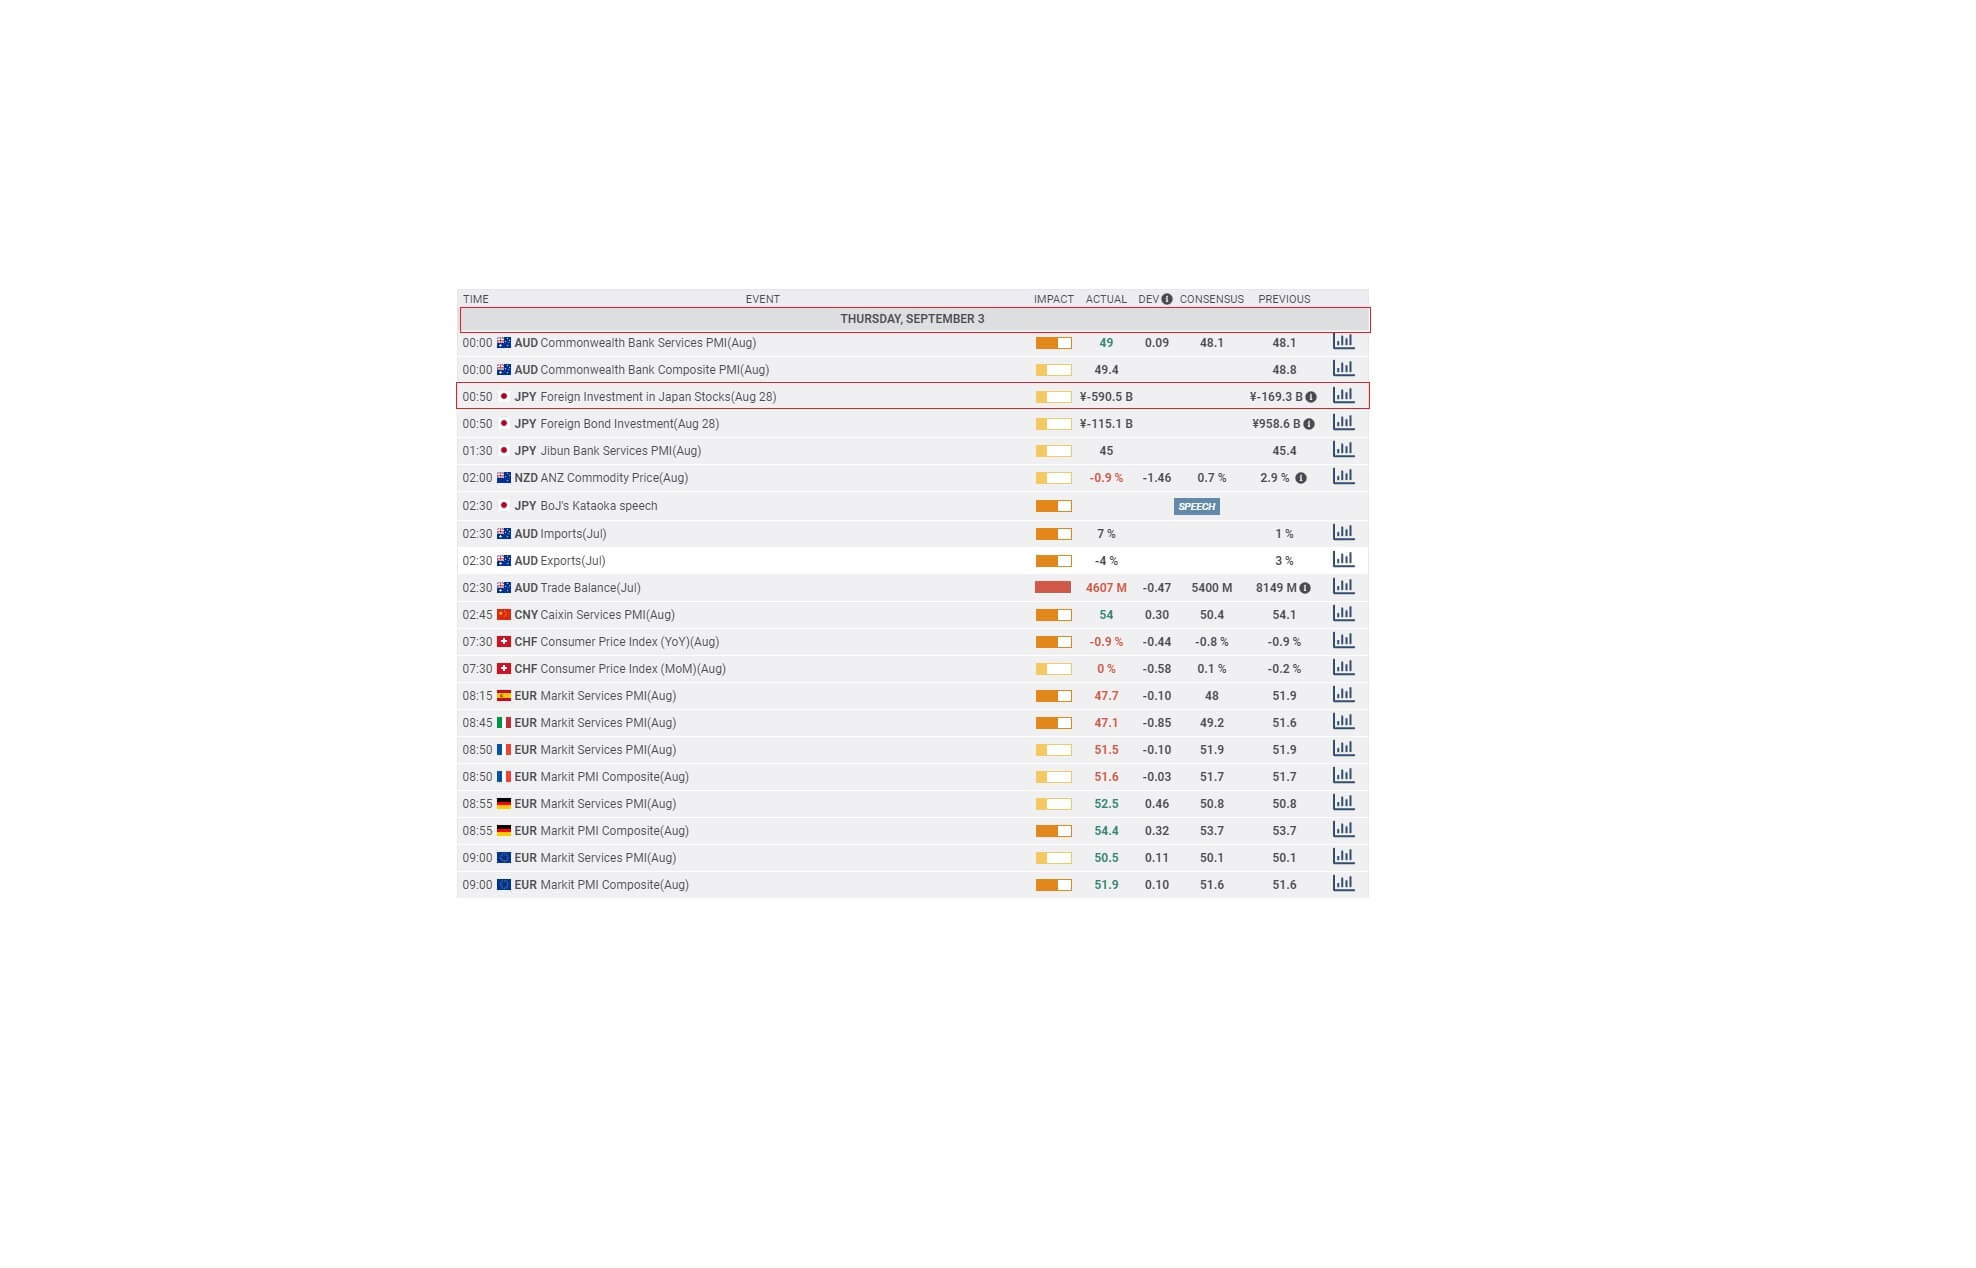
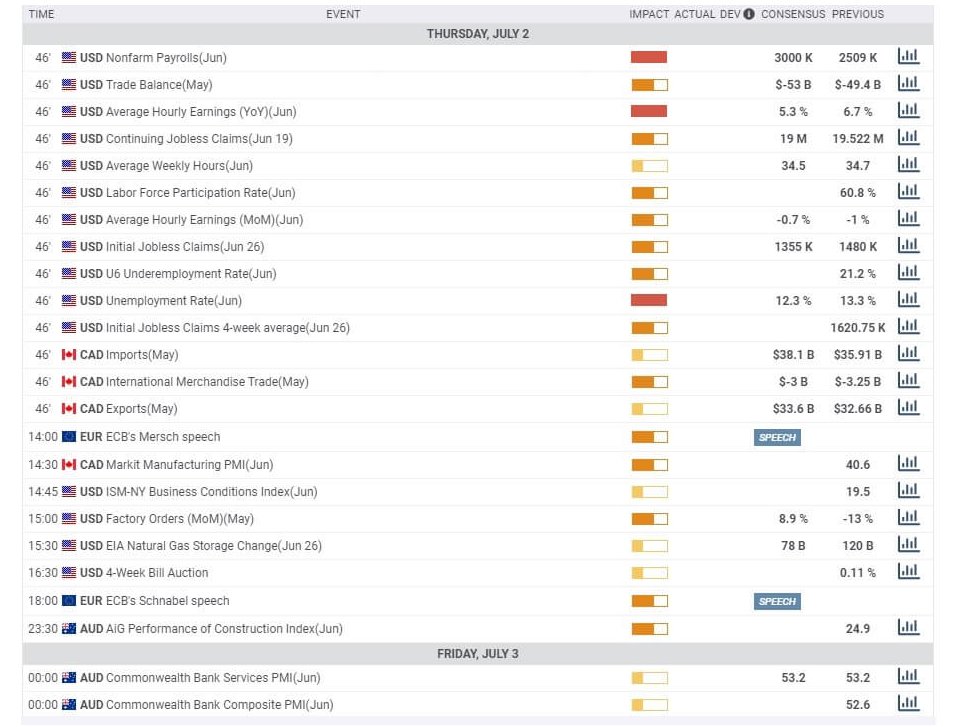
On the news front, eyes will remain on the Manufacturing PMI and Services PMI figures from the Eurozone, the U.K., and the United States. Almost all economic figures are expected to perform better than previous months, perhaps due to the lift of lockdown. Price action will depend upon any surprise changes in the PMI figures.
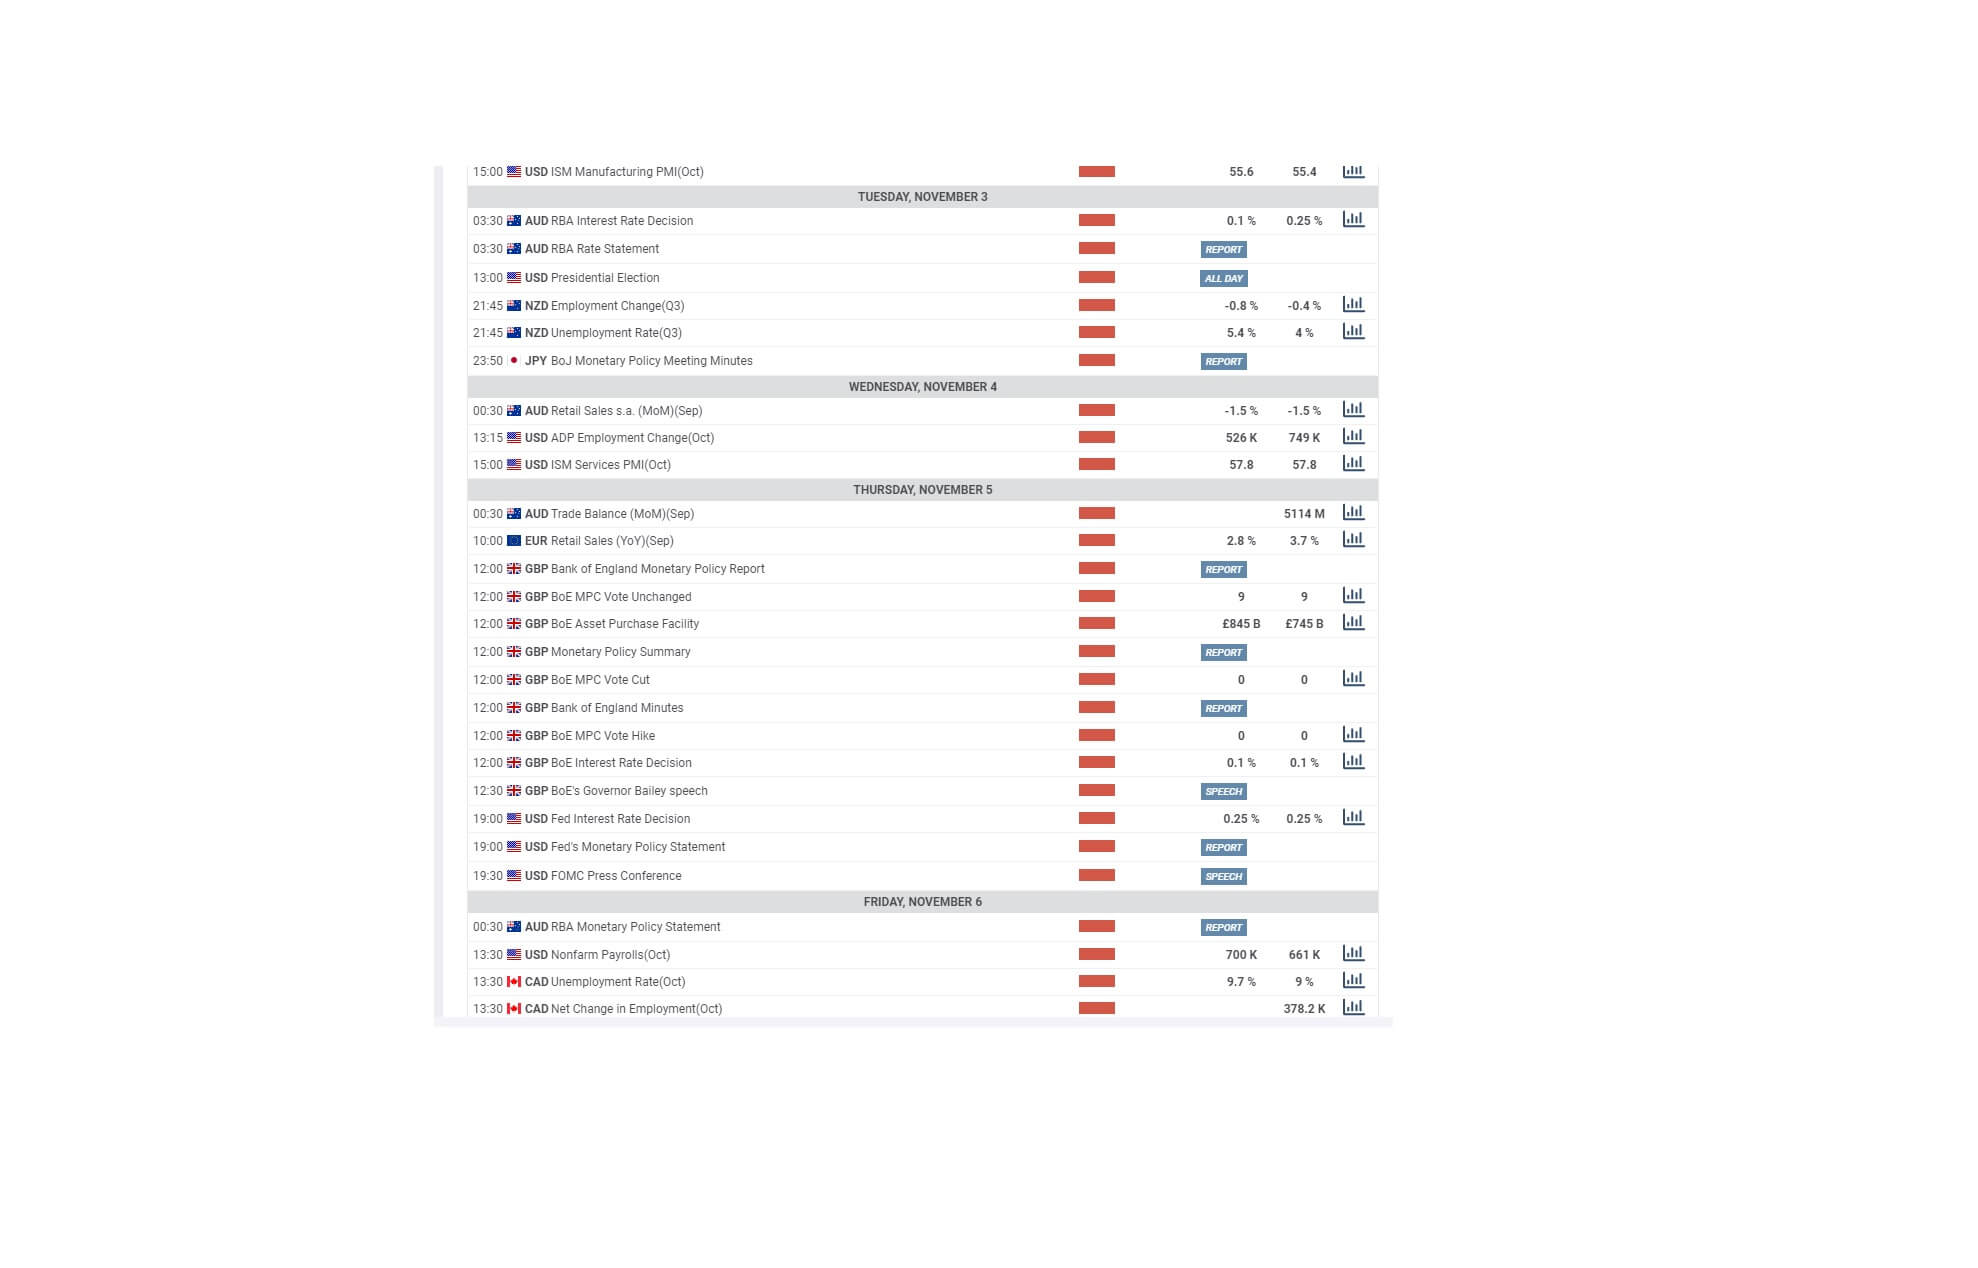
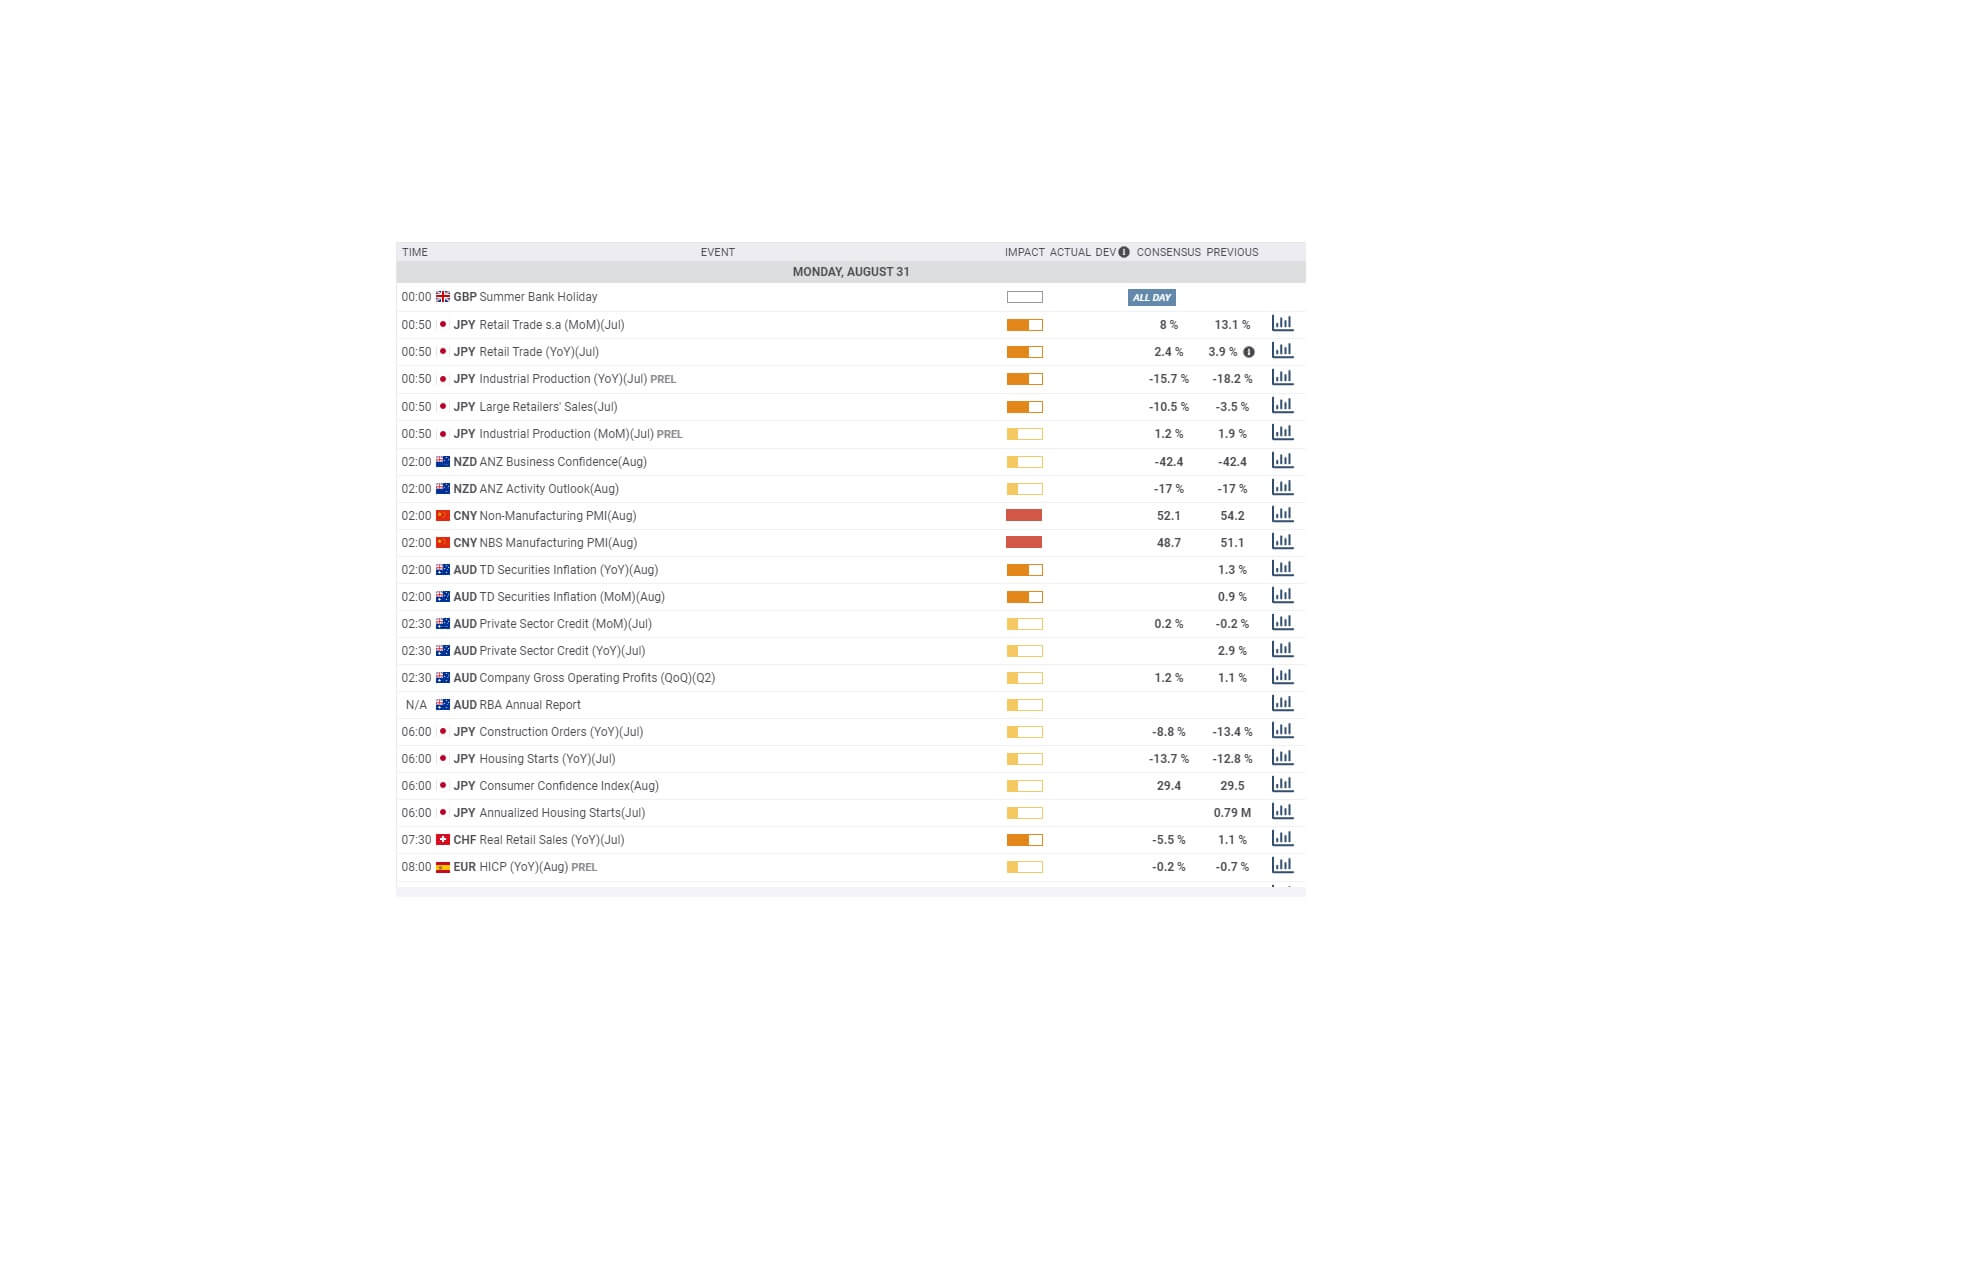
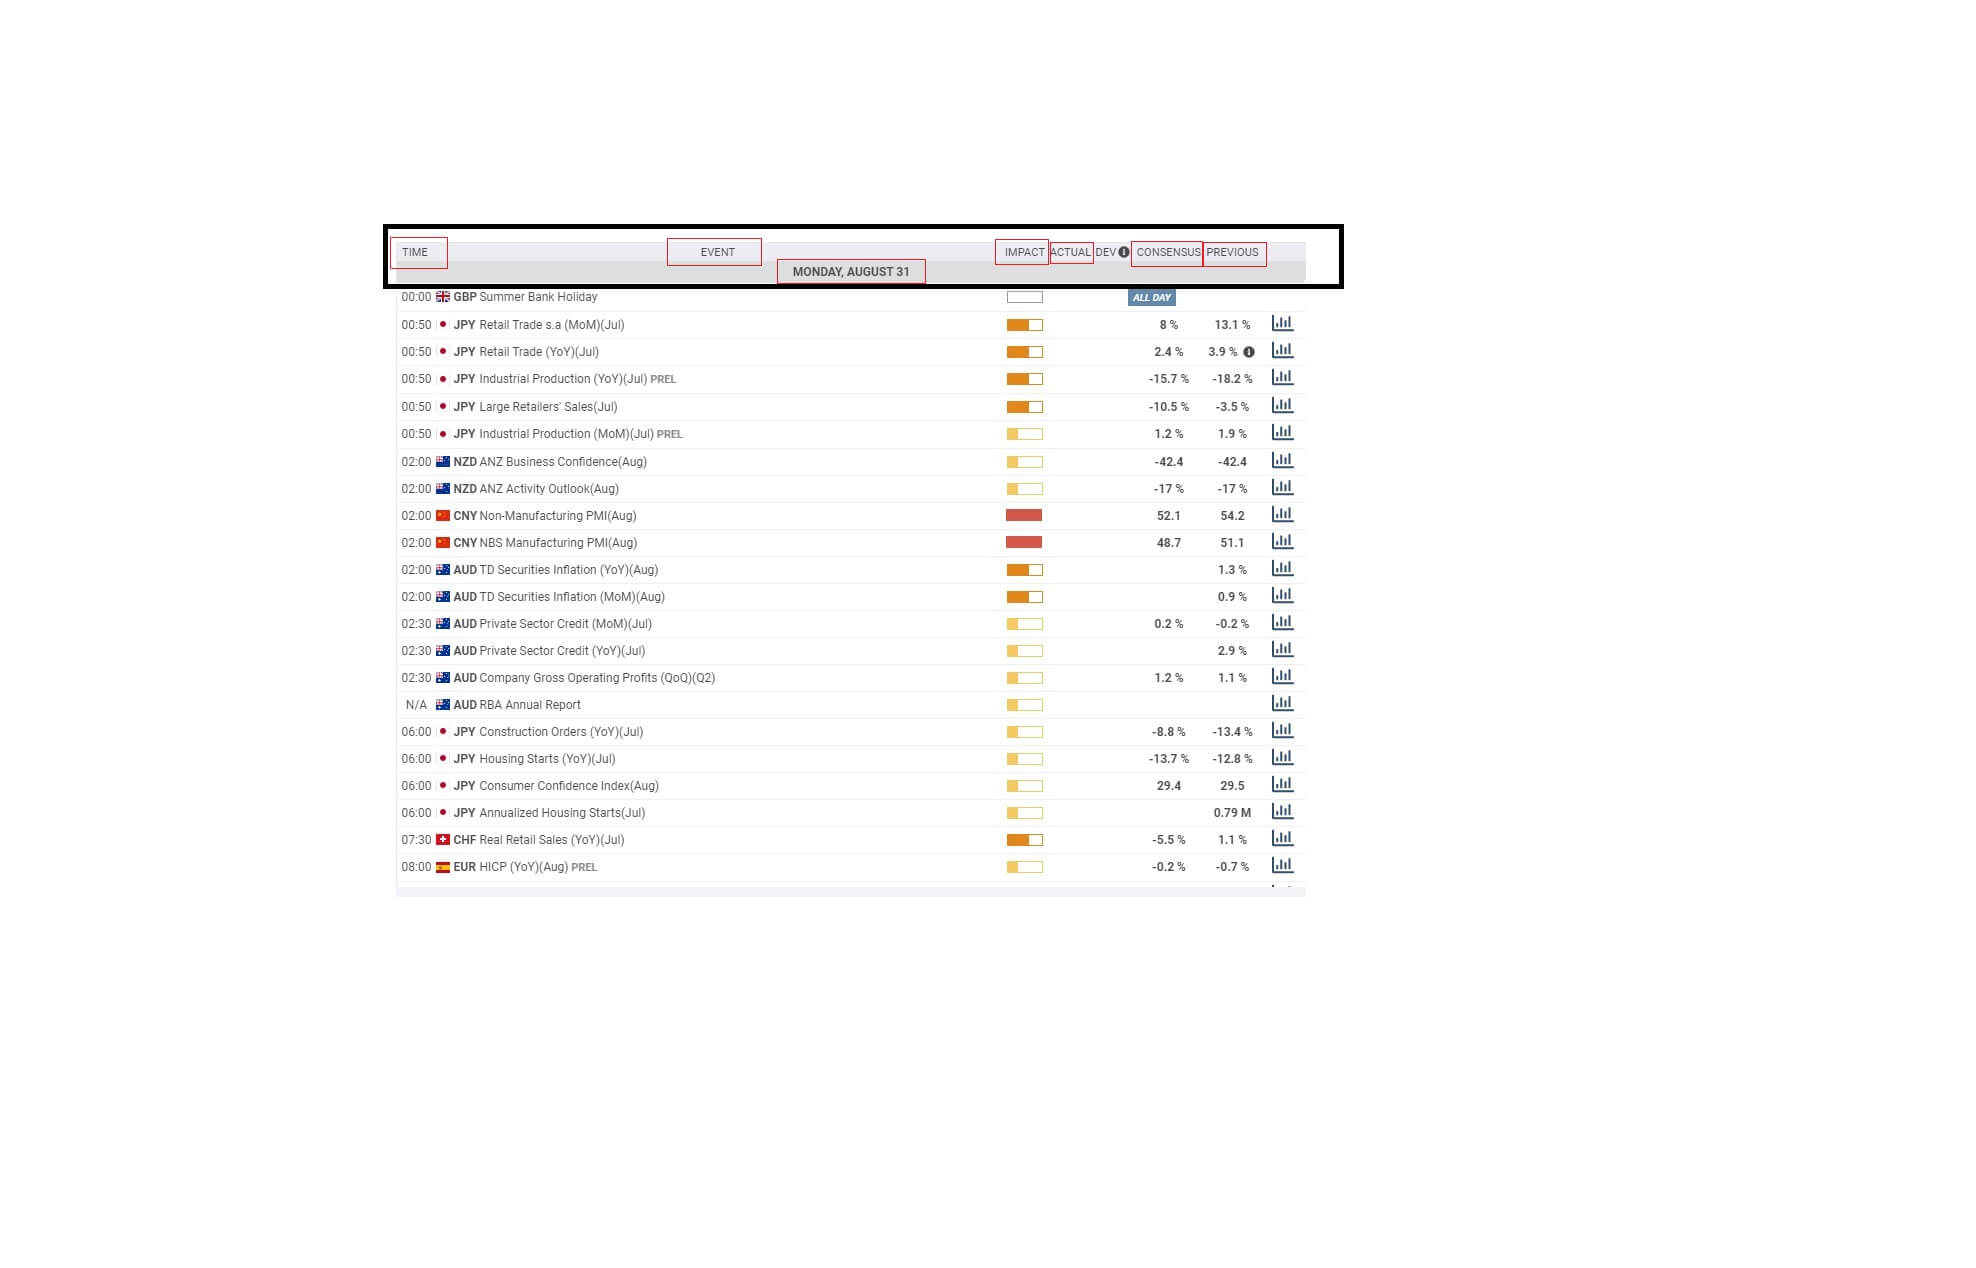
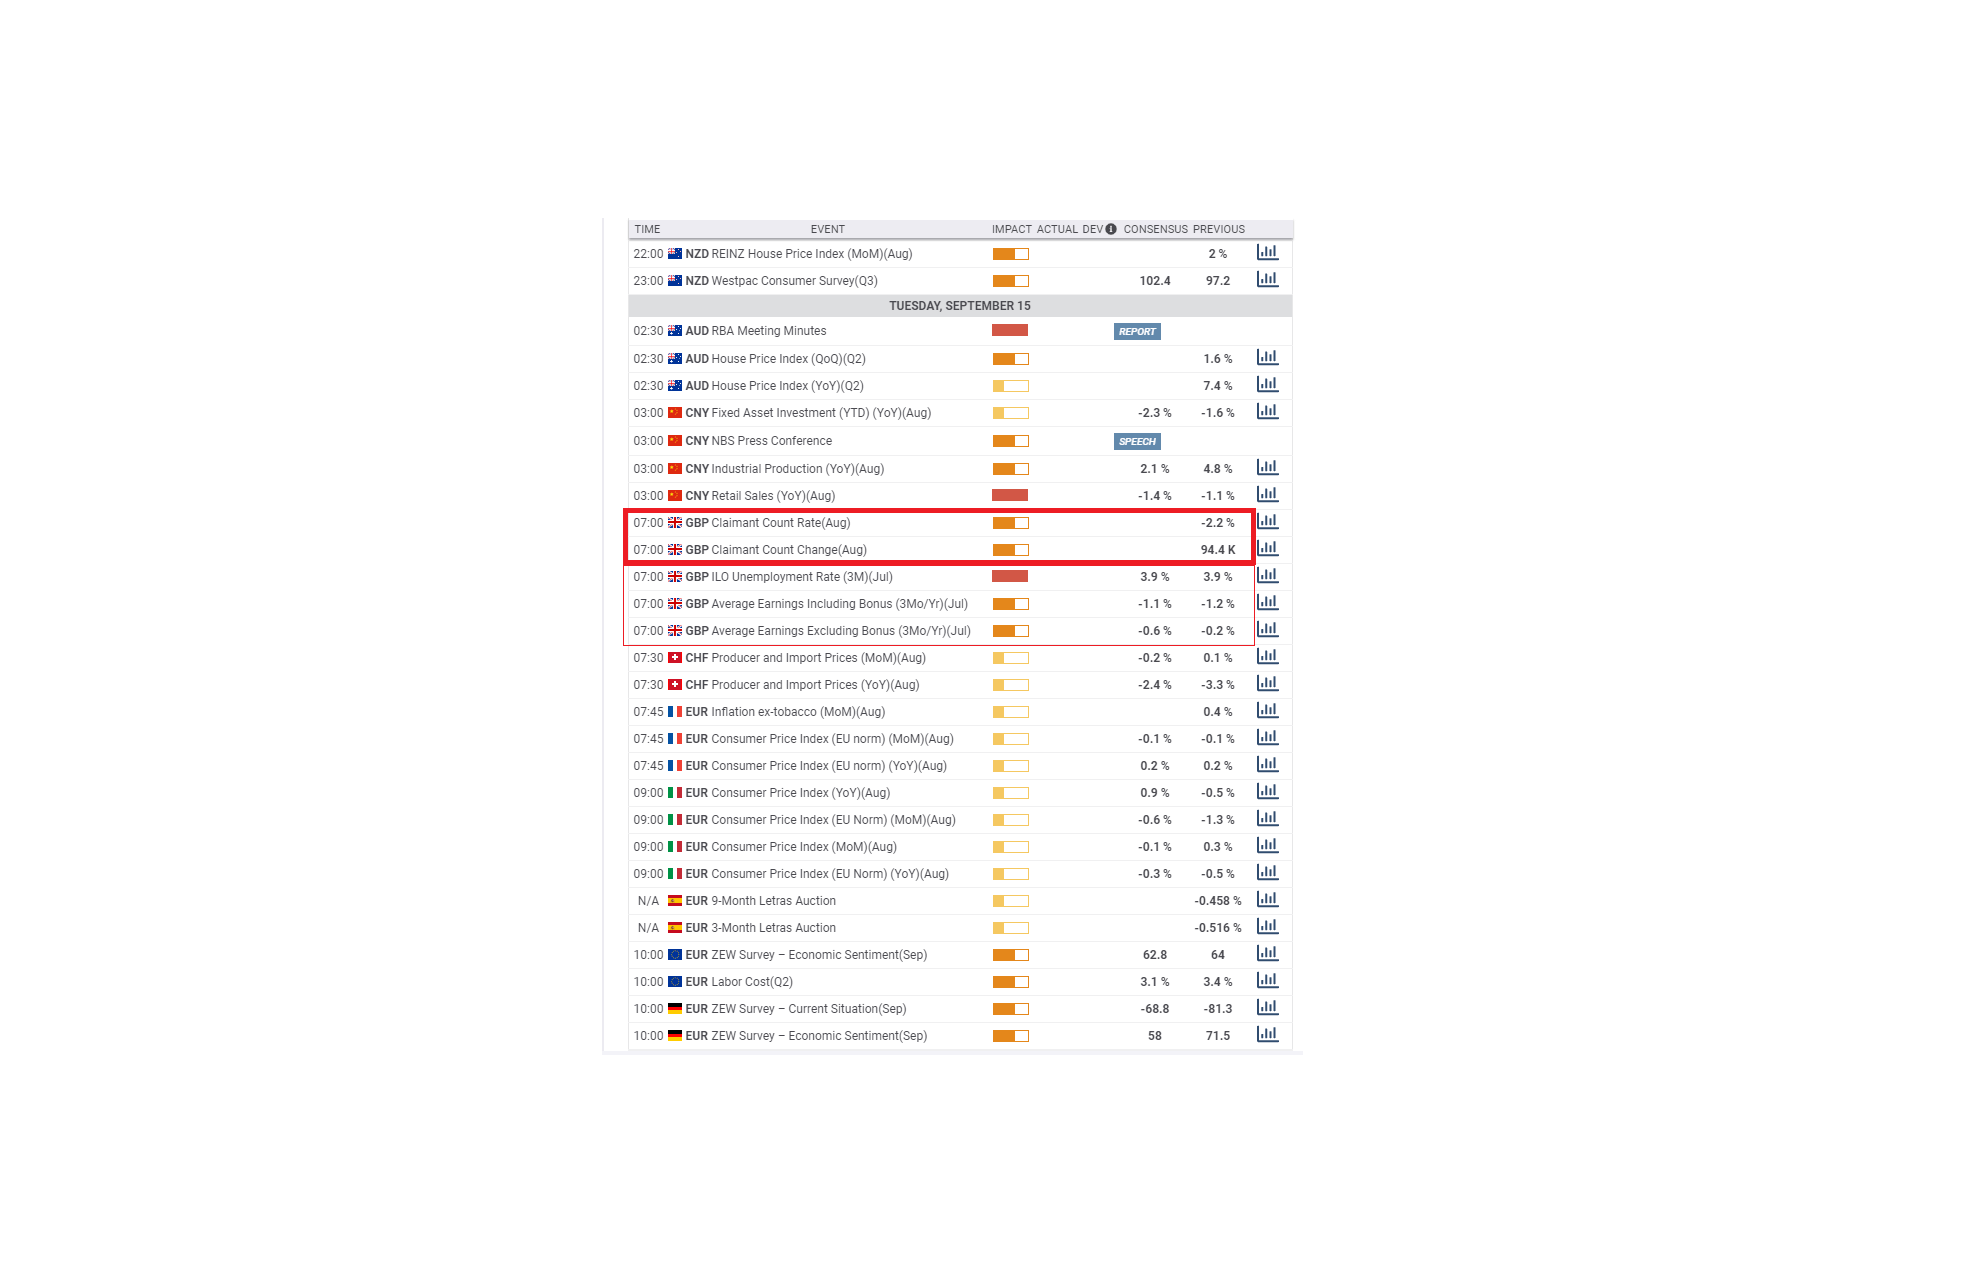
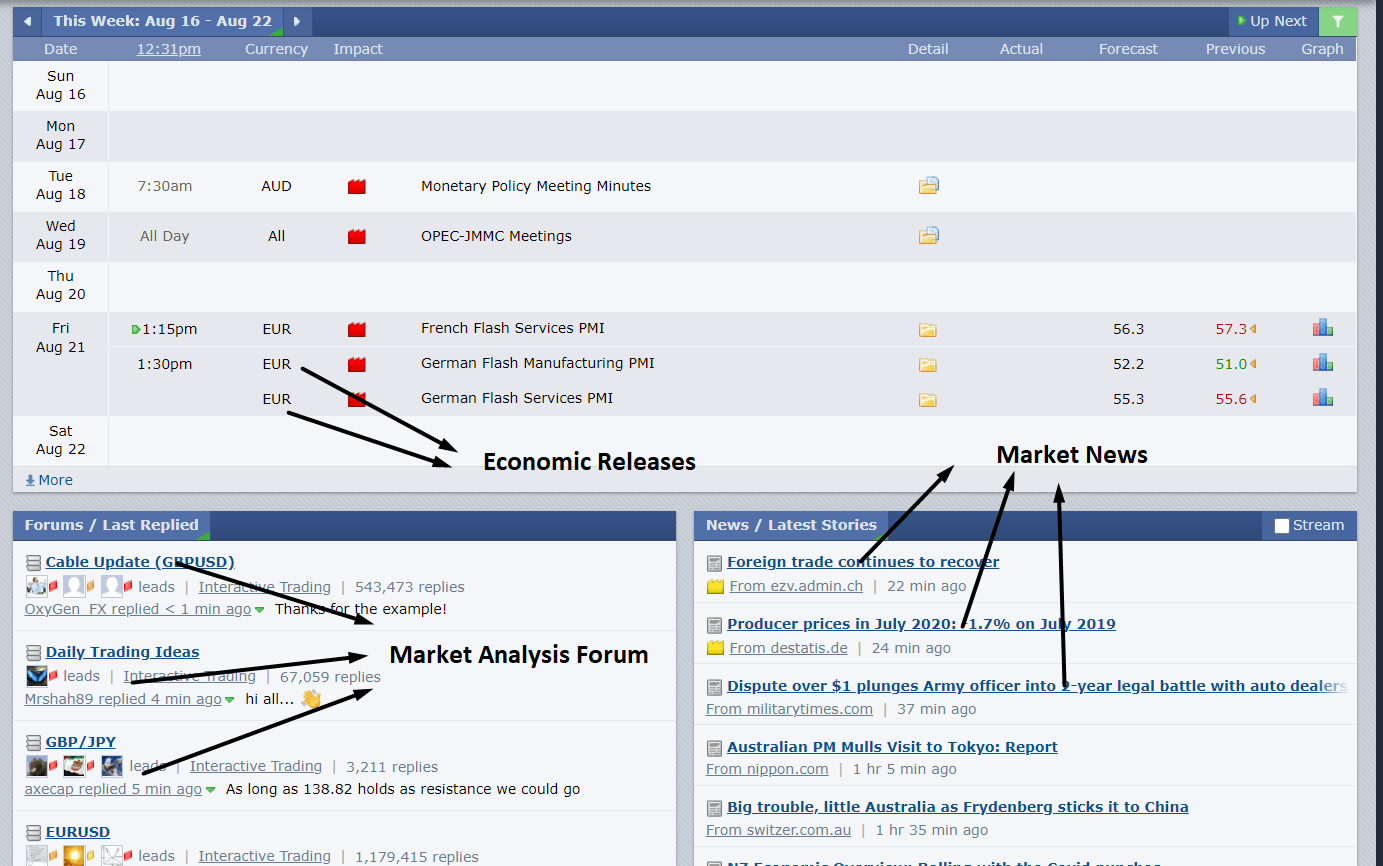
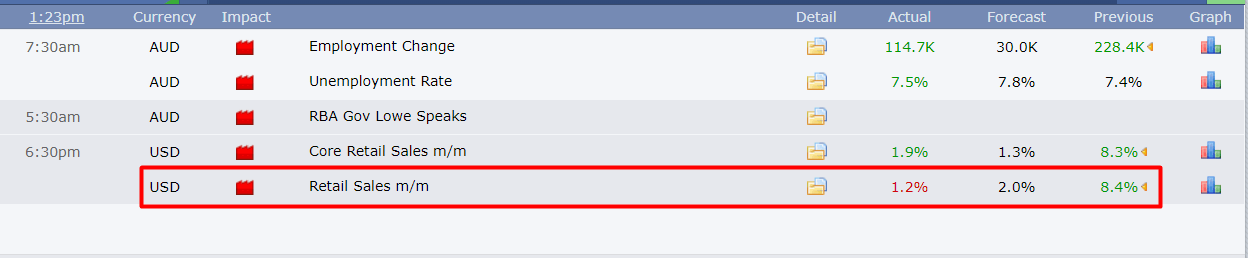
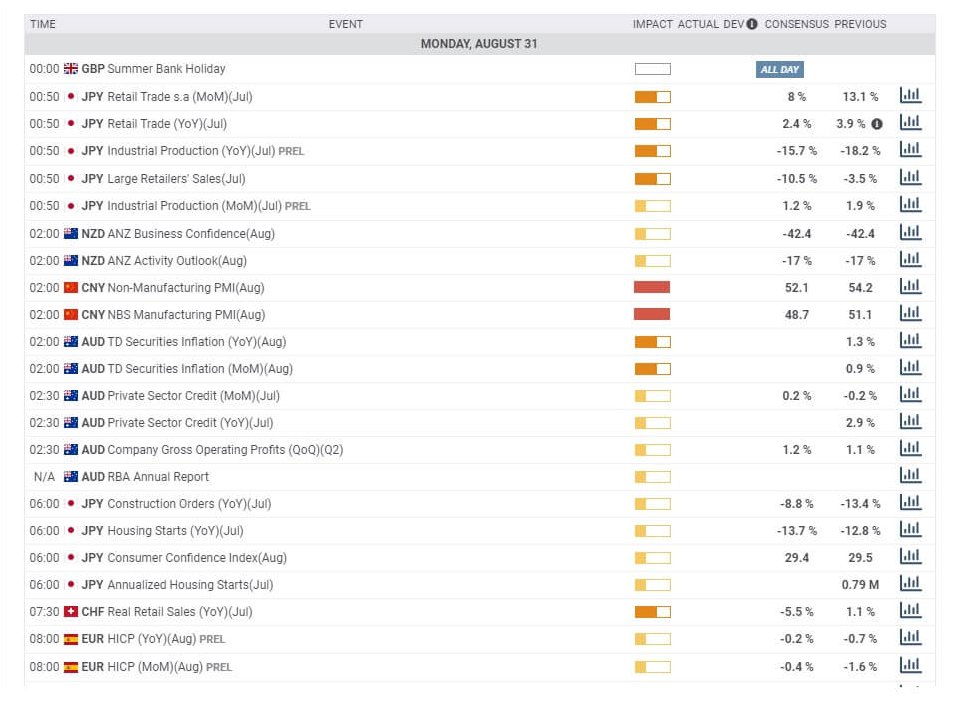
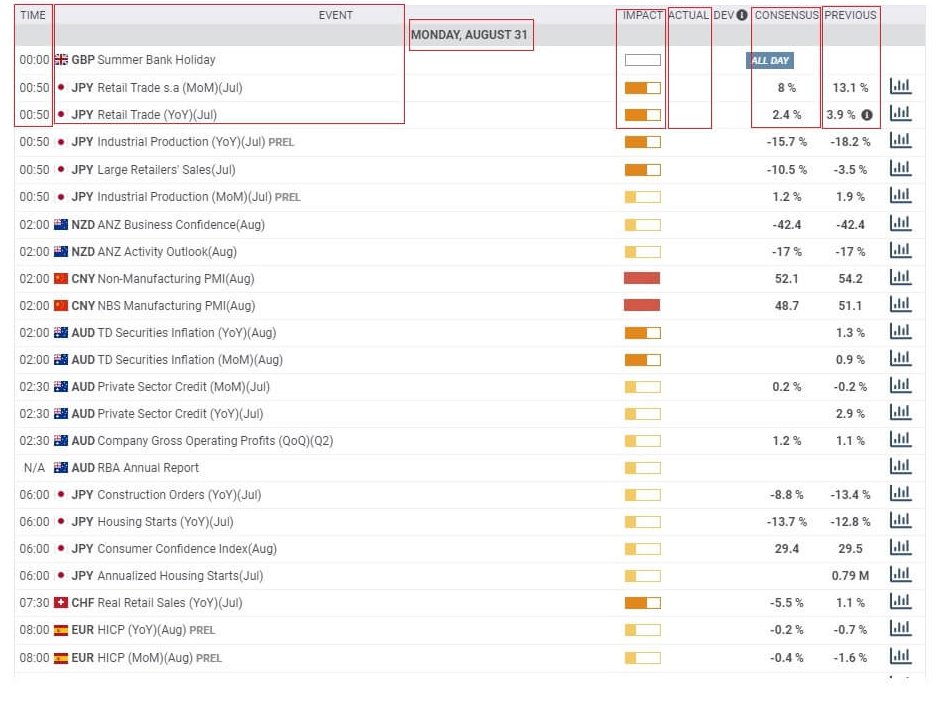
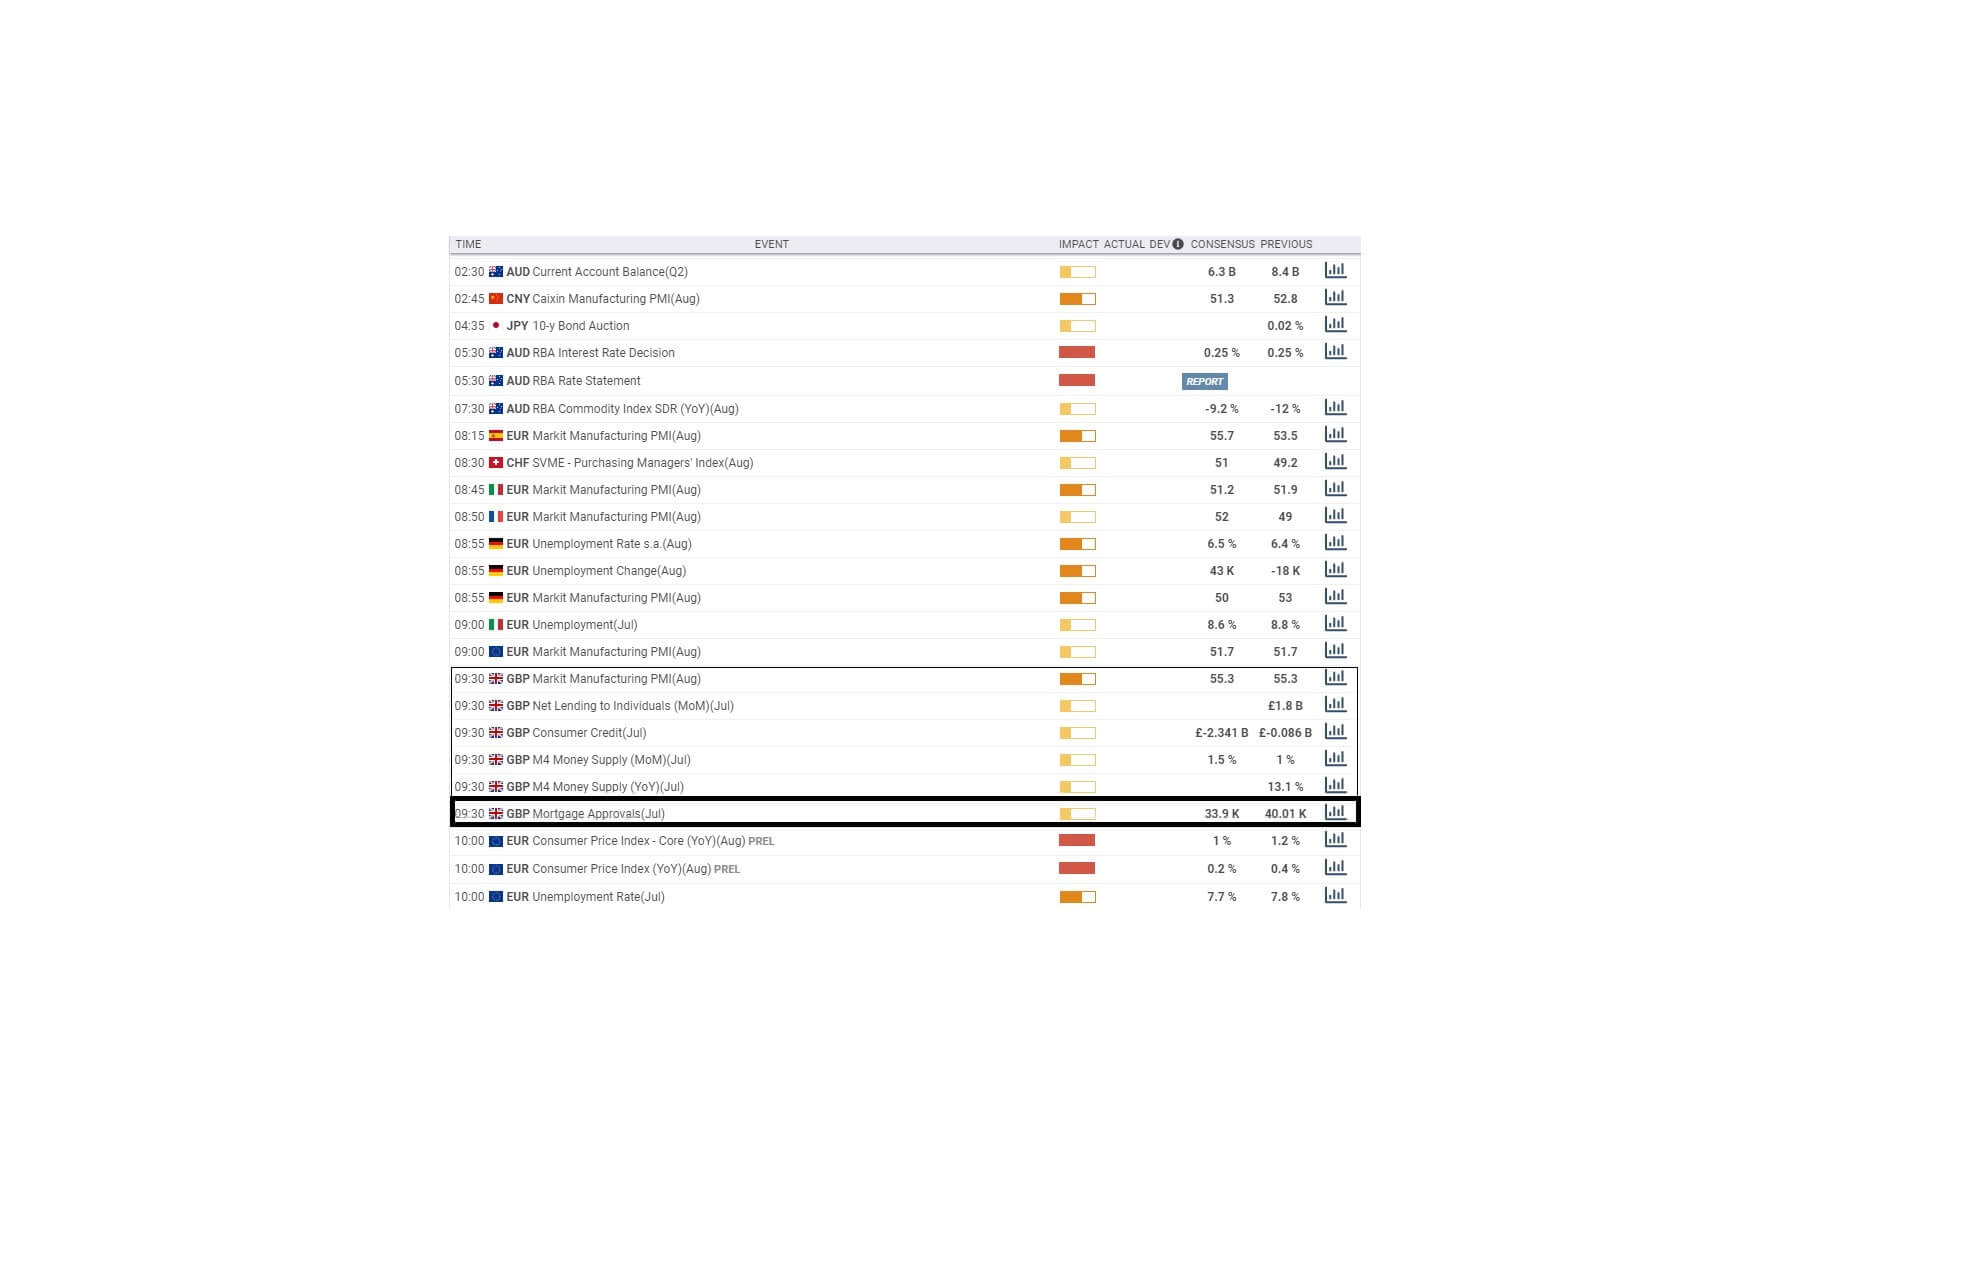
Economic Events to Watch Today
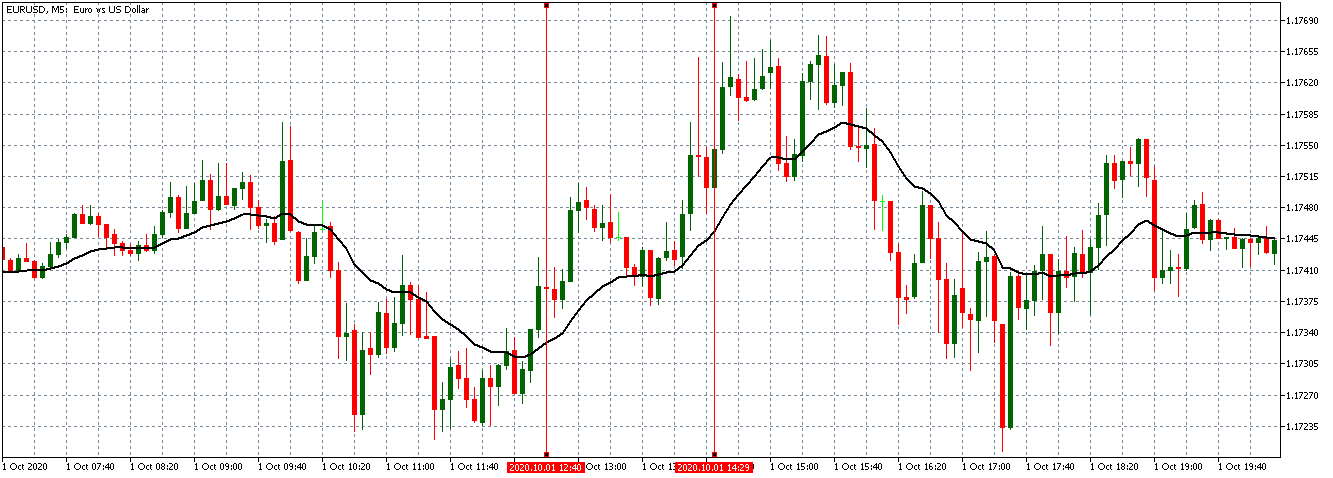
EUR/USD – Daily Analysis
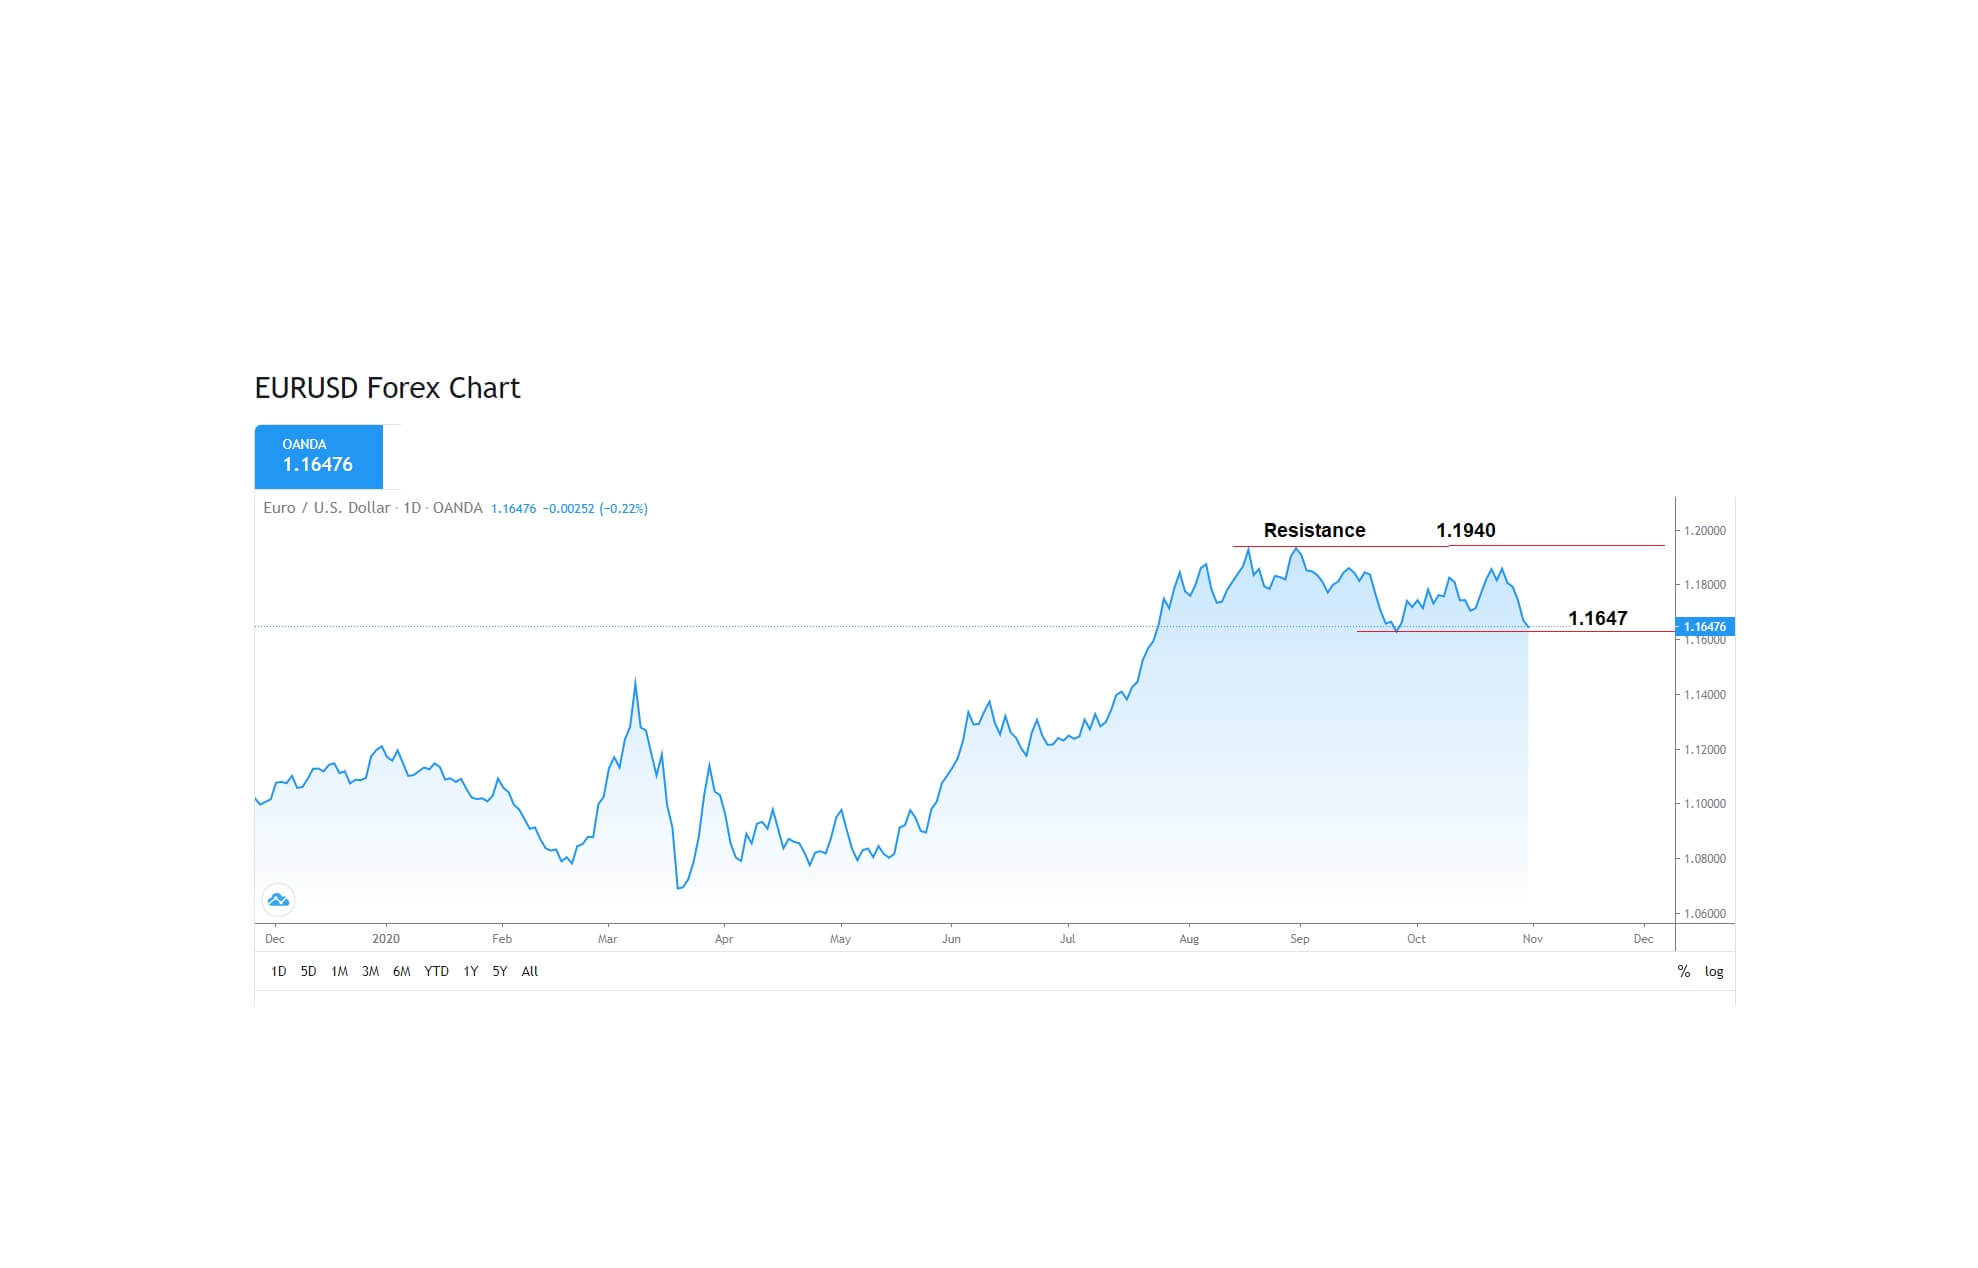
The EUR/USD pair was closed at 1.16445 after placing a high of 1.17041 and a low of 1.16398. The EUR/USD pair extended its losses for the 5th consecutive day on Friday and remained bearish throughout the day.
The main driver behind the steepest fall in Euro currency this week was the market concerns about the rising number of coronavirus infections in Europe and the effects of the social distancing measures to curb them.
The latest lockdown restrictions introduced by France and Germany and the tighter restrictions applied in Italy and Spain raised alarms about their impact on the fragile economic recovery and weighed on the single currency Euro that ultimately added pressure on EUR/USD pair. Furthermore, the European Central Bank hinted to unleash new stimulus measures in December to counteract the pandemic’s negative impact and weighed on the Euro currency that added further losses in EUR/USD pair on Friday.
Meanwhile, on the data front, at 11:30 GMT, the French Consumer Spending for September was dropped to -5.1% against the expected -1.5% and weighed on Euro. The French Flash GDP for the quarter raised to 18.2% against the expected 15.0% and supported Euro. At 12:00 GMT, German Retail Sales for September dropped to -2.2% from the forecasted -0.6% and weighed on Euro. At 12:45 GMT, the French Prelim CPI for October fell to -0.1% against the forecasted 0.0% and weighed on Euro.
At 13:00 GMT, the Spanish Flash GDP for the quarter surged to 16.7% after placing a high of 13.5% and supported Euro. The Italian Monthly Unemployment Rate declined to 9.6% from the forecasted 10.1% and weighed on Euro. At 14:00 GMT, German Prelim GDP for the quarter raised to 8.2% from the forecasted 7.3% and supported Euro. The Italian Prelim GDP for the quarter also raised to 16.1% from the forecasted 11.1% and supported Euro. At 14:58 GMT, the Italian Prelim CPI for October remained flat with the expectations of 0.2%.
At 15:00 GMT, the CPI Flash Estimate for the year remained flat at -0.3%. The Core CPI Flash Estimate for the year also came in line as expected, 0.2%. The Prelim Flash GDP for the quarter raised to 12.7% from the forecasted 9.5% and supported Euro. The Unemployment Rate from the whole bloc raised to 8.3% from the forecasted 8.2% and weighed on Euro.
After the release of economic data, the single currency Euro came under fresh pressure amid the rising fears of investors’ that strong quarterly economic growth in Germany, which raised to 8.2% in the third quarter, will be temporary as the virus spread in the region has picked up the pace. This added further pressure on EUR/USD pair on Friday.
From the U.S. side, at 17:30 GMT, the Core PCE Price Index for September came in line with the anticipations of 0.2%. The Personal Spending for September rose to 1.4% against the projected 1.0% and supported the U.S. dollar and added pressure on EUR/USD pair. The Employment Cost Index for the quarter came in line with the expectations of 0.5%. The Personal Income for September also surged to 0.9% from the estimated 0.3% and supported the U.S. dollar and add losses in EUR/USD pair.
At 18:45 GMT, the Chicago PMI for October upraised to 61.1 against the predictable 58.2 and supported the U.S. dollar. At 19:00 GMT, the Revised UoM Consumer Sentiment for October also elevated to 81.8 against the estimated 81.2 and supported the U.S. dollar that supported the losses on EUR/USD pair on Friday. The Revised UoM Inflation Expectations for October were reported as 2.6% compared to September’s 2.7%.
Daily Technical Levels
Support Resistance
1.1798 1.1789
1.1672 1.1834
1.1626 1.1870
Pivot point: 1.1753
EUR/USD– Trading Tip
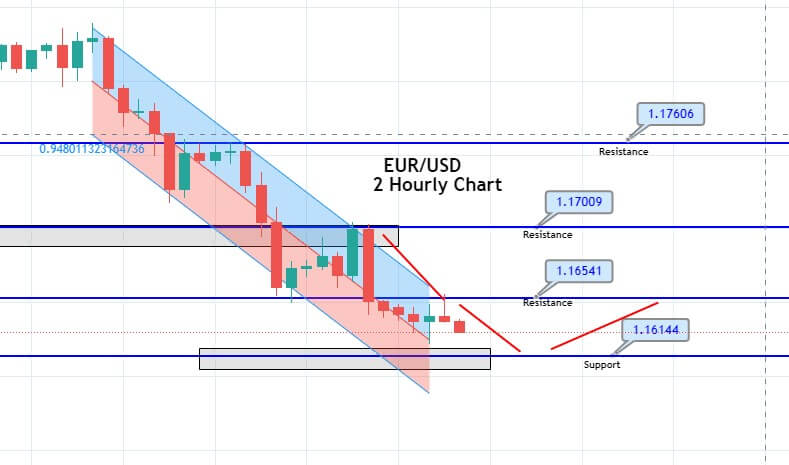
The EUR/USD traded with a bearish bias, having dropped below the support area of 1.1653. At the moment, the EUR/USD is likely to face the resistance at the same level of 1.1653. On the higher side, a bullish crossover of 1.1653 increases the odds of continuing an upward trend, and it may lead the EUR/USD price towards 1.1700. Further bullish crossover of this area can lead the pair towards the 1.1758 level. Conversely, a bearish crossover of 1.1653 support level has opened additional room for selling until the 1.1613 area as a double bottom support area extends the level.
GBP/USD – Daily Analysis
The GBP/USD pair was closed at 1.29464 after placing a high of 1.29879 and a low of 1.28989. After placing losses for two consecutive days, the GBP/USD pair raised on Friday and posted gains. The GBP/USD pair rose on Friday despite the strength of the U.S. dollar, improved risk-averse market sentiment, and the rising number of coronavirus cases in Great Britain. The rising number of coronavirus cases in the U.K. showed that the imposed restrictions might be insufficient, and the country should follow the steps of Europe and France.
On the U.S. Presidential election front, the polls after the presidential debate showed that former vice president Joe Biden was leading over President Donald Trump. The chances for a blue wave in the U.S. gave pressure on local currency and supported the gains of the GBP/USD pair on Friday. On the data front, at 11:52 GMT, the Nationwide House Price Index for October raised to 0.8% from the forecasted 0.4% and supported British Pound that added further gains in GBP/USD pair.
From the U.S. side, at 17:30 GMT, the Core PCE Price Index for September came as anticipated by 0.2%. The Personal Spending for September surged to 1.4% against the anticipated 1.0% and supported the U.S. dollar. The Employment Cost Index for the quarter came as expected of 0.5%. The Personal Income for September also raised to 0.9% from the projected 0.3% and supported the U.S. dollar.
At 18:45 GMT, the Chicago PMI for October surged to 61.1 against the anticipated 58.2 and supported the U.S. dollar. At 19:00 GMT, the Revised UoM Consumer Sentiment for October also rose to 81.8 against the forecasted 81.2 and supported the U.S. dollar. The Revised UoM Inflation Expectations for October came as 2.6% in comparison to September’s 2.7%. Despite the better than expected macroeconomic figures from the U.S., the U.S. dollar remained lower ahead of upcoming elections and weighed on GBP/USD pair on Friday.
Furthermore, the Brexit developments also helped the GBP/USD pair to stay higher in such circumstances this week. The Chief EU Negotiator Michel Barnier extended his stay in London to discuss the Brexit deal with his U.K. counterpart. The fact that he has delayed his stay also gave some hope that progress has been made in Brexit proves and supported GBP/USD pair.
The reports also suggested that both sides have almost reached an agreement over the state aid issue, and the only sticking point in the UK-EU deal left was the fisheries. These Brexit developments in depressing circumstances supported the GBP/USD pair on Friday.
Daily Technical Levels
Support Resistance
1.2909 1.3057
1.2839 1.3135
1.2762 1.3205
Pivot point: 1.2987
GBP/USD– Trading Tip
The GBP/USD is trading sharply bearish to trade over the double bottom support area of 1.2910 level. On the 2 hour timeframe, the GBP/USD pair has formed a downward channel, and bearish trend continuation can lead the pair further lower towards the next support area of 1.2830 level. However, to see that kind of selling, the Cable needs to violate the immediate support area of 1.2910. The MACD and 50 EMA support selling; therefore, we should look for a selling trade below the 1.2910 level today.
USD/JPY – Daily Analysis
The USD/JPY pair was closed at 104.673 after placing a high of 104.740and a low of 104.123. The USD/JPY pair extended its previous daily gains and rose for the second consecutive session on Friday.
The U.S. dollar was moving back and forth on Friday within the previous ranges, however, was unable to find a significant recovery. The second round of lockdown in Europe and the cautious market mood ahead of the U.S. Presidential elections kept the pair higher as the risk-averse market sentiment was gaining traction.
On the macroeconomic front, at 04:30 GMT, the Tokyo Core CPI for the year remained flat at -0.5%. The Unemployment Rate from Japan declined to 3.0% in September from the forecasted 3.1% and supported the Japanese Yen. At 04:50 GMT, the Prelim Industrial Production for September also raised to 4.0% from the expected 3.0% and supported the Japanese Yen. At 10:00 GMT, the Housing Starts from Japan for September dropped to -9.9% from the forecasted -8.6% and weighed on the Japanese Yen and supported the upside momentum in the USD/JPY pair.
From the U.S. side, at 17:30 GMT, the Core PCE Price Index for September remained flat at 0.2%. The Personal Spending for September advanced to 1.4% from the expected 1.0% and supported the U.S. dollar. The Employment Cost Index for the quarter came in line with the expectations of 0.5%. The Personal Income for September raised to 0.9% from the forecasted 0.3% and supported the U.S. dollar.
At 18:45 GMT, the Chicago PMI for October surged to 61.1 against the expectable 58.2 and supported the U.S. dollar. At 19:00 GMT, the Revised UoM Consumer Sentiment for October also advanced to 81.8 against the anticipated 81.2 and helped the U.S. dollar. The Revised UoM Inflation Expectations for October came as 2.6% in comparison to September’s 2.7%.
The stronger than expected data from the U.S. side also supported the USD/JPY pair’s upside movement on Friday. Meanwhile, the market mood was inclined towards the U.S. dollar demand in safe-haven as the growing number of infections in Europe forced the governments to impose lockdowns, which raised concerns over the global economic recovery when the economies were already struggling.
Furthermore, on Friday, the Federal Reserve declared that it will amend its main street lending program to support better small businesses that were still fighting the crisis of coronavirus pandemic. The central bank revealed that it would reduce the minimum amount that can be borrowed by the small & medium-sized businesses from $250,000 to $100,000. The Federal Reserve said that the change in the main-street lending program had been made to support pandemic-hit small companies. These announcements from the Fed weighed on the U.S. dollar and kept the gains in USD.JPY pair limited on Friday.
Daily Technical Levels
Support Resistance
104.07 104.53
103.86 104.78
103.62 104.99
Pivot point: 104.32
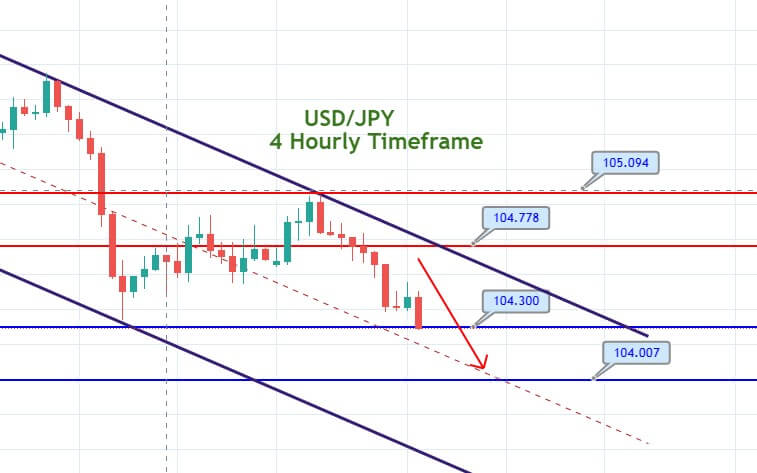
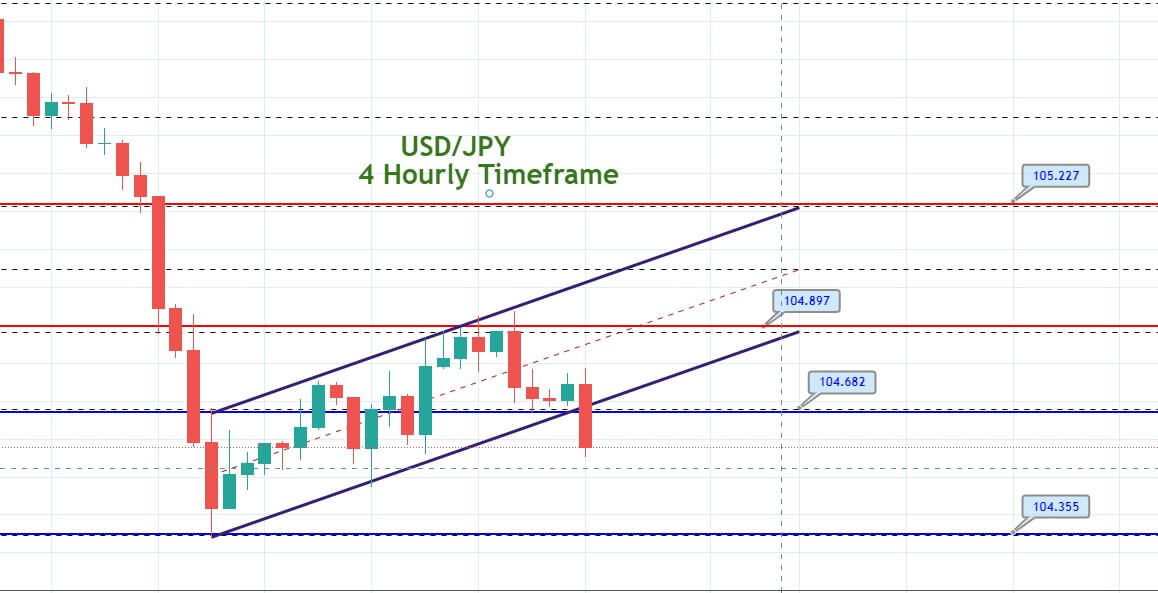
USD/JPY – Trading Tips
The USD/JPY is trading slightly bullish at the 104.745 level, having crossed over the immediate resistance area of the 104.600 mark. On the 2 hour timeframe, the USD/JPY has violated the downward trendline at 104.550 level, and now the same level is likely to support the USD/JPY pair. The closing of candles over 104.650 level is supporting strong odds of bullish trend continuation until 105.049 level. Further bullish trend continuation can also lead the USD/JPY pair towards the 105.800 level, but, I’m afraid, traders will wait for the U.S. Elections and the U.S. NFP later this Friday. Good luck!


