

Recent market drivers
Thank you for joining this forex academy educational video. In this session, we will be taking a snapshot of the recent market drivers, which might explain the moves in bitcoin, the Dow Jones, and a couple of major currency pairs.

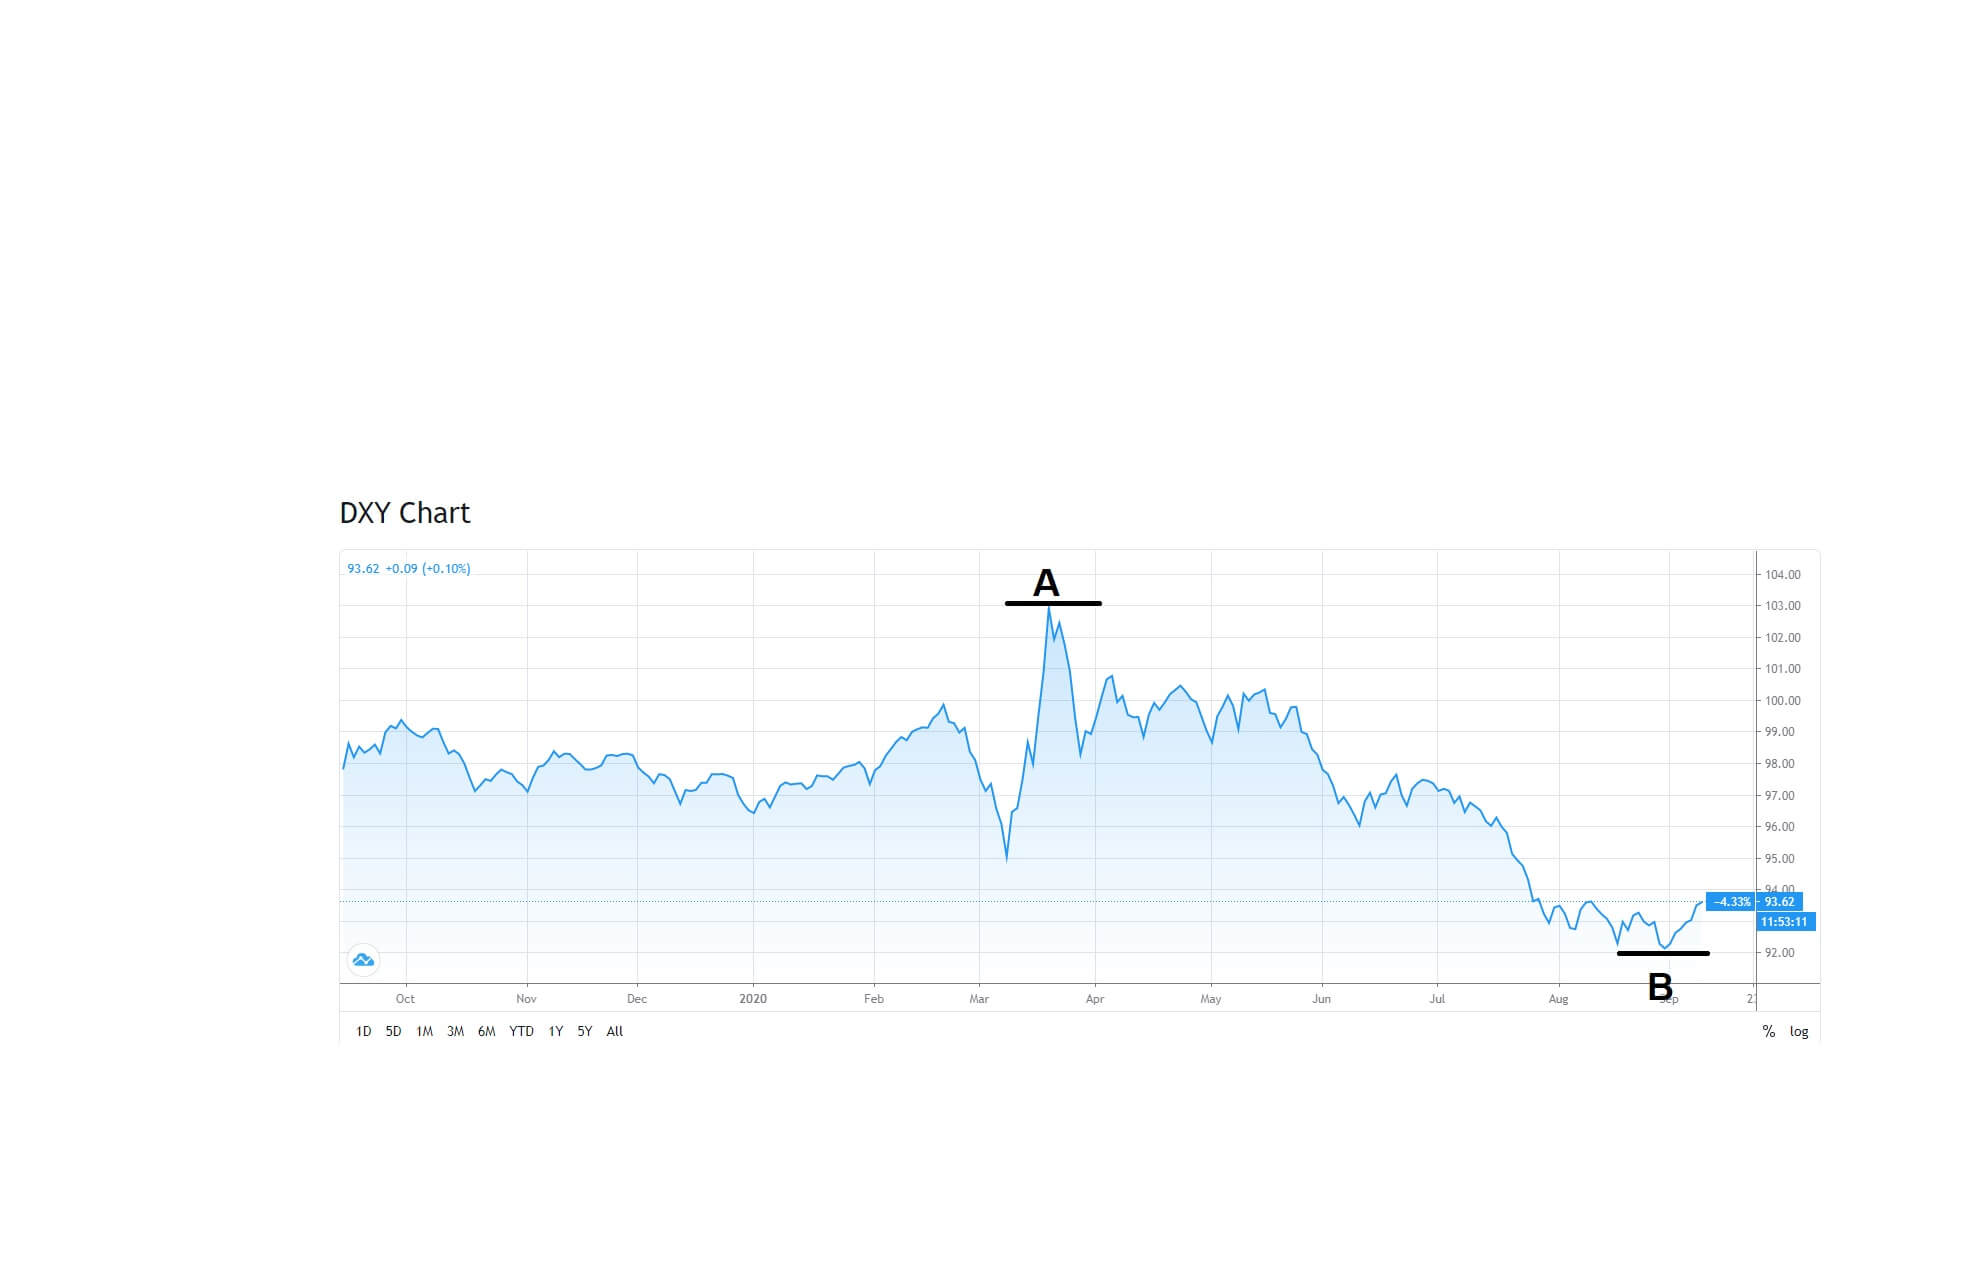
Festival we have the dollar index charts also known as the DXY, and where the dollar is measured against a basket of 6 major currencies, including the yen, the pound, the Australian dollar, the New Zealand dollar, the Swiss franc, the euro, and the Canadian dollar, and where the dollar index reached and high of 103.00 at position A, during the middle of March when Europe was in the grip of the pandemic and where the United States was not yet at its peak. We then see a low at position B, of 92.00, and where there is the dollar strength subsequently began to return, and now we can have a look at the possible reasons why.
Firstly we should take a look at the Dow Jones industrial average index whereby around the middle of February this year, Dow Jones hit an all-time record at 29,500 points, before crashing all the way down to 18,400 as the pandemic started to grip the United States. Although circumstances remain bad with the United States economy, the Dow Jones has rallied all the way up to a recent high above 29,000, almost approaching the previous record high, but where the fundamental economics do not match the previous rise from February. This may well have been a tipping point for traders who were already expecting a reversal in price action, and potentially we and see profit-taking at these levels.
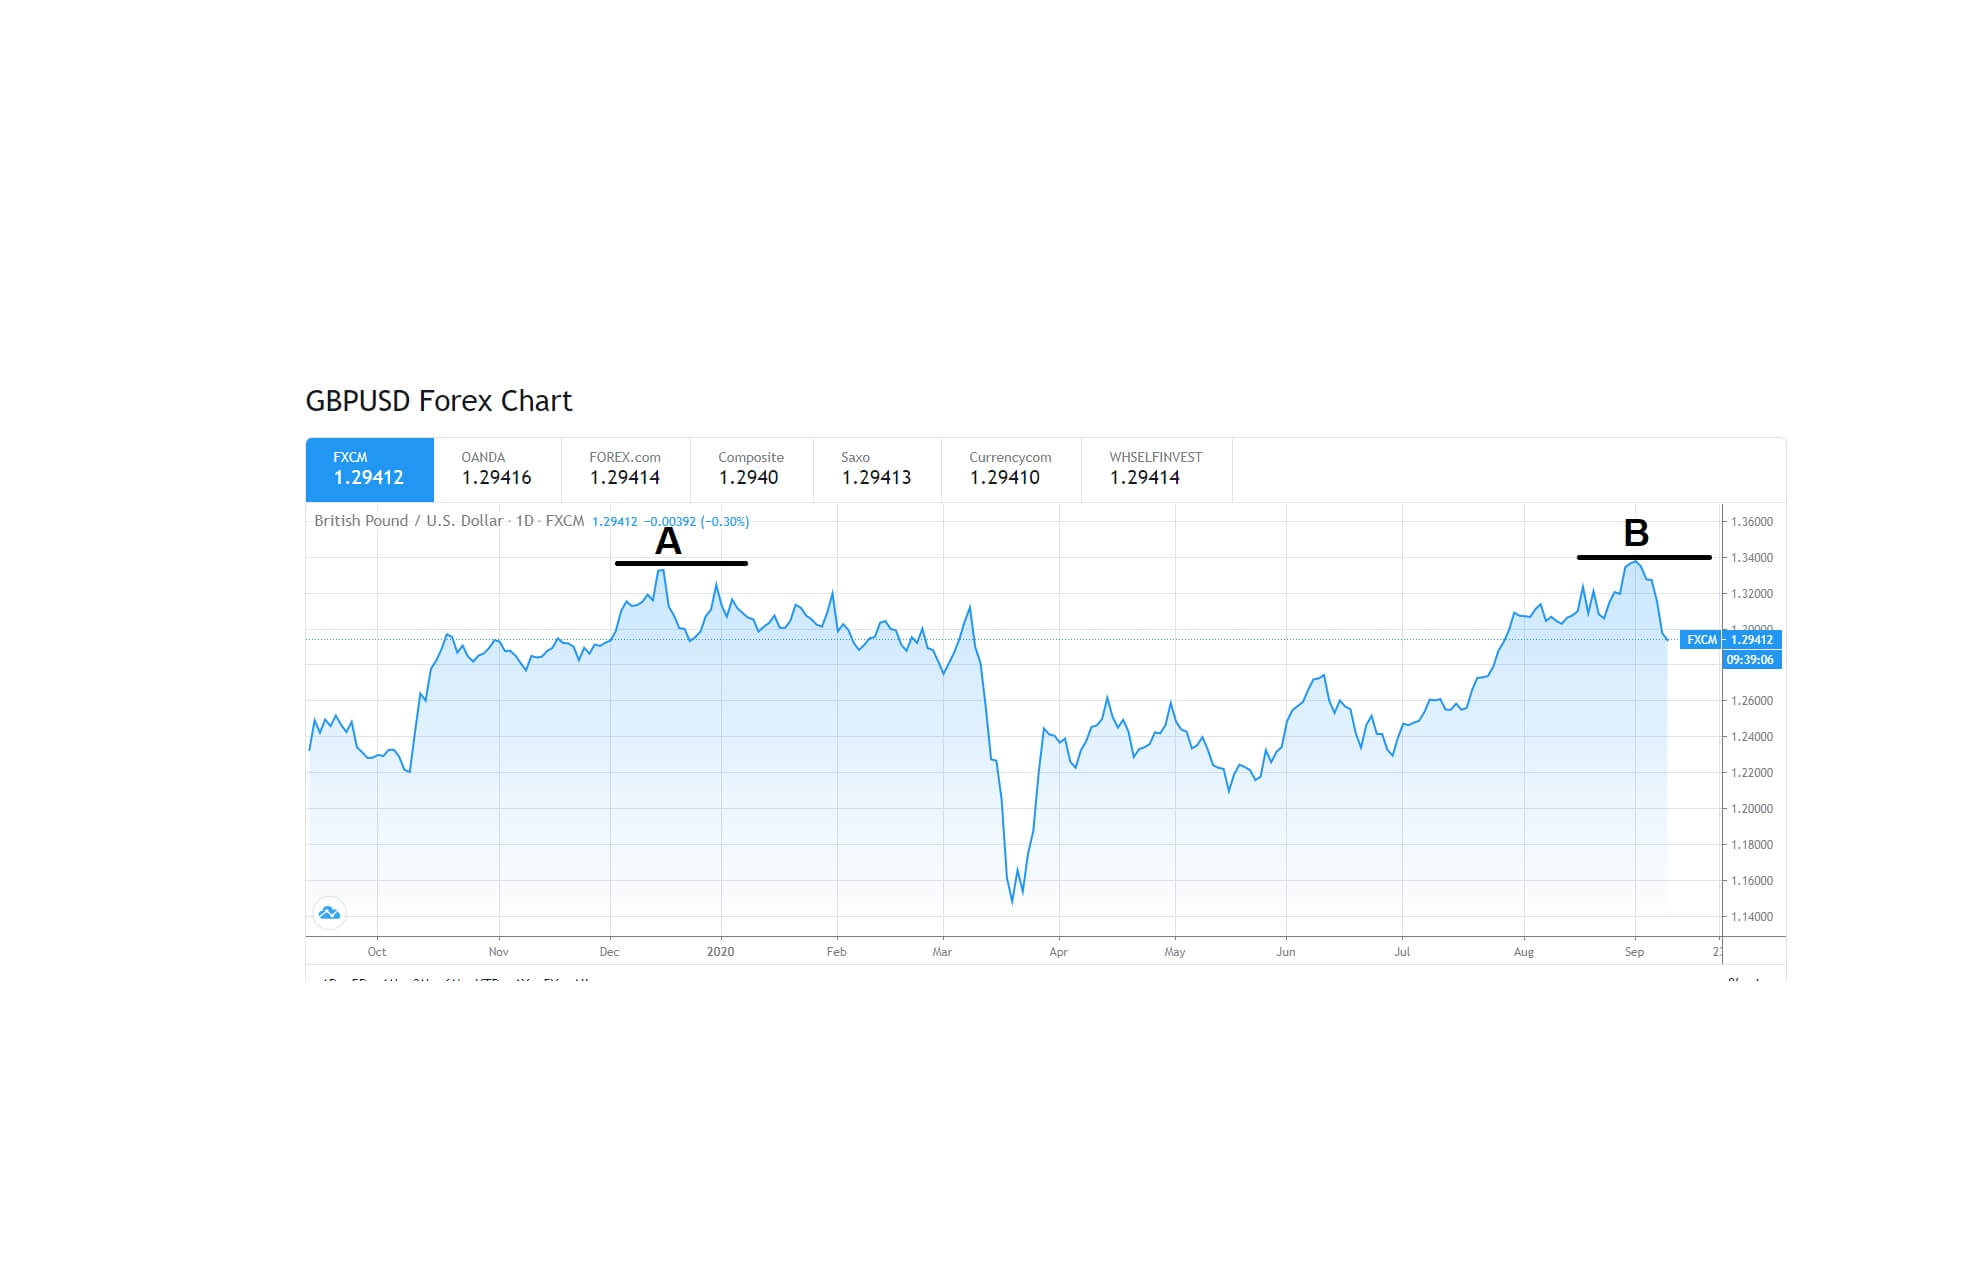
Now let’s take a look at the GBPUSD pair, AKA Cable. In December, when Britain voted to leave the European Union, the pair was on a high at 1,3350 at position A. Still, when the pandemic hit, Cable went down to just above 1.1400, again we have seen an incredible rally all the way back up to a high at position B of 1.3380. And then a pull lower to the current level of 1.2950 at the time of writing. The shift higher can only be attributed to dollar weakness because the United Kingdom is still suffering from the pandemic’s fallout and where no agreement has yet been reached regarding a future trading relationship with Europe. The pair will likely find further weakness the closer the UK gets to a no-deal arrangement with Europe.
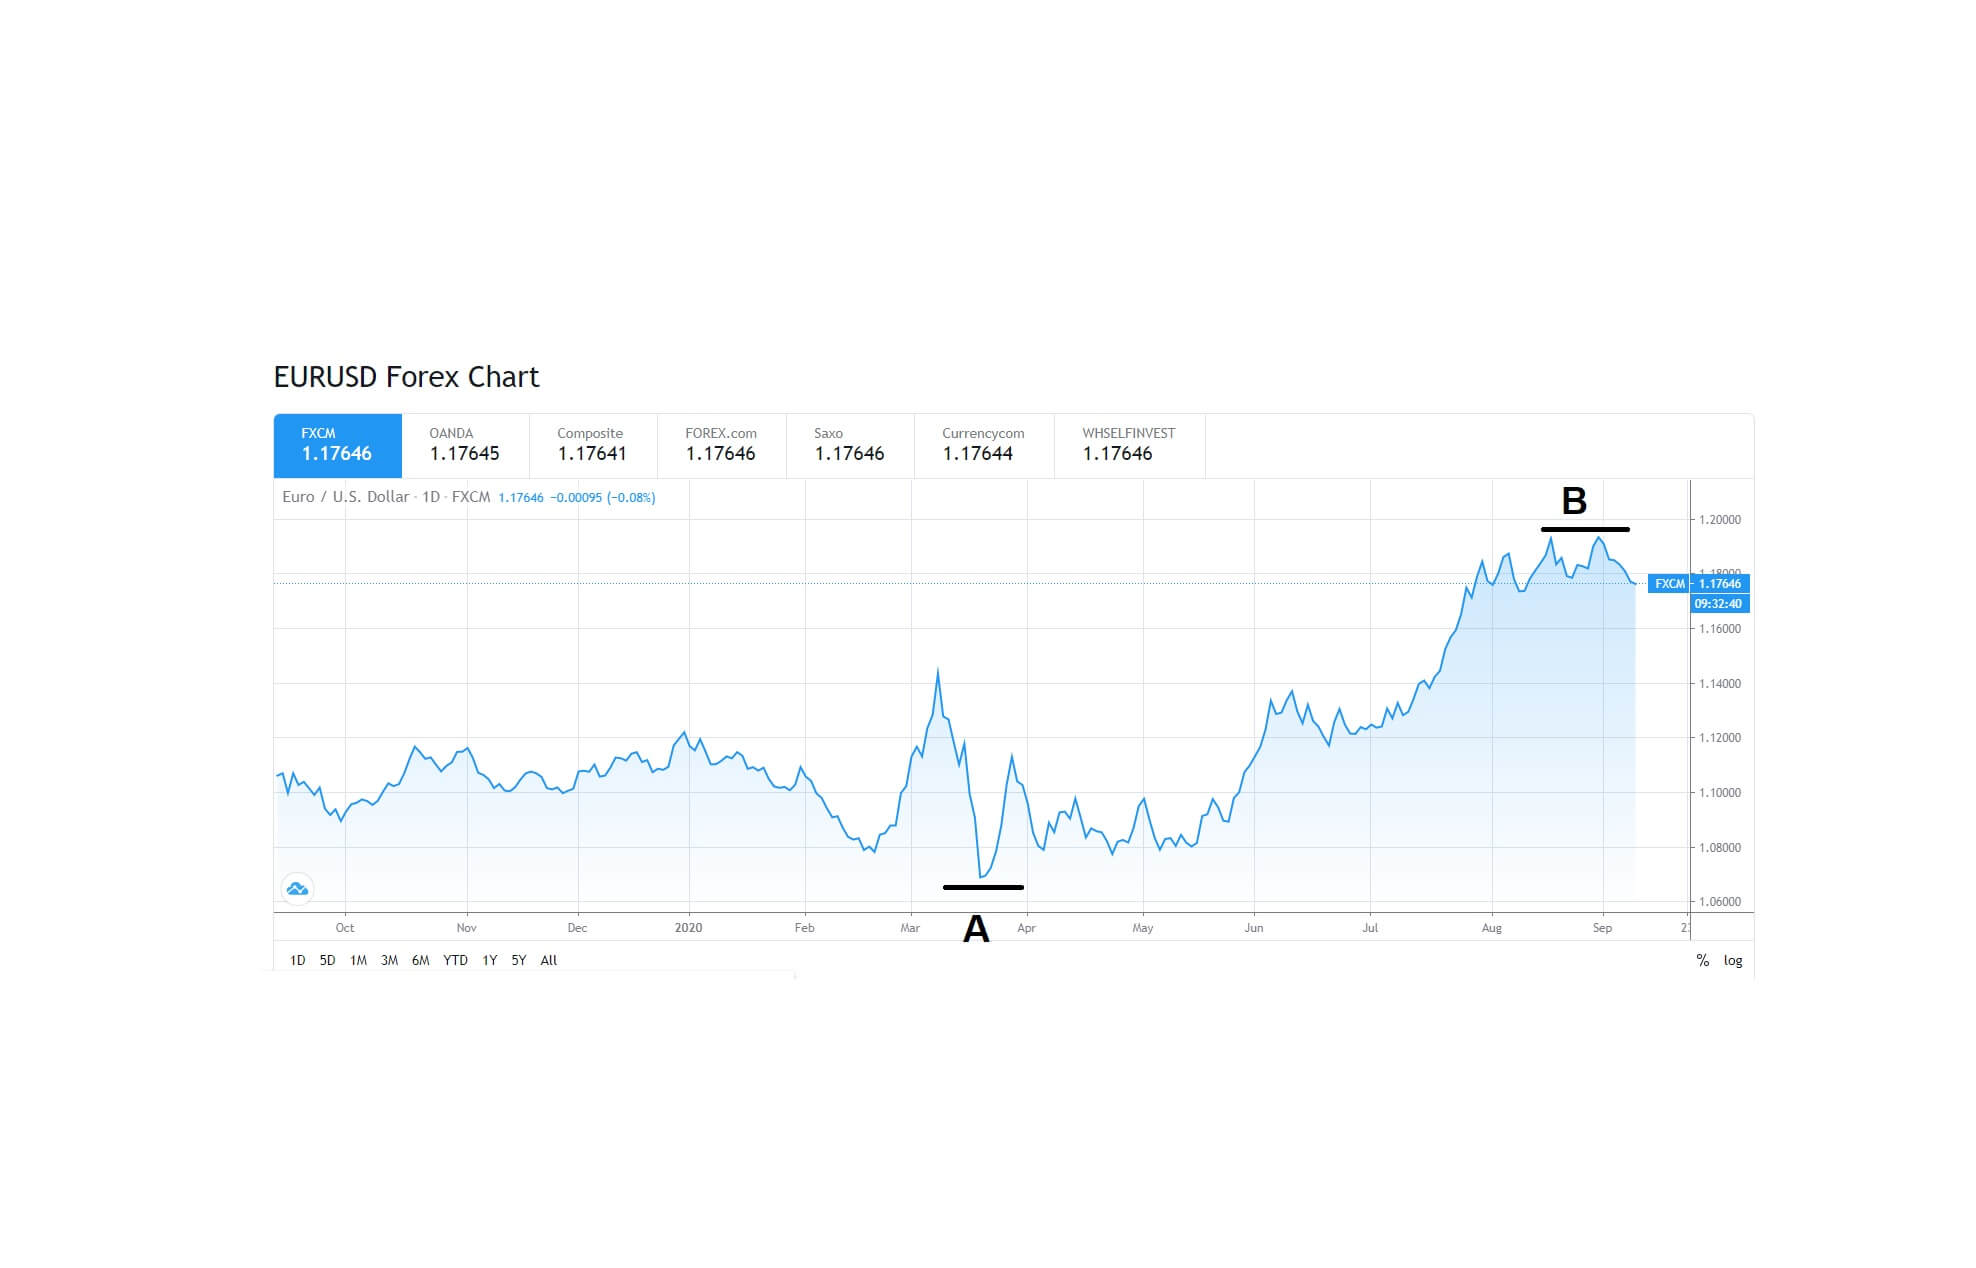
If we now turn our attention to the EURUSD pair, we can see that at position A, at the height of the pandemic in Europe, the currency pair was trading at 1.0600, before moving to a recent high of 1.1936, before falling lower to its current level at 1.1760 at the time of writing.
The sharp reversal in the Cable’s high at 1.3380 and EURUSD pair at 1.1936 can be attributed to the DXY reversing from its fall and bouncing off from its low of 92.00
The reversal of the DXY from 92.00 to its current level of 93.50 at the time of writing can be attributed to the reversal in the Dow Jones from an almost double top formation of a previous record-breaking high. The economic fundamentals are not working as in a normal stable market.
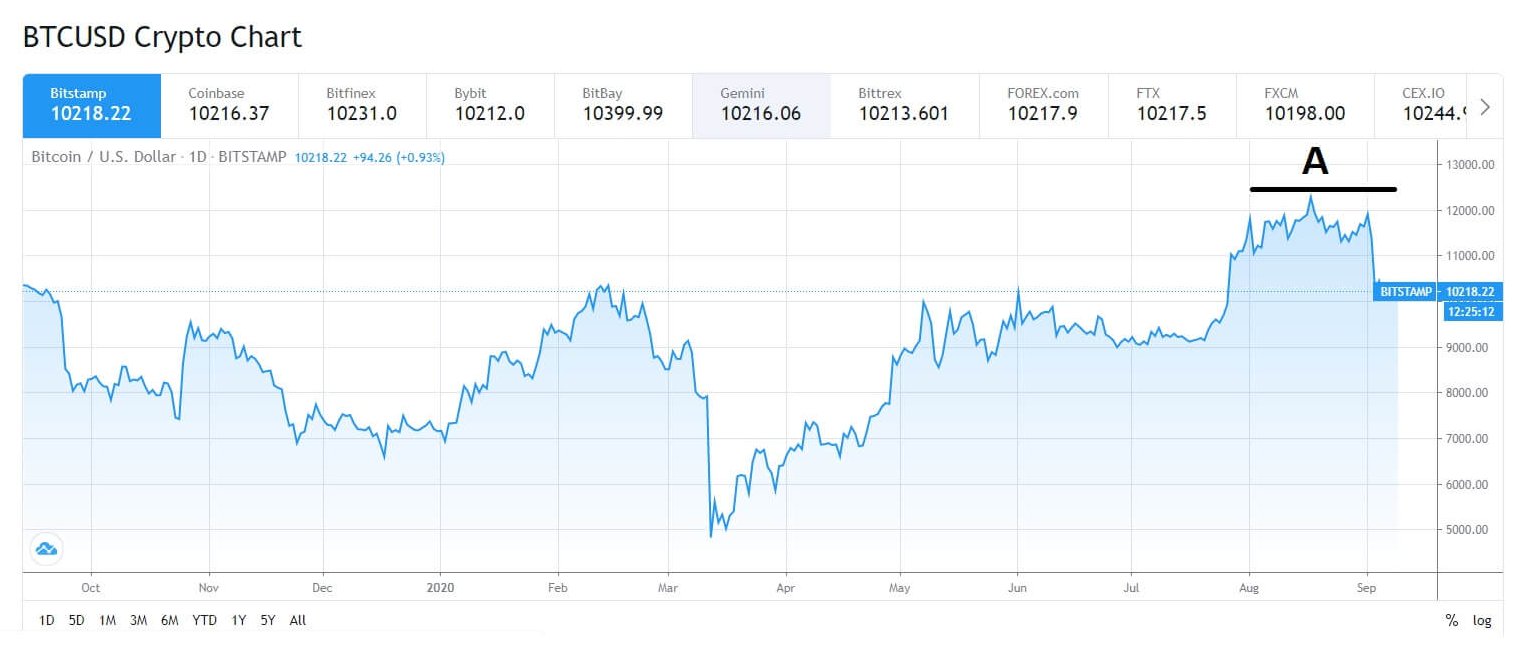
Let’s take a look at the bitcoin to the US dollar, which is currently trading at 10,230 but found resistance at 12,000 recently, and whereby this is no coincidence that this price rejection coincided with the DXY bouncing off of the key 92.00 level.
While some analysts will argue that the markets that we have looked at today are not correlated, either positively or negatively, the numbers and charts speak for themselves.
When trading, always try and factor in as many assets as possible to try and established which might be affecting the other and how that might, in turn, might affect the asset that you are trading.