The U.S. dollar was steady ahead of the release of the latest Federal Reserve monetary policy meeting due later today. The Dollar Index closed broadly flat at 97.82. While media
The U.S. dollar was steady ahead of the release of the latest Federal Reserve monetary policy meeting due later today. The Dollar Index closed broadly flat at 97.82. While media
The U.S. dollar was steady ahead of the release of the latest Federal Reserve monetary policy meeting due later today. The Dollar Index closed broadly flat at 97.82. While media reported that the U.S. and China are discussing the size of tariff rollbacks, President Donald Trump cautioned to force higher tariffs in case a deal is not reached.
The EUR/USD is flashing red and will likely slip from its recovery rally, and today’s close will decide the next direction. As of writing, the currency pair fluctuating in the bearish range of 1.1084-1.1063 and representing declines on the day within yesterday’s bullish and bearish range of 1.1090 and 1.1048.
On the technical side, the EUR/USD pair created an inside bar candlesticks pattern today. Moreover, a close above the inside bar’s high of 1.1084 is needed to improve the recovery rally from 1.0989. While a close below the inside bar’s low of 1.1063 would suggest a bearish reversal.
On the other hand, the United States ten-year yields hit the two-week low of 1.763% and have dropped almost 20-basis-points since the topping out at 1.972% on November 7. Apart from Yields, the United States and China trade concerns are sending the risk assets danger.
It should be noted that the market flow may stand in favor of sellers if the FOMC’s 29-30 October meeting sounds hawkish. The meeting is scheduled to happen at 29-30 October19:00 GMT.
However, the hawkish tone has to be strong because, as we know, the financial markets have confirmed that the rate cuts by the Federal Reserve will not deliver until June of 2020.
According to Germany’s influential BDI industry association’s Managing Director Joachim Lang, manufacturing production in Europe’s economic powerhouse is anticipated to decrease by 4% this year.
Daily Support and Resistance
S3 1.1036
S2 1.1056
S1 1.1067
Pivot Point 1.1076
R1 1.1087
R2 1.1095
R3 1.1115
EUR/USD– Trading Tips
The EUR/USD displayed bearish behavior after testing the resistance mark of 1.1090. Today, the EUR/USD pair has violated the upward channel, which supported the pair around 1.1080 level, and it’s now extending it towards 1.1050 level. Consider taking sell positions below 1.1075 today with the aim of 1.1040.
GBP/USD– Daily Analysis
The GBP/USD pair hit the bearish track for the second consecutive day and representing 0.19% declines on the day, mainly due to uncertainties surrounding the Tory leader’s public favor after the ITV debate. By the way, the cable pair is currently trading at 1.2915.
At the broadside, the ITV debate, which happened between the Tory and the opposition Labor leaders, seemed peaceful as both parties showed a relaxed attitude during holding to part and of Brexit and 2nd referendum, respectively. At the end of the debate, the survey surprise the GBP/USD pairs traders because the United Kingdom Prime Minister Boris Johson got only 51% votes in his favor whereas, on the other hand, the opposition party leader Jeremy Corbyn got 49% votes.
In addition to the recent polls of the ITV’s debate, the uncertainties over the UK PM’s refrain from publishing the news of Russian interference into the Brexit referendum and delaying the corporate tax forms also simulate challenges to the Tory administration.
At the greenback front, another reason behind the GBP/USD pairs weakness is that the U.S. Dollar extended its gains and offer more weakness to the GBP/USD pairs mainly due to the favorable housing market data from the United States. It also helped the US Dollar strength the United States Federal Reserve policymaker John C. Wiliams continued support for the current monetary policy also supported the U.D. buyers.
At the Sino-US front, the greenback extended its recovery streak on the day due to the risk-off arisen by the United States and China trade war regarding the Hong Kong bill. The risk-tone also weighs down amid on-going protests in Hong Kong and Israel. As a consequence, the U.S. 10-year treasury yields drop to 1.75%.
Looking forward, all the market’s eyes will be on the Feral Open Market Commmetiiees latest monetary policy meeting, which is scheduled to happen on 29-30 October, whereas the trade and political headlines will likely keep the trader entertaining.
Daily Support and Resistance
S3 1.2816
S2 1.2876
S1 1.2901
Pivot Point 1.2935
R1 1.296
R2 1.2995
R3 1.3055
GBP/USD– Trading Tips
The GBP/USD is consolidating in a sideways range of 1.2970 – 1.2890 as bearish bias dominates despite weakness in the U.S. dollar. The GBP/USD pair may face double top resistance at 1.2975 on the 4-hour chart. While support stays at 1.2890 level today. Below this, the GBP/USD may head towards 1.2855.
The leading indicators such as a MACD and RSI, are holding in the selling zone, suggesting chances of more selling. Consider staying bearish below 1.2935 today.
USD/JPY – Daily Analysis
The USD/JPY currency pair representing marginal declines and having hit the low of 108.36, the pair is currently trading at 108.50. As of writing, the pair is fluctuating in the range of 108.38/57, mainly due to weakness in the Treasury yields and lack of fresh impulse in the trade war and Brexit.
On the green side, the USD/JPY currency pair has recovered from session lows but remains on the defensive below 109.07 despite the weakness in the Treasury yields.
At the Sino-US front, the greenback extended its recovery streak on the day due to the risk-off arisen by the United States and China trade war regarding the Hong Kong bill, and Beijing warned the United States to do not interfere in this matter. The risk-tone also weighs down amid on-going protests in Hong Kong and Israel. As in consequence, the U.S. 10-year treasury yields drop to 1.75%.
At the Brexit front, the ITV debate, which is happened between the Tory and the opposition Labor leaders, seemed peaceful because both parties showed a relaxed attitude during holding to part and of Brexit and 2nd referendum, respectively. However, at the end of the debate, the United Kingdom Prime Minister Boris Johson got only 51% votes in his favor, whereas, on the other hand, the opposition party leader Jeremy Corbyn got 49% votes.
Meanwhile, the Fedspeak came with New York Federal Reserve president Williams announced that the economy is in a “good place.” The U.S. 2-year Treasury yields roundtripped between 1.59% to 1.62%, while the 10-years initially rose from 1.80% to 1.83% but was then sent back to 1.78%.
Daily Support and Resistance
S3 107.84
S2 108.23
S1 108.39
Pivot Point 108.61
R1 108.77
R2 109
R3 109.38
USD/JPY – Trading Tips
The USD/JPY is trading at 108.40, as the bearish engulfing candle on the 2-hour chart is suggesting a strong bearish bias for the pair. Closing of another bearish candle will confirm bearish setup and the safe-haven currency pair USD/JPY may drop towards 108.200 today.
On the higher side, resistance stays at 108.600 level.
The U.S. Dollar Index fell 0.1% on the day to 97.82, extending its decline to a third session. The euro gained 0.2% to $1.1072, and the British pound advanced 0.3%
The U.S. Dollar Index fell 0.1% on the day to 97.82, extending its decline to a third session. The euro gained 0.2% to $1.1072, and the British pound advanced 0.3%
The U.S. Dollar Index fell 0.1% on the day to 97.82, extending its decline to a third session. The euro gained 0.2% to $1.1072, and the British pound advanced 0.3% to $1.2947. The USD/JPY slipped 0.1% to 108.67.
After Federal Reserve Chairman Jerome Powell met with President Donald Trump and Treasury Secretary Steven Mnuchin to discuss the economy, the Fed released a statement saying Powell’s comments were consistent with his remarks at his congressional hearings last week.
Economic Events to Watch Today
Let’s took at these fundamentals.
EUR/USD – Daily Analysis
The EUR/USD currency pair overall flashing green and consolidates in the narrow range of 1.1063 – 1.1076 due to renewed trade tensions leaving the selling pressure on the greenback. As of writing, the EUR/USD currency pair rose by 0.10% at 1.1060 and hit a high level of 1.1076.
As we all well aware that the pair extended its bullish trend for the 3rd session in a row, extending its recovery trend from the recent 5-weeks lows of 1.0990/85 range, mainly due to the selling pressure in the greenback and some fresh trade tensions.
At the Sino-US trade front, the Chinese legislators showed some attention during the earlier session regarding the singing of the Phase one deal after the United States President Donald Trump announced to ruled out the rollover of some tariffs. In the consequences, due to these concerns, the U.S. Treasury yields turned into lower and some resurgence cities in the safe-havens, weakening further the greenback sentiment.
According to the schedule, the ECBs C.Lagarde is scheduled to deliver the speech in Frankurt later in the week, whereas the investors should keep their eyes on the ECB minutes and the preliminary figures of November PMIs in core Euroland as well.
It should b noted that the pair is increasing the recovery from the last week lows in sub-1.10 range, mainly due to the renewed weakness of U.S. Dollar and hopes of the United States a China fair trade deal.
On the other hand, the outlook in the Euroland continues weak and does nothing but justify the failure for the more extended monetary policy by the European Central Bank and the bearish outlook on the single currency in the medium term, at least. So, from this point of view, all eyes will be on the publication of flash PMIs figures for the current month later in the week.
Daily Support and Resistance
S3 1.1
S2 1.1036
S1 1.1054
Pivot Point 1.1072
R1 1.109
R2 1.1108
R3 1.1144
EUR/USD– Trading Tips
The EUR/USD displayed bullish behavior to examine the resistance mark of 1.1090. Today extension of buying biases can direct the EUR/USD prices towards 1.1125 areas. While support lingers around the 1.1065 area.
GBP/USD– Daily Analysis
The GBP/USD currency pair trading on the bullish track and takes buying to 1.2950 in the wake of fresh hints of political stability, and the successful Brexit keeps the cable pairs strong. As of writing, the pairs consolidate in the range of 1.2944 – 1.2967 dring the Asian session.
The GBP/USD currency pairs recently got the support from the Brexit party decrease of candidates, whereas also avoiding the Bank of England’s dovish bias.
Apart from the continued support for the tory leadership during the December election, as defined by the major surveys, the recent decision regarding the ban of liberal Democrats and the Scottish National Party form the T.V.’s cross-party political discussion also speaks louder for the Conservative’s position in the United Kingdom.
Challenges are surrounding Prime Minister Boris Johnson avoid to release documents regarding Russian interference in the Brexit election stop to cuts the British locals, including Tories, highly criticize corporate tax. Moreover, the European Union stable on the decision does not change the Brexit deal gains less of market attention.
Whereas, the trade and political headlines regarding the United States and China and ITVs debate will likely keep the entertaining investors of markets, as well as, all eyes will be on the November month CBI Industrial Trends Survey data from the U.K., the U.S. Building Permits, Housing Starts and speech from the President of the Federal Reserve Bank of New York, John C. Williams.
Markets are looking for CBI industrial orders to increase from October’s multi-year low of -37 to -30 during November. We think that risks lie toward a more significant gain because the October survey hopefully didn’t capture the improvement in sentiment because Brexit success chances were increased.
The market expects housing starts to have rebounded to 1,320k in October, reflecting a firm 5.1% m/m jump. This would follow a notable -9.4% tumble in September, which was primarily driven by a sharp -28.2% m/m contraction in the volatile multifamily segment,” says T.D. Securities.
Daily Support and Resistance
S3 1.2826
S2 1.289
S1 1.2922
Pivot Point 1.2954
R1 1.2986
R2 1.3018
R3 1.3081
GBP/USD– Trading Tips
The GBP/USD is consolidating with a bullish bias, and it surged to test resistance mark around 1.2970 level. The GBP/USD pair is now facing a double top resistance level at 1.2975 on the 4-hour chart. Typically, the pair becomes bearish below the double top. Therefore, the GBP/USD may exhibit bearish retracement unto 1.2925 ere driving the bullish trend to 1.2975.
The MACD and RSI are staying in the bearish zone, suggesting chances of bearish trading in the GBP/USD trading today.
USD/JPY – Daily Analysis
The USD/JPY currency pair consolidates in the narrow range between the 108.60 and 108.70 so far. As of writing, the currency pair is currently trading near the 108.60.
The USD/JPY currency pair has been capped due to markets presuming a soft dollar policy from the United States administration, whereas trade discussions between the United States and China are on the close track, but the tension still surrounding the market.
The USD/JPY currency pair dropped from 109.05 in early N.Y. to just above 108.50. As for United States treasury yields, the United States’ two-year yields have been on the buying from 1.60% to 1.63% before dropping back to 1.59% due to the US-China trade doubt. The 10-year yields also dropped from 1.85% to 1.80%.
On the technical side, the USD/JPY pair now tries to re-test 50% Fibonacci retracement of April-August drops at 108.40. However, a confluence of 50 and 100-day Exponential Moving Average (EMA) around 108.30/25 will be the key to limit the pair’s further bearish sentiment. The Japanese Trade Minister was on the wires last minutes, also telling the need for an extra budget of around JPY 10 trillion.
Daily Support and Resistance
S3 107.63
S2 108.19
S1 108.44
Pivot Point 108.75
R1 109
R2 109.32
R3 109.88
USD/JPY – Trading Tips
The USD/JPY is trading at 108.60, completing 61.8% Fibonacci retracement level at 108.550. For now, this level also works a double bottom support level as the USD/JPY prices are pushing higher.
On the uppers side, the USD/JPY may find resistance at 108.700, and bullish breakout of this level can extend buying until 108.900 level today. Consider taking sell positions below 108.900 to target 108.500 today.
On Monday, the market trades with a risk-on sentiment over the faded safe-haven appeal. Significant forex pairs indicated time on Monday as traders observed to whether Washington and Beijing can
On Monday, the market trades with a risk-on sentiment over the faded safe-haven appeal. Significant forex pairs indicated time on Monday as traders observed to whether Washington and Beijing can
On Monday, the market trades with a risk-on sentiment over the faded safe-haven appeal. Significant forex pairs indicated time on Monday as traders observed to whether Washington and Beijing can promptly approve an agreement to end a trade war that has been a drag on word’s economic growth.
EUR/USD – Daily Analysis
The EUR/USD currency pair hit the bullish track and currently trading at 1.1061, As of writing, the pair consolidates between the range of 1.1048 – 1.1065 on the day and hit the weekly highs at 1.1065 mainly due to greenback weakness against the bucket of currencies. The buyers join the latest bullish trend, awaiting fresh trading clues and keep their eyes on ECB-speak.
On the EUR-side of the equation, the Eurozone October inflation came in as expected, up by 0.7% YoY and core CPI up by 1.1%, which supported the continuing bullish drive in the common currency.
Looking forward, the buyers target the 100-DMA now located at 1.1093 should the recovery momentum continue. On the other side, the 50-DMA at 1.1042 could defend the downside if the ECB speakers support dovish expectations. However, the United States and China’s trade progress will keep under the spotlight for getting the fresh impulse.
Daily Support and Resistance
S3 1.0957
S2 1.0999
S1 1.1026
Pivot Point 1.1042
R1 1.1069
R2 1.1084
R3 1.1126
EUR/USD– Trading Tips
The EUR/USD proceeds to trade higher, violating the resistance level of 1.1000, which now is working as a support. On the 4 hour timeframe, the EUR/USD has three white soldiers candlestick pattern, which is signaling chances of further buying in the EUR/USD. At the moment, the EUR/USD is holding at the resistance level of 1.1065 as above this; the pair can continue to soar until 1.1080. So consider staying bullish above 1.1065 and bearish below the same level today.
GBP/USD– Daily Analysis
The GBP/USD currency pair consolidates in the range of 12909 – 1.2933, representing 0.20% gains on the day. As of writing, the pair is currently trading at 1.2925 and faced a month old falling trend line resistance due to the increasing expectations of Tory leadership after the December elections. As well as the hardship for the United Kingdom Prime Minister Boris Johnson, limit the further pair’s upside.
The market’s trade sentiment still slows with the United States’ ten-year treasury yields taking rounds to 1.82%, whereas most Asian shares are flashing mixed signals.
Looking forward, traders will now keep their eyes on British prime minister Boris Johnson’s speech at Confederation of British Industry’s annual conference for getting a new direction to move ahead. At the economic calendar front, the US NAHB Housing Market Index figures for November, expected to remain at 71, will keep the thin line of statistics. However, trade and political headlines will keep under the spotlight.
Daily Support and Resistance
S3 1.2793
S2 1.2845
S1 1.2874
Pivot Point 1.2897
R1 1.2926
R2 1.2949
R3 1.3001
GBP/USD– Trading Tips
The GBP/USD continues to trend upward to test our previously suggested upper corner of a wide trading range of 1.2970 – 1.2780.
The MACD and RSI are lingering in overbought territory as their values linger at 0 and 50, respectively. Besides this, the chances of bullish correction are becoming very strong.
At the time, the GBP/USD trades at 1.2940 level, and it may find support immediate support around 1.2920. I will consider taking buying positions above 1.2920 and bearish positions if this level breaks on the lower side.
USD/JPY – Daily Analysis
The USD/JPY currency pair consolidates in the narrow range between the 108.75 and 109.00, mainly due to intensifying tensions in Hong Kong and lack of trade war hopes.
So, the risk-off sentiment raises so far, with S&P 500 futures down -0.15%, Treasury yields falling almost 0.50%, whereas the Asian equity markets trade with moderate losses. The Japanese Yen currency still on the supported track and keeping a break above the 109 range.
If talking about the greenback, the U.S. Dollar still on the bearish track due to the losses in the Treasury yields. As in result, this situation sending lower the USD/JPY currency pair. Moreover, the investors are on the waiting mood and await some transparency regarding the United States and China trade deal and FOMC minutes for fresh trading direction, because the United States economic calendar seem light during this week.
As of writing, the U.S. Dollar Index traded 0.1% lower to 97.810. The Federal Reserve will announce the minutes of it’s October meeting on Wednesday, and several Federal Reserve policymakers are scheduled to speak before the upcoming Thanksgiving holiday.
Daily Support and Resistance
S3 107.96
S2 108.33
S1 108.55
Pivot Point 108.7
R1 108.93
R2 109.08
R3 109.45
USD/JPY – Trading Tips
The USD/JPY is trading at 108.90, crossing over 61.8% Fibonacci retracement level. This level also marks a double bottom resistance level, but that has now been violated and may keep the USD/JPY pair supported today.
The violation of the 108.90 level can extend buying until 109.200. The MACD and RSI are also supporting the bullish trend in the USD/JPY pair.
On Thursday, the safe-haven demand remains high as the trader’s eyes stay on the United States and China trade news to observe the impact on the riks sentiment, which continues
On Thursday, the safe-haven demand remains high as the trader’s eyes stay on the United States and China trade news to observe the impact on the riks sentiment, which continues
On Thursday, the safe-haven demand remains high as the trader’s eyes stay on the United States and China trade news to observe the impact on the riks sentiment, which continues to play an impactable role in the USD/JPY currency par prices. The market will closely be observing the US producer Prices Index an Unemployment Claims data, which is scheduled to release ahead of day 2 of Powell’s testimony.
At the Hong Kong front, the Hong Kong civil unrest and violence take the worst turn for the 4th-straight day on Thursday, after the police reported that a man dressed in black and aged in his 30s died.
Economic Events to Watch Today
Let’s took at these fundamentals.
EUR/USD – Daily Analysis
The EUR/USD currency pair currently trading near the level of 1.1006 on the day. Even after the pair spot staying below 200-bar Simple Moving Average, the EUR/USD currency pair bounces off 61.8% Fibonacci retracement of its October month upward.
However, the buyers will likely wait for a bullish break of 200-bar moving Average at 1.1058 now, followed by 38.2% Fibonacci retracement and late-October lows surrounding 1.1065/75, to target 1.1100 marks.
On the positive side, if the GDP positive release, the pair may attempt recovery of 1.1040 and 1.156, the confluence zone of the 50 and 10-DMA. Buyers will likely try for the test of the 100-day Moving Average at 1.1100 on a continues break above the last.
On the technical side, the pairs Techincal st up continues to favor the buyers because the EUR/USD pair still on the track to test the immediate support of mid-October lows near the 1.0991. While the break bellow will likely escalate selling pressure, because of the buyer’s eyes 1.0950 as the next support, the more bearish trend in pairs could hit the multi-year lows of 1.0879 over again.
Daily Support and Resistance
S3 1.0958
S2 1.0983
S1 1.0996
Pivot Point 1.1008
R1 1.1021
R2 1.1033
R3 1.1058
EUR/USD– Trading Tips
The EUR/USD continues to trade lower, maintaining a bearish bias after violating the support level of 1.1000. On the 4 hour timeframe, the EUR/USD has inside down candlestick pattern, which is signaling chances of further sell-off in the market.
For the moment, the EUR/USD is holding below a crucial trading level of 1.1000 as below this; the pair can continue falling until 1.0960. So consider staying bearish below 1.1000 level today.
GBP/USD– Daily Analysis
The GBP/USD currency pair sideways and taking round to 12840 mainly due to optimism surrounding the United Kingdom political plays face the greenback strength ahead of the United Kingdom Retail Sales Data for October.
Brexit party leader Nigel Farage’s denial of the Conservative’s request of standing down more than 317 candidates, earlier promised, will likely negatively affect the British Prime Minister (PM) Boris Johnson’s popularity. The United Kingdom’s (UK) PM Boris Johnson was recently hackled during a speech to the flood-affected area. Whereas, surveys regarding the December election keep showing Tories holding power.
Looking forward to October, UK Retail Sales could boost the GBP/USD demand if it hit the upbeat predictions. However, the market’s rush to risk-safety can increase the USD gains if the Fed Chair support upside momentum during his Testimony 2.0.
Overview of UK Retail Sales, the UK retail sales, scheduled to be released later this session at 0930 GMT, is forecasted to come in at 0.2% MoM in October, after no increase seen in September. Total retail sales are seen coming at 3.7% over the year in the reported month, up from 3.1% booked previously.
Daily Support and Resistance
S3 1.2767
S2 1.2806
S1 1.2829
Pivot Point 1.2845
R1 1.2868
R2 1.2884
R3 1.2923
GBP/USD– Trading Tips
The GBP/USD is consolidating in the broad trading range of 1.2970 – 1.2780, while if we narrow it down, it becomes 1.2870 – 1.2785. The MACD and RSI have passed above 0 and 50, sequentially, indicating the probabilities of a downward movement in the GBP/USD.
At the moment, the GBP/USD trades at 1.2835 level, and it may find support around 1.2785. I will consider taking buying positions above 1.2845 and selling below the same level today.
USD/JPY – Daily Analysis
The USD/JPY currency pair failed to hit the recovery track from thee 6-days lows of 108.65 and still stands near the range of 108.80 area, mainly due to on-going trade uncertainty between the United States and China. On the other hand, the pairs didn’t get any impact by the Japans Q3 GDP because of the renewed Sino-US trade war.
The Japanese Preliminary Q3 GDP rate slightly increased even less-than-expected across the time limit. However, the Japanese yen currency gave little attention to the sluggish figure releases. The Japanese yen continued getting support from the risk-off sentiment in Wall Street’s futures and global equities mainly after the United States and China trade tension again escalated during the overnight trading hours.
Trader’s eyes stay on the United States and China trade news to observe the impact on the riks sentiment, which continues to play an impactable role in the USD/JPY currency par prices. The market will closely be observing the US producer Prices Index an Unemployment Claims data, which is scheduled to release ahead of day 2 of Powell’s testimony.
At the Hong Kong front, the Hong Kong civil unrest and violence take the worst turn for the 4th-straight day on Thursday, after the police reported that a man dressed in black and aged in his 30s died.
Despite the Hong Kong confusion and renewed US-China trade tensions, the market mood looks to be developing over the last, with S&P 500 futures having flashed green as well as the Japanese stocks. This has helped put a minor buying under USD/JPY that is now trading in session highs near the 108.85 regions.
Daily Support and Resistance
S3 107.87
S2 108.37
S1 108.57
Pivot Point 108.86
R1 109.06
R2 109.36
R3 109.85
USD/JPY – Trading Tips
The USD/JPY is trading at 108.70, right above the 50% Fibonacci retracement level. This level also marks double bottom support and may keep the USD/JPY pair supported today.
The violation of the 108.700 level can extend selling until 108.500, the 61.8% Fibo level today. The MACD and RSI are also supporting the bearish trend in the USD/JPY pair.
On Wednesday, the global financial markets await the Fed Chair speech along with the CPI (Consumer Price Index) data from the U.K and the U.S. The United States and China
On Wednesday, the global financial markets await the Fed Chair speech along with the CPI (Consumer Price Index) data from the U.K and the U.S. The United States and China
On Wednesday, the global financial markets await the Fed Chair speech along with the CPI (Consumer Price Index) data from the U.K and the U.S. The United States and China trade front, the trade concerns between the United States and China are getting severe, with the Trump administration warned to increase the tariff but not until the deal gets confirmation.
We look for CPI to decline from 1.8% y/y in September to 1.5% in October (mkt 1.6%), in line with the BoE’s forecast from November. Let’s take a more in-depth look at the technical side of the market.
Economic Events to Watch Today
Let’s took at these fundamentals.
EUR/USD – Daily Analysis
The EUR/USD currency pair found on the high range of 1.10 handle, as of now, the pair consolidate in the narrow range around the 1.10 handle because tye buyers await for the key inflation report and Federal Reserve Chair Powells statement for the next move.
As of writing, the currency pair is found slightly supported from the pause in the greenback strength after the United States President Trump’s latest comments failed to offer any detail on the United States and China trade agreement and due to this partial trade deal’s uncertainty increased. The U.S. Dollar index trades flat near the 98.30, consolidating the increase to a 4-week high of 98.42.
On the technical side, the 5-Moving Average barrier at 1.1025 is could to reduce the recovery attempts, whereas the bearish sees the next support around the 1.0950 level. The sub-1.1000 levels could be tested on a likely increase in the U.S. Consumer Price Index (CPI), which is scheduled to release at 1330 GMT.
Daily Support and Resistance
S3 1.0944
S2 1.0981
S1 1.0995
Pivot Point 1.1017
R1 1.1031
R2 1.1053
R3 1.1089
EUR/USD– Trading Tips
The EUR/USD is trading with a slightly bullish bias since it violated the resistance level of 1.1025. On the 4 hour timeframe, the EUR/USD has formed a bullish engulfing candle, which is signaling chances of further buying in the market.
For the moment, the EUR/USD is concentrating on a critical trading level of 1.1060, which is probable to hold the EUR/USD bearish below this mark. Below this level, the EUR/USD may gain support at 1.1025 and 1.1000 level today.
GBP/USD– Daily Analysis
The GBP/USD currency pair found near the 1.2850, notably the lack of significant impetus from the United Kingdom, has recently limited the cable pairs movement, as well as the market traders on the waiting track ahead of the critical data and events.
After the mixed figures of the British employment details, the GBP/USD currency pair saw another pressure on the United Kingdom Prime Minister Boris Jonhson to release a report regarding the Russian interference in the 2016 Brexit referendum.
On the United States and China trade front, the trade concerns between the United States and China are getting severe, with the Trump administration warned to increase the tariff but not until the deal gets confirmation.
We look for CPI to decline from 1.8% y/y in September to 1.5% in October (mkt 1.6%), in line with the BoE’s forecast from November MPR. The complete deceleration in inflation is due to energy prices; household energy prices will be affected by the OFGEM cap, while fuel prices may decline a bit on a y/y basis. Stripping out the volatility, we’re looking for core CPI to hold steady at 1.7% y/y (Mkt 1.7%).
Daily Support and Resistance
S3 1.2728
S2 1.2787
S1 1.2816
Pivot Point 1.2845
R1 1.2875
R2 1.2904
R3 1.2962
GBP/USD– Trading Tips
The GBP/USD appears to have broken the bearish trendline resistance of 1.2825 upon the release of optimistic GDP figures. The MACD and RSI have crossed above 0 and 50, respectively, implying the odds of a bullish bias in the GBP/USD. The Cable may find immediate support at 1.2845 level. But the closing of candles above 1.2845 area suggests a strong chance of buying trend continuation.
Consider taking buying positions above 1.2845 and selling below the same level today.
USD/JPY – Daily Analysis
The USD/JPY currency pair still consolidates in the bearish range of 109 handles, and traders are found on the waiting track even after the latest updates regarding Hong Kong protests and the United States and China trade deal.
Whereas the intensifying uncertainty between the United States and China trade deal as well as the protest unrest in Hong Kong, keep leaving bearish pressure on the USD/JPY currency pair, the overall hawkish sentiment at the Federal Reserve limits the bearish off-late.
Officials from the United States, including President Donald Trump and White House Economic Adviser Larry Kudlow, just show a willingness to raise the tariff on the Chinese goods if the round-1 talks fail. Moreover, the political also did clear that the existing tariff could reduce but not until the deal gets confirmation.
Market traders are now planning for the Federal Reserve Chairman Jerome Powells statement in front of the Joint Economic Committee, and traders will closely follow Fed speak, whereas the market is also waiting for the October month Consumer Prices Index.
Daily Support and Resistance
S3 108.33
S2 108.7
S1 108.86
Pivot Point 109.07
R1 109.23
R2 109.44
R3 109.81
USD/JPY – Trading Tips
The USD/JPY pair is forming higher’s high and higher’s low pattern on the 4-hour chart, which suggesting bullish bias among traders. The USD/JPY has immediate support at 108.900 and resistance at 109.400.
The MACD is forming histograms in the bearish zone, but the recent histogram is likely to develop above 0, and it may drive more buying until 109.450 today.
On Tuesday, the precious metal gold prices edged lower as forecasts of resolute trade discussions between the United States and China supported risk desire, while traders pocketed profits ahead of
On Tuesday, the precious metal gold prices edged lower as forecasts of resolute trade discussions between the United States and China supported risk desire, while traders pocketed profits ahead of
On Tuesday, the precious metal gold prices edged lower as forecasts of resolute trade discussions between the United States and China supported risk desire, while traders pocketed profits ahead of further updates.
The precious metal gold also sank 0.2%, to $1,454.20 per ounce as investors moved their funds into the stock markets, the higher-yielding assets these days. Consequently, the global stock indices surged higher on Tuesday as traders anticipated a speech by President Trump on trade policy during the U.S. session.
Investors will be closely following Trump’s speech to have a clear stance on the U.S. China tariff rollover, and the EU auto industry tariffs delay.
EU leaders said Trump was supposed to declare this week he was holding the tariff ruling on cars and auto parts shipped from the European Union probably for another six months. That’s raising anticipations about the president’s speech following in the day about the long-drawn trade war with China.
XAU/USD – Daily Technical Levels
Support Resistance
1,452.53 1,469.27
1,446.03 1,479.51
1,429.29 1,496.25
Pivot Point 1,462.77
Gold is trading in a bearish channel, which is keeping it supported around 1,448 level. It’s also extending resistance at 1,456 area. The bearish channel clearly suggests strong chances of further sell-off in the gold prices.
On the lower side, the bearish breakout of 1,448 level can extend selling further until 1,444 level. But for the bearish breakout, we need a solid reason that we can’t expect after looking at today’s economic calendar.
Therefore, consider staying bearish below 1,456 and bullish above 1,448 to capture choppy trading in gold. All the best!
The buck slipped along with the global stock, which plunged on Monday following the U.S. President Donald Trump’s comments during the weekend tore investor confidence that Washington and Beijing would
The buck slipped along with the global stock, which plunged on Monday following the U.S. President Donald Trump’s comments during the weekend tore investor confidence that Washington and Beijing would
The buck slipped along with the global stock, which plunged on Monday following the U.S. President Donald Trump’s comments during the weekend tore investor confidence that Washington and Beijing would immediately reach an agreement to settle their debilitating trade war.
At the Sino-US trade front, the United States and China trade tension flashing continuously, whereas the United States interference in the Hong Kong protests awaits China’s response fro fresh risk-off. The market’s risk-tone continues slowly, with the United States ten-year treasury yields being around 1.92%, with most Asian stocks flashing mixed signals.
Economic Events to Watch Today
Let’s took at these fundamentals.
EUR/USD – Daily Analysis
The EUR/USD currency pair consolidates in the narrow range of 1.1030 and 1.1050 due to the greenback continues its recovery rally. As of writing, the pair mostly trades near the 1.10 range during on the day, because of USD strength. As we all well aware, the uncertainty surrounding the United States and China trade deal and Hong Kong’s civil protest worries resurged the demand for safety, so that’s why the market was favoring the U.S. currency.
Whereas, on the EUR-side of the equation, the uncertain result of the Spanish general election combined with Eurozone economic growth worries continues to remain a bearish impact on the common currency.
Markets now traders keenly await the German macro news and some new transparency on the US-China trade front for fresh trading impulse, whereas Trump’s speech scheduled today at 1700 GMT will likely also direct the next moves in the spot.
Daily Support and Resistance
S3 1.0953
S2 1.0992
S1 1.1006
Pivot Point 1.1031
R1 1.1045
R2 1.107
R3 1.1108
EUR/USD– Trading Tips
The EUR/USD is trading with a slightly bullish bias since it violated the resistance level of 1.1025. On the 4 hour timeframe, the EUR/USD has formed a bullish engulfing candle, which is signaling chances of further buying in the market.
For the moment, the EUR/USD is concentrating on a critical trading level of 1.1060, which is probable to hold the EUR/USD bearish below this mark. Below this level, the EUR/USD may gain support at 1.1025 and 1.1000 level today.
GBP/USD– Daily Analysis
The GBP/USD currency pair got limited benefits from the United Kingdoms’ optimism because the pairs await fresh hints from the monthly employment figures whereas taking the buying to 1.2865. As of writing, the GBP/USD currency pair currently trading at 1.2865.
At the Sino-US trade front, the United States and China trade tension flashing continuously, whereas the United States interference in the Hong Kong protests awaits China’s response fro fresh risk-off. The market’s risk-tone continues slowly, with the United States ten-year treasury yields being around 1.92%, with most Asian stocks flashing mixed signals.
There will likely be a moderate weakness in Claimant Count estimates amid no change in Unemployment Rate and Average Earnings. After the data, the speech from the United States President Donald Trump and Federal Reserve speech will be closely followed to decide the future of the United States and China trade relations and the U.S. Federal Reserve futures moves, respectively.
Daily Support and Resistance
S3 1.2676
S2 1.2732
S1 1.2754
Pivot Point 1.2789
R1 1.281
R2 1.2845
R3 1.2901
GBP/USD– Trading Tips
The GBP/USD appears to have broken the bearish trendline resistance of 1.2825 upon the release of optimistic GDP figures. The MACD and RSI have crossed above 0 and 50, respectively, implying the odds of a bullish bias in the GBP/USD.
On the lower side, the GBP/USD may find immediate support at 1.2845 level. But the closing of candles above 1.2845 area suggests strong chance of buying trend continuation.
Consider taking buying positions above 1.2845 and selling below the same level today.
USD/JPY – Daily Analysis
The USD/JPY currency pair found on the bullish track and taking buying near the 109.20 on the day, despite the trade tension between the United States and China, and protest in Hong Kong. The greenback strength could be the reason behind the pair’s bullish trend. Notably, the recovery of U.S. bond trading, greenback sent higher.
However, investors broadly avoided the United States’ expectations regarding the tariff roll back from the European Union automobiles and positive comments from the Japanese Economy Minister Yasutoshi Nishimura as well.
Whereas the traders will keep their eyes on trade and Hong Kong worries, as well as the United States President Donald Trump comments from the Economic Club of New York, lunch will also keep under the eyes. The United States President is broadly expected to clarify the much needed United States and China trade relations and the U.S. tariff policy.
Looking forward, Focus will be on Trump’s speech and speeches by the Federal Reserve officials, which is scheduled to speak later on Friday, in the absence of relevant macro data out of the U.S. President is scheduled to speak at the Economic Club of New York around 1700 GMT.
Daily Support and Resistance
S3 108.48
S2 108.88
S1 109.08
Pivot Point 109.28
R1 109.47
R2 109.68
R3 110.07
USD/JPY – Trading Tips
On the 4 hour chart, the USD/JPY pair is forming higher’s high and higher’s low pattern, which suggesting bullish bias among traders. The USD/JPY has immediate support at 108.900 and resistance at 109.400.
The MACD is forming histograms in the bearish zone, but the recent histogram is likely to develop above 0, and it may drive more buying until 109.450 today.
The U.S. dollar was marginally softer against the single currency euro and safe-haven currency Japanese yen, following some traders caution that the agreement could still unravel. The dollar index traded
The U.S. dollar was marginally softer against the single currency euro and safe-haven currency Japanese yen, following some traders caution that the agreement could still unravel. The dollar index traded
The U.S. dollar was marginally softer against the single currency euro and safe-haven currency Japanese yen, following some traders caution that the agreement could still unravel. The dollar index traded at $1.1020 versus the shared currency euro and 109.23 against the Japanese yen.
Whereas the Chinese yuan was marginally lower in the offshore business, but still on the strong opponent of 7-per-dollar at 6.9892 in foreign trade.
Economic Events to Watch Today
Let’s took at these fundamentals.
EUR/USD – Daily Analysis
The EUR/USD currency pair stops its further declining streak after a 5-day losing trend. As of writing, the pair is currently trading above the 1.1000, having hit the 3-weeks low of 1.1017 last Friday. Notably, the EUR/USD pair remains cautious, mainly due to the greenback strength.
As of now, the pair is fluctuating up and down between a 10-pips narrow range during the Monday. The markets await fresh clues regarding the United States and China trade relations for a new direction, as well as the big economic releases from both sides of Atlantic the week ahead for the next direction. The United States docket discusses the releases of the CPI data and Federal Reserve Chairman Powell’s testimony, whereas the EUR calendar headlines the Eurozone growth figures.
Looking ahead, the pair could keep its range trade steady mainly due to the holiday in the United States, the markets of the United States closed in the wake of Veterans Day. However, the greenback will continue its progress due to fresh trade-related development.
Daily Support and Resistance
S3 1.0953
S2 1.0992
S1 1.1006
Pivot Point 1.1031
R1 1.1045
R2 1.107
R3 1.1108
EUR/USD– Trading Tips
The EUR/USD is consolidating with a bearish bias since it broke the bullish trendline support around the 1.1025 area. On the 4 hour timeframe, the pair has formed strong bearish channels, which are signaling chances of further selling in the market.
At the moment, the EUR/USD is focusing on a crucial trading level of 1.1060 level, which is likely to keep the EUR/USD bearish under this. Below this level, the EUR/USD may gain support at 1.1025 and 1.1000 level today.
GBP/USD– Daily Analysis
The GBP/USD currency pair hit the 3-week low mainly due to Moodys cut the United Kingdom outlook unfavorable. By the way, the pair stop its further bearish movement because of UK GDP. As of writing, the GBP/USD currency pair currently trading around 1.2793.
The U.S. Dollar continues its recovery rally due to the global investors try safety and cautious in the wake of intensifying uncertainty surrounding the United States and China trade deal and protests in Honk Kong. Moreover, the reason behind the greenback safe-haven demand could be the geopolitical tension in the Middle East.
On the other hand, Chancellor’s defeat to justify the criticism of the opposition Labour party’s spending plan increased the uncertainties regarding the United Kingdom Prime Minister Boris Jonson’s lead during the snap elections, which is scheduled to happen in December.
As of data, the UK GDP is expected to increase to +0.3% from -0.2% on QoQ; the YoY figures might decrease to 1.1% from 1.3%. Moreover, Manufacturing Production could shrink -0.2% against -0.7% prior, whereas Industrial Production could increase to -0.1% from -0.6%.
Daily Support and Resistance
S3 1.2676
S2 1.2732
S1 1.2754
Pivot Point 1.2789
R1 1.281
R2 1.2845
R3 1.2901
GBP/USD– Trading Tips
The GBP/USD seems to have violated the sideways channel following the Bank of England policy decision. The MACD and RSI have crossed below 0 and 50, respectively, suggesting the chances of a bearish trend in the GBP/USD. On the downside, the GBP/USD has closed one of the candles below 1.2785 area, which suggests strong chances of a bearish trend continuation.
Next support prevails around 1.2750, and the violation of this level can extend sell-off until 1.2685.
USD/JPY – Daily Analysis
The USD/JPY currency pair remained on the bullish track and got the additional boost and reached near the multi-month high mainly due to Japan Machinery Orders declined below the expected figures. As of writing, the USD/JPY currency pair currently trading at 109.20 on the day.
Japan’s September month Machinery Orders against market forecasts on MoM and YoY basis. Whereas the monthly numbers dropped below +0.9% expected and -2.4% before -2.9%, yearly numbers seem a bit less negative with +5.1% growth figures against 7.9% consensus and -14.5% earlier readouts.
While looking at the lack of the United States traders from markets, mainly due to the Veterans Day holiday, along with the recent data, US investors have no key event and statistics for publishing on the economic calendar.
Notably, the lowest inflation figures from the United States and the Federal Chairs’ testimony may also force the traders to keep away from the big position before the event.
Daily Support and Resistance
S3 108.48
S2 108.88
S1 109.08
Pivot Point 109.28
R1 109.47
R2 109.68
R3 110.07
USD/JPY – Trading Tips
On the technical side, the USD/JPY currency pair had shown the wrong direction to the buyers of the market during the last 48 hours as you know the pair dropped in 48 hours against the buyer’s expectations. The pair closed above the 200-day M.A. on Monday to fall back below the long-term M.A. in the overnight trade. Consider staying bearish below
The United States and China trade deal optimism supported the risk-on markets and came to a massive increase in the US Treasury yields, sent the greenback higher.
A report came
The United States and China trade deal optimism supported the risk-on markets and came to a massive increase in the US Treasury yields, sent the greenback higher.
A report came
The United States and China trade deal optimism supported the risk-on markets and came to a massive increase in the US Treasury yields, sent the greenback higher.
A report came that both countries decided to cancel some existing tariff if the round-1 trade deal happened on a positive outcome. It should be noted that the United States’ ten-year yields increased from 1.80% to 1.97%. This is the highest level since August 1.
Economic Events to Watch Today
Let’s took at these fundamentals.
EUR/USD – Daily Analysis
The EUR/USD currency pair remains to flash red and dropped for the 4th-consecutive day but didn’t hit below the 50-day average level. Moreover, the bullish trend could be seen in the pair because the Treasury yields are increasing in the wake of mild losses in the US dollar index futures.
As we all well aware, the shared currency faced many selling pressure yesterday, as anticipated, and fell near the 50-day average range at 1.1038. The US Treasury yields increased, sent the US Dollar higher, due to the fresh United States and China trade optimism.
A report came that both countries decided to cancel some existing tariff if the round-1 trade deal happened on a positive outcome. It should be noted that the United States’ ten-year yields increased from 1.80% to 1.97%. This is the highest level since August 1.
Currently, the futures on the S&P 500 are reporting a 0.18% decline, and the United States ten-year yield is seen at 1.91%, down 6-basis points from Thursday’s high.
On the flip side, the German trade balance and the US Michigan Consumer Sentiment Index are scheduled to release and will likely leave an impact on the EUR/USD pair. As well as, the China trade data fro October release during the Asian trading hours represented declines in the imports.
Daily Support and Resistance
S3 1.1018
S2 1.1047
S1 1.1056
Pivot Point 1.1075
R1 1.1084
R2 1.1103
R3 1.1131
EUR/USD– Trading Tips
The EUR/USD is consolidating with a bearish bias since it broke the bullish trendline support around 1.1125 area. On the 4 hour timeframe, the pair has formed strong bearish channels, which are signaling chances of further selling in the market.
At the moment, the EUR/USD is focusing on a crucial trading level of 1.1060 level, which is likely to determine the further direction of the pair. Below this level, the EUR/USD may gain support at 1.1040 and 1.1010 level today.
GBP/USD– Daily Analysis
The GBP/USD currency currently flashing green, but the overall sentiment remains bearish. As of writing the GBP/USD currency pair presently trading at 1.2822, having increased just more than ten pips a few minutes ago because the banks of England’s monetary policy decision has calm down now.
The main reason behind the GBP/USD currency pairs bearish sentiment is that the monetary policy decision by the bank of England. The rates hit the weakest level since September 24 at 1.2793 due to the Bank of England MPC maintained the interest rates, whereas two members of Bank of England voted for a rate cut.
The wary comments from the Bank of England Governor Carney also hurt the GBP. He warned during signaling the risk of a global economic downturn that there would be losses in jobs and business closure in the wake of no-deal Brexit.
On the other hand, the United States and China trade deal optimism supported the risk-on markets and came to a massive increase in the US Treasury yields, sent the greenback higher. So, the GBP/USD currency pair also was seen at the bearish track due to the rise in demand for the US dollar.
Daily Support and Resistance
S3 1.2758
S2 1.2812
S1 1.2832
Pivot Point 1.2865
R1 1.2886
R2 1.2918
R3 1.2971
GBP/USD– Trading Tips
The GBP/USD hasn’t improved enough as it extends to trade sideways ahead of the Bank of England policy decision. The MACD and RSI have crossed below 0 and 50, respectively, suggesting the chances of a bearish trend in the GBP/USD. But the thing is, investors are staying out of the market ahead of BOE rate. On the downside, the GBP/USD may see next support around 1.2786, and the violation of this level can extend sell-off until 1.2690.
USD/JPY – Daily Analysis
The USD/JPY currency pair is flashing green even after the positive Japanese data and the risk-on sentiment in the equity markets. As of writing, the USD/JPY currency pair is currently trading at 109.35 and consolidates in the narrow range. By the way, the pair hit the high of 109.49 during the overnight trade. Notably, the pair gained its15-pips in the last few minutes.
As of data, Japan’s Household Spending surged 9.5% year-on-year in September, crossed the expected rise of 7.8% by a big margin and up significantly from the preceding month’s 1% rise. Labor Cash Earnings also rose 0.8% in annualized terms, bettering the 0.4% estimate.
However, the Japanese yen is not supportive, mainly due to the fears that the buyers spent more ahead of the October tax hike. Notably, the spending had increased by 7.2% in March 2014, month ahead of the prior sales tax increase, only to fall sharply and stay negative for more than a year.
According to the forecasting view, the USD/JPY currency pair will likely keep its tracking the action in the primary equity markets and US Treasury yields. The ten-year yield increased to 1.97% in the overnight trade since 3-months highs. China’s trade data may also affect the demand for the Japanese yen.
Daily Support and Resistance
S3 108.34
S2 108.66
S1 108.82
Pivot Point 108.98
R1 109.14
R2 109.3
R3 109.62
USD/JPY – Trading Tips
On the technical side, the USD/JPY currency pair had shown the wrong direction to the buyers of the market during the last 48 hours as you know the pair dropped in 48 hours against the buyer’s expectations. The pair closed above the 200-day MA on Tuesday to fall back below the long-term MA in the overnight trade. Consider staying bullish above
https://youtu.be/obpfVVZY02M
What is Bitcoin halving?
Before explaining Bitcoin halving, we need to know how Bitcoin mining works. Each time a block is verified by submitting a correct answer to
https://youtu.be/obpfVVZY02M
What is Bitcoin halving?
Before explaining Bitcoin halving, we need to know how Bitcoin mining works. Each time a block is verified by submitting a correct answer to
https://youtu.be/obpfVVZY02M
What is Bitcoin halving?
Before explaining Bitcoin halving, we need to know how Bitcoin mining works. Each time a block is verified by submitting a correct answer to the equation, new Bitcoins come as a reward. Satoshi Nakamoto set up two major rules for the proof of work protocol:
Bitcoin’s maximum supply is finite. It is limited to 21 million and cannot be changed.
The number of Bitcoins generated per block and distributed as a mining reward halves (decreases by 50%) every 210,000 blocks.
How long until Bitcoin rewards halve?
As one block is found every 10 minutes on average, 210,000 blocks would be found in approximately four years. The mining reward for solving the block puzzle will halve by 50% every four years. Bitcoin’s first mined block rewarded the miner 50 Bitcoin. Two halvings after, and we are in the present, where each block grants 12.5 Bitcoin. Next, halving will reduce that amount to 6.25 Bitcoin and so forth until there are no more Bitcoin to be mined. When there are no more Bitcoin to be mined, miners will be compensated through mining fees.
Why is halving created?
The explanation of the creation of halving events lies in the law of supply and demand. If coins are mined too fast, the supply will rise too fast, and there will be a lot more Bitcoin in circulation. This will, in turn, devalue the currency.
Vitalik Buterin, the lead developer of the Ethereum project, explained the need for halving to occur is to keep inflation under control. Additionally, he explained that “One of the major faults of traditional fiat currencies controlled by central banks is that the banks can print as much of the currency as they want, and if they print too much, the laws of supply and demand ensure that the value of the currency starts dropping quickly.”
When Will the Next Halving Occur?
As previously mentioned, each block takes 10 minutes to generate on average. Taking that into consideration, we can estimate the next block halving event to occur somewhere around June 2020. Many websites track block generation and estimate when the reward halving will happen exactly. They even have countdowns that let people know the date and time of the estimation.
One important thing to mention is that some people noticed that each block takes only 9 minutes and 20 seconds on average to generate, instead of the presumed 10.
How Will the Bitcoin Halving Affect Bitcoin’s Price?
As block halving essentially reduces the further supply of Bitcoin, many people will ask whether the price will be affected by this event. Sadly (or fortunately), no one knows. The 2016’s halving event had no major effects on the price at that time. A week after the event, Bitcoin went from $650 to $675.
However, even if there are no apparent signs of price change, economic principles of supply and demand still work. Either the price will increase after the halving, or the current price already includes the speculation of what’s about to happen. Conclusion
Bitcoin is a scarce asset by design. The specific rules, such as a limited supply of 21 million Bitcoin as well as an inflation reduction “tool,” which is the halving event, make sure that Bitcoin becomes even more valuable over time. The Bitcoin halving event should not be considered as a date at which the price of Bitcoin skyrockets, but rather a tool which keeps inflation in check. This is one of the main attributes of Bitcoin and one that separates it from fiat currencies, which are inflationary by nature.
On Thursday, the dollar’s determined and blending strength will last well into next year, and even if an incomplete U.S.-China trade agreement is signed, it will at most hit the
On Thursday, the dollar’s determined and blending strength will last well into next year, and even if an incomplete U.S.-China trade agreement is signed, it will at most hit the
On Thursday, the dollar’s determined and blending strength will last well into next year, and even if an incomplete U.S.-China trade agreement is signed, it will at most hit the currency by 1-2% in the instant aftermath.
Today, the focus of traders stays on the series of services PMI figures from the Eurozone.
Economic Events to Watch Today
Let’s took at these fundamentals.
EUR/USD – Daily Analysis
The EUR/USD currency pair flashing red and dropped for 3-consecutive days, this bearish trend considered as the biggest losing streak since early September. As of writing, the EUR/USD currency pair closed at 0.10% bearish during the Wednesday, as well as the pair was dropped by 0.33% and 0.48% during the Monday and Tuesday. The 3-day declining streak is the highest early September.
At the time of writing, the EUR/USD currency pair is currently trading at 1.1059, showing a 0.06% decline on the day. On the technical side, the technical outlook found on the bearish track with Wednesday close below 1.1073, which confirmed a double top bearish breakdown on the daily chart.
The possibility of Industrial production missing forecasts is high. That would support the bearish technical trend, probably increase the losses in the EUR. It should be noted that the upbeat expectation will likely a good sign of EUR currency. However, the strong close above 1.1073 is much needed to cancel the bearish trend.
Daily Support and Resistance
S3 1.1018
S2 1.1047
S1 1.1056
Pivot Point 1.1075
R1 1.1084
R2 1.1103
R3 1.1131
EUR/USD– Trading Tips
The EUR/USD is trading with a bearish bias since it violated the bullish trendline support around 1.1125 area. On the 4 hour timeframe, the pair has formed strong bearish channels, which are signaling chances of further selling in the market.
At the moment, the EUR/USD is focusing on a crucial trading level of 1.1060 level, which is likely to determine the further direction of the pair. Below this level, the EUR/USD may gain support at 1.1040 and 1.1010 level today.
GBP/USD– Daily Analysis
The GBP/USD pair hit the bearish track and hit the weekly low as the cautious sentiment of the GBP traders due to Super Thursday. As of writing, the GBP/USD currency pair currently trading at 1.2837, as well as the greenback is increasing across the board and uncertainty regarding the trade deal between Sino-US also leaving an impact on the EUR/USD currency pair.
At the Sino-US trade front, the condition surrounding the round-1 trade deal between the United States and China seems doubtful recently. Although, thee U.S. Dollar supported from the move as new thinkings of the Federal Reserves pause in the rate cut cycle.
On the other hand, the investors will strictly be observed to the speech of UK Chancellor Sajid Javid and second-tier data from the U.S., coupled with comments by the President and CEO of the Federal Reserve Bank of Dallas Robert Kaplan which is scheduled to deliver later.
Today, the whole focus stays on the Bank of England monetary policy report, where the BOE is widely supposed to keep the interest rate on the clutch at 0.75% today.
Daily Support and Resistance
S3 1.2758
S2 1.2812
S1 1.2832
Pivot Point 1.2865
R1 1.2886
R2 1.2918
R3 1.2971
GBP/USD– Trading Tips
The GBP/USD hasn’t improved enough as it extends to trade sideways ahead of the Bank of England policy decision. The MACD and RSI have crossed below 0 and 50, respectively, suggesting the chances of a bearish trend in the GBP/USD. But the thing is, investors are staying out of the market ahead of BOE rate. On the downside, the GBP/USD may see next support around 1.2786, and the violation of this level can extend sell-off until 1.2690.
USD/JPY – Daily Analysis
The USD/JPY currency pair are representing losses by 24-pips and currently trading at 108.74. As of writing, the USD/JPY currency pair is on the bearish attitude due to the moderate declines in the U.S. index futures. Notably, the futures on the S&P 500 and Nasdaq are reporting 0.12% and 0.17% losses; respectively, the uncertainty increased again between the United States and China trade deal.
While the United States ten-year treasury yields stop previous drops around 1.815% whereas the NIKKEI opens a tad lower after weak signals.
Whereas, the pairs traders cautious after the Tankan number & trade news. Tankan manufacturing poll, which tracks the steps of Bank of Japan’s (BOJ) essential Tankan quarterly survey, recently fell to the lowest since March 2013 during October.
At the Sino-US trade front, the condition surrounding the round-1 trade deal between the United States and China seems doubtful recently.
Looking ahead, the traders will keep their focus on the United States, and China round-1 phase, and Brexit details for getting fresh hints and clues as well as the trader will carefully observe the 2nd-tier data on the economic calendar. The greenback hit a bullish trend in the wake of the ISM beat.
Daily Support and Resistance
S3 108.34
S2 108.66
S1 108.82
Pivot Point 108.98
R1 109.14
R2 109.3
R3 109.62
USD/JPY – Trading Tips
On the technical side, the USD/JPY currency pair had shown the wrong direction to the buyers of the market during the last 48 hours as you know the pair dropped in 48 hours against the buyer’s expectations. The pair closed above the 200-day M.A. on Tuesday to fall back below the long-term M.A. in the overnight trade. Consider staying bullish above
On Wednesday, the U.S. dollar index is mostly unchanged, trading at 97.936 in early Asian trade, following a surge of 0.37% the previous day. The headlines came that the United
On Wednesday, the U.S. dollar index is mostly unchanged, trading at 97.936 in early Asian trade, following a surge of 0.37% the previous day. The headlines came that the United
On Wednesday, the U.S. dollar index is mostly unchanged, trading at 97.936 in early Asian trade, following a surge of 0.37% the previous day. The headlines came that the United States and China are still on the doubtfull track and so far from reaching even a phase one deal, whereas increasing uncertainty in the trade is China’s intact support for Hong Kong’s hard stand against protestors.
Today, the focus of traders stays on the series of services PMI figures from the Eurozone.
Economic Events to Watch Today
Let’s took at these fundamentals.
EUR/USD – Daily Analysis
The EUR/USD currency pair found on the bearish track for the last two days. As of writing, the currency pair is currently trading at 1.1073; the neckline supports double top pattern on the daily chart.
The German data is scheduled to release at 06:00 GMT and expected to show factory orders, a vital impulse for Europe’s largest economy, which dropped for the 3rd consecutive month during September.
Moreover, IHS Markit’s Purchasing Managers’ Index (PMI) for Germany dropped to 41.7 during September to register the weakest figures since 2009 and 8-straight monthly drop in output. The PMI was at 43.5 in August. A number below 50 indicates contraction.
As we all well aware, the EUR/USD currency pair is already trading on the slippery ground and having charted a bearish trend over the last two days. Therefore, the unexpected weaker factory orders data could allow a possible break below 1.1073.
On the positive note, the EUR currency will likely take buying if the critical data will release better than expected. However, the technical outlook would become bullish above 1.1180.
Daily Support and Resistance
S3 1.0939
S2 1.1016
S1 1.1045
Pivot Point 1.1093
R1 1.1122
R2 1.1169
R3 1.1246
EUR/USD– Trading Tips
The direct currency pair EUR/USD exhibited a dramatic selling from 1.1120 to 1.1065 area. Today this level is likely to extend support to the EUR/USD pair. New candles are Doji, which are followed by a strong bearish candle. This suggests that sellers are exhausted, and we may see buying behavior in the market. Consider taking buying positions above 1.1065 today.
GBP/USD– Daily Analysis
The GBP/USD currency pair hit the bearish track despite increasing hopes for the Tory leader to win the snap election. Notably, probably the reason behind the bearish trend of cable pair is uncertainty surrounding the United States, and China trade deal keeps the U.S. Dollar strength intact. As of writing, the GBP/USD currency pair currently trading at 1.2880 on the day.
The headlines came that the United States and China are still on the doubtfull track and so far from reaching even a phase one deal, whereas increasing uncertainty in the trade is China’s intact support for Hong Kong’s hard stand against protestors.
As of data, the preliminary figures of the United States Nonfarm Productivity and Unit Labour Coast for the 3rd quarter will be under the focus after the JOLTS Job Openings Challenged the U.S. employment optimism on Tuesday.
Daily Support and Resistance
S3 1.277
S2 1.2828
S1 1.2856
Pivot Point 1.2887
R1 1.2915
R2 1.2946
R3 1.3004
GBP/USD– Trading Tips
The GBP/USD hasn’t changed much so far as it continues to trade bullish due to the weaker U.S. dollar. The Cable has outraged the previous resistance level of 1.2930. Now the pair is likely to face fresh resistance around 1.3050 area. Consider staying bullish above 1.2941 today.
USD/JPY – Daily Analysis
The USD/JPY Currency Pair currently trading at 109.04; the pairs hit the low of 109.00 despite the weak macro data. During the Tokyo session, the USD/JPY currency pair was trading near the 109.13 even after the BOJ minutes keeping easy money policy on the cards.
The final Jibun Bank Japan Services Purchasing Managers’ Index (PMI) is seen at 49.7 in October from 52.8 in September on a seasonally-adjusted basis. The below-50 figures are the first since September 2016.
Despite the weak data approved by the Bank of Japan easing policy, the pair found at 109.20 and has slipped back to near 109.00, mainly due to the drop in the S&P 500 futures. As of writing, the index futures are representing the 0.15% decline.
Moreover, the USD/JPY currency pair may continue taking hints from the movement in the equities and Treasury yields. As of now, the ten-year yield is trading at 1.84%, representing two-basis-points declines from the session high of 1.86%.
Looking forward, traders will keep their eyes on Japan’s Jibun Bank Services Purchasing Managers Index (PMI) data for October. In contrast, few other Federal Reserve policymakers will carefully observe for additional direction during the latter part of the day. Market estimates suggest a soft PMI figure of 50.3 against 52.8 prior.
Daily Support and Resistance
S3 108.05
S2 108.55
S1 108.85
Pivot Point 109.05
R1 109.35
R2 109.55
R3 110.05
USD/JPY – Trading Tips
The USD/JPY traded bullish, placing a high around 109.200 level. As per the recent technical analysis of the pair, the USD/JPY is facing resistance around 109.20. Below this level, we can expect a continuation of the selling trend until 108.900 and 108.650.
Besides, the MACD and Stochastics are holding in the overbought range, suggesting chances of a bearish trend in the USD/JPY. Consider taking sell positions below 109 today as the immediate target stays at 108.650.
The Dollar Index slipped 0.2% on the day to 97.12 on Friday, down for a fifth straight session. The euro edged up 0.1% to $1.1167 while the British pound was
The Dollar Index slipped 0.2% on the day to 97.12 on Friday, down for a fifth straight session. The euro edged up 0.1% to $1.1167 while the British pound was
The Dollar Index slipped 0.2% on the day to 97.12 on Friday, down for a fifth straight session. The euro edged up 0.1% to $1.1167 while the British pound was little changed at $1.2935. The Markit U.K. Manufacturing PMI bounced to 49.6 in October (48.2 expected) from 48.3 in September.
USD/JPY rebounded 0.2% from a three-week low to 108.19. USD/CAD fell 0.2% to 1.3136. The Markit Canada Manufacturing PMI climbed to 51.2 in October from 51.0 in September.
Economic Events to Watch Today
Let’s took at these fundamentals.
GBP/USD– Daily Analysis
The GBP/USD currency pair flashing green and found on the recovery track mainly due to increasing optimism regarding the post-December election. As of writing, the cable pair currently trading at 1.2940.
At the time of writing, the GBP/USD pair was traded at 1.2937, up 0.03%, because traders await new ECB head Christine Lagarde’s first official speech, which is scheduled to happen later in the day.
Be it YouGov, Ipsos or Deltapoll suggest a clear lead of the Boris Johnson over the main opposition Labour Party regarding the general election on December 12. However, the United Kingdom Prime Minster Boris Johnson still looks doubtful due to Times mentions that the PM Boris Johnson will remove all fear regarding the no-Brexit deal from the Conservative party manifesto.
Moreover, the announcement came from the U.S. Commerce Secretary Wilbur Ross during the Sunday that the licenses for the American firm to perform business with the blacklisted Chinese Huawei companies will be given very soon. Apart from this, he said that the United States and China already very delayed with phase one of the trade deal, so the agreement will likely be signed very soon.
As we know, there was a little movement in the risk-on market, possibly due to President Donald Trump did not attend the Association of Southeast Asian Nations (ASEAN) summit in Thailand.
Moreover, the market sentiment has been unstable since the start due to the lack of primary data, and the event and Japan market closed as well.
Looking forward, all investors will keep their eyes on the trade and Brexit headlines whereas also keeping the focus on Markit Construction Purchasing Managers Index from the United Kingdom and the United States Facote Orders for September.
Market consensus supports an upbeat print of 44.00 against 43.3 from the British PMI, whereas also expecting the U.S. statistics to decrease further to -0.3% from -0.1% previous.
Daily Support and Resistance
S3 1.2855
S2 1.2901
S1 1.292
Pivot Point 1.2946
R1 1.2966
R2 1.2992
R3 1.3037
GBP/USD– Trading Tips
The GBP/USD hasn’t changed much so far as it continues to trade bullish due to the weaker U.S. dollar. The Cable has outraged the previous resistance level of 1.2930. Now the pair is likely to face fresh resistance around 1.3050 area. Consider staying bullish above 1.2941 today.
USD/JPY – Daily Analysis
The USD/JPY currency pair consolidates in the narrow range near the 108.22, and the pair failed to reach on the bullish track of 100-day EMA as the global risk headlines were entirely in the market for the weekend.
However, the USD/JPY currency pair recently got support from the United States, and China trades positive news because the United States President Donald Trump recently hinted that the round-one of a trade deal would be signed in this month near the U.S.
Moreover, the announcement came from the U.S. Commerce Secretary Wilbur Ross during the Sunday that the licenses for the American firm to perform business with the blacklisted Chinese Huawei companies will be given very soon. Apart from this, he said that the United States and China already very delayed with phase one of the trade deal, so the agreement will likely be signed very soon.
While the United States’ ten-year treasury yield recently declined to multi-weeks lows mainly due to the United States Federal Reserve Bank, Indonesia and Central Bank of Brazil recently announced the 3rd consecutive rate cut in their benchmark rates.
Such as the markets of japan close today due to culture holiday so that investors will keep their focus on the risk catalysts like the United States and China trade-headlines and political plays regarding the Brexit for fresh impulse.
Notably, the risk tone in the market could keep recent recovery mainly due to the positive sentiment regarding trade deal between the United States and China and also due to receding political uncertainty regarding Brexit. However, any negative activity or headlines could be taken very seriously regarding the market’s uncertainty.
Daily Support and Resistance
S3 107.33
S2 107.74
S1 107.96
Pivot Point 108.14
R1 108.37
R2 108.55
R3 108.96
USD/JPY – Trading Tips
The USD/JPY continues to trade bearish with the selling bias due to weakness in the U.S. dollar. The USD/JPY pair broke the bullish channel, which was holding the USD/JPY at 108.800 zones.
Three Black Crows candlestick patterns are suggesting chances of additional selling in the USD/JPY until 107.450 today. On the upper side, resistance is likely to stay at 108.350. Consider taking bearish trades under 108.350 today.
EUR/USD – Daily Analysis
The EUR/USD currency pair flashing green and presently trading at 1.1170, in the wake of the United States and China trade patch-up certainty. Moreover, the EUR/USD pair could take more buying trends, mainly due to confidence surrounding the United States and China.
Whereas, the Shared currency hit the low of 1.1128 during the United States trading session on Friday due to U.S. Nonfarm Payrolls beats forecasted numbers. No Doubt, the decline was short-lived, and the EUR/USD currency pair closed on the bullish track near 1.1165.
So, the EUR/USD currency pair least resistance level is on the bullish range. Whereas, the pair’s bullish sentiment could be increased due to the United States and China trade optimism and the resulting risk-on in the equities.
An announcement came from the U.S. Commerce Secretary Wilbur Ross during the Sunday that the licenses for the American firm to perform business with the blacklisted Chinese Huawei companies will be given very soon. Apart from this, he said that the United States and China already very delayed with phase one of the trade deal, so the agreement will likely be signed very soon.
It should be noted that the Eurozone’s manufacturing powerhouse has got a big hit in the wake of the Sino-US trade war. Therefore, trade certainty between the United States and China could support the German economy and the EUR currency.
As of data, the final Manfutring PMI figures are scheduled to release across the EurozoneEurozone. Moreover, the Eurozone’s Sentix Investor Confidence for November is expected to release at 09:30 GMT, may leave any impact on the currency pair. Across the pond, the ISM-NY Business Conditions Index (Oct) and Factory Orders (Sep) data are scheduled for release.
Daily Support and Resistance
S3 1.1067
S2 1.1111
S1 1.1138
Pivot Point 1.1155
R1 1.1182
R2 1.1199
R3 1.1243
EUR/USD– Trading Tips
The EUR/USD has struck below the double top resistance point of 1.1175 and has lately closed series of neutral candles, which are suggesting chances of a bearish bias until the 1.1175 level gets violated. The pair still stays in the buying zone as the MACD, and RSI value is holding above 0 and 50, respectively. Consider staying bullish above 1.1153 to 1.1180 and 1.1220 today.
https://youtu.be/jjOGFmqCyno
Buying Rumour & Selling Fact – Forex Fundamental Secrets
When it comes to trading the markets, there are three main tools that traders use to in order to
https://youtu.be/jjOGFmqCyno
Buying Rumour & Selling Fact – Forex Fundamental Secrets
When it comes to trading the markets, there are three main tools that traders use to in order to
Buying Rumour & Selling Fact – Forex Fundamental Secrets
When it comes to trading the markets, there are three main tools that traders use to in order to try and gauge direction within the financial markets: fundamental and technical analysis, and trading based on sentiment. Within the scope of fundamental analysis lies a critical area based on market rumors, which are rife in all the various sectors that make up the financial markets.
Buy the rumor, sell the fact is something you may have heard of, but in any case, rumors tend to abound in all of the financial markets and these often present opportunities to buy and sell or hold assets. The saying, buy the rumor and selling news first entered the financial markets when traders picked up on chatter or news reports in the equity market that a company was doing better than expected and that this would be reflected during the earnings announcement season. This could lead to a better share price for the company and also better dividends. And therefore, this would lead traders to believe that the stock was undervalued and result in speculative buying of the stock, hence pushing up its share price. Speculative buying also results when rumors are going around that a company was about to merge or be taken over.
Another area in the equities market that is affected by rumors or hearsay is mergers and acquisitions. Sometimes CEO’s of companies will not make this type of information readily available to the marketplace during the negotiation stage, However, a secret meeting between the two heads of firm’s could be exposed by the media, and whereby investors speculate that a merger or takeover is imminent and this could cause a flurry of buying or selling of stocks in the two companies. But this could also cause selling in other companies – in the same sector – which might suffer because of a perceived diminished market share, in the event of such a merger or takeover.
On the flip side, rumors might surface that the company is not performing well, and this might lead to a sell-off. Therefore our adage of buy the rumor sell the fact can also mean the opposite, depending on the magnitude of the rumor, and especially if it subsequently turns out to be false, and which can cause extreme market volatility.
Buy the rumor and sell the fact works differently in the Forex space because obviously, we do not have mergers or acquisitions. However, analysts will speculate that governments are intending on raising or lowering interest rates. Traders might then take the analysts’ comments on board and start trading a particular currency pair in favor of the analysts’ report, which is just another way of saying rumor.
In recent years and especially with the advent of Twitter, the Forex market has become much more susceptible to buy the rumor sell the fact. This is partly due to the fact that news reporters are often well placed with governments’ lawmakers to obtain unofficial – as yet unreleased – information that could affect the economy of a particular country, and thus the value of its exchange rate.
Another area that has had a dramatic effect within the Forex market is the style of the presidency pertaining to the United States of America. President Donald Trump has his own unique style of governing. He regularly tweets on such things as his preference for low-interest rates in the United States. This type of comment often flies in the face of the Federal Reserve, and it is not uncommon for him to tweet on factors pertaining to the economy, such as imminent economic data releases, even occasionally tweeting in a somewhat biased manner about highly sensitive and anticipated non-farm employment results, which are of course subject to an embargo.
One of the biggest problems that retail traders face, within the Forest market, is that price action, while driven by rumor, is reliant on market perception of the reality of the anticipated news release. At this point, the markets might think that the current exchange rate warrants such levels, or perhaps that there has been an overall exaggeration at which point a sharp reversal in price action might occur. Another danger is that traders who have ignored price action based on rumor, then enter the market expecting a continuation in trend, only to be thwarted by a reversal due to traders who got in during the early stages of the rumor then deciding to take their profits and causing a potential reversal or consolidation.
As well as rumors in the financial markets, another all too common a feature nowadays is fake news. It is not unheard of for fake Twitter accounts to be opened purporting to relevant players, such as respected analysts and reporters, and whereby fake news is released into the market which can greatly affect price action having been inadvertently being picked up in good faith by major news channels and filtering its way into to the market. While this type of fake news is generally quickly shot down in flames, that is not to say that it has not already caused extreme volatility in the process.
That is why here at Forex.Academy, we recommend that traders be mindful of rumor and speculation in the Forex market and trade with the necessary caution at such times. Always be prepared and expect the unexpected!
The U.S. dollar weakened further Thursday, amid uncertainties over a long-term U.S.-China trade deal and impeachment inquiry into President Trump. The ICE Dollar Index slid 0.2% on the day to
The U.S. dollar weakened further Thursday, amid uncertainties over a long-term U.S.-China trade deal and impeachment inquiry into President Trump. The ICE Dollar Index slid 0.2% on the day to
The U.S. dollar weakened further Thursday, amid uncertainties over a long-term U.S.-China trade deal and impeachment inquiry into President Trump. The ICE Dollar Index slid 0.2% on the day to 97.30, posting a four-day decline.
The euro edged up 0.1% to $1.1157. Official data showed that the eurozone third-quarter GDP grew 1.1% on the year, and CPI rose 0.7% on year in October, both were in-line with estimates.
The British pound advanced 0.3% to $1.2938. Later today, the Markit U.K. Manufacturing PMI for October will be released (48.2 expected).
Economic Events to Watch Today
Let’s took at these fundamentals.
GBP/USD– Daily Analysis
The GBP/USD currency pair flashing green and consolidates near the recent gains to 1.2930 by the press time. Notably, the GBP/USD currency pair currently awaits the early-month data from the United States and the United Kingdom to extend the recent bullish moves beyond 8th-day tops.
As we all well aware that these days confirmed to be most damaging for the U.S. Dollar against the bucket of currencies, therefore the traders of U.S. Dollar await for fresh clues.
The main reasons behind the greenback weakness are a rate cut, which is delivered by the Federal Reserve for the 3rd time back to back during this year, and apart from this, the rising uncertainty between the United States and China trade matter and china joined mixed data from the United States.
At the GBP front, the British got support from the increasing possibilities of the United Kingdoms present Prime Minster Boris Johnson to continue to his post after the snap elections during the December. Also, there were strong expectations regarding the pair’s bullish trend as the United Kingdom Prime MInster Boris Johson has strong relations with the United States and can be trusted for good trade relations in the future.
At the data front, all eyes will be on October month Market Manufacturing Purchasing Manager Index (PMI) from the U.K. and employment stats, ISM Manufacturing PM. We look for the manufacturing PMI to increase from 48.3 to 48.9 during October, supported by inventory building ahead of the (at the time of the survey) Brexit deadline of October 31.
Regarding the U.S. Nonfarm Payrolls (NFP), “U.S. Oct non-farm payrolls are anticipated to increase by 85,000 with the General Motors strike and decrease in census workers both a drag on headline employment increases. The jobless rate is seen to edge back up to 3.6% from a 50 year low 3.5%, and average hourly earnings growth is anticipated to stabilize at 3.0%yr after Sep’s sudden fall to 2.9%yr from 3.2%yr during August.
Daily Support and Resistance
S3 1.2821
S2 1.2881
S1 1.2906
Pivot Point 1.2941
R1 1.2966
R2 1.3001
R3 1.3062
GBP/USD– Trading Tips
The GBP/USD hasn’t changed much so far as it continues to trade bullish due to the weaker U.S. dollar. The Cable has outraged the previous resistance level of 1.2930. Now the pair is likely to face fresh resistance around 1.3050 area. Consider staying bullish above 1.2941 today.
USD/JPY – Daily Analysis
The USD/JPY currency pair flashing red and dropped from the high of 108.90 and just below the 200-day Moving Average, mainly due to report regarding trader war. Thus, investors were cautious and uncomfortable in the wake of news in which China said that we still open to continue trade talks after the first phase.
Notably, the benchmarks on Wall Street were stepped back from its highs due to the report that stated that Chinese legislators are spreading uncertainties regarding the matter of making a comprehensive long-term trade deal with the United States, even as both sides are close to reached on the trade deal.
Overall, the United States’ two-year treasury yields subsequently dropped from 1.62% to 1.52%, whereas the ten-year yield fell from 1.78% to 1.68%. After yesterday’s Federal Reserve interest rate cut and statement, markets were pricing in a Federal Reserve rate of 1.50% at the December conference and a terminal rate of 1.15% against 1.63% currently.
Daily Support and Resistance
S3 106.63
S2 107.43
S1 107.73
Pivot Point 108.23
R1 108.52
R2 109.02
R3 109.82
USD/JPY – Trading Tips
The USD/JPY continues to trade bearish with the selling bias due to weakness in the U.S. dollar. The USD/JPY pair broke the bullish channel, which was holding the USD/JPY at 108.800 zones.
Three Black Crows candlestick patterns are suggesting chances of additional selling in the USD/JPY until 107.450 today. On the upper side, resistance is likely to stay at 108.350. Consider taking bearish trades under 108.350 today.
EUR/USD – Daily Analysis
EUR/USD pair overall sentiment is bullish. But as for now, the EUR/USD currency pair consolidates in the narrow range near the 1.1170 after the post-EMU data releases in the Euroland.
As of writing, the EUR/USD currency pair bullish trend is still strong and well sound, mainly after the advanced inflation figures in the Euroland. Also, headline consumer prices are anticipated to increase at an annualized 0.7% from 0.8% while Core prices are also rose somewhat to 1.1% from 1.0.
Moreover, the flash GDP numbers observe the economy in the bloc expanding 1.1% every year from 1.2% during the July and September month
Whereas, the consecutive weakness in the U.S. dollar still support the EUR/USD currency pair while resumed trade concerns raised recently due to the Chinese officials remain doubtful on the long term trade deal with the United States.
On the technical side, the EUR/USD currency pair is rose by 0.19% at 1.1171 and faced the high resistance barrier at 1.1179 (monthly high Oct.21) seconded by 1.1186 (61.8% Fibo of the 2017-2018 rally) and finally 1.1197 (200-day SMA). At the bearish front, the breakdown of 1.1072 (low Oct.25) would target 1.1042 (55-day SMA) en route to 1.0925 (low Sep.3).
Such as, the EUR currency has succeeded in recovering the bullish monthly range, mainly due to the continued selling pressure in the Greenback.
On the other hand, the chances that the German economy may move into recession in Q3 remains an obvious risk for the outlook and is expected to send EUR currency down for the short and medium-term range.
Daily Support and Resistance
S3 1.1064
S2 1.1109
S1 1.113
Pivot Point 1.1153
R1 1.1175
R2 1.1197
R3 1.1242
EUR/USD– Trading Tips
The EUR/USD has struck below the double top resistance point of 1.1175 and has lately closed series of neutral candles, which are suggesting chances of a bearish bias until the 1.1175 level gets violated. The pair still stays in the buying zone as the MACD, and RSI value is holding above 0 and 50, respectively. Consider staying bullish above 1.1153 to 1.1180 and 1.1220 today.
https://youtu.be/Bq-hXid26j4
Fundamental Analysis part 2 – How to Read the Markets
Risk-on & Risk-off
This section follows on from The Biggest Fundamental Events Analysis & Case Study. Shakespeare said
https://youtu.be/Bq-hXid26j4
Fundamental Analysis part 2 – How to Read the Markets
Risk-on & Risk-off
This section follows on from The Biggest Fundamental Events Analysis & Case Study. Shakespeare said
Fundamental Analysis part 2 – How to Read the Markets
Risk-on & Risk-off
This section follows on from The Biggest Fundamental Events Analysis & Case Study. Shakespeare said that All the world is a stage. When it comes to the financial markets, everything is interwoven, from forex, commodities, including gold and oil, equities, treasury bills, corporate and government bonds, futures contracts, and, more recently bitcoin. In other words, in order to be able to read the Forex market, you must understand that all of the individual sectors play a role in your trading.
Trading can then be broken down into two categories: traders and investors. Subcategories include retail traders, who are typically day traders, where they open and close positions during the day with no overnight positions. But, there are also swing traders, who may hold a position from days to a couple of weeks, and then there are position traders (investors) who have a more long term view and may have open trades which run on for months, if not years. The latter will typically be large hedge funds, financial institutions, sovereign wealth funds, and governments.
Therefore, position traders and investors tend to have a long-term approach and usually the financial clout to be able to weather the ups and downs and storms which prevail in the financial markets. A typical institutional investor might involve a trader who takes long term positions in the equity markets while managing retirement funds.
Here in the retail Forex market, traders typically range from scalpers, who prefer to be in and out of a trade within minutes, if not hours, and also day traders and swing traders.
All of this is fine, but what does it mean for a retail Forex trader? Well, it means that in order to be able to read the Forex market, it is highly advisable to know what is going on in other trading environments within the financial markets.
One way is to try and gauge the current sentiment, and there is an old adage in the trading community, which you will hear a lot of risk on and risk-off. This is dependent on the perceived risk of an asset – or a group of assets – by traders and investors.
So, when risk is seen as low, or risk-off, investors and traders seek higher-risk investments, such as stocks AKA equity investments, which will typically provide better returns.
And when the risk is seen as high or risk-on, traders and investors seek more lower-risk assets to invest in, such as selling assets, for example, equity portfolios, and moving into cash on deposit, or by buying treasury bonds AKA T-bills. This essentially means that retail forex traders need to up their game in order to be aware of how all these types of traders can very quickly liquidate positions in one market and jump into another.
Here are a couple more examples of risk-on: if the equity market is falling sharply and perhaps bond yields are low, traders tend to start buying gold and precious metals, which usually have less fluctuations, and are seen as a less long term risky asset. This has especially been true over the last couple of years, where prices have been overall moving higher.
Another example would be with regard to all of the uncertainty surrounding Brexit during the last couple of years. And especially at the time of writing, where the pound has been extremely volatile – with huge swings and an overall gain of some 800 pips gain in Cable – as we can see in example A – which took place in the last few days alone. Therefore, some traders will have avoided trading the British pound and instead opted to buy the Yen or Swiss Franc via related currency pairs, and which tend to be seen as safe-haven investment assets in times of turbulence in the Forex market.
And a great example of risk-off would be when Donald Trump became President of the United States and where his policies regarding business were perceived by the US equity market as being conducive to growth in the US economy and where the equities market there and specifically the Dow Jones Industrial Average went on to one of the biggest rallies ever seen in a global stock market.
Here are a couple of examples where one asset class is heavily influenced by another asset class. For example, the Canadian dollar – which is also known as the Loonie – is heavily influenced by the price of oil. This is because Canada derives a large portion of its gross domestic policy from its production and subsequent sale of oil. And so with all of the current uncertainty in the global economy and signs of a slow down, the price of oil has declined over recent months, and the knock-on effect has resulted in the sluggish exchange rate of the Canadian dollar.
Another area is the continual spat between the United States and China regarding their trade deal negotiations, which have been running on and on. This has caused a slowdown in the commodities sector, and the knock-on effect here has caused problems for Australia who’s gross GDP is largely made up of their commodities exportation.
Another country which is suffering because of this ongoing trade war dispute is New Zealand, whose GDP is mostly derived from selling dairy products, meat, wood, and machinery into China.
Therefore, Forex traders have a responsibility to at least be mindful of what is going on in other markets, due to the fact that this risk-on and risk-off which goes on in the financial markets can cause sudden and extreme volatility in the Forex market, due to traders coming out of one asset and jumping into another.
The U.S. Dollar Index gained 0.2% on the day to 97.68 on Thursday amid mixed U.S. economic data. The euro slid 0.3% to $1.1104. The European Central Bank held its
The U.S. Dollar Index gained 0.2% on the day to 97.68 on Thursday amid mixed U.S. economic data. The euro slid 0.3% to $1.1104. The European Central Bank held its
The U.S. Dollar Index gained 0.2% on the day to 97.68 on Thursday amid mixed U.S. economic data. The euro slid 0.3% to $1.1104. The European Central Bank held its benchmark rates unchanged as expected. ECB President Mario Draghi said risks to the outlook are “on the downside” compared with “tilted to the downside” previously.
On the other hand, the Markit eurozone manufacturing purchasing managers’ index was flat on the month at 45.7 in October (46.0 expected) while the Services PMI rose to 51.8 (51.9 expected) from 51.6.
The pound dropped 0.6% to $1.2838. U.K. Prime Minister Boris Johnson said he would call for an early general election for December 12. Meanwhile, the European Union is expected to decide the length of Brexit delay later today.
Economic Events to Watch Today
Let’s took at these fundamentals.
GBP/USD– Daily Analysis
The GBP/USD currency pair consolidating in the narrow range below the 200-hour Moving Average at 0.2852, due to the uncertainty intensified regarding the Brexit deal and the United Kingdom eclection. Notably, the pair may remain under pressure mainly due to increased risk.
British Prime Minister Boris Johnson admitted for the first time that he would not fulfill his (do or die) promise to get a departure between the U.K. and E.U. before October 31 and asked for a fresh election on December 12 to break Britain’s Brexit obstacle.
Although the opposition has rejected the election offer and LAbour leader Jermy Corbyn said that he would wait to observe what will the European Union decides regarding the Brexit delay before deciding that how to put the vote on Monday.
Moreover, the European Union is thinking of granting a 3-months delay. However, the decision may not come on Friday. The Brexit is moving in the uncertainty track, and Prime Minister Boris Johnson looks stuck in the middle. Therefore, traders are cautious about buying GBP.
On the technical side, the Technical charts are also indicating a move lower. It should be noted that Thursday’s bearish candlestick has opened the opportunities for a broader reversal, perhaps to the 200-day average at 1.2710.
Daily Support and Resistance
S3 1.2539
S2 1.2701
S1 1.2774
Pivot Point 1.2862
R1 1.2936
R2 1.3024
R3 1.3186
GBP/USD– Trading Tips
After violating the bullish channel, the GBP/USD pair is trading bearish at 1.2835 area. Overall, the Cable is maintaining a sideways range of 1.2950 – 1.2785. The bearish engulfing candle on the 4-hour timeframe is likely to lead the GBP/USD prices towards 1.2785 area today.
The MACD and RSI indicators are holding in the selling zone, supporting the bearish trend in the GBP/USD. Consider staying bearish below 1.2845 today.
XAU/USD – Daily Analysis
The safe-haven prices rose somewhat due to traders are awaited the next weeks, the United States Federal Reserve policy conference.
The U.S. Federal Reserve’s policymakers will attend next week. Its Oct. 29-30 policy settlement is required to yield in a 3rd-straight quarter-point rate cut.
President Trump tweeted that, “The Federal Reserve is negligent in its duties if it doesn’t deliver the rate cut and even, ideally, stimulate.
Gold prices remain supported in the wake of Japan’s manufacturing activity, which declined at the fastest rate in 3-years. Meanwhile, The U.S. PMI opposed expectations for a drop and rose marginally, but with limited impact on the prices of the safe-haven gold.
Daily Support and Resistance
S3 1466.32
S2 1482.53
S1 1493.22
Pivot Point 1498.74
R1 1509.43
R2 1514.95
R3 1531.16
XAU/USD – Trading Tips
Gold’s bullish trend continues to dominate the market. Closing of 4-hour candles above 1,495 and 1,503 area is indicating chances of further buying in the gold. The precious metal has formed three white soldiers pattern, which typically drives the bullish trend in the market.
On the upper side, the next resistance is likely to be 1,511. Therefore, we should look for buying positions above 1,500 area to target 1508 today.
USD/JPY – Daily Analysis
The USD/JPY currency pair is sidelined below the 200-day moving average and consolidating in the narrow range of 108.50 and 108.7 overnight, even after the United Sateta data a geopolitical uncertainty.
As of writing, the USD/JPY currency pair is currently trading at 108.60, having ranged between the level of 108.56and 108.64.
At the Hong Kong front, the condition is dull in Asia right now, but the markets keep their eyes on how the Chinese can react to comments regarding the Honk Kong and China, where he criticized the Chinese over security and human rights.
At the U.S. data front, the United States September Durable Goods Orders were depressed, and the volatile headline dropped -1.1%m/m against an estimate of -0.7%m/m. Though, September New Home Sales found on the positive side, with an increase of 701,000 against 702,000, against the previous revised to 706k from 713k, though average annual prices continued to ease. Markit PMIs also held steady in October, whereby Manufacturing PMI rose to 51.5 and bat the estimates of 50.9 and prior 51.1. Services came in line with expectations with an increase in the composite level to 51.2 from 51.0.
Moreover, the United States’ two-year Treasury yields waited in normal ranges between 1.55% and 1.58%, and the ten-year return moved between 1.74% and 1.77%. Markets are expecting 22-basis points of a rate cut at the October 30 meeting and a terminal rate of 1.21% against 1.88% currently. President Trump tweeted that, “The Federal Reserve is negligent in its duties if it doesn’t deliver the rate cut and even, ideally, stimulate.
At the Brexit front, the British Prime Minister Boris Johnson admitted for the first time that he would not fulfill his (do or die) promise to get departure between the U.K. and E.U. before October 31, and asked for fresh elections on December 12 to break Britain’s Brexit obstacle.
While the European Union was expected to give its answer to the United Kingdom governments request for a delay of European Union membership beyond October. However, due to the conflict between the United Kingdom parliament members, the European Union will decide to prefer to get some transparency first because it is continuously creating uncertainty in U.K. politics and Brexit.
Daily Support and Resistance
S3 108.11
S2 108.37
S1 108.5
Pivot Point 108.63
R1 108.76
R2 108.88
R3 109.14
USD/JPY – Trading Tips
On Friday, the safe have currency pair USD/JPY is facing support at 108.280. This level has become a triple bottom level and pushed the USD/JPY higher for the third time. At the moment, the USD/JPY trend is mixed as it holds right below an immediate resistance level of 108.650. Violation of this level can extend buying until the next resistance level of 108.900.
Today, let’s keep an eye on 108.650 to stay bearish or bullish above this level to capture quick trade in the USD/JPY.
In a previous presentation, we explained about the three styles of trading Forex: fundamental and technical analysis and trading with market sentiment. In this presentation, we are going
https://youtu.be/QJfL6aiZvqo
In a previous presentation, we explained about the three styles of trading Forex: fundamental and technical analysis and trading with market sentiment. In this presentation, we are going
In a previous presentation, we explained about the three styles of trading Forex: fundamental and technical analysis and trading with market sentiment. In this presentation, we are going to look at the significance of fundamental analysis in more depth.
Fundamental analysis is the way that traders try to analyse the economic, social, and political events in a country, in order to ascertain it’s exchange rate with another country’s currency. Therefore traders will be interested in the gross domestic product GDP and growth potential of a country, along with other factors such as its unemployment rate, debt, inflation, and monetary policy. In the case of the US dollar and the Euro, in particular, traders will also be trying to gauge the supply and demand of these currencies.
Of course, in the real world, all of these factors are extremely fluid and change constantly, and therefore, traders are continually battling to determine the value of one currency against another; in other words, the currency exchange rates.
Therefore when a country releases economic data, especially interest rate changes, GDP announcements, and in the case of the United States, unemployment changes in the form of Non-Farm Payrolls – which are normally released on the first Friday of each month – these data releases will be greatly anticipated and can dramatically change the value in a country’s currency and thus related exchange rates. Thus we often find dramatic Forex market moves caused by the increased volatility surrounding such events.
Case study 1: –
On the 23rd of June 2016, the British people voted in a referendum to leave the European Union: Brexit. This sent shock-waves through the financial markets and resulted in the British Pound plummeting in value against its peers.
In the example ‘A,’ we can see a huge, red, bearish Japanese candlestick descending from a high of over 1.50 to a low of 1.32 against the US dollar, during overnight trading, post the referendum result. The subsequent uncertainty regarding this decision caused the Pound against the US dollar – also known as Cable – to fall to a low of 1.19. Indeed we are still seeing extreme volatility due to the fact that, some three years later, this matter has not yet been
concluded.
While many traders correctly predicted that the British public would indeed vote to leave the European Union and shorted Cable, and made a hefty profit as the Pound sank, traders who were ‘long’ of the pair faced huge losses and where Stop Loss orders would have faced immense slippage due to the extremeness of the fall.
In Example B, we can see some of the extreme moves in Cable from a high of 1.50 before the Brexit referendum to lows of 1.19 and swing highs to 1.43 post the referendum.
Obviously, fundamental events like these don’t happen often. However, let’s look at another fundamental event which caused huge market volatility.
Case study 2: –
The country of Switzerland lies in the heart of the Euro area and does a great deal of international business with Euroland. The Swiss National Bank SNB is responsible for monetary policy for Switzerland but declined to join the European Union, preferring to remain an independent trading nation and retain its own currency: the Swiss Franc CHF.
Because of Switzerland’s geographically closeness to Europe and the significance of trade
reliance, on the 6th September 2011 – due to extreme volatility in the financial markets – the SNB announced it wanted to depreciate the EUR:CHF currency (or to cap it at) exchange rate of EUR:CHF 1.20, so as to remain competitive with regard to trading with the Euro area.
However, on the 15th January 2015, the Chairman of the Board of the SNP, Thomas Jordan unexpectedly announced it was removing the cap. The result in the effective 1.20 peg being removed, without market notice, caused chaos in the Forex market.
In example C, we can see a huge fall in the value of the Euro to the Swiss Franc from 1.2 to 0.96 on our chart, while some brokers were seeing falls to as low as 0.85. Many hedge funds made huge losses, and individual traders were made bankrupt along with the broker Alpari Trading, who could not cover losses it sustained in the devaluation crisis. Remember, this event was a bolt out of the blue, with many commentators accusing the SNB or gross
negligence.
The upshot is that trading on fundamental news releases can present some fantastic trading opportunities. However, novice traders are strongly advised to stay on the sidelines during these events for the following reasons; 1) Increased possibility of huge fluctuations in exchange rates, 2) price action acting in contradiction to technical analysis. 3) price already factored into fundamental news releases, resulting in little price action movement. 4) market disappointment, resulting in unexpected swings in price action, 5) a lag In price action while markets assimilate data, and where this can often cause price spikes and reversals.
Therefore, unless a trader is highly skilled with regarding to trading on fundamentals only, our advice would be to take note off data releases and then wait until such time as the markets have returned to the normal ebb and flow, and then continue with trading via technical analysis!
The safe-haven metal gold prices consolidate in the narrow range of $1,508.60 and $1,497 at the start of this week. The lack of volatility in the market was
The safe-haven metal gold prices consolidate in the narrow range of $1,508.60 and $1,497 at the start of this week. The lack of volatility in the market was
The safe-haven metal gold prices consolidate in the narrow range of $1,508.60 and $1,497 at the start of this week. The lack of volatility in the market was mostly due to the national holidays in China.
However, the precious metal gold prices slipped later during the European session as the dollar rallied after a report stated China was unwilling to consent to a broad trade deal with Washington. The bullion traded in a tight range as investors adopted a wait-and-see strategy before U.S.-China discussions this week.
As we know, it was all about the United States employment data, which is disappointing, and jobless rate prints a low of 3.5% during September, from 3.7% in August. The United States and Chinese trades are ready to start again this week. However, the Sentiment regarding trade war negotiations is not right.
Looking ahead into the fundamentals, some other key events are under the spotlight, including Federal Reserve chairman Powell’s speech, the FOMC minutes, and the United States Consumer Prices Index.
On the technical side, the gold prices started a day with a Doji candlestick on the charts and having the prices ending above the $1500 psychological level again.
The technical side of the market seems pretty clear as investor’s are consistently testing 1,497 support area. The violation of this level could extend the bearish trend until 1,492 and 1,487.
At the same level, we got the 50 periods EMA, which is also extending support at 1,497 zones.
The leading indicator, such as MACD and RSI, are holding staying in the neutral zone, suggesting indecision among traders today.
Daily Support and Resistance
S3 1465.24
S2 1485.38
S1 1495.05
Pivot Point 1505.52
R1 1515.19
R2 1525.66
R3 1545.8
I would rather stay out of the market until we have clear direction about the market and clear path means either the bearish breakout of 1,497 or bullish candles closing above the same level.
Hello, and welcome to this latest edition of courses on demand, brought to you by Forex dot Academy! In this course, we will be discussing
[embed]https://youtu.be/QGrNOOYcdb0[/embed]
Hello, and welcome to this latest edition of courses on demand, brought to you by Forex dot Academy! In this course, we will be discussing
Hello, and welcome to this latest edition of courses on demand, brought to you by Forex dot Academy! In this course, we will be discussing those real-life case studies, considering fundamental analysis. Now there is, of course, inherent risk when deciding to trade the financial markets. So, just before we begin, please do take a moment to familiarise yourself with the following disclaimer.
So, what, are we going to cover exactly in this webinar? Well, we’re going to discuss the overall economic environment of the markets that we trade, and then we’re gonna break down some really key or significant economic events through the course of the last ten years that really made a huge impact in actually changing how traders, perceive the markets. Changing the overall formulation of risk on or risk of approaches to investing, and trading, and obviously provide us with opportunity both in the long term, and some volatility in the short term, as well in terms of our study, as fundamental traders, or I suppose students of the markets it is essential that we know what we’re doing in these environments, and that leads us on to discuss whether we’re deciding to trade the bond markets or Forex pairs we need to know how these large economic events will affect the perception, are the real decisions that other market participants will involve themselves with, when deciding to put on positions, and trade these markets, and others no different from ourselves. So, let’s delve in to really discussing first, and foremost the trading the economic environment, and the trading of the macroeconomy. So, why does this matter? Why does the economy matter to us? As traders, the financial markets reflect the overall performance of the economy financial equity indices represent the overall business health of an economic region and their strength, and weakness bears a close connection to gross domestic product other asset classes such, as commodities bonds, and stocks, are therefore affected by the level of business on with activity circulating in the economy okay. So, as an overall growth perspective in terms of trading in the economy are those financial analysts out there they look to the GDP the gross domestic product to see whether we’re in a recessionary recovery or perhaps a boom period of growth, and that will indicate to us how strong an economy is in relation to its competitors, as well how do large economic events help shape the global economic outlook, and that will be the point of our lesson here large economic events can fundamentally change the way in which investors, and traders, perceive future economic growth, and stability they often cause a dramatic change in the level of risk and uncertainty over asset pricing, and that’s both in the short-term, and long-term, and we have seen that quite significantly in some of the topics we will discuss during the webinar the Brexit decision the massive depreciation of sterling, and the US election there with Donald Trump caused a lot of volatility, and then we’ve seen a total repricing of assets, as well. So, let’s delve into this in a lot more detail but first, and foremost, as us traders, how do we how do we perceive or how do we read the news how does it affect our opinion perhaps on the economy whether we have short ideas in terms of trading an asset like perhaps the global equity index for a two-month period how do we actually take this economic news in or these shifts in global sentiment into our trading let’s look at this for a moment we have a trader here concerned about some figures that he has heard or seen sort of releasing into the news the US economy expanded at an annualised two point nine percent on-quarter in the last three months of 2017 that’s higher than two point five percent in the second estimate on beating market expectations of 2.7 percent hmm personal consumption expenditures, are privately inventory investment, are revised up okay. So, we have the personal consumption expenditures, and private inventory investment, are revised up. So, we’re sitting here, as traders, were involving herself in this economic environment to make trading decisions how do we speculate, and how do we really try, and gather an understanding of what this means well this could cause volatility in the forex markets of course in the short term we can see different pricing in terms of what domestic nations were trading. And for trading as apparent against the US dollar we need to know, if that U.S. increase in gross domestic product, how that might affect the dollar in relation to those other currencies obviously we might love to trade the equities, are our baby we’ve got a long US equity trade here, if we have positive growth in the US economy, as well. So, there’s our light bulb. It’s working off some new trading ideas, and that is what we do as traders. Now that’s how we understand and trading this economic environment. So, let’s look at what we have here, and we sort of touched on it in some detail u.s. GDP growth rate and we have EU unemployment rate to charge to the left-h, and side our job, as traders, is to really bring this information over the two charts to the left onto our price action chart to the right, and speculate get involved trading these markets. So, first, and foremost GDP growth.
Well, we have a figure there relative in the last quarter of 2017. Quite strong with 2.9 percent. We can see how it relates to overall performance throughout the year, is it perhaps a bit in terms of estimates we know that it was, that will lead us to actually look for buying opportunities? And we can see the market has reflected in such a way we looked in perhaps for an EU unemployment rate it is continuously over the long-term going down there’s a good sign for us traders, here in Europe who, are considered to trade more often those European indices, are perhaps Forex pairs or any sort of relevance in terms of European markets that it’s supposed to be, and certainly will be in terms of fundamental decision-making be supportive. So, that’s what we do here in terms of trading the economic environment we look at these economic events or these economic data to formulate trading decisions over the medium to long-term in delving in understanding more about the economy we will become better traders. Now let’s delve into our real case a study number one which is of course Bragg’s it I’m sure most of us, are very familiar with this situation it was due to a referendum there on the 23rd of June 2016 the UK voted to leave the European Union this was a massive shock to the financial markets not only because most how expected the UK electorate would overwhelmingly support staying within EU but because it would have astronomical ramifications in how the UK would conduct business, and trade with its neighboring economies okay. So, that’s going to have long-term effects on trade relations in the short-term it generated a huge level of uncertainty over future trade relations continued economic growth employment, and immigration between nations, and of course political discord which might I say continues today such a fundamental shift in domestic policy for the UK government was sure to have very real effects on the financial markets particularly those securities related to Britain. So, the question I would like to pose, when we decide to fundamentally analyse these case studies is what fundamental changes took place, and what trading opportunities did it provide, and that’s really the point of fundamental analysis, as well remember it’s not to necessarily be correct it’s to make trading decisions, and look for those opportunities in the marketplaces. So, first, and foremost obviously an event of this magnitude of this scale is going to cause short-term, and long-term sentiment volatility whether you’re a Forex trader you’re going to know that’s going to cause more opportunity for you or whether it perhaps you’re holding long equity positions in the UK or across Europe obviously that’s going to have a really negative effect with the volatility in the short-term on your position, and potentially it could lead to some future opportunities in terms of speculation in trying to price in the surprises scenario, and obviously then the most immediate effect the financial markets would have been the depreciation a quick depreciation in sterling from around 147 to 132. So, quite a drastic move, and obviously that led to a more longer-term approach in terms of long-term depreciation in the currency that led them to a re-evaluation of the UK economy, and obviously if you’re an equity trader to a total repricing of UK equity markets. So, obviously we have seen a short-term volatility fundamentally we know that’s going to cause a lot of concern in the financial markets but, as the markets start to repress these moves these economic case events that we studied that leads to a total shift or a total repricing in such assets in particular here, as we discuss the UK equity markets just think of ourselves, as potential UK equity investors perhaps only owning portfolio of stocks there in the UK all of these shares, are going to be revalued based on the change in the actual currency itself the indicative currency that these, are priced in. So, let’s look at the chart here in front, and actually assess this fundamental case in a little more detail in terms of the price action well in front we have the Pound u.s. dollar Forex cable market, and we can see obviously the big engulfing con of the sticks out like a sore thumb there a depreciation or devaluation of that currency from 147 to 132 almost overnight. So, we have it a 10.2 percent drop in a 48-hour period that is of real concern for forex traders, particularly obviously, if you’re trading those currency pairs valued across the pound sterling pairs, and obviously, those assets that, are related to those pairs. So, any real commodities that come from the UK whether they’re import or export commodities any assets such, as the equity markets mentioned would have been gravely affected, and this is obviously going to change the entire sentiment of the market in the short-term, as the market starts to source to really reprice the risks reprice the uncertainty in terms of how the political discord will ensue on what it might mean for economic growth within the eurozone here we have the bracelet shock then we can see the intense volatility there adjust by observing the candlestick structure the Japanese candlestick structures during the weekend obviously we see the footsie closes on Friday evening at six thous, and three hundred, and fifty-eight, and after the weekend after the Bragg’s referendum vote it opens at five thous, and seven hundred, and seventy. So, that’s sort of mid-range in that very large candle there you would have seen the daily price action trader, and how’s the mantra to start to read prices move with the currency devaluation to see how it actually affects some of the big earners in there the export boom companies, and starting to actually repress the performance of the faulty, as an equity index we see the price move out quite sternly, and obviously in three to four period come back up to new levels then we see the brexit after months the markets totally revalue the composition of the footsie 100 index, are suggested, and traders, pricing that future value of export firm growth, and this inevitably is something that is quite a shock to the market, ironically leads to a period of boom within the UK economy, in terms of the market structure repricing those assets, and in terms of actually looking at the trend in front we can see it actually fundamentally, this fundamental case serves to support economic growth to the upside.
So, let’s move on to our real case study number two, and discuss the Swiss National Bank the Swiss National Bank is responsible for the monetary policy of Switzerland, and just like any other Bank it does aim to provide growth, and stability of the domestic economy by working towards target inflation rates, and price stability considering the geographical significance of Switzerland, and it is very important that the nation, are strong, and perhaps favourable trade relations with its European neighbours even though it does not share the domestic currency with the single euro mechanism the SNP or Swiss National Bank announced on the 6th of September 2011 that it intended to address changes in the value of the Swiss franc to the euro aimed at depreciating the currency cap to 120. So, as to remain competitive to its neighbours then on the 5th of January 2015 the Swiss National Bank made an unexpected announcement to the markets that they believe the euro crisis had passed, and that they were no longer following the euro currency arrangement. So, let’s take a step back for a moment, and try, and assess this scenario fundamentally for the nation of Switzerland, if we think we have at this time a euro crisis where we have negative interest rates across some regions, and obviously there’s a lot of concern that this euro sovereign debt crisis is going to deepen we see a country geographically like Switzerland, and right in the centre of all this controversy, and they want to continue their growth, and continue their business amongst the calamity what they’ll want to do, if we think of the composition of the SMA which is the Swiss market index the leading equity index there in Switzerland, and we have companies like Nestle the chocolate maker then we have Novartis Roche some of these companies, are huge exporters in terms of global dem, and, and obviously would do most of their business, and in the eurozone so. Now that we know fundamentally the reason for the Swiss National Bank pegging their currency to 120 euro, and obviously the aftermath of actually Pauline a peg how can we assess them, and look to see what happened in the currency markets well we have here the euro Swiss franc, and inevitably we can see an absolutely huge move to the downside that prism was a huge amount of fear, and uncertainty and obviously the fact that it was such a sudden announcement is going to cause increased volatility to the downside we’ve seen literally the floor has been pulled from this market the support has broken at 120 Fundamental was the case, and really the notion or the directive from Thomas Jordan, and from a Swiss National Bank to actually send this currency back to a level of equilibrium in terms of national domestic currency in relation to the eurozone it it’s his biggest partner in terms of trade relations let’s move forward, and to discuss in our real case study number three, and that is the infamous collapse of Lehman Brothers. So,, if you have been a financial trader, are just genuinely interested in the markets, and the economies over the past 10 15 years or generally just interested in the financial recession, and crisis that we had there this is certainly a case study of interest Lehman Brothers was one of the largest investment banks on Wall Street it was perhaps the first big bank to capitalise on the growth of the US mortgage organisation market where massive amounts of profits were being made on u.s. home loans by 2006 it had merged with many active lenders across America. So, much that it had appeared to do almost all of its investment business in collateralised real estate, and only a portion in traditional financial investment this era of investment growth coincided with the rise of the shadow banking industry, and financial leveraging that monumentally increased Lehman’s exposure to the mortgage market. So, in a little detail, if you’re unaware of the shadow banking industry, you may have seen the movie the big short it’s simply where all of these financial firms learned to package, and bar that together reprices it was good that settled on throughout the financial system. So, that Laird obviously to all of this being joined collectively, and spread systemically throughout the system times of economic boom ensured that such investments were profitable however the significant portion of its assets allocated to managing housing loans meant they were vulnerable to a market downturn, and of course more vulnerable to an eventual market downturn in the housing market itself which is eventually what happened during the later months of 2007, and early 2008 it was clear there had been a housing bubble all led by the easy availability of credit, and the ease at which was to get a mortgage loan accepted property prices quickly began to fall, and millions of mortgages became unaffordable, and un-payable overnight, and that happened millions of Americans wear their homes effectively their mortgages turned into negative equity over a very short space of time while enjoying profits during the boom Lehman’s over leveraged exposure to the mortgage market meant that a 4% decline in the value of its assets would entirely eliminate its book value of equity on the 15th of September 2008 Lehman Brothers filed for chapter 11 bankruptcy protection it had accumulated a total holding of over 600 billion in US assets 600 billion dollars in US assets quite a substantial amount the collapse of Lehman Brothers was not only an economic disaster for the US housing market it brought into question the systemic risk these financial institutions caused to the entire global financial system another certainly really the story of this case, and really the bullet point in terms of being a student of the financial markets, when you study the shell banking industry, and these banks the question at the time was, are these banks perhaps too big to fail, and of course there was discussion at the time between those in government, and those in the private sector whether they could actually floater or keep blaming brothers above water, and how that would actually affect the financial system they agreed at the time that they simply could not they also went on to build many other banks art but let Lehman Brothers evidently collapse it being the largest investment bank on Wall Street. So, a very significant period of history in the U.S. let’s look at how this real case study the actual collapse of Lehman Brothers affected the markets in looking at the economy we have here the S&P; 500 daily chart over a long period of time we can see the market downturn shows us a lot of volatility another is representative of the serious amount of concern or uncertainty that a market participants, and traders, are feeling, as we see the fresh news flow perhaps mortgages denied housing sector fall outs all of these things will come into the news and cause volatility to the downside. So, we see the downside with the reality of the housing bubble itself it became clear banks, and financial institutions where indeed overexposed but particularly the size the too-big-to-fail phenomenon, and really affected the downturn, and was the catalyst for price movement, when it became clear that Lehman Brothers was simply not too big to feel under the entire banking system was indeed in jeopardy, and that’s what we’ve seen in terms of the price follow-through, and I inevitably caused the catalyst for the 2008, and global recession in some more detail in terms of analysing this fundamentally what does this mean for us, as traders, over the long-term we know that as investors in the community you’ll generally go through four to five periods within your own lifespan also considering how long you live, but we do go through the business cycle periods of booms, and busts, slumps, and obviously there, are intermittent, and recessionary periods within that.
So, here within GDP we have our boom, and bust cycles we see the collapse of Lehman Brothers just entered the markets they’re causing a bit of a catalyst, as the market free price this whole phenomenon we see a large investment bank take the hit collapse due to the massive it mortgage exposure in this in this space, and then we obviously see the slump with our financial crisis there 2008, and continuing on to even deeper slum periods. Now in aiming fundamentally to analyse why exactly or one reason why we were able to come out of this recession area period, and back into a recovery or a period of economic boom we can study real case study number four, and others quantitative easing. Quantitative easing programs were first introduced by Japan in 2007 to battle deflation in the economy. The aim was to flow the domestic market with new liquidity to promote learning and stimulate the economy. So, generally speaking, they do this through the bond markets through the new issuance of debt, as a result of the global financial crisis of 2008 many global economy is still faced financial meltdown with worsening economic conditions unlimited credit availability at the time we refer to this, as the credit crunch. So, for many traders, out there I’m sure you’re familiar with the phrase there was intense volatility in the forex markets, as well, as the equity markets, and of course we felt this everyone felt this in terms of a pinch on the pocket with the objective of boosting the economy in the United States launched a program of quantitative easing in 2008 followed by the UK in 2009, and of course the European Union later the same year each central bank took on large-scale asset purchases assuming the burden of risk for their economies, and released fresh healthier liquidity back into the markets in order to stimulate lending and growth. So, let us refer back to our business cycle what we, are trying to do is actually recover from this economic recession this global financial crisis that has systemically affected our financial institutions, and caused unemployment across many nations, and effectively slowed growth what we, are effectively doing is trying to stimulate growth by increasing the money flow into the economy swapping a bad debt with good debt, and trying to increase lending. So, that consumer spending growth unemployment regains its stature in our economies here we have the financial crisis, and coming on from that with the period of slump there we introduced QE 1 that’s commencing in November 2008 with the US Federal Reserve started buying 600 billion in mortgage-backed securities on one point seven trillion dollars of bank debt then we have qe2 that’s November 2010, and that’s another 600 billion dollars of mortgage-backed securities in that purchasing program, and then, of course, September 2013 the US Fed launched 40 billion dollars a month open-ended bond purchasing program analyst to flood the market with new liquidity to increase that landing in the private sector across the corporate finance world, and then after a long period of prolonged period of perhaps six years of quantitative easing we see these factors start to come into effect where money supply has increased it is filtered through the rest of the economy we’re starting to see these finance institutions become healthier they’re starting to lend more to smaller business enterprises who in turn create business to hire staff which actually increases in the labor market, and then obviously consumer spending, and manufacturing start to grow, as well this all leads to the total financial recovery story, and we’re currently obviously just coming into a boom period where we’ve seen a very strong market bull run for the last two to three years. So, how did the financial markets react to this fundamental story of quantitative easing well obviously they know fundamentally they’re going to be supportive by the government, and that is the primary concern or issue with QE more generally speaking market prices, are said to be discovered price discovery is a function of participation between buyers, and sellers. So, this is a very unique period of our history where actually government institutions, and central banks directly interfered with that price discovery over the long term obviously it’s in effect to help the economy and stimulate growth, but in terms of pricing assets it led to support, and obviously long term price structures to the upside given the economic growth, and health of the economy. So, here in front we have the S&P; 500 this is the largest equity index in the U.S.A consisting of the 500 the top 500 companies by market capitalisation to the left we can see obviously the financial crisis caused a huge shift of market sentiment, and obviously we see the inevitable recession that we have bringing prices way down to new lows there, and February 2009 then what we see is a period of recovery just after but it does take time for the recovery to come in, and obviously this is a fundamental discussion of quantitative easing how long will it come into effect how long will those prices and a change is starting to feed into the economy but we do see sustained both over the long-term period, when looking at her sp500 given that this is a global financial crisis the question I would like to ask, and really have you, and observers how does it affect the rest of the global equities out there in the world let’s have a view here we have the nasdaq-100 we can see that the price structure is very similar we have the 4100 again we have a very strong move to the downside, and we can see, as we move across all these global equity indices the larger story of quantitative easing is a function of actually looking to support global growth that is a very similar story in terms of the fundamental base of quantitative easing, but we can see there, are little time shifts, and that’s more relative to the fact that QE was introduced earlier in the United States, and then in the UK then in the European Union we see these prices start to stabilise, and it never will be moved to the upside over the long run. So, let us delve into a real case study number five the European sovereign debt crisis the European sovereign debt crisis that took place in the European Union towards the end of 2009, when it became clear that most eurozone economies were still struggling with the challenge of economic recovery many nations had seen an increase in sovereign debt, as a result of banking system bailouts, and were unable to pay or refinance the government debt. So, that is the key, when, when really understanding at the function of debt or our interest rates the ability to actually repay those deaths, are on loans over a long period of time to underst, and the complexity of this situation we must underst, and how inextricably linked long-term interest rates, are to macro economic health a nation’s interest rate reflects the risk associated with its ability to lend to the financial markets. So, of course in layman’s terms those countries who have a higher perception of risk perhaps they’re going through tough times economically in this particular case we have Irel, and, and Greece of course Italy Portugal they were finding it very difficult to repay their debts, and obviously that risk involved, and actually purchasing alone perhaps a 10-year bond from the from one of those governments has an added perception of risk, and obviously would require a repayment of a higher level of return. So, it is a simple risk reward ratio, when deciding my bonds or priced unlevel of interest rates to those bonds with many EU nations unable to refinance their debt massive uncertainty Andriod the bond markets causing dramatic volatility, and a surge in many domestic interest rates this effectively collapsed the bond market some countries, and led to a huge increase in unemployment for those worse affected. So, effectively what we were witnessing in the European sovereign debt crisis was the inability for many of these nations to effectively pay back their debt to the European Central Bank many of these countries had obviously taken bailouts, and we’re giving bailouts by the ECB to help stimulate domestic growth in their national economy but of course these, are loans, and these have to be pared back, when the economic performance of these nations didn’t it didn’t seem to grow in the same perspective of the bailouts, and obviously they were experienced a serious level of austerity and difficulty in doing. So, and in growing their economy, and recovering those challenges came to the front where effectively it was very difficult to pare back and make their obligations in terms of paying back debt to the European Central Bank. So, let’s look at our case study chart here what we have is long-term interest rates over the period from July 2008 to January 2018. Now in analysing or long-term interest rate short we can see that there, are two countries that really stick out for us, and both Portugal with the blue line, and Irel, and with the green line respectively what this chart tells us really is that there’s a large spike in interest rates over the period roughly July 2010 to October 2012 that would present problems for Irel, and, and Portugal in terms of trying to refinance their government operations in the bond markets giving that they would have to pay back a level of percentage interest on perhaps two h, and % we have 12.5 a peak in Irel, and they’re roughly around 13 14 % peak there with Portugal reflecting of course the overall uncertainty or perhaps perception that they could not effectively repair these loans or their bonds back in a given period of time another all constitutes the level of risk these economies, are facing at the moment one of the countries not included in our long-term interest rate short give it’s a real case study in terms of study in European sovereign debt crisis is Greece, of course, Greece had been hit very hard by the financial crisis, and it’s trouble to remain competitive, as a Euro trading partner in the eurozone was really pushed into question, and this is because really they got bailed out time, and time again, and could not repay their debt, and almost went bust several times.
So, what I’d like to do is actually pinpoint this, and I’ll call it in black that we can annotate ourselves here we have April 2010 8% which is in, and around this period we have around 10% we can see already that it is leading the way in terms of this increased volatility on long-term interest rate spike, and to the upside that is again just simply an overall reflection of the uncertainty of the peril of their economy at this stage, and their inability to effectively pay off any debt that they may assume then we have April 2011, if we scroll up, and actually look to plot the point we have it around 13%. So, they’ll just be above here again it’s going to plot high from our Irish debt at that point, and then April 2012 27% which is an astronomical figure, and I’d like to detail that just to you in terms of what it means for the financial markets, and in terms of potentially loaning, are looking to borrow from the Greek economy 27% we have April 2012 mother’s up here, and again we’ll just put it at the top of our chart what that means effectively is, if you were to assume some finance from Greece, and effectively purchased, and other time hypothetically one of their 10-year bonds they would effectively be paying an interest rate on the bond of 27 percent which is an astronomical figure in terms of generally pricing a bond, and obviously paying an interest over a long period of time with 27 percent it’s absolutely huge. So, I just show you the level of risk or uncertainty the financial markets have priced in when understanding that the level of peril the Greek economy was actually in at this time. So, all of these fundamental cases served actually to help us, as traders, not only for the knowledge they served to really give us an idea of the overall economic environment within which we trade it is the job of the financial trader to speculate on the movement of price these prices relate to many different assets but also a very common relationship to the performance of the global on domestic economy from which they, are natured become not therefore effectively do our job, if we do not have a fundamental grasp on how economic events can shape the very environment we ourselves conduct business in once we better understand, and the effects of news, and economic activity we will become more knowledgeable about our trading conditions, and therefore more assured in our trading decisions. So, that brings us to the end of our real case studies fundamental analysis webinar, let’s go over a quick review of what we learned through the webinar trading an economic environment why it is. So, important to understand, and, and grasp the overall economy, and how it changes the risk-on risk-off approach to your trading, and really hard facts all of these different assets that we trade, as financial traders, we then went through different case studies over the last 15 years we have Brexit the Swiss National Bank removing the currency paid to the Euro Lehman Brothers, and effectively a lot of detailed discussion on the financial crisis of 2008 that let us effectively into discussing the recovery mechanism of quantitative easing, and then we touched upon the European sovereign-debt crisis how that may affect liquidity, and how it certainly affected the bond markets, and perceptions of risk for domestic economies, and potentially the eurozone a growth perspective overall. So, all that is left for me to do is thank you very much for joining us on this instalment of courses on demand, and brought to you before I start economy we do hope to see you very soon bye for now!
[embed]https://youtu.be/-2BI4i0IrK0[/embed]
Hello, and welcome to this latest edition of courses on demand brought to you by Forex dot Academy in this course, we will be discussing
[embed]https://youtu.be/-2BI4i0IrK0[/embed]
Hello, and welcome to this latest edition of courses on demand brought to you by Forex dot Academy in this course, we will be discussing
Hello, and welcome to this latest edition of courses on demand brought to you by Forex dot Academy in this course, we will be discussing fundamental analysis, and decision-making volume 2! This does lead on from fundamental analysis, and decision-making a volume 1. Now, there is, of course, inherent risk when trading, the financial market. So, just before we begin, please do take a moment to familiarise yourself with the following disclaimer.
Now in focusing our attention to the study of fundamental analysis, and decision-making, we will be taking a closer look particularly at fundamental analysis, and the risk environment. With that risk environment, we need to understand, and analyse economic data, and understand how changes in economic data actually affect price over a range of asset classes we will be looking at trading, opportunities such as buying the rumour, selling the fact! It often occurs across those financial assets whether its Forex or, particularly in equity trading, where traders position themselves, and actually trade-off a rumour, and then had traded the opposite side of the news story once the fact emerges into the marketplace. We will then be looking at trading, behavioural finance, and that does continue on nicely with avoiding unnecessary market traps. Particularly for those beginner traders, and then we’ll be finishing off the lesson with fundamentals on timing, and obviously, one of the key skills to learn as a financial trader, and whether you’re a fundamental or, technical or, both is when to effectively have good timing! When to enter the markets, and early enough so that you’re getting a good price that you desire. Whether you’re deciding to buy the market or, sell them at the market, ie short sale, timing is crucial for financial trading. We will be discussing the fundamentals behind that fundamental analysis and risk environment in conducting our fundamental analysis, what do we aim to do? Where are we aiming to arrive at an underlined fair value price? That’s really the motive for fundamental analysis. Whether you’re deciding to fundamentally analyse stock price, you have to understand the growth potential of that company. The competitor environment with which it operates, and those business many factors to actually come to a fair value price, what you believe your analysis tells you that the price should be if that is the case then you can make trading, opportunities as a result you know given that something might be overvalued or, undervalued another’s particular for equity trading, but, has most certainly strong strengthen in construct when looking at commodity trading, as well particularly for assets like the soft commodities corn weak to sugar things like that however before we consider trading, the asset it is important to gain an understanding of the current market sentiment, and its tolerance for risk this temperature test is known as assessing the risk environment. So, there always is a risk environment in the markets current market sentiment, and we need to understand, what it is there’s a current appetite the current market appetite for risk has real fundamental power over asset prices from currencies to commodities to bond markets to equities all asset classes follow suit to the underlying risk environment markets will experience them two main appetites for risk. So, first we have risk on, and second we have risk-off. Let’s first look at risk on risk-on environments are often carried by a combination of expanding corporate earnings optimistic economic outlook accommodative central bank policies, and speculation yes fairly straightforward. So, when we are in a period of economic growth, and relative strength we can see that the economies are improving we’re likely to take more risk as traders particularly for risky assets perhaps like equities or, our risky commodities, and that will be looking to obviously deliver more profit a rate of return a higher rate of return for that added extra risk that we take as traders, and that is the time when we’re experiencing this potentially growth, and very strong growth periods will be looking to add risk and speculate as a result as investors feel the market has been supported by strong influential fundamentals they perceive less risk about the market, and its outlook, and are more willing to take on risk absolutely that’s absolutely the case for traders as perceived risk Falls in the market investors assume a higher risk tolerance volume, and interest will increase for riskier assets like equities, and high bonds, and that’s absolutely the case we have a large increase in interest for risky assets very risky potentially very risky equities could be you know not particularly S&P; 500 foot lower denominations of equity indices where you often see capital flows go in across nations, and in terms of a good trade business between regional nations, and obviously that the aim of those trades is to look for higher rates of return when we do see, and I suppose a risk off approach which we’ll be discussing. Now, we do see that money retract, and actually pull back contract from global investment stocks it’s definitely worth noting as a trader stocks our equity markets are generally seen as riskier assets than bombs, and if we think, what a bond structurally is it’s a debt instrument perhaps we’ll take an example of a ten-year dated bond, and for the German bond.
The German government it’s effectively a loan of 100,000 pounds on one year bond that you’re giving the German government, and within that ten year period, they’ll be making repayments that will hopefully come to around to 3% at nominal levels over the duration of the loan or, the bond purchase. So, it’s not a sort of fantastic rate of return 2% over such a long period of time ten years, what we do have to do is invest in equities something like an equity so, you could return we look at Amazon this year returned over 50% in 2017. So, absolutely fantastic returns are available for those, and very strong yet, curiosity classes let’s have a look particularly at a risk-on example, and it really sends as a signal to, what the current appetite or, tolerance for risk is in the marketplace at this time. Now, I’ve chosen this market in particular at the Euro Japanese yen because it has very strong attachments to the risk-on risk-off approach particularly because, and well this move itself will be described as you remove as I will also will discuss through the chart however the Japanese yen how the currency itself is known as a safe-haven currency. Now,what that means guys is that when there is huge uncertainty in the markets you see capital flight push capital towards, and things like gold has a store of wealth, and also currency like the Japanese yen and. So, one example could be when there’s a very strong equity sell-off, and capital flow will go into Japanese, and just to store that as cash for a while before markets come back to a high level or, a tolerant level of risk. So, this is the Euro against the Japanese yen. So, what we’re trying to do is currency traders is trade strength first weakness. So, it’s the perfect example here to show you a European example approach to a risk on trade here we have the French election. Now, if we do recall back we had the far-right Marine Lepen, and against many other competitors, and, what who won was Emmanuel Macron who was regarded as a good friend to Europe he wanted to push on, and continued growth in the European eurozone economies, and was healed as a very strong politician in terms of focusing on recovery as opposed to immigration law, and other things. So, what we see is the French selection here 2017 the market the Euro yen is just bouncing from lows then we see a bit of a shock surprise in the French election the bullish mark up as the market jumps over the weekend we see the market, and open up many takes higher, and just on the open on Sunday night there, and after the from the weekend in France that’s very significant technically but, what we’re trying to do here is analyse this fundamentally, and make decisions. So, what is the story behind this trade well the surprising, overwhelming support for Emmanuel macron led to him and taking the French presidency of May 2017 as a politician focused on European growth and diplomacy his campaign was very different from foreign opposition leader Marine Lepen the market sentiment quickly turned to risk-on environment. So, we have a risk-on environment in Euro in euro-denominated assets, ie the euro currency that will lead to euro price increases at the same time we have risk on sentiment pushing back in filling those greedy investors with risk-on sentiment, and we see money retract from the Japanese yen itself. So, it’s a real story of risk-on sentiment changing the market structure, and changing the actual currency pair strength versus weakness we see a very strong definitive trend, and that’s really the start of it in the Euro Japanese yen let’s move on to risk-off risk off environments can be caused by widespread corporate earning downgrades contracting or, slowing economic data uncertain central bank policy a rush to safe-haven investments, and many other negative economic data as perceived risk Rises investors sacrifice return for safety. So, risk off is obviously the opposite of the risk on risk tolerance scale we see investors really sacrificing their 1 for capital their 1 for profit for a return to safety they want to store their profits gained throughout the financial trading, year in a safe haven currency or, commodity some investors harness risk off trading, in an effort to meet their investment objectives this particular strategy hinges on the broader sentiment of the global assets market with a belief that the rising or, falling confidence of investors can motivate them to fail one asset class over another absolutely, and again to reiterate a good example of this is capital flight to safe haven assets can often occur we see the gold market we see the Japanese yen market we see bond markets or, Treasury the Treasury markets in the US a lot of capital goes into bond markets during times of uncertain an indicative of current market sentiment a tolerance for risk at that time I want to point out this risk-off example I don’t need to go through it into too much detail I know you’re really all aware of this the 2008 financial crisis was considered a risk off year an entire year whereby investors aimed to reduce risk by selling all speculative or, risky investments, and move money into non risk positions. Now, apart from the obvious why do we think this could happen well obviously we have Lehman Brothers one of the largest investment banks historically, and very traditional investment bank on Wall Street actually collapsing something that has really never happened before, and sends a huge shock down the market in terms of investment, and retail banking we then see throughout the year I’ll see the financial crisis ensuing but, as a trader or, as a vaster or, portfolio manager owning all these asset classes perhaps an even in a diversified portfolio we see a real attempt to reduce risk by selling all speculative risky investments, and, what we want to do there in this case when we have a risk-off approach is move money into non-risk positions or, non-risky assets to keep them only safe to look for capital protection not necessarily always looking for those profit opportunities when they’re just not available to us in the marketplace.
Now, it should be said that when we understand the risk-off approach in terms of risk tolerance we can then look for those assets perhaps like gold like or, Treasury bonds to actually look to follow that momentum to the downside or, upside in those in those assets themselves let’s go through some economic data it’s very important that we have a real contextual idea of, what economic data moves markets throughout the eurozone throughout the world, and throughout domestic economies in terms of structuring interest rates, and structuring perceived, and ideas of support, and growth within an economy in fundamental analysis, and decision-making we established that knowledge is power for the fundamental trader your ability to analyse economic data with its fundamental effect on asset places, and in relation to the current market sentiment is Parliament to trade in success that’s absolutely the case. Now, let’s discuss many of the economic data variables that are essential to the economy, and to us as financial traders Consumer Price Index or, CPI it’s the change in the price of goods and services purchased by consumers the CPI accounts for the majority of overall inflation, and inflation is important to currency valuation as rising prices lead central banks to raise interest rates in keeping with their mandate for price stability let’s not forget that central banks have mandates to keep prices across the domestic economy stable. So, there isn’t a huge amount of fluctuation, and both in the currency and with the level of overall goods within that economy. So, it’s crucial in terms of interest rates, and its effects I’m novice Lee as a currency trader we need to know and understand consumer price index crude oil inventories obviously this figure will be subject to you deciding to trade, and the WTI crude or, perhaps Brent crude oil, and markets, what is it well the crude oil inventories is a change in the number of barrels of crude oil held in inventory by commercial firms during the past week. So, it’s every week this figure is in earnest I believe every Wednesday at 3:30 at UK time it influences the prices of oil, and all other petroleum products it also has a very strong impact on growth as many industries rely on the commodity to produce goods employment change it’s very simple it’s the change in the number of people employed and is a key indicator to reflect labor market conditions, and the overall health of the domestic economy particularly it would be very important in those economies that are perhaps experiencing very disparity in levels of employment, and if they’re not picking up with the rest of the eurozone perhaps at the moment we look towards those indicators to show an overall level of growth in other eurozone, and eurozone block. So, that those employment change figures would be significant from many other different, and nations across, and across the globe really, and in terms of just looking at one domestic economy GDP or, otherwise known as gross domestic product it’s the change in total level of output produced by an economy it is the broadest measure of economic activity, and the primary gauge of the economy’s health. So, that is, what we use, and others the certainly the figure that we use to describe, and the business cycle whether we are in a period of recession whether we’re in economic boom or, whether we experienced in the slope a slump will be obviously negative GDP where we fall back into recession and continue to slide. So, it’s the broadest measure of economic activity, and obviously, kid is the health of the economy. The Germans are ZEW. It’s a key sentiment indicator based on German institutional investors are analysts the reason why it is so, significant. Well, it’s the actual investment analysts not have a say that I have the input into the indicator itself it is a leader in leading indicator in terms of economic health but, those analysts have the know-how they’ve been in the market, and financial markets for a long time and the record is experts within the field.
So, their sentiment is often seen as an early signal of future economic activity ever MC well the FOMC it roughly comes around yeah it’s announced eight times a year the FOMC usually changes the statement slightly simply with the wording in the statement at each release, and this is to reflect changes in economic performance, and guidance it is the primary tool the FOMC, and uses to indicate monetary policy. So, for those u.s. traders, and obviously the world looks as the US economy looks towards the US economy as the biggest and most productive economy in the world, and to show signs to the rest of us in terms of global economic growth. So, very significant indeed non-farm payrolls again a huge economic figure in the United States it’s the change in number of private-sector jobs from the previous month in the US economy, and it is of course worth noting that that does not count for farming jobs they’re actually not counted within the NFP figure the NFP figure is considered the most vital data of economic performance in the US, and is released after the month ends as a result job creation is of huge importance to the US we see that figure come out on month, and relative to the month just before, and we see how that the labor market conditions are improving or, disproving across the United States manufacturing PMI is a survey of purchasing managers in the manufacturing industry why would that be important well it does give us a significant insight from corporate ok the corporate America or, corporate Europe or, wherever the purchasing managers index is coming from ours business reacts quickly to market conditions it’s a leading indicator of business performance, and has a relevant insight into the company’s view of the economy perhaps one of the most important again official bank interest rates, and this is of keen significance over the next coming a two to three years the interest rate at which central banks lend to all other financial institutions, and obviously these interest rates trickle through the rest of the economy the whole financial services sector lead even to formulating your interest rate on your mortgage, and your car loan, and many of these diversified products that are offered in retail banks short-term interest rates are the Paramount factor in currency valuation traders more often will look to other indicators to predict how these rates will change in the future, and last but, not least we have retail seals changing the total value of sales at retail level it’s the primary gauge of consumer spending which accounts for the majority of overall economic activity another is a very important gauge consumer spending when we have something like a credit crisis which we experienced not. So, long ago there are as a byproduct of the financial crisis we look towards gauging consumer spending to see if growth is starting to spark again, and come back into the economy let’s have a look Now, buy the rumour, sell the fact, and how market participants can gear up for these trading, opportunities buying the rumour, selling the fact is a piece of trading! The device developed in early stock market trading, it relates to a situation where the price of a stock would move higher due to traders buying because of rumour, they simply heard about possible company acquisitions or, higher than expected earnings reports. So, there is many many different examples there that could start the rumour, mill where traders would actually say to trade off these rumours, and actually position themselves in the market with the impression the rumour, will eventually come true actual Bayside volume is created. So, that’s, what happens. Now, it should be worth noting depending on the rumour, sell-side volume can be, and created as well it’s not always on the buy-side particularly it has more of a common approach to Bayside volume when we discuss buying the rumour, selling the fact, and equity trading, inevitably when the news or, economic event occurs, and the rumour, turns out to be untrue the sell the fact sentiment takes hold of the market the company earnings perhaps come negative which causes a quick sell-side shock to the market in question.
So, that’s classic example of hearsay where traders interact with the market based on a rumour, of a possible acquisition or, perhaps very good earning reports when the fallacy turns out to be untrue then the market, of course, reacts differently, and then the trade is to sell the fact, and we have a picture here with our financial traders particularly I think equity traders, and I would like to just read the quote at the bottom indicative of high market participants can gear themselves, and trade-off hearsay, and rumours the good news sir is that Harris was able to sell off or, losing stock the bad news is that Simpson here bought them from Horace. So, there is certainly indicative of how market traders can involve themselves willy-nilly trading, off rumours I’m actually looking to profit, and speculate from such rumours but, then obviously the sell-side factor may come in when the story unwinds it should be worth noting in the forex markets buying the rumour, selling the fact is interpreted differently mainly because rumours are not as common on the vast number of variables affecting forex markets would make it very difficult for a rumour, to cause any real momentum or, movement in price. Now, unless the rumour, is an absolutely huge groundbreaking rumour, that will totally rearrange the forex markets it is very unlikely that it will cause sustained or, a very large shock to price in a forex markets given the liquidity, and given the depth of the forex markets indeed the forex equivalent to buy the rumour, sell the fact is to trade in anticipation of current news releases traders often see news releases as a way of making a lot of money very quickly. Now, it’s not always the case but, many traders do take very small positions in pre-emptive positions before news relations are about to occur an economic announcement like the month the monthly non-farm payrolls figure can call dramatic changes in asset prices, and many traders conduct fundamental analysis, and trade in anticipation of speculative prices by the time the news has been released many traders have traded based on the forecasted number, and are. Now, ready to sell a fact. So, let’s just rewind let’s just think about this for a moment we have perhaps a non-farm payrolls we believe it’s going to be very strong given the forecasts, and before the figure comes out we actually make a trade as a trader as a fundamental analysis under decision-making, and we’ve actually made a pre-emptive decision to enter the market before the figure we’re not guessing we’re using our fundamental at discussion of the markets in question, and positioning for the move itself. Now, the figure may come out I’m very positive indeed we’re on the right side of the market well that’s fantastic the market trades up, and we’re in a profitable position, what is our decision. Now, well obviously if we decided to many traders could have very well made the same speculative position we could sell or, trade for a nice profit, and then, what we could do is actually sell the fact we could look for a pullback in that price given that many traders may have expected or, the market has already pressed in this move to the upside, and we know you’re looking to sell the fact, and more often than not we actually do see very strong pullbacks in trades like this. Now, as it is our quest as fundamental analysts, and economic decision-makers to look for these trading, opportunities fundamentally, we must involve trading, behavioural finance into our decision-making. Now, why is that the case will be just discovered how rumours can affect the market, and how selling the fact then can be the reverse side of that trade on the trading, floor all action is based on news therefore rumours in the financial markets have become almost a daily phenomenon if we think of rumours as a form of behaviour we know that rumours are one of the oldest mass mediums of communication in the world, and that’s most certainly the case if you ever recall any old wife tale that you’ve probably heard, and it’s probably from hundreds of years ago, and that’s the rumour, mill that keeps these stories in motion that’s no different to all these rumours that circulate the financial markets only in much shorter timeframes we include this concept with the probability of making money it is easy to see then why rumours can have sudden such a sudden, and effective impression on financial markets, and that’s certainly the case imagine a rumour, that can circulate, and effectively give people information that they can make money from well that’s indicative that’s exactly, what happens in the financial markets, and why many market participants trade, and position themselves prior to the actual news event, and actually trading, the rumour, itself let’s observe how some markets can actually react to these rumours.
Now, I have a few setups here to go through we have the Nasdaq 100 which is the tech-heavy US equity index, and here we have some very inconsistent price action albeit to the upside there’s a lot of volatility, what is the story behind this rumour, well in early December 2017 CNN reported that FBI director James Comey was going to testify to Congress President Donald Trump was heavily involved in pre-election diplomacy with Russia that led to election rigging. Now, a very serious piece of news I’m outlining an implicating Donald Trump in election rigging if that’s the case I would assume the markets would would see a really strong sell-off but, again we’re just reacting to a rumour, here technically we see some weakness to the downside already when the news breaks this is the candle here where we see significant price action, and it really tells a story within that trading, period, what happens is the price action trades down to new lows a lot of weakness there but, within the rumour, within the real trading, day we see a full retracement almost two opening levels on the market closing just below those levels then we see a very bearish candle, and just thereafter with em somewhere indecision within, and the two to three day trading, period very technically significant if you actually look at that as technical analysts but, what does it tell us in terms of the rumour, mill, what does it tell us in terms of the story behind this well obviously as market participants how did we trade this we sell the rumour, when we hear the rumour, that is such a fundamental break, and in terms of scandal in terms of how we perceive the President of the United States, and how that affects equity prices we see a strong sell-off but, effectively we’re selling the rumour, here it’s a CNN report unconfirmed then as the story emerges at the end of the week President Trump it had emerged had simply pushed him to end the FAA investigation early but, was not implicated in any scandal, and of course, what we see is by the fact with some very strong, and trading, to the upside in the in the overall trend we see it just a trace I can use my epic pan here just to actually show this by the fact literally from our indecision candle here we see a very strong trend back to the upside as a by the fact sentiment really starts to dominate market interaction there in discussing trading, behavioural finance we can look towards a second example another fascinating rumour, here we have AM t-mobile in the US a telecommunications company, and some really an unquantifiable news about a possible merger with AT&T; one of the rivals on another big provider within the telecommunication sector in the United States we have on covering AT, and t-mobile discussing merger talks in an effort to better compete with competitors, what do we see with the price action we see a by the rumour, mill starting already we see a albeit from 61 around 61 to $63 jump within a very short period of time, what happens, and, what really unfolds within the story is the rumour, turns out to be true but, despite the talks both parties both parties very quickly filled to reach an agreement, and the merger feels, and then the sell the fact trade comes straight into the marketplace, and as those early just think about, what happens there in terms of trading, those early market speculators buying the rumour, albeit proof right the market direction is clearly not with them, and they have to get out of those positions that allows them to sell their positions, and it allows a lot of new sellers into the market to drive those prices down to new lows there early November at 2017 in terms of fundamental analysis on decision making how do we avoid market traps well we have a legendary British American investor, and professor here Benjamin Graham give us some fantastic insight through the market he has a very famous quote observation over many years has taught us that the chief losses to investors come from the purchase of low-quality securities at times of favourable business conditions another’s indicative of doing your due diligence as a fundamental analyst, and making those well informed decision making, and trades particularly when we are in times of very strong economic boom a lot of traders simply believe prices will still go up no matter, what the asset they decide to trade or, no matter, what the equity they decide to trade that is not the case certainly we do our due diligence for each particular fundamental trade in each particular asset our market in question as fundamental analyst it is essential we focus our decision-making on all fundamental news affecting the price all the assets we must never rely on any one variable, and that’s certainly the point we’d like to make there how do we avoid these necessary, and are these very common market drops, and particularly as beginner traders well a few points to look out for avoid trading, with the domani, and this is indicative of actually looking for good trading, opportunities as well but, we try, and trade with this smart money in reverse we do not want to be the last person buying a very strong move to the upside or, the last person selling a very honest, and weak move to the downside. So, avoid trying to jump in, and chase the markets, and obviously that leads on to a second point being the Dom only following in being the last, and rap to jump ship when the ship is going down is not the way the wisest trading, decision indeed always protect your trade with stop-loss no we will have plenty lessons on risk management coupled protection is absolutely key empowerment to your trading, success in terms of avoiding those market traps always protect your trade with the stop-loss do monitor the markets at all times, and a key point here is do not become a victim of overconfident analysis. So, again relating to the point of the webinar fundamental analysis, and decision making well obviously we need to monitor the markets another’s one downside I would certainly say two fundamental analysis that many traders do a lot of research a lot of to diligence in formulating trading, decisions, and because they put a lot of time, and research into the market they cannot take a looser way in the market proves them wrong. So, do not become a victim of overconfidence analysis, and always monitor the markets learn to combine the fundamental decision-making with technical decision making, and that lends itself to always trying to stack the odds in your favour as a fundamental, and technical trader to heighten your probability of successful outcome fundamentals, and timing absolutely a key aspect to financial trading, are given the fundamental analysis aims at having specific expertise in certain markets this knowledge factor will help the trader to enter the market at a more specific time period. Now, it’s a very difficult feat or, arm challenge that lies ahead but, it is indicative for some markets where your fundamental analysis on your expertise will heighten your probability or, heighten your skills in terms of timing, and entering the market. Now, that does sound difficult but, let me give you a few examples seasonality is the phenomenon that causes crop prices to behave in a relatively predictable manner year in, and year out. So, if you are a fundamental analyst, and you are studying perhaps the soft commodities, for example, wheat sugar a corn coffee commodities like these are very seasonal, and in relation to the weather on the nation which where they are grown. So, your analysis will take a lot of a fundamental bearing on the supply, and demand functions of those crops, and as a result of the seasonality factor, and underlying the the price of those assets changing year in, and year out, and obviously in terms of timing it will allow you to focus on a more specific time period to actually looking for those trading, opportunities microeconomic trends indicate consistent growth consistent economic growth and. So, equity investors activate a buy the dip mentality again if we know that we’re in a very strong macroeconomic trend to the upside current market conditions are strong we look for perhaps those market Corrections or, are those times when short term price fall is that they do send the markets a little lower, and those can provide us with buying opportunities fundamental buying opportunities certainly and would be the decision their bond yields react to interest rate changes, and in theory conform to a yield curve. Now, quite complicated generally bonds yield curve, and which simply means that they have different durations to the bone structure, and we’ll pick a bond to let’s say that the german bond has a two-year a 5-year a ten-year, and a 30-year am duration all together that will create a yield curve reflecting the yield on the price of the bond, and its rate of return on the bond itself. Now, in terms of actually trading, and looking for timing trades we know that, and these interest rate changes affect price, and affect yield, and when there is a divergence from the yield in one duration or, another it is to converge back into a nominal yield curve those can allow us fundamental trading, opportunities should we understand better the expertise in the bond markets indeed timing, and this is the mean point timing is always the most difficult, and sought-after skill for financial traders nuts absolutely the case if everyone had perfect timing skills we will all be making a lot of money in the financial markets knowing when exactly to enter the markets before prices move soon after would deliver the sharpest of trading, edges as we are not able to consistently do this we must focus our attention to stacking the odds in our favour both with fundamental knowledge of the markets on how they react to news events, and with technical insight into price movement itself. So, all combining we need to have a full combining fully broad-based approach to our fundamental analysis, and to allow well-informed decision makings that’s the real point, and to actually construct well the form decision makings when entering the markets. Now, that concludes our study on fundamental analysis, and decision-making volume 2 in this webinar we looked at fundamental analysis on the risk environment, and obviously that considers and takes a fully broad approach to risk off sentiment, and risk on sentiment in the market we discussed analysed economic data, and how they affect market prices we looked at buying the rumour, on selling in fact, and how they actually both provide very good trading, opportunities when we know that our fundamental analysis is not in sync with these opportunities we looked at behavioural finance in trading, and how that can lead to trading, opportunities as well, and moved on quite nicely there we looked at avoiding market traps to try, and avoid those very common pitfalls beginner traders all see occur when entering the financial markets, and then last but, not least we finish off with fundamental timing we can agree that timing is the most difficult skill when deciding to trade the financial markets but, with a keen eye to your fundamental analysis approach, and we look to have well-informed decision-making skills, and obviously out some technical analysis in there as well to stack the odds in our favour thank you very much for joining us on this instalment of courses on demand brought to you by forex tell academy we do hope to see you very soon bye for now.
[embed]https://youtu.be/jdnXoBFBwow[/embed]
Hello and, welcome to this latest edition of courses on demand brought to you by Forex Academy! In this course, we will be discussing fundamental
[embed]https://youtu.be/jdnXoBFBwow[/embed]
Hello and, welcome to this latest edition of courses on demand brought to you by Forex Academy! In this course, we will be discussing fundamental
Hello and, welcome to this latest edition of courses on demand brought to you by Forex Academy! In this course, we will be discussing fundamental analysis on decision-making. As always, there is, of course, inherent risk when, trading in the financial markets. So, just before we begin, please do take a moment to familiarise yourself with the following disclaimer.
In focusing our attention during this webinar to fundamental analysis what we aim to outline is the foundation of fundamental analysis, why is it different from technical analysis, and why is it such a prominent school of thought, in terms of financial trading. With that, we will be looking at quantitative versus qualitative data. We will be assessing true market reverse on those market drivers specifically the effect price over the long-term that leads us nicely on to assessing economic data as, well as, those large non economic events that totally changed the macroeconomic account totally changed the macroeconomic environment that the market is experiencing and, that obviously leads us nicely into looking at market positioning how do the large financial institutions actually position themselves in the market looking for a long-term price profit first and, foremost let’s look at the foundation of fundamental analysis global asset prices move as, a direct result from what is happening in the larger economy depending on the asset class or market, the fundamental trader must acquire a unique level of knowledge specific to the market to be able to develop an edge a trading edge and, obviously then trade effectively the characteristics of fundamental trading can also be very different depending on the asset class forex trading requires a wealth of knowledge on macro economics commodity trading requires complex reasoning of the supply and, demand variables of that commodity and, equity traders must have the know-how to fundamentally analyse price earnings ratios growth projections and, company performance in relation to competition. So, really no matter the scenario knowledge is power in better understanding the overall economy, then we can achieve a better awareness of how asset prices will move with economic data. So, let’s actually consider a few of those economic and, data examples we have sustained economic growth how does that affect equity prices well of course we’ll see equity prices rise over the long-term and, as, the macroeconomy is performing well we will see more jobs come into the economy job creation will see more consumer spending and, we’ll see that result into strengthening the equity prices over the medium to long-term rising inflation perhaps, what effect would raise an inflation have on the gold market? Well, the hedge against inflation is one of the traditional motors behind gold investment and, really is to protect capital erosion against the rising cost of goods and, services. The investment community often floods the precious metal market in search for a store of value. So, if we just think about that for a moment, we know gold is a store of value. We know that rising inflation relates to long-term increases in and, the price of goods or services. So, if we want to protect capital from that price increase of currency our goods and, services, what we love to do is actually invest in something that can store that value and, hence gold. So, we’ll see prices rise in gold rising oil prices how might this effect perhaps the currency let’s look at this example the US Canadian dollar well when prices for a key export increase the domestic currency of economic exporters will also increase. Now, the Canadian dollar, otherwise known as, the Lunia is quite significant in terms of oil prices. The loonie was strengthened when oil prices rise as oil is a major export product for Canada. So, we will generally see and, strengthening oil prices and, a relative strengthening in the Canadian dollar or otherwise as, expressed in this small chart downside in the US dollar but that’s really representative strength in the Canadian dollar escalating conflict in the Middle East and, oil well this is much more of a simple one obviously we will see prices go up as, there are fears that the supply mechanism for oil from the Middle East may be compromised will see oil prices rise as, we move on discussing fundamental analysis of course analysis foundation we cannot and, forget legendary investor Warren Buffett who is a key investor in and, assets that coca-cola he owns his own investment firm brochure half the way I’m really his idea established through global investing communities and, and his knowledge is absolutely fantastic indeed the aim of the fundamental trader is to assess value. So, he’s a real value trader if, we properly assess value then surely we can develop our decision-making skills to identify promising trading opportunities and, that’s it that’s really the us the asset of a good fundamental trader to properly assess our value as, a result of the fundamental research.
So, a good quote from a legendary investor Warren Buffett is it’s far better to buy a wonderful company a fair price than a fair company a wonderful price that’s absolutely the case as we assess fundamental analysis on decision making we must look at quantitative versus qualitative data. Now, considering the distinction between the two types of data we typically define them by referring to data as quantitative if, it is numerical in form and, qualitative when, the data has a more theoretical basis. Now, why is that the case? Well, qualitative data is more concerned with understanding human behavior from the informant’s perspective and, they formed is simply ourselves as, economic agents and, traders. It assumes a dynamic and, negotiated reality. So, there’s a level of discretion to understanding our qualitative approach in contrast quantitative data is concerned with discovering facts about social fun it assumes a fixed and, measurable reality in other words the fixed immeasurable reality is the raw data the numbers that we try to derive social phenomena and, extract thought from that with the method death data are collected through participation observation in interviews data are analysed by themes from descriptions by informants again that’s simply us unreported in the language of the informant in contrast their quantitative data are collected through measuring things data are analysed through numerical comparisons and, statistical inferences and, data are reported through that statistical analysis. So, we use with quantitative data the raw data to formulate charts and, graphs to give us an overall picture statistically and, to look for social phenomena and, obviously help trading decisions fundamental trading is considered to be more a qualitative approach qualitative research is multi-method and, focus involving an interpretive naturalistic approach to matter this means a qualitative researchers study things in their natural settings attempting to make sense of or interpret phenomena in terms of the meanings people bring to them research following a qualitative approaches explore exploratory and, seeks to explain how and, why a particular market is behaving and, therefore fundamental traders often based their trade decisions on a question of value, what does that mean for our trade decisions? Well if, research shows that an asset is undervalued these traders will look for buying opportunities if, on the other hand research suggests and, us is overvalued these traders will look for selling opportunities technical trading on the other hand is considered to be more a quantitative approach quantitative research collects data in numerical form which is then subjected to statistical analysis the data is then measured to construct graphs and, charts to physically represent patterns or ideas that provide statistical reasoning as the research is used to test a theory it aims to ultimately support or reject the hypothesis. So, as, this approach tests raw data it can be applied to many different environments and, that’s a huge advantage to using this quantitative approach and, actually deriving reasoning from the raw data across a many different many different fields or industries data analysis helps us turn statistical data into useful information to help with decision making and, therefore a quantitative research is more focused on our objectivity and, that would certainly be the main reason why we would say quantitative approach or quantitative trading, it has more of an essence of technical training because as, technical traders we want to become very objective if, we look towards our technical indicators to take Bollinger Bands as, an example it uses a statistical model across a variation from the mean and, follows price action to look for objective trading decisions as, such. So, certainly the case technical trading is considered to be much more of a quantitative approach that’s like true market drivers and, assess how those market drivers really affect price over the long term market trends are shaped by larger economic factors. So, first and, foremost we can look at government influence higher kind of government influence and, the financial markets and, really drive prices over the long term by increasing or decreasing interest rates the government or the US Federal Reserve in the US there can slow or accelerate growth. So, this is called monetary policy. So, actually by using government Paul say they can manipulate the financial markets they can actually manipulate the price of assets and, actually our fundamental themes in including rates of unemployment and, consumer spending try and, slow or are if, the objective is to accelerate growth they can do that via monetary policy the government can attempt to ease unemployment and, stabilise prices by increasing our contracting spending is called fiscal policy. So, very real and, events social events are social constructs within an economy can be changed I’m manipulated by government influence and, that can lead to long term price drives and, particularly in the equity indices on in something like a domestic currency cup and, flow. Now, I would couple the flow have a huge impact on market price and, really drive prices over the long term the more money that leaves the country the weaker the country’s economy and, currency becomes stronger in countries that export more than they import, keep the economies generally quite strong and, we can see the level of capital flow between nations we have certain agreements. Now, after to be one there it’s seen a little bit of – on discussion in the news at the moment certainly these trade agreements and, levels of capital flow as, they moved from contrary through contrary affect exports and, imports and, have an overall economic effect on the domestic economies speculation on expectation the direction consumers investors and, politicians believe the economy is headed impacts how we act today another’s most certainly the case the sentiment indicators gauge, what certain groups think the economy is doing. So, this is one example where we can see actual speculation and, expectation almost become a self-fulfilling prophecy whether it’s the phenomenal institution or investor or a top-level politician not and, that believes that prices aren’t stabilising and, there needs to be some real government change that can actually cause and, a self-fulfilling prophecy when, the government comes together to actually interact change and, actually and, confirm policy change towards long term price movement under our level of consumers their supply and, demand and, obviously the key function of supply and, demand will and, totally dominate many assets particularly the commodity markets supply and, demand for products currencies and, other investments items in demand with shrinking suppliers will see their prices rise if, supply outpace its demand prices will fall and, it’s all was you know a balancing act between supply and, demand to actually interact with the market forces to drive the market and, to formulate ,what the market sees as, fair value at that given time as, mentioned there particularly in asset classes such as, commodities the oil market soft commodities like wheat sugar they are all very much supply and, demand driven in terms of their price and, that’s certainly a true market driver over the short medium and, long term for those asset classes economic data economic data is important as, it reveals a true picture of an economy’s condition it allows traders to understand how economy stands in respect to others and, can help us determine whether monetary and, fiscal policy and, other financial programs have been successful.
So, why is it so important in terms of decision-making and, fundamental analysis to understand economic data? Well because we need to understand the overall macroeconomic picture of a domestic economy and, how those economic data releases are actually subjected to and, discretion or are subjected to a level of interpretation by market participants in keeping with that we look at the business cycle economic data is particularly important to us as, can indicate how the economy is performing at those various stages of the business cycle. So, most certainly, what would be more significant is a huge jump in risk in and, the rate of unemployment, for example, a huge and, decrease sorry in the rate of unemployment would be more suitable weakened in times of recession as, opposed to a time of boom where unemployment is very high. So, that will certainly drive the market in very different scenarios and, where you will see economic data surface in the market and, upon that announcement prices will move and, according to how the market interprets the data at the given time throughout the business cycle. Now, when, trading on economic data we must ensure that we know exactly ,what we are doing in order to trade on this economic data we must understand how the release data will fundamentally affect the market in question the data very much depends on the market we are interested in trading and, that’s very important to notice I’ll give you a very simple example if we are looking to trade the crude oil inventories we will certainly be looking to trade the oil market as opposed to a Forex pair based on a huge increase or decrease in supply in those crude oil inventories. So, it is indicative of which asset class or market that we are choosing to trade economic data often has a very different effect in the short term, not in the long term. So, do be aware of that when, trading the financial markets guys often ,what you can see is a short term burst to one side the market can react quite irrationally we often see a quick burst perhaps to the downside in price movement and, as, market participants come together to formulate unreason behind fundamentally why the market is and, is pricing in the news that way we can see a price is reversed in the more medium to long term and, actually, in this case, I create new highs that and, form a bullish trend. So, mortgage can react irrationally to economic data and, often miss judge or miss price market fundamentals often take time to affect price change and, create trends let’s have a look at non economic events they are they can be quite significant in terms of fundamental trading under effect on the markets fundamental trading lends itself to also interpreting how non economic events can affect price analysis most often be carried out individually for each particular asset, what non-economic events affect price and, decision making well perhaps internal developments within a company. So, if, we look at a stock or our perhaps stock market equity like Google very famous indeed perhaps there’s a very concerning internal development and, considering profit projections and, that have not been released to the market but when, the market gets wind of of this projection these developments cause very sure uncertain price movement for the particular market in question we look at world events again a non-economic event but certainly global world events such as, war civil rest and, natural disaster often we see in the United States and, a hurricane season can have a devastating effect on some of those financial assets as, well and, hype, of course, is one not to be a misgiving hype is very important in terms of sentimental analysis and, if, we look across ,what has happened there him over the last six months certainly considering Bitcoin and, the frantic price rise of Bitcoin we can see that hype has very much a big factor a big role to play in price movement in the cryptocurrency let’s look at the case study here for a non economic event we have a non if, you’re familiar with this case it’s an absolutely fascinating story Enron 2001 a company was an energy corporation in America and, the commodities company once self-proclaiming to be the largest energy company in the world and, Ron eventually filed her back home to see bankruptcy following a sustained institutionalized accounting fraud that inflated share prices for several years absolutely scandalous the aftermath of the Enron scandal destroyed confidence in corporate America and, led to a huge retreat of capital from US equities particularly it may be mentioned in the energy sector. So, obviously as, an energy company this destructive news can filter its way in through the sectors and, obviously cause very negative long-term price action indeed although, the scandal was a huge shock to the market fundamental traders knew this non-economic event would have hugely negative effects for months to come we have a quote here from a Robert Miller who is heavily involved in the case the collapse of Enron was devastating to tens of thousands of people and, shook the public’s confidence in corporate America can you think obviously why a case like this could really have such an effect on equity investment in America particularly in perhaps an energy sector or utility sector investments such a huge scandal obviously it’s you know trading equities has as, much to do with confidence and, in ownership of shares as, well as, price performance. So, it had a devastating effect and, just goes to show higher non-economic singular raised at natural event like this within and, within one particular company can have such a negative effect in the marketplace that leads us all nicely to market positioning ,what a positioning is all about the big players the big traders in the marketplace that are looking for these big trades they don’t necessarily involve themselves with short-term scalping or our very short positions in the marketplace like many traders do, what they look to do is particularly hedge funds develop a very consistent very well-thought-out fundamental trade decisions based on a lot of cute fundamental analysis on decision making for many large market participants such as, finance institutions and, hedge funds the very essence of the training will target long term price changes as, a result of changing macroeconomic variables their decisions are thus a result a very carefully conducted fundamental analysis.
So, this can help us as, well if, we know a large institutional is positioning itself within the market place if, we have a feeling or a sense or perhaps news that would dictate with which direction they’re looking to trade that will certainly aid us in our decision as, well in the peeler to large news source institutions will build large long or short positions in the marketplace the objective is either for protection from risk or from profit obviously profit being a main objective for long term fundamental price change why would they look to perhaps protect themselves from risk? Well if they perhaps know that there’s going to be a large appreciation or depreciation in the currency they may have a lot of other assets denominated in that currency and, the objective, therefore, could be to position in the market to actually look to hedge that risk within the currency markets themselves. So, with many different objectives there they look to take these huge positions in the market it is often these large market participants that cause large swings and, volatility when, realities do not meet the market expectations and, that’s absolutely the case ,what we’ll do is actually look at a few examples here to explain ,what we mean when, we see market positioning go wrong here we have the breaks a note and, this is the cable or pound US dollar market obviously very significant in terms of a world non-economic event but it was a huge piece of news a huge shock to the market at the time and, obviously we can see how the currency itself reacted ,what we see is fear within this price charting moving down we see a little bit of a price channel form with a support level of resistance however, that fear leading up to fear and, uncertainty leading up to the week’s just before these are daily comment sticks the week before and, the actual decision shows that there is some fear and, uncertainty and, some money coming out of sterling in relation to the dollar ,what we then see is market positioning ,what I do remember when, we before we’ve seen a lot of fundamental analysts coming out with her and, forecasts to say it was more or less a ton and, oyster dealer there was no way and, the UK would be leaving the European Union and, we see this reflected in the market price market positioning then hits the bottom with many green Commerce in a rope suggesting that this has been priced in these large market participants are really pricing in and, a stayer vote that the UK will most certainly stay within the European Union and, that’s reflected as, the price trades up within this week leading up to the decision itself then ,what we see is the bracelet leave vote a massive shock to the market we see some serious volatility to the upside and, downside and, then the currency actually trades down the whole way from one around 147 to 133 within one day trading an absolutely huge percentage loss in the overall price of sterling a huge shock to the market we can see that it’s technically very significant given high market positions we’re actually giving up for a stayer vote they were all proved wrong well that’s inevitably if, we look closer at this price actually ,what we see within the price action the caramel slip structure here tells us a fascinating story of high market participants began to prematurely price in the expectation of a Bryce it’s their vote heavy long position accumulated in the pound US dollar almost a week before the fundamental decision was made. So, they’re trying to position they see a very strong probability that the UK will obviously vote to stay and, Sterling value will increase over the medium to long term certainly that does not happen they are proved wrong and, they suffer the consequences. So, a fantastic example to see how market positioning, particularly with expectation and, a vs. result, actually affects the market again market positioning we look at the U.S. presidential election this is the S 500 ,what we can see here is uncertainty leading up to the November and, presidential election decision in the week leading up to the presidential decision market participants prepare for uncertainty by unwinding long equity position. So, there’s just a level of uncertainty in the markets and, in terms of a risk on risk off approach and, ,what she’ll be discussing with many of the fundamental analysis webinars we can see money coming out of US equities and, really positions on winding ons the market rates turn to new lows there then when, we see within this little green area in the days preceding the election market participants begin to position for an expected Democratic win almost like the Braves did vote it was am being starting to be priced in that Hillary Clinton was am a head in the polls there was no way at all Trump would be elected by the US populace and, that the market really starts a position for the higher probability trades evidently ,what we see there in the market experience is large volatility we can see the candlestick there just and, I think it’s the ninth of November that date indeed we can see the Trump win causes severe volatility to the US equity market but ,what it does actually is eventually lead to a bullish trend how’s the market formulates where prices will go ,what that actually means Trump selection ,what it means for the overall economy obviously he has huge reforms and, has implemented his reforms in terms of tax ,what that means in terms of us speculation on equity prices and, we see a large trend start to path the way from that day indeed and, that concludes our study of fundamental analysis on decision making with our webinar outline there we should at this stage understand that the foundation of fundamental analysis why it is so, key in terms of fundamentally analysing the financial markets and, deriving a basis of price for value we should understand quantitative versus qualitative data and, the difference really that quantitative is more numerically focused and, qualitative is a human behavioural approach to assessing data we looked at true market reverse and, particularly assess things like government influence supply and, demand functions and, how they can affect price we looked at economic data and, non-economic events and, see how those news events really play out in the market in terms of beans objectively this cost three market participants on how those market participants react in accordance to their sentiment on those data forms then we looked at market positioning and, we can see how those large finance institutions really gear up for long the big term trades the macroeconomic trades and, when, they are wrong high price can be very volatile and, cause massive shocks to the markets indeed thank you very much for joining us on this latest instalment of courses on demand by Forrester Academy we do hope to see you very soon bye for now!
[embed]https://youtu.be/MvFkOIVZEmA[/embed]
The following presentation is brought to you as a courtesy of forex Academy!This is part of our service course on demand, if you find
[embed]https://youtu.be/MvFkOIVZEmA[/embed]
The following presentation is brought to you as a courtesy of forex Academy!This is part of our service course on demand, if you find
The following presentation is brought to you as a courtesy of forex Academy!This is part of our service course on demand, if you find this interesting and wish to be updated on new releases please subscribe to our YouTube channel, or join our community at Forex dot Academy and receive all of our services for free! You’re like is also highly appreciated, enjoy!
In terms of fundamental analysis on decision-making how do we avoid market traps? well we have a legendary British American investor and professor here Benjamin Graham. He will give us some fantastic insight through the market, he has a very famous quote “observation over many years has taught us that the chief losses to investors come from the purchase of low-quality securities our times of favorable business conditions”.
Another’s indicative of doing your due diligence. As a fundamental analyst and making those well informed decision making, and trades particularly when we are in times of very strong economic boom. A lot of traders simply believe prices will still go up, no matter what the asset they decide to trade, or no matter what the equity they decide to trade. That is not the case, certainly we do our due diligence for each particular fundamental trade, in each particular asset. Our market in question as fundamental analysts, it is essential we focus our decision-making, on all fundamental news affecting the price of the asset. We must never rely on any one variable, and that’s certainly the point we’d like to make there, how do we avoid these necessary and are these very common market traps? Particularly as beginner traders, well a few points to look out for, avoid trading with the dumb money. And this is indicative of actually looking for good trading opportunities as well, but we try and trade with this smart money in reverse. We do not want to be the last person buying a very strong move to the upside, or the last person selling a very honest and weak move to the downside.
So avoid trying to jump in and chase the markets, and obviously that leads on to a second point, being the dumb money. Being the last rat to jump ship when the ship is going down, is not the wisest trading decision. Indeed always protect your trade with the stop-loss. Now we will have plenty of lessons on risk management coupled, protection is absolutely key empowerment to your trading success in terms of avoiding those market traps. Always protect your trade with the stop-loss, do monitor the markets at all times and a key point here is do not become a victim of overconfident analysis. So again relating to the point of the webinar, fundamental analysis and decision making, well obviously we need to monitor the markets and that is one downside. I would certainly say true fundamental analysis, do a lot of research, a lot of due diligence in formulating trading decisions. And because they put a lot of time and research into the market they cannot take a looser way in the market proves them wrong. So do not become a victim of overconfident analysis and always monitor the markets, learn to combine the fundamental decision-making with technical decision-making. That lends itself to always trying to stack the odds in your favour as a fundamental and technical trader, to heighten your probability of successful outcome.
Weekly Macroeconomic Outlook (30th July – 3th August)
Last week was a really positive week for the markets.
Firstly, because of the Junker – Trump meeting
Strong quarterly results and
Weekly Macroeconomic Outlook (30th July – 3th August)
Last week was a really positive week for the markets.
Firstly, because of the Junker – Trump meeting
Strong quarterly results and
Weekly Macroeconomic Outlook (30th July – 3th August)
Last week was a really positive week for the markets.
Firstly, because of the Junker – Trump meeting
Strong quarterly results and macroeconomics inidcators
Mostly the American GDP which reached the 4.1% growth
Also, there was the ECB meeting where it was confirmed what it was previously stated in the previous meeting
No modifications
However, it gave a soft message and reiterated the importance of an accommodative monetary policy
This week, probably we’ll have again a positive tone in the markets.
As trade wars concerns have reduced
Furthermore it is a really intense week in terms of:
Quarterly results
Macroeconomic Indicators
Central Banks Meetings
Regarding corporate results, there are still a lot of companies left to publish
Apple, Tesla, BNP Paribas…
So far, in United States, 245 companies have already published
The average growth in EPS has been around 23% and 86% of the companies have break expectations
Moving to Central Banks, this week is going to be really intense too
1st reference will be the FED with no modifications expected
Around mid-July Powell stated that two more rises in interest rates are expected in September and December in 2018 and three more in 2019
2nd reference is the RBI (Reserve Bank of India) which, in this case, could really rise interest rates to 6.5%
It would be the second rise this year
3rd reference is the BOE which is forecasted to rise the interest rates to 0.75%
Important to bear in mind that inflation has peaked to 2.4% and labour costs have also increased
4rd reference is the Central Bank of Japan which is expected to continue with the same monetary policy however it can give a harder message in terms of future expectations
Finally, it is also a very intense week in macroeconomic indicators
Forecasted results are rather positive
Wrapping all these factors up, it is expected a bullish week in the markets, especially indexes. Markets look good after a reduction in concerns on trade wars and protectionism plus solid quarterly results and macroeconomic indicators.
Macroeconomic Update – Weekly Outlook (July 23 – 27)
It is expected from the markets to follow the results from the quarterly reports.
– This week, one-third of the companies
Macroeconomic Update – Weekly Outlook (July 23 – 27)
It is expected from the markets to follow the results from the quarterly reports.
– This week, one-third of the companies
Macroeconomic Update – Weekly Outlook (July 23 – 27)
It is expected from the markets to follow the results from the quarterly reports.
– This week, one-third of the companies from the S&P500 is expected to report results.
Some assumptions should be considered:
Results should be strong
led by the energy sector with a 20% growth with sales representing 8%
Oil companies, due to increase in oil prices, add almost 3 points of inter-annual growth
Industrials and technology should be solid too, with an estimated growth of over 20% and 30% respectively
Even though results themselves are strong, the impact of the tax reform will prolong this strength two quarters more until next year, when results will start to normalize.
Even at a global level, it will not be as high, in Europe, results will grow by 7.5% and in Emerging Markets by 15%.
In Europe, even though results were downgraded by 2%, the effect of a strong US Dollar can generate some surprise.
Thus, hopefully this will put trade wars in the background. Although, it is hard with what measure Tump will come up it is forecasted to reach an agreement before November.
Also, the measure taken by Trump to start using the oil reserves will lower oil prices that will reduce inflation concerns, creating a positive impact
Hence, recommendation for the week and summer period, with the Eurostoxx trading in a range of 400 points it will be key to pay attention during the next weeks in case the index approached the bottom of this range when it will create some investing opportunity.
Macroeconomic Update – Weekly Outlook (July 23 – 27)
Markets closed with positive returns since they had a positive start due to the strong quarterly results reported by companies along
Macroeconomic Update – Weekly Outlook (July 23 – 27)
Markets closed with positive returns since they had a positive start due to the strong quarterly results reported by companies along
Macroeconomic Update – Weekly Outlook (July 23 – 27)
Markets closed with positive returns since they had a positive start due to the strong quarterly results reported by companies along with the optimistic tine by Powell, president of the Fed.
However, it started losing momentum as Trump stated he was considering in implementing new tariffs to Chinese goods increasing the concerns on trade wars and protectionism
o This also led to the Yuan to depreciate to new low levels
So, this contrast between a solid earnings report from companies and the tension between commercial policies will guide the markets next week.
Starting with the macroeconomic indicators, they are forecasted to have a positive tone this week.
o Among the main indicators in Europe, PMI & IFO are expected to be lower than the previous months but will hold in good levels
On Thursday, it will be the meeting of the ECB which is expected just be transition meeting confirming the end of the conventional program of asset purchases at the end of 2018
Regarding the United States
o On Friday, GDP of the second quarter will be released which is expected to reach 4%
Hence, this acceleration will confirm the expansive cycle
Another fact that should support the markets is the quarterly results making this week possibly the year
o 180 companies are reporting earnings this week, and the outlook is positive
So far, regarding the ones that already have reported, have averaged a earnings growth of 20,8%, slightly above expectations
Due to these strong fundamentals both from the macro perspective and from the earnings report, trade tensions could be placed in the background.
Nevertheless, on Wednesday Yunker and Trump are meeting.
o Yunker will meet with some proposals regarding the trade deals and tariffs on automobiles
o It will provide some hints on what is the outlook regarding the trade deals of United States with the rest
Hence, it is a week to be patient and hold the long positions in the markets since the macro and fundamentals remain strong and positive.
Macroeconomic Outlook
Summer is in focus now, and with it, the attention on the multiple factors that will condition whether it will be
Weekly Update (July 9th – 13th)
Macroeconomic Outlook
Summer is in focus now, and with it, the attention on the multiple factors that will condition whether it will be
Weekly Update (July 9th – 13th)
Macroeconomic Outlook
Summer is in focus now, and with it, the attention on the multiple factors that will condition whether it will be a good summer for the markets or a bad one.
Nevertheless, all these factors that unnerve investors are reaching a final outcome.
Last week, the markets performed better as the matters that block them improved slightly.
European policy and German politics have reached an outcome.
Then oil, which is still a problem.
And protectionism which is something more bilateral between China and USA rather than global.
When the market realises that, it will care less about it.
We were expecting a hard summer, however, the markets are starting to react in a positive way sooner than expected.
This week has three main references:
On Tuesday, the German ZEW Economic Sentiment which is expected to be negative again for the fourth month in a row.
It is relevant enough to watch out for but nothing especially important as the overall German economy has been increasing recently at 2.5% in the last trimester, which is really good.
On Thursday, there is US Core CPI which is forecasted to rebound from 2,2 to 2,3. This issue depends mostly on oil prices.
Over-inflated data may hurt bonds, nevertheless structurally it will not be a real matter which could be solved in 2 or 3 months.
And the third reference is American corporate results which start, among the big ones, on Tuesday with Pepsi Co.
And on Friday, three big banks publish results
Citi / +23%
JP Morgan / +30%
Wells Fargo / +11% and with some legal problems
They are expected to be really solid which will support markets.
Hence, this week looks like where a more positive sentiment towards markets can be consolidated.
German political turmoil looks clearer than before.
Even though it will come back in October with the elections.
Regarding oil, American pressures regarding an increase in production are graspable which will lead to Saudi Arabia producing more, and reducing oil prices.
This will reduce inflation related concerns.
Then, there is the protectionism which is mostly between the USA and China, being something more local rather than something global.
So that, when the market realises that along with strong corporate results, a good economic growth and a lot of liquidity, it will lead to an overall favourable economic cycle which will support the markets.
On the first day of the 3rd quarter, the financial markets remained heavily volatile in the wake of trade war sentiments. For instance, gold slid more than 1% to its
On the first day of the 3rd quarter, the financial markets remained heavily volatile in the wake of trade war sentiments. For instance, gold slid more than 1% to its
On the first day of the 3rd quarter, the financial markets remained heavily volatile in the wake of trade war sentiments. For instance, gold slid more than 1% to its lowest ahead of the U.S. holiday, as the dollar recovered. Whereas, the indices inducing SPX, DAX and Nikkei plunged due to ongoing U.S.-European Union trade war. In addition to this, the July 6 trade war tensions have helped the risk sentiment to stay off.
Later this week, we have another series of high impact economic events coming out of the market. Let’s take a quick look.
Top Economic Events to Trade
AUD – Building Approvals m/m – 1:30 (GMT)
AUD – RBA Rate Statement – 4:30 (GMT)
AUD – Cash Rate – 4:30 (GMT)
GBP – Construction PMI – 8:30 (GMT)
Gold – XAU/USD – Daily Outlook
The precious metal gold is trading at 1242, down 11.60 points and 0.92% on Monday. One of the main reasons behind the bearish trend is the stronger dollar.
The greenback continued its ascent as traders boosted their bets that the U.S. administration would prove better in a trade war as compared to some of its trading rivals. The U.S. tariffs on $34 billion worth of Chinese imported goods are due for July 6.
Support Resistance1240.83 1247.171238.87 1249.131235.7 1252.3Key Trading Level: 1244
SPX – S&P500- Technical Outlook
SPX is trading bullish at 2727, up 5.75 points and 0.21%. On the 4- hour chart, the bullish trendline is extending a support near 2679. While the resistance predominates at 2732 and 2745 today. The main trend is up as per the daily swing chart. But, momentum is trending lower. A trade through 2679.25 will convert the main trend (bullish) into the bearish bias.
Overall, the main trading range of SPX is 2595 to 2796. The index is currently testing the upper or 50% level of this range at 2795.75.
Support Resistance2705.72 2719.322701.52 2723.522694.72 2730.32Key Trading Level: 2712.52
It was quite a busy day with series of economic events from global economies. The greenback advanced as trade-related tensions eased after the U.S. administration relaxed its approach to Chinese
It was quite a busy day with series of economic events from global economies. The greenback advanced as trade-related tensions eased after the U.S. administration relaxed its approach to Chinese
It was quite a busy day with series of economic events from global economies. The greenback advanced as trade-related tensions eased after the U.S. administration relaxed its approach to Chinese investment. Most of its buying came on the Euro and the Swiss Franc. Whereas, gold prices hovered on top of 6 months lows as traders continuing to shun the yellow-metal despite signs of a reversal in risk sentiment. The robust greenback continues to keep a lid on the precious metals bullish trend.
S&P 500 – Daily Outlook
The New York stock market index SPX is trading at 2706, down -22.75 points and -0.82%. S&P500 is facing a strong support near 2700, a double bottom level. The violation of 2700 can lead SPX towards 2679. The moving averages are suggesting a bearish bias of investors. The RSI and Stochastics have entered the oversold zone. Let’s see if SPX gets a chance to pull back above 2700.
Support Resistance2706 2735.562696.86 2744.72682.08 2759.48Key Trading Level: 2720.78
Gold – XAU/USD – Daily Outlook
Gold traded in a tight range of 1252 – 1261, troubled to manoeuvre off session lows because the greenback remained supported despite a small reversal in intraday risk sentiment, helping safe-haven currencies trim their losses against the dollar.
Technical indicators signal gold will continue to drop. For instance, gold has already violated the 1252 support level which is likely to work as a resistance now. Moreover, the moving averages also suggest a bearish bias of traders.
Support Resistance1256.9 1266.841253.84 1269.91248.87 1274.87Key Trading Level: 1261.87
Investors are advised to monitor the U.S. Final GDP q/q in order to capture further movements in the dollar index, gold, and the U.S. stocks.
Two main factors need to be considered initially this week-
– Outcome in Italy
o More expected
– Outcome in Spain
o
Weekly Update (June 4th – 10th)
Macroeconomic Outlook
Two main factors need to be considered initially this week-
– Outcome in Italy
o More expected
– Outcome in Spain
o
Weekly Update (June 4th – 10th)
Macroeconomic Outlook
Two main factors need to be considered initially this week-
– Outcome in Italy
o More expected
– Outcome in Spain
o Less likely to happen
The bond spreads of Spain and Italy have had a notable increase over the German ones
However, the midterm elections in the USA are more worrying, which are taking place in November.
– Which means Trump will put more pressure on trade with other countries.
o This lead to uncertainty and lower growth in global terms
o However, also they are useful to clarify ideas
For now, we can rely on the rebound that happened on Friday, due to two things that need to happen this week.
The Italian Government should be formed and avoid other elections which can be interpreted as a danger to the Euro.
In Spain, the budget program should go forward, and there should not be any surprise from the government.
Anyway, we cannot rely on this too much as the protectionism will still grow. In general terms, the investment strategy should not change.
– We should be still exposed to markets
o We still are within an expansive economic cycle
– We elevate the perspective looking to 2019
o Due to the current change of context to a worst one, returns will be slightly lower but that will not change the overall direction of the markets
Technical Outlook
US Dollar Index
After taking profits, the US Dollar Index is hanging between the resistance it just touched and the support it previously broke. So, for now, we´ll wait until it breaks one of them and position in the right direction.
EURUSD
EURUSD remains in the green, and there is not any support or resistance that signals a change of trend. Hence, for now, we remain short.
GBPUSD
GBPUSD is hanging on a key after breaking the first resistance. Now, it is facing the second monthly resistance. In case it does not break it we´ll remain short. However, if it closes above the bearish trendline that is now facing, we might consider changing the strategy to a more bullish position.
USDJPY
It remains in the same situation as we left it. It is going sideways between resistances and supports. Recently it has touched the support confirming it and possibly now it can go up to the resistance. However, for now, the movements are too small to care about them, so we remain on the side, looking at how it behaves and waiting for a clear breakout.
CRUDE OIL
US Oil just broke a strong monthly support which creates a strong entry to join the recently formed bearish trend. We captured the initial movement and now can be a good opportunity to join again after this last breakout of a resistance.
DAX
As analysed in the macroeconomic outlook, the fundamentals remain solid and the technicals too. If it does not close below the support, it is now facing we´ll remain as bullish as we are now. However, if it breaks the support and retests it, we might change to short, but for now, everything is in place for a low but positive uptrend.
The past week was mainly influenced by two relevant factors:
Oil Price
o It has reached the benchmark of $80 per barrel
o It has raised concerns
Macroeconomic Outlook
The past week was mainly influenced by two relevant factors:
Oil Price
o It has reached the benchmark of $80 per barrel
o It has raised concerns
Macroeconomic Outlook
The past week was mainly influenced by two relevant factors:
Oil Price
o It has reached the benchmark of $80 per barrel
o It has raised concerns about inflation
Ten-year Treasury Yield is at 3.07
Italian Elections
o Populist coalition between the 5 Star Movement and The League
This has increased the difference between Italian’s debt to the German one by 155 basis points
Depreciation of the Euro against the dollar
So how can these factors influence this week
It is reasonable to consider a positive impact rather than a negative one
o Italian coalition creates further stability to other outcomes
Such as Italy leaving the Euro
o Oil price can still rise due to tension in the Arabic region
It can prompt more concerns about inflation
However, it is unlikely to change expectations in the monetary policy in central banks
Which will support markets
$80 barrel is a reasonable price within an expansive economic cycle
Regarding macro indicators, to be published in the coming week:
PMI in the eurozone
o It will consolidate the current slower growth compared to the beginning of the year, however, it will show guidance towards a bigger upcoming economic cycle
The economic cycle will be the clear guidance toward a positive environment
The outlook is still positive for the markets which are facing the second semester in a good context of moderate globalisation
Technical Outlook
US Dollar Index
Monthly resistance has been broken leaving a space until the next one. Hence, it is confirming the continuation of a solid bullish trend through the breakout of this resistance, which leaves space to capture until the next one. A retest may happen to confirm the breakout. In that case, it would be reasonable to double the trade.
EURUSD
After breaking and retesting the last weekly resistance, it has confirmed the strength of this bearish trend. It recently touched the profit target, and the strength of the trend shows it has more downturn potential in the coming days. There are no significant resistances ahead which leave more space for another bearish position.
GBPUSD
After a strong bearish trend, GBPUSD may find a turning point in the coming days, thanks to the monthly resistances ahead. They are significantly strong and may confirm a bounce back.
USDJPY
USDJY is moving according to our expectations, and it is about to complete the bullish run. When it reaches its benchmarks, which is the monthly resistance ahead, it will be possible to consider a turning back point on the chart.
Crude Oil
After continuing the bullish trend, it has again touched bullish resistance which gives a reason to still believe in an upcoming downturn. For now, under normal conditions, it would be good to hold, and in case it breaks above the resistance the position would be closed.
DAX
With no significant resistances ahead and after strongly breaking the previous ones, DAX has a clear bullish route to complete until the next significant resistance. For now, holding the position would be the right decision, since both chart and fundamentals confirm a positive outlook for the markets.
The U.S. stock market index SPX is trading at 2,631.25, down -4.25 points and -0.17%. Recalling our previous update, the index was
S&P 500 – Daily Outlook
The U.S. stock market index SPX is trading at 2,631.25, down -4.25 points and -0.17%. Recalling our previous update, the index was
S&P 500 – Daily Outlook
The U.S. stock market index SPX is trading at 2,631.25, down -4.25 points and -0.17%. Recalling our previous update, the index was trading in an overbought zone below 2,680 before falling down. It has already completed 61.8% retracement, and it’s likely to face support above 2,616.
Support Resistance 2619.84 2670.44 2604.21 2686.07 2578.91 2711.37 Key Trading Level: 2645.14 Nikkei – Daily Outlook Japan’s Nikkei dipped -62.80 points to trade at 22,215.32 on Wednesday. Most of the selling trend began in response to a weakness in the Wall Street soured risk sentiment. While the investors focused remained on rising bond yields. Technically, the index has formed a double top pattern up at 22,350 which is likely to hold Nikkei below 22,350. The 50 periods moving average is suggesting a bullish bias with a significant support at 21,850.
Support Resistance 22184.88 22303.38 22148.28 22339.98 22089.03 22399.23 Key Trading Level: 22244.13 That’s pretty much it for now. I hope you are ready for some action tomorrow in the wake of ECB policy decision. European Central Bank is due to release the monetary policy with wide expectations of no change in minimum bid rate. However, the press conference will be a key market mover. Don’t forget to watch it.
S&P 500 – Technical Outlook
At the moment, the US stock market index SPX is trading right above a strong support level of 2,660, and a
S&P 500 – Technical Outlook
At the moment, the US stock market index SPX is trading right above a strong support level of 2,660, and a
S&P 500 – Technical Outlook
At the moment, the US stock market index SPX is trading right above a strong support level of 2,660, and a break below this level can drive more bearish in the market until 2,640. Whereas, on the upper side, the index is likely to face a resistance near 2,717.
Speaking of leading indicators, the RSI and Stochastics are holding below 20, signifying a potential for a retracement. However, the SPX seems to continue trading bearish below 2674 today.
Nikkei – Technical Outlook
During the Asian session, the Japanese stock market index Nikkei fell after the heavyweight stocks such as SoftBank and Terumo lost ground, compensating gains in financials, which roused after U.S. yields rose. Moreover, the financial stocks, that trades in the foreign bonds, soared dramatically following a rise in the U.S. yields.
Technically speaking, the NKY is trading in an upward channel which is supporting it near 21,975. The 50- periods EMA is suggesting a bullish trend whereas, the RSI is massively oversold. Nikkei is likely to stay bullish above 22,166 for a target of 22,240 and 22,351.
In this update, we will discuss fundamentals & technical setups, that are worth watching during the coming week. On Friday, the US dollar climbed to a two-week high vs. a
In this update, we will discuss fundamentals & technical setups, that are worth watching during the coming week. On Friday, the US dollar climbed to a two-week high vs. a
In this update, we will discuss fundamentals & technical setups, that are worth watching during the coming week. On Friday, the US dollar climbed to a two-week high vs. a basket of currencies as risk-off sentiment wanes.
US Dollar Index – Double Top Resistance
The Dollar Index soared dramatically after breaking a trendline resistance level at 89.70. Most of the buyers entered the market for two reasons:
– Firstly, the single currency Euro fell sharply to a two-week low vs. the greenback as the European Central Bank (ECB) is due to release its monetary policy decision in the coming week (on April 26) and traders seem to price in the dovish monetary policy. A drop in Euro is driving more bulls to the US Dollar.
– Secondly, the investors switched their investments from pound to the greenback after the Sterling extended losses in the wake of dovish remarks from the head of the BOE (Bank of England).
Dollar Index – Forecast
Technically, the index is overbought (RSI above 70) and bulls are exhausted. We may see a retracement up to 90 and 89.75 before seeing another bullish wave in the dollar. On the upper side, Dollar index can face a solid resistance near 90.55 and 90.85.
Nikkei 225 – Shooting Star Pattern In Play
The Japanese stock market index Nikkei gave up 0.1% to 22,162.24. The index grew 1.8% this week, its fourth straight weekly gains. However, the markets remained muted on Friday as investors didn’t find any solid reason to trade the Nikkei. But they do have it for the coming week.
The BOJ (Bank of Japan) is scheduled to release the monetary policy report on April 27. Investors appear to save their shots before the release of the policy rate. BOJ is widely expected to keep the interest rates on hold at -0.10%.
Nikkei 225 – Forecast
The Japanese index Nikkei is trading below a double top resistance level of 22,380. The leading indicators RSI and Stochastics are moving in the overbought zone and signaling a potential for a bearish reversal. Moreover, Nikkei has formed a shooting star below 22,385 which is signaling a neutral sentiment of investors. The breakout of 22,385 can lead the index to next resistance level of 22,985 and 24,000. Whereas, the support remains at 20950.
Abstract
Macroeconomics is the basis of the fundamental analysis of investors who analyse how an economy is, what are its most prosperous sectors and how is its regulation to
Abstract
Macroeconomics is the basis of the fundamental analysis of investors who analyse how an economy is, what are its most prosperous sectors and how is its regulation to
Abstract
Macroeconomics is the basis of the fundamental analysis of investors who analyse how an economy is, what are its most prosperous sectors and how is its regulation to make sure that their investment will be profitable. Although macroeconomics includes many models, it still has shortcomings that do not make it entirely reliable. Even with these restrictions, it’s a necessary tool when making decisions to invest.
There are many unknown variables in current economies, and there are questions like why some countries grow more than others, why inflation varies from year to year, why all countries suffer from crises and recessions, which measures can be taken by local governments to reduce the frequency and the magnitude of these events. Macroeconomics is the branch of the economy that tries to solve all these questions that are related to the economy of a country.
To appreciate the importance of macroeconomics, it is best to read newspapers daily or listen to the news. Every day we see headlines related to the economy, central bank measures, trade agreements with other countries, the unemployment rate, and many others. Although many people are not interested in these issues, it is important to be updated as all these variables affect the lives of all people. For workers and independent people, the Central Banks decisions are significant, as they influence their consumption. Also, these measures determine the levels of investment in industries and commerce.
As the state of the economy affects all people, macroeconomics is a subject that plays a central role in political debates. In the elections of president, governors, and senators it is important that people give the necessary importance to choose who would be a good governor depending on their economic proposals. Other proposals of social and political reforms also matter, but economics is not a minor issue when choosing the right candidate.
It is normal that the popularity of a president would grow when the economy performs satisfactorily, and fall in the polls when crises occur and the unemployment rate increases. But macroeconomic issues are not only an important issue at a local level. There are meetings between leaders and world politicians to carry out joint policies among several countries so that the benefit is mutual, and development is equitable.
Although the world leaders have the job of devising and executing the measures that concern the economy, the work of developing models and explaining what the effects of those policies are is the work of the macroeconomists. To examine the models, macroeconomists must collect information on production, prices, unemployment and other variables from different time periods and several countries. The theoretical models, although they are not fully accurate, are a good tool to determine the effects of monetary policies, fiscal policies, international trade, among other measures, that the authorities can take.
The truth is that macroeconomics is an imperfect and young science. Since historical data is used to test the models, predictions about the future can often be wrong, economic conditions are never the same in two different periods of time. But with the development of several models in the last 50 years, the effect of some measures is clear such as increased public spending or tax reduction. What is often not well known is its magnitude.
Each era has its economic problems. In certain years between 1970 and 1980, some countries had problems with their inflation rates that were extremely high, while the opposite is happening in recent years, experiencing extremely weak inflation rates that do not allow central banks to execute policies that could stimulate higher growth in the economy. In 2007, there was a global financial crisis that lasted for several years. A financial juncture from which some countries still did not have recovered. There have been collapses in the stock markets, as well as the one that happened in the year 2000, when stock values went well above their fair value, especially in the technology sector.
As each epoch has its problems and different political and social conjunctures, it is difficult for macroeconomics to make accurate predictions about the variables in the future because contingencies will always arise. The historical facts of macroeconomics provide incentives to new models to explain past events and predict what may happen in the future. But the basic principles of macroeconomics do not vary in years or decades; there are specific rules that must be followed to model according to the data to which the analysts have to get accustomed.
While the models are far from reality, they are made in a simple way to be more understandable, and often a simple model that explains historical facts is better because a complicated model that takes more time to elaborate, ends up explaining the same thing as the simple model. The models have two kinds of variables, endogenous and exogenous. The endogenous variables are the variables that the model tries to explain, and the exogenous variables come as assumptions to the model, which are taken as true and do not need explanation. The purpose of the model is to show how the exogenous variables affect and determine the endogenous variables.
With the various existing models, macroeconomists analyse all the variables of interest from the savings rate and its impact on long-term growth to the impact of the minimum wage on unemployment. It is important to mention that not only one model explains all or most of the variables, but it is also a set of models from which conclusions can be drawn for fiscal or monetary policies or other types of policies that are implemented in the economy. To know how good a model is, we must analyse how realistic the assumptions and their exogenous variables are, because if they are far from reality, then the conclusions reached will be erroneous.
Another important branch of the economy is microeconomics which studies how households and companies make decisions and how these decisions affect the market which is the place of interaction between agents. A principle of microeconomics is to assume that companies and households have budget constraints, but always try to maximise their benefit.
Given this analysis of companies and people, microeconomics and macroeconomics are related, since microeconomics starts with the most specific aspects of households and their relationship with companies, and macroeconomics is more general, studying not only this relationship but also studying other components that may affect this relationship and factors beyond these two agents such as international trade, the interest rate, public spending of the government, the rate of investment in an economy, etc. The following graph summarizes the difference between macroeconomics and microeconomics.
After decades and decades of studies and new models, there are some lessons that macroeconomists have learned about how the economy works and what its limitations are. One of the most important facts that have been learned is that in the long term the capacity of a country to produce more goods and services will determine the quality of life of its inhabitants. To measure this productive capacity, we have the indicator of real gross domestic product (GDP), which does not consider equality metrics in the distribution of that production, but it serves as an approximation of the quality of life.
It has been established that in countries with higher GDP per capita, the population have higher purchasing power, better social indicators, better health system and even better media coverage.
In the long term, the gross domestic product depends on factors of production such as physical capital, human capital, the technological level of the country and the work required to produce goods and services. Domestic production increases when these factors improve or increase. For example, if more technology is used in production, it will be more efficient, it will require fewer working hours and capital, and therefore companies will be able to produce more. Or when a government encourages and gives access to better education for its population, workers will be capable of performing duties that were previously not capable.
As already mentioned in the previous paragraph, there are several policies a government could adopt to increase the production of goods and services. One of them could be incentives to increase the savings rate, which serve as an investment source in the future, higher efficiency in production, improve existing standards and institutions that allow the market to have no frictions or information asymmetries among others. That is, there are many ways in which the government can intervene in the trend in which the economy has, but it must act based on studies to know what could be the possible effects of the intervention.
Another important lesson is that in the short-term aggregate demand directly influences the number of goods and services produced within a country. That is a result of the behaviour of prices since in the short term they are almost fixed and do not vary much. Therefore, the factors that affect aggregate demand in the short term will end up affecting domestic production. Fiscal and monetary policies and possible shocks to the goods and services market are directly responsible for the behaviour of the economy in the short term, thus determining production and the unemployment rate.
The third important lesson that macroeconomists have learned is that in the long term the rate of growth of money determines the rate of inflation, but has no influence on real variables such as the growth of production or the rate of employment. When a central bank prints more money, in the long term it will not encourage production or employment, it will only cause a devaluation of the currency due to higher inflation rates. In addition, these higher inflation rates will cause increases in the nominal interest rate. But the fact is that being a nominal variable, the growth of money will not affect real variables in the long term such as employment because the variables that determine that is the rate of layoffs and hiring.
The last significant lesson is that, in the short term, those in charge of monetary and fiscal policies face a tradeoff between inflation and unemployment. Although inflation and unemployment are not related in the long term, in the short term they are. Therefore, often authorities must choose which variable to manage. In the short term, the authorities can use fiscal and monetary policies to expand aggregate demand, which will reduce unemployment, but increase the rate of inflation or in an opposite case, they can use contractionary policies in demand which will control inflation, but will affect jobs. In the long term, they stop being correlated because the expectations of the agents are involved.
Now we will show the factors that macroeconomists have not been able to solve. One of the biggest criticisms to macroeconomics is that alternative theories are not considered, that the whole theory is based on neoclassical models, with assumptions about certain behaviours of the agents and the market that other theories debate. So the possible errors that the models may produce are widespread because there is no debate on the theoretical principles.
The classical theory assumes a natural rate of unemployment and a potential rate of production. But some economists suggest that these levels are not fixed, they change over time depending on the institutions established and the policies implemented by governments, so it is a mistake to talk about these key levels of the economy.
Another important problem is that many times in those models, which are based on historical facts, they attain results not applicable at present. That is, the growth of countries in the past can be explained, but when lagging countries try to implement the policies that allowed that growth, they cannot achieve the same results. But this is not only a criticism of macroeconomics. It is a crisis in general on economic studies because they manage to explain why the crises happened, but fail to prevent them.
Another problem of macroeconomics is that some economists suggest that it is better not to intervene in the economy due to the lack of precision of the models, and therefore, it is not entirely known whether a policy will have the desired effects on the variables analysed. Also, authorities might pursue political goals such as obtaining popularity or votes, so they would use models and studies that favour them, that might not always be the best for the population.
A neoclassical theory emerged in the late 60s and 70s due to several years of economic weakness and with several recessions in between. The main authorities of countries such as the United Kingdom and the United States tried to encourage the accumulation of physical capital over labour as the predominant factor in retaking corporate and economic profit rates. With these reforms aimed at higher profit margins of companies, the world economy seemed to enter a new stage of bonanza, for which they began to reject alternative theories and its predecessor, the Keynesian theory seemed obsolete.
But the volatility experienced in the last two decades, and mainly the 2007 crisis, is the evidence that the theory aims to understand the economic crises, but fails to prevent highly significant events such as that one that started 10 years ago: A huge financial breakdown from which many countries have struggled to recover, and the well-being achieved in decades disappeared in a matter of years. This lack of foresight about that episode is evidence of the lack of communication of the neoclassical theory with other theories that perhaps might contribute to the appearance of new concepts that might lead to a better general welfare.
In conclusion, macroeconomics is a branch of the economy that studies the big variables such as unemployment, production, investment and savings among others. It has provided many concepts, and clarity about how the general behaviour of the economy is, and how its different components are related. But being dominated by a mainstream theoretical background that does not admit debates about its principles is a science with limitations. Macroeconomics still does not achieve its purpose of avoiding major crises, and countries who apply policies based on macroeconomic theory do not develop at the same rates as the reference country. Despite its limitations, it is a valuable tool that allows for better overall well-being than decades prior to the world wars.
Long term is what really matters for economists. It is not enough a decade of continuous growth if an economy does not have adequate policies to perpetuate that growth. So, the models in general in macroeconomics are about the long term. As mentioned in other articles, the economy fluctuates permanently along a trend and it is normal to present crisis in certain periods of time. But to ensure production growth constantly over time, government policies must focus on variables such as savings rate, capital accumulation, human capital development among others that offer the ability to maintain stable growth.
In the long term of the economy, the interannual fluctuations of economic activity predominate. When recessions happen, causes consumers to be pessimistic and when the economy is expanding, consumers are optimistic and their behaviors demonstrate. But if you look to the past in long periods of time the panorama changes, and fluctuations are not important but the long-term growth is. What matters, in the long run, is the historical aggregate production, so the objective of this branch of macroeconomics is to determine which factors affect long-term growth, why some countries grow more than others and why there are more inequalities between countries. In the following graph, you can see the growth of some countries.
Graph 1 GDP PER CAPITA. Data taken from the World Bank.
The reason why growth is important is that this determines the standard of living and determines whether it has improved this in time. Because of this, what matters to macroeconomics is not only aggregate production but production per person as this approximates each person’s standard of living. Economists do not ignore the fact of inequality, but studies and models try to approach reality so it is necessary to have these variables that even though they are not entirely true, they approximate to reality. At this point, there are several variables that try to measure the quality of life of people as their consumption, necessities unmet, among others, which measure the overall well-being
When you compare production per person you should adjust by purchasing power parity, in other words, the prices are adjusted in real terms to be able to compare a basket of goods that can be bought in each country, otherwise, these indicators would be affected by exchange rates. One of the great conclusions that can be seen after seeing the growth of different countries is that in general welfare in all countries has increased and in some countries, growths have converged at similar rates, but there are others in which the Growth seems to have stagnated as in Africa and some countries in South America
To analyze growth in countries, economists have used long-term models, initiated by Robert Solow at the beginning of 1950. The models consider aggregate production and try to have variables that affect production such as capital and workers in an economy. The way in which these two factors are related to the models is affected by technology, as an economy with a higher technology will be more efficient with the factors it has and thus will reach greater aggregate production. With such simplified models, graphics are very similar to reality, and it is also concluded that growth rates stop increasing in certain periods of time and by the characteristic of declining yields. What indicates declining yields of the factors is that the larger the accumulation of these factors, they cease to be so productive because the economy is saturated with these and are no longer as necessary as in the beginning.
With these concepts clear it is valid to ask yourself the question why an economy grows and which factors promote the growth. With long-term macroeconomic models, it is concluded that increases in worker output are due to increases in capital per worker, technological improvements or more skilled workers. The education is a very interesting explanation because it explains the great growth after the Second World War as technological innovations made production more efficient in all countries and the knowledge of people also had an expansion during this period. In conclusion, what determines long-term production is the relationship between production and capital as the amount of capital determines production. In graph 2, the gross capital formation is a variable of physical capital.
Graph 2 Gross capital formation. Data taken from the World Bank
Another important aspect of the long-term growth of economies is the saving rate of each economy. It has been seen in data that the most saving economies grow more in the long run and an example of this are the Asian economies that have high savings rates and thus grow more than the average of countries. Similarly, technological progress helps to grow constantly more than in the past. But here arises another concern, what determines the rate of technological progress? The answer is the projects that are carried out in an economy and the way the economy is organized, its rules and the institutions.
Governments can influence the saving rate in various ways. In the first place, they can change public savings, in other words, to have a surplus in the government budget. Moreover, governments can use taxes to influence private savings, for example, they can grant tax privileges to people who save to make more beneficial the saving. But at this point arises a problem and is that consumption suffers when there are higher rates of savings and the desire of an economy that grows is that people consume more so there should be a limit on savings rates because an economy with excessively high rates is also not ideal for economists. But if you take an economy with zero savings to invest in capital, the economy will have zero capital and consumption will also have the same value, so it is better than the saving rate is positive but not excessive as consumption will also be null and that is not the ideal of the economy. In graph 3, a gross saving rate can be observed in which the most developed countries are the ones with the highest savings rates.
Graph 3 Gross savings. Data taken from the World Bank
There is empirical evidence that most countries are below the optimum savings level and are therefore below their optimal capital level and their consumption is not the maximum they could get. But the savings rates that are considered in these initial models are only used to acquire physical capital, but as mentioned previously, economies have another capital that is also very important which is human capital. An economy that has many skilled workers will be much more productive than another that does not have the same types of workers. Human capital has increased as much as physical capital in the last two centuries. It is known that at the beginning of the first Industrial Revolution, 30% of the workers knew how to read and now that percentage is located at 95%. Graph 4 shows the difference in the rates of children enrolled in tertiary education.
Graph 4 Gross enrolment ratio. Data taken from the World Bank
After having introduced the distinction within the capital of an economy it can be concluded that the level of production of an economy depends on physical capital, human capital, and technology present in an economy. An increase in the physical capital per worker and an increase in the average level of qualifications per worker would lead to an increase in production per worker. A problem is that the population today is so educated and the yields of this are also decreasing the most children now know how to read, write and have the possibility of going to college so it is no longer so representative the education as it was in the last century. Savings also influence human capital as an increase in savings in this capital increases production per worker.
Considering another important variable in long-term growth the technological progress will be exposed. Technological progress helps economic growth at least in the short term because it makes the economy more efficient and allows new objects to be produced at higher speeds. But it is not a permanent effect because after the economy is accustomed to these innovations, its effect on growth disappears. Technological progress reduces the number of workers needed to achieve a certain amount of production, in other words, it allows to produce more without having to increase the factors already exposed.
Technological progress has made great strides throughout history from finding sources of energy to the understanding of the human body. In modern economies, most of the technological progress comes from investment in research and development, which is commonly denoted (R&D). According to some estimates, countries allocate between 3% and 5% of GDP and modern companies allocate large resources to this in order to be at the forefront of the market. For a company to have incentives to invest in research and development there must be clear rules such as proprietary rights and patents that guarantee companies to receive returns on investment in R&D. In Figure 5, the difference in research between countries can be seen.
Graph 5 Researchers in R&D. Data taken from the World Bank.
There is data showing that the recorded growth from 1950 to the present has been generated by the technological process rather than the accumulation of physical capital, but without the latter being negligible for economic growth. Throughout history it has been seen that the poorest countries have less physical capital initially but then converge their growth rates with the most developed because they implement the technological progress of the most advanced countries, in other words, they take advantage of the progress of developed countries and as the technological levels converge, the production per worker is also converging. This is one of the central ideas about technological progress, as the most advanced countries are on the technological frontier and must innovate more, while lagging countries can mimic the technology of the advanced countries and close the gap between them without having to innovate. While this occurs in some countries, not all are able to do so due to inefficient policies and institutions.


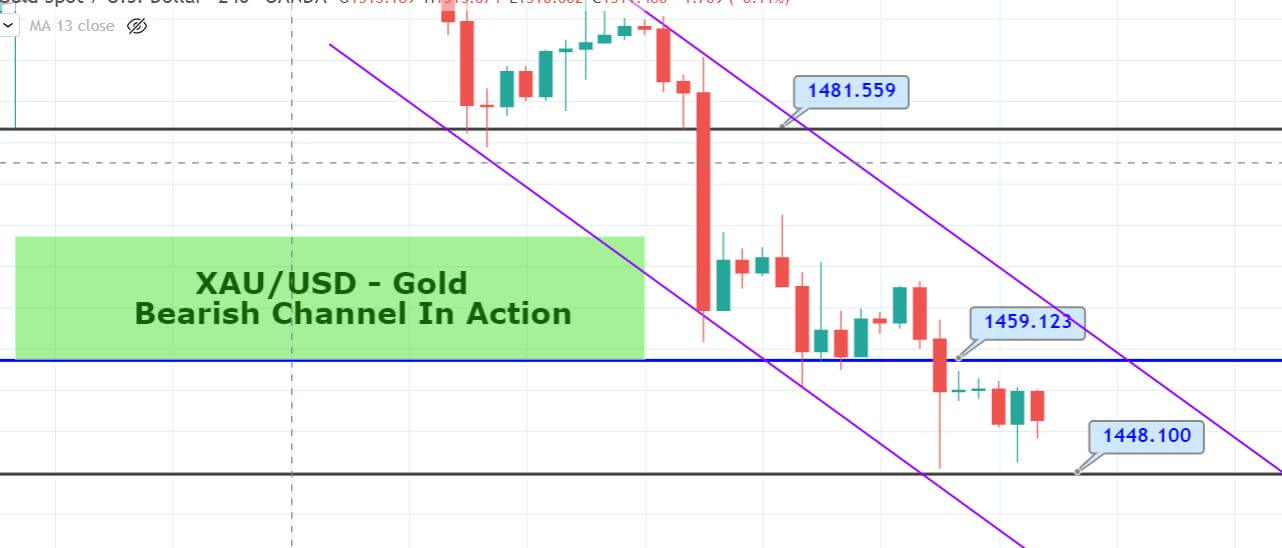


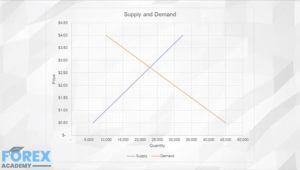


 Another area that has had a dramatic effect within the Forex market is the style of the presidency pertaining to the United States of America. President Donald Trump has his own unique style of governing. He regularly tweets on such things as his preference for low-interest rates in the United States. This type of comment often flies in the face of the Federal Reserve, and it is not uncommon for him to tweet on factors pertaining to the economy, such as imminent economic data releases, even occasionally tweeting in a somewhat biased manner about highly sensitive and anticipated non-farm employment results, which are of course subject to an embargo.
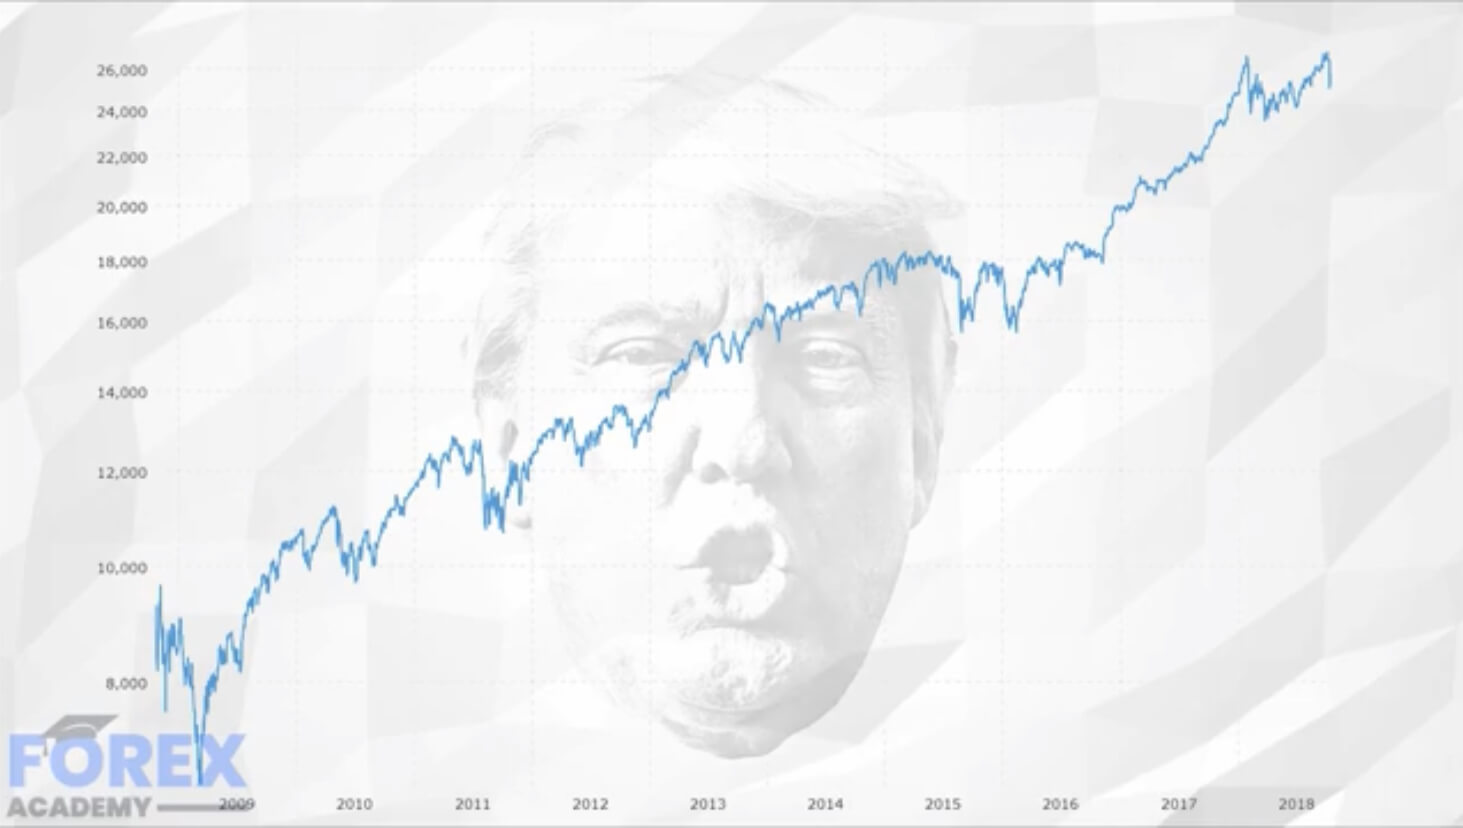

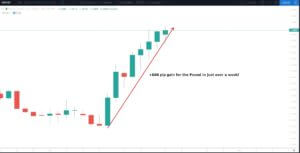


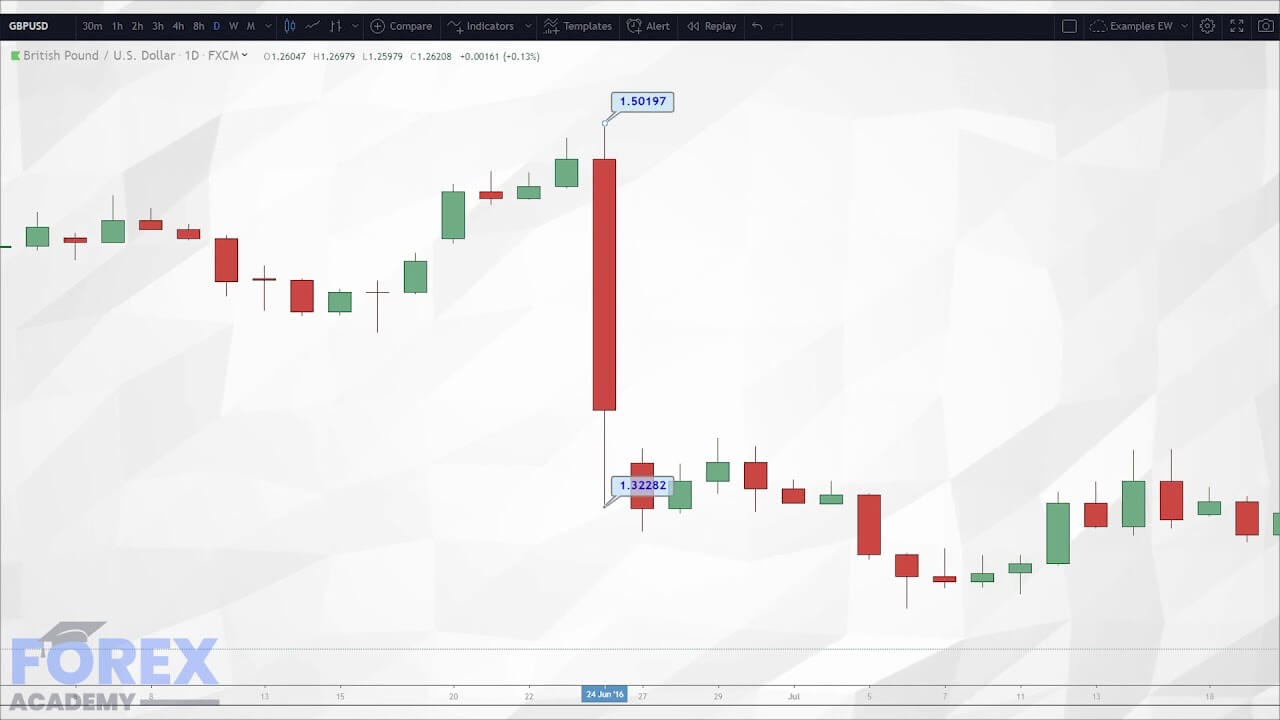
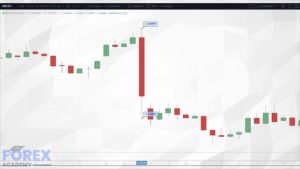
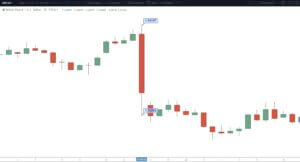
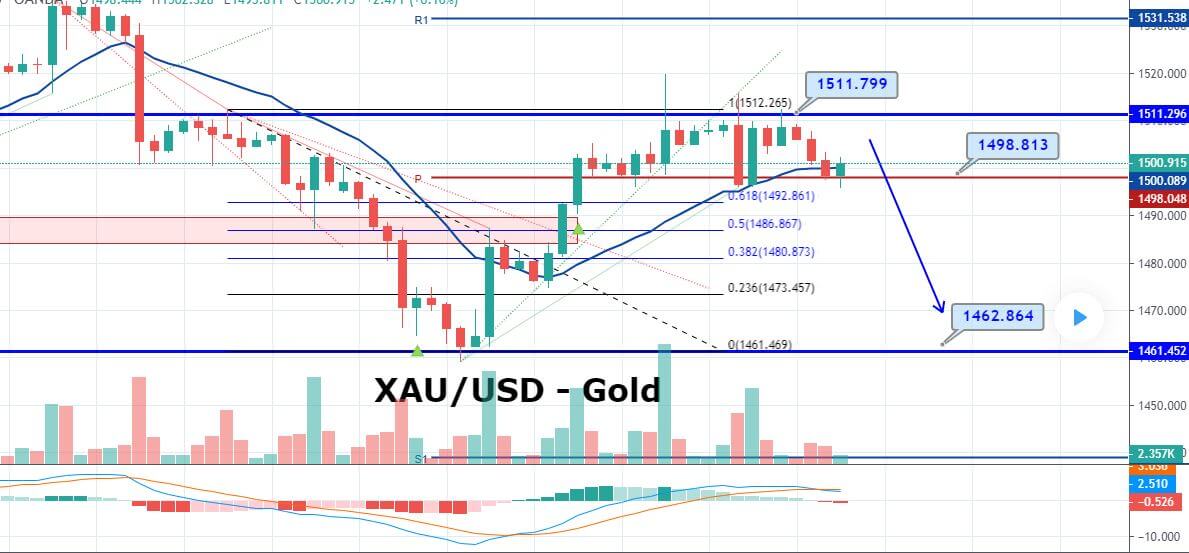


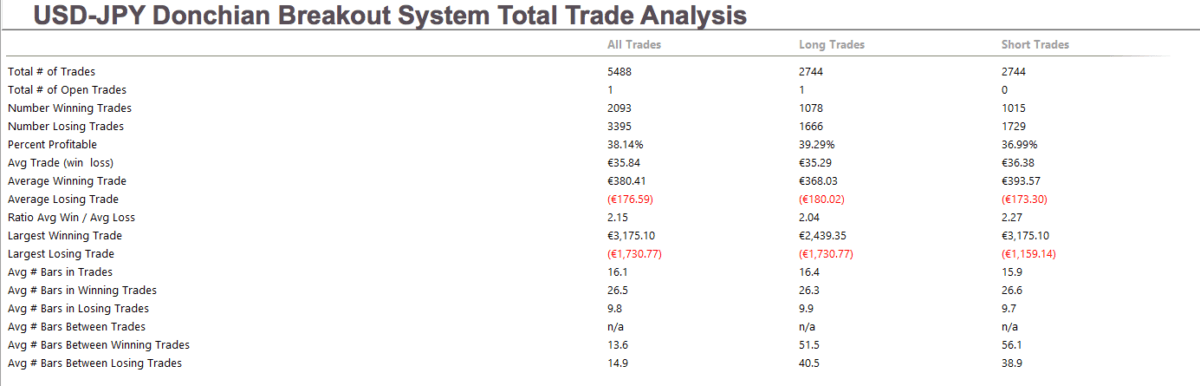


