Forex charts are used by traders to analyze and make decisions about the currency market. These charts are visual representations of the exchange rate between two currencies over a period of time. Traders use these charts to identify potential trading opportunities, monitor market trends, and make informed decisions about when to enter or exit a trade. But what currency is looked at in a forex chart? In this article, we will explore the answer to this question in detail.
Forex charts use currency pairs to display the exchange rate between two currencies. A currency pair is a combination of two currencies, with the first currency being the base currency and the second currency being the quote currency. For example, the EUR/USD currency pair represents the exchange rate between the euro and the US dollar. The first currency (EUR) is the base currency, and the second currency (USD) is the quote currency.
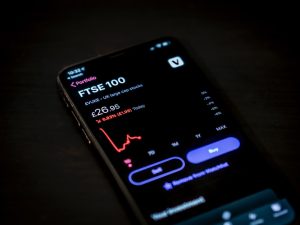
When looking at a forex chart, traders will see a series of candlesticks or bars that represent the price movement of the currency pair over a specific time period. Each candlestick or bar represents a specified time frame, such as 1 minute, 5 minutes, 1 hour, 1 day, etc. The vertical axis of the chart represents the exchange rate of the currency pair, while the horizontal axis represents the time.
Traders use forex charts to analyze historical price data and identify patterns or trends that can help them predict future price movements. For example, if a trader sees a series of candlesticks indicating that the price of the EUR/USD currency pair has been steadily increasing over the last few hours, they may decide to enter a long position (buy) in the hope that the trend will continue.
In addition to the exchange rate, forex charts may also display other useful information, such as trading volume, support and resistance levels, and technical indicators. Technical indicators are mathematical calculations based on price and/or volume data that can help traders identify potential entry and exit points. Some popular technical indicators used in forex trading include moving averages, RSI (Relative Strength Index), MACD (Moving Average Convergence Divergence), and Bollinger Bands.
It is important to note that forex charts are always displayed in the quote currency. This means that if a trader is looking at a EUR/USD chart, the price displayed will be in US dollars. This is because the quote currency is always the currency that the exchange rate is being compared to. In the case of the EUR/USD currency pair, the exchange rate is the value of one euro compared to the value of one US dollar.
In conclusion, the currency that is looked at in a forex chart is the currency pair being traded. Forex charts display the exchange rate between two currencies, with the first currency being the base currency and the second currency being the quote currency. Traders use these charts to analyze historical price data and identify potential trading opportunities. By understanding how forex charts work and what currency is being displayed, traders can make informed decisions about when to enter or exit a trade.