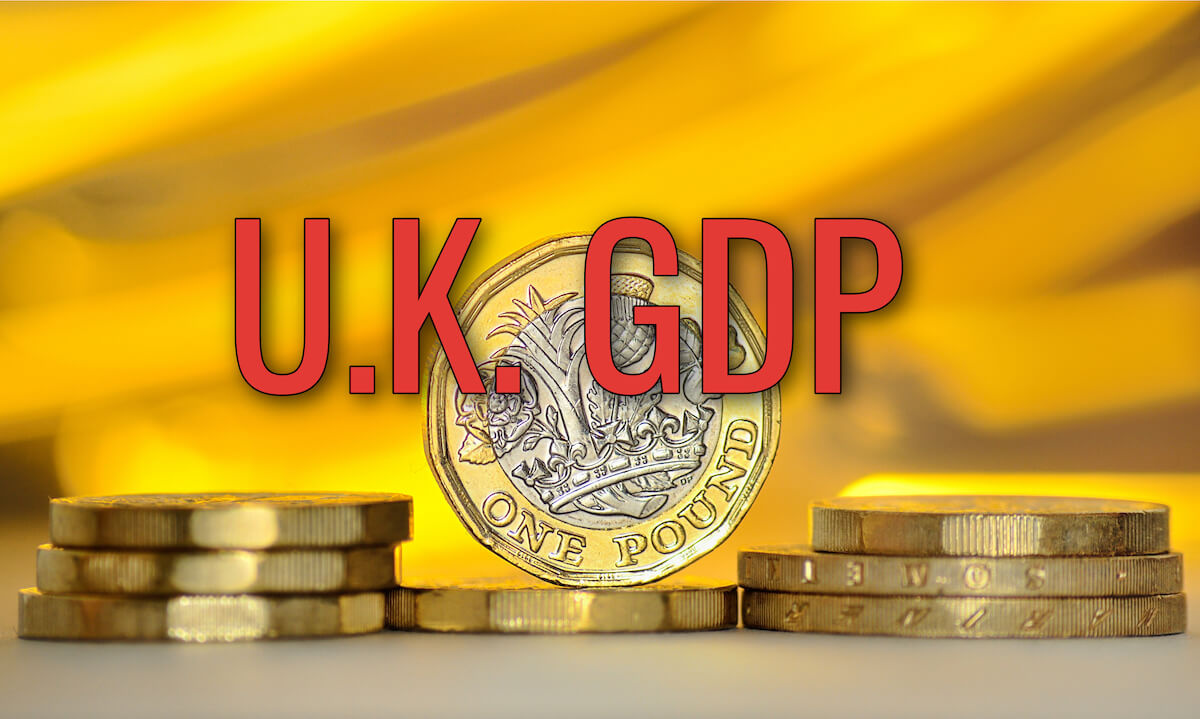
On the news front, the eyes will remain on the series of economic events from the U.K., especially the GDP m/m, Goods Trade Balance, and Industrial Production m/m. The sterling may suffer today as the GDP and Construction Output are forecasted to be worse than before. Besides, the Canadian economy will also remain in highlights for the release of Employment Change and Unemployment Rate as both of these are expected to report negative data.
Economic Events to Watch Today
EUR/USD – Daily Analysis
The EUR/USD pair was closed at 1.17599 after placing a high of 1.17815 and a low of 1.17325. Overall the movement of the EUR/USD pair remained flat throughout the day. The EUR/USD pair remained flat on Thursday as it closed its day on the same level it was started with. The earlier decline in the EUR/USD pair was due to the rising concerns mentioned in monetary policy accounts. At the same time, the surge in the EUR/USD pair was caused by the latest comments from President Trump about the U.S. stimulus deal.
The ECB issued its September’s monetary policy meeting minutes on Thursday that suggested that ECB could roll out more stimulus later this year as the Bank was more concerned about the pandemic hit economy than analysts had previously thought.
The minutes revealed that ECB was more concerned about the inflation trajectory and Euro than market participants anticipated. The Euro struggled to find demand after the release of minutes that suggested that further stimulus was not too distant in the future amid an uncertain economic outlook. The ECB officials’ tone in the September meeting minutes was in contrast to the ECB President Christine Lagarde’s speech that showed no concerns about the rising Euro and was optimistic about the Eurozone economy.
Lagarde had said that the strong rebound in activity was broadly in line with previous projections. Whereas, the ECB accounts showed that members preferred the Bank to remain flexible on policy and have concerns about the pace of inflation.
Furthermore, the Vice President of the European Central Bank, Luis de Guindos, said that ECB has to use its tools at its disposal as the coronavirus pandemic depresses inflation expectations. These concerns weighed on single currency euro and dragged the prices of the EUR/USD pair in the early trading session. Whereas, in the late trading session, the U.S. President Donald Trump said that he favored a mini-accord focused on airlines and checks to all Americans. After terminating talks with Democrats for further stimulus, these comments raised hopes that some packages will be announced soon. This weighed on the U.S. dollar and raised the EUR/USD pair in the late trading session and closed the day at the opening level that provided flat movement in the pair.
On the data front, at 10:59 GMT, the German Trade Balance for August dropped to 15.7B from the projected 17.1B and weighed on single currency Euro. Whereas from the U.S. side, the Unemployment claims during last week rose to 840K against the expected 820K and weighed on the U.S. dollar that added strength to EUR/USD pair.
Daily Technical Levels
Support Resistance
1.1734 1.1784
1.1708 1.1808
1.1684 1.1834
Pivot point: 1.1758
EUR/USD– Trading Tip
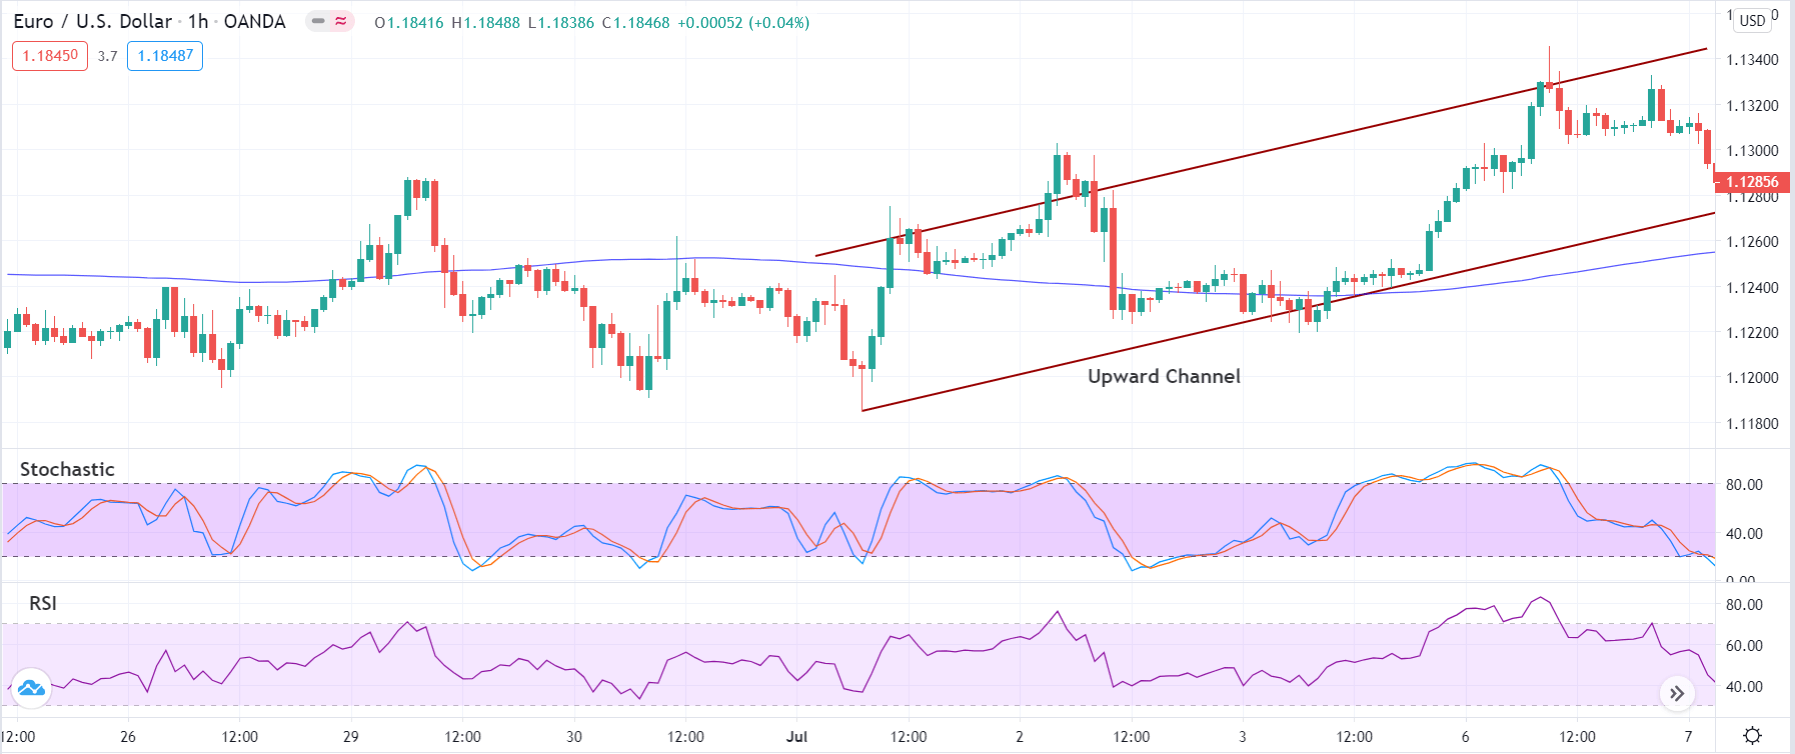
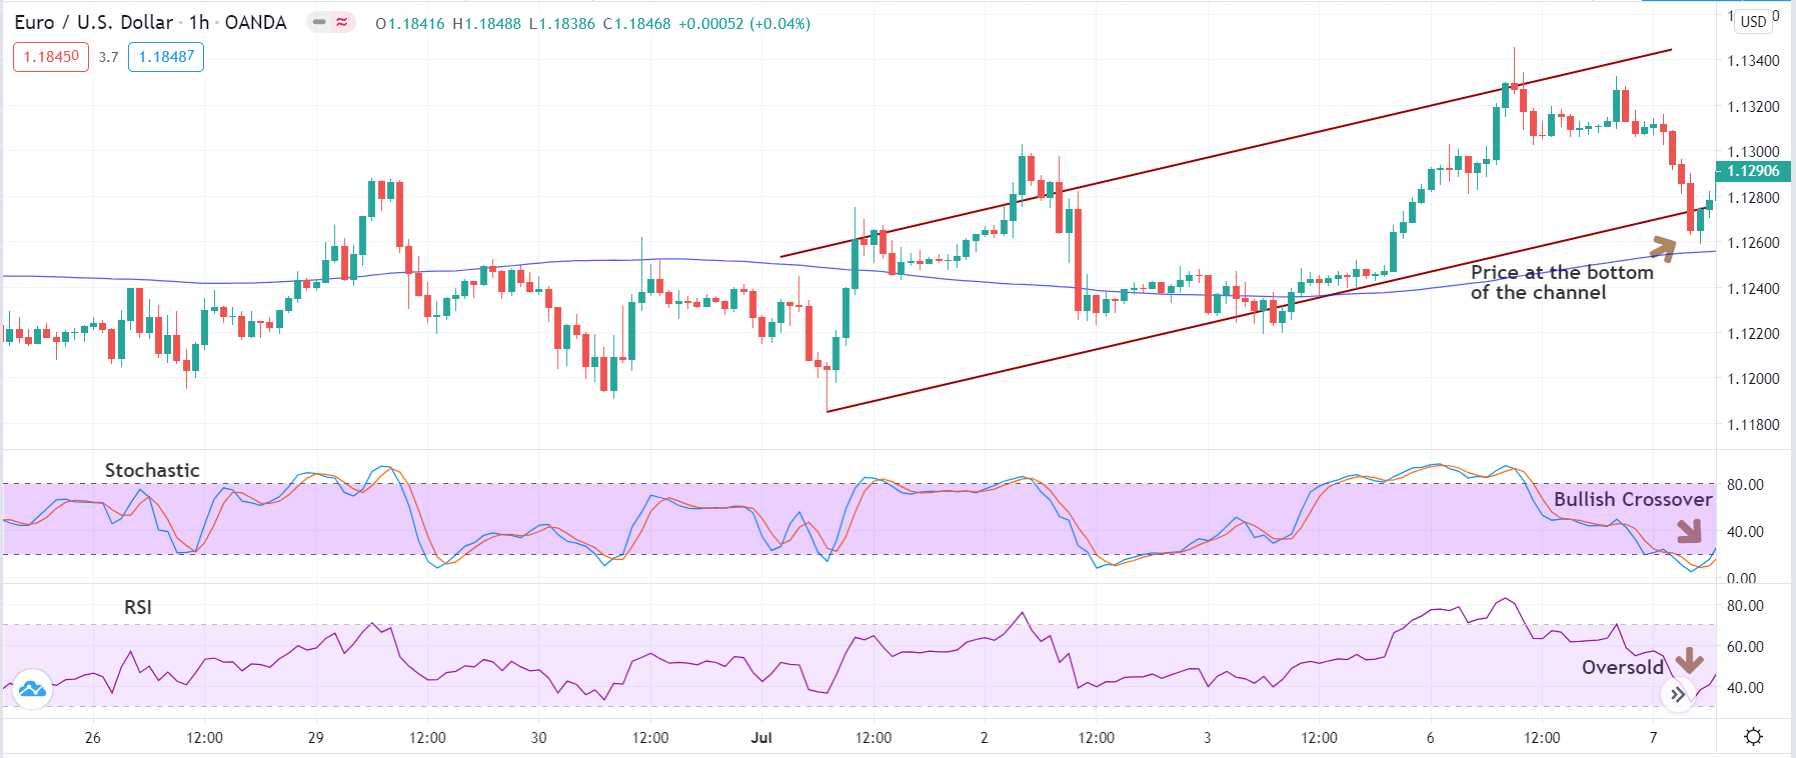
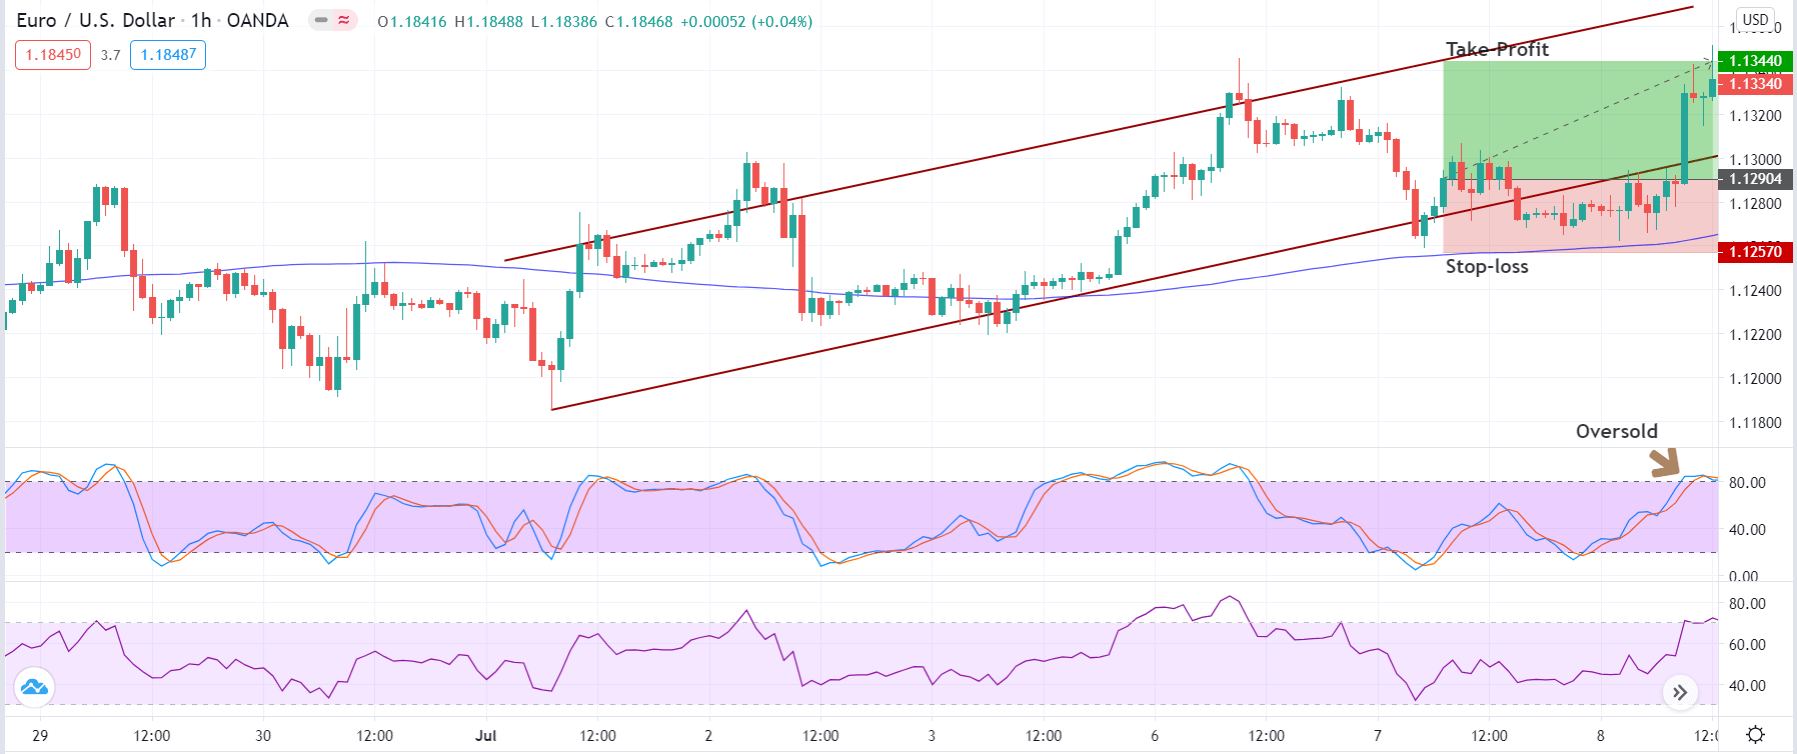
The EUR/USD pair is consolidating below 1.1780 level, and the closing of candles below the triple top resistance level of 1.1780 level may drive the selling trend in the EUR/USD pair until the support level of 1.1758 and 1.1740 level. Conversely, the bullish breakout of the 1.1780 level can trigger a sharp buying trend until today’s 1.1807 marks.
GBP/USD – Daily Analysis
The GBP/USD pair was closed at 1.29340 after placing a high of 1.29702 and a low of 1.28913. Overall the movement of the GBP/USD pair remained bullish throughout the day. The Governor of the Bank of England’s positive comments and Trump’s support for the U.S. stimulus package pushed GBP/USD pair higher on grounds on Thursday. GBP/USD pair raised and extended its previous day’s gains despite rising concerns over the coronavirus situation in the U.K. and Brexit deal.
On Thursday, the Bank of England Governor Andrew Bailey said that the Bank was not out of power to handle the downside risks faced by the economy as the country focus was shifted to the second wave of the coronavirus crisis. Bailey said that economic recovery has been very uneven, with different sectors gaining more than others. He also said that there was an unprecedented level of uncertainty at the moment, and the risk was very much on the downside, but the Bank was not out of ammunition to fight the crisis yet.
He added that the Bank has many policy tools that could be used promptly in response to the second wave and third wave if needed.
Britain experienced a record decline in economic output in the second quarter of this year by a GDP contraction of 19.8%, the biggest drop since the record began in 1955. Bailey said that the country was still in a very big recession, with the economic recovery from the pandemic height very uneven. These comments from Bailey raised British Pound and helped GBP/USD pair to post gains.
The upward trend of the GBP/USD pair was further supported by the latest Trump’s call for a small stimulus package from the U.S. Congress for airline and small businesses. The change of view by Trump over stimulus measure within a day weighed on the U.S. dollar and supported the upward movement of the GBP/USD pair.
Furthermore, the U.S. dollar was also weighed by the last week’s Unemployment Claims that rose to 840K from the projected 820K last week. The weak U.S. dollar pushed GBP/USD further on the upside on Thursday and extended its gains.
Whereas, the coronavirus cases in the north of England were getting out of control and were under a serious situation. The minister defended the government plans to introduce new restrictions that would include a ban on overnight stays and closing the pubs and restaurants in the worst-affected areas. These potential restrictions to control the coronavirus situation in the U.K. weighed on GBP and capped further gains in GBP/USD pair on Thursday.
On the data front, at 04:01 GMT, the RICS House Price Balance raised to 61% from the expected 39% and supported British Pound that added strength to GBP/USD pair. On the Brexit front, the hopes for a Brexit deal were fading in the market and weighing on British Pound with Boris Johnson giving threats to walk away from talks if the deal was not reached by 15th October. At the same time, E.U. officials have dared Johnson to walk away if he views a deal as impossible.
According to Bloomberg, the E.U. officials are working on a plan that will find a way to carry on discussions into the second half of October despite some differences remaining on both sides. The uncertain Brexit developments have weighed on British Pound and limited the additional gains in GBP/USD on Thursday.
Daily Technical Levels
Support Resistance
1.2921 1.3013
1.2863 1.3049
1.2828 1.3106
Pivot Point: 1.2956
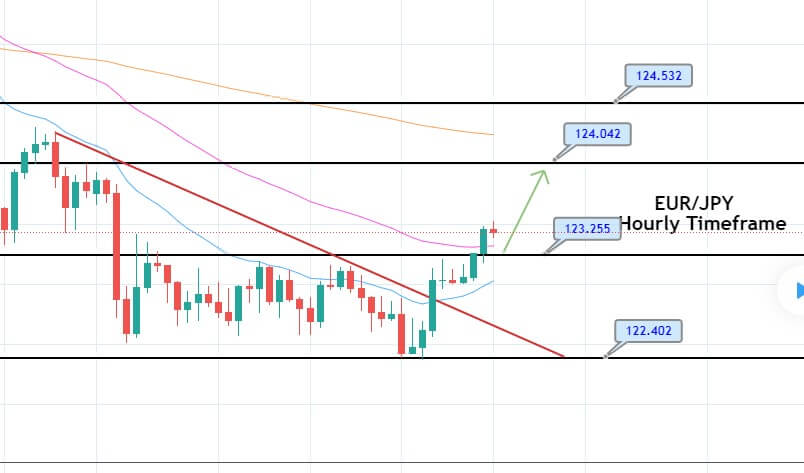
GBP/USD– Trading Tip
The GBP/USD is trading at 1.2960 level, holding right below an immediate resistance level of 1.2960. The resistance is extended by a double top resistance level on the hourly timeframe. Below the 1.2960 resistance level, the Sterling can trigger selling until the 1.2920 level and 1.2900 level. On the higher side, a bullish breakout of 1.2960 levels can trigger buying until the 1.3000 level. The fundamental side is busy today, and the U.K. economy is due to release series of economic events, with a special focus on the U.K. GDP data. A positive date is likely to drive a bullish breakout until 1.3000. At the same time, the negative GDP figures may lead the GBP/USD price towards 1.29350.
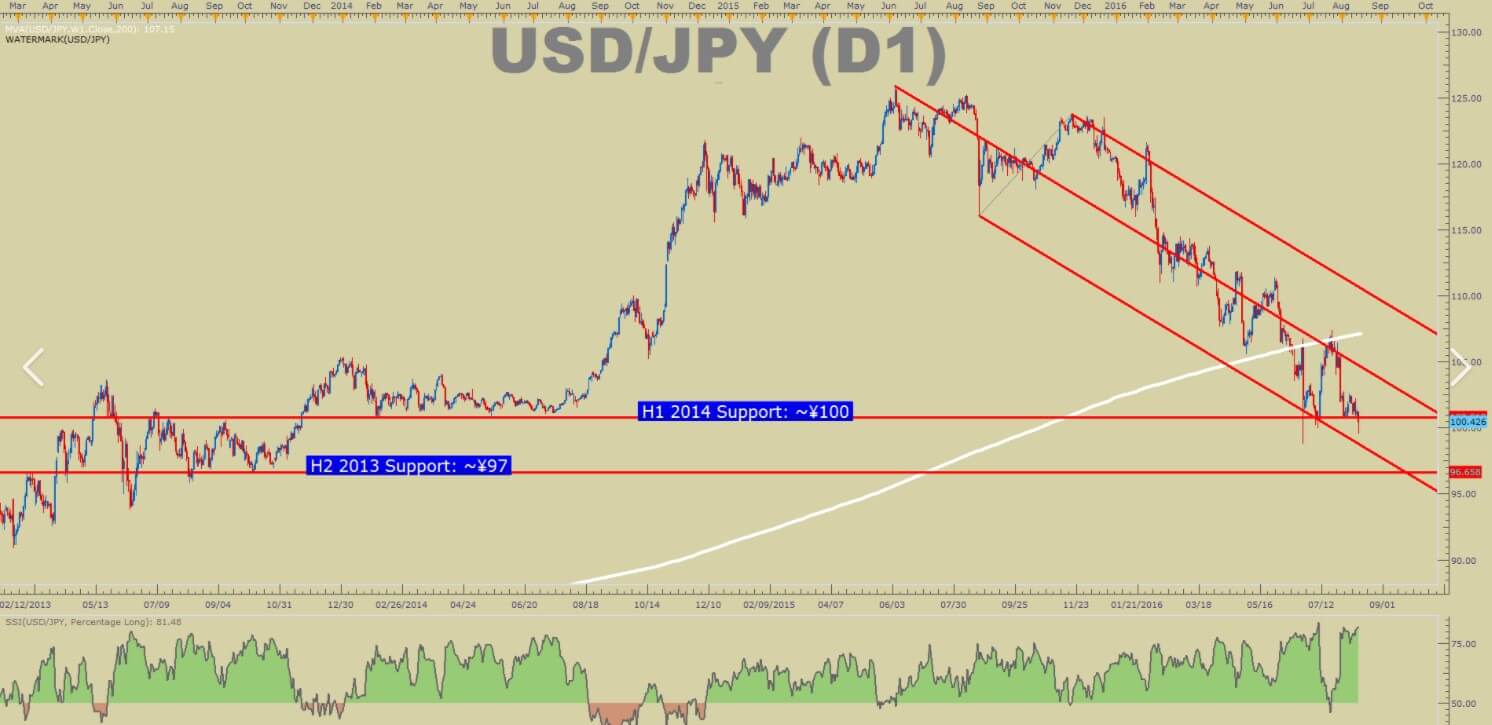
USD/JPY – Daily Analysis
The USD/JPY pair was closed at 106.026 after placing a high of 106.106 and a low of 105.923. Overall the movement of the USD/JPY pair remained bullish throughout the day. The pair USD/JPY consolidated in a range of around 106 marks on Thursday amid mixed statements from President Trump, House Speaker Pelosi, and Treasury Secretary Mnuchin related to U.S. stimulus measure.
Earlier this week, President Trump halted further negotiations with Democrats for a stimulus measure package and said he would provide a massive stimulus measure to win the election. However, the next day, Trump backed from his statement amid the need for financial support to airlines and small businesses that had been hit hardest by the pandemic crisis.
Trump called for a small stimulus aid for airlines, which weighed on the U.S. dollar that was moving higher due to his previous comments. U.S. stocks, however, rallied after the new call for a small package by President Trump. These statements helped the USD/JPY pair to post gains due to improved risk sentiment in the market on Thursday.
On the other hand, the House Speaker Nancy Pelosi said that a mini-accord was not possible without passing a big stimulus in response to calls for a small aid package. These contrasting statements from both sides frustrated the traders and increased concerns in the market. After Pelosi’s comments, the rally in equities that started earlier suffered and was reversed on Thursday.
On the data front, at 04:50 GMT, the Current Account Balance from Japan raised in August to 1.65T against the forecasted 1.50T and supported the Japanese Yen. At 10:02 GMT, the Economy Watchers Sentiment increased to 49.3 from the projected 45.0 and supported the Japanese Yen.
From the U.S. side, the Consumer Credit for August was released at 00:00 GMT, which dropped to -7.2B against the forecasted 14.9B and weighed on the U.S. dollar. At 17:30 GMT, the Unemployment Claims from last week raised to 840K from the anticipated 820Kand weighed on the U.S. dollar.
Despite Japan’s positive data and negative data from the United States, the currency pair USD/JPY managed to remain bullish throughout the day on Thursday. Meanwhile, the risk sentiment was also improved by the latest news that the United States has enough coronavirus vaccine for every American by March. The Health and Human Services (HHS) Secretary Alex Azar said that Americans could use vaccines by March to be available for every one of them. This improved risk sentiment weighed on the safe-haven Japanese Yen and supported the USD/JPY pair on Thursday.
Daily Technical Levels
Support Resistance
105.66 106.18
105.36 106.42
105.13 106.71
Pivot point: 105.89
USD/JPY – Trading Tips
The USD/JPY pair has violated the ascending triangle pattern at 105.800 level, and now the same level is working as a support for the safe-haven pair. On the higher side, the USD/JPY pair can continue its bullish bias until the 106.270 level. However, we can expect USD/JPY to retrace back until the support level of 105.800 level before showing us a bullish trend. Let us wait to buy over 105.800, but the next support will prevail at the 105.450 level. Let’s consider staying bullish over the 105.800 level today, and selling should also be considered only below this level today. Good luck!


 Indices: