Categories
Beginners Forex Education Forex Basics

The Forex Trader’s Guide to Starting Over

Perhaps you took a long break from trading, lost your entire account balance, experienced several losing trades in a row, or had other bad luck somewhere along the line. Whatever the reason for previously quitting, you might be considering starting over again. Unfortunately, it’s harder to start over with trading than it is to try in the first place – and this sad fact is what keeps many traders from ever trying again. On the bright side, those that have been down on their luck before can actually benefit from starting over. 

Wondering how? Those that have already tried something out and failed have a better idea of what to expect. You might have believed in certain myths about trading when you first started, for example, that trading was easy, that you would become rich off a small deposit, or that you should risk a lot on each trade, like with gambling. Your losses would have shown you that these things aren’t true, but this gives you a place to start. Now you can begin with a better idea of what trading is, without believing in the same misconceptions and with more realistic goals. 

It’s important to ensure that you do learn from your past mistakes before starting over. If you didn’t spend enough time researching and learning how the forex market works the first time around, be sure to spend plenty of time looking into these facts the next time. You could even check your knowledge with quizzes and practice on a demo account for good measure. If your previous mistake was risking too much on a single trade, you’ll want to spend some time looking at the ways that you manage risk by placing stop losses, only risking 1-2% on each trade, and so on.

If you didn’t stick to your trading plan before, now is the time to do so. Or you might have opened an account with a brokerage that is less than trustworthy, but now you get to begin again and have the option to choose a better company to do business with. Whatever your previous mistake was, your main goals need to focus on overcoming them. 

You’ll also want to avoid making the mistake of thinking that you’re immediately ready to start trading again, thanks to the idea that now you know exactly what to change. It’s important to invest time into improving on prior mistakes and to work on your trading plan so that you don’t fail. Even if you previously wiped out your account by risking too much, you still need to brush up on your overall trading knowledge, while paying extra attention to risk management. Try reading articles or watching tutorials that deal with your specific issues, but don’t forget to look at the big picture. You don’t want to start off with improvements in certain areas where you failed before, while using a trading plan that doesn’t work and making mistakes in other areas, otherwise you’ve defeated the purpose. 

Starting over can be difficult and you might question whether it’s worth it in the first place. After all, it was hard enough to lose money the first time around and nobody wants to lose money on the same mistake twice. The good news is that traders that have failed before have a better idea of what to expect and know more about their own personal weaknesses, so they know where to focus their efforts for improvement. The first step is to identify your previous mistakes. Then, you should brush up on your trading knowledge, especially if some time has passed since you last traded.

When developing your trading plan, be sure to devote more time to your previous problem areas. From there, you’ll be ready to start over with a newfound confidence in your abilities. As long as you truly devote yourself to starting over, one day you’ll be able to share how your previous defeat was the precursor to your successful trading career. 

Categories
Forex Basic Strategies

The Power to Average in Forex

0101Price action and swing trading methodologies per se provide a powerful way to operate in markets, but when they are complemented with average value analysis, you can start to “see” much more. The word “average” is synonymous with the word “average”, which is widely used in financial markets, including the stock market. However, this can be an important tool when used correctly. Mathematicians, Scientists, and Data Analysts usually use the power of the average in clinical trials, predictive analysis, and other applications to predict things. In this article what we want most is to show them how the power of simple average can be applied to your forex trading.

The Wisdom of Crowds: Average on Forex

The power of averaging comes to light when used with “crowd data”. Keep in mind, when analyzing a price chart, you’re looking at the average combined thinking of all traders in the market, who are being represented in the price. For example, do you know those quizzes about guessing the amount of candy in a jar? Most people will be far away from the actual number with their assumptions, some as much as 100 times above or below the actual amount. In fact, out of 160 people, only about 4 would approach the real value.

The interesting thing is that, even though no one usually gives the correct answer, “everyone” (as a group) comes up to a fairly close number. The typical scenario shows that when the amounts said by the public were averaged, the resulting number was something like 5,231.77 when the actual amount of candy inside the bottle was 5,240. This means that data collected from the entire public were able to accurately determine how many candies were in the bottle with a difference of 9 candies, which would be a margin of error of approximately 0.17%.

This example is quite amazing and shows the power of averaging. A Youtube channel did this experiment on the candy jar, letting people put their amounts in the comments. When the results were collected and averaged, the average was within 4% of the real value. Usually what happens is that people who overestimate are canceled by people who underestimate, which naturally filters out the bad estimates. What this shows is that you can collect everyone’s thoughts and average them to get something that is mysteriously close to real value.

Probabilities and averages should be the backbone of your risk management. Another unexpected place where averages play an important role is in our risk management plan. This will certainly have a consequence on the way you think and respond to your trading performance on a long-term basis. Many forex traders have difficulty making the switch and starting to think in terms of probabilities. Unfortunately, many people have their heads full of misinformation, contradictions, and paradoxes. For this reason, most new traders rank money management and capital preservation much lower than do experienced traders.

But the bottom line is that trading is a math game. You must understand the odds and statistics, and aim to stay on the right side of the numbers by exploiting your advantages in order to succeed. The advantage we teach in these items is to exploit recurring price patterns that continue to be repeated in the same way over time. Always keep in mind, there are a certain number of traders in the market at any given time, and they are doing the same thing over and over again to try to make money. This includes large amounts of “smart money,” such as investment funds and commercial companies that have the largest volume on the market.

This behavior repeatedly generates price action signals that we recognize and use to predict price movements. These signals of purchase or sale on average will behave in the same way as they have in the past, producing results that we can capitalize on. To make the most of the power of averaging, it is also advisable to apply positive risk-benefit ratios to the risk management of our operations, so that the “average” operation will have a profit. When you apply a 1:3 benefit risk ratio to your operations, you can lose 75% of them on average to keep your account in balance (neither win nor lose). In other words, you must win 1 out of 4 operations to maintain balance, or 1 out of 3 operations to earn money.

When you look at your recent operations, you may not see these numbers, but if you continue to apply this principle, the numbers eventually “stabilize” and represent what we are exposing. For example, you could have 4 consecutive operations that end up reaching the 1:3 target, which would be a total return of 12 R (12 times the risk). After this, you could suffer a drawdown period of 5 losing operations, but it wouldn’t really be a drawdown, because you’d still be up at 7 R. On the other hand, this could happen the other way around, losing operations might come first, giving you a -5 R as a result of a losing streak. But if the next 4 operations win, the situation changes completely and you end up with +7 R.

This is somehow to be expected because the market moves through good and bad conditions to make money for each system, and the losing and winning operations will tend to cluster as the market cycles happen. Start using the power of positive risk-benefit ratios and eventually you’ll see the results. All this is true if we assume that you have an advantage in your trading system, such as using price action.
How Most Common Indicators Work

We could stay here and tell you how useless we think the indicators are, but you’re human and your curiosity will force you to explore them for yourself for sure. This is completely understandable, sometimes you need to explore them to remove any remaining doubts in your head about what you might be losing. This way you can know exactly what the indicators are and decide from your own experience whether they are for you or not. When you insert indicators to your charts, they usually expose your data in the form of a line chart or histogram. The indicator is like a “black box” that does the hard work internally.

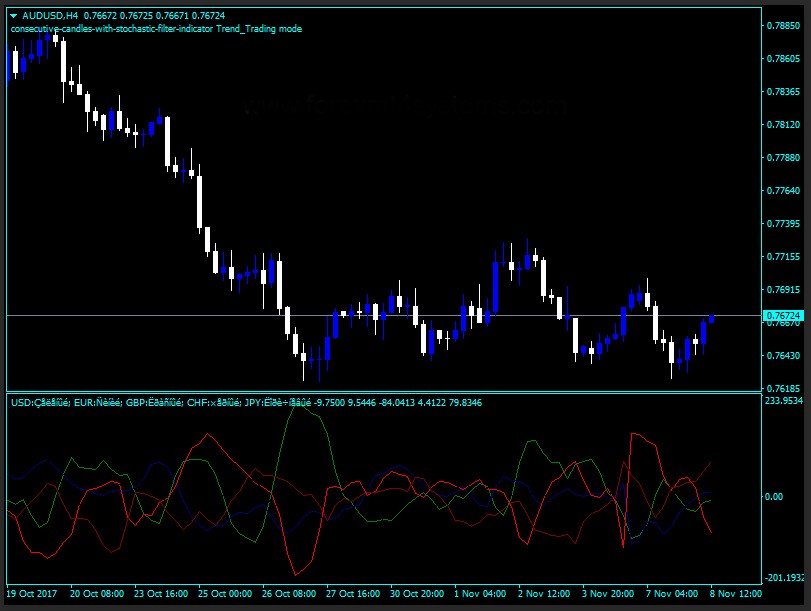
Would it surprise you if we told you that most common indicators are just a combination of price action data and mathematical averages? Well, it is true. Indicators such as stochastic, ADX, and CCI use the maximum, minimum, and closing prices of candles and pass them through averaging formulas. The ADX recycles its own data through multiple layers of averages.

The ADX is designed to quantify a trend by a certain numerical value. The result is that, if the value is too high, the trend will be more powerful. Here you can see how in the USD/SDG pair we have had this beautiful trend, but the ADX only showed a really confusing graph of lines that does not seem to correlate with the strength of the trend, or stability.

There are some custom indicators going around, which are actually joining multiple indicators within one, in an attempt to develop an extraordinary hybrid indicator. That is why it is well known that indicators have such a horrible natural mismatch. Some are notoriously worse than others, because every time you average data, the end result responds much more slowly to the real movement of prices. When you look at what is happening within most indicators, they are actually just a game with price action data, which are passed through some mathematical averaging calculations, it is not a big deal, just the same type of data but shown in different ways. This could be an advantage for some, but several of us would be frustrated with the performance of the indicators.

It is true that some indicators can work well under specific conditions for short periods, mostly in highly biased markets; but on the other hand, these indicators will give the trader a lot of poor quality buying and selling signals during conditions that are out of the optimal market behavior for which they were designed, and this could be as much as 80% of the time.

Presenting the Average Value Analysis

This is the basis for the analysis of the average value, the study of the price relative to its average value. We use average value analysis to help us determine many things in a price chart, such as:

  • The direction of the trend
  • Strength and momentum of the trend
  • Stability of the market
  • Signs of climax/exhaustion
  • Ideal points of purchase and sale
  • On Price Extension/Opportunities Reversion Operations to Average

The middle-value properties help the trader quickly remove noise, presenting a “summary” that you can use to quickly measure conditions at first sight, and help you make smart trading decisions. But of course, the analysis of the average value is not the only aspect that makes a good sign of trading. This along with price action and swing trading work synergistically with each other to create a powerful trading methodology that helps you read the graphics.

Categories
Beginners Forex Education Forex Basics

Economic Calendars and Forex Trading

An economic calendar keeps track of important news events and announcements that could affect the movement of a specific asset or the market as a whole. Economic calendars serve several different purposes and are especially useful considering that a lot of financial information can be released in a very small time span. If you’re looking to trade the news, then this is a must-have tool, although every forex trader needs to use one. This is what you need to look for on an economic calendar:

  • Monetary policies related to interest rates: this is related to changes in current interest rates imposed by national banks or when national banks or other accredited institutions make predictions about where interest rates will go. 
  • Monetary policies related to inflation: inflation is closely related to interest rates because national banks will adjust their interest rates to lower inflation.
  • GDP: this is the ratio of imports vs exports in a country. Having more imports versus exports generally signifies that a government is in debt, which is bad for investors. 
  • Employment rates: this is one of the main indicators of whether an economy is thriving. Investors typically steer clear of countries with high unemployment rates.

Investors need to be aware of the above because it gives them an idea of how the economy in a country is doing. News releases, especially related to finances or government policies, cause investors to make decisions. Some of these items are announced monthly, while others are released quarterly. 

In addition to keeping track of economic impacts, economic calendars also serve several other important purposes for forex traders:

  • They can tell you when to enter or exit the market: many traders enter or exit the market based on events that are indicated by their economic calendars. Trading in the direction of news events is one of the most popular trading strategies. Do keep in mind that unexpected events may take place, so it is good to have risk-management precautions or to look at other data.
  • They can help one to avoid an extremely volatile market: some volatility is good because it presents a number of opportunities to buy and sell, but too much volatility is dangerous for traders. It is more difficult to analyze the market when it is more volatile. Your economic calendar will let you know if there is going to be bad news so that you can avoid trading in these conditions altogether. 
  • They can help you get ahead: many beginners ignore economic calendars because they don’t understand how they work or how efficient they can be. Using one can help you get a better start than those traders, and it can also be helpful to those keeping a trading journal. You’ll be making better, more informed decisions and you’ll have more information to log. 

Economic calendars keep track of a lot of information. This is one of the main reasons that many beginners don’t bother with them. Many of these calendars will allow you to filter events by importance so that they can be used more efficiently. Events are labeled by colors to indicate the expected impact they will have on the market. Yellow indicates a low-impact event, orange indicates a medium-impact event, and red signifies events that should grab your attention. As you become more comfortable using an economic calendar, you’ll become more aware of what affects the market significantly and what doesn’t. 

As we conclude this article, we will remind our readers that economic calendars are must-have tools for any trader. Whether you’re just getting started or you’ve been trading without one, you need to learn how to use them to make better trading decisions. If you’re wondering where to find one, you should know that many brokers offer economic calendars on their websites for free. Try checking the education or tools section on your broker’s website. If you don’t have a broker yet or if your broker doesn’t offer them, then you can do a quick Google search for “forex economic calendar” to find many different options online.

Categories
Forex Basics

Are These Issues Causing You to Fall Short of Your Goals?

As a forex trader, you should always be working on self-improvement to make a better impact on your trading decisions. Making an effort to address problems like allowing negative emotions to interfere with your choices or not spending enough time researching trading topics you could learn more about are a couple of examples of things that can impact your trades. If you find that you aren’t meeting your trading goals, ask yourself these questions:

Are You Setting Realistic Goals?

When setting trading goals, many beginners start out with one thing in mind – making money. The truth if this is your only goal, you aren’t doing yourself any favors. It’s also a bad idea to set goals that focus on making exact figures, as it’s nearly impossible to predict that you will make a certain amount of money in x amount of time. It’s ok to have long-term goals, as long as you understand that it will take time to reach them. However, even your long-term goals need to be obtainable. If your goal is to make a million dollars and you’ve only invested $100, you aren’t setting a realistic goal. In the meantime, you should set short-term goals that are possible to reach. Here are a couple of examples of good short-term trading goals:

  • To spend x amount of time each day researching different trading topics
  • To actively log each trade in a trading journal and to review those results after a certain period of time, like a week or a month
  • To invest x amount of money into your trading account each time you get paid, even if it is only $5 or $10. 
  • To finish reading a book that was written by a successful forex trader

As you can see, the above goals can be reached fairly easily, but it will take some effort to get there. The reward centers in your brain will thank you when you complete one of these goals, which is better than feeling stressed out because your only goals are long-term and out of reach. 

Do You Have a Plan to Actively Meet Your Goals?

Sure, you might want to make money, but how do you plan to get there? You’ll need an active trading plan, which covers the following topics and more:

  • How you will find and execute trades
  • How large of a position you will take (i.e. your risk-tolerance)
  • What assets you will and won’t trade

Your trading plan basically covers what and when you trade, including decisions that involve entering and exiting trades. From there, you’ll also want to think about a trading strategy. A strategy is different from a plan because it outlines what type of trader you are. For example:

  • Day traders typically open a few positions each day and close them before the end of the trading day
  • Swing traders might open one large position or a couple of medium ones and leave them to accumulate for days or weeks
  • Scalpers open several positions a day (sometimes even 100 or more) and attempt to profit off very small price movements

The strategy you choose can offer benefits and drawbacks. For example, a scalper only makes a small profit off each trade, so one big loss can wipe out their earnings for that day. A swing trader is subject to swap fees, which are charged by brokers for leaving positions open overnight. Day traders don’t have to worry about these fees, but each person might not have the time or patience to take up day trading. 

The point is that you need to have a good trading plan and strategy set up to reach your goals. You won’t be able to make money without putting thought into the how’s and why’s of the way you trade. If you’ve been trading without a real plan, now’s the time to figure it out. If you already have one and aren’t meeting your goals, perhaps it’s time to look at your plan as a whole and to see if any changes need to be made.

Are You Tracking Your Progress?

We’re referring to a trading journal here. Some traders might start out using one, only to abandon it once they get a little more experience under their belt. Others might never use one at all. When you keep a trading journal, you log information about each trade you make, including your profits/losses, why you entered or exited when you did, any emotions you were feeling at the time, and so on. Later, you can go back and review that data to look for reoccurring issues that may need to be addressed. Sure, you might notice if you lose money, but without a trading journal, you may not be sure of your total profits or losses for a certain period of time. Once everything is in front of you, you might realize that something else is causing you to fall short of your goals. For example, maybe you exited several trades too early after losing money because you were feeling fearful after taking those losses. From a bird’s eye view, it’s easier to pinpoint where the real problems are coming from.