Categories
Forex Basic Strategies

Learning To Trade The Forex Market Using ‘2-Period RSI’ Trading Strategy

Introduction

When we look for a trade setup, most of the times we do not have an idea of the strategy, we will be using for taking a particular trade. From there, we start to pick random indicators and start trading using those indicators without a proper strategy associated with that indicator. With our 2-Period RSI strategy, we will solve this confusion by looking at the market with a systematic approach that involves using the RSI indicator. In addition to the RSI indicator, we will also use a 20-period EMA. Most importantly, we will look to take trades in the direction of the main trend.

Now that we know what our goals are, we will look into the various parameters of the strategy and understand how to apply the same.

Time Frame

This strategy works well on the 5-minutes and 15-minutes time frame. This is a perfect intraday trading strategy.

Indicators

The strategy uses RSI as its major indicator. We also use the EMA for identification of the trend. Both the indicators are applied with their default settings.

Currency Pairs

This strategy is applicable to most of the currency pairs listed on the broker’s platform. However, illiquid pair should be completely avoided.

Strategy Concept 

The concept of the strategy is very simple if we have a clear understanding of the previously discussed strategy. The basic idea of here is to trade the retracement of an established trend. Therefore, the strategy can only be used when the market is trending. Once the trend has been identified, we wait for a ‘pullback’ in the price and then take an ‘entry’ in the direction of the market after a suitable confirmation. The Relative Strength Index (RSI) is an important indicator in this strategy which helps us in measuring the over-extended phase of the retracement.

A reading above 70 indicates an over-extended ‘up’ move while a reading below 30 indicates an over-extended ‘down’ move. In an uptrend, we will look for a retracement that is overextended, implying that the RSI should be below 30. While in a downtrend, we will look for a retracement that is overextended, implying that the RSI should be above 70. The crucial part of the strategy is that we don’t enter for a ‘buy’ or ‘sell’ soon after the RSI gives an indication, but instead wait for a sign of reversal that confirms the continuation of the trend.

Trade Setup

In order to explain the strategy, we will be taking a ‘long’ trade in the GBP/USD currency pair on the 5-minutes chart using the 2-period RSI strategy.

Step 1

The first step is to identify the major direction of the market. Many technical indicators help in identification of the trend, but the one that is suitable for this strategy is the EMA. We will identify the trend of the market using the 20-period EMA, which is best suited as per the conditions of the strategy.

In our example, we have identified an uptrend whose retracement shall be evaluated.

Step 2

Next, we need to wait for the market to turn from its highest or lowest point, depending on the trend, and then check if that is a retracement or a reversal. After the price starts to pull back, we wait until the RSI shows a reading below 30, in an uptrend and above 70, in a downtrend. Once that happens, we become alert and watch the price cautiously.

Step 3

Now we wait for the price to reverse and close above the 20-period EMA, in an uptrend and close below the EMA, in a downtrend. Ensuring this step is critical as it confirms the continuation of the trend. We enter the market with an appropriate position at the close of the candle. There are two ways of entering the market. One, wait for the candle to close and then enter. Second, enter at the crossing of the price above or below the EMA. The second approach is an aggressive form of ‘entry’ and is not recommended for everyone. There is also a conservative form of entry, that is entering at the re-test of the EMA.

In the below image, we can see that we are entering at the close of the bullish candle above the EMA. But since the candle is long and has a large body, the ‘entry’ price is much higher than what we were looking for.

Step 4

Finally, we determine the stop-loss and take-profit for the strategy. The stop-loss is placed below the ‘low’ from where the market reverses and starts moving higher in case of a ‘long’ trade. In a ‘short’ trade, it will be placed above the ‘high’ from where the market reverses and starts moving lower. Since we are trading with the trend, the ‘take-profit’ can be set at the new ’high’ or ‘low’ that will result in a higher risk-to-reward ratio.

In our case, the risk-to-reward ratio of the trade is just 1:1 since we took a late ‘entry.’

Strategy Roundup

We are making use of the RSI indicator in a most constructive way which helps us in identifying when the market is overbought or oversold. Using the concept of trends, we are applying the strategy to reduce risk and maximise gains. The rule for entering the market in this strategy is what stands out. We are entering only after getting clear signs of confirmation from the market. We can also trail our stop-loss and exit when we get signs of another reversal. This is an aggressive way of taking profit and is mostly done to increase the gains.

Categories
Forex Market

Why are Forex Traders Losing Money in 2020?

What are the reasons why the vast majority of traders are losing money in 2020? It’s a pretty interesting question and the answers help you to better understand the market and give you a focus on what you should and should not be doing. Here, we’ve provided a summary of the most common mistakes seen within the industry this year.

Index

  1. Insufficient training to start trading
  2. Poor approach and lack of perspective
  3. Emotions interfere with your trading
  4. Do not limit losses
  5. Making predictions
  6. Trading scams
  7. Lack of persistence

Insufficient Training to Start Trading

More than 70% of the traders who start bankrupt their accounts in the first month. This fact says it all. It’s not that they lose money, it’s that they lose all their money. It is curious as for any other kind of professions as can be a doctor, teacher, dentist We dedicate years and to do trading you turn on your computer, watch some free videos on the Internet and you already think you can make a lot of money in one or two days. ¡ Ou, mama!

This does not mean that you have the need to spend years studying and training until you can start, only that your training takes time and doing things right beyond running and running and burning your account.

Poor Approach and Lack of Perspective

As you well know, there is too much information on the Internet about the study of graphics (chartism) and technical analysis. Lots of copied and pasted information that you start to devour and that many people apply over and over again. This has two consequences:

The vast majority of people lose money because they apply the same thing and this ends up making those patterns not fulfilled in the market. This way or approach to analysis is very subjective and makes you not know if what you’re learning or applying works. What we mean is there’s a lot of people teaching how to trade from twenty-page manuals without opening a real account or without results. There are few barriers to entry in terms of training and most are very theoretical.

All this, coupled with the idea that you can open a $100 trading account and take it in a couple of days at $1000, is a fateful cocktail. Recently someone asked me if I could earn 5 euros a day with 100 euros. We are talking about 5% daily. My answer was “How many days?”. You can earn 5% in one day, but you can’t expect to earn 5% or 1% every day. You know why? Because profitability in such a short term is not up to you. I like to say this because the other person’s reaction is usually to think “Okay, you don’t know, but you can”. After a while, that person usually remembers you. Sometimes the human being needs to be wrong to realize things.

All I can tell you about all this is that you need to see this business objectively and with a real perspective.

Emotions Interfere with Your Trading

It’s normal that you don’t feel the same when your account goes up as when your account goes down. We have emotions and that you feel them is normal. The problem comes when you do the opposite and your emotions interfere with your operations. For example, your adrenaline goes up and you start to raise your exposure and the size of your positions or, worse, you’re losing and you start doing surgeries without a beat. It works something like this, “Wow, I’ve run three operations and they’ve all been positive. From now on I’m going to double my tickets”. Or so, “The last two operations have been negative, abandonment”.

You need to create a methodology that makes you make cold decisions. This I have achieved with algorithmic trading, I focus on creating systems and evaluating them, measuring them. And once they’re running, I just supervise them. In this way you gain x1000 peace of mind and feel relaxed, knowing that you do everything that is in your hand.

Do Not Limit Losses

I’m not just talking stop loss that limits your loss when an operation is against you (of course they have to be applied). I’m talking about having the ability to eliminate strategies that are having a bad performance by others that can work better.

What most traders usually do is apply a single strategy. As you know, every strategy has a winning phase and a losing phase. What is it possible for you to do when you only have one strategy and start losing? Wait, little more. However, if you work with different strategies you can remove from your account those that behave worse and constantly incorporate those that do better. This will not just depend on a system and make your curve more stable.

Limiting losses is a key aspect of survival. Someday, whatever system you’re using will stop working. What are you going to do then?

Making Predictions

If you are a trader, you will often be asked something like “what do you think of the price of bitcoin?”. The reality is, no one knows unless you have inside information about it. And it’s not usually common unless a relative of yours is a colleague of Trump’s.

Making predictions in the press or social networks is very cheap. In the case of not fulfilling people usually delete the tweet or forget. But if everything goes as they said, they will say that they were right and that they are experts in it. You should not as a Forex trader depend on this.

You also don’t need to make predictions to make money. You need trading systems with a statistical advantage in your favor. Don’t worry about how to do it, nowadays there are tools that allow you to do it without programming and create your own arsenal. This is what I do myself and I recommend you to do: focus on creating strategies, check that they are robust, apply them and supervise. That’s it.

Trading Scams

Yes, unfortunately, there are many online scams related to trading. Unregulated brokers, groups of signals that make up your results, martingale robots that burst your account. You need to know that all this is there and not fall down to know what is best for you. You need to differentiate what is right for you from what is not.

You want profitability or you want to lose everything already? Many people fall into this kind of scam not because they are clumsy, but because they have the illusion of multiplying their money in a few hours and just in case they try. It happens in different sectors, in sports betting, online shops that do not deliver their products, etc. This has been and will be there. The question you have to ask when a broker calls you offering something is whether it is aligned with your interests. This type of broker wins when you lose. Need a partner for your business who would make money if you perform badly? It doesn’t make sense. Just avoid all of it and keep your head clean to focus on what you’re really interested in generating profitability.

Lack of Persistence

Many people are attracted to trade as a way to make quick money. They start, they start with a lot of risks and when a losing streak comes they leave it. They don’t know exactly what the subject is. They seek to make money by doing anything. And they finally end up losing all the money doing a lot of things. All without results.

Like any other business, you’ll need to take some time off and not run off at the first exchange. If you’re not really attracted to trading and just looking for results, you have a lot of ballots to go out the back door.

Change the Chip

It may seem complex, but it’s very easy to avoid all of the above. From not reading biased news or predictions, from being relaxed looking at your screen while watching how the EAs are running. I certainly do not know what will happen to the price of the EUR/USD pair, or EUR/GBP. I am dedicated to creating strategies that have worked based on profitable patterns. I test them and measure their robustness and work with a number high enough not to obsess over the performance of one. I eliminate the ones that don’t work well and incorporate the ones that are working correctly.

It all comes down to working with systems that make you take positions without thinking too much and react by impulses. The only thing we have as traders is the possibility to see how things have gone in the past. We do this through backtesting. Doing reliable backtests and managing your strategies in the present is how I’ve managed to get results, doing all this in a scalable and bearable way.

If you can automate to leave out of control the divergences of doing it manually, but you can start discretionally. The important thing is not to automate by automating, the important thing is to apply strategies that work. This is what is in your hand. At present, the real question is, how can I know what works? The answer is simple, focus on statistics.

Categories
Beginners Forex Education Forex Basics

As a Forex Trader, Get Used To Being Wrong

Trading is a game of probabilities, ultimately you will either get something right or you will get something wrong, when we look for trading opportunities, we are actually looking for a number of different probabilities, each thing that affects a trade will add a probability towards the markets going up or down. We correlate these into a buy or sell, the one with the higher probability we go for. Sounds simple, and it is, the problem comes from the fact that the markets don’t always do what they are supposed to do and that you cannot take every single probability into account so you may miss one, but that one is a major one that would have gone against you.

So considering the fact that we look at so many different probabilities you would expect that we would get the majority of our trades right, but it is actually the complete opposite, you should actually be planning to get the majority of them wrong, especially when you are first starting out in your trading career. There is a reason why the majority of people fail and lose the money that they put in. However, one of the best defences to losses is to expect them in the first place, we are going to take a look at why it is so important to recognise that you will make losses, lots of them, and why you should be prepared for them.

The question of why we need to be able to prepare ourselves for losses is so simple to gain an understanding that you will have losses and a lot of them. People see the big numbers that others have gotten or have said that they have gotten (don’t believe everything you see on the internet) and so come into the trading game with the expectation that they will do the same with very little issue along the way. There needs to be an understanding that even the most consistent and most profitable traders will have losses, or multiple in a row, in fact, people can be profitable even with a very low win rate. So if even the best traders in the world are making losses, then you should certainly expect to make a few too.

Just because you have made some losses does not mean that you are doing anything wrong or that you are bad at trading, it does not mean that your analysis was bad or wrong, it simply means that the markets moved against all the positive probabilities that you had found, and this happens, a lot. Sometimes it can be something completely out of the blue, a natural disaster somewhere, or a certain president putting up a new twitter post. These things are out of your control, they are not available to be analysed and simply happen, throwing the markets out of synch and potentially causing your stop losses to be hit. You cannot really blame anything you have done for that.

You need to be in the state of mind where you are able to accept when you are wrong, you need to be able to see what you have done wrong or whether or not it was out of your control, as long as you are able to accept it, then you will be putting yourself in a good position for getting past it and for changing your own ideas to be slightly more successful. Your losing trades can give you an idea of certain assets or trades to avoid in the future, it can tell you if you are risking too much and they can ultimately help you to become a better trader.

So what we need to do next is to recognise that trading is not all about the ideas or the overall strategy that will make or break your account, it is your own personal skills as a trader. Of course, it will take those things mentioned above into account, but it will be looking at you as a whole and your overall understanding of what you are doing and trading. If you have confidence in what you are doing, confidence in the risk management that you have pt in place, you will be far more open to being wrong and to having losses, as you understand that those losses are a part of trading and that you are able to get through a number of losses without too much issue.

If you are still not used to the losses, then try keeping a trading journal (you should be doing this anyway) in order to document those trades that have lost, this will then give you a good insight into why it went wrong which can allow you to alter things in the future to help minimise your future losses.

There are a few things that you can think about to help reduce losses and to enable you to better accept those that you have. Consider how long you hold onto trades before they hit your targets, are you holding them too long or for not long enough? Consider what level of losses will be enough for you to consider altering your strategy or your own biases within the markets. Remember, that your job as a trader is not there to be right every single time, you are there to be profitable, while they do go hand in hand, you do not need to be right in order to be profitable We mentioned before, that many profitable traders have a very low win percentage, but because the rest of their strategy is on point, they can still come out with some money.

If you are not able to accept losses when they occur, it can lead to a number of different issues, it can put you into a slump or create emotions that could jeopardise your trading. If you feel that you have lost too much then it can make you want to get it back by increasing your risk, which is not a good thing at all. Make sure that you learn how to accept those losses so you do not fall into a slump which could potentially put your account in danger.

So those are our views on accepting losses, you will be experiencing a lot of them as you trade. It is paramount that you are able to accept those losses and that you are able to get through them. The earlier that you are able to do that, the earlier you can get through them, and the quicker you can become a profitable and successful trader.

Categories
Beginners Forex Education Forex Basics

10 Steps To Starting to Trade Forex

Forex trading is complex, there’s no doubt about it. However, it is an absolutely fantastic opportunity to get yourself some financial freedom to get out from under that horrible boss that is holding you back and making your life hell. While it is a great opportunity, it also isn’t an easy one, if it was, there would be millions of more successful traders out there. Many people end up giving up or losing whatever it is that they have invested, this is down to the simple fact that they simply did not know what they were doing, or at least not properly. They have not had any guidance and so they do not have any obvious routes of progression.

We have come up with 10 steps that you can follow that will help guide you through the starting points of your trading journey. They are not perfect and there may be some things that you feel you want to do differently, but stick to at least a similar track, and it will make the process of learning and developing yourself as a trader a lot easier. So let’s get on with 10 steps to start your forex trading career.

Step 1: Learn everything!

Ok, so maybe not absolutely everything, that would be impossible, but you need to be willing to learn everything that you need to, which may actually turn out to be a lot more than you are expecting. If you are just starting out then you probably don’t know much about it, you probably only know what you have been told or what you have seen from the outside. There are a lot of different terms and phrases out there that will make little to no sense to you, these are things that you are going to have to learn. 

Forex is a game of probabilities, many see it as gambling, you need to come in with the mentality that it is not, you are there to play the game, not to gamble. You should never place any trades without first understanding why you are placing it and what your chances are of it being a good trade. One thing that you need to understand is that you will never really complete this stage, there are always new things to learn when it comes to trading so you will be constantly learning throughout our trading career, but coming into it knowing that you are required to keep learning and to learn pretty much everything you can is a great first step.

Step 2: Get a broker

There are a lot of brokers out there, thousands if not potentially millions, so it would be unreasonable to have you look at every single one in order to work out which one is right for you. As you were going through the first step, you most likely would have come across a number of different brokers In an ideal world you would go with one of the more trustworthy and well-known brokers, checking reviews from independent sources and also asking any actual traders that you may know who they use. Try not to look for special offers or bonuses, instead go for one with better trading conditions and ones that others give good recommendations for, these in the long run will work out a lot better.

Step 3: Open an account

Each broker that you find will most likely have a number of different account types available, each one offering slightly different trading conditions Our favourite type of account is an #eCN account as they generally come with low spreads and if the commissions are kept low they can be a dream to trade on. As You are just starting out we would suggest opening up an account that does not have a hefty initial deposit limit, in terms of leverage, it is not too much to worry about at this point as again, you are just starting out so you do not want to over-leverage yourself. Be sure to play around with demo accounts too, try to get a demo account that does not start with a million bucks, this is not realistic, you want a demo account with a similar amount to what you would be trading live. Just bear in mind that while this is your first account, it certainly won’t be your last, so it is not the end of the world if it isn’t perfect, you can always open up another one before going live.

Step 4: Download a trading platform

Different brokers will offer different trading platforms. The most popular ones around the globe at the moment is from the MetaQuotes company, they have two platforms, the most popular MetaTrader 4 and the slightly less popular MetaTrader 5. MetaTrader 4 dominates the retail trading market and is one of the best supported by the various brokers. It also comes with tons of documentation as well as addons through the form of indicators and expert advisors (automated trading robots). Try out a couple of different platforms, but if you are really not sure, we would say to play it safe and stick with Metatrader 4 as your trading platform of choice. This is an important choice as not having a platform basically means that you cannot trade, however, much like with the accounts, it is not the end of the world if you start with one which you end up not liking, you can very easily switch to one of the other available platforms.

Step 5: Get a risk management plan

It may seem like a relatively small thing to do and it doesn’t actually take much time, but creating your risk management plan is one of the most vital things that you can do. It can be the make and break of your strategy, it is the thing that stands in the way between a small loss and a blown account. You can of course trade without one, but it is not something that pretty much anyone would recommend. The risk management plan is simply a set of rules that you have put in place to protect your account. Many people look at risking 1% to 2% of their account per trade, the risk management plan ensures that no more than this is lost with each trade, without one that 1% loss could in fact turn into a 100% loss. Try to make it in like with your own risk tolerance so things do not get too stressful for you.

Step 6: Learn to analyse the markets

This is where you can work out which trades to actually make. There are a lot of different ways to analyse the markets and each person will probably tell you differently. We are not going to instruct you on exactly how to do it, that will be up to you to learn the way that suits you, but we will give you some ideas on what to look for. Many forms of analysis will fall under one of two categories, fundamental analysis or technical analysis. Fundamental analysis is all about looking at how things like news events will move the markets, things like GDP or unemployment rates. Technical analysis is where you look at the markets as a whole, many people use indicators to gather this information, they can measure a number of different things and many traders seem to edge towards the technical analysis side of things. It is important that you go for the one that better suits you, so try out a few different techniques.

Step 7: Place some trades

Hopefully, you now have a grip of some of the basics, you have a broker, an account, and a trading platform, you also know how to do some basic analysis and have a risk management plan in place, the next thing to do is to actually place some trades. You should be doing this initially on a demo account, of course, and this is where you will really get a feel for trading. This is where you will work out what has worked for you and what has not, giving you the opportunity to change things and improve. Make sure you do not have the expectation of being able to win straight away, many go approximately a year before they have winning months, so you should be expecting something similar. Use these trades as a gauge for the level you are at, use them to improve.

Step 8: Look at trading styles

There are a number of main trading styles, the shorter-term day trading and scalping and the long term swing trading and position trading. Being able to find the one that both matches your personality but also works for the amount of time that you have to trade. Generally the shorter the trading timeframe the more time you need to be sat at the front of the computer. So if you only have a few minutes each day, scalping will not really work for you. Starting out, you are probably doing it part-time along with your job, so try out the longer-term ones initially, of course, if you have days off during the week, scalping could still work for you. Try out all four styles before deciding though, you may find that you enjoy one of the ones you otherwise thought you would not.

Step 9: Start and keep a trading journal

A trading journal is a vital bit of kit, it is basically where you write down everything that you do when it comes to trading, the trades you made as well as the ones you did not. You also include the reasons why you made it or didn’t, how long it was kept open, the profits, the losses, and more, pretty much everything. This gives you the perfect document to review when things have gone well as well as when they have not. It can tell you of your trading habits, making it easier to find the bad ones and get out of them, it can also tell you whether you are sticking to your trading rules, all very valuable information when looking to improve.

Step 10: Learn some more

We said that step one was going to be ongoing and so it is here at the end too. You will never stop learning, as soon as you think that you know everything you will be in trouble. Always consider yourself as available for learning, do not be afraid of things that you do not know, embrace them, and take on the new knowledge.

So those are out 10 steps to start forex trading. There are, of course, other things that you should be doing, but those will become apparent as you go along. Follow the steps above and you’ll get off on the right foot for when you decide to start your trading career.

Categories
Beginners Forex Education Forex Basics

Achieving a Livable Trade-Life Balance

You often hear the phrase “maintaining a work-life balance” being thrown around by those that have a normal full-time job, or even two jobs. The whole idea of this phrase is that many people find it hard to juggle their work life and their home life and believe that they just do not have enough time to do both., this is one of the draws of forex trading, people see it as a way of getting away from the work grind, to be their own boss and to only work the hours that they want to. The problem is that this is not exactly the case, many traders actually find things harder than they would with a normal day job. You are now relying on your trading, every win and every loss has a much greater meaning, one that could affect your life.

So if people are finding the trade to life balance difficult, why do they continue? The problems that once you have made the plunge into full-time trading, it is very hard to actually get out of it. Remember, you are now reliant on income and your results. It will take time to find another job, so the only thing that you can do now is to work out a way to help you balance your life between your trading and your own time. There are a number of things that people do which make this difficult, we will be looking into them as well as looking at things that you can do to help give you a slightly better balance between your trading and everything else going on in your life.

Let’s jump straight into some of the downsides to having a bad trade to life balance, the first is pretty obvious, something is going to have to give. You cannot have either a lot of trading time or a lot of your time. If you put too much into one, then the other is going to suffer, so if you trade too much, you may lose other aspects of your life like time with your friends and family, or gym time, the things you enjoy doing. On the other side, if you have too much free time or time with your family, then you will not be able to trade as much and so may not be able to make enough to keep you afloat this month in terms of bills. So a balance needs to be met. 

It is also not good for your health. Doing something for a long time can give you a number of different medical conditions. Long term or chronic stress can set in, especially if there is a lack of exercise in your day. Sitting in the same position for long periods of time can have a negative effect on your muscles, bones, and posture, something that you would want to try and avoid through movement and taking regular breaks. The problem with trading is that anything can happen at any moment which could affect the markets, this gives you the impression that when you have a trade on, you need to be there and ready to react to things that happen. In a sense this is true if you have not put things in place, however, there are ways to avoid this that we will look at later. Unfortunately, many people do not use them and so are stuck sitting at the computer or if not, constantly checking their phones which will no doubt annoy their partner.

Another thing that causes you to go a little off track in relation to your work-life balance is if you have set up your trading terminal at home. When you are working a job you have strict start and end times, something that is monitored by your manager or boss, this is not something that you experience at home. You chose when to start and so for many when first starting out, they may find their bed a little too comfortable, so comfortable that they do not want to get out of it, pushing your start time back and simpy meaning that you do not have enough time to trade and analyse properly.

So we have looked at some of the negatives, there are of course more of them, showing how tricky this can be, but there are other things that you can do to bring yourself back and to strike a much more healthy trade to life ratio, one that should keep you floating and your family and your wellbeing happy. So let’s take a look at what some of them could be.

The first thing that you need to do is to create a simple schedule, this will include some of the basic things like the time that you will start trading and the time that you will finish. It is important that you set this up as a work schedule, make it realistic, something that you will easily be able to stick to, if you make it too complicated or at different times each day it will be far harder to stick to and you will more likely start to slip out of it. Treat It like a job, you are going to work still, believe that it is like that and it will be easier to stick to and to force yourself out of that comfy bed.

So you have set up your schedule, but some of your trades go longer than your finish time, what can you do? You can either completely ruin the work that you have it in by constantly monitoring your trades when you are not meant to be, or you could use the simple things known as a stop loss and a take profit level. These allow your trading platform to automatically close trades when they get to a certain level, either positive or negative. This means that you no longer need to be actively monitoring your trades and terminal, you can let it do that for you, so now you can go off and concentrate on whatever it is that you were planning to do.

Some people wake up in the night wanting to trade, if this is you, then you need to be able to force yourself to stay in bed, do not get into the habit of getting up in the night to check your trades or to check the markets, not even on your phone. The more you do it, the harder it will be to stop at a later date, so this is a habit that you need to get rid of straight away.

When you are trading, ensure that there aren’t too many distractions around, remember, you are trading now to live off the money you make. The last thing that you want is to get distracted and to then not make enough, this will in turn mean that you need to work late and long hours in order to make up for it, so ensure your trading environment is distraction-free.

Take regular breaks in your schedule, but make sure you plan them. Think about your strategy, there are going to be certain times of the day where the markets just do not suit it, such as when the markets change over from London to New York as an example. This is the perfect time to plan your breaks. Use that hour to go off and spend time with the family, or to do something that has nothing to do with trading. Use this as a way to add a little balance into yo day. Once you have brakes planned, stick to them and come back when you are meant to.

The most important thing to remember is to set your schedule and then stick to it. You need to treat trading like a job, I know we have mentioned it before but it is vital that you understand this, treat it like a job. Afterall, it pretty much is your job now, you use this to pay your bills and to buy your food, so the sooner you act like it and stick to a working schedule, the quicker you will be ready to continue this journey and to have a much healthier work to trade balance.

Categories
Beginners Forex Education Forex Basic Strategies

The World’s Most Dangerous FX Trading Strategies

It is vital that you have a strategy when trading, the strategy is what lets you know how you can get in and out of your trades as well as containing the risk management for your account. So it is important that you have one, however, you need to consider what sort of strategy you are planning to use, the fact is that there are good strategies and there are bad strategies. A bad strategy does not necessarily mean that it will make you lose. Some of them can actually make you a lot of money. They are often considered bad because of the risks involved or the inflexibility that they have when things go against you

So we are going to be looking at some of the strategies that a  lot of people consider bad, remember, it doesn’t mean that they do not work, it just means that there are some very obvious flaws in them that the markets will not be afraid to exploit.

The Martingale Strategy

If you have been involved in trading or gambling or pretty much anything to do with investing then you most likely would have heard of the martingale strategy.. It first became popular casinos, specifically on the roulette tables and later on Blackjack tables. The idea behind it is simple, place a $1 bet and place it on red or black, if it wins, you double your money, if it is wrong you lose. If You lost, the next bet you put a $2 bet on the same color, if it wins you are -$1 + -$2 + $4 so $1 in profit, if it loses, you double again. So a $4 bet on the same colour, this method will continue until there is a win when you win, you will always be that $1 up.

Sounds good right? In principle you will always win that $1, there is no way that you cannot, well apart from the fact that you do not have unlimited money. Let’s say that you have a balance of $1,000, how many times do you think you can put a bet on using his strategy? 10? 20? 50? In fact, your $1,000 account could only manage to put on 8 trades, just 8, if all 8 lose then you will blow that account. The only way that the Martingale strategy works if you have $an unlimited amount of money. The thing is, people know what you are doing, the casino world got around it by limiting the maximum bet that you can make, so you can only get 4 or 5 bets on before it becomes unprofitable.

So how does this work with trading? It is pretty simple and works exactly the same way, you place a 0.01 lot long trade on EURUSD, it, unfortunately, moves against you, so you decide to open up another position, this time though it is at a 0.02 lot size. This means that the markets do not need to move as high in order to make the overall positions profitable. However, if it goes south, you now have 0.03 lots adding to drawdown. So you add another position, this time 0.04 lots, the markets gain you do not need to go as high to get you out. But as it continues the wrong way, you have 0.07 lots going against you. This can continue because when the markets go on a strong trend, and if they do, it will continue to drag you down. If you keep adding positions until your margin no longer available, your account will eventually be depleted. 

If it is so risky why do so many people use it It is simple really, it is by far the easiest strategy to get into and to learn. There is very little to learn at al. Some people can literally just stick a  random trade on, regardless of the markets and the direction doesn’t matter. It is a complete gamble to them as the market will eventually turn right? It is also the easiest trading robot to create, which is why there are so many of them out there for sale. If you go to any trading robot marketplace, a large percentage of them will be using a form of this strategy, simply because it is a quick and easy strategy to use, although it is also by far one of the most dangerous.

We would advise sticking clear of this strategy unless you love to gamble and do not mind losing all the money that is already in your account.

Grid Strategies

A grid strategy is actually very similar to the Martingale strategy, the main difference is that with a grid strategy, there is not an increase in the bet or lot size that is being used, they often also have a number of different ways of getting out of trades. While the drawdown and lot sizes do not increase quite as dramatically, it does post a lot of the same risks and is still considered as a very dangerous strategy to use.

The strategy takes a very similar pan as the Martingale strategy does, as things go against you, you open up additional trades in the same direction, the main difference between this and the Martingale strategy is that the size of the trade is consistent, it does not increase with each additional trade.

There are also some differences in the way that the trades close, the grid strategy will generally do this in one of two ways. It will wait until the markets change direction and will then close the entire basket of trades once it goes into profit. The other method will close off the most recent trade when in profit and then close off the oldest trade or part of it so that the overall position that is closed is profitable. This will slowly eat away at the first trades that were made, eventually closing them out.

Much like the Martingale strategy, this has a lot of potential for the drawdown to begin to grow exponentially depending on how many positions are open, this is another reason why many more experienced traders would advise you to steer clear of this strategy.

Mass Scalping

Not the official name for it, but this is a simple strategy when you are trying to grab as many 2 to 3 pip wins as you can, sounds easy right? The problem with this strategy is that it can get out of control very quickly. It’s only 3 pips, right? Easy, most trades move to that position at some point right? Wrong, trades can continue to move against you, but you haven’t planned for this so when do you decide to get out of the trades? They could be taking away the profits of the past 20 or 30 trades. As you are putting on so many, it can be quite hard to keep track of everything and this will only lead to complete disaster and ultimately a loss of your account.

Strategies Using too Many Pairs

Not a specific strategy, but there are a lot of strategies out there that tell you to diversify and to trade a lot of different currency pairs at the same time. It is far better to have a strategy that focuses on one of two different assets. You need to remember that different currency pairs and different assets all move differently, there are different elements and factors that dictate whether they go up or down. In order to trade all of them successfully, you need to have an understanding of them all, this is just nothing that is practically possible in the real world.

Do not use strategies that trade 20 different pairs, it will be confusing and you won’t be able to keep up, let alone know why you are making those trades. Stick to strategies that specialise on one or two strategies, you can then expand into other strategies that work with other pairs instead of using one that claims to work with them all.

So those are just a few of the strategies that you really should avoid, they may well work for a short time, but the risks that they bring and put on your account only means that at some time in the future, they will blow it, so try and stick to those less risky strategies, even if they are giving you slightly lower yet more realistic returns.

Categories
Forex Psychology

Positive Thinking = Positive Trading: The Power of Positivity

Staying positive can be difficult, especially when things are no longer going your way, and when trading in the markets, there are countless things going on that can cause you to have a slightly more negative attitude. With currency trading, the markets like to go on trends and when these trends go against you it could lead to potentially weeks of things not going your way.

Positive thinking and personal development are incredibly important things, not just when trading but in anything in life, your job, your family life, it all requires personal development and certain levels of positive thinking in order to be successful, trading the markets is no different in this regard.

So we want to be in a positive mindset when we go into trading, but how do we get into this mindset? Well, there are a  few things that we can do, and they are important to get right. Going into trading with a positive mind will give us extra motivation and confidence within the markets and our own strategies and trading plans.

Start your day on a positive note:

This may seem obvious, but being able to start your day on a positive note will give you a good starting position, you will begin the day motivated, confident, and ready to trade and learn. Prompt yourself and remind yourself as soon as you get up that the day will be a good one. You may look strange talking to yourself, but this sort of self-motivation can work wonders on our daily outlook and productivity.

Use constant self-assurance:

Throughout the day, things will happen that will put a dent into our positivity, especially when trading and a trade does not go our way. You need to be able to keep self-motivating yourself by telling yourself that things will turn around and that your next trades are going to go well. It is good to remember that losses are a part of trading, your strategy and trading plan has taken them into account so they should give you any negative thoughts, instead, chalk them off as part of the ride and try to keep that positivity up.

Positive environments:

One thing you could change is the environment that you trade in, what brings you more happiness, a plane grey room with a desk and a window, or a colourful room with plants, colours, pictures, and other things? I am assuming the second, this is the sort of environment that you want to trade in, a room that makes you happy and makes you feel positive. Trading in a depressing room will not only prevent certain levels of inspiration, but it will potentially make you feel bored or other negative thoughts. Of course, don’t just stuff the room full of all your favourite things, this could cause unwanted distractions, just make sure it is a nice room to be in,

Spread positivity to others:

When you are feeling positive, it is important to pass those feelings onto others, not only to help them but to also help yourself. Talking to others can bring up their positivity levels, doing so will help to cement the positive vibes into your own mind. Once others are positive, there is a good chance that they will be able to lift you back up should your positivity begin to fall. It can become a positivity circle and can be beneficial for everyone involved.

The currency markets can be depressing and stressful places, but they can offer a lot of fantastic things too. In order to get the most out of them, you will need to go in with a positive mind and a positive attitude, doing so will make it far easier to both learn and develop our own trading techniques as well as motivating you to actually trade.

Categories
Forex Basics

How to Rejoin the World of Forex Trading

Starting again with anything in life can be a bit of a challenge, after all, how can you start from fresh when you already have some knowledge and have most likely already built up some biases within the markets and for certain trading strategies. It can be difficult, no doubt about that, it will take a lot of work too, do you remember how much reading you needed to do, how many websites you had to visit to get the knowledge that you currently have, well we will be doing that all over again.

So why would you want to start over? There are many reasons why someone would want to, maybe you had an extended time away from trading, if you have stopped doing something for a year, when you come back you still have the knowledge of it, but a lot of things have changed, or you have forgotten certain parts of it, sometimes it can be easier to just start from scratch and start learning again rather than trying to find the little bits of information that you are missing. You could be in a situation where your current strategies just aren’t working and you don’t have the motivation to fix them, starting again can help drive more motivation into your learning and trading as you will see far more progress over time if you have started from the start again.

Learn the Markets Again

Relearning the markets from ground zero can be a little daunting and challenging at the same time, you are trying to re-learn things that you already know, or at least think you do, this is probably the most boring part of starting again. It is important that when doing this, you do not get held up on your own learning, what you knew before is now irrelevant, we want everything fresh, things may have changed from when you last learned it and so we do not want your past biases to take effect on your learning, learn everything, even if you do not think it would be relevant.

Remember Your Strengths and Weaknesses

While we are starting from scratch, one advantage that you will have over someone who is entirely new is the fact that you know your strengths and your weaknesses. You need to remember these and keep them, not only does this help you with building the first strategy of your restart, but it also helps you to focus your learning, there is no point on concentrating on the bits that you are good at, instead it allows you to focus some more of your time on your weaker parts, thus bringing your overall trading abilities up, you never know, these weaknesses could have been the parts holding you back before.

Use a Trading Journal

You have probably had people tell you to always use a trading journal, a lot of traders do, but a lot of treaders started them well into their trading journeys. This is your opportunity to start one at the beginning (of the re-start). Why would this benefit you, it will allow you to see exactly how your trading is developing, you will begin to see patterns forming, but also even the most subtle of changes will be brought up, you can then look at the figures and see where you are going right or wrong. If the changes are good, keep with them, if they are bad, you can revert back to the point where things were going right. Keep entries of everything you do and it will help guide you to far better trading in the long run.

Keep on Trading

Keep trading, the best way to learn is to do it, trade, trade, trade, of course, you want to be trading in line with your strategy. As all professionals or experienced traders would say, use a demo account to practice, this is your way of honing your skills, practice your established strategies and new strategies alike. The more that you trade the more used to trading you will become and your data you will gather in order to analyse your own trading abilities.

It is never easy starting over, you will feel like you have lost all the time you spent learning before, but this is not the case, you will still have knowledge of your strengths and weaknesses, you will still have a decent understanding of the markets and various strategies. Starting over is more of a way of refreshing your knowledge and getting a fresh view on things, especially if they have changed since the last time you traded. Practice and record everything you do and you will soon find the motivation to go much further than you did before.

Categories
Forex Fundamental Analysis

Everything You Should Know About ‘Retail Sales YoY’ Macro Economic Indicator

Introduction

The computation of gross domestic product takes into account the consumption by households. In the households’ consumption, the retail sales data is considered to be the best leading indicator. Retail sales account for the majority of consumption by households. Retail sales are estimated to account for up to 70% of the US economy. It is, therefore, important for forex traders to understand how it affects the economy and the currency.

Understanding Retail Sales YoY

Retail Sales: the definition of retail sales is the purchase of finished goods and services by the end consumers. As an economic indicator, retail sales are used to measure the changes in the value of the goods and services bought at the retail level. This change can be monthly (retail sales MoM) or over the previous twelve months (retail sales YoY).

Retail Sales YoY: covers the retail sales made to consumers for the preceding 12 calendar months. It measures the rate of change in the value of purchases made by households.

How Retail Sales YoY is Measured

The data collected for the YoY retail sales cover all retail outlets from physical stores to e-commerce. It also includes data from the services sector, such as hotels and restaurants. According to the US Census Bureau, retail sales are divided into 13 categories, which include: e-commerce retailers, department stores, food and beverage stores, health and beauty stores; furniture stores; hospitality, apparel, building stores, auto dealers, and gas stations.

In the US, the measurement of the annual retail sales is done using the Annual Retail Trade Survey (ARTS). The ARTS is aimed at giving the estimates of the national total annual sales, sales taxes, e-commerce sales, end-of-year inventories, purchases, total operating expenses, gross margins, and end-of-year accounts receivable for retail businesses. This survey is conducted annually.

The retail sales YoY tends to be influenced by the seasonality of the economic activities since it covers more extended periods. These seasons including the holiday shopping seasons account for about 20% of the retail sales YoY. As a result, retail sales YoY cannot be expected to provide the most current and up-to-date retail data.

How Retail Sales YoY can be used in Analysis

As aforementioned, the retail sales account for about 70% of the GDP, making it a vital leading indicator.

Consumer spending drives the economy. An increase in retail sales implies that more money is circulating in the economy. This increase could be a result of increased wages, which increases the disposable income, increase in the rate of employment; and accessibility to loans and credit. All these factors increase the aggregate demand within an economy. The increase in demand leads to an increase in aggregate supply. This increase leads to the creation of more employment opportunities due to the expansion of businesses. Therefore, a steady increase in the retail sales YoY signifies that the economy has been steadily expanding over the long term.

Source: St. Louis FRED

Declining retail sales YoY is an indicator that the economy might be contracting. The decrease in retail sales implies that there is less disposable income within the economy, either as a result of low wages or job cuts. Subsequently, there will be reduced demand for the finished goods and services in the economy, which will, in turn, compel producers to cut the output to avoid price distortion. The reduction in the production will force them to scale down their operations, leading to more unemployment. Thus, a continually decreasing retail sales YoY could be an indicator of a looming economic recession.

Since the retail sales YoY are spread out over 12 calendar months, it provides a comprehensive outlook for the central banks to monitor the effectiveness of their monetary policies. In the US, the Federal Reserve Board uses the accounts receivable data in monitoring retail credit lending.

Monitoring the retail sale YoY enables the Federal Reserve to keep an eye on the rate of inflation. A continually increasing retail sales YoY, if left unchecked, could lead to an increased rate of inflation beyond the target rate. Thus, to ensure this does not happen, the central banks consider this data when making the interest rate decision.

Conversely, since a continually decreasing retail sales YoY forebode a possibility of a recession, this data encourages governments and central banks to implement expansionary fiscal and monetary policies. These policies, such as cutting the interest rates, are meant to reduce the cost of borrowing and increase access to credit hence spurring demand within the economy.

Impact on Currency

As established, an increase in the retail sales YoY is synonymous with an increase in economic activities and an expanding economy. A country’s economic growth leads to an increase in the value of its currency. Thus, increasing retail sales YoY results in currency appreciation.

Conversely, the declining retail sales YoY forebodes a looming recession and a possible interest rate cut in the future. More so, this decline signifies an increase in the unemployment levels and a contracting economy. All these factors contribute to the depreciating of a country’s currency.

In the forex market, the retail sales YoY is a low-level economic indicator. It is overshadowed by the MoM retail sales data, which represents the more recent changes observed within the economy.

Sources of Retail Sales YoY Data

In the US, the retail sales YoY data is released monthly by the United States Census Bureau, along with the monthly updates. A comprehensive breakdown of the US retail sales YoY can be accessed at St. Louis FRED website. Statistics on the global retail sales YoY can be accessed at Trading Economics.

How Retail Sales YoY Data Release Affects The Forex Price Charts

The most recent retail sales YoY data was released on August 14, 2020, at 8.30 AM ET. A more in-depth review of the data release can be accessed at the US Census Bureau website.

The screengrab below is of the retail sales YoY from Investing.com. On the right is a legend that indicates the level of impact the fundamental indicator has on the USD.

As can be seen, the retail sales YoY data release is expected to cause low volatility on the USD.

In the 12 months to July 2020, the retail sales YoY in the US increased by 2.74%. This increase is higher compared to the previous increase of 2.12%. In theory, this increase should appreciate the USD relative to other currencies.

The screengrab above shows the simultaneous release of the monthly retail sales data and the retail sales YoY data. It is to be expected that the monthly retail sales data will dampen any impact that the retail sales YoY would have had on the price action.

EUR/USD: Before the Retail Sales, YoY Data Release on 
August 14, 2020, Just Before 8.30 AM ET

As we can see from the above 15-minute EUR/USD chart, the pair was trading in a weak uptrend. This trend is proved by the 15-minute candles crossing above the slightly rising 20-period Moving Average.

EUR/USD: After the  Retail Sales, YoY Data Release on 
August 14, 2020, at 8.30 AM ET

After the news announcement, the pair formed a 15-minute bullish candle. This candle indicates that the USD weakened against the EUR. Subsequently, the pair continued trading in a renewed uptrend as the 20-period MA rose steeply.

GBP/USD: Before the Retail Sales YoY Data Release on 
August 14, 2020, Just Before 8.30 AM ET

Before the data release, the GBP/USD pair was trading in a steady uptrend. This trend is evidenced by a steeply rising 20-period MA, with bullish candles forming further above it.

GBP/USD: After the  Retail Sales, YoY Data Release on 
August 14, 2020, at 8.30 AM ET

Similar to the EUR/USD, the GBP/USD pair formed a long 15-minute bullish candle after the news release. The pair continued to trade in the previously observed uptrend before peaking and slowly flattening.

NZD/USD: Before the Retail Sales, YoY Data Release on 
August 14, 2020, Just Before 8.30 AM ET

NZD/USD: After the  Retail Sales, YoY Data Release on 
August 14, 2020, at 8.30 AM ET

Before the retail sales YoY data release, the NZD/USD pair was trading in a similar trend as the EUR/USD pair. The 15-minute candles were crossing above a flattening 20-period Moving Average. After the news announcement, the pair formed a  long 15-minute bullish candle as did the EUR/USD and GBP/USD pairs. Subsequently, the pair traded in a renewed uptrend as the 20-period MA rose steeply with candles forming further above it.

Bottom Line

The retail sales YoY provides vital long-term data about the economic outlook of the households and their consumption patterns. In the forex markets, however, the retail sales YoY data is overshadowed by the retail sales MoM data, which is release concurrently. From this analysis, the increase of the retail sales YoY data for July 2020 had no impact on the price action since the markets reacted to the negative monthly retail sales data.

Categories
Forex Basic Strategies

How to Profit Using The ‘Gap and Leave’ Forex Trading Strategy

Introduction

Gap and Leave is an interesting trading strategy that utilizes one of the most distressing phenomena of the forex market, a weekly gap between the last Friday’s close and the current Monday’s open price. The gap takes its origin in the fact that the interbank currency market continues to react on the fundamental news during the weekend, which results in a kind of opening on Monday at the highest level of liquidity. Today’s strategy is based on the assumption that the gap is a result of speculations and excess liquidity. Therefore, a position in the opposite direction should become profitable after a few hours.

In the past few articles, we discussed strategies that were pertaining to ‘trend pullback.’ Now, we will shift our focus and talk about a strategy that is best suited for trading a ‘range.’

Time Frame

This strategy works well on the 15-minutes and 1-hour time frame. Traders looking to trade intraday should use the strategy on the 15-minutes time frame. While traders looking for swing trading opportunities should look at 1-hour charts.

Indicators

No indicators are being used in this strategy. It mostly relies on price action and market speculation.

Currency Pairs

This strategy is suitable for trading in currency pairs, which are volatile and liquid. Also, since the Asian market is the first one to open for trading after the weekend, we would suggest applying this strategy in currency pairs involving the Japanese yen, Australian dollar, and the New Zealand dollar.

Strategy Concept

Gap and Leave is an easy strategy that is based on simple price action and speculation. It is observed that events and occasions that occur during the weekend give rise to unfilled orders in the market, which leads to a gap on Monday. This gap is a result of speculation and sudden infusion of liquidity in the market, as an outcome of the event. Most of these events are not of great importance, which means they do not have long-lasting on the value of a currency.

This characteristic can be used to our advantage by entering at discounted prices. Here it is important to note that the gap should coincide with a technical level of support and resistance. As mentioned earlier, this is a ‘range’ trading strategy. The price must reach the extremes of the ‘range’ as a result of the ‘gap.’ The idea is to go ‘long’ at support and ‘short’ at resistance. But this is done by following all the rules of the strategy.

The strategy offers a high risk-to-reward since we are executing our trades at the lowest prices, keeping a target at the other end of the ‘range.’

Trade Setup

In order to explain the strategy, we shall consider an example where we will execute a ‘long’ trade-in GBP/NZD pair on the 15-minutes time frame. Here are the steps to execute the strategy.

Step 1

Firstly, we should identify a ‘range’ that is newly formed. By this, we mean, the price should have reacted from the top or bottom of the range at least twice and moved to the other end. At the same time, we need to also ensure that the ‘range’ is not very old. We should not be considering ‘ranges’ where the support and resistance levels have been respected more than 5-6 times.

In our example, we have identified a ‘range’ on the 15-minutes time frame where the price has reacted twice from the resistance and four times from the support.

Step 2

The next step is to watch for Friday’s closing price. The candle must close somewhere in the middle of the range. This is because if the market has to gap on Monday, the gap will take the price at one of the extremes of the range. If the candle closes at support or resistance on Friday, the price gap will lead to a breakout or breakdown that will violate the ‘range’ trade. Then we should look for a breakout strategy.

In the case of GBP/NZD, we can see that the price almost closes in the middle of the range.

Step 3

This is the most important step in the strategy. In this step, we watch the market’s behavior on Monday and see if it opens with a gap or not. If the market gaps down to the support of the range, we will look for taking a ‘long’ trade after a suitable confirmation. On the other hand, if the market gaps up to the resistance, we will take a ‘short’ trade provided we have followed all the steps discussed earlier. A bullish candle after ‘gap down’ is the confirmation for a ‘long’ trade, and a bearish candle after ‘gap up’ is the confirmation for a ‘short’ trade.

In the below image, we can see that the price forms a bullish candle after gapping down on Monday. Hence, we enter for a ‘buy’ at this close of the first candle.

Step 4

Lastly, we need to determine the stop-loss and ‘take-profit’ for the strategy. Stop-loss placement is pretty simple, where it is placed below the support when ‘long’ in the market and above the resistance when ‘short.’ We take our profits when the price reaches the other end of the range. This means at resistance when ‘long’ and at the support when ‘short.’ The risk-to-reward of trades using this strategy is above average, which is quite attractive.

Strategy Roundup

Gaps are one of the most common tools used by institutional traders due to the high probability of winning trades. This strategy is based on market movement that is only a consequence of speculation, which does not hold any value. If we are looking for a gap trading strategy in forex, the Gap and Leave strategy is a good one to start with because it is great for beginners who want a relatively easy entry, at a slow pace and not involving complex indicators.

Categories
Forex Psychology

Is It Important that You Actually Enjoy Forex Trading?

It’s a very simple question as to whether you enjoy trading or not, however even some of the simplest questions can be quite hard to answer if you look into things in a little more detail, with a little more depth, you can find out exactly how you feel about something, and for many, it may not actually be how it seems on the outside. There are a lot of aspects to Forex trading. Some people will enjoy some of them, like the wining, and others will find it absolutely tedious, such as all the numbers. It really comes down to your personality and your likes and dislikes as to whether you will enjoy your trading journey.

Trading is tough and trading takes a lot of deduction and discipline, if you believe that you are a free spirit, someone who cannot be held down, then trading can seem from the outside like it would be perfect for you, no boss, no set working time, however, in reality, the markets will ultimately control you and will be in charge of you. You will be forced to work certain hours, you will be punished when you do things wrong and you will unfortunately have all of that without the stability of a guaranteed monthly wage.

Trading can be incredibly exciting and incredibly rewarding, especially when you are on a roll of positive trades. Each and every win will give you a little bit of excitement and a little confirmation that you are doing something correctly. What about when things go wrong? When you make a loss, it is of course not an enjoyable situation to be in. What you need to think about is how you deal with that loss, how are you coping with losses? Do they stress you out, do they cause frustration? If they do, then you may not find trading to be very enjoyable in the long run.

There will be a lot of losses along your trading journey, if you are not able to deal with them without stress or to be able to move those loose out of your mind in order to move on then there is a good chance that you may begin to find trading stressful and not all that enjoyable once the losses begin to build up, and they most certainly will begin to build up. Being able to deal with those losses and being able to clear your mind will really help you remain positive. Just remember that those losses are coming, there will always be losses, so dealing with them is paramount. Just remember to consider your overall enjoyment when deciding to trade, if you get caught up on losses, then this may not be the hobby or career for you.

Numbers, lots of numbers, do you like numbers? If not then trading won’t be an enjoyable thing for you. The Majority of trading, the analysing, the planing, and the actual trading is all based around numbers, be it the value of a currency or the current Fibonacci levels. Numbers will be involved in everything that you do. For those that like maths and statistics, trading will be an amazing experience, it allows you to analyse all sorts of things and will keep you busy pretty much every day. However, if you are not a fan of numbers and performing mathematical sums, then trading could be a little boring and a little tedious as you begin to realise that it is pretty much all based around those pesky numbers.

How are you when being by yourself for an extended period of time? If you struggle to keep yourself company, then it can be a difficult journey. The majority of trading is not a highly social event, in fact, the majority of the time you will be sat by yourself in front of the computer, reading, trading, and keeping yourself entertained. Of course, there are times where you will take to others there are forums and other message boards available to talk to other like-minded people, but this is still all digital and many other traders do not actually come into physical contact with any other active traders.

Are you able to keep yourself occupied, do you feel lonely when alone, and do you cope well with isolation? These are pretty big questions that you need to ask yourself, there are those that are able to entertain themselves or in fact enjoy the aspect of isolation. If that is you then you could really start to enjoy trading, you are in total control, but that also means control of your moods and your interactions with others. If it starts to get too much, then you may need to look at trading in smaller chunks and using the time between to get outside and interact with others. However, if you like the isolation, like a lot of people do, then not needing to deal with other people and the issues that come with people management, then this could certainly be the career for you, it will be just you, your computer, and the markets.

Do you need direction? One thing that a lot of people hate about their job is receiving instructions on what they need to do, but it isn’t until you have left that job that you come to realise that you actually needed that direction and those instructions. Many people find it hard to prioritise and to plan their days, and without some there to help you through it can often feel a little lost. Being a trader, full time or part-time, requires a certain amount of self-direction and planning. You need to plan your day, you need to ensure that you are motivated to do it and you need to be able to evaluate your own performance on it. If you are not able to plan your days properly then you may find trading an extremely stressful experience. Those able to work well by themselves will find relief in the fact that they do not have someone above them managing them, of course, the markets will still be in charge.

How are you with self-motivation and self-discipline? If you notice that you are doing something wrong are you able to correct yourself? Being a trader means being able to motivate yourself to do the work and being able to tell yourself when you are doing something badly. In terms of your enjoyment of trading, motivation will go a lot way, if you are not motivated and not able to self motivate yourself then you will struggle to enjoy it. The most common reason for losing motivation is boredom, and that is something that you will potentially experience a lot during a solo trading career, so being able to give yourself that boost is paramount to any form of success.

The same can be said for discipline, if you are not able to discipline yourself to give yourself some honest feedback on your trading abilities and performance, then you will only continue to make mistakes These mistakes will lead to a loss in motivation and will diminish your overall enjoyment of trading. So if you are able to self reflect on your performance, you may well enjoy it, but if you are not, then it could be a difficult and demoralising journey for you.

So those are some of the things that you need to be able to think about. Trading can be very enjoyable for some, but others it can be a real mood and motivation killer. It will ultimately come down to your personality and the way that you are able to deal with boredom, stress, and all the other emotions that come along with trading.

Categories
Forex Psychology

Should You Trust Your Instincts While Trading?

Your instincts are powerful things, they can take hold of us when we are doing pretty much anything in life, out in the wild, our fight or flight reactions, playing sports and it most certainly rears its head when we are trading, in fact, everything that we do when trading has an aspect of our instincts in them, or at least in the back of our minds. We have often been taught when trading that we need to go with facts and not our instincts, but is this really the case? We are going to look into your instincts and how they can actually help with your trading.

We are going to go against that trend and state that you should indeed listen to your trading instincts, there are a few catches, we, of course, are not referring to simply ignoring all the research and then just trade whatever it is that you think is right.

We are sure that there have been times when you are trading where you have done all the analysis, it all looks right and good for a trade, but there is something at the bottom of your stomach or the back of your head that is telling you not to take that trade, but why? Everything seems to be pointing to it being a good trade, so why shouldn’t we take that trade?

More often than not, you would have read something or heard something somewhere which you did not register at the time, so are not entirely sure what it was, but you did, and now your mind and body are telling you not to take this trade due to that. Seems silly not to take the trade still, but how many times in life have you just had a bad feeling about something and so did not do something, only to then later find out that it went wrong and should you have done it, you would have been in trouble.

So in this regard, it is good to listen to your instincts when you feel that you should not enter a trade, after all, there is no harm in not taking a trade based on it, the worst that can happen is that you miss out on a profitable trade, but you can always get the next one that comes along, so in reality there is very little harm in it.

There are also times when we can look to our instinct when putting on trades too, sometimes you simply feel that something will go up and down, but this does not mean that you should then put on the trade. Instead, it should be an indication that you should then do the analysis and check on that trade, if everything you analyse and look at confirms your feelings then you should by all means put on the trade after all the analysis confirms it.

What you should not do is put on a trade simply because you think it will work without doing the subsequent work to confirm it. This is basically gambling, the same as betting on a sports team because you think they will win. Listen to your instinct but do not act on it solely by itself.

People will always tell you that your instinct has no place in trading, this is simply not true, listen to it, use it as a tool, just make sure that you are not using it to choose your trades without doing the rest of the work that is required.

Categories
Beginners Forex Education Forex Basics

Finding Your Personal Trading Style

An important part of trading and learning to trade is being able to find your own trading style. If you do not and instead try to simply copy someone else’s, you can run into a large number of issues that could set you back quite a long time and a lot of work. When people start out they normally see a style, try it and that is what they stick with, regardless of the fact that there are many other styles out there that may actually be more suitable for that trader. Without knowing that they are there, they carry on none the wiser. We are going to be looking at a few of the different trading styles that are available and who they are best suits for, so you can hopefully find the one that is right for you.

The first thing that we need to clarify is the difference between a trading style and a trading strategy, while they may sound pretty similar, they are actually quite different. The trading styles that are most known are day trading and swing trading, there are of course the two other main styles that are growing in popularity which are position trading and scalping. Trading style refers to the way in which you trade, or at what speed to make trades, a trading strategy is about how you make your trades, what you reply to enter and exit your trades, and the rules that you use. So while they sound the same, they do have very different meanings.

So let’s take a look at what some of the main different trading styles are, we can divide them up into two categories, long term styles, and short term styles. The long term styles would include swing trading and position trading while the short term styles would include day trading and scalping. 

Swing Trading

Swing trading is often considered as a part-time style. The style often has the trader open up a large or medium-sized trade and then leave it there for a considerable period of time, sometimes for days or even weeks. The main problem with this style and the reason why a  lot of people do not like it is the fact that a lot of brokers will add on some charges known as swap fees for holding trades overnight, this can add to the cost and depending on the pair and the broker it can be quite expensive. This is a style of trading that can be seen as a little more sensible for those traders who want to trade less frequently, or that do not necessarily have enough time to be constantly checking the markets and their trades. As with any style, risk management will be key to help prevent a trade from going way into the negatives once you have set it and walked away.

Position Trading

Position trading is kind of a more extreme version of swing trading, so with string trading, you are holding something for days or week, with position trading you can be holding it for months or even years. A position trader is not interested in small movements, instead, they are looking for some huge movements, the sort of movement that can make history. Traders using this trading style do not need to watch the markets much at all, instead, they need to have a belief that the markers will go up or down in the long run and so they let it do its thing rather than constantly monitoring it.

Day Trading

Day trading is often referred to as the opposite to swing trading, people who are using this style of trading will open up multiple positions throughout the day and will close them before the end of play each day. This style of trading will take a lot of dedication and can result in you being in front of the computer for extended periods of time. You are required to be quick to spot opportunities to take and it can often be quite hard to find times to do this as they can occur at any time during the day, easily missed when making some food or popping to the toilet. It is a very popular trading style and many people like it due to the ability to compound any profits in order to earn a little more each time.

Scalping

Scalping is a more extreme version of day trading, scalpers can make a lot of trades per day, sometimes even in the hundreds. Every single movement in the market is an opportunity to make a trade and to make a little bit of money, they are not looking for big profits, they are looking for little bits at a time. It is a very intense style that takes a lot of concentration but if it is done well, it can be very profitable, and much like day trading, the profits can be reinvested in order to help increase future profits. This style of trading is growing in popularity, especially through the use of expert advisors and it is something that a lot of people are now starting to take notice of.

So those are the four primary styles of trading, but how do you know which one is right for you? The first thing that you need to do is to decide whether you want a long term or a short term style of trading. The problem is that it is not exactly an easy question to answer, as what may suit you one time may not suit you the next week. It is important that you get a little bit of experience with each of them and get an understanding of what is actually involved in them. You should also consider the requirements, the longer the trades for a style often means that they also require more capital in order to trade them, they are bigger trades being held for a long period of time and so require the money in the accounts to cover that.

Short term trading styles require a lot less patience, and less capital, the profits are also received a lot quicker and so can be compounded in order to increase the amount of profit or trades next time around. The trades are generally smaller in size so the account balance in the account does not need to be quite as high.

If you are an impatient trade that does not want to wait, then the shorter-term trades are best for you, if you have a lot of time on your hands then the shorter styles could again be a good choice for you. If you want to set and forget, then the longer-term styles would suit you a lot more. Remember to keep things simple though, something being more complicated or giving you more to do does not necessarily make it any better.

Having said all that, you should certainly try each style at least once, there may be one that you are certain you would not enjoy, but once you actually try it, it feels natural to you and is the one that you want to go for. It is hard to judge exactly how much time you will spend on each one, but you should feel straight away whether one could potentially be good for you or not, just ensure that you try them all. Some people swap between different styles depending on the markets, so having a choice of multiple is not always a bad thing.

Whatever you chose to do, try and stick with it for a longer period of time, simply trying something for a week is not enough to get a full understanding of what it is that you are doing. Of course, if you are absolutely hating it then it is better to change earlier than later as it could put you off trading completely. Once you have found the style that is right for you, make sure that you set up a trading journal, that you are recording what you are doing. This is completely new to you so you need to work out what your natural habits are and this can be done through a journal, only then will you be able to start adapting the style of your trading to better suit you and the markets together.

Categories
Beginners Forex Education Forex Basics

Setting Up Your Trading Environment

As with any job in life, the place that you are going to be working, or in this scenario, the place where you are going to be trading, needs to be set up in a particular way. We can’t tell you exactly how it should be done as it will be different for everyone, but there are some considerations that you should take into account no matter who you are and no matter how experienced you are at trading.

So while Bob may want to have the world’s most high tech office, all the latest gadgets and equipment, Sarah may want a simple pen and paper and a nice potted plant in the corner of the room. Each person will have different preferences, so if yours is looking different to someone else’s, then there is no need to fret, just remember that your room is right for you and theirs is right for them.

So what are the sorts of things that you need to think about? We are going to be looking at what you need to consider before you set up your trading office and workstation.

Separated Space

This may not be possible for everyone, but being able to separate your workstation and trading area from the rest of your hour and personal spaces can be a regal benefit Not only does it help you to separate your work and home life, but it also helps to remove some of the distractions that could potentially take your focus away from your trading. This also helps you to get into trading or work mode as soon as you step into the office, rather than having to be constantly reminding yourself that you are working and not simply using the computer at home.

Keep Things Simple

This one can come down to personal preference, for the majority, keeping things simple is vital. Do you need 3 screens if you are only needing one? Do you need that extra pad of paper, or that rather distracting little ornament or picture on the wall? Start with what you need, and only what you need. As you begging to become more successful you can start to add little things to help with your trading or as a reminder of what you have achieved, but when starting out, you only need to have what you actually need to trade, keep things simple to keep the distractions away, especially when you are just starting out.

Remove Distractions

We touched on this earlier, but being able to remove distractions from your trading environment and workstation is vital, especially during the early stages of your trading career. Anything that could cause a distraction should be removed. This does not just could for your environment, think about your actual computer too, there is nothing more distracting than looking for a trade, doing the analysis, and in the middle, you get a Facebook notification that is designed to grab our attention so you lose all focus on your trading. Use a clean and fresh computer, only for trading so it does not have any distractions on it.

In terms of your environment, there is no point in trying to trade with the tv on in the background, something will inevitably come up that will take your attention away, this goes for anything that has the potential to grab your attention, bright and abrasive pictures should be removed, little toys, if you have children, their toys should not be there either. Remember, this is a workplace, not a playroom, keep the distractions for your personal life, not your working one.

Invest in What Matters

We mentioned that you should be keeping things to a minimum, to begin with, but this does not mean that you cannot invest in having some decent equipment or things that will benefit you, what we meant is that you do not go out spending your money on things that will simply clutter up the room. There are certain things that are vital, a good strong desk, a supporting chair, and a decent computer for trading, those are some of the most vital things that you should be worried about spending a little bit of cash on.

There are other things that could be worth the money, things like a subscription to a high-quality forex or trading journal, pen, and paper, anything that could help to give you an edge over the markets. Remember, having a clean and simple trading environment does not mean that it needs to be empty, it just means that the things in it need to be relevant to what you are doing and not just there for the sake of being there.

Declutter Your Trading Terminal

Something that we often see which baffles us a bit is the amount of clutter that people have on their trading terminal. We aren’t talking about the games or social media on the computers that are being used, but the actual trading terminal. When you first load up a chart, it is often nice and clean and clear, then you add an indicator to it, it’s a little less clean now, then another and then another. At some point, the chart can get very busy, so busy that it can actually be quite hard to see what it is that you are actually looking at.

How are you meant to trade like this? The simple answer is that you can’t. You need to be able to keep your charts and your terminal clear. Look at the indicators that you have, which ones are actually relevant to your strategy, if you require more than 3 or 4, then your strategy is probably far more complicated than it needs to be. Try to keep 3 or 4 indicators maximum, this way there is plenty of information on the charts, but it is never overly complicated and does not distract you from your actual analysis and trading.

A Clean Computer

This goes in line with the above point about the trading terminal, so you have cleared up your terminal, but what of the actual computer. We mentioned the games and social media on the computer, are they relevant to your trading? Do they actually serve a purpose? Probably not the only notifications that you should have coming up should be related to your trading notifications or from your mentor or tutor, you should not have any other. We do not need to mention why it is not a good idea to have games installed, they will only be a distraction and should not be on the computer at al.

A Trading Schedule

Setting yourself a proper schedule is also important, this is not just for you but for the people who live with you too. There needs to be an understanding that between certain hours it is your trading and working time, not a time for someone to come in and start making conversation with you. Get one set up and stick it on your office door, this way people will know whether they should be coming in or not. It also helps you to plan your day, so you aren’t halfway through another task before you trade which will only lead you to think of that instead. When you are in your trading time, you know what you are meant to be concentrating on your trading.

So those are some of the things that you can do to help stop your trading environment ready to trade. It will be different for everyone, some people will need some things that others may not and some will have far more space than others. What is important is that you are able to get things set up the best you can with the resources and tools that you have available for you Once it is all set up correctly, your trading productivity and ultimately results will see the benefit.

Categories
Forex Market Analysis

Daily F.X. Analysis, September 10 – Top Trade Setups In Forex – ECB Monetary Policy In Focus

It will be a big day for the European pairs as the European Central Bank is due to report it’s minimum bid rate along with the Press Conference to determine the monetary policy. Besides, the U.S. Unemployment Claims and PPI data will be the main market mover of the market.

Economic Events to Watch Today  


EUR/USD – Daily Analysis

The EUR/USD pair was closed at 1.18027 after placing a high of 1.18339 and a low of 1.17525. Overall the movement of the EUR/USD pair remained bullish throughout the day. The market sentiment was sour on Wednesday amid the pause in the AstraZeneca & Oxford University vaccine’s final clinical trials. The trials were paused due to an unexplained illness in one participant. This weighed on risk sentiment and kept the EUR/USD pair under pressure on Wednesday.

The much-awaited decision of the European Central Bank monetary policy will announce on Thursday, and the market participants have started to bets on it. Meanwhile, the U.S. dollar surging due to increased pressure on its rivals dropped on Wednesday and caused a surge in EUR/USD pair.

The ECB is concerned about the appreciation in Euro and increased deflationary pressure and the uncertainty around Europe’s coronavirus situation. The bank is set to announce no changes in its upcoming monetary policy for the second month in September. The bank expanded it’s Pandemic Emergency Purchase Program with EUR 600 billion in June.

The interest rates on main refinancing operations are at 0.00%, on the marginal lending facility are at 0.25%, and the deposit facility is at -0.50%. All are expected to remain unchanged in this monetary policy meeting. The PEPP will also remain unchanged at EUR 1350 Billion. The speech from the ECB President Cristine Lagarde will remain under focus by traders to find fresh clues about the EUR/USD pair.

For August, the Eurozone inflation came in negative when the annualized consumer price index fell by 0.2% versus the July’s rise by 0.4% and raised concerns about the local economy. The impact of coronavirus has been rising as the coronavirus is surging in the Eurozone. To combat coronavirus’s economic impact, ECB expanded its balance sheet from 4500 B euros to 6424B euros. The long-term Eurozone inflation is also gloomy and shows a downward trend.

Traders await that the euro appreciation will remain under the focus of Lagarde’s speech, and measures that she will announce to cope with it will provide massive movements in EUR/USD prices on Thursday. The Eurozone economy outlook from the European Central Bank will also give clues on the EUR/USD pair.

On the U.S. side, the Consumer Credit in July dropped to 12.2B from the forecasted 12.9B and weighed on the U.S. dollar that helped EUR/USD move upward. EUR/USD pair posted gains after falling for three consecutive days on Wednesday.

Daily Technical Levels

Support Pivot Resistance
1.1795 1.1820 1.1857
1.1758 1.1882
1.1733 1.1919

EUR/USD– Trading Tip

The EUR/USD has recovered a bit to trade at 1.1820 level ahead of the ECB Monetary policy decision due to coming out during the late European session. ECB isn’t expected to change its rate; however, the press conference will be the EUR/USD pair’s main mover. On the higher side, the pair may find resistance at 1.1860 level along with support at 1.1797 level. Below 1.1797, the pair may drop towards 1.1755 level. Conversely, a bullish breakout of 1.1825 level can lead EUR/USD prices towards 1.1866.


GBP/USD – Daily Analysis

The GBP/USD pair was closed at 1.29986 after placing a high of 1.30231 and a low of 1.28847. Overall the movement of the GBP/USD pair remained bullish throughout the day. After falling for two consecutive days and posting massive losses, the GBP/USD pair dropped on Wednesday in an earlier trading session near the lowest level since July 28. However, in the late trading session, the pair successfully recovered its daily gains and reversed its direction and started posting gains.

The pair followed its previous day bearish trend in the early trading session on Wednesday that the new Internal Market Bill news from the U.K. Parliament pushed. The new bill was issued to protect the United Kingdom’s jobs after the transition period ends next December. 

The bill raised fears that it might impact the relationship between the U.K. and the E.U. It could re-write the parts of the Brexit withdrawal agreement related to the Northern Ireland protocol. In response to the new bill news, the E.U. Commission President Ursula von der Leyen said that breaching the singed withdrawal agreement would break the international law and undermine trust. This weighed on the local currency GBP and dragged the pair towards the lowest level since July 28.

However, the pair’s downward movement was further supported by the latest news that weighed on risk sentiment that AstraZeneca & Oxford University vaccine’s final clinical trials were paused after an unexplained illness was found in a participant.

Whereas, on the U.S. front, the U.S. dollar came under pressure on Wednesday after rising for the past few days on the back of weak rival currencies performance. The weakness in the U.S. dollar was ahead of the ECB meeting on Thursday. The U.S. Dollar Index fell by 0.1% on Wednesday to 93.16 and weighed on the U.S. dollar that supported the GBP/USD pair’s movement.

On the data front, the Consumer Credit for July dropped to 12.2B against the forecasted 12.9B and weighed on the U.S. dollar that added further support to the GBP/USD pair. On Wednesday, PM Boris Johnson said that they must act to avoid another lockdown as virus cases were rising in England. He was referring to the new rule that restricts the gathering of more than six people. The new rule can issue fines or make arrests in case of breach of law.

 Daily Technical Levels

Support Pivot Resistance
1.3079 1.3125 1.3196
1.3008 1.3242
1.2962 1.3313

GBP/USD– Trading Tip

The GBP/USD pair has formed a Doji pattern over 1.2901 area, and the support level is extended by an upward trendline on four hourly timeframes. On the higher side, the pair may face immediate resistance at 1.3021, and above this, the Cable may head towards 61.8% Fibo level of 1.3154 level. Jobless claims data may play the role today.


USD/JPY – Daily Analysis

The USD/JPY pair was closed at 106.174 after placing a high of 106.272 and a low of 105.785. Overall the movement of the USD/JPY pair remained bullish throughout the day. After falling on Tuesday, the USD/JPY pair gained traction on Wednesday and started rising. The pair fell to 6 days lowest level on Wednesday in the early trading session but reversed its direction and moved upward on the back of the upbeat market sentiment.

The market mood improved on Wednesday and made it difficult for the safe-haven Japanese Yen to find demand and pushed the pair USD/JPY higher. After falling for three consecutive days, the equity market was raised on Wednesday with the S&P 500 index up by 1.85% and confirmed the risk-on market sentiment. The U.S. Treasury bond yields for a 10-year note also rose to 2.2% and supported the upward market sentiment.

Moreover, the U.S. Dollar Index also rose on Wednesday to 93.66 level the highest since August 12 and supported the upward U.S. dollar movement. 

However, the USD/JPY par gains were capped by multiple factors, including the US-China tussles and negative vaccine news.

On Wednesday, the long-awaited vaccine developed by AstraZeneca and Oxford University stopped its final stage clinical trials due to an unexplained illness found in one of the participants. This news raised concerns over vaccines’ development and, ultimately, on the economic recovery and capped further gains in the USD/JPY pair.

Meanwhile, the rising tensions between the U.S. & China after the latest comments from President Donald Trump and his administration regarding the tech fight and bringing back the production to America raised fears for the phase-one deal completion. These tensions and the lingering fight on the South China Sea have weighed on market sentiment that undermined the risk sentiment and supported the Japanese Yen, ultimately capping further gains in the USD/JPY pair.

Moreover, the new Brexit worries after the U.K. introduced new potential internal law that could change the initial withdrawal agreement terms related to the Northern Ireland border, also weighed on risk sentiment. The uncertainty regarding a Brexit deal between the E.U. & U.K. also weighed on market sentiment and limited the USD/JPY pair’s gains.

On the data front, the M2 Money Stock for the year in Japan rose to 8.6% in August from 8.2% and supported the Japanese Yen that capped further gains in the USD/JPY pair. At 10:59 GMT, the Prelim Machine Tool Orders decreased by -23.3% in August compared to July’s -31.1%. On the U.S. front, the JOLTS Job Openings in July rose to 6.62M against the forecasted 6.05M and supported the U.S. dollar that added further support to the USD/JPY pair on Wednesday.


Daily Technical Levels

Support Pivot Resistance
105.9500 106.2700 106.6800
105.5500 106.9900
105.2300 107.4000

USD/JPY – Trading Tips

On Thursday, the USD/JPY is consolidating at 106.050, with a resistance mark of 106.480 level. An upward crossover of 106.480 level may extend further buying trend until the 106.840level, and the violation of this level can extend buying until the next resistance level of 107.150. On the downside, the safe-haven USD/JPY currency may gain support at 105.620 and 105.280. Let’s consider taking a sell trade below 106.024 level as the MACD and RSI also suggest selling bias. Good luck! 


Categories
Beginners Forex Education Forex Basics

Learn to Trade Forex Based On Your Strengths

When it comes to Forex and trading, there is a lot to learn. In fact, there is so much that not one person will ever know everything that there is. There is no single database that contains all of the information that one would need, especially as Forex is always changing and the amount of information expanding.

Due to this, it is important to understand that you will not be able to learn everything. In fact, you will most likely never learn more than 10% of what there is to know. What is important is that you learn what is relevant to the trading that you are wanting to do, and that you learn it in a way that is relevant to the way that you learn and that will allow you to use your strengths to assist your trading.

Some people love to learn by simply reading, they love to sit down with a big book and just read, they take in the information as they go, sometimes re-reading what they have already gone over to help cement the information into their mind. Others will sometimes learn better by doing. Actually, trading is the best way that they can learn, whatever you are more suited to is how you should be trading and learning.

So let’s imagine that you learn best by doing things, reading is boring and can’t hold your attention for long, that is fine, a lot of people feel that way. So how can we learn when there is not much information? You can simply break down the information into bite-size chunks, you then take that information and try it out on a demo account, this way you are not getting stuck in reading page after page and you are actively trying out what you have been learning, cementing that information in and more importantly, doing it in a way that suits your own learning style.

In general, there are seven main learning styles, we will briefly look at each one and what they involve, this can help give you an idea of how you prefer to learn so you can adapt the way that you are learning to trade to better suit your own style.

Visual

Visual learning is all about what you see, you learn well by looking at images and pictures, have a spatial understanding of what is going on and simply watching someone else do something can be enough for you to pick up a lot of information. This sort of style is often accompanied by an audio explanation. However, images and pictures can often be enough to learn. There are plenty of places online that help you learn trading via images and examples.

Aural

This is all about what you hear, you learn by listening, one of the reasons audiobooks came out was to help those that do not like reading get into listening to books. The same can go for learning, you do not like reading but listening to the information helps you take it in and learn, this is all about sounds and music. Listening to YouTube or podcasts can be a good way to pick up information on trading that suits this style of learning.

Verbal

Verbal doesn’t just mean what someone is saying, it can also refer to written words. This means that you are able to learn through words, either reading them or having someone say them to you. This is the most common style of learning, it takes place in school, university, and training courses. It is also the most prevalent when it comes to learning to trade, there are hundreds of resources online that can help you to learn in this manner.

Physical

This is all about actually doing things, while trading is not actually a physical thing to do with your hands, you are actively taking part and having to do things in order to trade. A demo account is a perfect way to learn this way. If you have read or heard some information, try it out on a demo account, this will help you to see how it works and what was told in real-time and in a real-life scenario, doing is often a great way of learning, so demo demo demo.

Logical

Logical learning is all about using logic and finding the reason behind the things that you are doing, in regards to trading, it is working out why certain things move the markets or why you should be placing certain trades. This looks into each subject in a lot more detail, but it allows you to get a much more in-depth understanding of each subject matter. There are sites available that go into the real nitty-gritty details of trading and those are the sites that you would want to look out for.

Social

Some people love to learn in groups, be it one other person or a group of 10. These people thrive on relaying information between them and by discussing what is being learned. There are sites south here for learning in groups, forums are also available and offer great places to talk and learn with others. Team members often push each other to achieve and learn more.

Solidarity

The opposite of learning in a  group, learning by yourself can also be someone’s choice of learning style. You do not want the distractions that come from others, you want to be able to concentrate on what you are doing and are easily able to self-motivate yourself to get the learning and work down. Too many people mean too many distractions, this allows you to learn at your own pace. So those are some of the learning styles, there is one key part of learning that we have not mentioned yet, that is simply the learning that you can get from mistakes and losses.

When we are trading, there will be mistakes being made as well as losses being accrued. It is important that we use these opportunities as a new way to learn. If you think back to school, some of the knowledge that you have would be simply from making a mistake, as soon as that mistake was made, you learned what made it right and have most likely never forgotten it since. It is exactly the same as trading.

Every single time that you make a mistake or make a loss, take a look at why that loss occurred, what was the curse, you can then use what you have learned to better understand what happened and to help prevent it from happening again in the future. Doing this enables you to become a much better trader, prone to making far fewer mistakes. It can also give you an insight into subjects and topics that you would have never looked into otherwise.

So those are a few of the learning styles as well as the importance of learning to trade in a way that suits you. There is no point trying to follow the footsteps of someone that learns or tutors in a way that does not suit your own style, use your strengths to learn, you will then be able to learn a lot more and a lot quicker.

Categories
Beginners Forex Education Forex Basics

Good Habits for a New Forex Traders

Being new to Forex can be exciting, there is this whole new world out there of financial markets that you know in the back of your head can make you rich, but it’s all very complicated. We have come up with some habits that it would be good to get into as a newcomer to trading, they may not work for everyone, but even incorporating one new habit into your trading, can make a world of difference.

Finding Your Strategy

There are hundreds if not thousands of strategies out there with all sorts of strange names. If you tried to learn them all, you would either be the smartest person alive, or the information would all become a muddled mess within your head.

You need to be able to find the one strategy that suits your own style, it may take a while to get it right, some traders it can take weeks, other years, but testing out various strategies on a demo account, as soon as you find one that you seem to take a liking to, learn more about it, learn it inside and out and use that as your future baseline. Using the same strategy regularly helps you hone your skills, and also helps to prevent the mistake of getting into the market with no knowledge of the current conditions or knowing where to exit.

Use Stop Losses

This one probably seems obvious right? You would be surprised at how many traders (both new and experienced) trade without stop losses. This is technically a form of gambling rather than trading. When you are new, you most likely sit around watching your screen to see how the trade is doing, I know I did and I am sure most newer traders do too, this may lead you to believe that because you are watching the markets, you will be able to get out when you need to. 

This is a mindset that you need to grow out of, the 60 seconds that it takes you to run to the toilet, or a sudden unforeseen news event can bring your trade into losses very quickly, the human mind will always doubt itself and you may stay in the trade, seeing it move further and further into the red. Having a stop loss means you are only risking a certain percentage of your account on each trade, rather than the entire balance without a stop loss. The stop loss saves accounts, so be sure to use them.

Record Your Trading

When a trade goes well, how do you know that it did? When a trade goes wrong, what caused it? These are a thing that you should be recording, it can seem like a daunting task, people used to write down everything, each entry, exit, movements, profits, losses, and more which is a lot of work. Luckily there is now some software that can do most of the work for you, be sure to use one, seeing your full history is a fantastic way to learn from your mistakes and to ensure you know exactly what is working to improve and better replicate those results.

Set Time Each Day

Trading needs to be seen as a job, while the markets are open 24-hours a day, it does not mean that you need to be trading it at all times, no one wants to be sat up at 3 am staring at the charts hoping something happens to match your strategy. Give yourself an allotted time each day, an hour or two in the morning, a couple of hours in the evening. This was you begin to work yourself into a routine, eventually, you will work out (by using the records stated above) what times of the days work best for your strategy, working only those times will keep you fresh, give you a clear mind, and you won’t feel bored or overworked, it will also ensure that you are free from distractions and can fully focus on your trading during these times.

These are just a few of the great habits that you could look into, getting your own routine which incorporates healthier trading conditions are always a positive thing to attain.

Categories
Forex Basic Strategies

Guide to Trading Forex Without Indicators

Indicators are a wonderful thing, they can do a lot of our thinking for us, there are however problems with them and since they are becoming more and more popular, people seem to be adding hundreds of them to their charts which causes them to end up looking like a bit of a mess. Too many indicators can simply confuse things, you don’t really know what you are looking for and your actual strategy will be lost somewhere beneath them all. The other issue is that it takes away a lot of the skill from trading, simply using them as indications of when to trade means that you do not need to think anymore, everything that you learned before is going to waste.

If you are experiencing some of those issues, then there is something that could work for you, naked trading. We don’t mean getting all your clothes off, you are probably doing that already, what we are talking about is trading without any indicators. We need to remember that indicators are not designed to be signals, they should not be telling you to buy or sell, but that is how a lot of people arouse them. They are designed to simply tell you something about the markets, it should then be your job to use that information to make up your own trading decisions. We are going to be taking a look at what it means to be a naked trader and how you could potentially bring this idea into your own trading routine.

So let’s get a brief idea of what naked trading actually is, its main principle is that you will be looking at the markets it is current state, the price that it is currently at, we are not looking at the past prices and we are not looking at its potential future price, just what it is at right now in this moment of time. It is all about making trades and decisions based on the charts that are in front of you and nothing else. The difference between naked trading and trading with indicators is that you are required to have a good knowledge of different candlestick and chart patterns, hopefully, you should have already learned some of these during your initial trading training and education, they are afterall one of the main analysis techniques in trading. Price action is another bit of knowledge that you need to have a good understanding of, you will be using this to help work out your trades as it will make the markets a lot clearer for you.

Understanding Trends

Trends can be a naked trader’s best friend, understanding them gives you a greater understanding of the markets and the way that it generally likes to move in cycles. If we think of a typical market cycle, it will start ranging low, then start to trend upwards, it will then range high before a downtrend starts, it will then cycle like this, of course, that is a typical one and the markets don’t always play fair. These movements are however vital for a naked trader to understand. These patterns appear in all charts, not just the longer timeframes a good naked trader will be able to see the direction of these trends and will trade with them, not against them.

Understanding Market Psychology

Getting yourself a good understanding of the psychology that goes on within the markets will help you with your naked trading. There is something known as dumb money and smart money. When there is a huge candlestick forming, those that jump on it is what is known as dumb money they are simply throwing money into something that is already happening or has already happened. You need to get in before this, as after a huge buying candlestick, there is normally a lot of selling at the end, you want to be selling, that is market money. You need to be able to establish how the markets are moving. Or in other words, how volatile the markets are at that point in time. Volatility is great, it presents you with opportunities to get some trades on the go, of course too much volatility can be dangerous and can be made more dangerous when trading naked without any indicators to help you. Understanding this volatility and the larger movements are key to making profits when naked trading, ranging is a little trickier but can still be profitable.

Trend Lines and Support and Resistance Levels

When naked trading, you should still be using support and resistance levels as they can provide you with a lot of information about the markets. The thing to remember is to not draw too many lines, if you are writing on 100 lines then it will just become confusing, you need just a few and you need to ensure that you are constantly updating them, recent lines are far more useful to you than older ones. You should also only draw the lines that you are 100% sure of, do not try guessing where the resistance and support levels may be. It may not sound like naked trading anymore, but remember that you are drawing these yourself, not using a bit of software to do it for you, the trend lines can give you a real boost to your analysis and trading, so ensure that you at least try to use them.

So it sounds a little complicated, but who can actually trade naked? Is it for everyone? The simple answer is no, however you should certainly try it at least once. Even those that do not like it will still admit that they often look for price action first before then using their indicators, indicators are great for confirmations and can help to confirm whether it is safe to make a trade or not. Naked trading can also help to save time, you are trading in real-time and will not be overthinking your analysis which could cause a trade to pass by without you taking it. It can be simpler, less stressful, more precise and it takes less time. Having said that, you still need to set yourself a trading plan and some goals. Do not just go straight into naked trading without hanging ideas of the trades you want and when you should be getting into and out of the markets.

So you have decided to do some naked trading, there are a number of different things that you should be looking for, one of them are patterns, there are multiple different ones to think about covering the candlesticks and price action, so let’s very briefly look at what some of these patterns are.

Price Action Patterns

Let’s start with price action patterns, the first to look for is the Head and shoulders pattern. This is an extremely common pattern and you most likely would have seen it a number of times without knowing it. It is one of the key patterns to look for when naked trading. It is easy to notice as it consists of two shoulders which are lower heights and a head, or the highest point. More often than not when this pattern emerges it means that an uptrend is starting to tire and could be about to reverse into a downtrend. If you have a position open then it is a good idea to sell it before the market reverses. It can also work in reverse and would signal that a downtrend is about to reverse into an uptrend.

The other main price action pattern to look for is the Wedge, this pattern is also sometimes referred to as a triangle pattern and it can occur in a number of different ways which indicate slightly different things depending on the market condition it is found in. The wedge pattern is defined as a triangle, it has one long side which is accompanied by the price getting closer and closer together, the other sides are then drawn with trend lines. As the price gets closer than a breakout will occur and either a downtrend or an uptrend will occur. Normally, if there is a falling wedge pattern with the price slowly falling, then an uptrend breakout will occur, and vice versa for a downtrend. There can also be wedges without a rising or falling trend, which can make things a little harder to predict the breakout.

Those are two of the main price action patterns, there are then two main candlestick patterns to look out for. These patterns are based only on a small group of candlesticks, normally just two, three, or four of them. The first that we will look at is the Hammer, this pattern is a single candlestick that simply looks like a hammer, sometimes known as a pin bar. It has a long wick and a short body, it can sometimes be used to help indicate that a reversal is about to happen and can be seen at the top or bottom of a trend. The Engulfing pattern is the second one, this pattern consists of two candlesticks, it gets its name from the fact that the first candlestick is completely engulfed by the second one. This pattern helps to indicate that a trend reversal may be about to take place.

So it all sounds good, there doesn’t seem to be any reason not to naked trade right? Well not quite, it takes a lot of skill to trade naked, for many people, it is not something that they will be able to do straight away, it will take quite a lot of experience to do it properly and to be profitable when doing it. Many will argue that it is still better to use some indicators, especially when the markets are being a little funny. It is far harder to be a consistent trader when naked trading than it is when using a few indicators, if you are not fully reading and understanding the markets, then it could change without you noticing.

Our advice is to try trading with indicators, at least to begin with, if you are confident, and then try naked trading on demo account for a bit, if you do well, then move on to a live account, just remember that it takes a lot of skill, not everyone is cut out for it, so do not be afraid of giving it a miss after trying for a bit and going back to indicators, those indicators were designed to help you after all.

Categories
Forex Basic Strategies

Exploring The Forex Market Opportunities With The Help of ‘Volume’

Introduction

In the Forex market, we don’t really have a centralised exchange as we’re trading over the counter. This is the reason why it is so difficult to determine exact trading volumes in Forex. Even though there is no centralised exchange to provide us with the volume data, many forex broker’s and trading platforms keep track of the average volumes in a pair. Each retail broker will have their own aggregate trading volume. Platforms like TradingView also have a volume attached to their chart. We all have realised over time that volume in the forex market is an important indicator, which is the reason why we need the best volume indicator.

The volume indicator used to read the volume in the forex market is the Chaikin Money Flow indicator (CMF.) The CMF was developed by Marc Chaikin, who is a trader himself, and was coached by the most successful institutional investors around the world. The reason Chaikin Money Flow (CMF) the best volume indicator is that is measures institutional accumulation and distribution.

Normally, on a rally, the Chaikin volume indicator should be below zero. Conversely, on sell-offs, the indicator should be below the ‘zero’ line.

Time Frame

The strategy works well on the 1-hour and 4-hour time frame only. Therefore, we can say that it is a swing trading strategy and is not suitable for trading intraday.

Indicators

We will be using just one indicator in this strategy, and that is the Chaikin Money Flow indicator (CMF.) The rest all is based on price action.

Currency Pairs

The strategy is suitable for trading in almost all currency pairs that are listed on the broker’s platform. But we need to make sure that the forex pair has enough trading volume.

Strategy Concept

Volume trading requires us to pay careful attention to the forces of demand and supply. Volume traders look for instances of increased buying or selling orders. They also pay attention to the current price movement and trend of the market. Generally, increased trading volume leans towards heavy buy orders. These positive volume trends will prompt us to open new positions on the ‘long’ side of the market, depending on the price action.

On the other hand, if trading volumes and cash flow decrease—it indicates a “bearish divergence. This may be appropriate to sell. We will pay attention to the relative volume—regardless of the number of transactions occurring in a trading period. By learning how to use the Chaikin money flow and other relevant indicators, we will be able to identify whether to ‘buy’ or ‘sell.’

With practice, the volume trading strategy can yield a win rate of 75%!

Trade Setup

In order to explain the strategy, we have considered the chart of EUR/USD, where we will be illustrating a ‘long’ trade using the rules of the strategy.

Step 1

Firstly, look for a price reversal in the market or a price action that reverses an established downtrend or uptrend. This is an easy and simple step that requires us to have a basic understanding of price reversal. This reversal should be accompanied by the rising Chaikin volume indicator that shoots up in a straight line from below zero to above the ‘zero’ line, during the reversal of a downtrend. In an uptrend, the slope should be downwards, i.e., from positive to negative.

When the volume indicator goes negative to positive in a strong fashion, it shows an accumulation of smart money.

Step 2

Wait for the price to pullback near the previous lower low after an upward reversal. Likewise, wait for the price to pullback near the previous higher high. The Volume Indicator should also pullback in a similar manner. If the pullback is coming in slowly, the trade has a higher probability of performing. If the pullback is strong, we will exercise some caution.

When the volume indicator is decreasing and drops below zero, we have to make sure that the price remains above the swing low. If the market is satisfying all the conditions of the strategy until now, we can move on to the next step.

Step 3

Wait for the Chaikin volume indicator to break back above the zero lines. We enter for a ‘buy’ once a ‘higher low’ is confirmed, and the price starts moving in the direction of the reversal. In a reversal of an uptrend, the Chaikin indicator should break below the ‘zero’ line. We enter for a ‘sell’ once a ‘lower high’ is confirmed, and the price starts moving lower. Once the institutional money comes back in the market, we wait for them to step back and drive the market.

The below image shows a ‘higher low’ being formed along with the volume breakout.

Step 4

This brings us to the next important step, where we establish protective stop-loss and take-profit for the strategy. We place stop-loss below the ‘higher low’ that confirmed the reversal when ‘long’ in the pair and above the ‘lower high ‘when ‘short’ in the currency pair. This strategy indicates a strong reversal in the market that will change the trend of the market. This is why we set our ‘take-profit’ at the origin of the previous trend.

In our example, the risk-to-reward of the trade was over 1:2, which is great.

Strategy Roundup

The volume trading strategy will continue to work in the future; it is based on the activities of the smart money. Even though they hide all their operations, their footprints are still visible. We can read those marks by using proper tools. The Chaikin indicator will add value to our trading because it gives a window into the volume activity the same way we traded the stocks. Make sure to follow this step-by-step guide to trade properly using volume.

Categories
Forex Psychology

Why Dedication is So Important For Forex Traders

If you have been looking over the internet, at the various social meiosis sites, forums, and trading communities, you would have seen some of the amazing success stories out there. Having seen them, at one point or another, you probably thought to yourself that this is something that you are able to do too. There is nothing stopping you from achieving this, apart from yourself.

One of the traits needed to become good at anything in life, including trading, sports, or even going up the career ladder, that trait is dedication. Dedication is also vital for becoming a successful trader, most people recognise this when they are starting out. However, a lot of people don’t necessarily understand exactly how much dedication is needed or how much work will need to be put in in order to actually achieve these goals.

Those people who have come into trading expecting or wanting some quick results are often the ones that fall victim to the amount of work that is needed and so then eventually gives up. There are people out there from all walks of life who will, unfortunately, decide to jump into trading with tier life savings, hoping to make it big, especially those that are used to gambling or taking larger risks in life. There is an expectation that they will be able to make it, with little other understanding of the ins and outs or the work that is actually involved in it.

Getting into trading is becoming more and more accessible, due to this the expectation from those getting into it is that it must be quite easy to achieve some targets and goals. All you need to do now is to sign up to a broker, send in your ID, deposit some money and you are ready to trade. No lessons, no knowledge needed (even though there is a lot of education and resources available out on the internet), many use it to get a headstart, however, there are those that do not and the ease of getting into trading just makes it an enticing thing to get into with very little fuss involved.

While there have been a number of different traders who have gotten into it and become successful over a very short period of time, this is certainly not the norm. Those success stories and few and far between, however, they are the ones that get the most publicity, and so this gives people the impression that it is an easy and common thing to occur, something that is far from the truth. Not everyone gets the brown success story like this, in fact, the majority of them will not, the majority will lose out. One of the major things that you can do to help improve your chances are to put in the work to learn and to keep some dedication towards your goals and learning.

If we look at the importance of dedication in some other professions, there are very few writers who manage to write a bestseller on their first attempt. In fact the majority of them, it will take many books and failed attempts before one is even looked at by a publisher. Some people also need to put themselves in the right environment. If we look at K.K. Rowling, the author of the incredibly popular Harry Potter books. When she started her writing career, she was a single mother, near bankruptcy, but she still dedicated herself to her writing, going to school, and writing novels. Through this determination to work and to write, she eventually came up with the Harry Potter books and now she has more money than she knows what to do with. If she didn’t have the determination and the dedication to writing when she had been given her first few rejection letters, she most likely would have given up and so she would not be in the situation that she is now.

What about Michae Jordan? You may well know him as one of the best basketball players to have played the game, but did you know what back in high school, he was actually dropped from the team? For many this would have been more than enough reason to give up, but did he? No, he stuck with it, worked hard, and then became one of the best.

Those are just some of the real-world examples of how powerful dedication can be, if you really want to achieve something and you are willing to put the work in to achieve it then there is no reason why you cannot achieve that goal. This works exactly the same for trading, if you really want to do it, you understand that it is a lot of work but you are still willing to put in the work then there is no reason why you won’t be able to do it and to do it well.

Forex is a long process, a really long process, many of the successful traders that you see today (not the ones that got lucky with a single big trade) have taken a long time to get to where they are today. Years at a minimum, in fact, a lot of them would have still been making a loss after their first year. That time is used to get used to how things work, to find yourself and what sort of style of trading best suits you. This is not the time to be thinking of that new car or that you will be quitting your job to do this full time. That will come, but a lot later down the road.

What we need to take from this is the fact that once we have started with something we need to stick with it. This counts for trading as a whole, but it also counts for the smaller parts within trading. If you are trying out a new strategy, you cannot simply try it for a week and then decide that it does not work. Strategies take a long time to create and also a long time to test, at least six months should be put into a strategy before it can be declared as not working (unless it completely fails with a lot of losses). If you have started something, put the work into it, stick with it, and show some dedication to making it work.

Dedication is something that comes naturally to some, they have the ability to start something and then stick with it with little effort. Others may find it harder, those with short attention spans or those that easily get bored can find things harder to stick to in the long run, however if you manage to, you will see the huge differences to your trading ability and your results. So if you are just coming into trading, be prepared for the long haul, not some quick and simple profits, which will most likely never come without having the dedication to push on.

Categories
Forex Market Analysis

Daily F.X. Analysis, September 09 – Top Trade Setups In Forex – U.S. China Conflict in Play! 

On the news front, the Bank of Canada Overnight Rate rate and Rate Statement will be in focus, and it may drive some price action in Canadian pairs. Elsewhere, we don’t have any major events that can drive sharp movements in the U.S. dollar related pairs. Let’s focus on technical levels.

Economic Events to Watch Today  


EUR/USD – Daily Analysis

The UR/USD pair was closed at 1.17734 after placing a high of 1.18273 and a low of 1.17654. The EUR/USD pair dropped on Tuesday and extended its bearish move for the 3rd consecutive day on the back of a strong U.S. dollar and ahead of ECB monetary policy meeting.

Recently ll eyes have turned towards the upcoming meeting of European Central Bank on Thursday to observe if they will do anything to push inflation pressure higher. Chief Economist Philip Lane has raised concerns over the high prices of local currency the last week. Though the currency has already come under pressure due to currency devaluation expectations or inflation, investors are still awaiting the words from ECB. The currency Euro is facing heavy pressure ahead of ECB’s monetary policy meeting and is weighing on EUR/USD for the past three days. The pair continued following the same pressure and dropped on Tuesday as well.

On the data front, 10:30 GMT, the French Final Private Payrolls for the quarter dropped to -0.8% from the projected -0.6%and weighed on Euro. At 11:00 GMT, the German Trade Balance showed a surplus of 18.0B against the expected 14.9B and supported Euro. At 11:45 GMT, the French Trade Balance was released that remained flat with the expectations of -7.0B. At 13:00 GMT, the Italian Retail Sales for July dropped to -2.2% from the projected 1.1% and weighed on Euro. At 14:00 GMT, the Final Employment Change for the quarter dropped to -2.9% from the forecasted -2.8% and weighed on Euro. The Revised GDP for the quarter from Eurozone dropped by -11.8% against the expected -12.1% and supported Euro. As most data came in against the single currency Euro, the EUR/USD pair came under fresh pressure and dropped on Tuesday to 8th day lowest level.

From the U.S. side, the NFIB Small Business Index was released at 15:00 GMT that advanced to 100.2 against the expected 99.0 and supported the U.S. dollar. The strong U.S. dollar added further pressure on EUR/USD pair and dragged the pair down.

Meanwhile, as the global coronavirus cases have surged to 27.3M, including 893,000 deaths, Spain has become the first nation in Western Europe to exceed half-million COVID-19 total infections. This also weighed on the local currency Euro and added in the currency pair losses.

The U.S. dollar was already strong because of its safe-haven status amid the rising US-China tensions after the tech fight escalated. 

The U.S. has announced tariffs of any American company forcing overseas production. The U.S. has also warned its companies not to work with any Chinese company or face sanctions. Whereas, the greenback was also strong because of the weakness of its rival currency like the Euro and GBP. 

Daily Technical Levels

Support Pivot Resistance
1.1753 1.1791 1.1817
1.1727 1.1855
1.1690 1.1881

EUR/USD– Trading Tip

The EUR/USD is trading with a bearish bias around 1.1780 level, having immediate support at 1.1756 level that’s extended by a double bottom pattern. On the 4 hour timeframe, the violation of the 1.1756 level may extend the selling trend until the 1.1715 level. The EUR/USD may find resistance at 1.1862 and 1.1958 level. Bullish bias seems dominant today.


GBP/USD – Daily Analysis

The GBP/USD closed at 1.29806 after placing a high of 1.31697 and a low of 1.29798. Overall the movement of the GBP/USD pair remained bearish throughout the day. THE GBP/USD pair fell below 1.30 level on Tuesday at the lowest level since 30-July 2020. The pair extended its previous day bearish movement due to a fresh threat by Prime Minister Boris Johnson to leave the E.U. without any deal if progress in talks will not be made till October 15.

Johnson has said that there would need to be an agreement in place by the mid-October deadline when European Council convenes or warned that the U.K. would leave the negotiating table and follow the WTO rules.

However, the talks have become tough after the U.K. has already angered the E.U. members by unveiling plans to introduce a new law that would undermine the withdrawal agreement. Both parties signed the agreement into law and included all terms and conditions of the U.K.’s departure from the bloc.

The new bill aims to create common rules that would apply across the whole of the U.K. are expected to clash with the terms of the withdrawal agreement that requires the Northern Ireland to keep following E.U. rules in the post-Brexit period to avoid a hard border with the Republic of Ireland.

The talks have started on Tuesday between the E.U. chief negotiator Michel Barnier and U.K. chief negotiator David Frost. The U.K.’s controversial move about new law has made the E.U. angry, and the E.U. has said that it will be ready for a no-deal Brexit when the transition period ends on December 31. The British Pound suffered massively as the concerns raised ahead of Brexit talks and dropped below 1.30 level on Tuesday.

On the data front, at 04:01 GMT, the BRC Retail Sales Monitor for the year in August rose to 4.7% from the expected 3.5% and supported British Pound, but the traders ignored it as the focus was shifted towards Brexit talks. The U.S. dollar was also strong in the market due to positive data and safe-haven appeal and also weighed on GBP/USD currency pair. At 15:00 GMT, the NFIB Small Business Index advanced to 100.2 from the expected 99.0 and supported the U.S. dollar that added pressure on GBP/USD pair.

 Daily Technical Levels

Support Pivot Resistance
1.2918 1.3049 1.3118
1.2849 1.3249
1.2719 1.3318

GBP/USD– Trading Tip

The GBP/USD is trading with a selling bias at 1.2948 level, set to test the support level of 1.2923 level. The Cable is trading within a downward channel, extending support at 1.2923 level and resistance at 1.3013. On the downside, the GBP/USD pair may find support at 1.2857 level upon the violation of the 1.2923 level. The recent bearish engulfing candle is also in support of the selling trend. The MACD is also supporting selling bias; therefore, we will be looking for selling trades below the 1.3000 level.  


USD/JPY – Daily Analysis

Today in the European trading session, the USD/JPY currency pair failed to break its thin trading range and still hovering below the 106.50 marks. However, the choppy trading around the currency pair could be associated with the risk-off market sentiment, driven by the US-China tussle and Brexit concern, which eventually underpinned the safe-haven Japanese yen and kept the currency pair under pressure. On the other hand, the broad-based U.S. dollar strength, supportive by the safe-haven demand, becomes the key factor that keeps trying to break the pair’s thin trading range. At this moment, the USD/JPY currency pair is currently trading at 106.30 and consolidating in the range between 106.20 – 106.39.

Despite the optimism over a potential treatment/vaccine for the highly infectious virus, the market risk sentiment remains depressive. Be it the worrisome headlines concerning the Brexit or the tension between the US-China, not to forget the coronavirus issues in the U.S., the market trading sentiment has been flashing red since the European session started, which ultimately keeps the safe-haven assets supportive on the day. 

At the US-China front, the rising tensions between the United States and China continued to pick up the pace as President Trump earlier imposed punitive measures over the Asian major. As a result, China announced new visa restrictions to counter the Trump administration’s action against China. Also fueled the tension could be the fresh headlines suggested that the U.S. is considering banning some or all products made with cotton from China’s Xinjiang region. Apart from this, the Brexit’s gloomy headlines also weighed on the market trading sentiment, which eventually supported the safe-haven appeal in the market and dragged the currency pair down.

Also weighed on the market trading sentiment were the fears of rising COVID-19 cases in the U.S., Europe, and some of the notable Asian nations like India, which fueling fears that the economic recovery could be halt.

On the contrary, the broad-based U.S. dollar succeeded in maintaining its positive traction and remaining bullish on the day amid risk-off sentiment. The U.S. dollar gains were further bolstered by the ongoing upsurge in the U.S. Treasury bond yields. However, the U.S. dollar’s modest gains turned out to be the major factor that capped the pair’s further downside momentum. Whereas, the U.S. Dollar Index, which tracks the greenback against a basket of other currencies, rose by 0.13% to 93.168 by 9:53 PM ET (2:53 AM GMT).


Daily Technical Levels

Support Pivot Resistance
105.7900 106.0900 106.3200
105.5600 106.6200
105.2500 106.8500

USD/JPY – Trading Tips

The USD/JPY is consolidating at 105.928 area, having a resistance mark of 106.025 level. An upward crossover of 106.024 level may extend further buying trend until the 106.480 level, and the violation of this level can extend buying until the next resistance level of 106.840. On the downside, the safe-haven USD/JPY currency may gain support at 105.620 and 105.280. Let’s consider taking a sell trade below 106.024 level as the MACD and RSI also suggest selling bias. Good luck! 

Categories
Forex Psychology

How Greed Can Both Help and Hinder Your Trading

Forex trading is often referred to as an emotional rollercoaster ride due to the ups and downs of various emotions that humans can experience while trading. When we’re winning, we feel excited or on top of the world and may never want to stop. When we’re down, we might feel anxious, afraid, or depressed. Although our thoughts on these emotions might be black in white, for example, excitement is usually regarded as a good emotion, these feelings can all have negative influences on our trades. This is because someone that is feeling excited might keep going when they should stop, thus resulting in a loss. Today, we will talk about the way greed can influence our trades. 

Greed could be considered a mixed bag when it comes to positive and negative outcomes. The truth is that greed mostly has a negative influence on our trading decisions, although it is associated with ‘riding the wave’ in trading. This is a common tactic that can be highly rewarding, as long as one knows when to get out. It only works in highly volatile trending markets and can be done using various indicators or with some background knowledge. Traders generally label this strategy as greedy, and this can be one of the only benefits of being greedy in the forex market. However, many greedy traders do not know when it’s the right time to get out of the trade because they are always looking to make the most profit possible.

Most professionals will tell you that there’s nothing good about getting greedy when you’re trading. Many of these seasoned traders have experienced the devastating effects of the emotion firsthand, so they want to pass along this lesson to save others from its devastating effects. Here are some of the negative ways that greed can interfere with your trading:

  • Greedy traders risk too much because they are often seeking a big return. This can backfire and result in a large loss instead. These traders might ignore their take profit levels and fail to exit trades when they previously planned to.
  • A greedy trader might miss out on one opportunity and want to make more the next time around, only to end up with a loss. 
  • Greedy traders never feel as though they have accomplished enough. Rather than congratulating themselves for a job well done, they feel the need to keep going.
  • A greedy trader often focuses on making profits in general and might fail to think far enough ahead.
  • Some greedy traders set limits but deviate from those limits once greed takes over.
  • A greedy trader might trade too much out of a constant fear of what they’re missing. This is also known as ‘overtrading’. A good trader knows when to step back and take a break. Sometimes, the best move is doing nothing. 

As you can see, greed can really interfere with our trades and cause one to keep going past their take profit level, only to lose in the end. A trader might get lucky a few times doing this, but this tactic is too close to gambling and is bound to cause more losses than gains in the end. Trading too much, or overtrading, is not a good move if you want to be successful. Many greedy traders might not realize that they are making these mistakes. In fact, they probably feel that they are making logical decisions. This is why it’s important to recognize this emotion and how it can hinder you before you begin.

If you’re already trading and feel that greed is affecting you, take a step back and look at the big picture so that you can focus on solving the problem. Sure, greed is associated with riding the wave, which can be highly profitable for some traders, but this emotion causes more harm than good. Always try to be vigilant about the ways that greed might be affecting your trades and invest some time into learning about trading psychology if you haven’t yet. 

Categories
Beginners Forex Education Forex Basics

Guide to Developing a Forex Trading Plan

If you’re going to be a successful forex trader, you’ll need a trading plan. Trading plans are notoriously helpful because they help traders to remain disciplined, trade consistently, keep emotions in check, and they can help you to improve your trading strategy.  These are the key factors that need to be taken into consideration:

  • Your trading plan structure and financial goals
  • Research and education
  • Strategy (using fundamental and technical tools)
  • Risk management
  • Timing
  • Trade mechanics, documenting, and testing 

Before you even begin to develop a plan, you need to figure out what type of trader you should be. You’ll want to think about how much time you actually plan to spend trading, for example. Some only trade part-time, while others trade full-time. Your motivations are another important item to consider. Are you trading to become successful in the long-term, as a hobby, to have more time to spend with friends and family, or for some other reason? Defining your goals and expectations is important when figuring out how you should trade and how much you will need to invest. This is what you need to figure out:

  • Why do you want to become a trader? What are your motivating factors?
  • How much time can you carve out for trading?
  • Do you have an appropriate amount of money to achieve your financial goals? 
  • What are your strengths and weaknesses? An example of a trading weakness would be anxiety. 
  • Figure out whether you are a fundamental or technical trader.

Once you’ve figured out all of the above, you’ll be ready to start investing time into research and education. From there, it’s time to develop a trading strategy that fits with your goals, the amount of time you have for trading, your education level, and what type of trader you are. These are the concepts that need to be included in your trading strategy:

  • Types of analysis tools that will be used (technical or fundamental – or both)
  • When and how those tools will be used
  • Timeframes to use the tools
  • Sequence of analysis
  • Types or orders that will be used (market, trailing stop, etc.)
  • What types of trades to place

Once you have a set plan, you must remember to use it. Many traders spend a great deal of time working on their plan but fail to use it later down the road. Also, don’t forget the last step. Once you have a plan, you’ll need to test it and document your results. A trading journal is the best way to keep track of this information and to get an overview of how your plan is or isn’t working. 

Categories
Forex Basic Strategies

Learning To Trade The ‘Turn To Trend’ Forex Strategy

Introduction

Although many times before, we have stressed on trading with the direction of the market, yet most traders have a hard time trading with the trend. The observation is contrary to what is said by experts and professional traders since the majority of retail traders claim to be trading with the trend but end up trading counter-trend. While everyone talks of the idiom, “the trend is your friend,” in reality, most traders love to pick tops and bottoms and constantly violate the above rule.

Time Frame

The strategy is fixed to two-time frames. The daily time frame for trend identification and the 1-hour time frame for trade entry.

Indicators

We use the following technical indicators for the strategy:

  • 20-period SMA
  • Three standard deviations Bollinger band (3SD)
  • Two standard deviations Bollinger band (3SD)

Currency Pairs

This strategy is applicable to most of the currency pairs listed on the broker’s platform. However, exotic pairs should be avoided.

Strategy Concept

This setup recognizes the desire of most traders to buy low and sell high but does so in the predominant framework of trading with the trend. The strategy uses multiple time frames and a couple of indicators as it’s a tool for entry. First and foremost, we look at the daily chart to ascertain of the pair in a trend. For that, we use the 20-period simple moving average (SMA), which tells us the direction of the market. In technical analysis, there are numerous ways of determining the trend, but none of them is as simple and easy as the 20-period SMA.

Next, we switch to the hourly charts to find our ‘entry.’ In the ‘Turn to Trend’ Strategy, we will only trade in the direction of the market by buying highly oversold prices in an uptrend and selling highly overbought prices in a downtrend. The question arises, how do we know the market is overbought or oversold? The answer is by using Bollinger bands, which help us gauge the price action.

Bollinger bands measure price extremes by calculating the standard deviation of price from its moving average. In our case, we use the three standard deviation Bollinger band (3SD) and Bollinger band with two standard deviations (2SD). These two create a set of Bollinger band channels. When price trades in a trend, most of the price action will be contained within the Bollinger bands of 2SD and 1SD.

Trade Setup

In order to illustrate the strategy, we have considered the chart of EUR/CAD, where we will be applying the strategy to take a ‘long’ trade.

Step 1

The first step is to identify the major trend of the market. This can be done using the 20-period simple moving average (SMA). If the price is very well above the SMA, we say that the market is in an uptrend. Likewise, if the price is mostly below the SMA, we say that the market is a downtrend. For this strategy, we have to determine the trend on the daily chart of the currency pair.

In our case, we see that the market is in a strong uptrend, as shown in the below image. Hence, we will enter for a ‘long’ trade at the price retracement on the 1-hour time frame.

Step 2

Next, we have to change the time frame of the chart to 1 hour and wait for a price retracement. In order to evaluate the retracement, we plot three standard deviations (3SD) and two standard deviations (2SD) Bollinger band on the chart. After plotting the two Bollinger bands, we need to wait for the price to get into the zone of 2SD-3SD BB.

In the below image, we can see that the price breaks into the zone of 2SD-3SD BB after a lengthy ‘range’ movement.

Step 3

Once the price moves into the zone of 2SD-3SD BB, we wait for the price to bounce off from the lower band of the 3SD BB to give an indication of a reversal. In a ‘short‘ set up, the price should react off from the upper band of the 3SD BB, and give an indication of downtrend continuation. During this process, we need to make sure that the price does not break below or above the 3SD BB. Because if this happens, the ‘pullback’ is no more valid, and this could be a sign of reversal. This is a crucial aspect of the strategy.

The below image shows how the price bounces off from the lower band of the 3SD BB two candles after the price moves into the zone.

Step 4

We enter the market at the first sign of trend continuation, which was determined in the previous step. Now we need to define the stop-loss and take-profit for the strategy. Stop-loss should be placed below the lower band of the 3SD BB, in case of a ‘long’ trade and above the upper band of the 3SD BB, in a ‘short’ trade. The ‘take-profit’ is not a fixed point. Instead, we take our profit as soon as the price touches the opposite band of the 3SD BB.

In the case of EUR/CAD, the resultant risk-to-reward of the trade was a minimum of 1:2, as shown in the below image.

Strategy Roundup

The beauty of this setup is that it prevents us from guessing the turn in the market prematurely by forcing us to wait until the price action confirms a swing bottom or a swing top. If the price is in a downtrend, we watch the hourlies for a turn back to the trend. If the price continues to trade between the 3SD and 2SD BB, we stay away as long as we get confirmation from the market. We can also set our first take-profit at 1:1 risk to reward to lock in some profits.

Categories
Beginners Forex Education Forex Basics

Pitfalls that New Traders Need to Avoid

We have all been a new trader at some point in our lives or at least considering becoming one. We have seen all of the amazing results that people are getting over the internet (top tip, not all the results that you see posted are real). Trading is becoming more and more accessible to pretty much anyone around the globe. With amounts as little as $1 or $10 being the minimum accepted deposits, this means that pretty much anyone with a computer or access to one can trade. 

Due to this, there has been a huge influx of new traders into the trading world, these traders are coming into the industry with an expectation that they will be able to make money, and a lot of it very quickly. This is of course a dangerous mindset, but it is what has been blasted into their minds. Due to this, many come in without the knowledge or experience required to be successful. So today we are going to be looking at some of the pitfalls around that newer traders (and some experienced ones) fall into on a regular basis. If you have been in one, do not fear, there are always ways out of them and ways to improve, if you have not yet started trading, then take them as a warning of what to avoid once you do take the plunge and start your trading career.

Spending More than You Can Afford

One of the main warning signs that you are told by pretty much all of the brokers is that you will probably lose and that you should not be using money that you cannot afford to lose. Many people come in with the hope that they will be able to make a lot of money, the really sad thing is that a lot of these people have been given the wrong information. The countless adverts and social media posts showing off wealth, showing off accounts that have seemingly made from a small deposit of $5. Their desperation has made them want to trade to make money so they have put everything that they have got into it. That is the worst case, there are others who are much better off in life who are also trading more than they have to play with. You should not be trading with anything that you would miss should you use it. Any money that you put in should be considered lost until you withdraw it back to your bank account. If you need the money for rent or food, then do not trade with it, it should be as simple as that, and please, do not borrow money to trade with, that is another course towards disaster, do not put yourself in debt for the hope of making more money.

Lack of Knowledge

When you start anything in life you are starting with it with very little knowledge, you may have heard something here and there or seen how it works, but your actual understanding of how it works is not fully there yet. Yet this does not stop people from getting involved and it does not stop people from starting straight away on a live account. Some may not know that demo accounts are sexist, some may not want to use them, but the real issue comes from those that do not want to learn first. They simply want to start making money without trying to gain the knowledge and experience needed first. There needs to be an element of learning, reading, and practicing before going live. If we tried to play chess with no knowledge of the rules, things wouldn’t go well. The same works for trading and pretty much anything in life, so ensure that you get to know what you are doing and why before you actually try to do it.

Going too Fast

This one leads on from the previous point, some people do gain some knowledge, but then they decide to move a little too fast. Simply knowing something does not mean that you will be good at it and it certainly does not mean that you will be able to be profitable. The old phrase of walk before you can run is certainly relevant here. If you have made a successful trade, that does not mean that everything is perfect, so do not jump straight to larger trades. If you have learned something new such as a new strategy, then do not simply jump straight into the live markets, try a demo account. It is important that you take things slowly, do not jump the gun and get ahead of yourself. Take things one step at a time, learn something new, then one more step, do not try and jump the gun and escalate your trading too quickly.

Overconfidence

Getting overconfident is one of the big sins of trading, as soon as you act in a way that is above your current level you will begin to experience losses and the risk management that you have put on your account goes out the window. Overconfidence normally comes from a win or a number of wins in a row, this makes you believe that your own opinion is the best bet and so you follow it. You then begin to increase the trade sizes, the trade frequency, and more just because you think that what you know is more and better than others. This is not the case and overconfidence will only lead to losses. Remember that it is the markets that are in charge and not you.

No Emotional Control

Emotions can get the better of us, they can get the better of anyone, when you first start out you may be starting to experience certain emotions that you have not really experienced before. Things like regret, greed, overconfidence, and doubt are some of the main ones. Each one can have a different effect on your trading and overall profitability. It is important that you get familiar with them, it is also important that you work out ways that you can either avoid or get around them when they pop up, because they will. When you learn to control your emotions you will be able to concentrate once more on the trading and your strategy rather than worrying about the emotions that you are now feeling.

Going Live Straight Away

Demo, demo, demo. Those are important words, yet they are often ignored completely. If you want to be a successful trader then you need to be able to utilise demo accounts properly. When you are starting out with a new strategy, test it for an extended period of time before going live. If you have a working strategy but need to adjust it, then test it on a demo account first. If you need to change your risk management, test it on a demo account first. You should be getting the drift here. Always test everything you do on a demo account before you make changes, if you don’t add you make a change directly onto your live account, then it can lead to losses due to not knowing what effect the changes will have on your strategy.

So those are some of the pitfalls that newer traders seem to fall into the most, there are of course others and these are of course not only for new traders, experienced ones also still manage to fall into these traps. If you have an understanding of them, it will be far easier to work out how you can avoid them in the future to help better your trading.

Categories
Forex Market Analysis

Daily F.X. Analysis, September 04 – Top Trade Setups In Forex – Brace for U.S. NFP Figures! 

On the news front, the eyes will be on the U.S. ADP Non-farm payroll figures, which may drive price action during the New York session today. Besides, the U.S. Crude Oil Inventories will remain in highlights as economists expect a slight draw in U.S. oil stocks that may drive buying in WTI crude oil.

Economic Events to Watch Today  

EUR/USD – Daily Analysis

The EUR/USD pair was closed at 1.18513 after placing a high of 1.18644 and a low of 1.17888. Overall the movement of the EUR/USD pair remained flat yet bullish throughout the day. After dropping for two consecutive days, the EUR/USD pair extended its losses in the first half of the day but reversed its direction and started posting gains in the late trading hours.

After reaching a 2-years peak level, the EUR/USD pair saw subsequent profit-taking that weighed on its prices and dragged it down. However, on Thursday, the pair’s extra downside pressure was due to the strong U.S. dollar amid better than expected economic data.

The Unemployment Claims from the United States last week dropped to 881K from its previous forecast of 955K and supported the U.S. dollar. The less unemployment claim benefits mean more people rejoined their jobs during the last week in the U.S. and raised hopes for a quick economic recovery.

Moreover, from the European side, at 12:15 GMT, the Spanish Services PMI in August dropped to 47.7 from the forecasted 48.0 and weighed on the shared currency Euro. At 12:45 GMT, the Italian Services PMI for August also dropped to 47.1 from the expected 49.4 and weighed on Euro. AT 12:50 GMT, the French Final Services PMI dropped to 51.5 from the projected 51.9 and weighed on Euro.

However, at 12:55 GMT, the German Final Services PMI rose to 52.5 from the expected 50.8and supported Euro. At 13:00 GMT, the Final Services PMI for the whole bloc in August also rose to 50.5 and showed an expansion against the expectations of 50.1 and supported the Euro that added further in the EUR/USD pair’s gains. At 14:0 GMT, the Retail Sales data from Eurozone dropped to -1.3% in July against the anticipated 1.3% and weighed heavily on Euro.

Most data from Europe on Thursday came in against the local currency and took the pair EUR/USD to its five days lowest level on Thursday. However, in the late trading session, the pair managed to reverse its track and started posting gains. On the other hand, on Thursday, a survey showed that the Eurozone’s rebound from its deepest economic downturn was weakened in August as some countries in the E.U. suffered more than others from the restrictions imposed to curb the spread of the virus.

On Thursday, France’s government detailed its 100 billion euro stimulus plan to erase the coronavirus crises’ economic impact over two years. The billions of euros were lined up in public investments, subsidies, and tax cuts. This added pressure on the single currency Euro and the pair dropped in the first session.

Meanwhile, the countries that rely heavily on tourism like Italy, Spain, and Greece saw a large contraction in the services PMI on Thursday as travel restrictions were put in place to stop the coronavirus spread.

Apart from that, the EUR/USD pair was also under pressure on Thursday because of the latest comments from the Chief ECB Economist, Philip Lane, who said that authorities have started to become uncomfortable with the single currency’s recent appreciation. This not only triggered the profit-taking but also hopes for a new stimulus measure from the European Union to ease the rally of EUR currency. However, the pair EUR/USD managed to find support at the ending hours of Thursday’s trading session as the selling pressure was eased ahead of the NFP data from the U.S.

Daily Technical Levels

Support Pivot Resistance
1.1802 1.1834 1.1879
1.1757 1.1911
1.1726 1.1956

EUR/USD– Trading Tip

As expected, the EUR/USD bounced off over the support level of 1.1795, and now it’s heading further higher until the next target of 1.1890. The pair may find an immediate resistance at 1.1860 level. Conversely, the EUR/USD may find support at 1.1808 and 1.1780 levels. NFP will determine further price action in the pair. 

GBP/USD – Daily Analysis

The GBP/USD pair was closed at 1.32804 after placing a high of 1.33584 and a low of 1.32424. Overall the movement of the GBP/USD pair remained bearish throughout the day. The British Pound fell for a second straight day on Thursday and threatened to reverse the 3-week winning streak on the Bank of England’s rising expectations of negative interest rates.

Recently, the Governor of Bank of England, Andrew Bailey, has said that the central bank could adopt the worst-case scenario’s negative interest rate policy. The scenario pointed towards the second wave of coronavirus and failure to reach a post-Brexit trade deal with the E.U.

According to Andrew Bailey, the use of negative interest rates would be strong in the worst-case scenario instead of using bond buying or quantitative easing, which are considered the central bank’s preferred tools.

He added that the fears of the second wave of coronavirus affected the recovery pace as the key parts of economy operations were under their normal level. He said that he was worried about the weak economic activity in London.

Bailey also highlighted that there was still a huge amount of uncertainty around the effects that the crisis would have on the economy long term. These concerning comments from bailey weighed on a single currency Pound and kept the GBP/USD pair under pressure on Thursday.

Moreover, the U.S. dollar also played an important role in keeping the currency pair GBP/USD on the downside on Thursday after the release of U.S. Unemployment Claims data.

At 17:30 GMT, the Jobless Claims from last week dropped to 881K from the forecasted 955K and supported the U.S. dollar. At 19:00 GMT, the highly awaited ISM non-Manufacturing PMI remained flat with the expectations of 47.0. The strong U.S. dollar then weighed on GBP/USD pair and extended its previous day losses.

Whereas, from the Great Britain side, at 13:30 GMT, the Final Services PMI for August dropped to 58.8 against the anticipated 60.1 and weighed on single currency Sterling. The already weak Sterling weighed on GBP/USD pair, and the pair posted losses on the day.

On the Brexit front, the E.U. chief negotiator Michel Barnier launched another attack on U.K.’s post-Brexit stance and said that the British government sought to have its cake and eat it. He accused the U.K. of failing to engage constructively in talks on the future relationship. He stressed the need to approve an agreement by the end of October to have time for ratification. Barnier claimed that despite the U.K.’s desire for independence from the E.U., in practice, the U.K. was seeking the status quo but without obligations. Barnier’s comments raised concerns over the Brexit deal and weighed on GBP that dragged the currency pair GBP/USD on the downside.

 Daily Technical Levels

Support Pivot Resistance
1.3228 1.3293 1.3344
1.3177 1.3409
1.3112 1.3460

 GBP/USD– Trading Tip

On Friday, the GBP/USD pair is trading bearish at 1.3308 level, set to test the support level of 1.3168 level. The Cable has already violated an upward trendline at 1.3375 level, which is already violated. On the lower side, the GBP/USD may drop further below 1.3358 until the 1.3263 level. The MACD is also supporting selling bias; therefore, we will be looking for selling trades below the 1.3355 level. 

USD/JPY – Daily Analysis

The USD/JPY pair was closed at 106.184 after placing a high of 106.551 and a low of 106.000. Overall the movement of the USD/JPY remained flat yet bullish throughout the day. The USD/JPY pair extended its bullish streak for the 4th consecutive day and rose to a high of 106.5 level on Thursday on positive U.S. jobless claims and services PMI data. However, the pair failed to remain higher and lost most of its daily gains in the late session as the Japanese Yen found demand as a safe-haven.

The U.S. stock market dropped sharply on Thursday, with S&P 500 and the Nasdaq Composite indexes down by 3.5% and 5.05%. The fall in equities was caused by the lack of progress in the next coronavirus stimulus package by the U.S. government and overdue correction.

Moreover, the US-Treasury yields for the 10-year note lost almost 5%, and the U.S. Dollar Index stayed in the positive territory near 92.8 level as the greenback continued to perform higher against its risk-sensitive rival currencies and helped the USD/JPY to limit its fall in the second session.

On the data front, at 17:30 GMT, the Unemployment Claims from last week were dropped to 881K from the projected 955K and supported the U.S. dollar that added further gains in the USD/JPY pair. 

The Revised Non-farm Productivity for the quarter raised to 10.1% from the forecasted 7.3% and weighed on the U.S. dollar. The Revised Unit Labor Costs for the quarter declined to 9.0% from the anticipated 12.0% and pressured on the U.S. dollar. The Trade Balance in July showed a deficit of 63.6B against the expectations of 58,2B deficit and weighed on the U.S. dollar. At 18:45 GMT, the Final Services PMI for August rose to 55.0 from the expected 54.8 and supported the U.S. dollar that added strength in the USD/JPY pair. At 19:00 GMT, the ISM Non-Manufacturing PMI remained flat with the expectations of 47.0 and had almost no effect on the U.S. dollar.

The decrease in Unemployment claim benefits and rise in Final Services PMI gave a push to U.S. dollar and USD/JPY pair gains on Thursday.

On the coronavirus front, 25.8 million people have been reported to be diagnosed from coronavirus globally. Almost 17 million people have been reported to be recovered, while more than 850,000 have reported as dead. On Wednesday, after easing the pandemic restrictions, India reported more than 78000 cases in a single day and surpassed the U.S. for a daily case record of coronavirus.

Australia saw the biggest drop in GDP for the quarter and was pushed into recession for the first time since 1991 amid a pandemic crisis and its effect on the economy. These lingering concerns over the coronavirus kept the safe-haven demand for Japanese yen on board and limited the USD/JPY pair’s gains.


Daily Technical Levels

Support Pivot Resistance
105.9300 106.2500 106.5000
105.6800 106.8200
105.3700 107.0700

USD/JPY – Trading Tips

On Friday, the USD/JPY currency pair is trading at 106.077with an immediate resistance level of 106.085 level. Bullish crossover of 106.085 level may drive further buying until the next resistance level of 106.570. On the lower side, the USD/JPY pair may find support at 105.800 and 105.500 levels. Let’s consider buying over 106.100 level as the MACD and RSI also suggest the same. Later today, the eyes will remain on the U.S. NFP figures. Good luck! 

Categories
Forex Trade Types

Day Trading Vs. Swing Trading: Which is Better?

Every trader might have individual goals – but we all have the same major goal at the end of the day: making a profit. There are a lot of different strategies and methods that traders use to try to accomplish this goal. Some prefer scalping, naked trading, breakout trading, using pivot points, and so on. Two of the most popular trading methods are day trading and swing trading. While traders using these methods have the shared goal of making profits, they go about this in very different ways. If you’re going to become a trader yourself, you’ll need to know about these popular strategies. 

Day Trading

Day traders make multiple trades per day, and almost always close out every single trade before the end of the day. In order to be considered a day trader, you’d need to make at least four trades per every five days. This trading style requires more attention than some other methods, with many traders becoming professional day traders in lieu of working a regular 9-5 job. This is because you need to actively monitor the market so that you can open and close your trades during the day. Day traders tend to make decisions based off of some of these factors:

  • Price discrepancies
  • Fundamentals
  • Quantitative reasons

As you can see, day traders often consider hard numbers when making decisions. If you want to be a day trader, you’re going to need an impressive account balance. In order to follow the “pattern day trader rule”, you’ll need to maintain a minimum account equity of at least $25,000 each day that you plan to trade. This is probably one of the main disadvantages of day trading, as many traders won’t be able to meet that requirement. You could always trade with less, but it may be difficult to open and close enough trades to truly be considered a day trader, or to make enough profit for a substantial living. 

Swing Trading

Swing trading is essentially the opposite of day trading. It involves buying securities and holding them for longer than a day, oftentimes for days or even weeks before selling. Many swing traders make decisions based off of:

  • Graph patterns 
  • Technical analysis (this involves looking at a price’s past history on charts)
  • Macroeconomics 

Swing traders often look to graphs and technical analysis, although some numbers and other factors can be considered as well. This type of trading doesn’t require as much time and attention as day trading, making it a better option for those that don’t have the time to monitor their trades as often. Swing trading also doesn’t require a large starting deposit, unlike with day trading. One of the downsides to choosing this method is that is can lead to overtrading and it produces less in returns than long-term buy-and-hold investors make. You’re also apt to pay more fees and commissions for holding your trades overnight. 

The Bottom Line

Should you become a day trader or swing trader? Here’s a quick summary to help pinpoint which style is right for you:

  • If you want to be a day trader, you’ll need an account balance of around $25,000. If you can’t possibly come up with this or don’t want to, swing trading is the way to go.
  • Swing traders will wind up paying more fees to their brokerage. 
  • Many day traders trade full time instead of working a regular job, as it requires your attention multiple days a week and trades must be actively monitored. Swing trading is better for those that might work a regular job or whom just don’t have that much time to spend trading in a given day.
  • Day traders typically make decisions based on numbers and fundamentals, while swing traders focus more on graphs and technical analysis. You might already have experience with one of these types of research. 

You might feel drawn to one of these methods, but if you don’t, then that’s okay too. There are a variety of other trading strategies out there and the best thing to do is to familiarize yourself with as many of them as possible. If you do decide to become a day trader or swing trader, we’d highly recommend performing a lot more online research to be sure that you completely understand how to perform the strategy successfully.

Categories
Beginners Forex Education Forex Basics

Five Important Stats to Log in Your Trading Journal

Whether you’re only considering trying out forex trading or you’re already a trader, there’s a good chance that you might have heard tips mentioning the importance of a trading journal. If you haven’t, you should know that these journals are essentially logs of all your trading activity. They are used to keep track of one’s performance over a certain period of time and can be used to evaluate your strategy, check out your profits and losses, look for any recurring issues, etc. However, what you keep track makes a huge difference in how effective your journal will be. If you’re not sure what stats to keep track of, take a look at our suggestions before for a quick guide. 

Win Percentage

Your win percentage is pretty straightforward, as it shows you if you’re winning more trades than you’re losing. Most of the time, a higher win percentage will mean more profits. However, this statistic might not be the best indicator of success if your losses are greater than your wins. For example, winning 1% on each winning trade but losing 2% on each losing trade would mean that you weren’t doing as well.   

Risk/Reward Ratio

Your risk/reward ratio revolves around the amount of money you’re willing to risk on each trade and how much you could profit. It’s important to figure out how much you want to risk on each trade so that you can ensure you could gain enough to make the trade worth it. 

Market Observation

In many cases, journal entries wind up more in the direction of one’s own self-analysis about the ways they were feeling or what they were thinking when entering or exiting the trade. It’s important to log this, but you’ll also want to include data about the market itself for the best results. 

Thoughts/Feelings

What were you thinking when you entered or exited each trade? Emotion is at the heart of trading psychology and it can really wreak havoc on your trades if you allow it to. This is why you should always log any feelings you might have that affected your trade. Did you pull out before hitting your stop loss because you were anxious? This would be an example of emotion you should log. 

Mistakes

You might want to beat yourself up over a silly mistake, but these things happen. It’s still important to log any losses that were caused by your own error, however, so that you will be able to see if it’s a big problem later on. One example of a common mistake many beginners make involves forgetting they’ve entered a trade. This might seem like a crazy mistake to make, but it is worth noting. You might just realize that avoidable mistakes are causing you to lose more money than you thought once you go back and check out those results.

A Few Quick Tips

  1. Always begin the journal entry before the trade and end it afterward.
  2. Write down everything in detail so that you won’t be missing any crucial information later.
  3. Remember to include market data and possibly screenshots, rather than only focusing on a self-analysis.
  4. Know that it’s important to log mistakes – if you forgot you entered a trade, be sure to write down what you were doing that caused you to forget.
  5. Don’t forget to log any emotions that might have affected your trading decisions.


Categories
Beginners Forex Education Forex Trading Platforms

Interactive Brokers Trader Workstation Review

Trader Workstation (TWS) is the flagship trading platform offered by Interactive Brokers, a US-based online trading leviathan. It has a lot of features to recommend it and also some drawbacks in various elements of its functionality. Trader Workstation by Interactive Brokers is a beast in many ways, but are all of them good? Continue reading to find out.

Getting Started

If one thing is clear, it is that Interactive Brokers is not interested in paying anything more than the most superficial lip service to attracting casual traders. In short, they cater to the more serious retail traders and to professionals. There are a few knock-on effects from this and everybody who chooses IB as their broker and TWS as their trading platform will encounter them in one form or another as they go forward.

One of these knock-on effects is the fact that the Interactive Brokers website is a little cumbersome and finicky to navigate. Now, let’s not go overboard, this isn’t ultimately going to slow you down too much but it remains a bit of a mystery why one of the leading international brokerages specialising in online trading hasn’t devoted more effort to ensuring a user-friendly online experience for its prospective clients.

Another little hurdle is the number of hoops you will have to jump through when opening an account. It is obvious that any efforts Interactive Brokers have invested in this area have resulted in only the most minimal streamlining. You will have to provide more information and e-sign more forms than you might be used to with other brokers before your account is open and, if you encounter any hiccups along the way, you might find this process a little disheartening at first. The good news is that the customer service team is – surprisingly, given IB’s previous reputation for sluggish customer service – actually very responsive and will guide you through any difficulties you encounter and that the help functions provided are well-thought-out and user-friendly. They provide a 24-hour contact number and a call-back service, as well as a useful online chat function that is staffed by an actual person on the other end and we found that the staff is quick to reply and very helpful in resolving any problems. And it shouldn’t be forgotten, of course, that this initial hoop-jumping is there primarily to ensure a high-level of security, so in a sense, it does provide a modicum of peace of mind.

Once you have cleared all of the not-insignificant amounts of formalities, you will be able to open an account without actually loading any cash onto it. This is a useful feature as it means you can give both the broker and their platform a quick test run without committing all the way. But don’t get too cozy in this state of limbo – if you don’t fund your account within 90 days, it will be retired automatically.

Trader Workstation Introduction

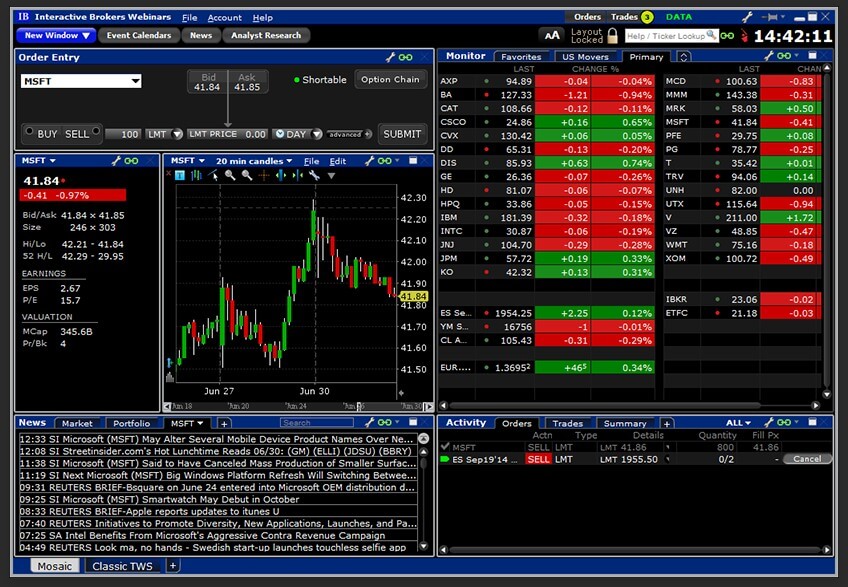
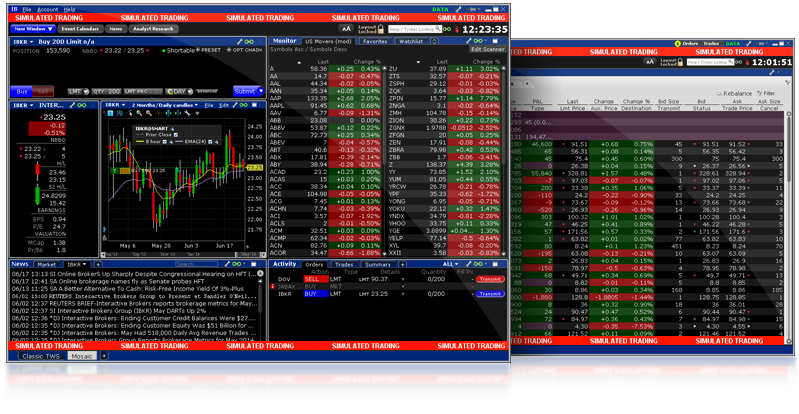
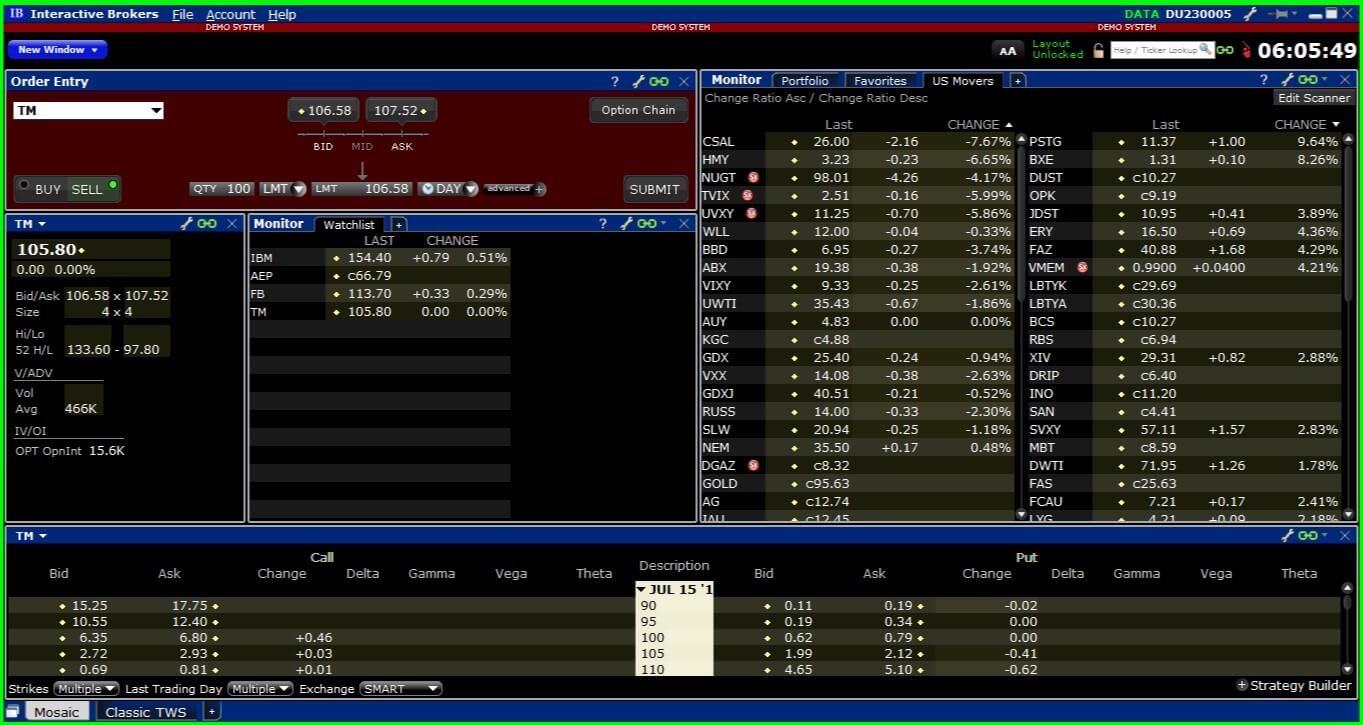
When you open the Mosaic interface in TWS, it’s going to be a little overwhelming at first. And, until you adapt to using this platform regularly, this is a genuine drawback. Your workstation will seem cluttered and that’s because it is cluttered.  This is probably an unavoidable aspect of how the TWS platform has to look in order to provide all of the functionality it does. There are some small elements of the design that do seem like they could have been more carefully thought through. One example is the little arrows that open and close fields. They appear in all sorts of windows that you will find yourself using daily so they are an integral part of the design – which makes it all the more baffling that the designers chose to make them so small and so hard to see. You might find yourself looking for a parameter or function for much longer than you need to, simply because you missed one of these little field-opening arrows in a menu. The good news is that it doesn’t take too long for your brain to catch up with what’s going on to the point where you become accustomed to all of the quirks of the platform design. And, when you make it to this point, you will begin to appreciate the flexibility of the layout and how much information it can provide you with at any given time.

Flexibility is a key aspect here and it is worth highlighting. The layout is customisable, so you will be able to tailor it to show what you need to see. You can change the size of the windows, you can move them around and you can delete them and bring up other windows as and when you feel you need to. A very useful feature here is the Layout Library, which enables you to pick out any one of a number of predefined templates that will give you a basic workspace layout that you can then go on to customise further. What’s particularly important here is that you can save your customised layouts and go back to them in the future.

You will need to spend some time becoming proficient in using the platform and getting to know your way around. Because it is aimed at professional, experienced traders, the platform is not optimised for beginners. The good news is that any prior experience you have with Metatrader will drastically flatten out your learning curve.

The TWS desktop platform is where you will want to be, since it has all of the extensive tools and functions you will need and, in those terms, outstrips the functionality of the web platform and the mobile app – though you can integrate some features (such as watchlists) across these three. Ultimately, however, the mobile app and online platform will not offer all of the functionality you need for anything more than tracking market movements and keeping up-to-date on news events. While security across all three has been beefed up significantly – more on that later – security-conscious traders will probably want to confine actual trading actions to just the desktop platform. The mobile app further suffers from not giving you access to drawing tools for your charts, so that’s also something to take into account.

Now, IB’s are certainly aware that mobile trading is a growing market and something that gets some traders quite excited, so they have invested in making the mobile app as attractive as possible. One of these is making sure that the app updates regularly and tracks updates to your iPhone or Android phone or tablet – something that maybe we’ve all become accustomed to with all kinds of apps we use but also that is particularly if you’re using your mobile device to trade.

Demo Account

The demo account offered by Interactive Brokers is a fully live, fully functioning demo account working in real-time. Everything is set up to faithfully mimic the trading experience you will encounter when trading live.

The main advantage of the demo account – other than, of course, enabling you to test and work out your trading system – is that it looks precisely the same as your live account. This gives you an invaluable opportunity to familiarise yourself with the trading platform prior to getting settled into using the full, live trading account. You do not want to be trading on your live account while you’re still fumbling around with various functions, clicking around searching for the data you need, or making sloppy mistakes because you’re unfamiliar with where things are. The demo account makes it possible for you to iron out all of those little niggles early on and make sure that you know exactly what you’re doing when you start trading in the real world. 

Resetting your demo account is also made not only easy – simply head to the account tab, which will take you to the IB website where it is simply a case of following the steps to resetting your account as and when you see fit. The one thing you need to be aware of is that it pays to close out all your outstanding positions before you reset. The reason being that if you reset to a smaller demo account, you might find that you do not have sufficient funds to close them out subsequently. All the same, when you have finished closing out your existing positions, resetting your demo account is easy and, even though a message will pop up telling you that you may have to wait a day, it usually happens instantly. 

Sizing and Organising Windows

The fact that the layout of TWS is endlessly customisable is, without a doubt, one of the platform’s great strengths. However, that does not mean that it is also without some snags and niggles. One of these has got to be the layout lock and unlock button. You’ll find this in the top right corner of your screen and, while you’re setting up your layout, it will be both your best friend and your worst enemy. While you’re adjusting and resizing and organising the windows of your layout, you will want it to be in the unlocked position. Conversely, while you’re trading, you want your layout to be locked because you don’t want to accidentally drag a window out of place or to close a window you need access to when developing a setup or placing an order. The problem is that until you have your layout set up exactly how you want it, you will find yourself having to go back and forth between a locked and an unlocked layout, and that will definitely cause some frustration.

Beyond this, the initial period of layout customization will certainly be coloured by a level of frustration. Particularly if you have even an ounce of OCD in your character, you will find this process challenging until you have everything lined up as you need and want it. Part of the reason for this frustration comes with how easy it is to overlap windows or to leave annoying gaps between them. Now, this might be a result of the windows not snapping into place as crisply as the average user will want, in which case it can definitely be chalked up as a design drawback. However, this initial setup phase will always be kind of clunky on any platform and with any workstation. Ultimately, the good thing is that you can then lock a layout into place and save it for future use, so it’s not like you will have to drag the windows around every time you open up TWS. Still, you may find yourself making little adjustments from time to time, whenever you feel unhappy about how you set them up in the past. Again, the ability to save your new layout is worth its weight in gold here.

Adjusting Charts

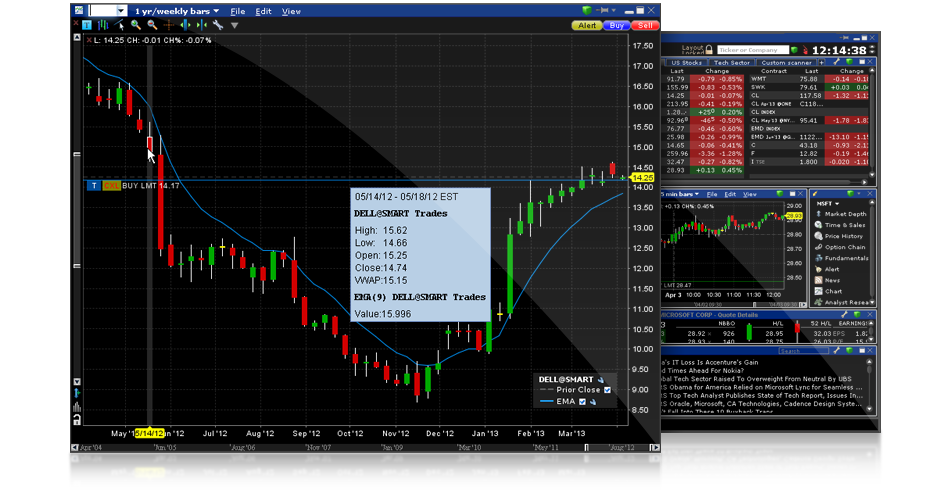
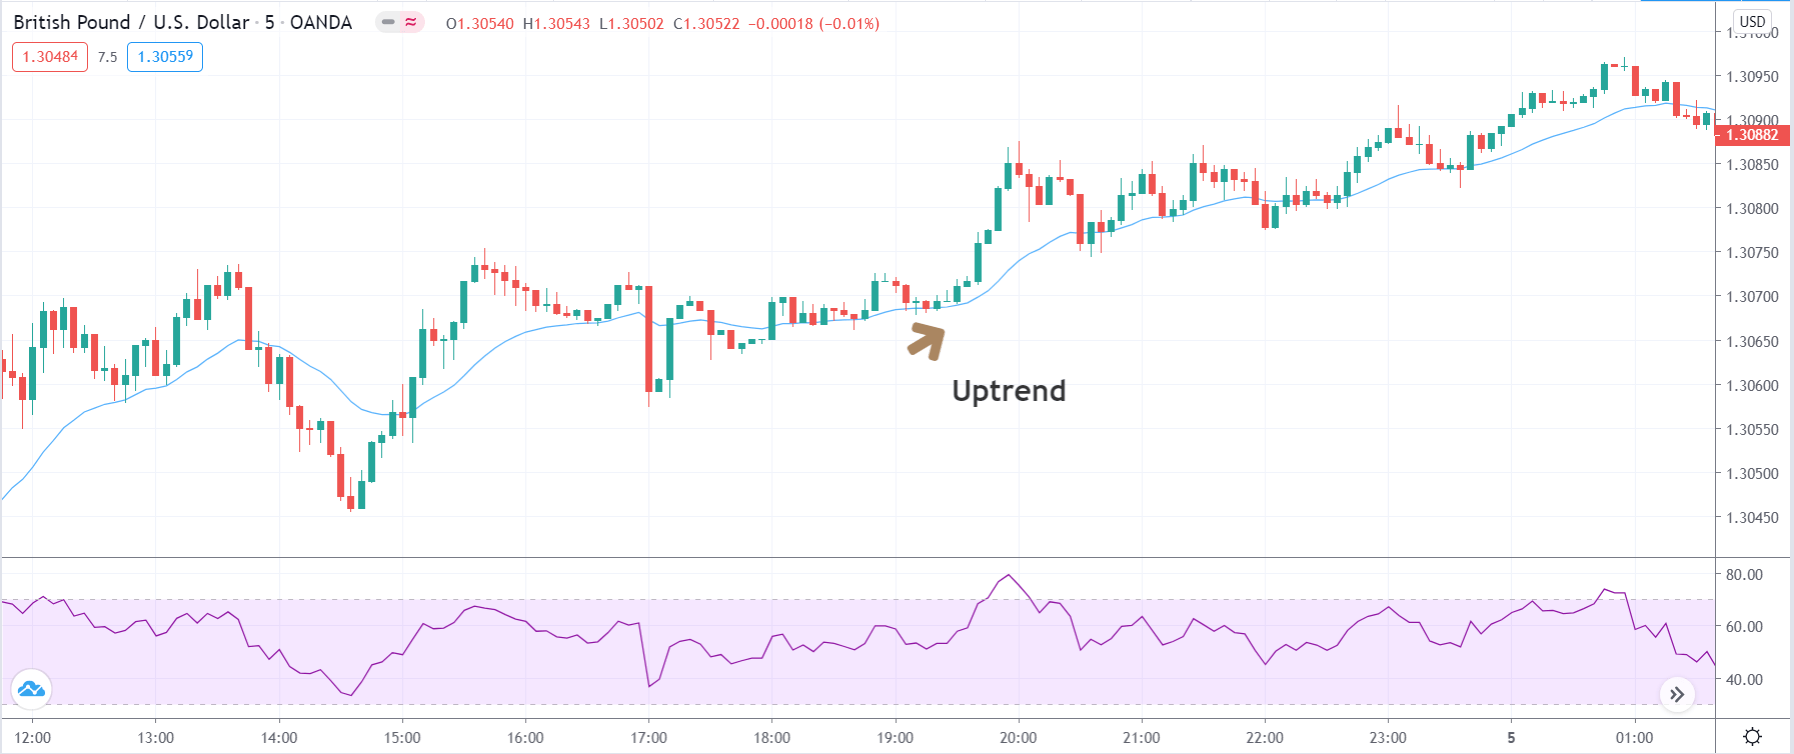
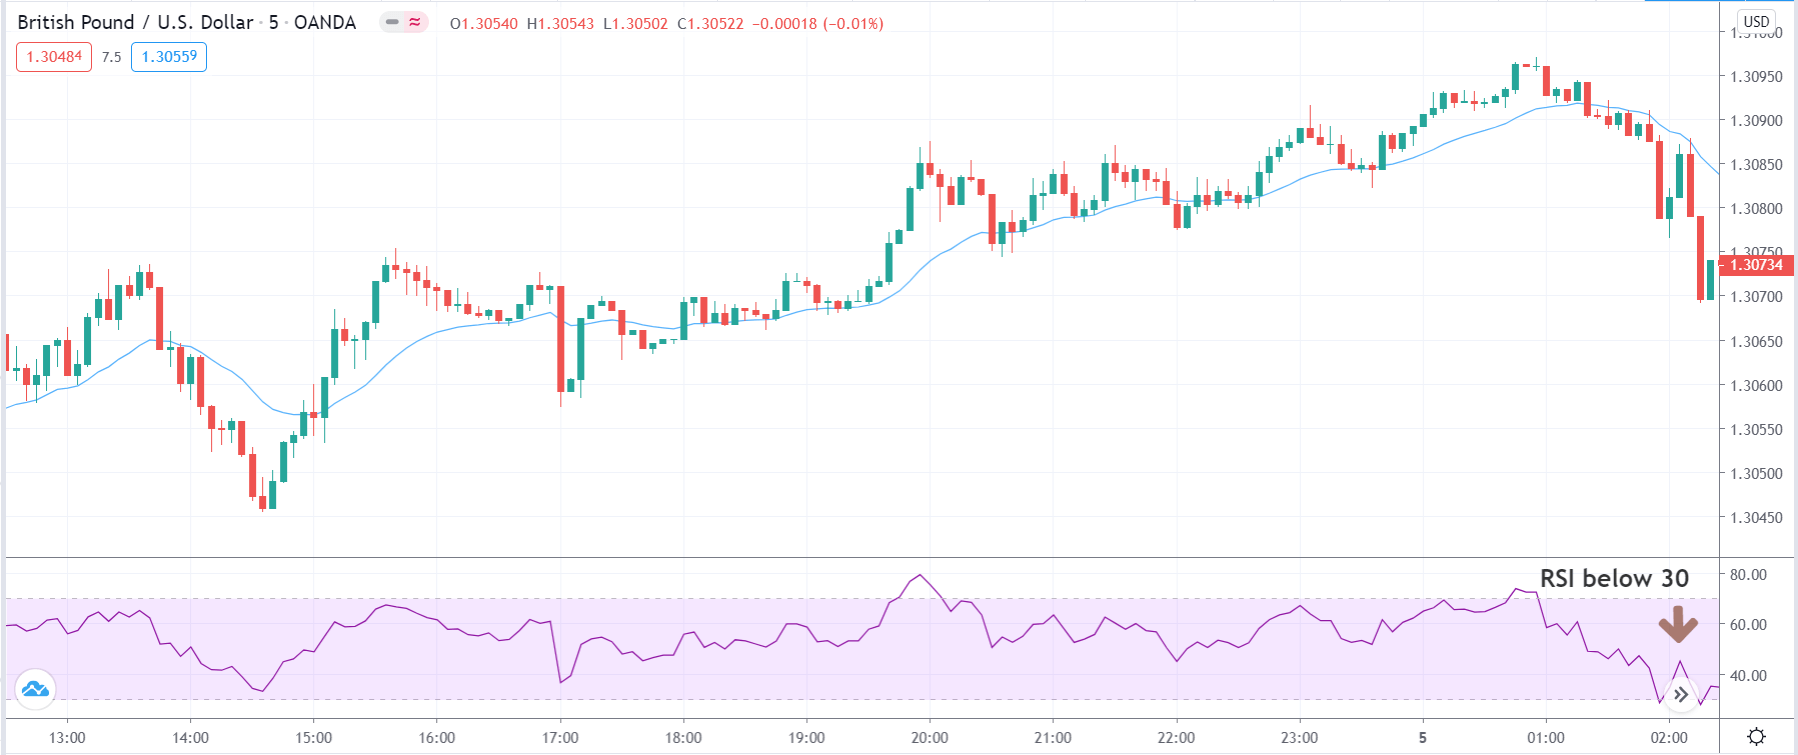
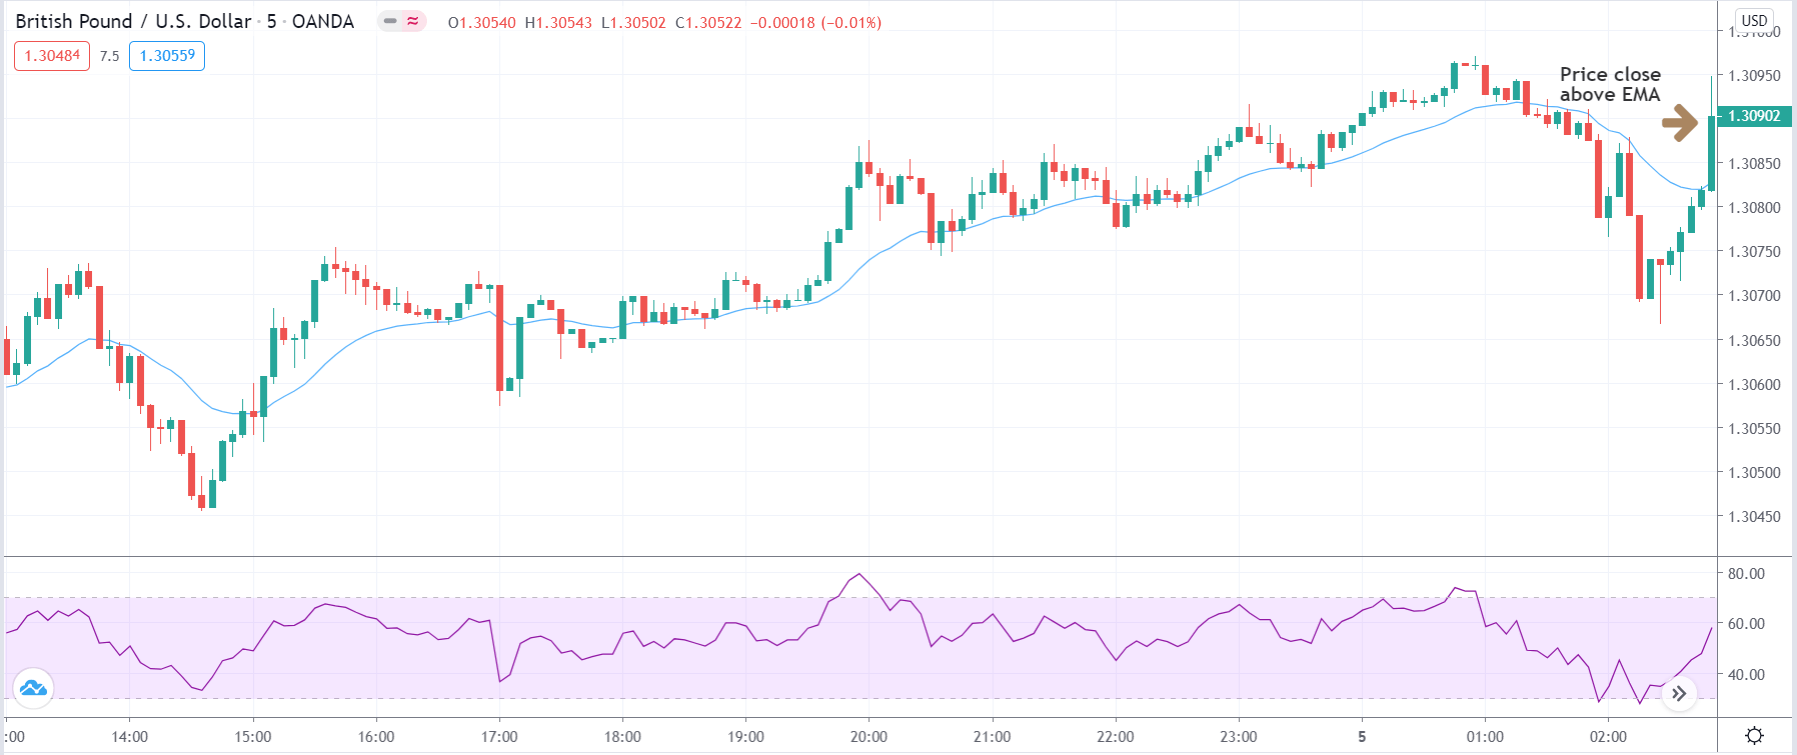
Customising your chart is exactly as easy and user-friendly as you would expect from such a professional platform. All of the options are available to you, including a wide range of timeframes and parameters. At first glance, the sheer number of various options you are presented with when you click on Chart Settings might be bewildering to less experienced traders but you will quickly come to appreciate the functionality and flexibility of having so many parameters to choose from. The same settings menu is also your go-to place for a large range of indicators that are integral to the platform – simply click through the various drop-down menus under the Studies tab and pick out the indicators you need. You can also make a number of adjustments to your chart just by right-clicking on the chart itself, which opens up a menu that will reveal a number of handy tools. Simply as a result of the large number of options available, you are going to want to take some time to familiarise yourself with all of these functions and it may take you a while to find what you are looking for.

Creating Your Own Tabs

Another element of additional functionality and flexibility in the Mosaic interface is the option to create your own tabs in certain windows. As an example of that, in your Monitor window, you can simply click the little ‘+’ to add a tab. This is a great addition because it allows you to add multiple watchlists and portfolio view options that are then extremely easy to access. More importantly still, you can add additional tabs along the bottom of the interface that allow you to open up various layout options. This is endlessly useful as it means you can have layouts devoted just to charts on various timeframes, ones devoted to tracking your portfolio, or, indeed, any combination of layouts you need to make your trading as informed and structured as possible. The fact that you can design, adjust and save each one of these layouts means that you are able to customise your entire trading experience from top to bottom.

There are a couple of drawbacks, of course, since no platform is ever going to be completely perfect. One of these is that you will, especially initially, find yourself having to lock and unlock your layouts as you go back to them to make minor adjustments. This can get a little tiresome if you are determined to make each layout as neat and readable as possible. Another minor issue is that the tabs end up filling up pretty fast, which gives the screen a cluttered look and makes it a little harder to find what you’re looking for. But, since you are in control of the number of tabs and both the location and content of every tab, you will eventually come to think of the layout as your own creation – so if you can’t remember where you put the tab with the various timeframe charts, you only have yourself to blame. 

Of course, there are smart ways to set up your layouts and there are less-than-smart ways to do it. The added flexibility of TWS does kind of guide you to smarter ways for arranging your layout. One example of this is that some traders might be tempted to add tabs for each currency pair they’re trading but that would lead to the tabs quickly becoming completely overwhelming and ultimately unusable. The better way to switch between currency pairs is to go to have a window set up on your primary layout displaying all of your pairs in an overarching watchlist. A simple double click on any currency pair in your watchlist will switch over your main chart to display that currency combination – offering you a much easier and more elegant way to skip between currencies. You can also ungroup certain charts from this function so that they always display a given currency – to do this, simply click on the chain-link icon in the top right corner of your chart window. While it provides a useful function, the grouping system is not the best solution as it gets quite confusing keeping track of what groups are assigned to what functions of over multiple currencies. It might have been better had the platform designers simply provided a chart lock function that would exclude a locked chart from changing whenever the user selects a different currency pair in their watchlist. 

It is perhaps these minor shortcomings that are the platform’s real Achilles heel. If users are already presented with a myriad of customisation choices and options, hundreds of functions and parameters to set, then the last thing they want to be doing is also keeping track of which charts have been assigned to which group. That’s not to say that these functions are not useful – they very much are – it’s just that their execution often lacks a little elegance and refinement.

Order Entry on TWS

The mechanism for entering and placing orders is – in addition to the general ease of use, reliability, and indicators – perhaps the most important part of a trading platform. For TWS, this has been handled with a high degree of functionality and flexibility, which makes it possible for users to adopt a large number of trading styles. Orders, whether active or pending, are displayed in a number of locations across your layout, which is a useful feature allowing you to easily and quickly cross-reference your outstanding orders at a glance. Depending on how you have set up your layout, you will be able to see orders very easily in at least three locations: in the Activity window, as a tab; in your Monitor window, under your portfolio overview; and at the bottom of your chart in a collapsible window that you can access as needed. This window, called a ChartTrader, is a pretty useful way of quickly accessing information about the positions you have open on that particular currency pair, and also, it is rather neat that it can be retracted or recalled so easily.

Hot-buttons are available for entering a number of order types and you can access them through a couple of locations also: through your dedicated Orders window, if you have that added to your layout, or you can bring up the Orders tab through the View drop-down menu. These hotkeys can be almost endlessly modified in terms of the functions they perform, something day traders will find very useful. How they are programmed, however, is rather laborious and you will have to employ something akin to a trial and error approach to making sure they actually perform as you need them to. For those of us not engaged in day trading, one useful thing here is that you can hide the hot-buttons if you prefer not to use them. Another thing to watch out for is that orders generated through the hot-buttons do not immediately appear in your usual orders window – though they do appear in the orders tab of the ChartTrader. All the same, using hot-buttons is a little dangerous and if it makes you nervous, it is better simply to hide them through the View tab.

You can also set up orders through the primary window for the currency pair you’re looking at at the moment. This is most people’s go-to location for setting up an order because this is where all of the information and options are most clearly displayed. That this is the one location where all of the various types of orders are clearly shown and easily accessible is perhaps a slight drawback but then, there does have to be one primary location for setting up orders and it just so happens that this is it.

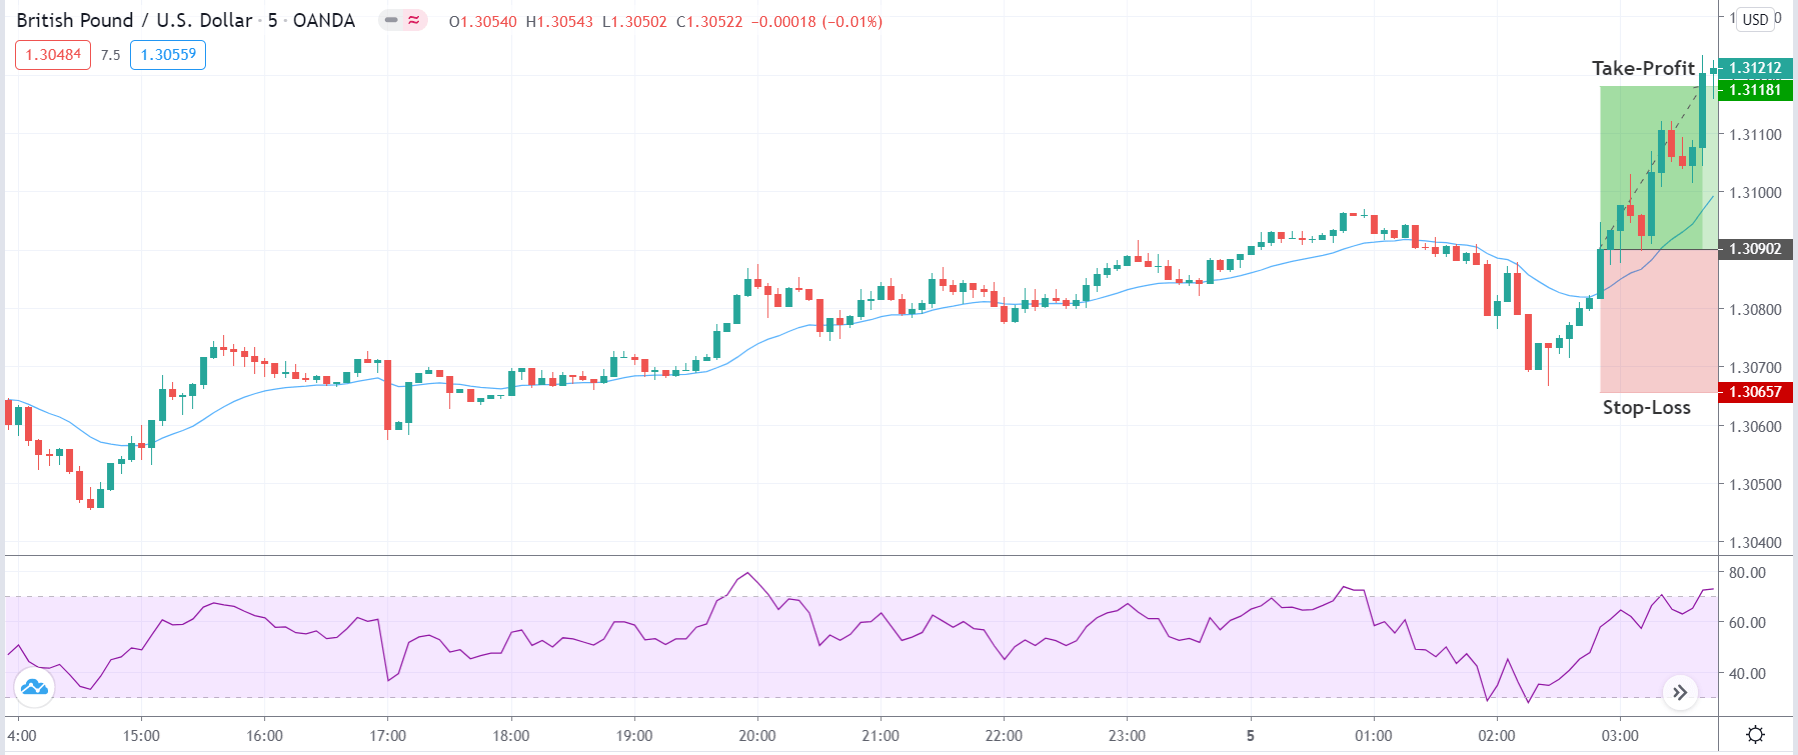
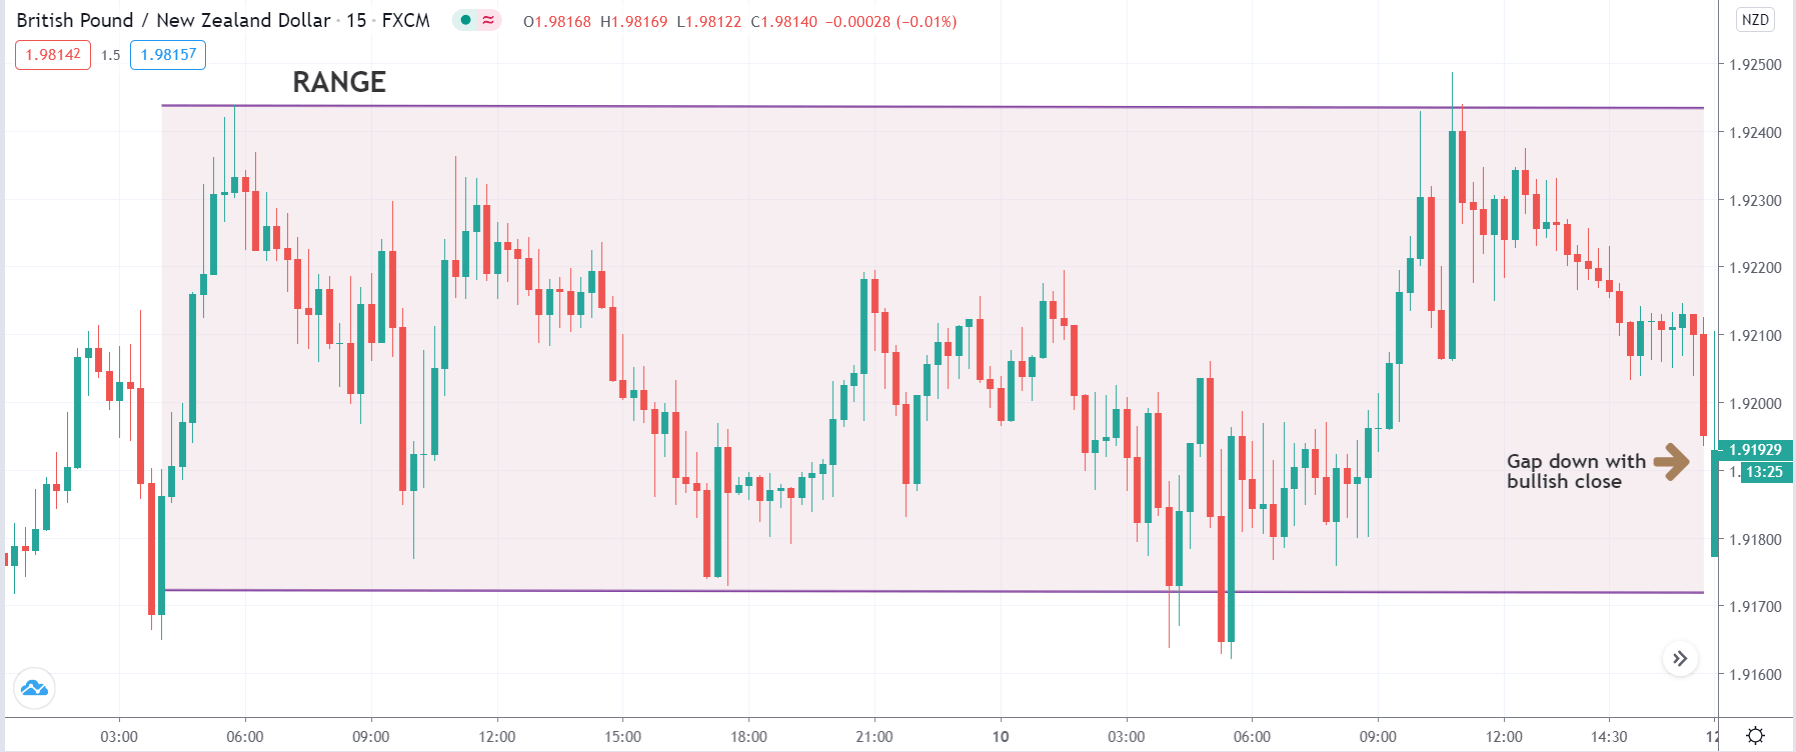
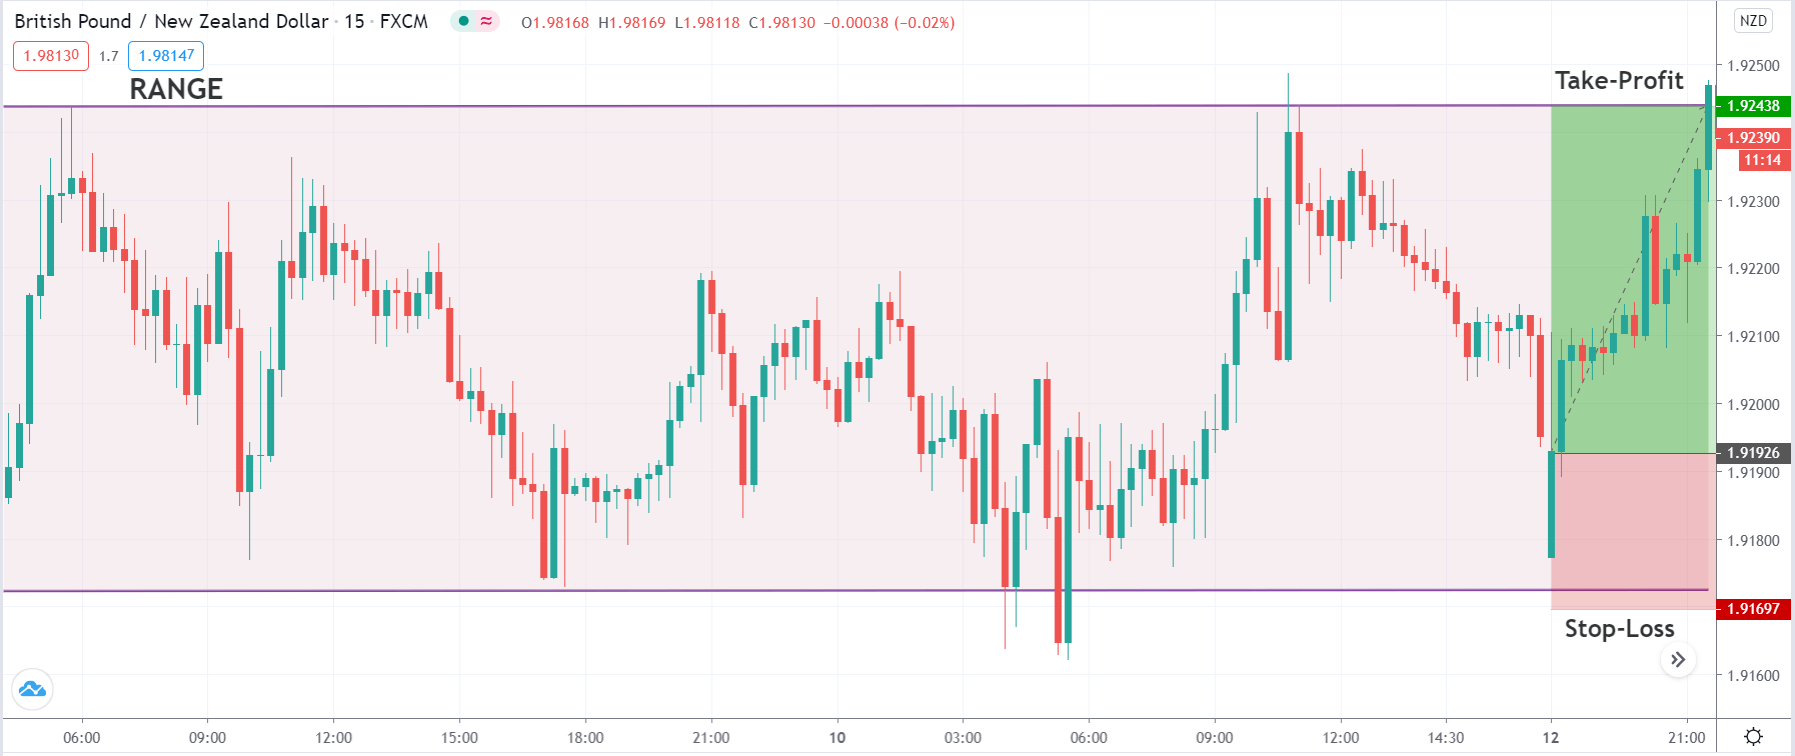
The layout for showing you where your order is, what parameters you’ve entered, including things like your take profit and stop/loss, is very clear and easy to follow. Moreover, the way it displays the order on your chart is also very helpful and clear – with the added bonus of some of the line colours being customisable so you can change them to suit your needs. What you will initially need to be careful about is that some bracket orders will have their defaults pre-set at unwieldy amounts, which can distort your chart until you resize them to more appropriate levels. 

Additionally, you can also modify your order directly on your chart by left-clicking and dragging the order entry line up or down – which is, frankly, a bit of a double-edged sword since you probably carefully worked out where you want to enter the trade and don’t want to be dragging it up and down haphazardly. The good thing is that if you do drag your order out of place on the chart, whether deliberately or by mistake somehow, you will need to click additionally to update your order – which makes for a useful safety measure and also a prudent way of double-checking that you actually wanted to make that change.

Overall, the order entry functions are, for the most part, both easy-to-use and sufficiently flexible to suit a variety of traders but there are some functions that suffer from small amounts of clumsiness so we’ll take a closer look at those here.

Adding Protection to Orders: Useful Functions

A useful tool that the TWS provides is the ability to quickly and easily add additional protection to orders that have already been placed retroactively. Unlike a number of functions available through the platform, this is quite intuitive to use and will automatically register whether the position you have set up is long or short and will generate the appropriate close for this position. Entering the stop order is just a couple of clicks away and setting the price is as easy and flexible as you would expect.

You can also relatively easily set up trailing stops. You will have to enter them individually but there is an option for trailing stop orders in your Orders window which is pretty easy to use. Simply click on the Trail button, rather than a usual bracket order, and select the “One cancels another” option. There you will have a drop-down box that allows you to select “trail”, which will give you the option to enter a trailing stop to the number of pips that you want it to trail by (although, somewhat annoyingly, you have to enter these in the decimal notation – so, 0.0035, instead of 35 pips. Don’t worry at this point because, once you’re ready to go, you will get an Order Confirmation window where everything is clearly displayed, giving you the option to double-check that you entered the trailing stop properly. 

Trailing stops are a useful function for a wide array of trades so it is a little frustrating that you cannot add them retrospectively to an order that you’ve already placed. The only real way to do this would be to cancel your existing order (before it gets filled) and start again from scratch but this time adding in a trailing stop, instead of a static stop order that goes with the standard bracket order. It would have been so much more useful if the platform allowed you to convert an existing stop order into a trailing stop but, alas, this function was not made available. This just goes to show, it continues to be true that trading platform designers are almost never traders themselves and some of those things you might need on a relatively regular basis have yet to make their way into the design of platforms themselves.

Another irritant, when it comes to trading stops, is that the trailing stop order function does not automatically default to the currency you are trading, which means that every time you are setting up a trailing stop you also have to double-check that you are telling it to set up a trailing stop for the currency pair you are working on at the time. This also seems an unnecessary additional complication given that it could lead to mistakes and/or stressful moments if you slip up.

A good thing about the trailing stop orders is that, once you’ve set one up, you can change the pip amount that it trails by. That’s a neat and useful tool that lets you adapt to changing situations. 

Legging In

Using a legging in strategy – where you stagger your entry into a position in order to mitigate risk – is catered for relatively neatly by TWS. The platform designers have understood that some traders make use of this approach and have factored that in when crafting how orders are entered. Let’s say, for example, that you are legging in with two orders total on a trending price movement. The system allows you to link those two orders in a very useful way. Simply enter both bracket orders as you normally would, allocating half of your total position to each order, entering your stops and targets where you have determined they need to be. Once these orders are live, you can go ahead and open up your Orders tab in your ChartTrader or the Orders tab in your Activity window and in either of these two places you can link these orders by merging your stops.

As a default, the stops will be set at half of the total amount you are committing to this position but you can just click on them and change them to equal your full position. But, and here’s the really useful part of this, you don’t have to make these new stops live (simply don’t hit the update button) until your second order has been filled. That allows you to hold off and play the waiting game to see how the price movement develops. If it develops as you predicted, your second order will be filled and you can update the stops with one easy click so that your whole position is protected. If, on the other hand, the price movement turns sour and your second order is left hanging, the quantity on your stop order will remain at the default amount (half of what you planned to commit to this position) and will kick in if things continue to go against you. There isn’t anything particularly difficult about making sure both of your legging in orders are appropriately covered but you will want to run through this technique in your demo account a couple of times – especially if you are still getting to grips with the platform and where various functions are located. Still, it does leave some traders wondering why there isn’t a more obviously signposted “Link stops” function for multiple orders of the same currency pair.

Min Max Limits Warning

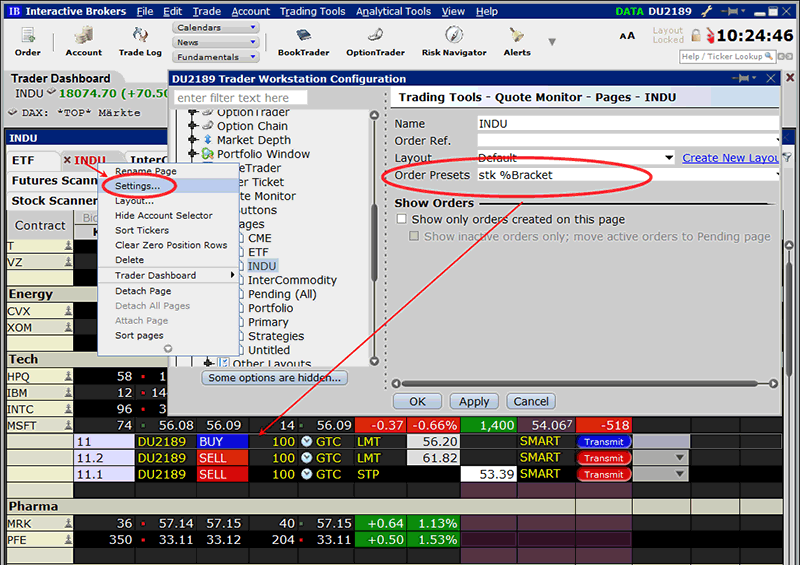
A perfect example of just how awkward and clumsy the platform can sometimes be is illustrated by the default minimum and maximum currency amounts. What happens is that a warning window will pop up when the trader hits send on an order they’ve set up. Now, this can be a little disconcerting – it would make any of us think twice about the size of the order we’re entering if a warning pops up telling us that the amount is too high. Of course, that’s not what’s going on here. What’s actually happening is that default limits exist within the platform and you need to get into the settings to either remove them completely or to adjust them to the point where the warning will no longer appear for the trades you engage in.

These defaults are set not only for currency amounts but also lot sizes. Now, if you want to change these maximums (and minimums), you need to click on the wrench icon (that’s the universal settings button across all of the windows on your layout). That will open up a very bewildering looking configuration window where you need to look for the Presets sub-menu – in there you need to find something “Precautionary Settings”. This is where you can adjust the defaults but if you think it’s that simple, you’ve got another thing coming. First, you need to make sure you’ve removed or adjusted these limits for all of the currencies you trade (more clicking, more sub-menus, more chasing the right setting you need) – so you have to muddle through this for every currency. But, the platform won’t even let you get away as easily as that. It will probably have saved your previous settings in a short-term memory cache, so you’ll need to click away from the currency you want to trade and onto any other currency, before clicking back and hoping that this will have cleared the cache. Even then, it might not have saved your new limits so if you want to be rid of those little warnings for good, you’ll either have to go back and do it all again or you can use the warning message itself to adjust each time it pops up.

This level of fiddling around is not exactly conducive to smooth trading and – until you’ve really become fully familiar with the platform and where everything is located – it can be time-consuming and incredibly frustrating to deal with these little snags. To be clear, that’s exactly what they are, snags. None of this is truly game-changing – these aren’t major problems with the platform or the man-machine interface – they’re just annoying little bumps along the road to you becoming fully proficient at using TWS proficiently.

Canceling Orders

One saving grace of how orders work in TWS is the sheer simplicity and user-friendliness of how you can cancel an order. There are several ways to see existing and active orders – in the Orders tab under your chart, in your Portfolio tab in the Monitor window, in the Orders tab of the Activity window, etc. The great thing here is that you can cancel an order in any of these locations because they’re all interlinked. This makes it easy to cancel an order in a hurry if you need to. Another thing that makes it easier to cancel an existing order in haste – again, if that’s what you need to do and, let’s face it, we’ve all been there – is the window that pops up to make confirm what you’re doing. The box will only pop up if you’re closing an existing bracket order so if you don’t see it, you need to double-check that you’re canceling the right order. Remember, canceling a bracket order will also cancel your stop/loss and take profit orders, which is exactly what you want it to do if you’re bugging out of a position you feel unsure about.

The last check you need to have in place when you are closing an order is to make sure you follow through and click submit. It’s easy enough to go through the process but to forget the submit button – particularly if you’re in a bit of a panic because you want to get out of the order as soon as possible. This additional safety measure is clearly there for a reason but make sure you’re aware of it so you don’t think you’ve canceled an order fully but still have it in place just because you forgot the last step. A mean platform reviewer might say that this is a problem with how the various steps are designed and, more importantly still, worded. This certainly could have been done better to make it clearer to users that they still have to go through an additional step because the pop-up window asking you to confirm that you’re closing an order definitely does make it seem like it’s the last step in making sure you get out. On the other hand, everyone who uses this platform will get the hang of this in no time at all so this isn’t exactly a major flaw to get too obsessed with.

At the end of the day, when you get out of an order you were unhappy with, a smart trader will go through a mini-debrief of what went wrong and this will definitely include rechecking your portfolio tab to make sure everything is back to normal, so to speak. So, if you are trading in a smart way, you will still be making sure that the order you canceled completed how you wanted it to and that you are back to the starting line.

A Few Closing Thoughts on Trader Workstation

Interactive Brokers are clearly concerned with producing a high-end trading platform dedicated to proficient and experienced traders who demand a great degree of flexibility and functionality. Indeed, given how many excellent and genuinely useful tools this platform provides and the customisability it offers a testament to how successful IB has been in achieving this. That being said, there are some areas where the platform can be said to have some room for improvement. Now, it is important to highlight the fact that none of these shortcomings come in terms of the actual utilisation of the platform for trading. The failings are mostly in terms of user-friendliness, visual design and the fiddly or frustrating process you have to go through to achieve what you are trying to do. 

With all of that in mind, here are our principle takeaways for the TWS platform:

  • IB has designed and created a staggeringly flexible, adaptable, and functional trading platform aimed at professional, experienced traders.
  • The ability of the platform to be tailored to the individual trader’s needs means it is suitable for the broadest possible range of trading styles.
  • The sheer number of order types and combinations available mean that traders are free to experiment and develop their approach to trading as their knowledge grows, without having the need to progress to a more complex platform.
  • The platform is not suitable for beginners and even experienced traders that encounter it for the first time will face a steep uphill learning curve getting to grips with the myriad of functions, options, parameters, and indicators available in various iterations of the layout. This is simply a function of how much ground TWS covers and 
  • Some of the minor glitches and inconsistencies highlighted in our report above are sure to cause frustration and often the only way of overcoming them is to adapt and learn where they might crop up. Over time users will internalise these little problems and long-term users probably hardly ever notice them but that doesn’t mean that they aren’t there and one can only hope that updates to the platform will eventually iron them out.

Overall, this is a platform that is a serious tool for serious traders, which is ultimately why it takes a serious effort to come to grips with it. 

Categories
Forex Market Analysis

Daily F.X. Analysis, September 02 – Top Trade Setups In Forex – Eyes on ADP Non-Farm Employment! 

On the news front, the eyes will be on the U.S. ADP Non-farm payroll figures, which may drive price action during the New York session today. Besides, the U.S. Crude Oil Inventories will remain in highlights as economists expect a slight draw in U.S. oil stocks that may drive buying in WTI crude oil.

Economic Events to Watch Today  


EUR/USD – Daily Analysis

The EUR/USD pair was closed at 1.19117 after placing a high of 1.20113 and a low of 1.19010. On Tuesday, the EUR/USD pair rose above 1.2000 level in earlier trading session but failed to keep the level and dropped in the late session to post losses. The gains in the first half of the day were associated with the broad-based U.S. dollar weakness; however, in the late session, the losses were associated with the dollar strength triggered by better than expected ISM Manufacturing PMI.

The upward momentum that took the pair above 1.200 level on Tuesday was derived from the broad-based U.S. dollar weakness followed by the new policy shift from Federal Reserve. The improved risk sentiment due to vaccine hopes also helped the pair reach its highest since May 2018. However, the gains were limited as the pair started to fell in the second half of the day.

The losses in the EUR/USD pair were also encouraged by the fading market risk sentiment due to increased coronavirus cases worldwide. On Wednesday, the number of cases reached 6 million in the U.S., while India reported the biggest single-day jump of 78,761 in coronavirus cases over the weekend, whereas the daily case count reached 8000 in Spain. Meanwhile, after the U.S., Brazil, and India, now Russia also became the fourth country to exceed 1 million cases of COVID-19.

Furthermore, to prevent the second wave of coronavirus, the Scottish government announced new restrictions on travelers from Greece to Scotland; quarantine restrictions will be imposed on people traveling from Greece to Scotland due to emerging coronavirus cases. These tensions weighed on market risk sentiment and added in the further losses of EUR/USD on Tuesday.

Daily Technical Levels

Support Pivot Resistance
1.1870 1.1941 1.1981
1.1829 1.2053
1.1758 1.2093

EUR/USD– Trading Tip

The EUR/USD pair fell to trade at 1.1901 level, having immediate support at 1.1891 level, which is extended by double bottom level. Violation of 1.1891 level may extend selling until 1.1845 support. On the higher side, the resistance stays at 1.1935 and 1.1978 level for EUR/USD. Price action will highly depend upon the U.S. Advance NFP figures today.


GBP/USD – Daily Analysis

The GBP/USD pair was closed at 1.33830 after placing a high of 1.34820 and a low of 1.33561. Overall the movement of GBP/USD remained flat yet bullish throughout the day. In the first half of the day, the pair rose and extended its gains to reach its highest since December 2019, near 1.3500 level on the back of selling bias surrounding the U.S. dollar. However, most of its early gains were lost in the second half of the day after the release of ISM Manufacturing PMI data on Tuesday.

In the early trading session, the equity markets moved in a higher direction after releasing China’s manufacturing PMI data from Caixin that showed an expansion in the industry by 53.1 against the estimated 52.6. It showed that the world’s second-largest economy was improving and raised the chances for quick economic recovery.

The improvement in China’s economy when the U.S. is suffering against the coronavirus pandemic increased the risk sentiment and weighed on the U.S. dollar that pushed the risk-sensitive currency pair GBP/USD higher on board. However, USD and risk appetite’s selling bias did not remain in the market for long and started to fade in the late session as the macroeconomic data from both the U.K. & U.S. came in against GBP/USD pair on Tuesday.

At 13:30 GMT, the Final Manufacturing PMI from the U.K. in August dropped to 55.2 from the forecasted 55.3 and weighed on GBP. The M4 Money Supply in July from Britain also dropped to 0.9% from the expected 1.2% and weighed on the Sterling. The Mortgage Approvals, however, rose to 66K against the estimated 55K and supported GBP. The Net Lending to Individuals remained flat with the expectations of 3.9B. Most data from Great Britain was against British Pound, and hence, the GBP/USD pair suffered and lost some of its gains on the day.

On the other hand, from the U.S. side, the highly awaited ISM Manufacturing PMI was released at 19:00 GMT, which exceeded the expectations of 54.6 and came in as 56.0 and supported the U.S. dollar. The strong U.S. dollar added weight on the GBP/USD pair that lost most of its daily gains but still ended its day with a slightly bullish trend.

Apart from macroeconomic data, the progress towards Brexit deal also drove the GBP/USD pair on Tuesday when PM Boris Johnson’s spokesman said that Britain wanted to agree simpler parts of the future relationship with the E.U. first to create momentum in the negotiations. While the E.U. has been insisting on reaching a consensus on difficult areas in talks such as E.U. state aid before any other negotiation area, even legal texts.

However, the next round of talks is scheduled for next week, but before that, another meeting was scheduled for Tuesday ahead of formal negotiation resumption next Monday. Michel Barnier went to London for informal talks with his U.K. counterpart, David Frost, as the transition period is near to end. It is yet to see how the informal talks went between both parties and discussed in the next round of formal meetings. Traders are cautiously waiting for some direction towards Brexit-deal.

 Daily Technical Levels

Support Pivot Resistance
105.6400 105.9000 106.2100
105.3300 106.4700
105.0700 106.7800

 GBP/USD– Trading Tip

The GBP/USD pair is trading bearish at 1.3358 level, set to test the support level of 1.3358 level. The Cable has already violated an upward trendline at 1.3375 level, which is already violated. On the lower side, the GBP/USD pair may drop further below 1.3358 until the 1.3263 level. The MACD is also supporting selling bias; therefore, we will be looking for selling trades below the 1.3355 level. Lets brace for ADP NFP figures for better price action. 


USD/JPY – Daily Analysis

The USD/JPY pair was closed at 105.955 after placing a high of 106.150 and a low of 105.589. The USD/JPY pair moved sideways on Tuesday but ended its day with posting gains as the selling pressure against the U.S. dollar was faded away after the release of ISM Manufacturing data and some fresh comments from Fed Governor. 

However, the fading risk sentiment kept the gains in the USD/JPY pair checked after the coronavirus cases started to rise globally. The worldwide toll of cases reached 25 million with the United States on top with 6 million cases on Wednesday. India reported its biggest single-day surge in coronavirus cases of 78,761 on the weekend, while Spain reported a daily toll of more than 8000. After the U.S., Brazil, and India, now Russia has also entered the country with more than 1 million coronavirus cases. Besides, the Scottish government announced restrictions on people traveling from Greece to Scotland due to developing coronavirus cases.

The increasing number of COVID-19 cases decreased the risk appetite and helped safe-haven Japanese Yen to gain traction that weighed on the USD/JPY pair and limit the additional gains in the USD/JPY pair on Tuesday. Moreover, the renewed US-China tensions after Beijing’s new law to impose restrictions on tech export. China forced a ban on the export of tech companies that will require government approval, which will take 30 days approx. The move came in against the order of Donald Trump in which he gave 90 days to the TikTok app for sale or transfer of its rights to the U.S. The tensions also supported the Japanese Yen and capped further upside in the USD/JPY pair on Tuesday.

Daily Technical Levels

Support Pivot Resistance
1.3330 1.3407 1.3459
1.3279 1.3535
1.3202 1.3587

USD/JPY – Trading Tips

The USD/JPY currency pair is trading at 106.077with an immediate resistance level of 106.085 level. Bullish crossover of 106.085 level may drive further buying until the next resistance level of 106.570. On the lower side, the USD/JPY pair may find support at 105.800 and 105.500 levels. Let’s consider buying over 106.100 level as the MACD and RSI also suggest the same. Good luck! 

Categories
Beginners Forex Education Forex Basics

How to Cope with Forex Losses

Forex trading is inherently risky. It is known for churning out billionaires while others are left with less than they started with. Watching our hard-earned money disappear is difficult, and the aftermath can leave us in an emotional state where we don’t always make the best decisions. However, letting yourself fall victim to these emotions every time you lose will put you in a position where you are more likely to make mistakes. Traders must learn to deal with losses in a positive way to avoid falling victim to common trading problems based on a negative mindset. 

First, you need to know that even experts can’t be right 100% of the time. The best traders have a lighthearted, “oh well” attitude about losses and can find the humor in them. Yes, losing money is tough, but it isn’t the end of the world. Every winning streak has to end at some point. As long as you’re making more than you’re losing, then you’re on the right track and if you aren’t, then it only means you need to work on your strategy. 

When you lose money, you should start by analyzing what happened. Did you make a solid decision based on your trading strategy, only for the market to make an unexpected move? If so, know that this is an unavoidable part of trading. On the other hand, if you made a move that wasn’t thought out or based on nothing and lost, you should take responsibility for the mistake. Learn from your mistakes and move forward, rather than becoming fixated on what you lost. 

If you don’t learn to let go of your losses, then you’re bound to fall victim to other trading problems, like revenge trading. Many traders want revenge on the market for taking their money, so they begin to make highly leveraged trades that aren’t based on anything in order to frantically win their money back. Others fall into different patterns. For example, experiencing a large loss might leave you feeling anxious or afraid, which could cause you to avoid entering trades when you normally would or to pull out of trades before you hit your stop loss. 

Once you learn to cope with losses in a healthy way, you will find that trading doesn’t have to be so stressful and you’ll be able to improve your results. Here are some helpful tips related to losing money trading forex:

  • Analyze your losses: was it caused by a dumb mistake, or was it unavoidable? 
  • Learn from your losses and move on. There’s nothing you can do to change what happened, but you’ll know what not to do next time if the problem could have been avoided.
  • If you find yourself losing often, consider keeping a trading journal. This can help you to narrow down the problem.
  • Practice relaxation techniques if you’re becoming overwhelmed. If this doesn’t work, know when to take a break so that your emotions don’t interfere with your trades. 
  • If you’ve taken several losses in a row, this would be another good time to take a break so that you can come back to trading with a better outlook. 

Everyone hates losing money, but it is an unavoidable part of forex trading. Even the richest traders in the world have lost before, but they achieved greatness because they kept going and didn’t give up. The best thing you can do is learn to manage your emotions and learn from your mistakes so that small losses don’t turn into big problems for you down the road. Once you learn to cope with your losses in a healthy way, you’ll be a better forex trader


Categories
Forex Psychology

How to Avoid Analysis Paralysis

Analysis paralysis is a common anxiety experienced by many forex traders. Traders need to act quickly, but those suffering from this condition tend to over-analyze data, which can result in missed opportunities. In some cases, traders don’t even manage to enter trades because they are too overwhelmed by data and put off the decision for far too long. Having too many indicators on your chart contributes to this problem because they can give off too many signals, which results in a ton of information. Traders then prolong their decision because of the overwhelming amount of information and uncertainty about which signals should be trusted. At this point, the trader either spends too much time analyzing that data, to the point that they enter the trade past a favorable point, or they don’t enter a position at all because it is so late. This problem leads many traders to give up on Forex trading for good. 

If you’re suffering from this problem and looking to overcome it, we can help. First, you’ll need to understand that this problem is likely to be caused by information overload and can affect anyone. We always want to make the best decision and the thought of having more choices seems appealing since more choices should mean better decisions. This isn’t exactly the case, however. Limiting the number of indicators one uses can make it easier to analyze the data and make a quicker decision. Think quantity over quality here. Some professionals even recommend naked trading at first, which means trading without indicators. 

Another thing to remember is that every trading decision shouldn’t (or can’t) be perfect. If you spend too much time looking at data and never make a trade, then you won’t ever make a profit. Try giving yourself a time limit to help yourself make a faster decision. Also, remember that not deciding is a decision itself. If you don’t enter the position, you’ve chosen not to make a trade. This might indicate that you aren’t confident enough in the position you were about to enter. Perhaps this is a sign that you need to do more research or tweak your trading plan so that you will feel more reassured. 

Having a trading plan will help you to see your goals and what you need to be looking for more quickly. It can also help you to filter out which indicators you actually need to de-clutter your charts. Knowing what you’re looking for will help you avoid falling victim to the dreaded analysis paralysis that affects so many traders. A simpler plan can also help with this, as having fewer components to analyze will lead to faster decisions. 

Analysis paralysis has involvement with trading psychology. Emotions affect the way that we make trading decisions, and analysis paralysis certainly branches from anxiety. This is a real problem that stops traders from making decisions in time, or altogether. However, we have hopefully outlined some helpful points that can help traders to overcome this problem. You’ll need to come up with a good, simplified trading plan that you’re confident in first. Then, try to limit the number of indicators you’re using on your charts so that you don’t have as much information to analyze. Remember that trading is risky and decisions can’t be perfect. Educating yourself and following these steps will set you up with the best chance of success and should help avoid the anxiety associated with analysis paralysis.

Categories
Forex Basics

Are These Issues Causing You to Fall Short of Your Goals?

As a forex trader, you should always be working on self-improvement to make a better impact on your trading decisions. Making an effort to address problems like allowing negative emotions to interfere with your choices or not spending enough time researching trading topics you could learn more about are a couple of examples of things that can impact your trades. If you find that you aren’t meeting your trading goals, ask yourself these questions:

Are You Setting Realistic Goals?

When setting trading goals, many beginners start out with one thing in mind – making money. The truth if this is your only goal, you aren’t doing yourself any favors. It’s also a bad idea to set goals that focus on making exact figures, as it’s nearly impossible to predict that you will make a certain amount of money in x amount of time. It’s ok to have long-term goals, as long as you understand that it will take time to reach them. However, even your long-term goals need to be obtainable. If your goal is to make a million dollars and you’ve only invested $100, you aren’t setting a realistic goal. In the meantime, you should set short-term goals that are possible to reach. Here are a couple of examples of good short-term trading goals:

  • To spend x amount of time each day researching different trading topics
  • To actively log each trade in a trading journal and to review those results after a certain period of time, like a week or a month
  • To invest x amount of money into your trading account each time you get paid, even if it is only $5 or $10. 
  • To finish reading a book that was written by a successful forex trader

As you can see, the above goals can be reached fairly easily, but it will take some effort to get there. The reward centers in your brain will thank you when you complete one of these goals, which is better than feeling stressed out because your only goals are long-term and out of reach. 

Do You Have a Plan to Actively Meet Your Goals?

Sure, you might want to make money, but how do you plan to get there? You’ll need an active trading plan, which covers the following topics and more:

  • How you will find and execute trades
  • How large of a position you will take (i.e. your risk-tolerance)
  • What assets you will and won’t trade

Your trading plan basically covers what and when you trade, including decisions that involve entering and exiting trades. From there, you’ll also want to think about a trading strategy. A strategy is different from a plan because it outlines what type of trader you are. For example:

  • Day traders typically open a few positions each day and close them before the end of the trading day
  • Swing traders might open one large position or a couple of medium ones and leave them to accumulate for days or weeks
  • Scalpers open several positions a day (sometimes even 100 or more) and attempt to profit off very small price movements

The strategy you choose can offer benefits and drawbacks. For example, a scalper only makes a small profit off each trade, so one big loss can wipe out their earnings for that day. A swing trader is subject to swap fees, which are charged by brokers for leaving positions open overnight. Day traders don’t have to worry about these fees, but each person might not have the time or patience to take up day trading. 

The point is that you need to have a good trading plan and strategy set up to reach your goals. You won’t be able to make money without putting thought into the how’s and why’s of the way you trade. If you’ve been trading without a real plan, now’s the time to figure it out. If you already have one and aren’t meeting your goals, perhaps it’s time to look at your plan as a whole and to see if any changes need to be made.

Are You Tracking Your Progress?

We’re referring to a trading journal here. Some traders might start out using one, only to abandon it once they get a little more experience under their belt. Others might never use one at all. When you keep a trading journal, you log information about each trade you make, including your profits/losses, why you entered or exited when you did, any emotions you were feeling at the time, and so on. Later, you can go back and review that data to look for reoccurring issues that may need to be addressed. Sure, you might notice if you lose money, but without a trading journal, you may not be sure of your total profits or losses for a certain period of time. Once everything is in front of you, you might realize that something else is causing you to fall short of your goals. For example, maybe you exited several trades too early after losing money because you were feeling fearful after taking those losses. From a bird’s eye view, it’s easier to pinpoint where the real problems are coming from.

Categories
Beginners Forex Education Forex Basics

Six Seriously Damaging Misconceptions About Forex Trading

Have you ever seen a flashy video, ad, or website where forex trading is promoted by a billionaire? The luxurious lifestyle of a successful forex trader isn’t always as luxurious as it’s made out to be. This isn’t to say that trading can’t make you a great deal of money or help you become rich because it can. Unfortunately, however, there are some misconceptions out there that throw many beginners in the wrong direction. If you start with unrealistic expectations, you are likely to feel disappointed.

Thinking You’ll Get Rich Quick

The amount of money you make depends on many factors: your trading knowledge, strategy, how much money you invest, the leverage you use, your broker’s fees, how often you trade, and so on. You should know that it does take time for your money to add up, especially if you’re starting out with a smaller investment. Think about how many people would take up trading if it were that easy to get rich. The truth is that many people just don’t want to dedicate the time and don’t have the patience to stick with it in the beginning before profits become significant.

That You Can Start Immediately

Some people might see one of those flashy ads we mentioned and make an immediate decision to open a trading account. There’s nothing wrong with feeling inspired, however, you certainly aren’t prepared to trade from a whim. You need to invest time into educating yourself about trading first, no matter how eager you are to get started.

That it’s Better to Risk More

When one is gambling, they might make the decision to risk more because it can lead to a larger gain. Of course, you can also suffer a big loss. Forex trading and gambling are similar in this respect, but it’s better to risk less when you’re trading. Although you will base your trades on something, like fundamental or technical analysis, the market is still unpredictable. If you risk less, you might not earn as much, but you will also avoid wiping out your account. 

The More Leverage the Better

Different brokers offer different leverage caps. Some regulators restrict the cap to 1:30, while others offer much more flexible leverage options of 1:300 and higher, even up to 1:1000 or more. Since leverage increases your buying power, it’s a common misconception that more leverage is better. On the contrary, leverage can actually cause significant losses, especially for beginners that don’t have much experience. Stick with lower options unless you’re a seasoned trader that has a lot of money to gamble with.

That Trading is Fun

To be honest, trading can be quite boring. Many hours are spent in front of a screen waiting for a good move, and you may have days where you barely do anything at all. You might have a misconception about the life of a forex trader from movies that depict the fast-paced action on Wall Street, but this just isn’t the case for traders working from home. On the bright side, trading does offer some advantages, like the ability to work from anywhere with an internet connection. 

That you Need a Lot of Money to Get Started

Some might think that trading forex is not within their reach because they just don’t have a lot of money to invest. It’s true that the more you invest, the more you can make, but this doesn’t mean that you can’t get started with a small amount of money. Many brokers even offer special accounts that will allow you to get started with $5 or so. This misconception doesn’t end trading careers, it stops them before they start. Never be ashamed to invest in your future, even if your first investment is only a few dollars.

Categories
Forex Market Analysis

Daily F.X. Analysis, September 01 – Top Trade Setups In Forex – Dollar Weakens Amid NFP Forecast! 

On the news front, the eyes will be on the series of economic events like Manufacturing PMI data from Europe, the U.K., and the U.S. Economy. Overall, almost all of the events are expected to report neutral results. Therefore, any surprisingly bad or good data may drive some price action in the market today.

Economic Events to Watch Today  


EUR/USD – Daily Analysis

The EUR/USD closed at 1.19359 after placing a high of 1.19659 and a low of 1.18841. The EUR/USD pair continued its bullish trend for the second day and rose to its highest since August 18 on Monday amid broad-based U.S. dollar weakness. Every month, the currency pair EUR/USD rose for the 4th consecutive month in August. The improved risk sentiment followed the positive momentum in the EUR/USD pair in the market amid a rise in the U.S. stock futures.

 On Monday, the U.S. stock futures opened the day with modest gains as the market was on track to rack up their best August in more than 30 years. The upward momentum in stocks came after the S&P 500 and NASDAQ closed at an all-time high on Friday, with the former looking set to record its most robust August performance in 34 years.

The rally in the stock market was backed by the improved risk sentiment powered by massive monetary and fiscal stimulus in recent months that offset the concerns over the outlook of economic recovery from the coronavirus pandemic. Besides, the optimism around the vaccine development and treatments for COVID-19 and the robust demand for tech stocks also boosted the risk sentiment.

During the previous week, the Federal Reserve Chairman Jerome Powell shifted the policy to average inflation targeting that allowed inflation to surpass the 2% target. This shift raised concerns that interest rates were locked near-zero for as much as five years and weighed heavily on the U.S. dollar. The weak U.S. dollar helped EUR/USD to post gains on Monday.

Meanwhile, the German Prelim CPI in August dropped to -0.1% from the anticipated 0.0% and weighed on Euro on the data front. The Spanish Flash CPI fell in August to -0.5% from the July’s -0.6%. The Italian Prelim CPI in August came in line with the expectations of 0.3%. Most data from the European side came against Euro and limited the additional gains in EUR/USD pair on Monday.

While from the U.S. side, the Fed Vice Chair, Richard Clarida said on Monday that Federal Reserve would turn to discuss the next possible steps in the U.S. central bank’s fight against coronavirus induced economic fallout as a new policy framework has been set in place. The possible steps include linking interest rates directly with a return to full employment and possible expansion in monthly asset purchases to aid the economy through the COVID-19 crisis further.

Furthermore, the risk sentiment was also boosted by the news that the highly awaited Oxford vaccine will begin its phase-3 trials in the United States on Tuesday. This also helped EUR/USD pair to post gains on Monday.

Whereas, the World Health Organization pointed out encouraging signs that countries in Europe could deal with the coronavirus outbreak, despite the increase in cases since lockdown measures were lifted. According to a Senior Advisor to the Director-General at WHO, Bruce Aylward said that Europe has learned how to identify, isolate, and quarantine. It also helped raise the local currency Euro and added further in EUR/USD pair gains.

Daily Technical Levels

Support Pivot Resistance
1.1891 1.1929 1.1975
1.1846 1.2012
1.1808 1.2058

 EUR/USD– Trading Tip

The EUR/USD is trading sharply bullish amid the weaker dollar, leading EUR/USD pair towards 1.1993 level. The EUR/USD pair has violated the resistance level of 1.1960 level, which is now working as a support for Eur. On the upper side, the pair may find resistance at 1.2025 and 1.2065 levels today. The bullish bias remains dominant.


GBP/USD – Daily Analysis

The GBP/USD closed at 1.33651 after placing a high of 1.33956 and a low of 1.3309. Overall the movement of the GBP/USD pair remained bullish throughout the day. The GBP/USD pair extended its previous day’s bullish streak on Monday and posted gains for the third consecutive month on August amid broad-based U.S. dollar weakness and improved risk-on market sentiment.

The risk-sensitive British Pound gained on Monday due to many factors, including the dovish policy shift from the U.S. Federal Reserve, development in vaccine & treatments of COVID-19. At the same time, some lingering tensions in US-China kept the pair’s gains limited.

On Friday, the U.S. Federal Reserve shifted to a dovish policy that allowed inflation to pass over the 2% target, which means continued low-interest rates for almost five years. This weighed on the U.S. dollar and helped GBP/USD to post gains on Monday.

Meanwhile, the market sentiment was also powered by the positive headlines from the vaccine front as a possible virus vaccine made by Oxford has announced to start its phase-3 trials from Tuesday. Moreover, the US-listed Chinese tech companies were heading to Hong Kong exchange from New York Exchange amid increased US-China dispute. This weighed on market sentiment and kept a check on additional gains in GBP/USD pair.

Whereas, on the Brexit front, the U.K. Government has said that the European Union was making Brexit talks unnecessarily difficult after France accused the U.K. of deliberately stalling in negotiations.

In last week, U.K. and E.U. ended their latest round of negotiation with very little progress due to warnings of no-deal Brexit if issues did not settle within a few weeks. Only four months have left until the transition period ends, and both sides have failed to resolve their issues and are still stuck on various points, including fisheries and state aid policy.

Recently French Foreign Minister Jean-Yves Le Drian has blamed the U.K. for the deadlock and said that the failure in progress in talks was because of the United Kingdom’s intransigent and unrealistic attitude. Whereas, the U.K. has said that it has been clear from the outset about the U.K. approach’s principles. A spokeswoman said that the U.K. seeks a relationship that respects their sovereignty and has a free trade agreement the E.U. has with like-minded countries.

E.U. still insists not only that the U.K. must accept continuity with E.U. state aid and fisheries policy but also that the U.K. must agree before any further work can be done un any other area of negotiation. This also includes the legal texts that make in unnecessarily difficult to make progress. Next week, another round of talks will occur, and investors are looking forward to it for fresh clues.

 Daily Technical Levels

Support Pivot Resistance
1.3314 1.3355 1.3409
1.3260 1.3450
1.3219 1.3504

 GBP/USD– Trading Tip

The GBP/USD is trading with a neutral bias below an immediate resistance level of 1.3425 level. Closing of candles below 1.3420 level is likely to drive selling until the 38.2% Fibonacci support level of 1.3350 and 61.8% Fibonacci support level of 1.3305 level. The MACD has also crossed below 0, supporting selling bias in the GBP/USD pair. On the higher side, a bullish breakout of 1.3420 level can lead the Cable towards 1.3511 level. Let’s consider taking buying trades over 1.3350 level today.  


USD/JPY – Daily Analysis

The USD/JPY pair was closed at 105.901 after placing a high of 106.094 and a low of 105.208. The USD/JPY pair moved in an upward direction on Monday despite the broad-based U.S. dollar weakness. The pair, which posted a loss of more than100 pips on Friday amid the resignation of Japanese Prime Minister Shinzo Abe, recovered about half of the previous losses on Monday.

The risk-on market sentiment made it difficult for the safe-haven Japanese Yen to find demand on Monday and helped pair USD/JPY moved higher on board. The heightened optimism for an effective coronavirus treatment and the U.S. Food & Drug Administration’s decision to fast-track vaccine approval added in the risk-sentiment. Besides, the news that the Oxford vaccine will also start its phase-3 trials on the next day also powered the risk sentiment and weighed on JPY that pushed the USD/JPY pair even higher at the start of the week. 

However, with the lingering tensions between the U.S. & China, the US-listed Chinese tech companies were preferring the Hong Kong Exchange with Alibaba affiliate Ant Group, one of the most highly predicted initial public offerings ready for a dual listing in Shanghai and Hong Kong. This kept the additional gains in USD/JPY limited on Monday.

The U.S. dollar was under heavy selling pressure on Monday amid U.S. Dollar Index slumped to more than two years, the lowest level at 91.99.

The pressure surrounding the greenback was increased in the absence of any significant fundamentals on Monday, and the market kept following the strategy of a policy shift from the Federal Reserve on Friday.

Meanwhile, on Monday, Vice Chairman Richard Clarida explained that as Federal Reserve has shifted from its previous policy and has set a new policy framework, the central bank’s focus will now shift towards the next promises made by it to fight against the coronavirus induced economic slump.

Fed made promises to link interest rates to the direct return of full employment and increase the monthly assets purchases to boost the economy through the economic crisis followed by the coronavirus pandemic.

On the other hand, at 04:50 GMT, the Prelim Industrial Production in July increased to 8.0% from the expected 5.0% and supported the Japanese Yen. The Retail Sales for the year from Japan dropped to -2.8% from the forecasted -1.7% and weighed on the Japanese Yen that pushed the pair USD/JPY even higher on board.

At 10:00 GMT, the Consumer Confidence from Japan in August increased to 29.3 against the expected 28.7 and supported the Japanese Yen. At 10:02 GMT, the Housing Starts came in as -11.4% against the anticipated -12.0% and supported the Japanese Yen but failed to reverse the USD/JPY pair’s bullish movement.

Daily Technical Levels

Support Pivot Resistance
105.4200 105.7600 106.2300
104.9500 106.5700
104.6200 107.0300

USD/JPY – Trading Tips

The USD/JPY is trading within a sideways range of 105.866 to 105.200 range. The pair entered into the oversold zone previously, but now it has completed 23.6% Fibonacci retracement, and above this, the next target is likely to be found around 105.870. The MACD has crossed over 0 and has entered into the buying zone. Bullish bias seems dominant in the market today. Therefore, we may see USD/JPY prices soaring towards 38.2% Fibo levels of 105.870. Buying can be seen at over 105.200 level today. Good luck! 

Categories
Beginners Forex Education

Five More YouTube Channels that Forex Traders Should Follow

Previously, we listed some of the best YouTube channels that traders can follow based on content and popularity. Today, we’ll cover 5 more channels that you should follow on the popular platform if you’re looking to set yourself up for the best success in trading, whether you’re a beginner or a more experienced trader. Keep in mind that each channel provides different content and explains things in different ways, so there are several benefits to following multiple creators on the site. Note that the following channels are not provided in any specific order.  

#1: ForexSignalsTV was created by YouTuber Andrew Lockwood with 219K subscribers and more than 70 video uploads. This channel usually uploads about 2 to 7 videos per month, so you can expect to see videos added at a decent rate. Content covers some popular topics, like working from home, videos that are related to the current Coronavirus pandemic, interviews, checklists, and a whole host of other topics. While you might not see new videos being added daily or even weekly, there are enough videos available to binge-watch for some time. 

#2: Top Traders is a polished channel that has attracted close to 100K subscribers thanks to creator Kleveland Bishop’s educational videos. The videos uploaded to this channel are unique because many of them focus on actual trades that the creator or his friends have made, including the outcomes. Traders get more of a first-person view of trading through the series, which is highly useful. Another plus is that the channel uploads content revolving around strategies, the recession, brokers to choose, and other insightful topics. This channel definitely deserves more recognition in the forex community – but you can get ahead of the competition by subscribing. 

#3: Sasha Evdakov: Tradersfly has more than 150K subscribers and is named after its creator, who specializes in the opposite concepts day trading and swing trading. The purpose of the channel is to provide free educational videos that cover a lot of different information. Note that some of these videos can get a bit technical, so beginners may have trouble following along. However, Sasha is constantly adding helpful content to the site and covers a variety of interesting topics, making this channel worthy of checking out. 

#4: The YouTube channel named after Karen Foo offers inspirational videos with the main focus on trading psychology, along with other miscellaneous topics like stocks to buy, passive income ideas, and other money-making tips. Karen Foo doubles as an inspirational speaker, which adds to the overall feeling that traders can accomplish their goals. While this one isn’t as popular, more than 89K people have already started following the channel, which uploads multiple videos every single month. 

#5: TraderNick is last but not least on our list of top YouTube channels that traders should follow. Creator Nick has an educated background as a full-time forex trader and entrepreneur, along with a background in computer science and the know-how when it comes to building trading tools. The videos on this channel cover specific currency pairs and provide a guide on how to trade them, includes interviews where traders discuss how they got into trading and provide tips, and can really provide beginners with a leg up on the competition. The channel currently has more than 119K subscribers and has surpassed the Karen Foo and Top Trader YouTube channels, even though it used to lag behind them in popularity. We highly suggest taking the time to watch some of these videos, just know that you’ll probably get hooked!

Categories
Beginners Forex Education Forex Basics

Six Key Steps for Beginning Forex Traders

If you’re considering forex trading as a potential way to add to your income, you aren’t alone. More and more people have been opening up trading accounts lately and for good reason. A trading account is a great way to add to your savings, help you through retirement, or simply add money to your pocket. As the nation is currently more than 5 months into the Coronavirus pandemic, there’s no better time than now to think about trading as a potential part-time or full-time career. 

While trading can be profitable, there are some things you’ll need to know before you get started. There’s a lot of information out there, so getting started can seem daunting and the process might even dissuade some potential traders from ever starting their career. If you want to become a successful forex trader, take a look at our 7 key steps below for an easy-to-follow guide on how to get started.

Step #1: Get Educated!

You should start your forex career by learning about trading, which can be done by reading articles, watching videos and webinars, or attending seminars, taking an online course, and taking advantage of other free educational resources that can be found online. The sheer amount of information out there might seem a little overwhelming, but you can simply start with the basics by searching “beginner forex resources” or “how to trade forex”. From there, you’ll be ready to move on to more technical subject matter like risk-management, trading strategies, mechanics of using a trading platform, and so on. Also, be sure to do some research on trading psychology and try reading tips and advice from a few established traders that inspire you. 

Some might want to jump in headfirst by opening a trading account and learning at the same time, however, this isn’t the way to go about it. If you open a trading account too soon, you might choose the wrong broker, and you’ll be more likely to want to start trading before you’re ready. Another downside to opening an account too early is that some brokers charge inactivity fees. This means that you would be charged because you opened the account and deposited money but didn’t make a trade within a certain timeframe. Overall, it’s much better to ensure that you are prepared to start trading before you open your account.

Step #2: Test Your Knowledge

Once you feel that you’ve learned enough, you still may be eager to open your trading account. It’s great to be excited about trading, but you should really test your knowledge first. There are two good ways to do this, one of which being quizzes and the second being demo accounts. Quizzes can help you gauge your knowledge before you make that first investment. If you notice that you don’t understand a lot of the terminology and you’re failing the quizzes you take, then you probably need to spend more time learning. Try writing down any questions you get wrong or anything you don’t understand for guidance when you go back to researching. Demo accounts offer a more hands-on approach and can be opened for free through most forex brokers. These accounts simulate a live environment by giving you a virtual account balance so that you can practice trading. This is a good way to see if you’re ready for trading and can help you learn to navigate a trading platform. You can also test out your strategy to see how it performs before risking real money. Once you get good results, you’ll be ready to move on to step 3. 

Step #3: Choose a Broker and Open a Trading Account

Choosing a broker is a big decision and deserves careful consideration. If you make a bad choice, you could wind up paying way too much in fees, be forced to deal with lackluster customer service, have issues withdrawing your own money, and the list goes on. Fortunately, there are a lot of trustworthy brokers out there that won’t charge you an arm and a leg or try to take advantage of you. Remember that your broker’s fees will eat into your profits, so it’s important to compare your options and read reviews about any potential choices.

Once you’ve found a suitable broker, you’ll be ready to open a trading account. This doesn’t take much effort; you’ll simply need to register an account and make a deposit. The amount of your initial deposit will depend on the broker and account type you’ve chosen. You’re also likely to be asked for a POI (proof of identity) document, like a driver’s license, and a POA (proof of address) document, like a bill in your name that displays your address. Providing these shouldn’t be difficult, as you can usually take a photo of the document on your phone and upload them that way. If you have issues finding these documents, your broker’s customer service team will likely help you to find a solution. 

Step #4: Create a Trading Plan

Your trading plan has to do with the way you trade. The reasons why you will enter and exit trades, the time of day you’ll trade, your goals, how much you’re willing to risk, etc. are some examples of the topics that your plan should cover. Starting with a good plan is crucial for success because it helps you to outline the things that will define what type of trader you are. 

You’ll also want to come up with a trading strategy, which is different from your trading plan. Scalping is an example of a strategy. Scalpers open and close many trades per day, essentially aiming to target small price changes in the market. Day trading involves making multiple trades per day and closing those trades before the end of the trading day, while swing traders leave their positions open for multiple days or even weeks at a time. Each strategy offers unique benefits and disadvantages, so be sure to choose one that works the best for you. 

Step #5: Start Trading

As you begin trading, you should try to remember everything you’ve learned and be sure to look up anything you might be struggling with. Don’t give up if you get off to a bad start – simply take a look at what’s going wrong so that you can fix the problem. As long as you’re making money, you have something to be proud of, as many traders lose some money in the beginning. Know that you’ll have better success and make more profits as you spend more time trading. All of your hard work and dedication will pay off in the long run. 

Step #6: Analyze Your Performance

You might think that the last step is completed once you start trading, but this isn’t the case. After you have some trading activity, it’s time to look at your performance and your profit/loss ratio. Have you made money or lost it? The best way to keep track of this is to keep a trading journal, which details each trade you made. You would list the reasons why you entered and exited the trade, how much you made or lost on the trade, and so on when listing journal entries. Then, you can go back and figure out what’s going right or wrong, what you need to change, and what needs to stay the same. A trading journal can really help to see the bigger picture so that you can perfect your trading strategy over time and make as much profit as possible without losing money.

Categories
Beginners Forex Education Forex Basics

Answers to the Most Googled Forex Trading Questions

If you’ve ever used Google to seek out answers to your Forex trading questions, you’re certainly not alone. Here, you’ll find some of the most frequently asked questions that traders put to Google, as well as the answers.

Question #1: What is Forex Trading?

Traders buy and sell currencies through the foreign exchange market. Currency rates are predetermined by a variety of factors, such as political stability, government debt, news releases, and other driving factors behind that country’s economy. Traders try to capitalize off these prices essentially by selling one currency to purchase another.

Question #2: Is Forex Trading Profitable?

The answer to this question is yes, although it is subjective. Someone that makes a larger deposit is likely to make much more money and having an education and understanding of trading also helps one to make profits. In some cases, traders can lose money as well, so be sure that you’re ready before you start.

Question #3: How to Trade Forex

Once you’ve educated yourself about forex trading, you’ll need to choose a broker and make your first deposit. There are a lot of resources online that will teach you the mechanics of using a trading platform (especially the popular MT4/MT5 options). Ensure that you are familiar with the things that affect prices and other trading knowledge first. 

Question #4: What Do you Need to Trade Forex?

The good news is that it doesn’t take much to get started and essentially everyone can become a forex trader if they apply themselves. You need a device like a phone, laptop, tablet, etc., a working internet connection, a trading account, and a starting deposit of at least $5-$100. 

Question #5: Which Broker Should I Use?

There are thousands of forex brokers out there, which makes choosing the right one so much more difficult. The truth is that every trader has different needs, so what’s best for one trader may not be the right fit for another. The best thing you can do is figure out how much you want to deposit and then to compare account options with multiple brokers. Check for regulation status and read user reviews online, along with checking terms & conditions to find the broker with the best offer.

Question #6: Will Forex Trading Make me Rich?

It could. This depends once again on several factors. A well-educated trader with a solid trading strategy and plan is likely to be successful, while someone that jumps in without much knowledge isn’t likely to make it far. This isn’t something that will make you rich overnight, it does take a lot of hard work and patience to get there. You also have to invest money to make money, so don’t think of forex trading as a magic answer.

Question #7: Can you Make a Living Trading Forex?

Many people have managed to quit their jobs to become full-time day traders and the switch comes with some benefits like working from home and being your own boss. Everyone needs a different level of income to survive, so the first thing to do is to figure out how much you would have to make enough money. If you’re just beginning, it isn’t a good idea to quit your job yet, however, you should give it some time to see how well you do. You also might need to make a significant investment in order to turn enough profits.

Question #8: How Much Should I Invest?

This depends on how much money you’re trying to make and how comfortable you are with trading. You might not want to start out with a $5,000 investment just because you can. There are a lot of different minimum deposit requirements out there, some starting at just $5 and some brokers don’t require a minimum at all. You could start small and test the waters or come in with a big investment if that’s what you’re comfortable with. 

Categories
Forex Psychology

5 Questions Every Forex Trader Should Ask Themselves

Each and every Forex trader needs to not only create a trading plan and select his or her strategies but also need to prepare a money management plan, select a broker, and more. Answer these self-assessment questions to ensure that you’re on the right track.

Question #1: How Much Do I Want to Risk?

The amount of money that you’re willing to risk when trading might vary from one trade to the next, however, many professionals keep their risk percentage to 1-2% of their account balance per trade. Some might suggest basing how much you risk by looking at how much money is actually involved, although this comes down to personal preference. Risking too much can lead to a blown account balance, so be sure to give this one a lot of thought.

Question #2: Did I Choose the Right Broker?

You’ll probably form an opinion of your broker soon after opening an account. Once you need to chat with customer service about possible issues or with questions, test out the broker’s chosen platform, get a look at their fees in real action, and gain insight into any difficult policies you will either feel satisfied with your choice or feeling as if you could do better. If you think you’ve chosen a bad broker, you might want to withdraw your funds and go with another option. Of course, this is something you’ll need to seriously think about.

Question #3: Am I Really Ready to Start Trading?

If you haven’t been trading for long or haven’t started, you should definitely ask yourself whether you’re really ready. If you’ve already opened a trading account, you know whether you’re making or losing money. If you’re only considering opening one, you might not be sure if you’re ready. A few good ways to test this before risking any real money would be taking forex trading quizzes that test your knowledge or gaining hands-on practice through a demo account.  

Question #4: What Are My Goals?

Sure, making money probably seems like the biggest goal for a forex trader, but you need to start with smaller, more defined goals. Remember that it isn’t all about getting rich. For example, a noteworthy goal would be to make more money than you lose, rather than to become rich. To grow as a trader and to bring in slightly more profits each month would be another good example. If you set goals like these, you’ll feel more accomplished as you meet them. 

Question #5: Do I Have a Plan?

A trading plan is one of the first things a trader should develop because they provide a general outline of goals, risk tolerance, and a host of other things that should be taken into consideration. If you started trading without a plan, don’t worry – it’s never too late to come up with one. Still, it’s important to put this plan together as soon as possible and to actually follow it while trading, rather than forgetting about it.

Categories
Forex Market Analysis

Daily F.X. Analysis, August 31 – Top Trade Setups In Forex – Trading Choppy Sessions!   

On the news side, the eyes will be on European Spanish and German CPI data, which are expected to report a mixed figure. Later the Italian Prelim CPI is expected to report slightly positive data that may support EUR. Let’s take a look at the trade setups.

Economic Events to Watch Today  


EUR/USD – Daily Analysis

The EUR/USD pair was closed at 1.19054 after placing a high of 1.19196 and a low of 1.18108. Overall the movement of the EUR/USD pair remained bullish throughout the day. After moving sidelines and under pressure for two days, EUR/USD pair surged on Friday and posted gains on the back of broad-based U.S. dollar weakness from the dovish comments from the highly awaited Jerome Powell’s speech. However, the gains remain limited due to rising coronavirus cases and fears of the second wave in Europe.

The Government of Europe has re-imposed restrictions on citizens and renewed quarantine measures for some travelers. In response to these renewed restrictions, thousands of people took to the streets of Berlin against it. Police in Berlin arrested 300 demonstrators during the protests against Germany’s coronavirus restrictions.

On Friday, France made a larges jump since May 16 and reported 7462 new coronavirus cases. Germany reported around 1737 cases and three deaths. Italy reported 146 cases on Friday, the largest since April 1, and Spain announced 9779 cases on August 28. The resurgence of coronavirus in Europe came near when every European country was planning to start schooling from next week. Now, fears for a renewed spike in cases exacerbate as the schools’ time has come near. These lingering fears have kept the market sentiment under pressure and gains in EUR/USD limited on Friday.

Meanwhile, on the data front, at 11:00 GMT, the German GfK Consumer Climate in August declined to -1.8 from the projected 1.0 and weighed on single currency Euro. At 11:03 GMT, the German Import Prices for July rose to 0.3% from the expected 0.2% and supported Euro added in the currency pair’s gains.

At 11:45 GMT, the French Consumer Spending in July fell to 0.5% from the anticipated 1.2% and weighed on Euro. For August, the French Prelim CPI came in as -0.1% against the expected -0.2% and supported Euro and added in the gains of EUR/USD. The French Prelim GDP for the second quarter came in line with the expectations of -13.8%.

Daily Technical Levels

Support Pivot Resistance
1.1902 1.1904 1.1908
1.1898 1.1910
1.1895 1.1914

 EUR/USD– Trading Tip

The EUR/USD is trading slightly bullish at 1.1900 level, having an immediate resistance at 1.1918 level and support at 1.1896 level. On the higher side, a bullish breakout of the 1.1920 level can trigger buying until 1.1955 level. Conversely, a bearish breakout of 1.1896 level can drive selling until 1.1835 support. 

GBP/USD – Daily Analysis

The GBP/USD pair was closed at 1.33505 after placing a high of 1.33564 and a low of 1.31861. Overall the movement of GBP/USD pair remained bullish throughout the day. After moving sideways on Thursday, GBP/USD pair posted strong gains on the back of supportive comments from Governor of Bank of England at Jackson Hole Symposium and broad-based U.S. dollar weakness.

On Friday, the GovernorBank of England Governor said that the central bank was not out of power to support the economy. This statement was followed by the dramatic shock caused by the coronavirus pandemic.

In a speech to Jackson Hole symposium, Andrew Bailey told that the bank has more ammunition left to support the economy. He also said that the major bond-buying drives had been proved more effective in the major economic crisis caused by the pandemic.

He informed that the central bank appreciated the need to keep enough headroom to deal with future shocks. He said that the bank still has a range of fiscal tools, including the negative interest rates, and there was no need to tighten monetary policy.

In March, the Governor took over the bank and almost immediately oversaw a 300 billion pounds bond-buying program and a cut in interest rate to a record low of 0.1%. After these comments from the Governor of Bank of England, the GBP/USD pair surged to the highest level since December 15, 2019.

The gains in GBP/USD pair were also supported by the weakness in the U.S. dollar that was derived from the dovish comments from the Chairman of Federal Reserve Jerome Powell on Thursday. According to Powell, the inflation will remain at 2% average for some time that increased hopes for a entended period of loose monetary policy by the central bank and weighed on local currency.

The U.S. dollar weakness helped GBP/USD pair to post extra gains, and hence, the pair reached the highest of more than eight months. There was no macroeconomic release from the U.K. side on the data front, but from the U.S. side, at 17:30 GMT, the Core PCE Price Index fell to 0.3% in July from the anticipated 0.5% and weighed on U.S. dollar. The Personal Spending rose to 1.9% in July from the projected 1.5% and supported the U.S. dollar. At 18:05 GMT, the Chicago PMI came in line with the anticipations of 51.0 in August. At 19:00 GMT, the Revised UoM Consumer Sentiment rose to 74.1 from the projected 72.8 and supported the U.S. dollar.

 Daily Technical Levels

Support Pivot Resistance
105.3400 105.5700 105.7800
105.1300 106.0100
104.8900 106.2300

 GBP/USD– Trading Tip

The AUD/USD pair is trading with a neutral bias below an immediate resistance level of 1.3365 level. Closing of candles below 1.3365 level is likely to drive selling until 38.2% Fibonacci support level of 1.3280 and 61.8% Fibonacci support level of 1.3250 level. The MACD has also crossed below 0, supporting selling bias in the GBP/USD pair. Let’s consider taking selling trades below 1.3365 level today.  

USD/JPY – Daily Analysis

The USD/JPY pair was closed at 105.351 after placing a high of 106.945 and a low of 105.200. Overall the movement of the USD/JPY pair remained bearish throughout the day. The USD/JPY pair rose to near ten days the highest level on Friday near 107.00 level but failed to cross the resistance level and dropped on the back of broad-based U.S. dollar weakness and posted strong losses day. The pair posted the biggest daily decline on Friday and dropped to 105.2 level at the week’s ending day.

In the early trading session, the USD/JPY pair faced rejection near the 107.00 level and witnessed a dramatic turnaround on the latest news that Japan’s Prime Minister Shinzo Abe was stepping down due to ill health.

The 65-year-old Japan’s PM Shinzo Abe said that he did not want his illness to get in the decision-making way. He apologized to the Japanese people for failing to complete his term in office. He has had ulcerative colitis, inflammatory bowel disease, and he said that his condition had worsened recently.

Abe’s current period began in 2012, and last year he became Japan’s longest-serving prime minister. Until a successor is chosen, he will remain in his post and continue his duty. This political development gave strength to Japanese Yen that dragged the pair back closer to the 106 level on Friday.

Meanwhile, in later sessions, the pair was further dragged down due to the U.S. dollar’s broad-based weakness. The greenback was under pressure due to the dovish comments from the Fed Chair Jerome Powell at the Jackson Hole Symposium on the previous day.

On Thursday, Powell announced a significant policy shift and said that Fed was willing to run the inflation hotter than usual and support the labor market, also suggested keeping interest rates lower for longer. This also weighed on market sentiment and added further in the USD/JPY pair losses that dragged the pair towards 105.00 level.

On the data front, at 04:30 GMT, the Tokyo Core CPI for the year in August was declined to -0.3% from the anticipated 0.3% and weighed on Japanese Yen. From the U.S. side, at 17:30 GMT, the Core PCE Price Index was dropped to 0.3% from the anticipated 0.5% in July and weighed on the U.S. dollar and added in the losses of currency pair. The Personal Spending rose to 1.9% against the expected 1.5% in July and supported the U.S. dollar.

Daily Technical Levels

Support Pivot Resistance
1.3339 1.3349 1.3364
1.3325 1.3373
1.3315 1.3388

USD/JPY – Trading Tips

The USD/JPY is trading within a sideways range of 105.866 to 105.200 range. The pair entered into the oversold zone previously, but now it has completed 23.6% Fibonacci retracement, and above this, the next target is likely to be found around 105.870. The MACD has crossed over 0 and has entered into the buying zone. Bullish bias seems dominant in the market today. Therefore, we may see USD/JPY prices soaring towards 38.2% Fibo levels of 105.870. Buying can be seen at over 105.200 level today. Good luck! 

Categories
Forex Psychology

Is Forex Trading Addictive?

Trading addiction is a real problem, not unlike alcoholism or gambling addictions. Trading strongly stimulates the reward center in one’s brain and we become addicted to that rush. Trading can cause us to feel a rollercoaster of emotions, including euphoric highs when we win big. Those with a serious problem become addicted to the highs and lows and find themselves unable to stop. Unfortunately, trading addiction causes some of the same issues that drug addicts or alcoholics face because it can wreck relationships, cost one their job, and it usually leads to financial ruin. The good news is that there are ways to manage this so that trading can be practiced correctly and in a healthy manner.

Are you here because you think you might already be addicted to trading? One of the most common scenarios involves a beginner winning big because they get lucky, then they lose everything and try to win it back. The amateur trader then continues to lose more and more as they try to dig themselves out of the hole they have created, rather than knowing when to walk away. Someone that is addicted goes through financial resources that aren’t meant for trading. By that, we mean that anything you invest in trading should be disposable income. If you’re using grocery or bill money to trade with, it isn’t a good sign. 

Borrowing money from others, taking out loans, and selling personal items are other signs that one might be addicted to the rush of trading. People don’t always recognize trading addiction or realize how much it can affect them or their loved ones because it isn’t talked about as often as drug, alcohol, or gambling addictions. Once someone realizes that they have an addiction to trading, they might try to pull themselves out of it on their own. This can lead to disaster.

The best thing to do is to explain your problem to your friends and family so that they can understand how the addiction is affecting you. Those that don’t trade themselves might understand the way you’re feeling and why you’re spending all of your money once you explain this to them face to face. Seeking professional help is your best bet to solving the problem as a professional can help you recognize and overcome the problem.

Professional traders must have self-discipline and they need to be able to sit out when the market isn’t right for trading. Addicted traders need to feel the rush of trading and are more likely to make impulsive decisions, trade at bad times, and wipe out their trading accounts. Once a trader becomes addicted, they need to seek help to keep the problem from affecting their everyday life. This doesn’t mean that you have to give up trading for good, but a professional can help you manage your problem.

For example, you could set aside a certain amount of disposable income for trading from your weekly paycheck and never invest more than that at a time. Or you could mark out certain days of the week where you promise your significant other (or just yourself) that you won’t trade. If you run out of your weekly trading allowance or feel bored on a day where you aren’t supposed to trade, you could read articles and do research to improve your trading education. Or you could trade on a demo account to improve your skills. 

Finding healthy alternatives versus investing money and trading constantly will help you to be more in control of your actions. Taking all of these steps can certainly help one to overcome the problems that result from trading addiction.

Categories
Beginners Forex Education Forex Basics

The Importance of Keeping a Trading Journal

A trading journal is essentially a log of all of one’s trading activity, which is used by traders of all different skill levels to help improve their trading strategy. While beginners might benefit the most from journaling, we can always get better, therefore more advanced traders need to consider journaling as well. When you have all the data in front of you, it will be easier to note whether things are going right or wrong. 

First and foremost, you’ll need a good trading plan and system. Your trading journal comes in after you’ve accomplished some trading activity so that you can review and improve your trading plan. However, you need to track important information in your journal for it to work. If you don’t log some of the most important details about your trades, then you might miss crucial information when you go back to analyze that data. This is what most traders log in their journals:

  • Why did you decide to enter the market with a trade?
  • What time did you enter the trade?
  • What (precise) price was it when you entered the market? Enter this to the last exact pip. 
  • How long was the position open?
  • Why did you exit the trade?
  • How much did you win or lose?

Be honest when logging details about why you entered or exited a trade. If you got caught up talking, cooking, or doing something else and you simply forgot, write that down. If your emotions played a role in your decision, you’ll also want to note that. Were you feeling the excitement? Did anxiety cause you to close the trade before you initially intended to? Be sure to include information about the market that affected those decisions as well, rather than only focusing on your personal feelings. Otherwise, you might blame bad trades on yourself when it was really caused by the market’s behavior. Always be honest when logging information, even if it makes you look bad. Keep logging this information, even if you forget to use the journal sometimes. Don’t make the mistake of abandoning your journal once you improve in skill. 

Having a trading journal can be a key to success in the Forex market. If you log information in detail, the journal will become an excellent tool that can really help to hone your strategy over time. Remember to be honest with yourself and don’t forget to note the way that the market is behaving. Keep using your journal, even if you forget to log a trade or two because it will be helpful for long-term success. Your trading journal will prove to be one of the best, most customized tools in your trading arsenal.

Categories
Forex Fundamental Analysis

Everything About Food Inflation & The Impact Of Its Release On The Forex Market

Introduction

Capitalist economies achieve economic growth using inflation as the primary fuel. Low and steady inflation rates are essential for achieving target GDP each year. Not all commodities inflate steadily and proportionally. Disproportional inflation amongst different sectors leads to over and underpricing of commodities. Food and Energy are the most basic of necessities in today’s modern society. Understanding how food inflation affects the population and the overall economy will help us better understand the inflation trends and their consequences.

What is Food Inflation?

Inflation is the typical increase in prices of commodities and a decrease in the purchasing power of money over time. Inflation is required to motivate people to work better to be able to afford it. If prices were stagnant, the necessity to grow or earn more would cease, thus halting the growth of a nation on the macro level. When that happens, people will remain in their current financial state and would not progress. Hence, inflation is the “necessary evil” or the required fuel for capitalist countries to achieve economic growth.

Food Inflation refers to the general increase in prices of food commodities. As prices inflate, our current income’s purchasing power erodes. Food and Energy are the necessities for us in this modern society. Although to some extent, Energy can be cut back on to get on with life, we cannot cut back on food.

Food is the fundamental right to every human being. Accessibility and affordability to food and water is a must for every individual regardless of their country. Food inflation monitors the affordability aspect of food within the nation; the consequences associated with it are more intricate than we might anticipate.

How can the Food Inflation numbers be used for analysis?

As people can procure fewer goods for a unit of currency over time, people can either cut back on expenses or earn more to compensate for inflation. Food expenses are mandatory expenditure part of income. High food inflation will take up a more substantial chunk out of the disposable income of individuals leaving less room for discretionary spending.

As the affordability of food decreases due to high food inflation, consumer spending is negatively affected. Consumer Spending is the primary component of GDP accounting for more than two-thirds of the nation’s GDP. In the same case, more people who are working on minimum wages find it more difficult to afford food and would be below the poverty line even when their wages are not.

Political implications would also be severe. The backlash from the public over Government’s inadequacy to control inflation would be severe and, at times, have led to strikes and bans in many countries over the years. The Government at such times faces severe criticism both from the public and the opposition parties and would likely lose the next elections.

Food inflation could also occur due to adverse weather conditions destroying crops, or mismanagement of supply and demand by the authorities, or even politically manipulating supply and demand for profit by local dealers. There have been incidents where supplies of grains were withheld to boost up the prices for better profits artificially.

In developing countries, there are incidents where Government-issued rations are also sold illegally for profit by some corrupt groups. Lack of proper support to farmers in terms of resources like electricity, water, seeds, loans could also impair them to produce a good yield. All such factors add to food inflation, whose burden falls upon the ordinary people.

It is necessary to understand that all other commodities excluding Food and Energy generally have at least some alternatives (or different brands) to choose from in case price inflates. For instance, people looking to buy clothes from a brand may switch to another brand to avoid paying the new inflated price. Food inflation effect cannot be avoided as quickly as was the previous case.

Government officials closely monitor the inflation levels and are politically committed to keeping inflation in check through fiscal and monetary levers at their dispense. Food and Energy prices are given special attention, and almost all the time, the response is quick and practical from the Government during times of disruption in the food supply.

During the COVID-19 pandemic, many countries’ governments released relief packages to make sure there is no food shortage. Despite the fact many people slipped through the cracks of these protection measures, nonetheless, Governments did everything they could to avoid starvation.

 Impact on Currency

Food inflation is part of overall consumer inflation. Consumer inflation is the primary macroeconomic indicator for currency traders to assess relative inflation amongst currency pairs. Hence, food inflation is overlooked by currency traders for the broader inflation measures like the Consumer Price Index (CPI) or Personal Consumption Expenditure (PCE).

Nonetheless, food inflation is beneficial for the government officials to keep it in check all the time and also for the economic analysts to report the same. Overall, food inflation is a low-impact coincident indicator in macroeconomic analysis for currency trading that is overlooked for broader inflation measuring statistics, as mentioned before.

Economic Reports

The Bureau of Labor Statistics publishes monthly inflation statistics as part of its Consumer Price Index report for the United States. This report has the food inflation statistics as the first criteria.

The St. Louis FRED also maintains the inflation statistics on its website and has many other tools to add to our analysis.

Sources of Food Inflation

Consumer Price Index from the US Bureau of Labor Statistics is available on its official website along with monthly updates.

We can find the same indexes along with many others with a comprehensive summary and statistics on the St. Louis FRED website.

We can find the global food inflation statistics of most countries on Trading Economics.

How Food Inflation Data Release Affects The Price Charts

In the US, the food inflation data is released simultaneously with the overall consumer price index (CPI) data. The data is released monthly about 16 days after the month ends. The most recent release was on August 12, 2020, at 8.30 AM ET and can be accessed at Investing.com here. A more in-depth review of the monthly report can be accessed at the US Bureau of Labor Statistics website.

It is worth noting that since the food inflation numbers are released together with the over CPI, it will be challenging to determine the effect it has on price action.

The screengrab below is of the monthly CPI from Investing.com. On the right, is a legend that indicates the level of impact the Fundamental Indicator has on the USD.

As can be seen, the CPI data is expected to have a medium impact on the USD upon its release.

The screengrab below shows the most recent changes in the monthly CPI data in the US. In July 2020, the monthly CPI increased by 0.6% better than analysts’ expectations of a 0.3% change. This positive change is therefore expected to make the USD stronger compared to other currencies.

Now, let’s see how this release made an impact on the Forex price charts.

EUR/USD: Before Monthly CPI Release on August 12, 2020, 
Just Before 8.30 AM ET


As can be seen from the above 15-minute chart, the EUR/USD pair was on a steady uptrend before the inflation news release. Bullish candles are forming above a steeply rising 20-period Moving Average, indicating the dollar was weakening before the release. Immediately before the news release, the uptrend can be seen to be weakening.

EUR/USD: After Monthly CPI Release on August 12, 
2020, 8.30 AM ET

After the news release, the pair formed a 15-minute bullish candle. Contrary to the expectations, the USD became weaker against the EUR since the pair continued to trade in the previously observed uptrend.

Now let’s see how this news release impacted other major currency pairs.

AUD/USD: Before Monthly CPI Release on August 12, 2020, Just Before 8.30 AM ET

The AUD/USD pair shows a similar trading pattern as the EUR/USD before the inflation news release. The pair is on an uptrend, which heads for a neutral trend immediately before the news release.

AUD/USD: After Monthly CPI Release on August 12, 2020, 
8.30 AM ET

As observed with the EUR/USD pair, the AUD/USD formed a bullish 15-minute candle after the news release. Afterward, the pair traded in a renewed uptrend with the 20-period Moving Average steeply rising.

NZD/USD: Before Monthly CPI Release on August 12, 2020, 
Just Before 8.30 AM ET

NZD/USD: After Monthly CPI Release on August 12, 2020, 
8.30 AM ET

Unlike the EUR/USD and the AUD/USD pairs, the NZD/USD traded within a subdued neutral trend with an observable downtrend immediately before the news release. However, after the news release, the pair formed a 15-minute bullish candle and traded in a steady uptrend, as seen with the other pairs.

Bottom Line

In theory, a positive CPI data should be followed by an appreciating USD. From the above analyses, however, the positive news release resulted in the weakening of the USD. This phenomenon can be choked to the effects of the coronavirus expectations, which have made fundamental indicators less reliable.

Categories
Forex Money Management

Losing Money at the Beginning of your Forex Trading Career? Read This…

If you’ve recently started trading forex and you’ve found yourself losing money, you’re probably feeling discouraged and you might even feel like quitting. After all, articles and information online make trading sound easy, which likely led you to develop expectations. Losing your initial investment can be a huge disappointment and it often leads traders to give up entirely. But it isn’t too late if you’re in this spot – we can help.

The first thing you need to do is to figure out if you spent enough time educating yourself about forex trading before you jumped into it. While trading, did you have issues navigating on the trading platform and performing simple tasks like placing orders? Did you ever find yourself confused by the terminology? Do you feel that you have a good understanding of concepts like risk-management and different types of trading strategies? If not, then your biggest problem likely stems from the fact that you simply need to spend more time online reading articles, watching videos, and taking advantage of other free resources that will teach you everything you need to know. You should also practice on a demo account to gauge your progress. If you feel confident that you know everything you need to know, then you’re ready to move on to the next step.

Instead of freaking out over your past mistakes, you have to learn from them as a trader. Yes, losing money hurts, but it is part of trading. What really matters is that you make more money than you lose. If successful traders gave up after their first couple of losses, then nobody would make it as a trader. One of the best things you can try is keeping a trading journal to log every trade you make, along with the reasons why you made the trade and how much you made or lost. Then, you can start to analyze this data to look for patterns or identify issues that are affecting your trades. Maybe you’ve been forgetting you opened a trade, getting distracted around a certain time of day, suffering from trading anxiety – logging all of this data is the best way to figure out what’s going wrong.

A lot of traders suffer once they resume trading after taking a large loss. Even if the trader is confident in their strategy, they may be afraid of making trades because they don’t want to suffer another loss. Anxiety is a good example in this situation, as the trader might feel overly anxious, which leads to a problem known as analysis paralysis. Traders suffering from analysis paralysis make delayed decisions or fail to enter trades altogether because they are too anxious about the outcome. Anxiety and fear often affect traders that have recently taken a loss, but it’s important to overcome these emotions so that you can make level-headed trading decisions. The first step is to realize whether this is a problem that is affecting you, and then you can find multiple resources online to help you deal with it.

To summarize, there are a few main problems that can cause problems with your trading, especially if you’ve lost money in the beginning:

  • Not having a proper trading education
  • Fearing failure
  • Fixation on mistakes rather than learning from them
  • Feeling anxious, fearful, or overwhelmed once you resume trading
  • Failing to keep a trading journal to log your progress
  • Feeling less confident in yourself

Successful traders understand that losing money is just part of trading and don’t spend time fixating on their losses. It may seem difficult to move on, especially if you don’t have a lot of money to invest. If you’ve had difficulty with trading thus far, you shouldn’t give up yet. Try to figure out which of the above problems is affecting you so that you can fix these issues without walking away from your trading career.

Categories
Forex Market Analysis

Daily F.X. Analysis, August 28 – Top Trade Setups In Forex – U.S. Fed Chair Powell Speaks! 

On the news front, the economic calendar is due to a report series of CPI and GDP figures from the European economy. These events are expected to be overshadowed by the U.S. Personal Pending, Chicago PMI, and Revised UoM Consumer Sentiment, which are expected to slightly worse than beforehand. This may add further bearish bias for the U.S. dollar today.

Economic Events to Watch Today  


EUR/USD – Daily Analysis

During the Thursday’s Asian trading hours, the EUR/USD currency pair managed to extend its previous session gaining streak and still flashing green while taking round near 1.1830/40 level mainly due to the broad-based U.S. dollar selling bias, in the wake of cautious sentiment around the market ahead of the U.S. Federal Reserve (Fed) Chair Jerome Powell’s speech. On the contrary, the buying interest around the shared currency is declining on the day amid the intensifying virus fugues in Europe, which eventually becomes the key factor that has been capped further upside in the currency pair. 

At the moment, the EUR/USD currency pair is currently trading at 1.1835 and consolidating in the range between the 1.1817 – 1.1850. However, the traders are cautious about placing any strong position ahead of week’s Jackson Hole conferences where Federal Reserve’s (Fed) President Jerome Powell will speak about the central bank’s long-awaited monetary policy framework review, which will focus on inflation. 

Despite the upbeat U.S. and China data, the equity market has been declining since the day started amid the renewed concerns over the US-China relation. At the US-China front, the Trump administration sanctioned those companies who are helping China to mark its existence in the South China Sea. In contrast, China fired missiles in a military drill near the South China Sea. 

At the USD front, the broad-based U.S. dollar failed to gain any positive traction on the day. However, the losses could be associated with the doubts about the U.S. economic recovery ahead of Fed Chairman Jerome Powell’s speech at Thursday’s Jackson Hole symposium themed. However, the losses in the U.S. dollar became the key factor that kept the currency pair’s higher. Whereas, the U.S. Dollar Index that tracks the greenback against a basket of other currencies dropped by 0.12% to 92.882 by 11:59 PM ET (4:59 AM GMT).

At the coronavirus front, the coronavirus cases grew to 236,429, with a total of 9,280 deaths toll, according to the German disease and epidemic control center, Robert Koch Institute (RKI) report. In the meantime, the cases rose by 1,576 in Germany yesterday against Monday’s +1278. Whereas the death toll also grew by 3. It is worth mentioning that Germany recorded its highest number of new COVID-19 cases during the weekend in almost 4-months. As a result, they undermined the bullish sentiment around shared currency and held the currency pair between the thin range.

Daily Technical Levels

Support Pivot Resistance
1.1754 1.1828 1.1894
1.1689 1.1967
1.1615 1.2033

 EUR/USD– Trading Tip

The EUR/USD is trading slightly bullish at 1.1851, crossing over the resistance level of 1.1849 level. On the lower side, the EUR/USD may find support at 1.1830, while a bearish breakout of 1.1830 level can trigger selling until 1.1800 level. In case of a bullish breakout, the EUR/USD pair may begin further buying trends until 1.1880 and 1.1945 levels.


GBP/USD – Daily Analysis

The GBP/USD stimulates the daily high to 1.3242, up 0.29%, while directing into the European session open. Like major pairs, the Cable restored the yearly high on Thursday ere dipping to 1.3161, which caught the two-day winning streak. After remarks from Fed Chair, the broad U.S. dollar rally pulled the quote descending the prior day. 

The greenback’s latest drops support the pair bulls before BOE Governor Andrew Bailey’s address at the Jackson Hole Symposium. While running the third bullish day in the previous four, the GBP/USD prices also spend tiny heed to the Brexit distress indicated by The Times.

The final scheduled round of post-Brexit trade negotiations between the E.U. and the U.K. have already been abandoned, but ministers are expected to appear next week. Additionally, Germany’s expulsion of Brexit discussions as agenda from next week’s critical talks amongst the E.U. representatives.

Subsequently, the uproar girdling insect repellent ingredient defending against the coronavirus (COVID-19) and 21-day immunity plan represented a mild enthusiasm at home. The sentiment overlooks the biggest daily COVID-19 problems while producing 1,522 numbers for Thursday.

On the other hand, U.S. President Donald Trump addressed to end dependence on China “once and for all.” Besides, the mystic concepts of Fed Chair Powell, involving Average Inflation Targeting (AIT), appear to decrease the allure as markets start reading between the words and spot economic worries.

 Daily Technical Levels

Support Pivot Resistance
1.3145 1.3215 1.3268
1.3092 1.3338
1.3022 1.3391

 GBP/USD– Trading Tip

The GBP/USD has distributed the trading range of 1.3240 – 1.3180, and a bullish breakout of Cable is anticipated to lead it higher unto 1.3275 mark. On the higher side, the GBP/USD faces the next resistance at 1.3275 mark and over this level, the pair may find 1.3323 resistance. Speaking about the technical side of the market, 50 periods of EMA, RSI, and MACD suggest bullish bias in the GBP/USD pair. Today, let’s look for buying trades above 1.3275 level.


USD/JPY – Daily Analysis

During Thursday’s early European trading session, the USD/JPY currency pair managed to stop its early-day losing streak and took modest bids near above 106.00 level mainly after the (BOJ) board member Hitoshi Suzuki expressing his take on the monetary policy outlook, which eventually undermined the Japanese yen and extended some support to the currency pair. 

 Meanwhile, the risk-off market sentiment, driven by the renewed US-China tussle and intensifying virus cases in Europe and Asia, tends to underpin the safe-haven Japanese yen and kept the currency pair sidelined. At this moment, the USD/JPY currency pair is currently trading at 106.02 and consolidating in the range between 105.81 – 106.08.

It is worth reporting that the Bank of Japan (BOJ) board member Hitoshi Suzuki expressed his part on the monetary policy outlook while saying that “Will ease monetary policy further without hesitation with an eye on the pandemic impact on the economy. “He also added that “If BOJ were to ease more, it could use a special program for combating pandemic, cut short-, long-term interest rates or ramp up risky asset buying.” However, these statements recently weakened the Japanese yen and provided little support to the currency pair. 

Apart from this, the Takatoshi Ito, a famous economist who was once a preferred nominee to become Bank of Japan (BOJ) governor, stated that the Japanese economy could see a quicker recovery by 2022 if a vaccine becomes available. However, the currency pair failed to give any major attention to the above headlines, as it remains flat around 106.00 due to the cautious risk tone and weaker greenback ahead of the Fed Chair Powell’s Jackson Hole speech.

Across the pond, the failure of the American lawmakers to offer any hint on the big coronavirus (COVID-19) relief package or the highest COVID-19 new cases in Italy since May, not to forget the fresh US-China tussle over the South China Sea, all factors are weighing on the market trading sentiment, which could be considered as the main factors for the currency pair limited moves. 

At the US-China front, the Trump administration plans sanctions on those companies who are helping China to mark its existence in the South China Sea. At the same time, China fired missiles in a military drill near the South China Sea. The U.S. Secretary of State Michael Pompeo criticized China for “coercive bullying tactics against our friends in the United Kingdom.” This also exerted a burden on the market trading sentiment. This, in turn, underpinned the safe-haven Japanese yen demand and capped upside momentum in the pair.

Despite the risk-off market sentiment, the broad-based U.S. dollar failed to gain any positive traction on the day, as well as the losses could be associated with the doubts about the U.S. economic recovery ahead of Fed Chairman Jerome Powell’s speech at Thursday’s Jackson Hole symposium themed. However, the losses in the U.S. dollar became the key factor that kept the currency pair’s gain limited. Whereas, the U.S. Dollar Index that tracks the greenback against a basket of other currencies dropped by 0.12% to 92.882 by 11:59 PM ET (4:59 AM GMT).

Looking forward, the market traders await the Federal Reserve Chairman Jerome Powell’s speech in the Jackson Hole Symposium. As well as, America’s preliminary readings of the second quarter (Q2) GDP, which is expected -32.5% versus -32.9% will be key to watch. In the meantime, the updates surrounding the fresh Sino-US tussle, this time over the South China Sea, as well as the coronavirus (COVID-19) updates, could not lose their significance.


Daily Technical Levels

Support Pivot Resistance
105.8700 106.2900 106.9700
105.1800 107.4000
104.7600 108.0800

USD/JPY – Trading Tips

The USD/JPY is trading bearish at 106.082 level, holding above a support level of 106, which is extended by upward channel. On the higher side, the USD/JPY expected to gain an immediate resistance around 106.566 and 107.078. Looking at the 2-hour timeframe, the 50 periods EMA is extending resistance at 106.350. Likewise, the MACD and RSI are staying in a bearish zone, beneath 50 and 0, sequentially. The USD/JPY may trade bearish below 106.350 to target 106 and 105.800. Good luck! 


Categories
Forex Basics

How to Make Real Money with a Forex Demo Account

A demo account serves as a simulation account that traders can use to practice trading in a live environment with virtual currency. Opening a demo account is completely free and you never have to invest a dime into the account, regardless of how many you open, what company you use, or how long you use it. These accounts are one of the best ways for traders to test their practical skills with zero financial risks. Since demo accounts are completely free, many traders would assume that there is no possible way to make money from them. The good news is that it is entirely possible to profit from trading on a demo account.

So, how can you make money off a demo account? Participating in a demo account contest. You might not have heard of this before because many brokerages don’t offer this. Those that cannot afford to offer bonuses and promotional opportunities often stay away from this type of contest because it doesn’t bring them any income and only takes money out of their pocket. However, it is possible to find several of these contests online through different companies. Do note that many of these brokerages require you to register a live account to take part in their contests. 

Each participating brokerage offers its own unique contest with different rules and prizes, but many of these contests follow the same pattern. Anyone that would like to can open a demo account through the broker and trade for a specified amount of time, usually around a month or so. When the time is up, the trader that made the most profit is usually crowned the winner and given the main cash prize. Sometimes second, third, and other placing traders will earn lesser prizes. 

If you are looking for an ongoing contest, you can search for “forex demo contest” on any search engine to find results. Some companies offer contests periodically while others offer them monthly. There are also cases where a demo contest is offered as a one-time promotion. It’s a good idea to check online for any updates periodically so that you don’t miss out on a good opportunity. You’ll want to participate as soon as the contest starts so that you don’t get behind. 

Before you register for any demo contest, it is important to understand the unique rules that apply. You need to make sure that you qualify to enter so that there are no issues claiming your prize if you win. It is also important to look at the prize(s) and to make sure that any cash prize is fully withdrawable, so you don’t waste your time. If there are requirements for a certain trading volume to be met or other rules before the prize can be withdrawn, make sure that you’ll be able to meet those guidelines. You have a better chance to win a prize if you can find a contest that rewards 2nd and 3rd place winners. 

To give our readers a better idea of their options, we’ve provided a few examples of current demo contests that are currently available as of the summer of 2020. Keep in mind that these contests may expire or change over time, but this should give you a general idea of what’s out there. 

  • HotForex holds monthly demo contests that reward 1st place with $2,000, 2nd place with $1,000, and 3rd place with $500. Traders can view the current rankings online but be aware that all rewards are credited on a live account.
  • Atirox offers a monthly demo contest named Chasing Mavericks. The goal is to maximize prosses while incurring as few losses as possible. The monthly reward is $5,000 for the winner, but you need to register a real account with the company to participate. 
  • OctaFX holds periodic demo contests with the next one taking place on June 8th. The 1st place prize is $1,000, 2nd place wins $600, 3rd place receives $200, and 4th and 5th place takes home $120 and $80. The participant with the highest balance at the end of the round wins. You do have to register a live account to participate. 

These are only a few examples of demo contests that are out there, so be sure to look at other options. If you decide to open a trading account through a company for one of these contests, you’ll need to make sure that they offer attractive trading conditions on their live accounts. Also, know that it isn’t easy to win these contests. Most of them look for the highest profit or the most growth, so beginners will have a hard time winning. Still, this doesn’t mean that you shouldn’t participate, since these contests will help improve your skills and you could still win a prize with hard work and determination. 

Categories
Forex Signals

Gold Winning Signal Ends at Stop Loss – What’s Next? 

The precious metal gold prices were closed at 1953.90 after placing a high of 1954.86 and a low of 1902.53. Overall the movement of gold remained bullish throughout the day. After posting losses remaining flat from 3 consecutive days, gold prices rose on Wednesday by 2% on the back of US dollar weakness on the eve of a speech from the Federal Reserve Chairman Jerome Powell. Investors were betting on a further stimulus package to diminish the impact of coronavirus pandemic.

The US dollar was weak on the board as the traders were placing bids on the hopes and expectations that there was a further stimulus to come. The US Dollar Index (DXY) eased by about 0.1% against the six major currencies basket and made gold cheaper for investors holding other currencies. The Chairman of Federal Reserve, Jerome Powell, will speak at a virtual Jackson Hole symposium on Thursday, at the central bank’s annual Monetary Policy Framework Review.

The speech is highly awaited because investors believe that it will make a case for stronger monetary stimulus to help the economy. The speech will also give clues about Fed finding additional ways to bolster the economy if Congress fails to deliver on a new pandemic relief package.

Ahead of the September monetary policy meeting of Federal Reserve, the question remained on cards that whether Powell will favor shifting inflation target to an average instead of the long-favored 2% level. It is because such a shift will allow inflation to run higher before interest rates increased. In this situation, the US dollar will become weak, and gold will gain.

The Fed Chair’s speech’s rising dovish expectations on the next day weighed on the local currency and helped bullions to post gains. However, if Powell will deliver the expected comments, then gold could quickly recapture the $2000 level this week.

On the other hand, the gold prices were further supported by the rising safe-haven appeal after the US & China’s escalated tensions. On Wednesday, the US penalized 24 Chinese companies, and the Trump Administration cut them off from the American market, saying that they had contributed to China’s controversial island-building campaign.

The companies were added to the government list that bans them from buying American products. The reason was provided as their role in helping the Chinese military to construct artificial islands in the disputed South China Sea.

On the vaccine front, the top US virus expert Dr. Anthony Fauci warned against rushing out a COVID-19 vaccine before proven effective and safe. He said that it could hurt the development of other vaccines.

US President Donald Trump has been considering plans to put out a vaccine before it has been fully tested because a move like this would increase his chances of re-election in November’s presidential election. Democrats have accused Trump foe being prepared to endanger American lives for political gain.

The warning by Dr. Fauci faded some of the risk appetites from the market and added in the gains of gold prices on Wednesday.

Meanwhile, the gains in yellow metal were checked by the positive economic data from the US. At 17:30 GMT, the Core Durable Goods Orders rose in July to 2.4% from the expected 1.9% and supported the US dollar. The Durable Goods Orders in July also rose to 11.2% from the estimated 4.4% and supported the US dollar. The better than expected US economic data on Wednesday caped additional gains in yellow metal prices.


The precious metal gold soared sharply after testing the support level of 1,902 level to place a high around 1,955. The precious metal has closed a bearish engulfing candle on the 4-hour timeframe and may drive selling bias in gold. Gold can drop until 38.2% Fibonacci retracement level, which stays at 1,934 and 61.8% Fibo level of 1,922. Resistance stays at 1,954 and 1,965. The market is currently trading with massive volatility amid Fed Chair Pawell’s speech. Since our trade is closed at stop loss, let’s wait a bit for the market to gain stability before taking the next trade. Good luck! 

Categories
Forex Fundamental Analysis

Impact of ‘Employment Rate’ Economic Indicator On The Forex Market

Introduction

Employment is crucial for consumer spending, which makes more than two-thirds of the GDP for many countries. Understanding the employment rate and the cascading effect it has on the economy is paramount for fundamental analysis. The factors affecting the employment rate and business cycle patterns all inherently impact economic growth and currency valuation. Hence, understanding employment as an economic indicator will strengthen our analysis.

What is Employment Rate?

Employment Rate:  It is defined as the ratio of employed to the total available labour force. Here the labour force is defined as the sum of employed and unemployed persons. It is also considered as a measure of the extent to which the labour force is being used.

Unemployment is a state where an individual is actively searching for employment but cannot find work.

Unemployment Rate: It is defined as the percentage of unemployed people to the available labour force. It is the other half of the employment rate. Employment and unemployment rate combined should yield results as 100% as it equals the total available labour force.

How can the Employment Rate numbers be used for analysis?

Employment and unemployment can be considered as the two sides of the same coin. We can derive our fundamental conclusions from either direction. Employment Rate is essential for our analysis because it has a direct and cascading impact on consumer spending. In the US, consumer spending accounts for about 70% of the total GDP.

A high employment rate indicates that more people in the labour force have income that they can spend on purchasing goods and services. When consumer spending is on the rise, businesses flourish, leading to better wages, or even more employment. Overall, employment in one sector has an indirect positive effect on dependent sectors and a direct positive effect on the economy.

The Government is also politically committed to ensuring a low unemployment rate; otherwise, citizens will not favour them in the next elections. By providing proper support to local businesses, the Government can increase employment in the short run.

A high unemployment rate is very damaging to the economy. As more people are unemployed, there is a direct negative effect on consumer spending. In this scenario, also the cascading effect works and makes the situation worse. It also hurts the employed people.

Increased unemployment in the economy can bring down the employed morale, making them feel guilty for being employed while their colleagues are unemployed. It can also make employed people feel less secured and discourage their spending habits, and they may end up saving for a rainy day. Employed people may feel lucky enough to have a job that inhibits them from applying for better opportunities amid high unemployment.

Employment and Unemployment rates can also help investors to keep a pulse on the health of the economy. Overall it is essential to make sure the employment rate is always high and does not take a dip. Even when the unemployment rate rises linearly, it has an exponential impact on economic growth, and hence the central authorities try to avoid it at all times.

It is also essential to understand that employment rates are sensitive to business cycles in the short run. Hence, seasonally adjusted versions of the same are more useful for analysis. In the long run, the employment rates are significantly affected by government policies on higher education and income support. Policies that focus on the employment of women and disadvantaged groups also help increase the employment rate.

Both developing and underdeveloped countries’ governments have to focus on education policies and employment opportunities for their labour force if economic growth is the primary concern. Literacy and higher education in underdeveloped and developing nations have helped the economies grow stronger year-on-year.

Employment rates are coincident indicators and can also be used to predict or confirm oncoming recessionary or recovery periods, if any. The onset of a recession is accompanied by a massive unemployment rate or decreased employment rates. Hence, despite the propaganda of the media and Government, we can use employment data actually to confirm whether the economy is growing or stagnating. Accordingly, during recovery periods, employment rates start on a recovery trajectory back to its previous normal.

Impact on Currency

As an increase in employment rate points towards a growing economy, a high employment rate is good for the GDP and the currency. Hence, the employment rate is a proportional coincident indicator. An increase or decrease in employment rate is suggestive of improving or deteriorating the economy, respectively.

The forex market watches the unemployment rate more closely than the employment rate itself. Significant changes in the employment rate or the unemployment rate tend to have a considerable impact on market volatility. Still, generally employment rate in itself is a low impact indicator compared to the unemployment rate.

Employment change, initial jobless claims also precede unemployment rates, and the desired effects are already factored into the market before the employment rates are released. Hence, overall it is a low impact indicator.

Economic Reports

In the United States, the BLS surveys and tracks monthly employment and unemployment within the country. It classifies them based on geography, sex, race, industry, etc. The Employment Situation report is also published by the BLS, and it goes as far back as the 1940s. It is released by BLS on the first Friday at 8:30 AM Eastern Standard Time every month.

Sources of Employment Rate

The US BLS publishes monthly employment and unemployment reports on its official website. We can also find the same indexes and statistics of various categories on the St. Louis FRED. We can also find employment rate statistics published by the OECD countries here. Consolidated reports of employment rates of most countries can also be found in Trading Economics.

How Employment Rate News Release Affects The Price Charts

As we have already established, an increase or decrease in the employment rate can be used to gauge whether the economy is performing well or poorly. For forex traders, it is therefore imperative to understand how the news release of this macroeconomic indicator will impact the price action on various currency pairs.

In the US, employment reports are released monthly, usually on the first Friday after the month ends. The latest, expected, and all historical figures are published on the Forex Factory website. We can find the most recent release here. Below is a screengrab of the US unemployment rate from the Forex Factory website. On the right, we can see a legend that indicates the level of impact the Fundamental Indicator has on the corresponding currency.

As shown, the unemployment rate is a high impact indicator. The snapshot below shows the change in the US unemployment rate as released on August 7, 2020, at 1230GMT. For July 2020, the unemployment rate declined from 11.1% to 10.2%, beating the 10.5% decline forecasted by analysts.

Now, let’s see how this news release made an impact on the Forex price charts.

EUR/USD: Before Employment Data Release August 7, 2020, Just Before 1230GMT

The 30-minute EUR/USD chart above shows the market is on a downtrend from 0200 to 1200 GMT with the candles forming below the 20-period Moving Average. More so, the market was trading within a narrow price channel of between 1.1850 and 1.1810, indicating a calm market with traders waiting for the latest employment data to gauge the economic recovery.

EUR/USD: After Employment Data Release August 7, 2020, 1230GMT

As can be shown on the chart above, immediately after the news release, we can observe a sudden downward spike with a retraction. This spike indicates the market is having mixed reactions to the positive employment news hence the strong USD.

After the initial spike, the market can be seen to ‘absorb’ the positive news. The pair adopted a bearish outlook with the price breaking and staying below the earlier observed 1.1810 resistance level.

Since the pair had not shown any unexpected sudden swings before and after the new release, trading the news would have been profitable. For such a high impact economic indicator, it is advisable to open positions after the news release to avoid being caught on the losing end of the trend.

Now, let’s quickly see how this new release has impacted some of the other major Forex currency pairs.

GBP/USD: Before Employment Data Release August 7, 2020, Just Before 1230GMT

GBP/USD: After Employment Data Release August 7, 2020, 1230GMT

The GBP/USD pair showed a similar trend as the one observed with EUR/USD. The pair can be seen to have traded within a narrow price channel of 1.3122 and 1.3071 from 0700 to 1200 GMT. After the economic data release, the pair similarly had a sudden spike. It later adopted the same bullish stand as the EUR/USD pair, with price breaking and trading below the observed resistance level.

AUD/USD: Before Employment Data Release August 7, 2020, Just Before 1230GMT

GBP/USD: After Employment Data Release August 7, 2020, 1230GMT

Similar to the EUR/USD and the GBP/USD pairs, the AUD/USD traded within a price channel of 0.7221 and 0.7196 and no unexpected spikes before the news release. After the news release, a sudden spike can be observed with an accompanying retraction, and later the pair adopted a bullish stance breaking below the observed resistance level.

From the above analysis, the subdued market volatility before the release of the employment data and the subsequent volatility, it is evident that the employment rate is high impact indicator anticipated by forex traders.

Categories
Forex Market Analysis

Daily F.X. Analysis, August 27 – Top Trade Setups In Forex – U.S. Fed Chair Powell Speaks! 

On the fundamental side, the eyes will remain on the U.S. Prelim GDP, Unemployment rate, and Fed Chair Powell Speaks, which is due during the U.S. session. U.S. economy is once again expected to report a massive dip in the U.S. GDP data. At the same time, the Jobless Claims may improve a bit. Overall, the Fed Chair Powell Speaks will be the main highlight of the day as it may determine further sentiment about the U.S. dollar depending upon the dovish or hawkish tone of Powell.

Economic Events to Watch Today  


EUR/USD – Daily Analysis

The EUR/USD pair was closed at 1.18300 after placing a high of 1.18391 and a low of 1.17720. Overall the movement of the EUR/USD pair remained flat yet slightly bearish throughout the day. The Euro to U.S. Dollar exchange rate remained flat throughout the day and dropped in late Wednesday. The EUR/USD pair lost some of its previous daily gains earned on the back of stronger than expected German GDP data for the second quarter of this year.

The President at IFO Institute, Clemens Fuest, said that the German economy was on track to recovery as the German companies assessed their current business situation markedly more positively than last month. He said that the manufacturing sector’s business climate had improved considerably; however, many manufacturers still consider their current business to be poor.

Whereas, the resurgence of coronavirus pandemic in Europe increased the concerns for another wave of the Eurozone outbreak. Spain has recorded 80,000 new coronavirus cases over the last two weeks; the rate was by far the most in Western Europe. Germany reported 1576 new cases on Wednesday and increased the total count to 236,429.

The travel warning for countries outside Europe has been extended to September 14, as announced by the German Foreign Ministry on Wednesday. Meanwhile, Health Minister Jens Spahn has said that coronavirus testing’s capacity was limited in the country. In France, the Government warned that a second wave could hit the country as early as November. Furthermore, the E.U. trade commissioner Phil Hogan resigned after the Irish Government accused him of breaching COVID-19 guidelines. He attended a golf dinner with more than 80 people in a County Galway on August 19 and was criticized for not complying with quarantine rules while traveling.

Mr. Hogan denied breaking any law and said that he should have been more rigorous concerning the COVID-19 guidelines. These virus-related concerns kept weighing on the local currency Euro and kept the pair EUR/USD under pressure throughout the day.

On the U.S. front, the U.S. dollar was low on the day ahead of Fed Chair Jerome Powell’s speech scheduled for Thursday. The speech is expected to be dovish and provide fresh clues about the delayed U.S. next stimulus package and is weighing on the market sentiment.

However, the U.S. macroeconomic data remained supportive of the U.S. dollar as the Core Durable Goods Orders rose to 2.4% in July from the projected 1.9% and supported the U.S. dollar. The Durable Goods Orders also raised to 11.2% from the anticipated 4.4% and supported the U.S. dollar. The U.S. data added further pressure on EUR/USD pair, and the pair moved in a downward direction in the late American session after moving sideways throughout the day.

Daily Technical Levels

Support Pivot Resistance
1.1787 1.1814 1.1856
1.1744 1.1884
1.1717 1.1926

 EUR/USD– Trading Tip

The EUR/USD is trading sideways, holding below a double top resistance area of 1.1849 level. On the downside, the EUR/USD is likely to find support at 1.1804, while a bearish breakout of 1.1804 level can trigger selling until 1.1775 level. In case of a bullish breakout, the EUR/USD pair may trigger further buying trends until 1.1879 and 1.1945 levels.

GBP/USD – Daily Analysis

The GBP/USD currency pair managed to gain some positive traction and drew some modest bids near above 1.3200 level on the day mainly due to the broad-based U.S. dollar weakness, triggered by the cautious sentiment ahead of U.S. Federal Reserve (Fed) Chair Jerome Powell’s speech. Apart from this, the lack of progress over the much-awaited U.S. fiscal stimulus also weighed on the safe-haven U.S. dollar and contributed to the currency pair gains.

On the contrary, the downbeat report from the Confederation of British Industry (CBI) and negative remarks by the Organisation for Economic Co-operation and Development (OECD) also exerted some downside pressure o the currency pair. On the other hand, the cancelation of the negotiations over the U.K. and the European Union’s post-Brexit relationship also becomes the key factor that kept the lid on any additional gain in the currency pair. At this particular time, the GBP/USD currency pair is currently trading at 1.3207 and consolidating in the range between 1.3195 – 1.3223.

As per the CBI report, the companies reliant on spending by consumers – many of which only opened in recent weeks after the lockdown – cut jobs faster on record. However, these comments initially weighed on the currency pair. In the meantime, the OECD noted the British economy’s record quarterly fall as worrisome. In turn, this undermined the sentiment around the British Pound and contributed to the currency pair modest losses.

Also weighed on the quote was the reports that the E.U. representatives have dropped the discussions over the U.K. and the European Union’s post-Brexit relationship as a subject for the next week’s meeting. However, these gloomy headlines overshadowed the previous day’s positive comments from the Irish leader Michael Martin.

The fresh challenges to the US-China relations exerted further downside pressure on the market trading sentiment across the pond. It is worth reporting that the Trump administration considers imposing sanctions on those companies helping China mark its presence in the South China Sea. This happens after the dragon nation fired missiles in the drills around the debatable region.

At the USD front, the broad-based U.S. dollar was down on Thursday morning in Asia ahead of U.S. Federal Reserve Chairman Jerome Powell’s speech at the Jackson Hole symposium later. Whereas, the losses in the U.S. dollar become the key factor that kept the GBP/USD currency pair higher. Whereas, the U.S. Dollar Index that tracks the greenback against a basket of other currencies dropped by 0.12% to 92.882 by 11:59 PM ET (4:59 AM GMT).

Looking forward, the market traders await the Federal Reserve Chairman Jerome Powell’s speech in the Jackson Hole Symposium. As well as, America’s preliminary readings of the second quarter (Q2) GDP, which is expected -32.5% versus -32.9% will be key to watch. In the meantime, the updates surrounding the fresh Sino-US tussle, this time over the South China Sea, and the coronavirus (COVID-19) updates, could not lose their importance.


Daily Technical Levels

Support Pivot Resistance
1.3144 1.3182 1.3247
1.3079 1.3285
1.3040 1.3351

 GBP/USD– Trading Tip

The GBP/USD has distrub[ted the narrow trading range of 1.3140 – 1.3056, and upward breakout of GBP/USD is expected to lead the Cable prices further higher until 1.3262 mark. On the upper side, the GBP/USD pair may face the next resistance around 1.3262 mark and above this 1.3295. Technically, 50 periods of EMA, RSI, and MACD all are suggesting a bullish trends in the GBP/USD pair. Let’s look for buying trades above 1.3146 level.

USD/JPY – Daily Analysis

The USD/JPY was closed at 105.985 after placing a high of 106.554 and a low of 105.954. After posting gains for three consecutive days, USD/JPY pair declined on Wednesday amid the broad-based U.S. dollar weakness ahead of Fed Chair Jerome Powell’s speech on Thursday.

The traders were selling USD/JPY pair over the rising hopes that a next stimulus package was on its way. As in result, the U.S. Dollar Index (DXY) fell by 0.1% against its rival currencies and weighed further on the U.S. dollar that dragged the currency pair on the low side.

The Chairman of Federal Reserve, Jerome Powell, will deliver a speech via video conference at Jackson Hole Symposium on the next day and provide an annual central bank’s monetary policy framework review.

Investors believe that the speech will make a strong case about the monetary stimulus, so they are awaiting it to find fresh clues about how the Fed will support the economy further through the coronavirus pandemic crisis.

Another reason behind waiting for the Fed’s Chair Powell’s speech is to determine whether Fed will favor shifting from a long-run inflation target of 2% to an average level of inflation as it will raise inflation and will make the U.S. dollar weak before raised interest rates.

The U.S. dollar was lower on the day ahead of the next stimulus measure as Powell’s dovish expectations increased. If Powell’s speech provided the expected clues, then the U.S. dollar will fell even more and weighed on USD/JPY to move it below 104 level.

Whereas, on the data front, at 04:50 GMT, the SPPI for the year from Japan rose to 1.2% from the expected 0.8% and supported Japanese Yen and added losses in currency pair. From the U.S. side, the Core Durable Orders for July rose to 2.4% from the expected 1.9% and supported the U.S. dollar. The Durable Goods Orders for July also rose to 11.2% from the estimated 4.4% and supported the U.S. dollar. The strong U.S. dollar capped additional losses in the USD/JPY on Wednesday.

Meanwhile, the additional losses in currency pair were supported by the rising tensions between the U.S. & China. On Wednesday, 24 Chinese companies were penalized by the Trump Administration due to their contribution to China’s controversial island-building campaign.

The U.S. banned Chinese companies from buying the U.S. products citing their role in helping the Chinese military construct artificial islands in the disputed South China Sea. The U.S. had already penalized dozens of Chinese companies over national security concerns and violations of human rights, and now China’s encroachment in the South China Sea has also added in it. Now it is remained to see the response of China over this penalty by the U.S. The ongoing tensions between the U.S. & China added strength in Japanese Yen that further supported the USD/JPY pair’s bearish trend on Wednesday.

Meanwhile, the risk sentiment that took its pace yesterday on the back of renewed hopes on the vaccine was faded away after the latest warning from the top U.S. virus expert Dr. Anthony Fauci. He said that before the vaccine’s approval for safety and efficiency, the usage of vaccines could be harmful. He warned that it could affect the development of other vaccines.

President Donald Trump had considered plans to put out a vaccine before it was tested and approved to increase his re-election chances in upcoming November’s presidential elections. Democrats have blamed Trump for endangering American lives for political gain. It has also weighed on risk sentiment and added in the currency pairs losses on Wednesday.

Daily Technical Levels

Support Pivot Resistance
105.7600 106.1600 106.3700
105.5500 106.7700
105.1500 106.9800

USD/JPY – Trading Tips

The USD/JPY is consolidating in an upward channel, which is supporting the pair at 105.820. On the upper side, the USD/JPY is likely to gain an immediate resistance around 106.566 as well as 107.078. Looking at

the 2-hour chart, the 50 periods EMA is extending resistance at 106.069. Simultaneously, the MACD and RSI are holding in a selling zone, below 50 and 0, respectively. The USD/JPY may trade bullish over 105.850 to target 107.084 and selling below 105.829. Good luck! 


Categories
Forex Psychology

The Inherent Dangers of Revenge Trading

Revenge trading – it’s one of the many things that can stop a successful trader dead in their tracks on the path to success as if traders weren’t already dealing with enough negativity. Before you can learn to stop revenge trading and how to avoid it, you’ll need to understand what it is. Allow us to start by defining the term “revenge trading”. 

The term revenge trading refers to a common problem where a trader becomes angry after losing money and attempts to take revenge trades in an attempt to recover their losses. With emotions like anger and frustration clouding the trader’s mind, they are likely to make decisions that are closer to gambling without following their trading plan. There are two reasons why this is a big problem:

  • First, revenge trading causes the trader to throw their discipline out the window. In the heat of the moment, trading plans and strategies are often ignored, and the trader might base their trades off nothing much at all. When your head is stuck on those losses and how badly you want to make the money back, you aren’t likely to follow your strategy or to think about risk management. 
  • A trader that isn’t making good decisions and that makes large trades without accounting for their overall risk is likely to lose more money, thus repeating the cycle that started the revenge trading in the first place. 

As you can see, revenge trading can cause issues with one’s logical thinking in the same way that many other emotions like anxiety, fear, etc. can wreak havoc on trading decisions. Below, we will provide two common scenarios that exemplify revenge trading:

  • In the first scenario, trader A has invested a chunk of money into a trade and wound up losing $97. This leaves trader A feeling frustrated about the fact that he was wrong and anxious to make his money back. In the same ways that someone who is having a bad day might get road rage or become snappy with a loved one, trader A begins to take out his aggression on his trades. He impulsively makes larger trades out of desperation to win that money back, but he winds up losing even more. In the end, trader A loses $200 instead of the initial $97 loss.
  • In the next scenario, trader B loses $40 a few hours after her stop-loss is hit. Although she would usually only risk $50, she decides to double her risk to $100 out of frustration and in an attempt to win that money back. As soon as she makes her $50 back, she cuts her winning trade out because of the fear that she will lose money again, even though she could have made more money. 

Although both of the above scenarios differ, each trader has fallen guilty to revenge trading. Trader A lost more money than he would have because he was chasing his losses, while trader B doubled her risk and closed out her winning trade once she made what she had lost. Bost traders lost money they could have made, as trader A could have stuck with the initial loss and trader B could have made more money on the winning trade. 

Now that we’ve covered what revenge trading is and provided a few examples, we will offer a few steps that can help traders overcome this problem:

  • Step 1:  After a frustrating loss, you should step away and clear your head. You could try doing something that makes you feel relaxed, like listening to music, exercising, or even spending a few minutes outside. Once you’re calm, you’ll be ready to think more rationally. 
  • Step 2: Next, it is helpful to determine the reasons why you lost the trade. Was this an error on your part, or did you make a trading move that seemed reasonable? Instead of betting yourself up over the loss, you simply want to figure out what went wrong so that you can avoid making the same mistake. Also, try to identify any triggers that you might have that signal you’re about to start revenge trading. A fast heartbeat or biting fingernails are a couple of examples. 
  • Step 3: Always follow your trading plan, no matter what. If you have a plan and strategy, you shouldn’t deviate from it because you’ve lost money. If you usually only risk a certain percentage on a trade, don’t risk more just because you’ve lost money, as this is likely to cause more loss. 

If you follow the above steps by clearing your head, determining what went wrong, and sticking to your usual self-given trading guidelines, you should be able to stop revenge trading without much effort.