0101Price action and swing trading methodologies per se provide a powerful way to operate in markets, but when they are complemented with average value analysis, you can start to “see” much more. The word “average” is synonymous with the word “average”, which is widely used in financial markets, including the stock market. However, this can be an important tool when used correctly. Mathematicians, Scientists, and Data Analysts usually use the power of the average in clinical trials, predictive analysis, and other applications to predict things. In this article what we want most is to show them how the power of simple average can be applied to your forex trading.
The Wisdom of Crowds: Average on Forex
The power of averaging comes to light when used with “crowd data”. Keep in mind, when analyzing a price chart, you’re looking at the average combined thinking of all traders in the market, who are being represented in the price. For example, do you know those quizzes about guessing the amount of candy in a jar? Most people will be far away from the actual number with their assumptions, some as much as 100 times above or below the actual amount. In fact, out of 160 people, only about 4 would approach the real value.
The interesting thing is that, even though no one usually gives the correct answer, “everyone” (as a group) comes up to a fairly close number. The typical scenario shows that when the amounts said by the public were averaged, the resulting number was something like 5,231.77 when the actual amount of candy inside the bottle was 5,240. This means that data collected from the entire public were able to accurately determine how many candies were in the bottle with a difference of 9 candies, which would be a margin of error of approximately 0.17%.
This example is quite amazing and shows the power of averaging. A Youtube channel did this experiment on the candy jar, letting people put their amounts in the comments. When the results were collected and averaged, the average was within 4% of the real value. Usually what happens is that people who overestimate are canceled by people who underestimate, which naturally filters out the bad estimates. What this shows is that you can collect everyone’s thoughts and average them to get something that is mysteriously close to real value.
Probabilities and averages should be the backbone of your risk management. Another unexpected place where averages play an important role is in our risk management plan. This will certainly have a consequence on the way you think and respond to your trading performance on a long-term basis. Many forex traders have difficulty making the switch and starting to think in terms of probabilities. Unfortunately, many people have their heads full of misinformation, contradictions, and paradoxes. For this reason, most new traders rank money management and capital preservation much lower than do experienced traders.
But the bottom line is that trading is a math game. You must understand the odds and statistics, and aim to stay on the right side of the numbers by exploiting your advantages in order to succeed. The advantage we teach in these items is to exploit recurring price patterns that continue to be repeated in the same way over time. Always keep in mind, there are a certain number of traders in the market at any given time, and they are doing the same thing over and over again to try to make money. This includes large amounts of “smart money,” such as investment funds and commercial companies that have the largest volume on the market.
This behavior repeatedly generates price action signals that we recognize and use to predict price movements. These signals of purchase or sale on average will behave in the same way as they have in the past, producing results that we can capitalize on. To make the most of the power of averaging, it is also advisable to apply positive risk-benefit ratios to the risk management of our operations, so that the “average” operation will have a profit. When you apply a 1:3 benefit risk ratio to your operations, you can lose 75% of them on average to keep your account in balance (neither win nor lose). In other words, you must win 1 out of 4 operations to maintain balance, or 1 out of 3 operations to earn money.
When you look at your recent operations, you may not see these numbers, but if you continue to apply this principle, the numbers eventually “stabilize” and represent what we are exposing. For example, you could have 4 consecutive operations that end up reaching the 1:3 target, which would be a total return of 12 R (12 times the risk). After this, you could suffer a drawdown period of 5 losing operations, but it wouldn’t really be a drawdown, because you’d still be up at 7 R. On the other hand, this could happen the other way around, losing operations might come first, giving you a -5 R as a result of a losing streak. But if the next 4 operations win, the situation changes completely and you end up with +7 R.
This is somehow to be expected because the market moves through good and bad conditions to make money for each system, and the losing and winning operations will tend to cluster as the market cycles happen. Start using the power of positive risk-benefit ratios and eventually you’ll see the results. All this is true if we assume that you have an advantage in your trading system, such as using price action.
How Most Common Indicators Work
We could stay here and tell you how useless we think the indicators are, but you’re human and your curiosity will force you to explore them for yourself for sure. This is completely understandable, sometimes you need to explore them to remove any remaining doubts in your head about what you might be losing. This way you can know exactly what the indicators are and decide from your own experience whether they are for you or not. When you insert indicators to your charts, they usually expose your data in the form of a line chart or histogram. The indicator is like a “black box” that does the hard work internally.
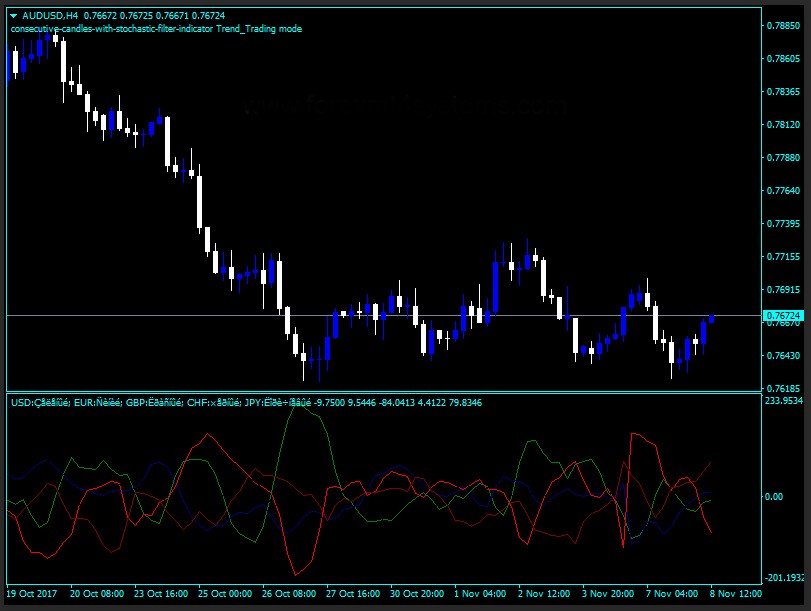
Would it surprise you if we told you that most common indicators are just a combination of price action data and mathematical averages? Well, it is true. Indicators such as stochastic, ADX, and CCI use the maximum, minimum, and closing prices of candles and pass them through averaging formulas. The ADX recycles its own data through multiple layers of averages.
The ADX is designed to quantify a trend by a certain numerical value. The result is that, if the value is too high, the trend will be more powerful. Here you can see how in the USD/SDG pair we have had this beautiful trend, but the ADX only showed a really confusing graph of lines that does not seem to correlate with the strength of the trend, or stability.
There are some custom indicators going around, which are actually joining multiple indicators within one, in an attempt to develop an extraordinary hybrid indicator. That is why it is well known that indicators have such a horrible natural mismatch. Some are notoriously worse than others, because every time you average data, the end result responds much more slowly to the real movement of prices. When you look at what is happening within most indicators, they are actually just a game with price action data, which are passed through some mathematical averaging calculations, it is not a big deal, just the same type of data but shown in different ways. This could be an advantage for some, but several of us would be frustrated with the performance of the indicators.
It is true that some indicators can work well under specific conditions for short periods, mostly in highly biased markets; but on the other hand, these indicators will give the trader a lot of poor quality buying and selling signals during conditions that are out of the optimal market behavior for which they were designed, and this could be as much as 80% of the time.
Presenting the Average Value Analysis
This is the basis for the analysis of the average value, the study of the price relative to its average value. We use average value analysis to help us determine many things in a price chart, such as:
- The direction of the trend
- Strength and momentum of the trend
- Stability of the market
- Signs of climax/exhaustion
- Ideal points of purchase and sale
- On Price Extension/Opportunities Reversion Operations to Average
The middle-value properties help the trader quickly remove noise, presenting a “summary” that you can use to quickly measure conditions at first sight, and help you make smart trading decisions. But of course, the analysis of the average value is not the only aspect that makes a good sign of trading. This along with price action and swing trading work synergistically with each other to create a powerful trading methodology that helps you read the graphics.