Categories
Forex Money Management

Effective Strategies For Financial Leverage That You Can Use Starting Today

We’ve already talked about leverage in other articles, and we’ve given a very precise explanation of what it is and how it works. Today begins the most interesting, Is the leverage good? Is it bad? Is it true that it ruins all traders? We’re going to find out what’s behind all the doubts and myths about financial leverage.

To do so, I will cite the phrases and opinions that I have been able to collect from the Internet.

“Leverage multiplies your losses.”

This phrase is not true, the 1:100 leverage allows me to operate as if I had 100 times more capital than I have, but this does not imply that I use all my credit to gamble on the stock market.

Effectively if I use all my buying potential in a single trade and I lose it I will be ruined, but never (go or not leveraged) you must play more than 1-2% of your trading account and only in a trade, if you are a daytrader then 1% is already quite risky to my understanding.

For example, I have created a 1:100 leveraged $1000 account (I have credit up to $100,000) but as a sensible trader, I don’t want to gamble more than 1% on my next trade. 1000$ * 1% = 10€

On Forex accounts you can play from 1 micro lot, then the value of each pip is 0.10$. So $10/ $0.1 would allow me to put the Stop Loss up to 100 pips away, but from here I should accept losses greater than 1%. As you can see a daytrader with a Stop Loss at about 30 pips can play 0.3% of his account and at the same time be leveraged 100 times.

“Leverage is what will make you rich.”

NO, of course not. Leverage is a very useful way to enter the stock market with little capital and be able to diversify your account better but to gain the important thing is your constancy, practice, constructive self-criticism, and positivity in front of the market.

“People without leverage work for those who do have leverage.”

I don’t think so, people without leverage look for the long term and they help themselves from the liquidity that we provide intraday and short-term traders to enter the market with better conditions and with more security. Leveraged traders tend to focus on the long term and rarely affect leverage.

“People with leverage work for those who are not.”

In the sense that short-term traders give liquidity to the market, yes, I have no doubt. But in a “we earn the money they lose” sense of course not! If Buffet had leveraged 3 times, today it wouldn’t be 3 times richer; it would be ruined. And the phrase is right. According to Warren himself:

“Unless you can see your stock drop 50% without causing a panic attack, you shouldn’t invest in the stock market.”

Obviously, no one who thinks like that should use leverage, if you don’t know how far you are going to take the losses you should seriously consider using leverage. On the other hand, to a short-term investor, the leverage comes from fable, in fact, there are professional traders who are dedicated to looking for commissions in exchange for giving liquidity to the market (the so-called rebates). These traders charge for every trade they open and usually look for 0 to 2 market ticks, no more. The leverage they use can reach 1:1000 without problems.

Well-used leverage means that a person with knowledge, work, and understanding of markets can come up with a very large portfolio that would otherwise be impossible. Personally, I want to highlight an interesting phrase that I have read:

“It’s not the bullet that’s dangerous, but the speed it’s carrying.”

In my humble opinion, this is not exactly so. The velocity of the bullet is not the key, it is the use you give it. If you’re a hunter who uses the bullet to feed the family, you’ll be using this speed to not die and still be alive. If you’re unconscious and you’ve never been taught to use a gun, you’re going to accidentally shoot yourself in the foot and complicate your life.

In trading the same happens, a bad trader is short and long term, the only difference is that in the short term you will take less time to make 100 trades and be out. In the long run, your agony can last 2-3 years and hopefully a bullish market can make you believe you’re good for a while… Then things like this happen…

“The problem with leverage isn’t speed, it’s how we use it.”

In summary, leverage can help you in the short term to operate in multiple markets at once without putting your personal economy at risk. You can diversify your portfolio better and have absolute control of risk. You can make interesting profits with much less capital and the same level of risk, but be careful, you need many hours of experience and rational use of leverage.

In the long run, leverage is only a good ally if you use a guaranteed Stop Loss and have a clear strategy. If you rely on buying and enduring (because of course, we all know that someday this will rise), then leverage will be your worst enemy.

From here on, everyone draws their own conclusions, we hope that with this article we have brought a little more light to leverage and that we have all taken a positive part of this debate.

Categories
Crypto

What The Experts Aren’t Saying About Forex Vs Crypto Trading

While brokers have always offered the ability to trade in most major and minor currency pairs, the cryptocurrency boom that occurred in 2010 caused many brokers to make the decision to add the most popular currency pairs like Bitcoin, Ethereum, Tether, and Ripple to their offerings. This opens up a world of opportunities to traders that want to invest in both while remaining convenient where you can open one trading account and access both options through most brokers. However, some traders may not completely understand the difference between currency pairs and the somewhat newly introduced cryptocurrency options. Online myths even suggest that cryptocurrency has no real value, which causes some traders to stay away. Regardless of what you’ve heard, you might be wondering which is better to invest in for the year 2021 – the timeless forex pairs, or the newer cryptocurrency options.

What is Forex?

The forex market is a global online foreign exchange market where the exchange rate of two different currencies is quoted and traded against each other. Major currencies include options like the US dollar, the Euro, the Japanese Yen, and the British Pound. When the US dollar is crossed with the Japanese Yen, it is written as USDJPY, while the US dollar crossed with the Euro is written as EURUSD, and so on. You can also trade minor currency pairs, which include any major pair that is not paired with the US dollar, along with exotic pairs from less established countries. Here are a few examples of exotic currencies:

  • The Norwegian Krone
  • The Hungarian Forint
  • The Russian Ruble
  • The South African Rand

When it comes to trading forex, there are pros and cons to think about. Forex involves fiat currencies that are managed by central banks, which typically aim to keep stable exchange rates for their currencies where possible. This makes the forex market less volatile, but traders also need to remember that prices are highly affected by global events. Elections, economic data releases, changes to central bank policy, and macroeconomic events can cause the market to become more volatile. While the forex market is more stable than the cryptocurrency market, it is still unpredictable at times.

Forex trading is also considered to be attractive because brokers are able to offer their services for a relatively low trading cost. Typically, brokers make their profits by charging spread and/or commission on a round trip trade. The average cost of trading the benchmark pair EURUSD is usually around 1 to 1.5 pips, making the cost to trade around 0.08% of the value of the asset being traded. This is significantly lower than the cost of trading cryptocurrency. 

The forex market is also widely available for trading, as market sessions generally go from Monday morning until Friday evening. This is divided into three major sessions: 

  • American
  • European
  • Asian

The wide market hours offer traders greater flexibility when it comes to trading opportunities, although it’s important to remember that the sessions dominated by New York, Tokyo, and London are considered to present the greatest opportunities to trade.

What is Cryptocurrency?

Cryptocurrency includes online digital currencies that work differently than real money does. While you can’t exchange cryptocurrency for goods or services the way that you can with cash, the digital currency holds value and can be exchanged for real money that can then be used to purchase those goods and services. Some examples of the most popular cryptocurrencies include Bitcoin, Ethereum, Tether, and Ripple. Some of these are created by private individuals, while we can thank banks and other companies for the creation of some cryptocurrency as well. Satoshi Nakamoto created the most well-known cryptocurrency Bitcoin in 2009 to provide a decentralized payment network that could offer peer to peer payments without relying on central banks. While there is still some speculation about whether cryptocurrency is a good investment, it’s important to know that the crypto market is approximately two-thirds the size of the forex market and growing. As we head towards the future, more individuals and banks will likely invest in it.

When it comes to investing in cryptocurrency, you have two options: you can use a major cryptocurrency exchange like Coinbase to buy a real cryptocurrency and hold onto it, or you can invest in cryptocurrency through most major brokers. If you purchase the cryptocurrency through an exchange, you’ll probably wind up paying commissions and fees, while you’ll have to worry about swap fees for holding crypto positions overnight if you choose to invest through your broker. If you want to make a long-term investment, it would be better to do so through an exchange.

Wondering if there are any major downsides to investing in cryptocurrency? Unfortunately, it does cost more to trade cryptocurrency as opposed to forex. Remember when we talked about the average price of trading the pair EURUSD? It costs about five times as much to trade the major cryptocurrency Bitcoin, which has an average exchange rate of 0.40% versus the 0.08% we mentioned earlier. 

Cryptocurrency can also be more susceptible to volatility in the market. In addition to being affected by global events, they are also at high risk of volatility from events that occur in their own market. For example, the Bitcoin halving effect had a major impact on the market. These wide price fluctuations can work for you or against you – as they offer an opportunity to make a large profit, but the risk can be dangerous.  Many brokers limit the leverage that can be used when trading crypto pairs to 1:2 because of the high risk associated with trading them. Another plus to trading cryptocurrency comes in the form of more flexible market hours, with trading opportunities on the weekend as opposed to typical weekdays. 

The Bottom Line: Which is Better?

Above, we explained the most important points for forex and cryptocurrency. Below, we will break it all down into categories so that you can personally decide which is better to trade. 

  • When it comes to the cost of trading, forex wins by a landslide. While it costs about 0.08% of the value of EURUSD to trade, you’ll pay approximately 5 times as much to trade Bitcoin.
  • Bitcoin offers more flexible market hours, including weekdays and weekends, while forex traders can’t trade on the weekend. It’s also better to trade forex during certain market sessions.
  • Most brokers offer all major currency pairs, along with a good selection of minors and sometimes exotics. Lately, more brokers have added cryptocurrencies to their offers, but you may be limited to the most popular options. 
  • Both forex and crypto have prices that are driven by microeconomic factors, but crypto is far more volatile because it is also affected by issues within its own market.
  • Forex traders can access much higher leverage than crypto traders because brokers consider forex pairs to be much more stable. Some brokers offer leverage as high as 1:1000 or more, while crypto traders are often limited to a 1:2 leverage.
Categories
Forex Fundamental Analysis

Foreign Securities Purchases Impact on Forex Currencies

Introduction

For the longest time, the performance of a country’s financial and capital markets has been touted as an indicator of economic health. On the other hand, foreign investors’ participation in the local financial and capital market can be taken as a sign of confidence in the local economy. Therefore, monitoring foreign securities purchases can be used as a gauge of investors’ confidence in the local economy.

Understanding Foreign Securities Purchases

Foreign securities purchases measure the involvement of foreigners in the domestic financial and capital markets. It includes the value of local bonds, stocks, and money-market assets bought by foreigners over a particular period.

The financial market is considered the backbone of any economy. Every sector of the economy is interconnected with the financial market, not just by transactions. Companies, businesses, and governments use the financial and capital markets as a source of funds. Through IPOs, companies can raise funds that will be used for business expansions. Governments issue bonds and treasury bills in the money markets, which are used to fund government expenditures. In the secondary markets, however, these financial assets’ prices tend to reflect investors’ sentiments.

Therefore, foreign investors’ level of participation in the local financial markets can be used as a leading indicator of economic sentiment.

Using Foreign Securities Purchases in Analysis

Primarily, the data of foreign securities purchases shows foreign interest in the domestic economy. This data has various applications to government agencies, investors, and even forex traders.

The stock and money markets are driven by sentiment. The basics of how the financial market works is that; you buy a financial asset when prices are low and sell when prices are high. For example, in the stock markets, the price of a company’s stock is tied to its financial performance. So, when its performance is well, the share price will rise, and when the performance is deteriorating, the share price will fall. Another critical factor that drives the fluctuation in share price is a sentiment about the company’s performance.

When traders anticipate that the company will have a windfall – either increased demand for its core products or the launch of a new product line – the share price will rise. The rise in the share price is driven by the fundamental laws of demand and supply. The price will rise when there is an increased demand from investors to buy the shares, which means that those buying exceed the number of those selling. The price will fall when investors are selling the shares, which increases its supply relative to those demanding to purchase it.

Using this aspect of the stock markets, when foreign investors flood the domestic market to purchase shares, it means that they anticipate that the companies will perform better soon. As we have explained, a better financial performance by a company could result from increased demand for its products or expansion in business operations.

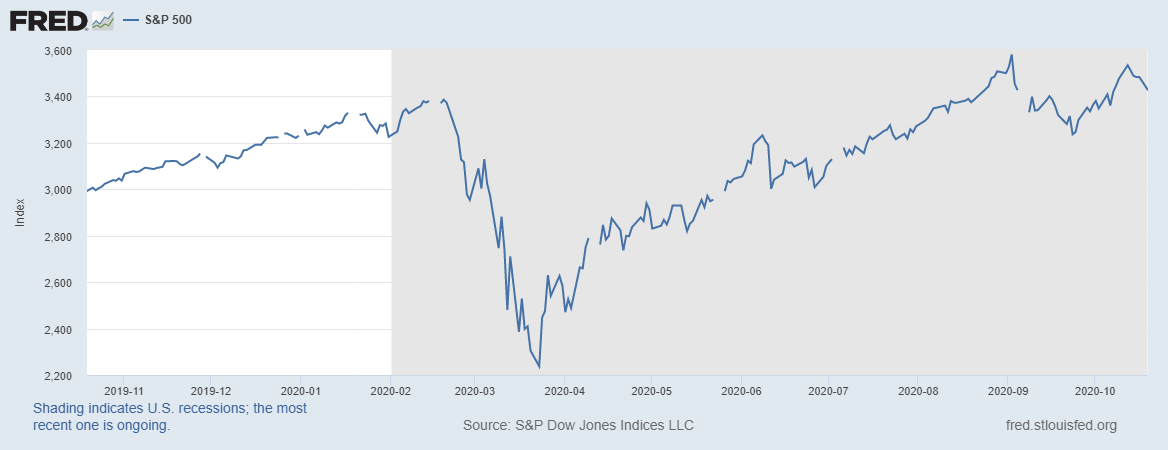
Since the stock market is forward-looking, increased buying activity can be interpreted as a vote of confidence that economic conditions are going to improve. Let’s take the example of the S&P 500. On October 19, 2020, the index closed just above 3400 from lows of 2237 on March 23, 2020, at the height of the Coronavirus pandemic.

Therefore, a rebound in the stock markets can be taken as a sign that investor confidence is increasing and improving economic conditions.

Source: St. Louis FRED

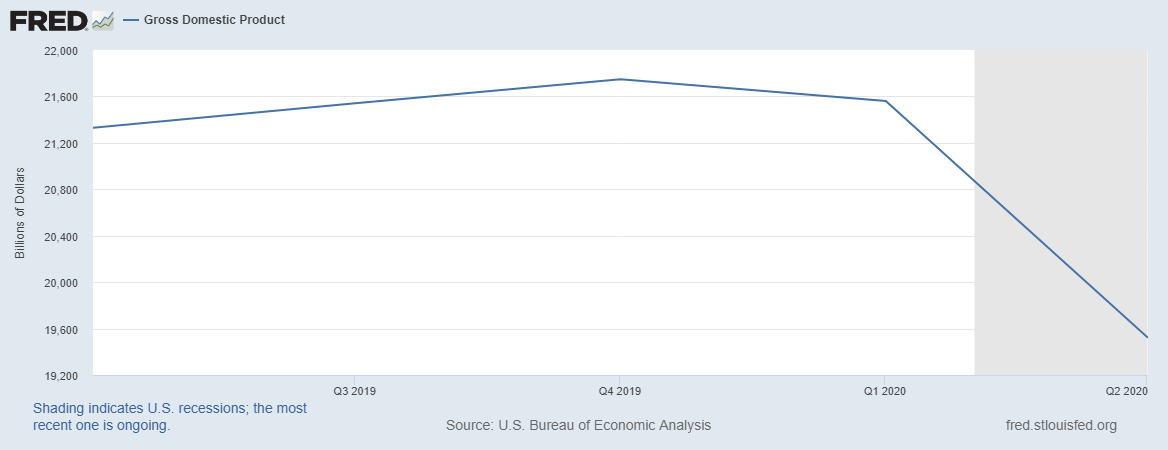
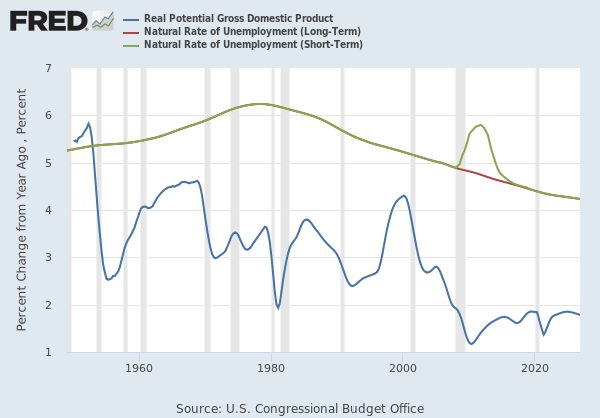
However, note that there is a disconnect between the GDP and the performance of the stock market. Most people tend to make the mistake of assuming that the growth of the stock market is synonymous to an increase in the GDP. While this might be true in some cases, it is purely coincidental, because the stock market is only one component of the economy. While the economy’s growth tends to encompass all aspects ranging from the growth of the labor market to household consumption, the stock market is majorly a reflection of corporate profits. For example, while the S&P 500 recovered from March to October 2020, the GDP was on a steady fall.

Source: St. Louis FRED

The other way foreign securities purchases can be used for analysis is through the purchases in the money markets, especially government bonds and treasury bills. When foreigners swam the domestic market to purchase government securities, it can be taken as a sign that the domestic economy is offering better returns compared to other international economies.

Furthermore, increased foreigner participation in the domestic money markets can be taken as a sign that the local economy is regarded as a safe heaven. It is a vote of confidence that the domestic economy is stable and comparatively less volatile, which means that their investments will receive a steady return and no chances of an outright loss of capital.

Impact on Currency

As a leading indicator of economic sentiment, foreign securities purchase data can show what investors think about economic recoveries. When the foreign securities purchases increase in times of economic recessions or slump, it can be taken as a vote of confidence by the investors that the economy will rebound in the near term. The logic behind this is that no one would want to invest in an economy bound to fall or one that has no signs of recovery. In such an instance, the currency will appreciate.

Similarly, the local currency will appreciate relative to others since an increase in foreign securities purchases implies that the domestic economy offers better returns. These higher returns could be a direct result of higher interest rates. Higher interest rates mean that the local currency will appreciate.

Conversely, when the foreign securities purchases data is on a decline, it shows that investors are fleeing the domestic economy. They can either get better returns on investment in other economies or believe that the local economy is headed for rough times. In this case, the local currency will depreciate relative to others.

Sources of Data

Statistics Canada collates and publishes foreign securities purchases data in Canada. The data published is of the prior two months. A more in-depth and historical review of the foreign securities purchases in Canada is available at Trading Economics.

How Foreign Securities Purchases Data Release Affects Forex Price Charts

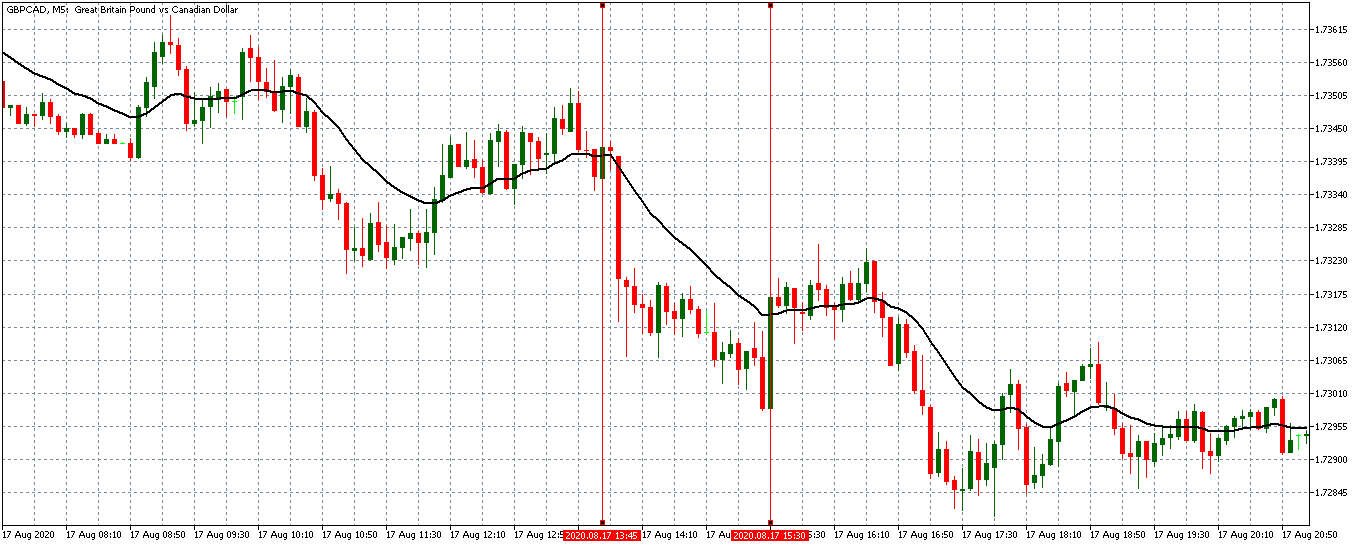
For this analysis, we will focus on the August 17, 2020, release of the foreign securities purchases data at 8.30 AM EST. The data can be accessed from Investing.com. Moderate volatility is expected when the data is released.

In June 2020, Canada’s net foreign securities purchases were -13.52 billion compared to 22.39 billion in May 2020.

Let’s see what impact this release had on the CAD.

GBP/CAD: Before Foreign Securities Purchases Release on October 17, 2020, 
Just Before 8.30 AM EST

From the above 5-minute GBP/CAD chart, the pair was trading in a steady downtrend before the release of the data. The 20-period MA was steeply falling with candles forming further below it. This trend shows that the CAD was strong during this period.

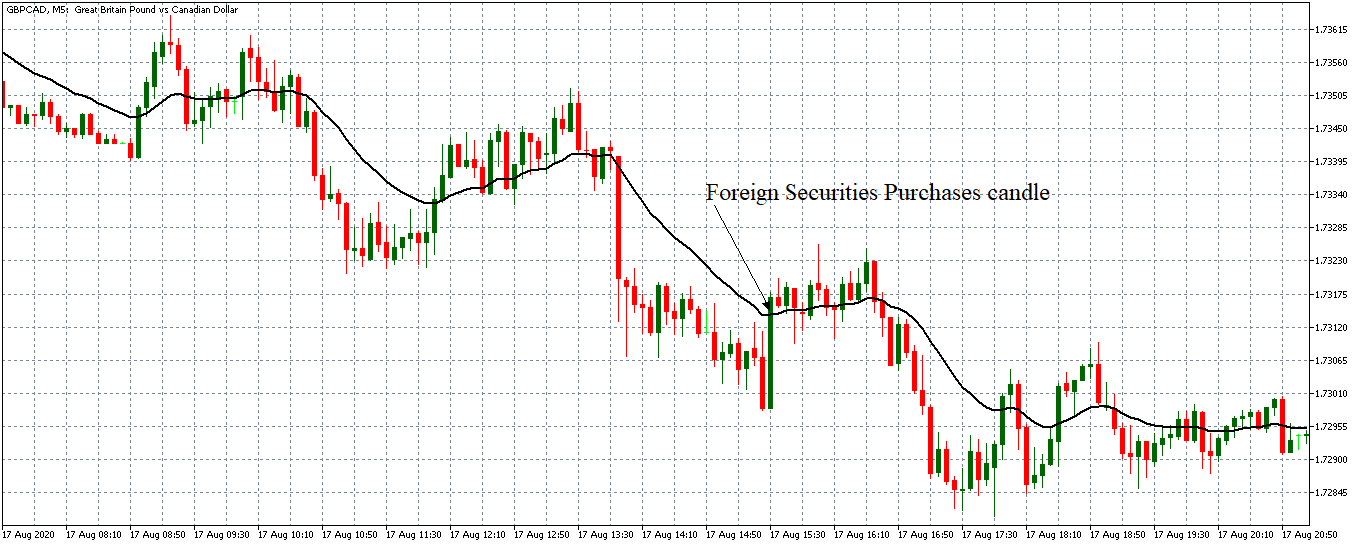
GBP/CAD: After Foreign Securities Purchases Release on October 17, 2020, 
at 8.30 AM EST

The pair formed a long 5-minute candle upon the release of the data. As expected, the negative net foreign securities purchases in Canada resulted in the weakening of the CAD. Subsequently, the pair traded adopted a subdued uptrend with the 20-period MA slightly rising and candles forming just above it.

Bottom Line

The foreign securities purchases data is a moderate-impact economic indicator. Since it only serves to show investor confidence in the economy, it does not result in high volatility when released. Cheers!

Categories
Beginners Forex Education Forex Basics Forex Psychology

Achieve Total Forex Competence in These 4 Simple Stages

The “four stages of competence” psychology model was created by management trainer Martin Broadwell back in 1969. It is used to describe the different kinds of psychological states one goes through when progressing from incompetence to competence with a skill. While this widely popular psychological guideline can be applied to a variety of different skills, it is especially useful when describing what one goes through on the journey from a forex novice to a truly competent trader. Stay with us as we explain each of the four stages and how they apply to traders.  

Stage 1: Unconscious Incompetence

This stage is simply a fancy way of saying that you don’t know much about what you’re doing, which applies to pretty much any skill you try for the first time, from playing an instrument to opening a trading account. Even if you have some trading activity under your belt, you’re likely still in this stage if you haven’t done much research and don’t put much thought into what you’re doing. Maybe you made a big bet and won so you keep it up, without realizing that your winnings are due more to coincidental luck than they are to your own competence of trading. You might even have the mindset that trading is easy because you don’t fully understand everything that goes into making smart trading decisions just yet.  

Stage 2: Conscious Incompetence

In this stage, you might actually realize that trading is harder than you thought. Perhaps simply reading this article has brought you to the stage of conscience incompetence! You still aren’t very knowledgeable about trading in this stage, but this is where you admit that and start making an effort to learn more about what you’re doing. When it comes to trading, you might pay more attention to fundamental or technical analysis, test different indicators, start keeping a trading journal and spend more time doing general research about trading. As you progress through this learning stage, you should be able to find a strategy that actually works for you before moving on to the next stage of competence. 

Stage 3: Conscious Competence

By the time you reach this stage, you will have spent enough time learning and testing out strategies to have a good idea of what does and doesn’t work for you. This doesn’t mean you’ve achieved perfection, but you likely have a detailed trading journal right beside you with an idea of different profitable strategies you could use and you’ll have implemented risk-management rules you intend to follow. While you may have issues following these rules exactly, this stage is about progress and you should be able to keep a clear head when losing trades while understanding that consistent execution is better than simply winning trades. During this stage, you may put in extra thought and overanalyze things in an effort to make better trading decisions. 

Stage 4: Unconscious Competence

Once you reach this stage, you’ll switch into autopilot when you’re trading. Think of when you first started driving, how you were probably aware of your exact speed or how you had to remind yourself to turn on your car’s headlights at night. Later on, you become so used to driving that you switch on your headlights without consciously thinking of it or you look down and realize you’ve been speeding without realizing it. This stage of trading works in the same way – you can identify trends and patterns efficiently without much thought, you get good or bad feelings about trades that you should enter, and you know when something needs to be changed when it comes to your strategy. At this point, you don’t have to put conscious effort into trading because it comes to you naturally. However, you should remember that a trader’s work is never done, so don’t make the mistake of assuming that you’ve mastered trading once you reach this stage. Never stop pursuing knowledge and don’t make the mistake of becoming overconfident. 

Now that you’ve learned about the four stages of trading competence, which stage do you think you fall under? Perhaps this can shed some light on what you need to do as a trader to move on to the final stage.

Categories
Forex Fundamental Analysis

The Impact of ‘Gross Domestic Product Estimate’ Economic Indicator On The Forex Market

Introduction

In most economies globally, the GDP data is published by governments or government agencies quarterly. This would mean that analysts, economists, and households would have to wait for a full quarter to know how the economy is performing. Naturally, this long wait can be frustrating and, in some cases, inconveniencing. Therefore, having some form of estimate as to what the GDP might be can be quite useful.

Understanding Gross Domestic Product Estimate

As the name suggests, the GDP estimate serves to estimate an economy’s GDP before the release of the official government-published GDP report.

These estimates are arrived at by surveying the industries within the country. In the UK, for example, the following industries are surveyed; production, manufacturing, mining and quarrying, agriculture, construction, private services, and public services. Most estimates adopted globally use the bottom-up methodology.

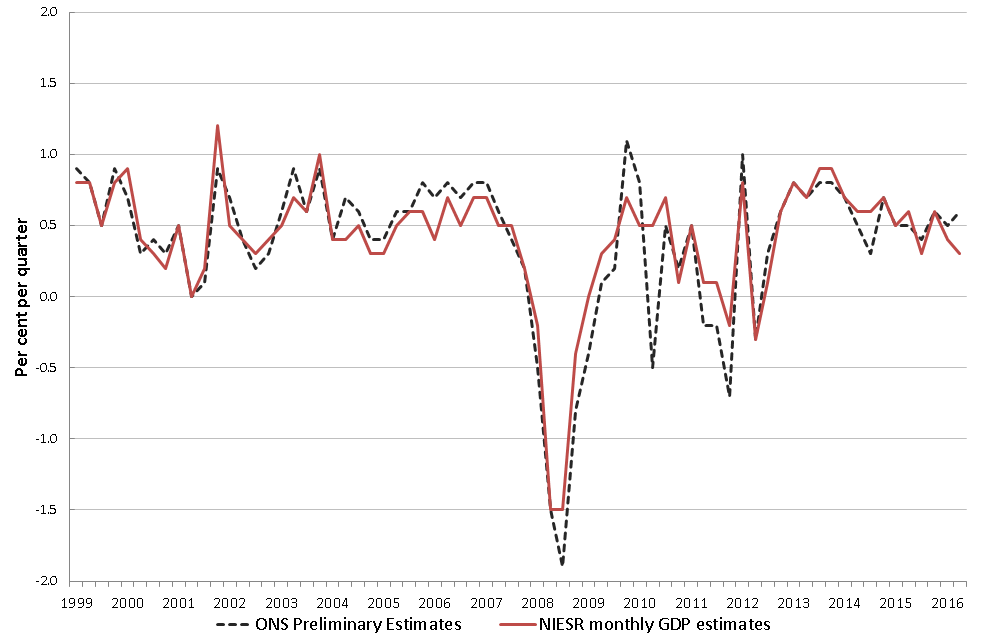
Source: National Institute of Economic and Social Research

In the UK, the National Institute of Economic and Social Research (NIESR) publishes a rolling monthly estimate of the GDP growth using the bottom-up methodology. Hence, its GDP estimate covers the preceding three months. Since the GDP estimates are published monthly, it means that NIESR releases at least four GDP estimates before the government’s publication. Using the bottom-up analysis to estimate the GDP, NIESR uses statistical models to aggregate the most recent trends observed within the GDP subcomponents. The statistical models are fed the latest trends, and they forecast the most probable outcome in these subcomponents. Note that these forecasts are only short-term.

While the GDP estimates are not always accurate to the exact decimal percentage, they provide an accurate GDP representation.

Using the Gross Domestic Product Estimate in Analysis

The GDP estimate data can be used in the timely analysis of economic performance. Here is how this data can be used.

In many countries, the macroeconomics policies are usually set more frequently than quarterly. However, since the economic performance is the centerpiece in any macroeconomic policy-making, it is vital to know the most recent GDP data. By tracking the trends of the top components of the GDP, the GDP estimates can provide the most recent data. Therefore, this will help the policymakers to implement more informed policies. Let’s see how the contrast between the GDP estimate and the actual GDP can make a difference in policy implementation.

For example, during the second quarter of 2020, governments and central banks wanted to implement expansionary fiscal and monetary policies. At this point, the only GDP data available to them is the actual GDP for the first quarter of 2020. But for most economies, the 2020 Q1 GDP showed economic growth. On the other hand, the more recent GDP estimates could show that contractions were already visible in the economy.

In this scenario, if policymakers were to use the actual data available to then – the Q1 GDP – they would have made undesirable policies. These policies would have further harmed the economy. On the other hand, if the GDP estimates would have been used to aid the policy implementation, chances are, the most suitable and appropriate monetary and fiscal policies would have been adopted. Here, the GDP estimate would have helped them make relevant policies and ensuring that these policies are implemented timely.

Furthermore, the GDP estimates can also be used to establish whether the policies implemented are working as expected. If expansionary policies are implemented, their primary goal is to spur demand and stimulate economic growth. Using the GDP estimate, policymakers can track to see if there are any changes experienced in the economy. Some aspects like inflation take a long time to adjust, but demand generated by households is almost instantaneous. Therefore, the GDP estimate can be used to gauge the effectiveness of the implemented policies. Take the stimulus packages adopted in Q2 2020 after the pandemic; they were meant to stimulate demand by households, which would lead to economic recovery. With the GDP estimate, we could tell whether the stimulus package worked or not.

When accurate, the advance GDP estimate can be a leading indicator of the actual GDP. Therefore, the GDP estimate data can be used to show the prevailing trends in the economy. For instance, it can be used to show looming periods of recession and any upcoming recoveries. Say that the trailing three months captured by the GDP estimate shows that the economy’s major subcomponents are struggling with demand and contracting. This data can be taken to mean that for that quarter, there is a higher probability that the overall economy would contract. Conversely, when the subcomponents being tracked show growth, it can be expected that the overall economy would have expanded in that quarter.

It’s not just the governments that can benefit from the GDP estimate data. The private sector as well can use the data to plan their economic activity. Take the example that the GDP estimate shows that a particular sector in the economy has been contracting for the previous three months. Investors in this sector can presume that the demand for goods or services from the sector is depressed. In this instance, to avoid venturing into loss-making businesses, investors can make informed decisions about where and when to invest their money.

Impact on Currency

When the GDP estimate shows that the short-term economy is expanding, the domestic currency will appreciate relative to others. A short-term expansion indicates that demand levels in the economy are higher, which implies that unemployment levels are low and households’ welfare is improving.

The domestic currency will depreciate if the GDP estimate shows that the economy is contracting. The primary driver of a contracting economy is decreased expenditure by households contributing almost 70% of the GDP. The decline in demand can be taken as a sign of higher unemployment levels.

Sources of Data

In the UK, the National Institute of Economic and Social Research publishes the monthly and quarterly UK GDP estimate.

How GDP Estimate Release Affects The Forex Price Charts

The most recent UK GDP estimate published by NIESR was on October 9, 2020, at 11.10 AM GMT and accessed at Investng.com. Moderate volatility on the GBP can be expected when the NIESR GDP estimate is published.

During this period, the UK GDP is estimated to have grown by 15.2% compared to 8.0% in the previous reading.

Let’s see how this release impacted the GBP.

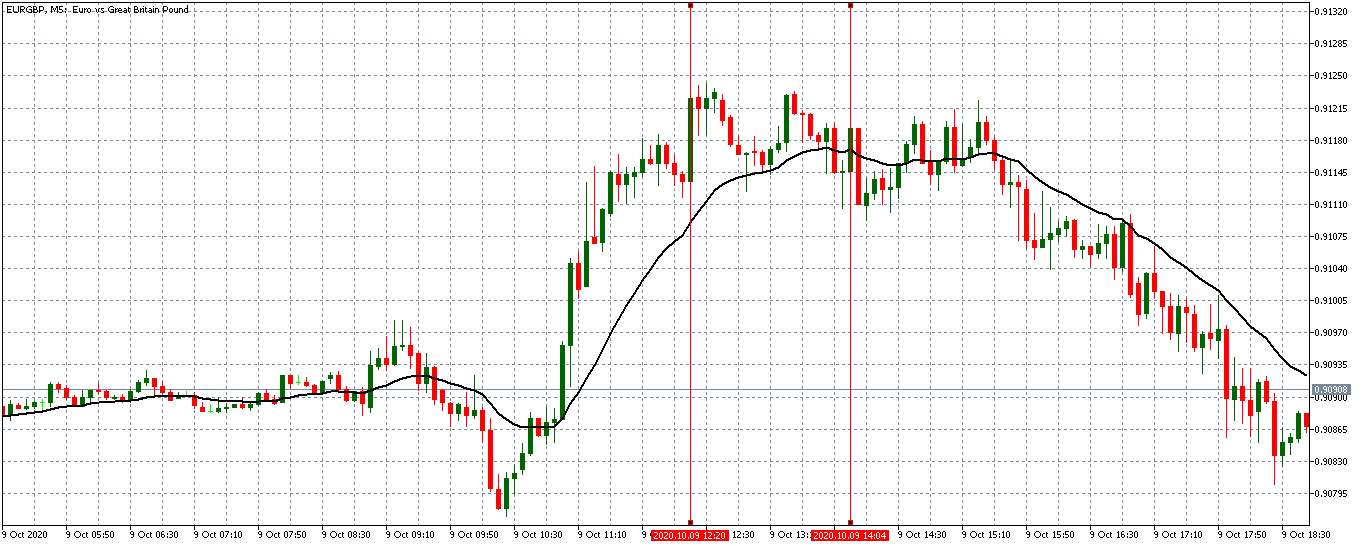
EUR/GBP: Before NIESR GDP Estimate Release on October 9, 2020, 
just before 11.10 AM GMT

Before the release of the NIESR GDP Estimate, the EUR/GBP pair was trading in a subdued uptrend. The 20-period MA transitioned from a steep rise to an almost flattened trend with candles forming just above it.

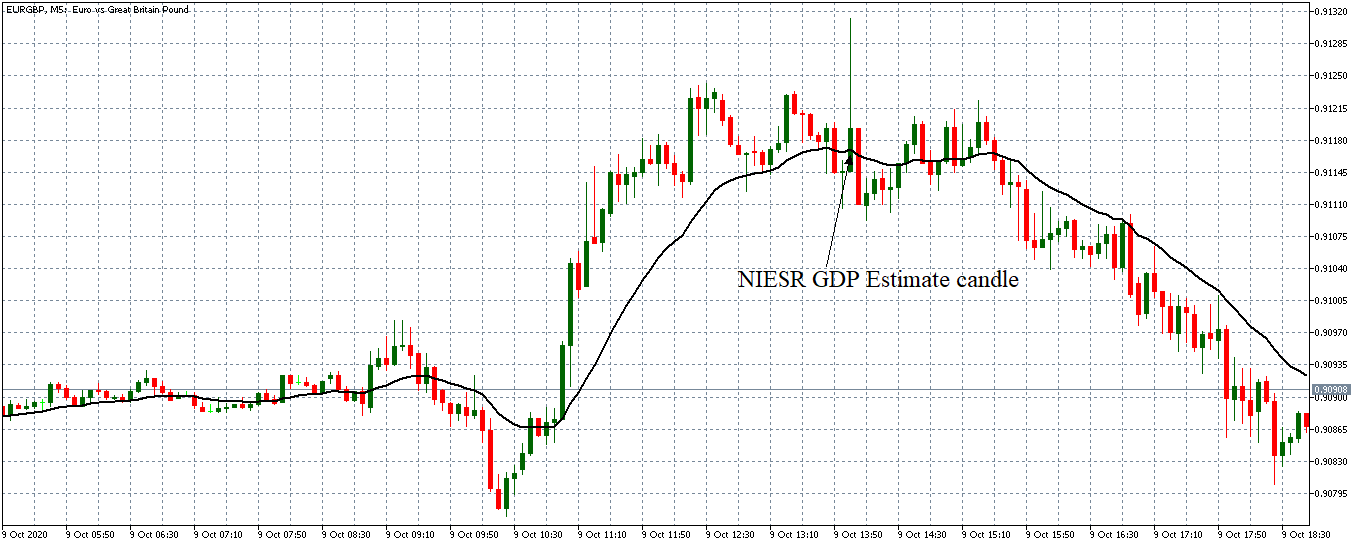
EUR/GBP: After NIESR GDP Estimate Release on October 9, 2020, 
at 11.10 AM GMT

After the GDP estimate release, the EUR/GBP pair formed a 5-minute bullish ‘inverted hammer’ candles with a long wick. This candle represents a period of volatility in the pair as the market absorbed the data. Subsequently, the pair traded in a neutral trend before adopting a steady downtrend with the 20-period MA steeply falling.

Bottom Line

The GDP estimate is not just relevant to investors and policymakers; as shown by the above analyses, it can result in periods of increased volatility in the forex market when it is published. Cheers!

Categories
Forex Course

169. Which Trading Timeframe Should I Choose?

Introduction 

In the previous lesson, we covered how to trade multiple timeframes in the forex market. So, what timeframe should you choose to trade?

The timeframe you chose to trade will be entirely determined by the type of forex trader you are. Therefore, in this lesson, we will cover the timeframe to trade depending on the type of forex trader you are, i.e., position trader, swing trader, day trader, or a forex scalper. It is worth noting that you should consider trading three timeframes in Forex.

Timeframes for a Forex Position Trader

If you are a forex position trader, it means you intend to have your trading position open for several months to years. Therefore, you should trade the monthly and weekly timeframes. These frames give you a long-term perspective of the market trend while filtering out the hourly and daily “noises” of the price spikes.

Timeframes for Forex Swing Trader

For a forex swing trader, your goal is to have your positions open overnight to just a few weeks. With such a strategy, while performing your multiple timeframe analysis, you should start with the daily timeframe to establish your selected currency pair’s dominant trend.

On the chart, the daily timeframe will cover several weeks, which will help you establish the support and resistance levels over this period. With this perspective, you will quickly identify the high and low extremes. Narrow down to a 12-hour timeframe to see if this timeframe lines up with the observed trend, then finally use the 4-hour timeframe to find the entry point for your trade.

Timeframes for Forex Day Traders

If you are a forex day trader, that means you enter and exit all your trades within 24 hours. In this case, you should trade the 4-hour, 1-hour, and 15-minute timeframes. With the 4-hour timeframe, you will be able to establish the support and resistance levels for the past few days for your selected currency pair. The 1-hour timeframe will help you identify if the intra-day price trend aligns with the observed dominant trend. Finally, the 15-minute timeframe will enable you to narrow down the best entry and exit points for your trades, depending on the current price trend.

Timeframes for Forex Scalpers

For the forex scalpers, the smallest minute-by-minute price spikes count. Therefore, you should trade the 30-minute, 15-minute, and 5-minute timeframes. With the 30-minute timeframe, you get to identify the prevailing short-term trend with the selected currency pair. The 5-minute timeframe narrows down the tend to show how the most current price spikes build-up to the short-term trend. This timeframe also serves as your trigger timeframe for entry and exit.

[wp_quiz id=”89150″]
Categories
Forex Market Analysis

Daily F.X. Analysis, November 05 – Top Trade Setups In Forex – Eyes on U.S. Election Results! 

On the news front, the eyes will remain on the outcome of the U.S. elections, although Joe seems to be the next president of the United States considering the voting lead against Trump so far. Besides, the Monetary Policy decision from the Bank of England will remain in highlights. The BOE isn’t expected to make any changes in the policy; however, the press conference will be worth watching. The muted impact is expected on the news. Lastly, the Unemployment Claims from the U.S. may support the U.S. dollar today.

Economic Events to Watch Today  


EUR/USD – Daily Analysis

The EUR/USD pair was closed at 1.17227 after placing a high of 1.17706 and a low of 1.16025. After falling to its lowest since mid-July, the EUR/USD pair reversed and started to rise and ended Wednesday with gains. The EUR/USD pair has been having a highly volatile week so far as uncertainty around the U.S. 2020 Presidential Election intensifies. Results have been tighter than the market’s expectations, and investors felt hesitant to sell the safe-haven U.S. dollar.

On Wednesday, the U.S. dollar rally kept the EUR/USD pair under pressure and made it hard to sustain gains Wednesday as both share a negative correlation. Moreover, the Eurozone’s coronavirus situation also worsened as the pandemic’s second wave raised across the bloc and forced many major economies, including Germany and France, to re-introduce fresh restrictions and lockdown measures.

In turn, the ECB has been signaling that it could introduce a new monetary policy stimulus that only added in the weakness of Euro currency and kept the gains in EUR/USD pair limited on Wednesday.

On the data front, at 13:00 GMT, the Spanish Unemployment Change for October came in as 49.6K compared to the previous -26.3K. At 13:15 GMT, the Spanish Services PMI for October raised to 41.1 from the forecasted 40.0 and supported Euro and added further in EUR/USD air’s gains. AT 13:45 GMT, the Italian Services PMI for October declined to 46.7 against the forecasted 47.4 and weighed on Euro.

 At 13:50 GMT, the French Final Services PMI remained flat at 46.5. At 13:55 GMT, the German Final Services PMI raised to 49.5 against the forecasted 48.9 and supported the single currency Euro. At 14:00 GMT, the Final Services PMI from the whole bloc for October also surged to 46.9 against the forecasted 46.2 and supported the single currency Euro and added further upside momentum to EUR/USD pair.

From the U.S. side, at 18:15 GMT, the ADP Non-Farm Employment Change for October dropped to 365K against the estimated 650K and weighed on the U.S. dollar that added strength to the upward momentum of the EUR/SD pair. At 18:30 GMT, the Trade Balance from the U.S. for October came in line with the expectations of -63.9B. At 19:45 GMT, the Final Services PMI for October surged to 56.9 from the projected 56.0 and supported the U.S. dollar and capped further gains in EUR.USD pair.

At 20:00 GMT, the ISM Services PMI for October fell to 56.6 from the anticipated 57.4 and weighed on the U.S. dollar and provided support to the rising EUR/USD pair.

The U.S. dollar is a safe-haven currency that tends to rise during uncertain environment and in the U.S. 2020 Presidential Election, the fears that election result could be close or contested, it led to a rise in the safe-haven demand and the U.S. dollar, that ultimately added pressure on EUR/USD pair.

Daily Technical Levels

Support    Resistance

1.1650      1.1757

1.1588      1.1802

1.1543      1.1864

Pivot point: 1.1695

EUR/USD– Trading Tip

The EUR/USD is trading sideways, with a wide trading range of 1.1615 to 1.1760 area as the U.S. elections keep the markets on the move. On the lower side, the bearish breakout of the 1.1615 area can extend selling until the next support area of the 1.1591 level. The release of European services PMI data may support the pair; elsewhere, the outcome of elections may drive further market movement. The MACD is entering the selling zone, but we may not see further selling until the 1.1615 level gets violated. 


GBP/USD – Daily Analysis

The GBP/USD pair was closed at 1.29142 after placing a high of 1.31401 and a low of 1.29839. The broad-based U.S. dollar strength added pressure on GBP/USD pair and kept it on the bearish track on Wednesday.

The uncertainty surrounding the U.S. election results increased after the race to White House became tighter than anticipation. However, the results from key battle states like Wisconsin, Michigan, and Pennsylvania were delayed. This uncertainty forced investors to hold onto their U.S. dollar positions and weighed on GBP/USD pair.

On the previous day, the markets were moving on Biden recovery expectations, but as results from different states were announced, the election results became tighter. Chances for a divided government increased, and the blue wave decreased that raised the U.S. dollar onboard and weighed on GBP/USD pair.

On the data front, at 14:30 GMT, the Final Services PMI for October fell to 51.4 against the estimated 52.3 and weighed on British Pound. From the U.S. side, at 18:15 GMT, the ADP Non-Farm Employment Change for October fell to 365K against the expected 650K and weighed on the U.S. dollar. At 18:30 GMT, the Trade Balance from the U.S. for October came in line with the anticipations of -63.9B. At 19:45 GMT, the Final Services PMI for October rushed to 56.9 from the estimated 56.0 and supported the U.S. dollar and weighed on GBP/USD pair. At 20:00 GMT, the ISM Services PMI for October declined to 56.6 from the projected 57.4 and weighed on the U.S. dollar.

In the U.K., the lawmakers approved a one-month lockdown for England as the coronavirus cases were continuously increasing. On Wednesday, the U.K. reported 25,177 new cases in a single day against Tuesday’s 20,018. The British Pound came under fresh pressure after these depressing highlights from the U.K. and added further losses in GBP/USD pair.

The Bank of England will release its monetary policy decision on Thursday. The uncertainty about the decision of BoE also increased with the escalated version of the coronavirus pandemic. The Bank is expected to keep rates stable, but as the lockdowns are re-introduced banks could change its decision and announce further easing. These uncertainties also kept the local currency under pressure and kept weighing on GBP/USD pair.

Daily Technical Levels

Support   Resistance

1.2913      1.2941

1.2898      1.2954

1.2884      1.2969

Pivot point; 1.2926

GBP/USD– Trading Tip

Just like the EUR/USD, the GBP/USD is also trading sideways in between a narrow trading range of 1.3122 – 1.2940 area. The Cable has recently violated the downward channel, supporting the GBP/USD pair around the 1.2940 level. Above this level, the odds of buying remain strong today. On the higher side, the Sterling may find next resistance around 1.3122 while the bearish breakout of 1.2940 may lead the Cable towards the 1.2855 level. A choppy session is expected today. 


USD/JPY – Daily Analysis

The USD/JPY pair was closed at 104.517 after placing a high of 105.343 and a low of 104.149. The USD/JPY pair moved upward towards its 11-days highest level on Wednesday but it lost most of its daily gains in the late trading session.

The primary driver of the USD/JPY pair was the USD’s market valuation on Wednesday. As the early election results showed that the blue wave was un-likely, it supported the safe-haven U.S. dollar and pushed the USD/JPY pair higher. The U.S. Dollar Index (DXY) also rose on Wednesday and moved to the 94.30 level.

As the markets were moving in previous days over the chances of Biden victory, after tighter election results, the chances for divided government increased and weighed on market sentiment. The hopes for larger stimulus also faded away with the declining hopes of the blue wave and the U.S. dollar gained through it and supported a strong bullish move on Wednesday.

However, on late night Tuesday, when it was clear that there will not be a winner, President Trump falsely claimed victory when millions of votes were still uncounted in the tight presidential race. This weighed on the U.S. dollar and the pair USD/JPY started to rise.

On the data front, at 18:15 GMT, the ADP Non-Farm Employment Change for October dropped to 365K against the projected 650K and weighed on the U.S. dollar. At 18:30 GMT, the Trade Balance from the U.S. for October remained flat with the expectations of -63.9B. At 19:45 GMT, the Final Services PMI for October raised to 56.9 from the projected 56.0 and supported the U.S. dollar. At 20:00 GMT, the ISM Services PMI for October dropped to 56.6 from the expected 57.4 and weighed on the U.S. dollar.

Meanwhile, the Bank of Japan released its monetary policy meeting of September on Wednesday that showed that some policymakers called for deeper scrutiny on how to address the fallout from the coronavirus pandemic as the economic outlook remained highly uncertain.

Many in the nine-member board agreed that it was sufficient to maintain the current ultra-loose monetary policy, for now, to cushion the economic blow from the pandemic. But some saw the need to debate how the BOJ could re-shape its policy in an era where the population must balance the need to contain the virus and sustain economic activity.

The Bank of Japan Governor Haruhiko Kuroda has said that the central bank’s focus will be on providing liquidity to cash-strapped firms hit by the pandemic. He has also indicated that deeper debate on how to achieve its 2 percent inflation target will be put on the back burner—these added strengths in the Japanese Yen and capped gains in the USD/JPY pair on Wednesday.

Daily Technical Levels

Support   Resistance

104.32      104.71

104.19      104.95

103.94      105.09

Pivot point: 104.57

USD/JPY – Trading Tips

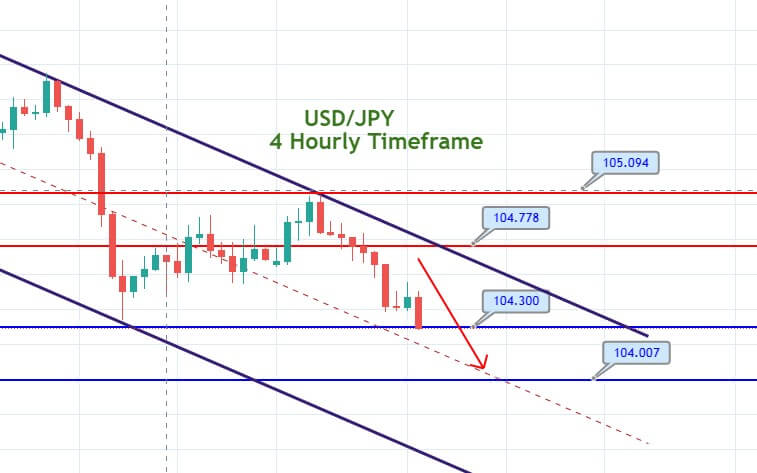
The USD/JPY is trading choppy in between a wide trading range of 105.64 to 104.420 level. Violation of these ranges may determine the next trend in the USD/JPY pair. A bullish breakout of 105.062 level can extend the buying trend until 105.590. Conversely, the bearish breakout of 104.426 can lead the USD/JPY pair towards the 104 area. The MACD is also showing mixed bias among investors; therefore, let’s wait for a breakout before taking the next position in the USD/JPY. Good luck! 

Categories
Forex Fundamental Analysis

The ‘Sentix Investor Confidence’: Revealing Market Sentiment

Introduction

The economy, financial, and forex markets are mainly driven by sentiment. Abstract aspects of demand and supply primarily drive these markets. A financial asset’s value will appreciate if a majority of investors believe that its future cash flows will increase. Conversely, the value of the asset will lower if these investors have a negative outlook on it. Therefore, knowing how most investors feel about the outlook of the economy can help you plan your future investments properly.

Understanding Sentix Investor Confidence

Investor confidence indexes are usually estimated by conducting surveys on investors and analysts throughout the economy.

In the EU, for example, the investors’ confidence is gauged using the ‘EU Sentix Investor Confidence’ index. Sentix is a German marketing and research firm predominantly dealing with behavioral finance. This index is compiled through a survey of about 2800 investors and analysts from across the 17-EU member countries. The primary role of the index is to obtain the confidence of the business people about the current economic climate and their anticipation about the future economy.

Sentix Investor Confidence Methodology

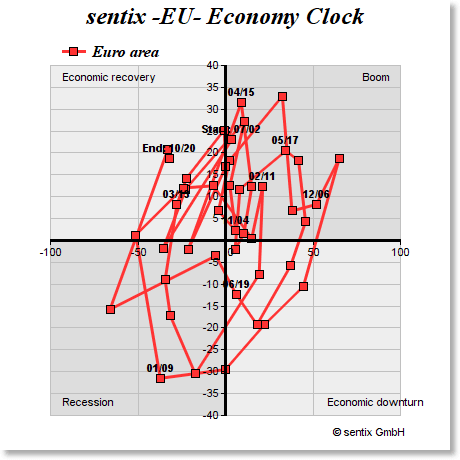
The Euro area Sentix economic report is categorized into the current situation and Expectations.

Current situation: This part of the report polls how the investors and analysts feel about the prevailing economic conditions. Ongoing geopolitical aspects inform the current economic conditions to the prevailing market conditions.

Source: Sentix

Expectations: As the name suggests, this part of the report concerns the future. Investors and analysts are polled to see what they think the future economic conditions will be. Do they expect the current conditions to improve, remain the same or deteriorate?

Both these parts of the report accommodate various economic indicators about the economy. The investors and analysts are asked their sentiments on various aspects of the economy, from the ease of doing business, labor conditions, interest rates to geopolitics.

As mentioned, Sentix surveys up to 2800 people who are mostly employees and investors in the private sector. The survey is conducted to ensure inclusivity of all economic sectors, thus obtaining a representative perspective about the state of the economy.

The results from the questionnaires are collated and indexed on a scale of -100 to 100. Readings of below 0 indicate that investors and analysts are pessimistic about the economy, with the severity of their pessimism increasing as the index approaches -100. On the other hand, a reading of above 0 shows optimism. The higher the index, the more optimistic the investors are about the economy.

Source: Sentix

Using Sentix Investor Confidence for Analysis

Keep in mind that the polled people for this index are experts – presumably authoritative in their various fields. Therefore, by following

Sentix

level of confidence in the economy can be incredibly helpful in making predictions about the economy at large.

Investments, in any economy, forms a major part of economic growth. When investors have a positive outlook about the economy, current, and future, we can expect them to make more investments in various sectors of the economy. Naturally, these investments create more jobs in the economy, increasing economic output, improving households’ welfare, and growing the GDP.

On the other hand, when the investors hold a negative outlook about the economy, they will halt any further investment plans. Some may go as far as cutting back on their investments. In this scenario, the industries in which they have invested in will be forced to scale down their operations. Consequently, the economy can expect a higher unemployment rate, depressed demand in the economy, reduced output, and a general contraction in the GDP.

Note that the current and the expectations of investor confidence aren’t always aligned. Policymakers can use this knowledge to make informed decisions on monetary and fiscal policies. When investors are confident about the current economic conditions but pessimists about the future, theoretically, governments and central banks could implement expansionary policies. Such policies will stimulate the economy and prevent any job losses, or adverse contractions of the economy in case investors shy away from further investing.

Furthermore, Sentix investor confidence is a vital indicator of recessions and recoveries. Let’s take the example of the ongoing coronavirus-induced recession. Towards the end of the first quarter of the year, investors were pessimistic about the future. They anticipated that the ravaging effects of the coronavirus would severely affect the economy. And true, as anticipated, the economy was ravaged. New investments during the months following the outbreak were at historic lows, and the unemployment levels globally were the highest ever witnessed. The Sentix investor confidence forestalls the current recession.

Similarly, the Sentix investor confidence index can be used to show signs of economic recoveries. Let’s still consider the example of the recent coronavirus pandemic; the Sentix investor confidence has been accurately used to show economic recovery signs. After governments and the European Central Bank (ECB) put in place economic expansionary measures, the Sentix investor confidence became less and less pessimistic. This showed that investors anticipated that the economy would recover.

Source: Sentix

Impact of Sentix Investor Confidence on Currency

As we mentioned earlier, sentiment is one of the major drivers of currency fluctuations. When the investor confidence is highly optimistic or improving from extreme pessimism, the domestic currency will appreciate. This appreciation is because investor confidence signals improvement in the economic condition, followed by lower unemployment levels, better living standards, and higher GDP levels.

Conversely, dropping levels in the Sentix investor confidence leads to the depreciation of the domestic currency relative to others. The depreciation is because forex traders will anticipate that adverse economic conditions will follow.

Sources of Data

Sentix conducts the surveys and publishes the Sentix Investor Confidence index for the Euro area.

How Sentix Investor Confidence Index Release Affects The Forex Price Charts

Sentix released the latest EU investor confidence index on October 5, 2020, at 8.30 AM GMT. The release of the index can be accessed at Investing.com. Since the investor confidence index is a low-impact indicator, low volatility is expected on the EUR.

In October 2020, the Sentix Investor Confidence index was -8.3 compared to -8.0 in September 2020. However, the October reading was better than the expected  -9.5.

Let’s find out how the October 2020 Sentix Investor Confidence index’s release impacted the ERU/USD price action.

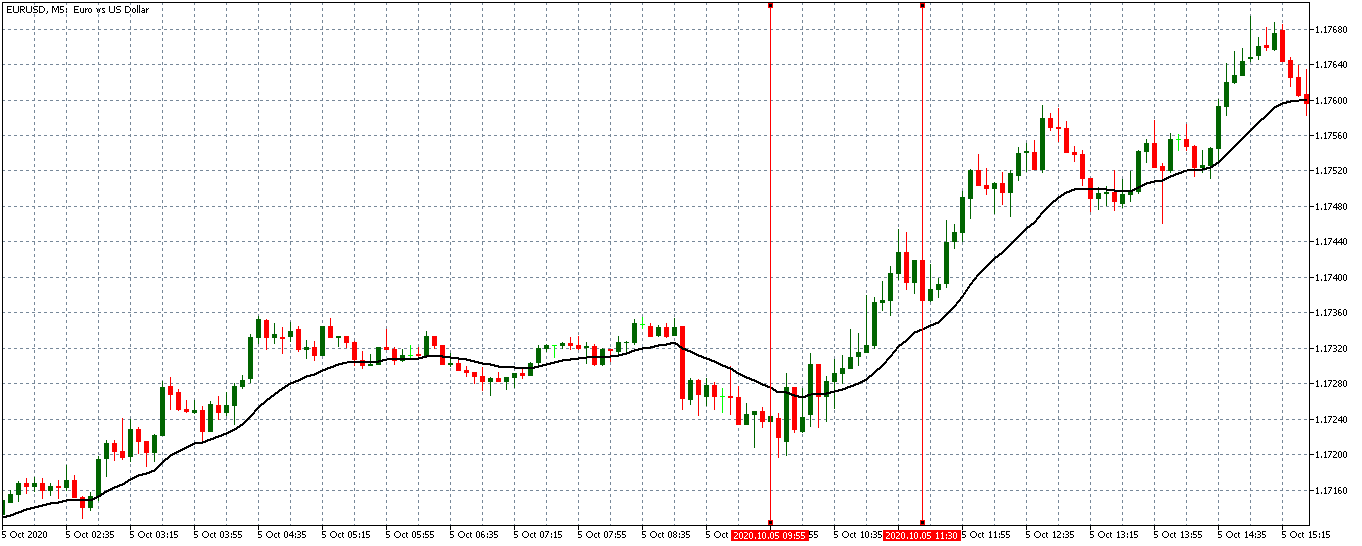
EUR/USD: Before the Sentix Investor Confidence Index Release on October 5, 2020, 
just before 8.30 AM GMT

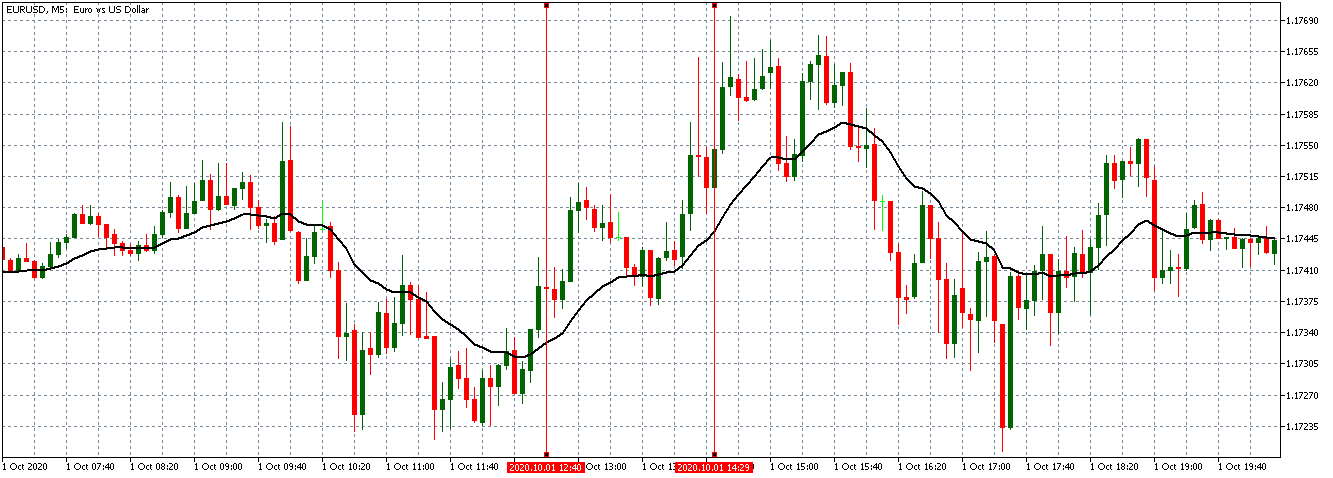
Before the release of the Sentix Investor Confidence Index, the EUR/USD pair was trading in a steady uptrend. The above 5-minute chart shows candles crossing above the 20-period MA and forming further above it.

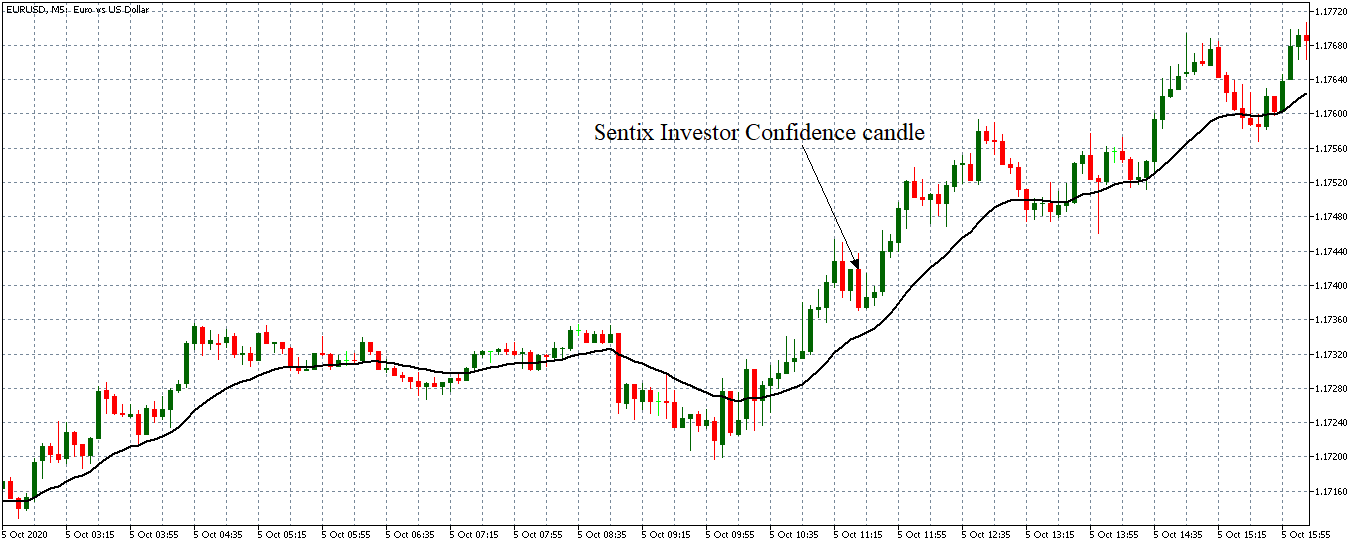
EUR/USD: After the Sentix Investor Confidence Index Release on October 5, 2020, 
at 8.30 AM GMT 

After the release of the index, the EUR/USD pair formed a 5-minute bearish candle. However, the pair subsequently adopted a strong uptrend. The 20-period MA rose steeply with candles forming further above it. This trend shows that the EUR became stronger after the release.

Bottom Line

In the forex market, the Sentix Investor Confidence index is a low-impact indicator. In the current economic climate, however, this index can prove invaluable in predicting the directions of the economy – to show whether the Euro area economy is bouncing back from the effects of the coronavirus pandemic.

Categories
Forex Assets

Trading The AUD/INR Forex Exotic Pair & Analysing The Costs Involved

Introduction

AUD/INR is an exotic currency pair in the forex market, with the AUD representing the Australian Dollar and the INR representing the Indian Rupee. Here, the AUD is the base currency, and the INR is the quote currency. That means that the AUD/INR price represents the amount of INR which 1AUD can buy. For example, let’s say that the price of the AUD/INR is 52.2654. It means that 1 AUD can buy 52.2654 INR.

AUD/INR Specification

Spread

When you go long in forex trading, you have to buy the currency pair from your forex broker. Now, if you decide to sell back the pair to the broker, they will buy it at a lower price than they sold to you. The difference between these two prices – also known as “bid” and “ask” – is the spread.

The spread for the AUD/INR pair is:

ECN: 20 pips | STP: 25 pips

Fees

Some brokers charge a commission for positions opened using ECN accounts. They vary depending on the size of the trade. STP accounts are rarely charged any trading fees.

Slippage

Slippage in Forex is the difference between the execution price of a market order and the price at which that order was placed. The slippage comes about due to increased market volatility or inefficiency on the part of your broker.

Trading Range in the AUD/INR Pair

When a currency pair fluctuates, its volatility varies across different timeframes. The analysis of this volatility in different timeframes is done using the trading range. It can help the trader identify the most suitable timeframes for a particular currency pair.

The trading range is expressed in pips. It shows the value of pips you stand to gain or lose on various timeframes.

The Procedure to assess Pip Ranges

  1. Add the ATR indicator to your chart.
  2. Set the period to 1
  3. Add a 200-period SMA to this indicator
  4. Shrink the chart so you can determine a larger period
  5. Select your desired timeframe
  6. Measure the floor level and set this value as the min
  7. Measure the level of the 200-period SMA and set this as the average
  8. Measure the peak levels and set this as Max.

AUD/INR Cost as a Percentage of the Trading Range

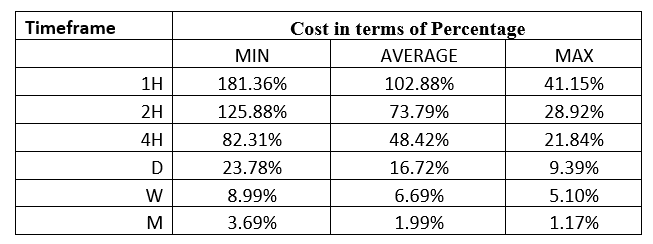
Expressing the total trading costs of a currency pair as a percentage of the trading range helps to understand the trading costs that pair on multiple timeframes. It shows how the trading costs change with volatility.

Below are the trading costs for the AUD/INR  pair on ECN and STP accounts.

ECN Model Account Costs

Spread = 20 | Slippage = 2 | Trading fee = 1

Total cost = 23

STP Model Account

Spread = 25 | Slippage = 2 | Trading fee = 0

Total cost = 27

The Ideal Timeframe to Trade AUD/INR Pair

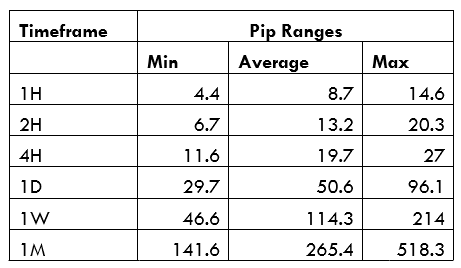
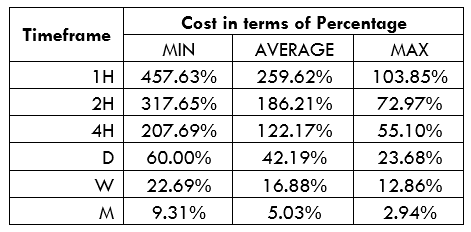
From the above analyses, we can observe that the lowest trading costs of the AUD/INR pair are on longer timeframes. The lowest trading costs for both the ECN and the STP accounts are when the AUD/INR volatility is at the highest – 518.3 pips. While the shorter timeframes have higher trading costs, intraday traders can take advantage of the maximum volatility periods during these timeframes.

Furthermore, traders can reduce the trading costs by implementing forex limit orders instead of market orders, which are prone to slippages. Here is an example of how the limit orders remove the slippage costs.

ECN Account Using Limit Model Account

Total cost = Slippage + Spread + Trading fee

= 0 + 20 + 1 = 21

You can notice that the forex limit orders lowers the overall costs by making the slippage cost 0. In this scenario, the highest trading cost has been reduced from 389.83% to 355.93%.

Categories
Forex Assets

Exploring The Costs Involved While Trading The AUD/KRW Exotic Pair

Introduction

The AUD/KRW is an exotic currency pair where AUD is the Australian Dollar, and KRW is the South Korean Won. This article will cover some of the essential elements of the AUD/KRW pair that you should know before you start trading this exotic pair.

The AUD is the base currency, and the KRW is the quote currency in this pair. Hence, the pair’s price represents the amount of KRW that can be bought using 1 AUD. For example, say the price of AUD/KRW is 795.89, it means that for every 1 AUD, you can buy 795.89 KRW.

AUD/KRW Specification

Spread

In forex trading, your broker will sell a currency pair to you at a higher price than the one they will buy from you if you sold it back to them. These prices are “bid” and “ask,” and the difference between them is the spread. The spread for the AUD/KRW pair is:

ECN: 21 pips | STP: 26 pips

Fees

STP type accounts incur no trade commissions. For the ECN accounts, the fees charged depend on your broker and the size of your position.

Slippage

When placing a forex market order with your broker, that order might be executed at a different price. The difference is slippage and is due to higher volatilities or execution delays by the broker.

Trading Range in the AUD/KRW Pair

The trading in forex aims to show the trader how a currency pair fluctuates across multiple timeframes. This analysis is used to determine volatility associated with the pair.

If. For example, the trading range of the AUD/KRW across the 4H timeframe is ten pips; it means that a trader can expect to gain or lose  AUD 12.6; since the value of 1 pip is AUD 1.26.

Here’s the trading range of the AUD/KRW  across multiple timeframes.

The Procedure to assess Pip Ranges

  1. Add the ATR indicator to your chart.
  2. Set the period to 1
  3. Add a 200-period SMA to this indicator.
  4. Shrink the chart so you can determine a larger period
  5. Select your desired timeframe
  6. Measure the floor level and set this value as the min
  7. Measure the level of the 200-period SMA and set this as the average
  8. Measure the peak levels and set this as Max.

AUD/KRW Cost as a Percentage of the Trading Range

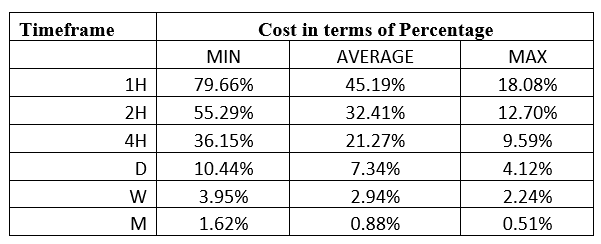
Here, we calculate the total trading costs that a trader can incur trading the AUD/KRW across different timeframes under different volatility.

The trading cost is expressed as a percentage of the volatility, which is in pips.

ECN Model Account Costs

Spread = 21 | Slippage = 2 | Trading fee = 1

Total cost = 24

STP Model Account

Spread = 26 | Slippage = 2 | Trading fee = 0

Total cost = 28

The Ideal Timeframe to Trade AUD/KRW Pair

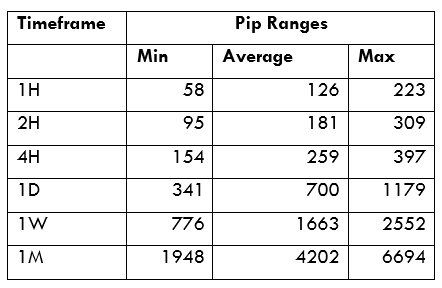
From the above analyses, we can observe that the highest costs in both the ECN and the STP accounts are incurred at the 1H timeframe when volatility is at the minimum 58 pips. Although the trading costs decline as the timeframe becomes longer, you can notice that the costs are lower when volatility is at the maximum across all timeframes. Therefore, for intraday traders trading the AUD/KRW pair when volatility approaches, the maximum will help lower the costs.

Using the forex limit order types can also help to reduce the overall costs since it eliminates the risks of slippage encountered in market orders. Here’s an example.

ECN Account Using Limit Model Account

Total cost = Slippage + Spread + Trading fee

= 0 + 21 + 1 = 22

Notice how the overall trading costs have been lowered in all timeframes. When volatility is at the minimum at the 1H timeframe, the highest trading cost has declined from 406.78% to 372.88%.

Categories
Forex Market Analysis

Daily F.X. Analysis, November 03 – Top Trade Setups In Forex – U.S. Presidential Election in Highlights!

On the news front, eyes will remain on the U.S. Presidential Election. The voters will elect the 46th President of the United States. The winner will likely be projected before the official vote count is announced, based on early vote counts and exit polling. Besides, the U.S. Factory Orders m/m are also due, but their impact is likely to be overshadowed by the U.S. elections. 

Economic Events to Watch Today  


EUR/USD – Daily Analysis

The EUR/USD pair was closed at 1.16399 after placing a high of 1.16554 and a low of 1.16218. EUR/USD pair extended its losses and dropped for the 6th consecutive session on Monday amid the rising safe-haven appeal and coronavirus situation in Europe. The EUR/USD pair ended its day with modest losses as the currency pair’s bearish momentum was somehow cooled down because of the positive PMI data from European nations. Meanwhile, the U.S. dollar was also strong onboard due to its safe-haven status as well as due to the strong macroeconomic data on Monday.

At 13:15 GMT, the Spanish Manufacturing PMI for October raised to 52.5 against the expected 51.0 and supported the single currency Euro. At 13:45 GMT, the Italian Manufacturing PMI for October remained flat with a forecast of 53.9. At 13:50 GMT, the French Final Manufacturing PMI for October also came in as expected 51.3. At 13:55 GMT, the German Final Manufacturing PMI came in line with the anticipations of 58.0. At 14:00 GMT, the Final Manufacturing PMI for the whole bloc in October raised to 54.8 from the expected 54.4 and supported the single currency Euro.

Europe’s positive PMI data gave some support to Euro that ultimately capped further losses in EUR/USD pair.

From the U.S. side, at 19:45 GMT, the Final Manufacturing PMI for October remained flat at 53.4. At 20:00 GMT, the ISM Manufacturing PMI for October rushed to 59.3 from the estimated 55.6 and supported the U.S. dollar. The Construction Spending for September fell to 0.3% from the projected 1.0% and weighed on the U.S. dollar. The ISM Manufacturing Prices for October also elevated to 65.6 against the anticipated 60.5 and supported the U.S. dollar.

On Monday, the positive data from the U.S. made the U.S. dollar even stronger and supported the downside movement of the EUR/USD pair.

Furthermore, the U.S. dollar was set to lose its bullishness in the days ahead as markets were keenly waiting for the U.S. presidential elections’ results. Although the uncertainty persists in the market regarding the election’s outcome, this is the critical time to enter or place any position in the market. This is the reason behind the consolidated movement of the EUR/USD pair on Monday.

Furthermore, both the U.S. election candidates, Biden and Trump, have said that they would deliver a big stimulus package after the election. So, it means the next round of stimulus packages will be delivered regardless of the winner. These hopes kept weighing in the U.S. dollar and capped further losses in EUR/USD pair.

On the other hand, the renewed lockdown restrictions in France, Germany, Italy, and Belgian to curb the effect of coronavirus pandemic raised the concerns for Eurozone economic recovery and kept weighing on single currency that kept the EUR/USD pair on the downside.

Daily Technical Levels

Support Resistance

1.1637     1.1651

1.1631     1.1659

1.1623     1.1665

Pivot point: 1.1645

EUR/USD– Trading Tip

The EUR/USD traded with a bearish bias, having dropped below the support area of 1.1653. At the moment, the EUR/USD is likely to face the resistance at the same level of 1.1653. On the higher side, a bullish crossover of 1.1653 increases the odds of continuing an upward trend, and it may lead the EUR/USD price towards 1.1700. Further bullish crossover of this area can lead the pair towards the 1.1758 level. Conversely, a bearish crossover of 1.1653 support level has opened additional room for selling until the 1.1613 area as a double bottom support area extends the level.  


GBP/USD – Daily Analysis

The GBP/USD pair was closed at 1.29180 after placing a high of 1.29426 and a low of 1.28539. The British Pound started to decline against the U.S. dollar at the starting day of the week as the hopes raised for further monetary easing by the Bank of England this week following the second lockdown in England.

Over the weekend, the U.K. announced that it would enter a second national lockdown for a month to control the rise in coronavirus infections. On Monday, the coronavirus cases fell to 18,950 in comparison to 10,900 cases a week ago. The expectations for further easing came on board after the Britain government made this announcement on the weekend.

The new lockdown measures in the U.K. demand the people stay at home unless there is an essential purpose like education, medical reason, or shopping for groceries. However, economists have warned that country would enter a double-dip recession if it enters another lockdown as it will dent the economic growth in the final quarter of the year. These concerns kept the risk sentiment under pressure and weighed on British Pound that ultimately added the GBP/USD pair’s losses.

On the data front, at14:30 GMT, the Final Manufacturing PMI from Great Britain was raised to 53.7against the expected 53.3 and supported British Pound and capped further losses in GBP/USD pair. From the U.S. side, at 19:45 GMT, the Final Manufacturing PMI for October came in line with the anticipations of 53.4. At 20:00 GMT, the ISM Manufacturing PMI for October raised to 59.3 from the forecasted 55.6 and supported the U.S. dollar. The Construction Spending for September plunged to 0.3% from the forecasted 1.0% and weighed on the U.S. dollar. The ISM Manufacturing Prices for October also rose to 65.6 against the estimated 60.5 and supported the U.S. dollar.

The positive PMI data from the U.S. gave strength to the U.S. dollar and added further pressure on GBP/USD pair. On the Central Bank front, the BOE will have its monetary policy meeting on Thursday, and the hopes are that it will refrain from announcing negative rates, and the bank could also introduce another easing for supporting the economy.

On the Brexit front, the Brexit-talks continue in Brussels as the U.K. and the E.U. were working to avoid a no-deal Brexit. However, no fresh headlines were seen regarding this matter on Monday that kept the currency pair under the mercy of a strong U.S. dollar across the board.

Daily Technical Levels

Support Resistance

1.2913     1.2941

1.2898     1.2954

1.2884     1.2969

Pivot point; 1.2926

GBP/USD– Trading Tip

The GBP/USD is trading sharply bearish to trade over the double bottom support area of 1.2910 level. On the 2 hour timeframe, the GBP/USD pair has formed a downward channel, and bearish trend continuation can lead the pair further lower towards the next support area of 1.2830 level. However, to see that kind of selling, the Cable needs to violate the immediate support area of 1.2910. The MACD and 50 EMA support selling; therefore, we should look for a selling trade below the 1.2910 level today. 


USD/JPY – Daily Analysis

The USD/JPY pair was closed at 104.749 after placing a high of 104.947 and a low of 104.514. The USD/JPY pair rose and posted gains for the third consecutive session on Monday amid the broad-based U.S. dollar strength. The U.S. dollar pushed higher in the early European session on Monday as European nations imposed more lockdowns on the back of an incessant rise in coronavirus cases. The uncertainty surrounding the upcoming U.S. elections also weighed on market sentiment and kept the USD/JPY pair higher.

The U.K. joined Germany and France over the weekend and re-introduced partial lockdowns to curb the coronavirus’s spread. Europe crossed the 10 million total cases of coronavirus infections and supported the safe-haven appeal that added further strength to the U.S. dollar.

The Bank of England will hold its monetary policy meeting on Thursday, and investors believe that the bank will increase the asset purchases by 150-200 billion British Pounds. These hopes forced the investors to stick with the U.S. currency in these uncertain times, but the ranges were tight as the markets were under pressure ahead of Tuesday’s U.S. presidential election.

The U.S. dollar was also strong because of the rising hopes for the victory of Joe Biden in the upcoming election as he has maintained a healthy lead over his competitor Donald Trump in national polls over the weekend before elections. Furthermore, some of the gains in the USD/JPY pair were lost in the late trading session as the traders were also waiting for the upcoming Federal Reserve monetary policy meeting on Thursday.

On the data front, at 05:30 GMT, the Final Manufacturing PMI from Japan for October raised to 48.7 from the forecasted 48.0 and supported the Japanese Yen that capped further upside in USD/JPY pair. From the U.S. side, at 19:45 GMT, the Final Manufacturing PMI from the U.S. for October remained flat at 53.4. At 20:00 GMT, the ISM Manufacturing PMI from the U.S. advanced to 59.3 from the estimated 55.6 in October and supported the U.S. dollar. The Construction Spending for September fell to 0.3% from the predicted 1.0% and weighed on the U.S. dollar. The ISM Manufacturing Prices for October also raised to 65.6 against the projected 60.5 and supported the U.S. dollar. The U.S. dollar was further supported by the positive results from the macroeconomic data, and it helped the USD/JPY pair to post gains on Monday.

Daily Technical Levels

Support Resistance

104.51     104.66

104.45     104.75

104.35     104.81

Pivot point: 104.60

USD/JPY – Trading Tips

The USD/JPY is trading slightly bullish at the 104.745 level, having crossed over the immediate resistance area of the 104.600 mark. On the 2 hour timeframe, the USD/JPY has violated the downward trendline at 104.550 level, and now the same level is likely to support the USD/JPY pair. The closing of candles over 104.650 level is supporting strong odds of bullish trend continuation until 105.049 level. Further bullish trend continuation can also lead the USD/JPY pair towards the 105.800 level. Good luck! 

Categories
Forex Signals

USD/CHF Set for Bearish Correction – U.S. Elections in Play!  

During Tuesday’s Early Asian trading session, the USD/CHF extended its overnight losses and remain depressed around just above the 0.9167 support level mainly due to the broad-based U.S. dollar weakness. However, the prevalent downtrend in the greenback is mainly tied to the upbeat activity numbers from the U.S., China, and Europe, which rekindled economic recovery hopes and kept market trading sentiment positive. Moreover, the political uncertainty in the U.S. also weighs on the already weaker U.S. dollar, which adds further burden around the currency pair.

Despite the intensified Sino-US tussle and coronavirus (COVID-19) woes, the market trading sentiment managed to stop its previous negative performance and started to gain some positive traction during the early Asian session on the day perhaps due to the upbeat activity numbers from the U.S., China, and Europe, which rekindled economic recovery hopes. Moreover, the market trading sentiment got an additional lift from the positive developments surrounding the Brexit talks between the U.K. and the European Union (E.U.), which in turn, provided an instant boost to the market trading sentiment and undermined the safe-haven assets including the safe-haven U.S. dollar.

Despite the upbeat U.S. data, the broad-based U.S. dollar remained depressed as the investors continue to sell U.S. dollars on the back of the upbeat market sentiment. Moreover, the losses in the U.S. dollar could also be associated with political uncertainty in the U.S. ahead of U.S. elections. However, the losses in the U.S. dollar could be considered as the major factor that kept the currency pair under pressure. Meanwhile, the U.S. Dollar Index that tracks the greenback against a bucket of other currencies dropped to 93.977 to 93.705.


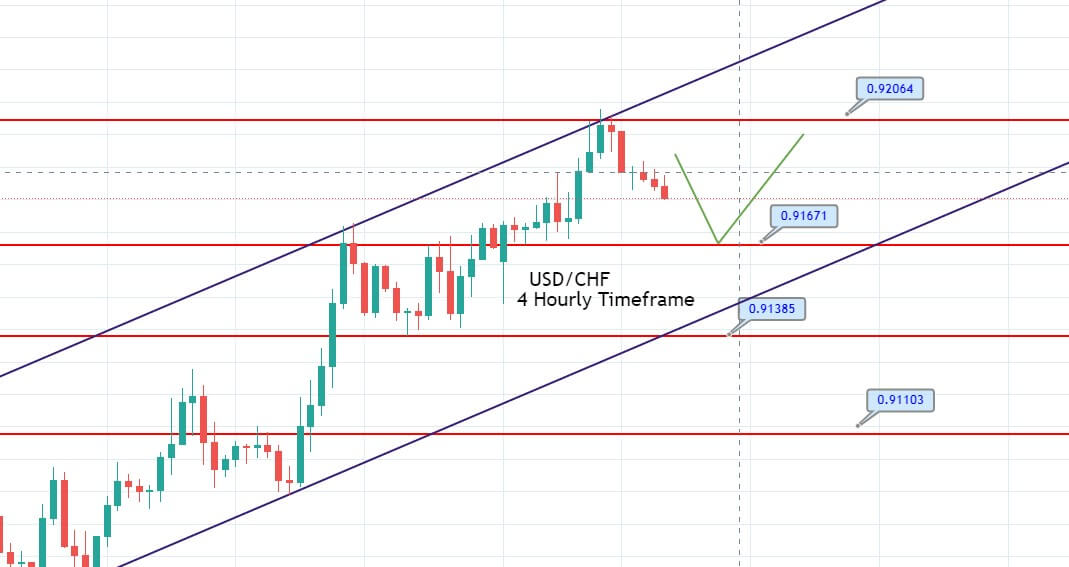
Technically, the USD/CHF pair has entered the overbought zone at the 0.9204 level and below this, the market has initiated the retracement/correction in the USD/CHF pair. Therefore, we have opened a sell trade below 0.9200 area to target quick 40 pips—checkout out a trading plan below. 

Entry Price – Sell 0.91809

Stop Loss – 0.92209

Take Profit – 0.91409

Risk to Reward – 1:1

Profit & Loss Per Standard Lot = -$400/ +$400

Profit & Loss Per Micro Lot = -$40/ +$40

Fellas, now you can check out forex trading signals via Forex Academy mobile app. Follow the links below.

iPhone Users: https://apps.apple.com/es/app/fasignals/id1521281368

Andriod Users: https://play.google.com/store/apps/details?id=academy.forex.thesignal&hl=en_US

Categories
Forex Basic Strategies Forex Daily Topic

Trade Ranges Like A Pro with this Effective Forex Trading Strategy

Introduction

The market does not move in random directions. It either trends or consolidates. As many would not know, the market is like a closed circle, and the same states keep repeating over and over again. Thus, in trading, one must learn how to become pro at reading these market states.

On that same note, we shall be going over an effective strategy when the market is in a consolidation/ranging state. However, before jumping right into the strategy, it is important to understand the basics and related concepts.

What is a consolidation phase in a market?

There are several ways to comprehend the consolidation phase of the market. There is logical reasoning behind the occurrence of this state, and is not simply a random pattern that shows up quite often.

The consolidation state is that phase of the market when the market moves in a sideways direction. This state is also referred to as a range. The reason for its occurrence is related to the strength between bulls and bears.

Comprehending a Range

There are two parties in the market – the bulls and the bears. Their strength is what describes the state of the market. In a trending market, either of the parties is powerful. For instance, if the market is going up, it simply means that the bulls control the market. In a consolidation state, both bulls and bears show equal strength. The bulls show strength by pushing the market higher, while the bears show power by taking the price right back down. As a result, the prices in both directions – which we refer to as a range.

How to draw a range?

To trade this range strategy, it is vital to understand how a range is drawn. A range is made up of two levels:

  • Support
  • Resistance

Thus, drawing the correct support and resistance levels will result in a perfect range.

Another point considered is the size of the range. The larger the range, the better. The other small consolidations in the market are ignored. Following is an example of how we pick an ideal range.

In the above example, both are ranges as the market is moving in a sideways direction. However, we do not consider range-1 as a range for our strategy. This is because a single line going up and down fails to depict the market’s price action.

Supply and Demand Range Strategy

What is the usual approach to trading a range? It is to buy at the support and sell at the resistance. But we’re going to step the game a little bit. The supply and demand range strategy uses the same principles of a typical range, in addition to other factors.

Step by step procedure to trade the Supply and Demand Range Strategy:

  1. Find a legitimate range in the market. Mark the Support and Resistance levels appropriately.
  2. Determine the direction of the market prior to the range.
  3. Find a potential supply/demand level.
  4. Get in when the market breaks through the range and reaches the supply/demand zone.

Buy Example

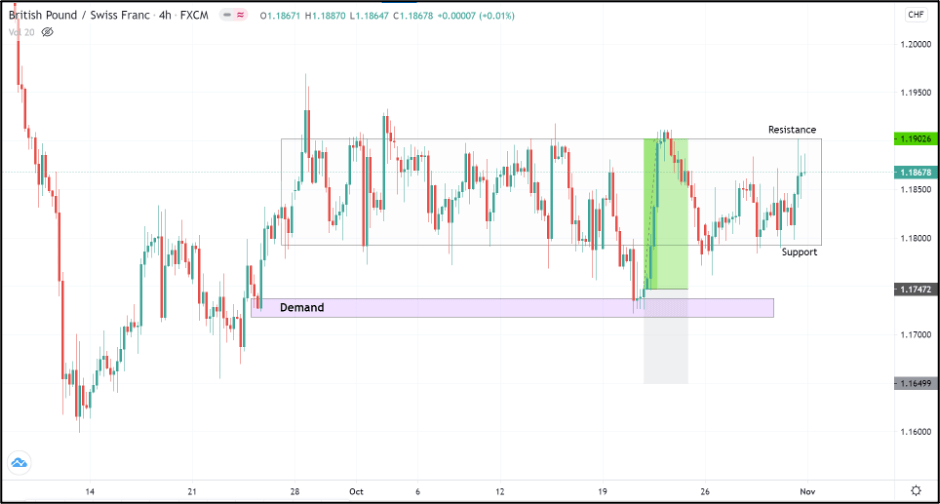
Consider the below chart of GBPCHF on the 4H timeframe. We see that the market has been ranging between 1.1902 and 1.1800. Observe that the support and resistance levels have been marked by cutting off the false market breakouts.

To trade this market, our job is not simply to hit the buy at the support and sell at the resistance. As mentioned, we take into account the preceding direction and the supply and demand levels around it.

The direction of the market prior to the range was an upside, indicating that the bulls were in control previously. A point to note is that, despite the market being in a range, it does not change the fact that the bulls are still powerful. Thus, we rather look for buying opportunities than shorting signals.

To do so, we wait for the price to drop below the bottom of the range and hold at any one of the demand zones. Once the market begins to reverse its direction from south to north around the demand zone, we can go long. The same scenario has been illustrated in the chart below.

Placements

Stop Loss – Well below the demand zone would be decent.

Take Profit – Top of the range would be an ideal spot to take profits.

Sell Example

Consider the chart of CAD/JPY on the 15min timeframe shown below. The recent market price action depicts that the market is moving sideways. The market’s overall trend is down, indicating that the bears are in control of the market.

Since the scenario is opposite to the previous example, we wait for the market to break through the resistance and reach any potential supply level. In the below example, we can see that the price broke through the resistance twice reacted off from the supply, as shown. Thus, we can look for entries when the market begins to switch direction to the downside.

Placements

Stop Loss – Above the supply zone

Take Profit – Bottom of the range

Conclusion

The only way to trade a range is not by buying and selling from the top and bottom of the range. It can be professionally traded with the application of other factors. And this range strategy particularly dealt with the strength of the bulls and bears and the concept of supply/demand.

We hope you were able to comprehend our Supply and Demand Range strategy. Do test them out for yourself and let us know your results in the comments below. Happy trading!

Categories
Forex Basics

How to Start Trading Forex for Free

Stumbling upon an article or piece of information about forex trading can be exciting, if not mysterious at first. People ask a lot of questions regarding trading regarding issues about whether or not it is possible, if it can make you rich, or if it is even worth it. While many aspiring traders gain their own perception of what trading will be like from information on the internet, many of them never go on to open a trading account or make that first deposit. While some of these traders don’t take the step because they have decided it isn’t worth it, many others just can’t bring themselves to make that first deposit when they don’t know if trading will actually make them any money.

Maybe you’re looking into trading because you desperately need another source of income, but you’re imagining that forex trading is reserved for wealthy people that can afford to invest large sums of money. After all, how are you supposed to make money if you don’t have anything to invest in? Or you might have a few hundred dollars (or more) that you could afford to invest, but you can think of a million other things you actually need. If you invest the money into a trading account and lose it, wouldn’t you have been better off spending it on something else? Even if you have a ton of money to spare and wouldn’t really miss it, nobody wants to give away their money with nothing to show for it. 

There’s good news if you’ve found yourself facing this problem – you can actually start trading for free by opening a demo account through almost any broker. A demo account works just like a live account in that it simulates the same environment traders on live accounts are experiencing, with the one key difference being that a demo account allows you to trade with virtual currency. You can enter and exit trades just like you would on a live account and trade with the same spreads and prices offered by the broker, only you don’t have to risk anything financially. This is a great way to see what kind of results you would get if you did decide to make a deposit, and there’s no risk because you can simply abandon the demo account at any time if you decide that it isn’t for you.

If you’re eager to open an actual trading account but you still don’t have the money to invest, there are a few other options. Some brokers will actually give you a welcome bonus to open a live account with them without asking that you deposit anything. If you lose the bonus, you don’t owe anything to the broker and you don’t ever have to make a deposit. However, it can sometimes be difficult to find promotional offers that don’t require anything on the trader’s behalf. Some of these promotions might be offered from time to time, so be sure to check online often if you have trouble finding one. Another option that isn’t entirely free would be to find a broker that offers a deposit bonus so that you can get more out of the deposit you make. This type of promotion is much more common and many brokers will match what you deposit up to a certain amount. So, if you only have $100, your broker would add another $100 to your account balance, giving you more money to trade with. This would be a good option for those that don’t have a lot of money to invest.

So, if you want to start trading for free, you have a handful of options. You should start with a free demo account, which will allow you to gain practice, test out any strategy you’re planning to use, and trade without any financial risk whatsoever. When you’re ready to move on, you can find a broker that will offer a welcome bonus and allow you to open an account for free, or you could find a broker with a deposit bonus to get more out of your initial deposit. If none of these options work for you, keep in mind that many brokers will allow you to start small with a deposit of around $10 or less, which is affordable for any aspiring trader.

Categories
Forex Psychology

The Supreme Discipline of the Forex Trader

Although the currency market is the largest market in the world, there are still many traders who have no idea how it works. So, the reality is that there’s a fair amount of prejudice against currency trading. Some traders even fear the market. If you’re one of those traders, be sure to read this article carefully.

In it, we will present to you the most important basic concepts of the currency market or Forex trading and show you the possibilities it offers. But even for readers with a lot of experience in this market, this article will be an interesting read, in which they will still be able to learn a little more.

Anyone who has made the decision to prove himself in the supreme discipline of traders must become intensely familiar with the currency market. If you know how the market works and what tools are available, you can optimally plan your operations and succeed.

Which players are represented in the market, how should risk and money be managed, what are the possibilities of analysis, and what are the most proven strategies? In this article, we want to work step by step on the most important points so that you can finally start successfully in the currency market (Forex).

What is Forex?

In the Forex market (currencies), currencies (currencies) are traded on the OTC market (over the counter). In other words, there is no central market but only OTC operations. The foreign exchange market is made up of banks, large companies, central banks, funds, intermediaries, and private investors. The Forex market gives the trader a chance to actively trade in the currencies of different countries, with private traders who can only actively trade in the foreign exchange market since the mid-1990s.

Previously, it was available only to institutions. The special feature of this currency market is that it is open on Sunday afternoons and remains active until Friday evening. During this time, it is open 24 hours a day, with a daily trading volume of around $6,000 billion, much more than any other market. Of course, it has its advantages. For example, you can trade when you have time currency pairs that are actively trading.

For example, suppose you live in Germany and have a window of opportunity from 08:00 to 10:00 when European stock exchanges open. In this case, for example, the currency pairs GBP/USD and EUR/USD could be very interesting. In general, the Forex market is very flexible and is able to create a timeline based on individual criteria.

What Moves the Market?

Economic data, in particular, has a significant impact on the Forex market, especially if a particular message deviates significantly from analysts’ and investors’ expectations. In some cases, however, a central bank could take a completely unexpected step at a certain point, leading to a dramatic price change in the currency market. Therefore, a position that is opened immediately before the central bank meeting is not advisable.

As with any trade, you should always remember to limit your losses through a limit on the Forex market, and consider what can happen when you post a specific message that moves the price directly to your loss limit. The amount lost due to a certain position is the question that must be asked again and again.

Entering the Currency Market

Currency pair trading can be done in different ways. Private investors, by choosing a suitable intermediary, gain access to various products with which they can directly or indirectly implement their trading ideas in the Forex market. In the case of cash trading, the two partners trade foreign currencies among themselves. For example, if Bank A with Bank B exchanges EUR 10 million/USD at an exchange rate of 1.30, Bank A will have to transfer USD 13 million. The A will receive 10 million euros from Bank B. The classic currency transaction is also available in a slightly modified form in private Forex trades under the name Spot Business.

Some brokers also offer trading with Forwards. Both methods are usually transactions based on a margin deposit; that is, with leverage. However, compared to cash trading in the interbank market, the foreign currency is not delivered but is “transferred” until the position is closed with an opposite order.

Costs Incurred 

Since the foreign exchange market is an interbank market and therefore does not incur additional fees to the stock exchange services, its trading is relatively cheap. Therefore, depending on the broker model, the trader only has to pay the differential or a combination of fork and commission. The tighter the hairpin, the better for the trader.

Since the currency market is very liquid, the odds of tight ranges are usually quite good. At the same time, dispersion is an important criterion when selecting the broker (in combination with commissions). However, traders need to know if the hairpin is fixed or flexible. In turbulent times, it can be a significant disadvantage when it suddenly reaches an expansion.

In addition, there may also be large differences between individual intermediaries in terms of corporate policy. Therefore, make sure that your broker guarantees the execution of the order and the setting of your loss limit. You should also make sure to include redundant systems to protect your hardware and software so that your commands always run, even if the server fails you during an operation. It should be noted that even in the less regulated currency market there are regulators who supervise many intermediaries, for example, the NFA (National Futures Association) in the U.S. The U.S. and the FCA (Financial Conduct Authority) in England.

On their websites, investors receive full information about private currency trading. Operators should be careful if the agent is in a peripheral country.

Trading Practice – Fundamental Analysis

The fundamental analysis analyses the causes that influence supply and demand in a given currency and thus determine the exchange rate. In assessing supply and demand, they consider, inter alia, the economic situation, and developments in the two currency areas included in each currency pair.

The development of factors such as interest rates, inflation, politics, and society, as well as economic growth plays an important role. Using models, it is possible to assess in a long-term context how a change in certain influencing factors affecting a given currency would affect and whether the current exchange rate seems justified. The exchange rate, which results from the models, is however only a theoretical guide.

In fact, prices may deviate from this, as particularly difficult future expectations to measure are included in price formation. Basically, however, it applies to the analysis: if the current price is below the value of the model, there is talk of an undervaluation, in the opposite case of an overvaluation.

Interest Rate Parity

The simplest model is interest rate parity. It requires traders to invest where they can achieve the highest return. Investment opportunities should have a similar level of liquidity and comparable risk. Capital flows between the two countries are based on the interest rate spread between the two currency areas, according to the interest rate parity model. If the interest rate is higher abroad, traders transfer their money there at the current exchange rate.

Later, the money is transferred back to the source at the current exchange rate. Depending on how the exchange rate develops during the investment period, it will have a positive or negative impact on profitability. If there were no exchange rate movements, the return would simply correspond to the foreign interest rate. Then, later, each investor would keep their money in the currency offering the highest interest rates.

Balance of Payments

In contrast to interest parity theory, the balance of payments attempts to explain exchange rates with a holistic approach. The focus is not on the return efforts of investors, but on the flow of goods and capital flows between the respective economies of a currency pair. The balance of payments is a systematic record of economic transactions between private and public households, as well as businesses and banks at home and abroad. It consists mainly of the current account and the capital account. The current account records all transactions in the goods market.

The current account balance is often defined as the “external contribution”. In other words, it’s about the difference between exports and imports of goods and services. If a country has a positive external contribution, domestic capital increases as a result of net capital inflows. If, on the other hand, imports exceed exports, money flows out of the country and domestic assets diminish. The capital account records accounts receivable and household liabilities vis-à-vis other countries. Here, a distinction is made between capital imports and exports.

The difference is also called the net export of capital. If the performance and financial balance are not the same, an imbalance between the supply and demand of a currency is created. The resulting movement of the exchange rate returns the relation to the equilibrium point. Fixed exchange rate systems may also have long-term imbalances in the balance of payments.

Purchasing Power Parity Theory

The third model, the absolute theory of purchasing power parity (also known as purchasing power parity, PPP), compares the purchasing power of 2 currencies. The key message of the theory is that one currency that has been changed to another in the corresponding country will have the same purchasing power and therefore the same real value.

The external price level after conversion of the exchange rate should correspond to the domestic price level. If the exchange rate deviates significantly from this equilibrium, there should be a tendency to return to equilibrium according to this model, since in principle there is a possibility of a gain.

If, for example, a computer in the U.S. (In Euros) costs less than in the Eurozone, it would be worth buying it in the U.S. and reselling it in Europe. It’s worth it. The difference between the purchase price (converted to euros) and the sale price continues to provide a profit.

However, to purchase a computer in the United States, you will need dollars. The supply of the euro and the demand for the dollar will subsequently lead to an appreciation of the dollar, with the result that purchasing power in both monetary areas is adjusted. A popular example of this model is the so-called Big Mac index. This is a simple-built index of people’s buying power published regularly by The Economist.

The basis for calculating purchasing power is a comprehensive description of the prices of a standardized and readily available product: the Big Mac at a McDonald’s restaurant. For example, if a Big Mac in the U.S. costs $ 5.28 on average, while the price in Germany is $ 3.95, the theoretical exchange rate is $ 5.28 / € 3.95 = 1.34. If the current exchange rate deviates significantly from the theoretically determined value, it would be adjusted to this long-term value according to purchasing power parity. In reality, the purchasing power parity theory considers not only a good but a complete shopping cart. Moreover, not all price differences generate an opportunity for profit, as taxes, transport costs and customs duties must be considered.

Many goods cannot be marketed worldwide, especially services or haircuts which are not transferable. Therefore, the shopping cart should only contain marketable products worldwide.

Technical Analysis

A general topic of controversy is whether the technical analysis in the currency market makes sense. On the one hand, there are so many price adjustments that many patterns can arise. On the other hand, the market is so inefficient that these patterns (theoretically) cannot function sustainably. However, most of the tools provided by Technical Analysis (TA) are well used in foreign exchange trading.

Classic graphics formations, such as trend channels or resistance and support lines, can be used, as well as the most advanced techniques of trend recognition, indicators, and oscillators, as well as candle formations. Due to the trend behaviour of the currencies, a relatively unknown type of graph is offered for the correct exchange rate analysis: the so-called “Graph of points and figures” (P&F – Point and Figure). This is a variant of alternative representation to the bars and candles graphics that are widely used.

In the foreground of the P&F table is no longer the movement of price in temporal terms, but the development of movement. Times when only small price changes (i.e., lateral movements) occur are filtered out of the table. A variant of similar representation, but more visually understandable, are the so-called Renko graphics. Both types of charts work with trend lines, indicators, and formations. When using it, you should always keep in mind that the time axis, unlike the “normal” graphics, is variable. Therefore, it may happen that the chart does not change over a longer period of time, if price fluctuations were too low or if a significant movement has not developed.

Various Time Levels

The methodology of integrating several time windows into the analysis and the resulting trading decisions are mentioned in the trader jargon as multiple time frame analysis. Due to the speed of the Forex market, this technique is particularly suitable. The concept derives mainly from 2 approaches. First, many operators check the situation in the main time window (for example, small time window: minutes chart, main time window: time chart) before entering a new position.

Only when the hourly chart does not have the resistance or support at the same level as the minutes chart and the exchange rate does not move in an opposite trend, will it enter the market. Second, many traders use this approach to enter into a long-term trend.

The smaller window often allows for a better entry time. However, once the entry is made, the operation will be managed in the longer-term chart. However, the danger of over-operation will be threatened. Instead of focusing on the long-term vision, many operators observe the position in the subordinated time frame, even after starting, and take unnecessary risks. If you consider support and resistance, you should start at the highest available time window and advance to the smallest primary unit in time.

Intermarket Analysis

The dollar, of course, is the most important currency in the world’s financial system. Consequently, the dollar index is excellent for analytical purposes. Just look at the index to read the strength or weakness of the dollar against the main currencies: if the index rises, the dollar shows strength against the other currencies. If the dollar index falls, this indicates a weakness against the other major currencies. To measure even how a known currency is developed one compares its value with a basket of 6 coins. Specifically, this is the weighted geometric average of the US currency in euros, Japanese yen, British pounds, Canadian dollars, Swedish krona, and Swiss francs.

Market observers, who are interested in the interactions of different asset classes, know that the United States dollar plays an important role in cross-market analysis. From the historical development of the price, it can be clearly deduced that the global currency has a long-term negative correlation with the commodity market.

You can see how commodities entered a massive bearish trend, as the dollar index had a brilliant rally in mid-2014. For this reason, the United States dollar or the associated concept of the United States dollar index plays an important role in cross-market analysis, which examines the interactions between markets.

Appropriate Strategies – Long-Term

Now that we have learned a lot about currency market theory, we also want to deal with its practical application. To this end, we present two strategies that are interchangeable, on the one hand, in the long term and, on the other hand, in the short term. The carry trade is well known in exchange operations. Behind it is a simple system: funds are generated in a low-interest currency and invested in a high-yield currency. The difference between interest rates and the change in price is most important.

If the exchange rate does not change during the investment period, the return on the carry trade equals the interest rate spread. Also, a rise in the price of high-interest rates versus low-interest rates will lead to a further increase in revenue. In this case, the return on the interest rate advantage is further increased by the favourable development of the exchange rate. On the contrary, a devaluation of the currency in which it is invested leads to a reduction in yield.

If the percentage devaluation is above the interest rate spread, the trader loses money. If there are significant fluctuations in exchange rates to the detriment of the investment currency, the strategy could incur correspondingly high losses.

Carry trade is a popular strategy for hedge funds, as they are suitable for large sums of investment. Fund managers seek to identify macroeconomic developments at an early stage and make cost-effective use of appropriate strategies. In the same context, there is often debate about leveraged carry trades. Only part of the negotiated sum is deposited as collateral, taking advantage of existing capital. A Deutsche Bundesbank study in 2005 based on carry trade in euros against the dollar shows an average yield of 15 %, a multiple of the interest rate spread. A maximum of 71% profit would be possible.

However, annualized yields can vary widely and be markedly negative from month to month. Although carry trade is a long-term currency strategy it represents an interesting trading approach in the past and today. However, due to the high potential for detractions, the risk should not be underestimated. Rapid market movements can wipe out accumulated earnings in months or even years.

Appropriate Strategies – Short-Term

For short-term traders who want to generate profits in the volatile phases of the market, there is the breakup strategy of Maite Krausse. Breakage trading is a strategy used by many professional traders that offer satisfactory results in both swing and intraday trading. The best results are achieved in the volatile market phases or in strong trends, with uncertainty between market participants and continuous sidesteps minimizing the likelihood of successful entries. First, the range is displayed from 24:00 to 08:00 Central European Time (CET) on the 15-minute chart.

At this time, the maxima and minima are determined. Highs up to 8:00 a.m are considered the upper limit or resistance range, and lower prices represent a support level. If the price is now above the minimum marked or below the minimum, a purchase order is placed between 2 and 5 pips above the maximum, a sales order of 2 to 5 pips below the minimum.

This range is only valid during the respective day, after which it must be redefined and is therefore ideal for intraday traders. Orders are still valid until around 21:00. Thereafter, all pending orders are removed and redefined the next day. Once a purchase/sale order is activated, the transaction is carried out throughout the day, with a risk/probability ratio (CRV) of around 2:1 on mostly quiet days and a CRV of 4:1 on economically important days, given that the interest rate is a country’s decision.

For example, the loss limit (SL) can be set between 20 to 30 points. Profit-taking (TP) ranges from 40 to 100 pips, depending on market fluctuations. Therefore, a smaller TP will be chosen in the quiet phases of the market, and a higher estimated TP in days of interest rate decisions and global political events. Trading management is simple and must be set with an automatic limit of approximately 15 to 25 pips. In addition, in the 1-hour chart, you should pay attention to the areas of resistance or support in the area of the alleged inputs.

Therefore, a purchase order above the resistance, and a sale order below the support will be established. The most likely to benefit from this strategy lies mainly in the evolution of macro-influenced prices. Then, it is very useful to have a look at the daily economic calendar, as the greatest fluctuations are accompanied by surprises and new knowledge about the economic situation of a country and, therefore, the respective currency.

Particularly interesting are central bank decisions or protocols that provide directional indications. In those days, sometimes the profit can be generous around 100 or more pips. Inputs can be further improved by including breakdowns of price patterns such as upward and downward triangles, double floor/roof, and head and shoulders formations.

If the price has formed as a pattern, you should be careful and tune your inputs, because the buds of these patterns are often traded and are volatile. Another way to identify good break opportunities is through certain candle patterns that have formed on the daily chart. For example, the inner bar candle (also known as Harami bassist/bassist), can predict an imminent break, both in trend and in reverse, which is often used.

There is an inner bar formation when the next daily sail is of a different colour (day 2) and has its maximum and minimum price within the previous day’s sail (day 1). The entry is set on day 3 above/below the maximum/minimum sail of the second day.

Conclusion

The Forex market offers interesting trading opportunities that allow private traders to benefit from exchange rate changes. Whether it’s in the area of classic day-to-day operations, as well as to protect against price fluctuations or as a mix of separate strategies in the custody account. The advantages lie in the high liquidity and flexibility of the market and its 24-hour operation.

Moreover, foreign exchange markets always offer clear short-term trends. With trading margin and leverage, Forex is especially interesting for low capitalization traders. Operators also have the opportunity to choose between a more flexible interbank market, on the one hand, and standardised products, on the other. An investor will be able to choose from numerous trading instruments and strategies and combine them if necessary.

Categories
Forex Technical Analysis

Forex Technical Trading – Basic Algorithm Guide

You may feel that you have explored every possible source on indicators, learned about the best ways to combine them, and actually even started trading real money. However, you can always explore some new and innovative approaches to trading that may seem like an entirely new dimension despite having experienced success in the past. Whether they are beginners or whether they have already accumulated some experience, traders may still find some intriguing, refreshing, and stimulating facts and tips that can help them to collect more pips and considerably save time.

Lack of knowledge on some of these areas can even be held responsible for your previous losses or the fact that you might not have progressed as fast as you had hoped. Primarily, what we are going to be focusing on in this article is the proper way to read charts and manage the trades you are already in. As the title suggests, today’s advice will heavily rely on indicators, as the right use, aside from proper selection, directly influences a trader’s success and prosperity levels. 

We will first start with the general algorithm structure, which some traders are already aware of as it contains various measured trading categories. It is just an example you can follow right now for swing trading. Such an algorithm consists of six different indicators: the ATR is taking the first spot and the confirmation indicator holding the third one, while the exit indicator is positioned last. As this is an unfinished list, you should, upon extensive research and testing, make your own selection of indicators that can take the available places and complete the algorithm, as this article will not focus on it. What is more, you can keep searching for better options to adjust your current list, but make sure that you are confident regarding each tool’s purpose.

The ATR indicator is the very foundation of every trade that you will ever enter and since there is an extensive body of research on this particular tool, you should definitely put effort into learning as much as possible. It covers the volatility category and therefore also solidifies our position management. Next, the confirmation indicator’s job is to provide a signal so that you would know whether to go short, go long, or simply stay put and do nothing. The last one, the exit indicator, allows for you to exit trades before it knocks off any of your stops. However, even with this knowledge and after extensive research and use, traders can make fundamental mistakes that can outweigh the potential of the algorithm they have worked towards completing.

The ATR Indicator

The first step is to understand what the correct way of reading the chart is. We will first analyze the ATR indicator and pay special attention to where we want to focus on the chart to obtain the most accurate items of information. The image below is the example of the GBP/CAD daily chart, which can be considered as one of the more volatile currency pairs there are. The previous candle closed approximately an hour ago and this fact is the one piece of information you will always want to record and rely on in your trades. Some professional traders start analyzing the chart a little before the close of the daily candle as they can still discover information that will hardly change at that point, although the approach we are suggesting today is also equally important for everyone looking to enter a trade one hour after. Whether you choose to start assessing your options right before or slightly after the daily candle closes, what you should truly concentrate on is the candle that gives you data that you will be using in your next trade.

GBP/CAD Daily Chart: The Penultimate Candle

As the chart above reflects how one trading day ends and a new one begins, the place where we need to look is the penultimate candle in this chart or the candle which was last complete. Since the last candle that closed is not the last candle in this chart, make sure that you do not get confused as to where your focus of attention should be. We should not be then interested in the tiny candle indicating a day that has not ended yet (compare the last two candles marked by the yellow circle pointer), as it has only been one hour upon closing of the daily candle. The differences between the two will be valuable for your trading analysis and will still be relevant for other indicators as well.

The ATR of the currency pair in question equals 158 pips according to the indicator information provided on the left side of the chart below the white line. Nevertheless, forex experts insist that this is not the most relevant information, as the ATR value can be much higher. The reason for this lies in the data that is factored in the calculation of this value, so we need to pay attention to which 14 periods (ATR default setting) we are actually including in the average. Therefore, we should not make this ATR value on the left our focal point, but the value we get from the last candle that closed, which is the penultimate candle we marked yellow in the previous image. Since the trading day has just begun an hour ago, the last candle will never sufficiently add to the 14-candle average, throwing it off lower than should truly be. To obtain the information we need, we need only move the cursor over to the last closed candle for the white text box to appear, showing in this case the expected higher value of 162 pips. Therefore, this is the number we need to take into consideration to be best prepared to enter a trade.

This approach is how every trader can read the ATR properly regardless of whether they started trading slightly before or after the close of the daily candle. Some professional traders prefer to enter trades approximately 20 minutes before the candle closes due to the fact that they feel certain about having all the information they need at that point. Even if some changes occur, these experts point out that differences in terms of numbers would not be greater than one or two ATR pips maximum. Also, in the hour following the daily close spreads turn out to be changing drastically, so experts choose to start trading prior to these circumstances. This is an excellent perspective because it allows traders not to have to constantly worry about incorrect data or go back to find accurate information. This way you can access all relevant data and see it for what it truly is. 

In case you are ever unable to start trading at the time around the close of the daily candle, you can always rely on the ATR value shown on the left side of the chart. This data is far from incorrect because it is very close to the penultimate candle’s value. Therefore, you should not feel stressed about timing if your job-related duties or place of living, among other factors, do not allow you to be present at the time when you should factor in the data we discussed above.

Other Indicators 

What you should definitely pay attention to is the correct interpretation of other indicators, which involves several steps you need to understand properly. Many professionals lay emphasis on waiting for the candle to close in order to be fully able to read any indicator. If you allow yourself to be drawn up and down across the chart before a candle closes, your data will vary quite significantly. Some indicators may provide too many signals telling you to buy or sell several times in one day while the candle is forming. However, the only data you should be concerned with is the data you can access once this formation process is over, on the candle close. You can still choose to look at the numbers slightly before the close, but strive to be fully focused so as to be looking at the right candle and the right data.

The EUR/USD daily chart added below uses the Stochastics indicator, which is not a general recommendation but only a useful tool for a case study. If you focus on the blue and red lines in the following chart, you will see the yellow circle over the point where the blue line crosses downward the red one. When this phenomenon occurs, Stochastics is giving a trader an official signal to go short. Here, however, you may be surprised if you looked for the proof of the signal upon the close of the candle – the lines are close, but not actually crossing just yet. This is a clear indication that you should not be entering a trade at this point and you need to be very careful with how you interpret the chart. You will also not be including the last unfinished candle because, again, it would affect the 14-period average. The line connecting the candle with the red and blue lines of the Stochastics indicator below cannot be drawn perfectly straight, but it is a crucial point for traders to see how they, in fact, never received a real signal. 

The catch here is always to wait for the candle to close first because you need every piece of information pertaining to the candle and we can only obtain it upon candle close. From the perspective of now, we cannot know exactly what would happen with the price the following day – it might even go up really fast. Nonetheless, without having both conditions met – the signal and the candle close – you need to sit out and wait, refraining from taking any action at that point. In this case, as we noticed how the candle above the two-line cross was not a real signal, we would need to wait out for the next candle to close. Therefore, if you look below at the EUR/USD chart, the penultimate candle really does show the blue line crossing down beyond the read on, which is an official signal to go short. This information is only available upon candle closing or, what some professional traders do, trade 20 minutes prior to the close of the daily candle when you can expect little to no changes, and have a real chance of seeing how the lines would move next. Remember that your indicator is not really telling you the truth until a candle closes or is close to this point.

EUR/USD Daily Chart: Signal or No Signal?

How to Read Your Charts Fast

After accumulating knowledge on how to analyze what your charts and indicators are telling you, the very next step is to learn the ways in which you can quickly zoom through your trades. Professional traders, for example, can be trading as many as 28 currency pairs at the same time, but this does not in any way imply that they take more time to do so. Contrary to what one may expect, experts have actually managed to create a routine of trading approximately 15 minutes a day. Some of them claim to only trade 20 minutes before the close of the daily candle and many also trade across different markets too (e.g. forex and metals).

You may be wondering how a quarter of an hour can suffice with such a staggeringly high number of trades and information to read and process. The experts, in fact, manage their trades in a very similar fashion as everyone else with regard to the action they take – they observe the charts to see if they should make any changes, checking whether any trade should be closed out, half of the position taken off, or a stop loss adjusted, etc. Sometimes, your daily trade need not include any action as none is required, and being at peace with this is also a very important skill.

Professional traders also look for the opportunity to enter new trades every day, which can be done easily right after taking care of the trades they are already in. Here they advise traders to ensure that they are using the best possible confirmation indicator and invest time in looking for one should this step still pose as a challenge. The confirmation indicator is perceived as the backbone for almost every step of trading and is vitally important for increasing your efficiency in managing your trades. 

If your number one confirmation indicator is telling you not to proceed and enter a trade, any other indicators you are using will not be relevant. Since your main confirmation indicator is not giving you a signal to either buy or sell, you should stay put and accept this information. You should not at this point look elsewhere to find additional confirmation for what has already been confirmed, as it will only deplete your energy and waste your time. Any further clarification will only confuse you especially since this happens extremely rarely that your confirmation indicator does not give out any buy/sell signals.

Should your number one confirmation indicator tell you to enter a trade, you can look at the remaining parts of your structure. Here is where you can actually make use of other indicators to find additional proof that you should proceed and start to trade. If every indicator is telling you to go long or short, it is time for you to enter a trade. The process is, therefore, very simple as long as you follow these steps. 

To observe how this approach functions in reality, we will rely on the EUR/USD daily chart below. Here we are using the RSI indicator, which is another tool we do not recommend that you use despite its popularity among forex traders. The relevant information you are looking for when you are using the RSI essentially comes from a price moving into the oversold/overbought territory and returning to the middle area. This is the only signal this indicator will give you so focus on the line coming up/down and then coming back to the middle of the chart. One such example is surely the curve we see below the white pointer. However, should you ever get a signal of a few candles before the end of the chart, you should not pay attention to that. Rather focus your attention on the penultimate candle, which is this chart does not show any signals.

EUR/USD Daily Chart: RSI

You can also experience situations in which you happen to see the line going below the middle, for example, and you can tell that there is a high probability of it crossing back into the middle despite the daily candle being just about an hour old. From this standpoint, we can only predict based on the potential of the line crossing back some time later on that day, but we should never focus our actions based on prediction. If you use the RSI indicator, always wait for the daily candle to close, for it will generate real clues of where the line is going to end up eventually. Always remember that a false signal, despite how strongly we feel about it, is not a signal at all and we should not enter a trade based on impression or emotion but actual, real signal.

The steps provided above comprise the typical daily trading responsibilities of every professional trader. What you should do is simply apply these when going through your charts and there is no need for it to last long. If you start debating whether a signal is truly a signal or not and start giving in to your emotions, your trading experience will neither be fast nor lucrative. Look for the information your main confirmation indicator is offering and decide on your next step according to the signal, or the lack thereof. 

By following this approach, your trading should not last more than 10—15 minutes each day. The part where you assess the trades you are already in should approximately last up to two minutes, while the remainder is generally consumed by entering into new trades. Sometimes you will not initiate any new trades at all and just manage the existing ones. This mentality and these practical steps are absolutely the way to save your time and be more efficient in every respect.

To conclude, you should always make sure that you wait until the candle closes or start interpreting the chart just about 20 minutes before it happens in order for you to be able to get the most accurate information. Should you find time to be a precious commodity as well, always lock on your main indicator on each chart you are looking at. Should the number one confirmation indicator endorse you to move forwards, consult with your other tools. This is the easiest and the fastest approach to entering new trades and handling the existing ones, which will take only up to a quarter an hour of your time each day. 

Finally, do not give in to your impulses and desires, hoping for something to be a signal when it actually is not. Prevent any future failure with your firm reliance on technical support, clear rules, and discipline and stay away from predicting potential. Forex trading can be exceptionally easy if we leave out self-sabotaging tendencies and apply strict strategies that are supported by a fine selection of tools. Therefore, in order for you to use your indicators the best possible way, you really need to put effort into finding the right ones to complete these elements of the example algorithm, as well as use the facts and advice we shared with you today to propel your trading skills and maximize your rewards as a result. Other indicator categories that should be included in your algorithm is Volatility/Volume, on chart Baseline, and additional confirmation indicator belonging to a different theory. These elements and their function will be covered in another article, but the current basic algorithm example should point you in the right direction already.
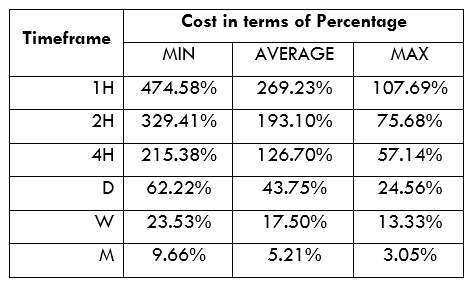
Categories
Forex Course

166. Introduction To Obscure Currency Crosses & Why It Is Very Risky To Trade Them?
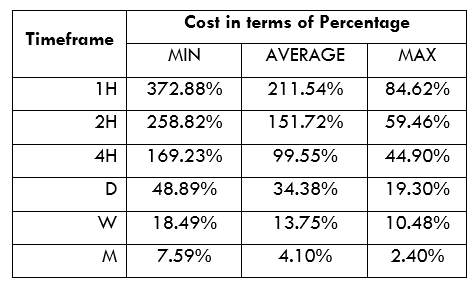
Introduction

Trading currency crosses an excellent way to make money from forex trading when major currency pairs do not make a good move due to the US economy’s corrective momentum. However, the US dollar is a global reserve currency of every country. Therefore, it can provide enough liquidity to make money where the obscure currency crosses have some risks due to insufficient liquidity.

What is Obscure Currency Cross?

We can find currency crosses when we eliminate the US dollar from major and commodity currencies. However, among the cross currencies, the Euro and the Japanese Yen are mostly traded. Therefore, if you trade any Euro and Yen related cross pair, you might see the price to have adequate liquidity. But, what happens if the currency cross does not have Yen or Euro?

Any cross currency pairs that do not have Japanese Yen or Euro as a first or second currency is called an Obscure currency cross. Examples of obscure currency crosses are GBPCHF, NZDCAD, AUDCHF, CADCHF, NZDCHF, NZDCAD, etc.

Why are Trading Obscure Currency Crosses Risky?

The forex market is run through a decentralized network where no one can dominate any market. Therefore, the movement of a currency pair depends on the supply and demand of that currency pair. When the supply or demand increases, the currency pair starts to move. On the other hand, when there is less volume, the currency pair may move within a correction.

The liquidity remains lower in the obscure currency pair than major, commodity, and EUR/YEN related currency pairs. Therefore, there is a risk of market volatility and correction. In some cases, obscure currency pairs consolidate for a long time, and if we take any trade on that pair, we might have to hold the trade for a considerable time.

Conclusion

In conclusion, we can say that trading obscure currency pairs have some reason to worry due to not having enough liquidity to provide a decent movement. However, it is a great way to make money from obscure currency pairs if we can read the price action well and identify the price is moving within a trend. Overall, maintaining a profitable and robust trading strategy is the key to make a consistent profit from the forex market.

[wp_quiz id=”86520″]
Categories
Forex Course

165. Knowing More About Trading The Euro & Yen Crosses

Introduction

In cross-currency trading, the Euro and Japanese Yen are the most traded currency. Therefore, after major currencies, EUR and JPY has the highest liquidity in the forex market. Overall, trading in the Euro and Yen crosses are secure compared to the other cross currencies.

Understand the European Economy

When trying to trade in any Euro cross pairs, we should understand the European economy even if we only follow technical analysis. In technical analysis, traders can make decisions based on previous price movements. Therefore, many traders think that there is no need for fundamental analysis.

However, in trading, we aim to increase the probability of our analysis. Therefore, when we add Europe’s economic condition, we will have a better outlook of trading Euro crosses like- EURCHF, EURAUD, EURNZD, etc.

The European economy consists of several countries, including France, Italy, Germany, etc. Therefore, trading in the Euro cross requires to know interest rate decisions, retail sales, employment export-import, GDP, and other economic releases of these countries.

Moreover, in Euro cross trading, we should focus on other currencies that combine with the Euro. For example, if we want to trade in the EURCHF pair, we should focus on Switzerland’s economic condition.

Understand the Japanese Economy

In Yen cross trading, we should have extensive knowledge of the Japanese economy. Japan is an export-oriented country. Therefore, it tries to depreciate its value against other major currencies by keeping the interest rate lower.

Overall, any increase in interest rate, retail sales, employment, and GDP are suitable for the Japanese economy.

Besides the Japanese economy, we need to understand the economic condition of the Japanese Yen combination. For example, trading in the CADJPY pair requires a fundamental analysis of both the Japanese and Canadian economies.

Conclusion

Overall, the Euro and Japanese Yen cross are mostly traded currency in currency crosses. Therefore, to trade Euro and Yen crosses, we should know these two countries’ economic conditions. Even if we don’t trade based on fundamental analysis, having good knowledge is essential to have an overall outlook of the economy. Cheers.

[wp_quiz id=”86515″]
Categories
Beginners Forex Education Forex Basics

Healthy Trading Habits to Try Today

Forex trading is a great way to put extra money in your pocket or to earn an unconventional income without having to worry about working a 9 to 5 job. However, the results that one gets depends on a variety of factors, including time spent researching, effort, trading strategies and plans, and so on. Revenge trading, overtrading, and other bad habits can wreak havoc on your trading profits and cause some traders to walk away forever after losing their investment. If you’re currently practicing bad habits, or if you haven’t started trading yet, consider trying these healthy trading habits if you want to see your profits improve significantly.

Habit #1: Reviewing Closed Trades

It’s important to take a look at your results after every closed trade, even winning ones. This helps to distinguish what you’re doing right and wrong, or where your trading plan is or isn’t working. Some traders might pay more attention to these details in the beginning but get lazy with reviewing their trades later on. Don’t fall into the bad habit of letting things go out of sheer laziness, or else you might start to miss things that could be changed to improve your results. Our best advice for this healthy habit is to keep a trading journal, which is used to log important details about each trade for review. This is the easiest and most organized way to keep up with your trading activity and to track improvement over a period of time. 

Habit #2: Only Enter Trades for a Reason

Some traders fall into the bad habit of overtrading because they are looking for the emotional rush of entering a trade, even if evidence doesn’t support it. Others might make the mistake of feeling lazy if they don’t trade on a certain day and enter a trade so that they feel as though they are doing something productive. The best traders actually recognize when it isn’t a good time to enter the market and know when to do nothing. If you want to practice this healthy habit, you need to start by outlining the reasons why you will enter trades in the first place. You might base this on economic data, fundamental analysis, technical analysis, or other pieces of factual information. If you don’t see the signs you’re looking for, simply don’t enter the trade. Remember that it’s better to do nothing than it is to enter a losing trade for the sake of doing something.    

Habit #3: Don’t Let Your Emotions Get the Best of You 

Trading when you’re emotional is a very bad habit that can cause you to make clouded decisions that will likely lead you to lose money. It’s true that many professional traders can control their emotions and don’t get bent out of shape over losses, however, it takes time to become disciplined enough to keep those emotions at bay. If you feel yourself getting anxious, fearful, or overly excited, you should take a deep breath and step away from the computer for a moment until you feel more level-headed.

If you find that a certain emotion is affecting you often, consider doing research online for tips that can help you deal with that exact problem. This is another habit that revolves around the need to recognize when it’s best not to trade. Like with our 2nd healthy habit, you can also double-check that the trade you want to make meets the criteria you’re looking for if you’re feeling out of your element.

Categories
Forex Basics

The Most Common Reasons Why Forex Traders Lose Trades

As traders, we are driven to do our best and to walk away with a profit, otherwise, what’s the point? While the market presents vast opportunities for profit and growth, it is also unpredictable and isn’t shy about throwing us a curveball when we’re least expecting it. Of course, there are some ways that you can limit the losses you take, starting with understanding the most common reasons why forex traders lose trades in the first place. 

Reason #1: They Don’t Know Enough

One of the greatest things about trading is that just about anyone can do it with a few dollars and an internet connection. The downside is that many newbies jump in too quickly and open a trading account before they really know what they’re doing. If you don’t understand key indicators, know the best times to trade, or understand how the market works, how do you expect to make money? These traders are also more likely to experience frustration when trying to figure out how to work their trading platform. All of this leads to lost trades but this problem can be avoided if beginners would spend more time learning. If you’re experiencing this problem, you should take a break from trading and spend some more time becoming acquainted with everything you need to know. Then, you’ll be ready to come back and actually start making real money. 

Reason #2: They Don’t Have a Plan

Traders need a detailed plan to follow. This plan needs to think about what they will trade when they will trade, how they will trade, and so on. Failure is often contributed to trading without a strategy or deviating from your plan once it’s in place. Those that don’t skip this step really know what they’re doing and they can avoid problems such as being unsure of whether to enter a trade because their plan tells them what to look for. A plan also gives you a place to start when it comes to improvement because you can go back to analyze your results, figure out strengths and weaknesses, and make changes when needed.

Reason #3: They Risk too Much

Some traders are tempted to take big risks in order to win big, but this isn’t gambling. We have to remember that part of the success of being a forex trader involves limiting your losses in addition to having winning trades. In some cases, you might even have a higher number of losing trades but come away with a profit because those losses were controlled. Many professionals recommend keeping your risk tolerance to 1-2% of your account balance per trade, but this really does come down to personal preference. Still, you should not be risking big chunks of your account balance on each trade, as this is a surefire way to lose your investment. 

Reason #4: They Don’t Understand Trading Psychology

Traders that don’t understand the ways that emotions can affect trades might not pick up on big mistakes they’re making. For example, if you’re feeling greedy, you might be prone to overtrading. Those that are anxious or fearful avoid entering winning trades or pull out too early out of the fear of losing money, some traders take up revenge trading when they are angry that they’ve lost money, and so on. Trading psychology is a broad field that covers several different topics, so all traders should be sure to invest some time into learning about it. This way you’ll be more likely to spot emotional mistakes and you’ll know where to look for tips to overcome them. 

Reason #5: They Trade on Bad Days

Some traders keep losing because they just don’t know when to quit. If you’ve had a horrible day with a string of losses, for example, perhaps you should take a break and clear your head so that you can come back to trading with a fresh start. This would also be a great time to review your recent losses in your trading journal to figure out what the issue is. A bad day could also be at fault of the market, where there just aren’t any good moves to enter. Instead of forcing trades that could end badly, this is another time when traders should just sit out and wait for better opportunities.

Categories
Forex Basics

Real-Life Lessons We Learned as First-Time Traders

Making the decision to become a forex trader is an empowering one, and while some of us are apprehensive about opening a trading account, others find it exhilarating. After all, if you’ve spent quite a lot of time researching and you feel that you’re totally prepared, then you’re ready to make money. This was how I felt when I opened my first trading account – I had an image in my mind of how it was going to be and how much money I was going to make. The good news is that I did make money, but I learned some lessons in the process. 

Lesson #1: Don’t Be too Sure of Yourself

Self-bias is a common problem that affects many traders. We tend to look for information that supports our hypothesis to enter a trade, while ignoring evidence that suggests we shouldn’t. We also might trick ourselves into thinking that a trade is guaranteed to be a winner because we feel overly confident. I made this mistake once and lost way too much money on a trade because it seemed like I just couldn’t lose thanks to the information I was receiving from my indicators. If I had remembered that the market is unpredictable and tightened my stop loss, I could have cut back on those losses. 

Lesson #2: Don’t Trade Just Because You Feel Like it

I woke up one morning, had a cup of coffee, and felt like being productive. However, the market just wasn’t showing me any good moves and there wasn’t any evidence that I should enter a trade. After sitting around for a while, I just couldn’t stand it anymore – so I entered a trade to feel like I was doing something. The trade lost money and I learned a valuable lesson in that sometimes it is better to do nothing. If you want to avoid this problem, always ensure that there is supporting evidence to enter a trade based on your trading plan, and don’t trade just to feel the rush. 

Lesson #3: Be Careful How Much You Risk

In the beginning, it can be tempting to risk too much money partly because you don’t realize that it’s too much. In reality, you shouldn’t be risking more than 1-2% of your total account balance on each trade, especially in the very beginning when you’re more likely to make mistakes. While I only risked slightly more than I should have, I did learn to tone it done after taking a couple of hits. Remember, being a successful forex trader is as much about managing your risk as it is about winning trades. 

Lesson #4: Don’t Open Too Many Trades

On another productive morning, I decided to enter multiple trades at once to increase my chances of making a profit. Unfortunately, I got stressed out rather quickly and had trouble watching over each open position. Some of us may be better at multitasking than others, but you shouldn’t push it in the beginning. It’s better to stick with a couple of positions at a time until you get the hang of it, or for good if you’re easily stressed.

Categories
Forex Basics

Forex Trading: Is there a Holy Grail?

When you decide to become a trader, you might start looking for a magic answer that is “guaranteed” to be profitable. This is only natural, as humans are accustomed to looking for cheat codes. If there’s an easier way to do something, we’re all for it, especially where money is involved. This is why beginners are often drawn in by brokers that promise you’ll make a profit or by similar claims that come in the form of forex strategies or robots that will magically trade for you without ever losing money. At least, these products are advertised in this way, but it’s important to know that these are false advertisements. 

If you’ve been trading for some time, you may have already gotten burned by a shady broker or invested a few hundred dollars into a forex robot that lost money. Or maybe you took advice from someone online that claimed to have figured it all out. We’re not saying that everything you read online is a lie, but it is impossible for anyone to promise that you won’t lose money trading. Allow us to explain why.

First, nobody can accurately prepare for all of the uncertainties that come with the trading market, even if they are developers or very experienced traders. In order to know these things, that person would need to be able to predict what financial institutions will say in the future, predict national disasters, and prepare for other unexpected circumstances ahead of time. Obviously, this isn’t possible.

Another cause of market unpredictability is the fact that it is moved by humans. One person might interpret an economic release in a different way than another while some might hold onto a position longer than others. You can’t always predict what other humans are going to do because different traders think differently. It’s also hard for software like trading robots to predict because they don’t think like humans, who are susceptible to emotions and other uncalculated factors.

Many trading systems that you read about online do work well under certain market conditions, but they don’t perform well under others. Things might go in your favor for a while, then you’ll start losing money when the price shifts into another pattern. This doesn’t mean that these tools and systems aren’t useful, only that they can’t be 100% right all of the time. You can also add to your problems by making mistakes like using too many indicators, which can cause delayed trading decisions or make you feel overwhelmed. 

At the end of the day, every trader needs to know that there is no holy grail in forex trading. Some strategies, robots, and systems work much better than others, that much is true. You can also find some golden advice online, while others may not give you the best suggestions. The key is to figure out what works best for you, develop a solid trading plan, and to manage your risk. Also, always remain cautious when someone promises or guarantees that they can make you rich when it comes to trading.

Categories
Forex Basics

The Real Causes of Ups and Downs in Trading

Have you ever found yourself in a pattern while trading, where you make money for a period of time, only to start losing money, and then the cycle repeats itself? This phenomenon is often referred to as a “trading yo-yo” because traders bounce back and forth between the two stages of being profitable and losing money. It’s true that trading is like riding a rollercoaster, which might cause many traders to overlook this pattern or to fail to realize that it is being caused by their own actions. 

In reality, the trader begins to make money, which makes them feel overconfident in their abilities, which leads to bad trades. Once you’re losing money, you start to make the necessary efforts to improve your results, so you start taking things more seriously. Then, you start making money again, only to become overconfident once more, thus repeating the cycle. Humans are prone to this cycle in everyday life as well, as many of us have ups and downs when it comes to sticking to a diet, maintaining social obligations, and other activities. 

Fortunately, there are some tips that can help you avoid this problem with trading in the same ways that you can find articles that help deal with the yo-yos of everyday life. It may seem like you could simply stick to your trading plan and avoid becoming overconfident, but the answer isn’t as simple. If you really want to overcome this problem and stop experiencing downtime in trading, try following our advice:

  1. Don’t fall victim to recency bias. To be clear, this occurs when a trader only looks at data from recent events or trades, while disregarding older but equally important events. When this happens, you might only pay attention to your most recent winning trades without remembering the lessons you’ve learned in the past. 
  2. Watch out for overconfidence. You should always have faith in your trading plan, but it isn’t smart to assume that you will always be right when it comes to trading. Remember that the market is unpredictable, so you shouldn’t make mistakes like taking larger than normal position sizes or entering trades when there isn’t reliable evidence to do so.
  3. Make sure that you don’t measure your self-worth on your account balance alone. Yes, a lot of money in your trading account can make you feel good, but there’s a lot more to think about. You need to remain rational when it comes to winning or losing money. 

If you’ve been experiencing ups and downs in trading, you shouldn’t ignore the problem and expect it to go away. In order to keep bringing in consistent profits, you’ll need to make changes to ensure that overconfidence isn’t bringing you down. Try following our tips above and refer to your trading journal to monitor your progress along the way. In time, you’ll likely find that you’re experiencing fewer downs and bringing in more profits.

Categories
Forex Basics

Calculating Your Trading Plan Expectancy

One of the biggest steps to successful trading is accomplished once you develop your trading plan. Your plan serves as a roadmap that covers everything having to do with the reasons why and how you’ll trade. This includes the evidence you’ll look for before entering a trade when you’ll exit trades, risk-management precautions you’ll take, such as how much money you’re willing to risk on each trade, and so on. Many professionals will tell you that you should create this plan and stick with it if you want to remain profitable, rather than going rogue30 and doing something else.

Of course, there may be times when a trader creates a plan that just doesn’t work. Many traders test their plans on a demo account beforehand, but some skip this step or don’t spend long enough in testing because they think their plan will work well on a live account. Others might develop a plan that works for them in the beginning, only to realize that they’ve outgrown their original plan over time. Regardless, there are times when you’ll have a solid trading plan that you need to live by because it works so well, and there are times when you’ll need to scrap your plan and start over because it just isn’t working for you. So how do you tell the difference?

If you are trying to figure out how successful your plan is, you should calculate your trading expectancy. This involves taking a look at your trading journal in order to measure all your winning trades versus losing trades, and then determining how much your winning trades won versus how much your losing trades lost. Obviously, you might have a higher number of losing trades, but this doesn’t mean that you weren’t profitable, as your winning trades still could have made more than you lost altogether. 

This is the formula used to calculate expectancy for your trading plan:

 Expectancy = [1+(W/L)] ×P−1

W = Average winning trade

L = Average losing trade

P = Percentage win ratio

After using the calculation, you should come out with a percentage that tells you how much you’re winning or losing while using your trading plan. From there, you can decide whether the plan is working well, or if you need to throw it out and try again. Remember that this formula can be helpful if you’re unsure how much you’re winning or losing, or if you’d like to put your plan’s success rate into a simple percentage rather than explaining how many trades you’ve won or lost. 

Categories
Forex Basics

Your Money-Related Forex Questions Answered

Those that have considered a career in trading often ask many questions in the beginning regarding many different topics, however, one of the most common themes seems to revolve around money. After all, the main reason why you would choose to trade forex would be to make money, so this raises a lot of questions about whether it is actually possible to do so or if trading is simply too good to be true. Stay with us to get answers to some of the most common money-related trading questions.

Q1: How much money do you need to start trading?

A1: If you’re willing to start with a mini account, you can usually start trading with a very small amount of money, with some entry barriers as low as $1. Of course, it would be wise to try to deposit more than this so that you can place at least a few trades before you need to top up your account. If you’re looking to open a standard account or better, you’ll need to commit to making a larger deposit, usually in the field of $100 – $500 or more. 

Q2: Can trading make me rich?

A2: Absolutely! However, you need to know that there are several factors that will affect how much money you make. For example, if you only deposit $100 at first, you can’t expect to become a millionaire rapidly. Other factors, like the effectiveness of your trading plan, your experience, market conditions, etc. will also affect how much money you make.

Q3: How much money can I make trading?

A3: Once again, this depends on several factors. In one study that has been published, it was found that a $30,000 deposit could yield over $3,000 in profits per month if you were to make several trades a week. Still, this is only a ballpark estimate because results would be different for every trader.

Q4: Can I quit my job to become a full-time trader?

A4: Technically yes, but we wouldn’t recommend quitting immediately. It’s a good idea to start trading part-time so that you can ensure you have realistic expectations and to make sure that you’re good at trading. If you’re seeing consistent profits and know that you could make enough to support yourself, then you could make the move to full-time trading.

Q5: Why should I become a trader when money isn’t guaranteed?

A5: It’s true that profits aren’t guaranteed, but trading does offer several perks. For one, you could make a lot of money in a short amount of time instead of getting paid by the hour like you would with a regular job. This is a great way to make money in your spare time from the comfort of your own home, which makes the risk worth it for many people.

Q6: What if I’m interested in trading but I can’t commit to making a deposit?

A6: The best place to start would be with a demo account, which will allow you to trade in a live environment with virtual money. Since there’s no risk, you can walk away from the demo at any time with no obligation to open a live account. If you do well, you’ll probably feel more comfortable making a deposit. 

Q7: Aren’t most brokers scammers?

A7: Some are, but many aren’t. You do need to research any potential broker you’re looking at beforehand so that you can avoid falling victim to any scams. It’s better to stick with more popular brokers and to double-check their regulation status. If the broker passes these tests, you’re safe to open an account. 

Q8: What if I lose all the money I invest in my trading account?

A8: Unfortunately, you’ll be out of luck if you lose your deposit because of your own trading choices. This doesn’t mean you should give up, but it is usually a sign that you might have opened an account too quickly. If this happens you should open a demo account with no financial risk and spend some time learning about trading, then you’ll be more prepared and less likely to lose the next deposit you make. 

Q9: I know I can open a trading account with a small deposit, but is there really a point?

A9: Did you know that many brokers offer bonuses that will double your starting deposit, along with welcome bonuses that give you free money to trade with? There’s nothing wrong with starting small either, as long as you start somewhere. Over time, your account balance will grow. 


Categories
Forex Course

164. Do You Know What A Synthetic Currency Pair Is?

Introduction

In institutional trading, traders usually take trades with a more significant volume, which often makes trading impossible in some currency pairs due to not having enough liquidity. Therefore, institutional traders create synthetic currency pairs to take trades on those pairs.

What is a Synthetic Currency Pair?

If an institutional trader finds a possibility of a decent upward movement of AUDJPY pair, but due to not having enough liquidity, they might be unable to take a buy trade. However, the alternative option to take the trade is to buy both AUDUSD and USDJPY as there is enough liquidity in these pairs. As a retail forex trader, we can take similar action as institutional traders. If we perform AUDUSD and USDJPY trades at the same time, we are trading in synthetic currency pairs.

In our current world, Internet connectivity makes trading easy; therefore, many brokers offer to trade currency pairs like CHFJPY or GBPNZD. However, these pairs have some issues regarding the spread and overnight fee. In some cases, cross-currency pairs like AUDCHF, GBPNZD, and CHFJPY move within a consolidation for a specified period. Therefore, trading in these pairs is costly, even if the broker allows.

How to Create Synthetic Currency Pairs?

Creating synthetic currency pairs need to open two trading entries with its margin. In synthetic currency trading, there is a common currency bought in one currency pair and sold in another currency pair. Overall, we will eliminate the common currency by buying and selling; therefore, the ultimate currency pair will remain that we are expecting to buy.

Is Synthetic Currency Pair Trading Profitable?

Trading in synthetic currency pair requires an additional margin, which is not wise to use. Moreover, in the present world, most brokers allow maximum currency pairs that reduce the hassle of trading two currency pairs at a time. Therefore, it is not recommended that traders trade in synthetic currency pairs if the broker has an option to take trades on the main currency pair.

Conclusion

Synthetic currency pair is a combination of the currency pairs where a single currency is bought in one pair and sold in another pair. In the present world, most Forex brokers allow trading cross and exotic currency pairs that eliminate the need for synthetic currency pairs. However, if any broker does not allow trading in a specific pair, we can use this method.

[wp_quiz id=”86510″]
Categories
Forex Course

163. Trading Currency Crosses Using Fundamentals

Introduction

In fundamental analysis, we can interpret two countries’ economic data of a cross-currency to predict the upcoming price movement. On the other hand, even if we ignore the US dollar, it has some shadow effect on a currency cross.

How to Trade Fundamentals with Currency Crosses

Let’s say Australia’s economic condition is good, and the Reserve Bank of Australia increased the interest rate. As a result, the primary expectation is that the AUD will be stronger against other currencies. On the other hand, we can find other currencies that are facing economic difficulties. Let’s say Eurozone is struggling, and ECB provided some dovish tone to provide an outlook of the current economic condition.

In this situation, we can evaluate the Eurozone’s economic condition and Australia to determine which country is doing well. If Australia shows a better than expected employment report, our first aim would be to buy AUDUSD. However, what happens if the USA showed a strong employment report?

Yes, AUDUSD might consolidate, and the difference between supply and demand would not change. In this situation, it is better to find other currencies that are weaker than in Australia.

Is Fundamental Trading Profitable for Currency Crosses?

In Forex trading, we predict a currency pair’s upcoming movement based on the technical and fundamental analysis. When we see that one currency has reason to become stronger than other currencies, we anticipate the price towards the stronger currency. The fundamental analysis is a process to find a stronger or weaker currency in a currency pair.

Due to having a lot of equity and market participants’ involvement, any fundamental news works well in USD related currency pairs. However, it does not mean trading currency crosses with fundamental analysis is not profitable.

We can quickly evaluate the UK and Japan’s economic conditions to identify the price direction of GBPJPY. Therefore, we can apply the same theory to every currency cross, like AUDJPY, AUDCHF, NZDCAD, or AUDNZD.

Concussion

Fundamental analysis is a process to anticipate the movement of a currency pair based on the two countries’ economic conditions. However, making an analysis ideally is the primary tool to make a profit from the forex market. Therefore, we should focus on money management, risk management, and trade management to get the ultimate trading result.

[wp_quiz id=”86506″]
Categories
Forex Market Analysis

Daily F.X. Analysis, October 30 – Top Trade Setups In Forex – Series of GDP Ahead! 

On the news front, the economic calendar is due to a report series of CPI and GDP figures from the European economy. These events are likely to be overshadowed by the U.S. Personal Pending, Chicago PMI, and Revised UoM Consumer Sentiment, which are expected to slightly worse than beforehand. This may add further bearish bias for the U.S. dollar today.

Economic Events to Watch Today  


EUR/USD – Daily Analysis

The EUR/USD pair’s prices were closed at 1.16742 after placing a high of 1.17587 and a low of 1.16500. The EUR/USD pair extended its previous daily losses and continued its bearish streak for the 4th consecutive session on Thursday. EUR/USD pair dropped to its more than one month lowest level on Thursday amid the broad-based U.S. dollar strength along with the rising number of lockdown restrictions in Europe.

The sharp decline in Euro against the U.S. dollar was derived by the European Central Bank’s decision on Thursday to hold its interest rates but gave signals that another monetary policy tool remains, and the bank would recalibrate its policy tools in December. As per the President of the European Central Bank, Christine Lagarde, it was necessary to cushion the European economy through pandemic and recalibrate its instruments at their next Governing Council meeting.

Lagarde refrained from expressing that the bank was looking at using all instruments rather than just topping up the 1.35 trillion euros PEPP at its upcoming Dec.10th meeting. Lagarde warned that the risks to the Eurozone recovery were tilted to the downside and suggested the pace to recovery or lack thereof would largely depend on the efforts of the economic bloc to contain the virus spread.

The growth of the Eurozone economy has come under pressure as the two biggest economies of the European Union, France, and Germany, have been forced to re-impose lockdown measures and raised the urgency to deliver more easing at the end of the year.

The Euro currency remained under pressure on Thursday after Lagarde’s comments and the central bank’s decision that ultimately added pressure on EUR/USD pair.

For October, the German Prelim CPI raised to 0.1% from the forecasted 0.0% and supported the single currency Euro on the data front. At 13:00 GMT, the Spanish Flash CPI for the year declined to -0.9% from the forecasted -0.4% and weighed on the single currency Euro that added pressure on EUR/USD pair. At 13:55 GMT, the German Unemployment Change for September came in as -35K against the forecasted -5K and supported the single currency Euro.

At 17:30 GMT, the Advanced GDP for the quarter raised to 33.1% from the estimated 32.0% and supported the U.S. dollar from the U.S. side. The Unemployment Claims for the previous week slipped to 751K from the anticipated 773K and supported the U.S. dollar. At 17:32 GMT, the Advance GDP Price Index for the quarter surged to 3.6% from the projected 2.9% and supported the U.S. dollar. At 19:00 GMT, the Pending Home Sales for September dropped to -2.2% from the projected 3.1% and weighed on the U.S. dollar. Most of the US-supported data weighed on EUR/USD pair towards the downside and added in the losses of the currency pair on Thursday.

Daily Technical Levels

Support Resistance

1.1798 1.1789

1.1672 1.1834

1.1626 1.1870

Pivot point: 1.1753

EUR/USD– Trading Tip

The EUR/USD traded with a bearish bias, having dropped to the support area of 1.1653. Above this, the pair has strong odds of taking a bullish turn until the 1.1700 area. Continuation of an upward trend may lead the EUR/USD price towards 1.1758, and bullish crossover of this area can lead the pair towards the 1.1820 level. Conversely, a bearish crossover of 1.1653 support level can extend selling until the 1.1613 area as a double bottom support area extends the level.  

GBP/USD – Daily Analysis

The GBP/USD pair was closed at 1.29126 after placing a high of 1.30255 and a low of 1.28806. The GBP/USD pair extended its previous daily losses and remained bearish on Thursday. The GBP/USD pair moved to its lowest level in almost 2-weeks and then recovered some of its losses in the late trading session on Thursday. The strength of the U.S. dollar drove the decline in the GBP/USD pair.

The U.S. dollar was strong due to the emerging risk-averse market sentiment and the strong macroeconomic data for the day. The delayed U.S. stimulus measure also helped the U.S. dollar to remain strong in the market. The U.S. Dollar Index (DXY) climbed above 94.00 level, its highest in almost a month, on Thursday as the risk-averse market sentiment emerged. The strong U.S. dollar added pressure on GBP.USD pair and dragged them to its 10-days lowest level.

On the data front, at 14:30 GMT, the M4 Money Supply for September raised 0.9% from the forecasted 0.3% and supported British Pound. At 14:32 GMT, the Mortgage Approvals raised to 91K from the forecasted 76K and supported British Pound. The Net Lending to Individuals came in line with the expectations of 4.2B. Britain’s data supported the local currency Sterling that capped further losses in the GBP/USD pair on Thursday.

From the U.S. side, at 17:30 GMT, the Advanced GDP for the quarter surged to 33.1% from the projected 32.0% and supported the U.S. dollar. The Unemployment Claims for the previous week fell to 751K from the estimated 773K and supported the U.S. dollar. At 17:32 GMT, the Advance GDP Price Index for the quarter advanced to 3.6% from the anticipated 2.9% and supported the U.S. dollar. At 19:00 GMT, the Pending Home Sales for September fell to -2.2% from the expected 3.1% and weighed on the U.S. dollar. The better than expected data from the U.S. supported the local currency U.S. dollar that added pressure on the declining GBP/USD pair’s prices.

On the Brexit front, the negotiations between the E.U. and U.K. were in progress with no headlines for the time being. However, the hopes were high that a deal could be reached this time as both sides were eager to solve the impasse given the limited time left for the end of the transition period. If a deal is reached, then British Pound will see a sharp rise in prices; however, analysts believe that a Brexit deal would likely offer only temporary relief for British Pound. They believe that Sterling’s near-term outlook will continue to be dominated by the late-stage Brexit negotiations that would include the significant trade frictions, the threat of tariffs and quotas.

It means that a Brexit deal between the E.U. and U.K. would not remove all the risks for British Pound and that sterling will still have to face further difficulties even after an agreement is reached.

Daily Technical Levels

Support Resistance

1.2909 1.3057

1.2839 1.3135

1.2762 1.3205

Pivot point: 1.2987

GBP/USD– Trading Tip

The GBP/USD is trading sharply bearish since the violation of the symmetric triangle pattern at the 1.3017 level, and the formation of bearish candles below the 1.3017 level has driven strong selling until the 1.2913 support area. For the moment, the Cable my lead GBP/USD price towards 1.3046 level for the sake of bullish correction. Conversely, the GBP/USD pair may find immediate support at 1.2913, and a bearish breakout of this level can be captured until the 1.2840 level.  

USD/JPY – Daily Analysis

The USD/JPY pair was closed at 104.593 after placing a high of 104.725 and a low of 104.023. The USD/JPY pair rose on Thursday and posted gains after falling for two consecutive sessions on the back of the strong U.S. dollar and the better than expected macroeconomic data from the U.S., along with the disappointing data from Japan.

At 04:50 GMT, the Retail Sales from Japan for September dropped to -8.7% from the forecasted -7.5% and weighed on the Japanese Yen that added strength to the USD/JPY pair. At 10:00 GMT, the Consumer Confidence for October in Japan declined to 33.6 from the forecasted 35.2 and weighed on the Japanese Yen that supported the USD/JPY pair’s bullish move.

From the U.S. side, at 17:30 GMT, the Advanced GDP for the quarter advanced to 33.1% from the estimated 32.0% and supported the U.S. dollar. The Unemployment Claims for the previous week slipped to 751K from the anticipated 773K and supported the U.S. dollar. At 17:32 GMT, the Advance GDP Price Index for the quarter raised to 3.6% from the estimated 2.9% and supported the U.S. dollar. At 19:00 GMT, the Pending Home Sales for September declined to -2.2% from the projected 3.1% and weighed on the U.S. dollar.

The better than expected data from the U.S. gave strength to the U.S. dollar that ultimately added further gains to the USD/JPY pair on Thursday. Meanwhile, the U.S. dollar was also strong due to the comments from the Head of Congress and White House that signaled a tough road ahead for a coronavirus stimulus even after the next week’s U.S. election.

The U.S. Congress delivered a Coronavirus Aid, Relief, and Economic Security (CARES) stimulus worth about $3 trillion. Since then, the Democrats and the Republicans have been locked in a stalemate on a successive package to CARES. The differences have been over the size of the next relief bill among both parties. Over the last two weeks, the hopes that a coronavirus relief package will be delivered before elections faded away despite the months of negotiations between Democrats & Republicans. The investors thought that a deal might be reached after the election, regardless of the winner.

However, the Speaker of the House of Representatives, Nancy Pelosi, revealed on Thursday that these hopes that a package will be delivered after the elections without any difficulty were not right as Republicans were yet to answer her on funding for several critical areas. The uncertainty and lack of hopes that a stimulus will be delivered even after elections raised the U.S. dollar and added further gains in the USD/JPY pair on Thursday. However, the USD/JPY currency pair’s gains were limited due to the emerging risk-averse market sentiment in the market on Thursday.

Daily Technical Levels

Support Resistance

104.07 104.53

103.86 104.78

103.62 104.99

Pivot point: 104.32

USD/JPY – Trading Tips

The bearish bias in the USD/JPY continues to extend the bearish bias; however, it’s trading within a choppy trading range now. The choppy range may provide resistance at 104.505 to 104.200 area. Violation of this range can trigger further selling until the 103.900 level. The MACD and RSI support selling bias today; therefore, we will be looking to enter a selling trade below 104.24 today. A violation of this level has high odds of leading the USD/JPY pair further lower towards the 103.900 level. Good luck! 

Categories
Forex Basics

How NOT To Trade Forex

There are a lot of guides out there detailing different ways to trade, different strategies, the risk management to use, and all sorts of information It is all well and good knowing what to do, but they very rarely go into detail on the things that you are not meant to be doing, so that is what we are going to be looking at today.

Before we take a look at the things that we should not be doing, let’s get a very brief overview of the things that we should be doing, these are things that you will hear all over the internet, from educational websites to Twitter, things people say you should do, we will point out that we actually agree with most of them and ensuring that you do them will help you to remain profitable and successful. Things like keeping a trading journal, very important to seeing how you are trading, using proper risk management, stop losses, take profits, and proper risk to reward ratio. Having enough capital, finding the right broker for you, getting a proper education, and more, all of these things can help you to be a successful trader and they are things that you should be doing.

So now let’s take a look at some of the things that you probably shouldn’t be doing as a trader…

Using Too Much Capital

The popular saying goes that you should only use what you can afford to lose, well that is very true, so it is a little bit of a mystery as to why so many people seem to trade with money that they cannot afford. We say it’s a mystery, it’s really not, it is simple greed, the want for more. We have seen hundreds if not thousands of people posting that they have lost all their savings or that they borrowed money to trade with and are now in debt. It is far too common and those people unfortunately very rarely learn, and are often repeat offenders. If you have lost money to need, do not put more in, it’s really that simple, yet quite hard for some people to understand. So the moral of the story is a simple one, do not trade what you can’t afford to use, see, tell you that was the popular thing to say.

Gamble

There is no harm in a little gamble, unless you are doing it on the forex markets, if you were to bet on football or whatever your favourite sport is then you have a finite amount that you can lose with each bet, you will only lose what you have bet. It is not quite the same with trading, a single gamble could cost you $10, or it could cost you your entire balance. Gambling and trading just do not go well together. There is no skill in it, you are not analysing the markets and working out the best probability, you are simply putting on a trade that you think or sometimes just blindly think will go one way. When it doesn’t, what do you think the next course of action will be? Well, it isn’t to walk away, nop, instead people will simply put on another trade, an even larger one, with potentially even worse results. So if you get the urge to gamble, take it to the sport betting sites and not the forex markets.

Trading to Repay Debts

When people are in debt they can do desperate things, one of those things is to trade in order to try and make enough money to pay off their debts. When money and desperation are your primary motivators for trading then you will most likely be letting greed take over you. You will make trades that you probably shouldn’t be making or trading larger trade sizes than you should be. Either way, if those are your motivations then you probably should be steering clear of trading.

Trading to Make a Living

This is actually an end goal for a lot of people which is fine, it’s a good goal to aim for, the problems that a lot of people will aim to do right from the start, this is a recipe for disaster. To be able to get rid of your job and to trade full time is a lot of effort, an incredible amount and you need to have a lot of experience in order to do it, it certainly is not something that you are able to do without a lot of education and time. Before you even think about going full time you need to be able to make more than you are making with your job, as a part-time trader. So it is a lot harder than you may think. Trading is a very up and down volatile market, you won’t always make enough to sustain your monthly expenditure, other months you will make more than enough, so ensure that you have backup funds and also make enough on average to sustain your life and to make more than you currently do with your job.

Choosing a Random Broker

All brokers are pretty much the same, they all allow you to trade on the markets, so it doesn’t really matter which one you chose right? Wrong! Each and every broker is unique, there are of course some which are simple clones of others, but these clones differ from all other brokers that are out there. Different features, trading platforms, spreads, commissions, execution methods, customer services, bonuses, and more, every single aspect of a broker can be different, not to mention that there are a lot of brokers that have been set up for the sole purpose of skimming and taking peoples money.

So instead of going for just a random one, you need to look for the one that suits your own needs. We would suggest avoiding market maker brokers, these are brokers that have their own markets and trade against their clients so they have an interest in your losing, instead, go for a commission-based one. The more money you make, the more successful you are, and they have an interest in your success. You also need to ensure that they have the assets and pairs that you want to trade, that the trading platform matches what you need, if you have an MT4 trading robot, you will of course need a broker that offers MT4 as a trading platform. Some brokers offer bonuses, but we would avoid them due to the high trading volumes needed to actually withdraw any of the bonus as money. Look for reviews from your peers, often website reviews are affiliated but if you can find independent ones then that would be a good source of information on the broker. Ultimately, look for some that suit you and do not just simply sign up for the first one that you see.

Using Your Emotions to Trade

Emotions are powerful things and they can have a powerful effect on your trading, as soon as you allow your emotions to dictate your trading you will be heading towards a disaster. Emotions like greed, overconfidence, and impatience are some of the worst emotions and feelings to have when trading. All of them lead to you making trades that go against your trading plans, your risk management, and often trades that have very little analysis behind them. If you feel these emotions coming, do not trade, instead, take a break, step away from your trading terminal, get some fresh air, and then come back with a clear mind. Just ensure that you are not trading when your emotions are running high.

So those are some of the things that you should not be doing when you trade, the sad fact is that a lot of brokers have been created for the single intent to steal peoples money, so you need to be careful, there are also a lot of different pitfalls that you can fall into, many of which are classed as bad habits, you need to learn, take your time, do some research and stay disciplined if you want to be a successful trader.

Categories
Forex Basic Strategies

How To Trade A Ranging Market

One of the toughest things to do in forex is to remain profitable, the thing that is even tougher than this is to remain profitable within a ranging market, some people absolutely love a ranging market while other people hate it, it can all come down to the strategy that you are using and also the type of trader that you are.

A ranging market is basically when the markets are going sideways, there are little movements up and down but it stays between a high and low price range, the unfortunate thing is that it is very easy to make mistakes during this type of market and a lot of traders do a lot damage to their accounts when the markets are in this sort of situation. This is far more preventable in traders who have learned to trade during a trend, either a bull or bear trend when the markets continue in an upwards or downwards direction.

Having said that it is a dangerous time to trade, there are certainly ways to trade within it, and it is still possible to make a profit within these ranging markets. In fact, some people are able to profit more from a ranging market than they can from a trending one, so we are going to e looking at different ways in which people can and do profit from a ranging market, trading in this sort of environment can be quite exciting, so let’s take a look at the ways that you can do it.

Support and Resistance

When you are thinking of trading in a ranging market. The first thing that you should be considering are the support and resistance levels that the market is currently adhering to, you may not actually be trading these levels but knowing where they are will give you a good idea of the current market conditions and how it is performing, it will also show you the potential levels that the markets could reach if the current ranging of the markets were to break.

The first thing that you need to do however is to identify that the markets are actually ranging, one of the main things to look for is that the sideways markets have quite a distance between the support and resistance levels. If the support and resistance levels are actually quite close together then this would be considered as a choppy market and they hold a lot more risk and so it may not actually be worth trading in this condition, so ensure that the support and resistance levels are a little further apart. Trading a choppy market has a form of gambling within it and will not have a very good risk to reward ratio level making it a dangerous time to trade.

There are of course a few different types of ranging markets, these include a perfect range which is when the range reaches the support and resistance levels a number of times, the price will be going up and down in a very predictable pattern, when drawing out the support and resistance levels it should create a very clear rectangle. The next type of range is a ranging market with a pattern, this kind of range often appears to have some kind of direction, there may be a number of lower highs and lower lows which could be suggesting that an onward trend is forming, or the opposite for an upward trend emerging. The thirst type of the ranging market is a range without a pattern, this sort of ranging market is a little less predictable with the prices going up and down with no clear pattern or reason.

By being able to identify the type of ranging market that is occurring will allow you to make a much more informed decision when it comes to the sort of trades that you are going to put on. It would be far better and easier to make predictions in a market where there are patterns forming than it would in a completely random one. When ranging with a pattern can also indicate that the markets are going to potentially move into a trend and can give you an idea of the possible direction of that trend, you will want to avoid trading in choppy markets or a ranging market without a trend as this can be a much more dangerous market to be active in. A ranging market can also occur in the middle of a trend, so it is important that you manage to identify the overall trend direction too.

Trading Support and Resistance

So let’s assume that you are going to be trading in these ranging markets, one of the most simple trading methods is simply to trade the support and resistance levels. So we have marked out our support and resistance levels, we then wait for the price to hit either the support or resistance level, when it hits the resistance level when we want to sell and when it hits the support level we want to buy. Some people suggest that you should only buy or sell once the levels have been breached rather than just hit, trading this method is very simple and is a safer option as there are fewer things that can go wrong. It is important to remember to put on your stop losses a little below or above the levels in order to help protect your account from a potential breakout.

Channel Patterns

You can also trade with channel patterns, these are somewhat similar to trading with support and resistance levels in the way that it is a similar type of trading, we will just be setting our levels a little differently. Channel patterns are something that are offered and available on most charting software tools and packages, you can use them to make the highs and the lows of the markets. You will then work the same way, selling on the highs and buying on the lows, these sorts of patterns can also be used with a trending market and not just a ranging one.

Trading False Breakouts

False Breakouts, otherwise known as fakeouts, are another way of trading these ranging markets. The way that these are normally observed is by a pin bar candlestick that sticks out of the support or resistance levels. It is known as a false breakout due to the fact that instead of then breaking out the market will then continue back into its range. For those that trade breakouts this is a form of trap that can get them stung but for ranging markets they are pretty nice as they can present you with a great opportunity for a buy or a sell.

Bollinger Bands

Bollinger bands are often used to try and work out just how volatile the market share is, the top band will tell you how high the price has reached which the lower band will tell you how low it has been. If the bands are too close together then again this will indicate that the markets are choppy and so it may not be worth trading in this condition. If the bands are quite far apart this can also mean that you should not trade, due to the markets being a little too volatile. You can probably work out how to trade these bands, when the price reaches the lowest band you should buy and sell when it reaches the higher one. It is often a good idea to use Bollinger Bands in a pairing with another indicator such as support and resistance levels.

So those are some of the available trading patterns and systems that you can use in order to trade during ranging markets, it should be pointed out that this is not for everyone. If the markets that you are currently trading in are suddenly ranging, then try looking into new markets, just don’t go crazy and start trading exotic pairs that you have absolutely no idea about, they could be a little more volatile than what you are used to.

Of course, if you are a trend trader or a longer-term trader then it may be the best idea to simply not trade at all, the risk to reward ratio in this sort of trading is often a lot lower than you may be used to, you will be risking more for less, so if this is not the sort of trading you are used to or interested in then the best things for you to do may be to simply not trade at all. There is of course no harm in taking a little break from trading when there is nothing available for you to trade, do not try to force it in order to simply have something to do.

So to sum things up, when thinking about trading in a ranging market you should be looking for the support and resistance levels, you should be looking for patterns and you should be considering how volatile the markets are at the time of your trading. If things fall into place and you want to try it, start small and then build your trading up. It is a difficult time to trade but if you manage to get good at it, it will be another weapon in our trading arsenal and will allow you to trade and be profitable no matter what the trading conditions are like.

Categories
Forex Chart Basics

What Are Forex Price Gaps?

Price gaps are not something that many traders want to see, they do not happen every single day but they are a pretty easy concept to understand. A price gap is simply an empty area on the charts, thymus the name of a gap. They take place when the opening price of a candlestick is not the same as the price of the previous closing candlestick. They aren’t as common on the forex markets as they are on the stock markets, but they do still happen, mainly due to the reason that the forex markets close over the weekends but is still active of operations by international banks, having said that, they can happen in the middle of the trading day when volatility is really hitting the high levels.

Gaps in the markets are something that every single trader will experience at some point in their trading career. As we mentioned they occur when the opening price of a candle differs from the closing one prior to it. Over the weekends, when the price moves up or down but our retail clients to do an update over the weekend, so when they open once again on Sunday evening (UK time) then the opening candlestick will differ to the one that closed on Friday evening, this is especially prevalent when there has been a significant even in the world or news over the weekend.

We mentioned that they can also happen in the middle of the trading day and not just at the weekends, this can happen when a significant news event takes place which brings in a lot of interest from traders, this large spike can widen the bid and the ask spread wide enough for there to be a gap on the next opening of a trade. Price gaps can give you a good idea as to what the market sentiment is from other traders, if the markets gap uup, then it can be an indication that people do not want to sell and when it gaps down it will show that traders do not want to buy, they can be used as an additional indicator to how the markets may behave.

There is also something known as trading the gaps, this is where people take advantage of these little gaps in order to make a little profit. Gap trading is considered to be easy, reliable, and pretty profitable by a number of traders, or very risky by others.

So let’s take a quick look at what the different gaps are, there are four main ones that we will be looking at now.

The Breakaway Gap:

The breakaway gap occurs when a price action comes to an end and when a new trend begins. This type of gap indicates that the price has broken out and then starts moving up or down leaving a gap. This sort of movement is often caused by a news event or breaking news, hence the name breakout gap. This process often causes a new trend and is then considered as not very trade-friendly. 

The Runaway Gap:

The runaway gap is a formation that can form within a trend and they often indicate that the trend is continuing in the same direction. Runaway gaps are considered to be quite tradable and are one of the safest ways to trade with gaps due to the fact that the gap is simply indicating that the trend is most likely going to continue in the same direction. They can often combine trading with runaway gaps with other price action tools to help with even safer trading conditions.

The Exhaustion Gap:

These sorts of gaps are very common on the stock markets, but they can also occur on the forex markets too, they just occur a lot less often. These sorts of gaps often form towards the ends of a previous trend and can help to indicate the final moment before the price begins to reverse. This means that you are able to trade these gaps, however, you should only do so after you have already identified them and you start trading with the new trend once it has been formed.

The Common Gap:

The common gap as it sounds is one of the most common types of gaps that you will find and is also often the most tradable type of gap and due to this is the most widely used style of the gap that is traded. These sorts of apps often appear late Sunday evening and early Monday mornings shortly after the markets have just opened and are appropriate for short term trading as they tend to be filled within a few price bars. It Is best to look for these sorts of gaps at midnight when the markets open, they can also occur after a holiday or when a major news event has been announced.

You may have come across something called filling the gap, this is basically when the price moves back to the initial level before a full gap appears  The price will always fill the ap at some point or another, the question that we need to work out is just how long it will take to do it. When the gap is filled within the same trading day it is known as fading, but this does not happen every single time with gaps. You also need to calculate just how many pips it will take to fill the gap, as it may not actually be feasible for trading if it is too large or too small, but the fact that the markets will always fill the gap at some point is what makes it so tempting and interesting for traders. It is not really that hard to work out that if the markets gap downwards then it will need to move back up in order to fill that gap, the problem with trading, especially when the markets have just opened up is that the spreads can make it not so profitable, so unless you get in and out at the right place with the right spreads, it may end up costing you even when the gap does fill.

There are of course risks when trading the gaps, so we need to work out how it is that we can minimise those risks. The primary thing to do is to simply have some sort of knowledge on trading and understanding the fundamentals behind how the markets move and how and why the gaps have been formed. A few other things that you can do are to always watch and keep up to date with a real-world event that could be affecting the markets, using an economic calendar, use a broker that has lower spreads, preferably an ECN broker which offer straight-through processing, always use a stop-loss. This should be pretty obvious but a lot of people trading the gaps forget it, and it can of course continue the wrong way before closing the gap, so be sure to add in a stop loss in order to protect your account.

So the main thing that you need to think about is whether or not you want to trade the gaps, it is not the most common thing for people to be trading. Make sure that you read up on it. If you are planning on it then make sure that you learn about the different gaps and how to trade them, ensure that you are up to date on world events, and learn the basics of both fundamental and technical trading and analysis. Use proper risk management and then practice with lower best, you may not get gaps on a demo account so may need to practice on a live one, but do so using small trade sizes in order to mitigate a bit of the risk involved.

Categories
Forex Basics

How to Become A Successful Part-Time Trader

A lot of people get into trading with the hopes that they will someday trade for a living, there are a lot of fantastic opportunities to make money or to simply supplement your current income. It doesn’t really matter how much you want to be involved in trading forex, there are ways to earn. Many want to be full time, but many also want to do it part-time, to simply do it on the side in their spare time, doing it part-time means you do not need to invest quite as much time, energy, and work into what you would do when doing it full time but hen evolving that part-time trading into a full-time job.

Having said that, the majority of people who are trading in the markets today, it is more of a part time job or even a hobby rather than something that they are looking to do full time. One of the best things about forex trading is that you are able to trade when you want and you are also able to scale that trading accordingly, so you do not need to be full time in order to make a little extra on the side, it also allows you to work around your current job should you wish to. Trading forex part-time and trading when you want to allows you to put in enough time in order to make a consistent income to supplement your full-time job.

Trading forex for a living may not be the right route for you, it can be quite the gamble to quit your day job in order to go for this full time with a lot of pitfalls around to tip you up, trading full time is also not a short term plan, it is something a long way down the line as you cannot simply join and become instantly successful. Trading can be an incredibly exciting thing, with adrenaline running with every trade, people often decide to leave their jobs on the back of a good month, but do you really want to give up that guaranteed income from a job for something that is a little more temperamental?

So if you had the opportunity, would you go for a full-time trading position or a part-time one? If you were to ask a bunch of part time traders why they chose to do it part time rather than full time, you will get a whole range of different options.

There is a concept which is known as less is more, this concept is very relatable when it comes to forex trading. When we are trading full time, we want to get every single trading opportunity that presents itself, we are caught up in the emotions of trading and that is where things can start to go wrong when emotions get caught up in our trading. They cause us to make rushed decisions, or to put on trades that we otherwise never would have. Trading part-time gives us the option to step away, we know we won’t be getting every chance, we know we won’t be there 100% of the time and so we can pick and choose the trades that we take with much less if any pressure on us to perform, leading to better overall trading decisions.

One of the other things that part-time traders seem to really like is the fact that you are able to plan and trade around your other daily activities such as work, social interactions, and family life. It’s convenient for those that have a busy life especially at home where you simply won’t have the time to be a full-time trader. In the end, being able to become a successful part-time trader means that you don’t actually need to give anything up (apart from a bit of spare time) while becoming a full-time trader takes a lot of sacrifices, sacrifices that a lot of people do not want to make.

If you do decide to trade as a part-time trader, it is still a  good idea to try and work out a kind of routine, many people try and fit it in either before or after work, an hour or two on either side of work is perfect as you are still in the working mood and will have the energy to put in the time and effort required. Having a routine makes things easier for you in the long run as you begin to get used to the system. Find the right time for you though, it may be different for every trader

Along with this, you also need to have your trading plan setu, this plan will detail many different things about your trading. These include the strategy that you are going to be using, your risk management, your trading rules, and anything else that you can think of, it will dictate how it is that you trade. Talking of strategies, make sure that you have one appropriate to your available time, there is no point using a strategy that requires you to be in front of the computer all day if you are only trading part time.

So let’s imagine that you are now going to be trading as a part time trader, let’s take a look at some example routines that you could be setting yourself.

  • Do your major market analysis on the weekends, this way you are able to save time during the weekdays when you will actually be trading. The last thing that you want to happen when trading is to use up all of your time analysing the markets, only to find out that you no longer have any time to actually put on h trade.
  • Ensure that you wake up at the same time each day, try and fit this into the good times for the markets, unfortunately, this is not always possible for everyone, if you are in the UK and on London time, waking up at 8 am will mean that it is 3 am in New York, not the eBay time for trading, but if you are consistent that you will work out the patterns and trends that occur at that time and so you can find some good trades still.
  • Use your free time well, on the toilet? Check out some trading forums or news sites in order to get a little update, it may help you to further analyse or confirm the analysis that you did over the weekends. You don’t need to listen to everyone as it can be a little overwhelming but it is always good to get an idea of what other traders are thinking.

One of the other things that you need to understand is that trading as a part-timer is that it will take time for you to develop our systems and your routines, longer than it would if you were full time, simply due to the fact that you are not doing as much of it and not as often. As a part-timer, you will have a lot of time when you do not have any trades on and that is actually a good thing, this will help you to avoid over-trading, something that can be quite dangerous for a full-time trader.

You also need to set some goals, though you need to ensure that you set them realistically and relevant to what you are doing. As a part-time trader, you are not going to be making $100,000 overnight or each month, you will most likely be making less than your day job. As a part-time trader you should be looking to make a little extra, just ensure that you set them appropriately and that they are actually achievable.

So we will end this article with a few extra tips for you as a trader, you most likely will have heard them before, but it is important to put them down to ensure that you are aware of some of the things that you will need to do.

  • Get yourself a trading style that will match your available schedule, there is no point trading a sculpting method that requires you to be in front of the screen at all times, instead get one that allows you to put on trades and then necessarily b around for the result
  • Keep a trading journal, this is thrown about everywhere, but it is vital that you do it. It is very hard to improve as a trader if you do not have a trading journal to see how your trades are actually doing.
  • Try not to get too focused on the trading, you are doing this part time, most likely because you have other priorities in your life too, do not let the trading take over your life.
  • Pick the right time to trade both for you and the markets, there is no point in choosing a time in the middle of the night where you won’t always have the motivation to get up and trade or if there are literally no movements in the markets at the time you chose.
  • Select a currency based on what you want to really get to know, learn that pair and trade that pair, try not to branch out too much until you really understand the technicals and fundamentals of this first currency pair.
  • Don’t try to over trade in order to compensate for less time, this is the last thing that you want to do, instead take your time and make sure that each trade counts, it is better to be right on one trade than guessing many others.

So that is what it means to be a part-time trader and also a few things that you can do to make the experience a little better for yourself. Take the tips on board, look after yourself, and your other priorities, and then part-time trading could give you a real boost in life.

Categories
Forex Basics

What Is the Best Time to Trade In The UK?

For those that have traded for a long time, you most likely would have worked out when the best time for you to trade is, but for those just starting out, you kind of wonder when you should be trading, should it be the morning the evening or the middle of the night?

The good news is that unlike the stock markets which open at 8 am and close at 4:30 pm, the forex markets are open 24 hours a day and only close to retail traders over the weekend. There is no set time that you need to trade between so there are opportunities at all times during the day to trade. This does not however mean that there isn’t an optimum time to trade, the thing that decides when the optimum trade time depends on a number of different factors and will be different for every single trader. So we have put together some ideas on what would be the right time to trade, and also ways that you can work out for yourself what time would be the best time for you to trade when trading from the UK.

So we mentioned that the markets are open 24 hours a day, this is true, but also not true at the same time. You see the 24 hour period is actually made up of four different trading sessions that take place around the world. These different trading sessions open and close at specific times and overlap each other ensuring that the services of the markets remain open for that 24 hour period, so what are those times?

  • London, United Kingdom: 8 am to 5 pm UTC 
  • New York, United States: 1 pm to 10 pm UTC
  • Sydney, Australia: 10 pm to 7 am UTC
  • Tokyo, Japan: 12 am to 9 am UTC

So as you can see, those trading sessions overlap, but why is it relevant to know when the different trading sessions are The simple fact is that this will determine a number of different things for different currency pairs, certain pairs will be more active during certain trading sessions than they are in others, there are also times of added liquidity and potential volatility during opening and closing, as well as overlapping times, we will look into those things in a little more detail latrine this article.

It is important to know exactly when the markets overlap, so we have detailed them below for ease of understanding:

  • London-New York (the European-American session): 12 pm to 4 pm UTC
  • Tokyo-London (the Asian-European session): 7 am to 8 am UTC
  • Tokyo-Sydney (the Asian-Pacific session): 11 pm to 6 am UTC

Within the time periods mentioned above, there are of course other markets, these are not the only markets that are available, they are simply the largest and most active markets, there are more than 20 other decentralised markets running at the same time, they are simply not considered as one of the major markets. It is predicted that about 40% of all trading comes from the UK alone, with the USA being the second-largest location for trading. Due to this, you can imagine that the busiest time for trading is when the UK and US markets overlap. It should also be mentioned that these times do change slightly as the year progresses due to things like Daylight Saving Time within the UK.

We know what you are thinking, can you trade over the weekends? As a rule, the forex markets are closed over the weekends, it opens on Sunday at either 9 pm or 10 pm and closes on Friday at 10 pm GMT, there are however specialist brokers that allow you to trade over the weekends, but these are few and far between and often have quite hefty joining requirements. There are however opportunities to trade on the weekends, many brokers are now beginning to allow cryptocurrency trading which has a 24 hour trading time, 7 days a week, so you are able to trade over the weekends independent from the forex market opening times.

When you started trading, hopefully you would have selected the currency pairs that you wish to trade, well it probably won’t surprise you to hear that different currency pairs are best traded within different market sessions, for example, there is a lot more volatility and movement on the JPY pairs during the Asian markets than there are during the European sessions, it all comes down to where in the world those currencies are based and which market sessions are open. A lot of the more popular currency pairs are ones where the sessions overlap, for example, the EUR/USD pair is popular as those two sessions overlap each other in regards to the London and New York markets.

Here are some of the more popular currencies pairings for different market sessions:

  • European session: EUR/USD; GBP/USD; EUR/JPY; GBP/JPY; GBP/AUD; GBP/CHF; EUR/CHF; EUR/GBP
  • American session: EUR/USD; GBP/USD; USD/CAD; USD/CHF; GBP/CAD; EUR/CAD; BTC/USD
  • Asian session: USD/JPY; GBP/JPY; USD/CNY; EUR/CNY; GBP/CNY
  • Pacific session: AUD/USD; AUD/JPY; AUD/NZD; GBP/AUD; EUR/AUD

We also briefly mentioned that your trading style and strategy will also have an impact on when the best time for you to trade as a UK trader will be, the strategy you chose will in the end dictate where you need to spend your time and which of the sessions you need to trade in. There are four main trading styles which we will briefly cover now:

-Day Trading is a style of trading that involves making a number of shorter-term trades throughout the day, this helps to reduce the risk of charges overnight, it can however be quite intensive and requires you to monitor the markets at all times when there are trades open.

-Scalping is what a lot of traders are now getting into, these are very short term small trades that are executed in high volume. A lot of trades are made, and it offers a good balance between risk and reward, the profits are small but with so many trades being made, they slowly add up.

-Position trading is a long term style of trading, it is a good style for those investors who want to play the long game, it involves looking for trends and attempting to make profits on major price movements.

-Swing trading is another long term trade and it is one where you hold on to trades for days at a time as the markets trend and move up and down.

When choosing your style, it will also change when you may need to be trading, for instance, a scalper on the EURUSD pair may not want to trade during the Asian markets simply because there is not much liquidity or volatility on this pair at that time, but instead to scalp during the crossover of the London and New York sessions where there is a history of a lot of liquidity and volatility, perfect for the scalper. For long-term traders, it doesn’t make too much difference, but it is still easier to get in and out of a trade during times of higher liquidity.

UK trading during the London session:

Living in the UK obviously makes it far easier to trade during this session, however, you are not limited to it at all, if your strategy does not require you to sit at the computer then you can trade during any of the available sessions. The European markets open at a very similar time to the London sessions so pairs like the EUR/GBP are very popular pairs with a lot of liquidity during this session. Of course, there is also a crossover between the London session and the New York session so pairs like EUR/USD or GBP/USD are very popular during these crossover times.

UK trading during the New York session:

The New York session starts at the end of the London sessions and runs until the #Sydney session opens, if you have decided to trade a pair that includes the USD then this session will most likely be the best session for you to trade in. Fortunately, this is not too late for those in the UK but may involve some evening trading after work or before bed. 

UK trading during the Tokyo session:

The Tokyo and London sessions crossover by one hour in the mornings, however for those trading in the Uk, the Tokyo session is not all that accessible due to it taking place when most people in the UK will be sleeping. Pairs like the USD/JPY, EUR/JPY, and AUD/JPY are some of the more popular currencies to trade. This session is seen as a safer session to trade as there is less volatility and movement within the markets.

So those are some of the things to think about when deciding to trade within the UK, there is a lot to think about we know, but deciding on our trading style and the currency pair that you wish to trade are vital in understanding when you should be trading. Of course, you also need to think about yourself, if you are going to struggle to get up in the middle of the night each night, then that pair and trading session may not be the best one for you. So pick one that works for you and then build on it.

Categories
Chart Patterns

Pullbacks – How Prop Traders Manage Discounts

Pullbacks we will talk about are described as a correction candle (or bar) after a bigger, sudden price movement candle (period) on any asset chart. When you apply a technical trading system and all signals it is time to trade after a pullback, traders enter at a more favorable price. This is a great way to get more pips out of a trend although if you love this discount too much, you can easily become a discount hunter. In forex, this habit will only cut down your account. Professional traders play a very careful game with pullbacks, they are hard to gauge, and once they happen the odds are not as great as without them. The trend may not continue with the same momentum. We will address how proprietary traders manage pullbacks using their technical system and their ruleset. This example can be taken as is, although there are many ways to manage the risk of pullbacks and their psychological effect. 

Discount shoppers should not apply the same principles in forex. Entering at a better price is what we should aim for, there is a time and place for this but it does not happen often in forex. If we wait for a pullback every time, the benefits of pullbacks become a losing waiting game. Our example in this article will use technical system elements explored in previous articles to pinpoint the time and place a pullback can be used for a better price entry. With a rule addition once they happen. The element in question is the Baseline and the volatility measurements. We will also address why professional prop traders avoid them in all other circumstances. Most of the time pullbacks will not be inline with the rule set and the technical system signals, but on some occasions, they will add up and in the long term will have significance to your account. 

The pullback hunting concept is not easy to grasp for a beginner, especially if not yet accustomed to custom indicators, technical systems, and the base Moving Average element. In case you do not understand how to use pullbacks using our example, you can completely disregard this concept and move on with other strategies. Pullbacks setups do not happen often and they do not always end with benefits. Some traders will not enter a trade unless they get a pullback. This also means they miss out on 99% of other trends worth taking. But let’s see how a pullback is used in our trading system. 

Big candles happen on any currency pairs, and we are not talking about the flash crash candles like the one after the Swissy peg removal. Big candles that are unusual can be measured as the ones that break the 1.5 ATR (14) value. These candles are caused by several phenomena in the forex. Most of them are after News events, such as Non-farm payroll, GDP, rates, elections, and so on. Also, these can happen in low liquidity periods, be it brokerage, liquidity providers, or other market drivers. Stop-loss hunting by the big banks is something that happens in between these, and are more common on popular trading currency pairs. Stop-Loss hunting is deliberate price manipulation by the big banks with huge volume to trigger visible clusters around specific price levels set by traders.

This is not a conspiracy theory but a fact we can even read about in the newspapers once the fines are announced to familiar bank names. Stop hunting is not the only manipulation but this is part of forex and it is not always a bad thing. These candles are mostly in counter-trend direction and overshoot a few before it. If these movements are not caused by news, it is mostly bank dumps or a combination of both. Trends can also move like this when there is a huge trading pressure or volume but it is not that often to see it without any catalyst before. The news and big bank manipulation moves are exaggerated, and when the price is deviating so much what usually follows is a correction or a completely new trend in opposite direction – reversal. This is a point where we can take advantage of a pullback, but using elements and rules to increase our odds. 

The rules a pullback can be utilized are applied only when the price cross-closes our baseline element. This is a signal we have a good trend to enter when all other indicators agree on this. Now, we will use the ATR(14) last pip value on our target, daily chart, and see if the current candle which is about to close in a few minutes is past this ATR pip value, measured from our baseline. In MT4/5 this is quickly measured by clicking the middle mouse button or ctrl+f and dragging from the top/bottom of the candle to the baseline. The rule for pullbacks is that only trade the pullback if in the price level is back into the ATR value range from the baseline. If we do this step by step it would be like this: 

  • We use the daily chart for our trading. 
  • The candle or trading day is a few minutes before closing.
  • The price has crossed our baseline.
  • Pull up the ATR (14) indicator and see what the current pip value does it sit. 
  • Measure the range from the current price level of the candle to the baseline.
  • See if the pip range measured is higher than the ATR pip value.
  • If it is, wait for tomorrow to see if we have a pullback candle at the end of the day.
  • We measure the pullback candle current price level range from the baseline a few minutes before the day close.
  • If the measured pip range is below the current ATR pip value we enter the trade. 
  • Our system gives a trade entry signal and other rules allow for it. 

This procedure may look complicated but it is easy after a few times. Some tools which can be downloaded for free from the MQL5 market can draw the ATR range channel on the chart making it easy to see if the pullback has qualified for entry, no need to measure the distance. 

Now we will give a few pullback examples using MT4 included indicators. In the picture below we have the EURUSD pair on the daily timeframe, 20 period SMA as our baseline example, Chaikin Money Flow indicator as our trend confirmation indicator, and the ATR on the default settings (14 periods). 

Notice the big candle in the middle of the picture that close-crossed our 20 SMA baseline colored yellow. Below, our confirmation indicator signals the long trade as it is above the horizontal zero line. The ATR below the Chaikin Money Flow gives us a value of 1005 points (100 pips) when we hover over the line (take the decimal number as a whole). 

When we measure the price level distance from our baseline, we get 101 pips – bigger than our ATR value so we do not take this trade (see picture below). 

If you want to be precise, you can hove over the candle and the baseline to see the values and calculate the pip distance, although when you trade real time this precision is not important unless it is hard to tell. The next candle pulled back. Our confirmation indicator is still signaling the long trade, the closing price level is now inside the ATR range from the baseline – 33 pips.

So now we are entering this trade at a discount, 68 pips better price entry does matter plus we have a better risk as our Take Profit point is lower. Pullback situations like this are not common, but you should be ready once they do. Remember that the one candle rule is applied here. If the next candle is not in the ATR-Baseline zone you do not take that trade. We do not count later candles and qualify them as pullbacks, only the first after a big candle. Interestingly, this one candle rule is applied to some lagging indicators to give them a chance to catch up with the rest of the system, however, this is just one example of a trading system used by a prop trader. The picture below shows price action we do not qualify as a pullback, the second candle after the exaggerated one is not a correction while the third is not accountable. 

On some occasions, your confirmation indicators may be lagging so you do not catch a baseline crossing candle or the one after. If this happens and the price is already past the ATR range from the baseline, you pass on that trade. There is no waiting for any kind of a pullback. The baseline element cannot play its role if you take trades too far from it. The baseline is there to show the “balance” point to which the price comes back to after deviations. Entering a trade in the middle of the deviation decreases the odds it will continue to move away. The baseline element is also a protective function from losses. Of course, you can try other ATR settings or levels for this rule if it proves to be more effective in the testing. 

The ATR range rule is applied to normal trading signals too in our system example. Any deviation which is too far away once the baseline is crossed does not qualify for an entry. There is one exception though – when you encounter continuation trades. More on these situations is presented in another article. 

Pullbacks can work well, so well it can make you skip the rules you have set. The hype of success can lead you to seek pullbacks wherever you can, adjusting the system to only catch them as much as it can. This change will lead you into a losing spiral not only to your account but to your morale too. It is easy to get into the pullback hype and much harder to get out of it. There are no indicators that predict pullbacks and even less the ones that predict trends after it. You may rely on your hunches whenever you see a big candle, and this is a dangerous practice for your account. When your ATR is just one pip lower to qualify a pullback, there is no tolerance, you pass on that trade.

The rule discipline will get you out of the losing trades and, more importantly, you will not wait for pullbacks and miss out on winner trends just because the price kept going. These winners are what make a difference to your account after everything, missing them out is not an option. The choice between five 300 pip winners per year and one 350 pip winner with a pullback entry is very easy to make, but the hype of getting a discount cloud our judgment. Discount shopper patience does not apply to forex when it comes to pullbacks. Waiting for a high-percentage trade is not similar. Here, you are missing out on a signal from your system and your rulebook just because you want a better price to enter after a pullback. Do not mix this with high-percentage trading which is actually what you should do all the time. 

As you may have noticed, this example is based on measurements, indicators, and strict rules in conjunction with them. It is a technical system that may not be an appropriate way of trading for everyone. Some traders trade without any indicators, or as they might describe – secondary technical indicators. The primary indicator for them is Price Action. What they see on the chart is the base for their decision making. Identifying pullbacks is not exact practice, they might wait for a pullback every time with pending orders or wait for a Price Action pattern to unfold before making an entry. However, these skills are unique to them and cannot be replicated in any technical system. On the other side, by having something you can measure, you have an easy-going decision-making system ready for anyone who can just follow their signals to be successful.

Categories
Forex Market Analysis

Daily F.X. Analysis, October 29 – Top Trade Setups In Forex – Eyes on ECB Policy Rate! 

The focus will remain on the U.S. Advance GDP figures. GDP data expected to perform better than before as the data represents the economic activity of the lockdown period. Besides this, the major focus will remain on the ECB Monetary policy decision, where the ECB is expected to keep the interest rate unchanged. However, the increased number of  Covid-19 cases may trigger a dovish sentiment on the European official bank rate, and it may place bearish pressure on the single currency Euro. 

Economic Events to Watch Today  


EUR/USD – Daily Analysis

The EUR/USD pair was closed at 1.17460 after placing a high of 1.17879 and a low of 1.17176. The EUR/USD pair dropped to its one week lowest level and remained bearish throughout the day. The Euro fell against the U.S. dollar on Wednesday ahead of the European Central Bank meeting amid the rising fears that the Eurozone’s economic recovery will be hard as Germany and France introduced fresh lockdown measures to control the spread of coronavirus infections.

A four-week lockdown was introduced by German Chancellor Angela Merkel on Wednesday for the country to control the spread of the virus. The partial lockdown will start from Monday, and under the restrictions, the hospital sector will likely ease as restaurants, bars, gyms, cinemas will be closed while schools, daycare centers, and kindergartens will remain open.

France that is already under curfew, will announce a nationwide lockdown on Friday. The President of France Emmanuel Macron has said that the measures they had taken to control the spread did not work out and were insufficient to counter the second wave of coronavirus affecting all of Europe.

Both Germany and France have seen a rise in coronavirus cases, with France expected to experience 100,000 new cases per day in the coming days. These fears that the lockdown measures will greatly impact the emerging European economic recovery weighed heavily on a single currency on Wednesday.

At 12:00 GMT, German Import Prices raised in September to 0.3% from the forecasted -0.3% and supported Euro currency on the data front. At 17:30 GMT, the Goods Trade Balance for September came in as -79.4B against the projected -84.8B and supported the U.S. dollar that weighed on EUR/USD prices. The Prelim Wholesale Inventories from the U.S. in September were reported as -0.1% against the expected 0.4% and supported the U.S. dollar added in the losses of EUR/USD pair on Wednesday.

On the U.S. dollar front, the United States also saw records high numbers of coronavirus cases; however, the U.S. dollar remained strong across the board. It seems like investors chose to invest in the greenback in these uncertain times due to its safe-haven status. The strong U.S. dollar weighed further on EUR.USD pair on Wednesday, and the prices continued moving in downside momentum.

Daily Technical Levels

Support Resistance

1.1779     1.1825

1.1762     1.1856

1.1732     1.1872

Pivot Point: 1.1809

EUR/USD– Trading Tip

The EUR/USD traded with a bearish bias, having dropped to the support area of 1.1745. Above this, the pair has strong odds of taking a bullish turn until the 1.1790 area. Continuation of an upward trend may lead the EUR/USD price towards 1.1790, and bullish crossover of this area can lead the pair towards the 1.1820 level. Conversely, a bearish crossover of 1.1745 support level can extend selling until the 1.1694 area. 


GBP/USD – Daily Analysis

The GBP/USD pair was closed at 1.29877 after placing a high of 1.30636 and a low of 1.29163. The GBP/USD pair dropped and posted losses on Wednesday. The GBP/USD pair dropped to its seven days lowest level on Wednesday amid broad-based U.S. dollar strength and the rising number of coronavirus cases in the U.K. The Brexit impasse, along with the U.S. elections uncertainty, also weighed on GBP/USD pair on Wednesday.

The U.S. dollar was strong across the board on Wednesday as the global coronavirus spread raised the greenback’s safe-haven allure. The British Pound lost as much as 1% against the U.S. dollar on Wednesday as investors withdraw due to decreased hopes for global economic recovery and increased risk-aversion market sentiment.

The uncertainties surrounding the U.S. elections were already weighing on the market sentiment, and the resurgence of coronavirus cases in Europe and the United States emerged that escalated the concerns. In the past week, the rate of deaths in Europe rose by almost 40%, and it challenged the narrative that the virus was relatively harmless that had encouraged the easing of lockdown measures for the sake of local economies.

Both Germany and France announced new lockdown measures to control coronavirus spread, and the U.K. was also expected to impose Tier-3 restrictions. These fears weighed heavily on the local currency British Pound that ultimately dragged the GBP/USD pair’s prices on Wednesday to its one-week lowest level.

On the data front, t 05:01 GMT, BRC Shop Price Index for October came in as -1.2% compared to -1.6%. Whereas, from the U.S. side, at 17:30 GMT, the Goods Trade Balance for September was reported as -79.4B against the expected -84.8B and supported the U.S. dollar that weighed on GBP/USD prices. The Prelim Wholesale Inventories from the U.S. in September came in as -0.1% against the anticipated 0.4% and supported the U.S. dollar that weighed on GBP/USD pair on Wednesday.

On the Brexit front, Britain and the European Union have just over two months to reach a trade agreement before the status-quo transition period ends on December 31. The E.U.’s chief negotiator, Michel Barnier, is in London for negotiations, and it is believed that progress has been made over some sticking points.

The sentiment has raised hopes that this time a deal will be reached between the U.K. and the E.U. by early November. According to Bloomberg, both sides have begun work on the text of the agreement on the level competitive playing field and were close to finalizing a joint document covering state aid.

These developments regarding Brexit-deal gave some ease to the market sentiment and capped further losses in the GBP/USD pair on Wednesday.

Furthermore, the Bank of England has shown willingness to go for negative rates that had been partially priced in the market and had kept the British Pound under pressure. Therefore, any such action by the bank would not come as a surprise in the upcoming meeting, and it means that a negative interest rate effect could be of secondary importance for GBP traders than a shock of Brexit in the coming days.

Daily Technical Levels

Support Resistance

1.3001     1.3081

1.2961     1.3121

1.2921     1.3161

Pivot Point: 1.3041

GBP/USD– Trading Tip

The GBP/USD has violated the symmetric triangle pattern at the 1.3017 area, and closing of candles below the 1.3017 level has driven strong selling until the 1.2915 support area. On the higher side, the Cable my lead GBP/USD price towards 1.3046 level. For now, the GBP/USD pair may find an immediate resistance at 1.3046 are, and below this, selling can be captured until 1.2980 and 1.2919 level.  


USD/JPY – Daily Analysis

The USD/JPY pair was closed at 104.307 after placing a high of 104.554 and a low of 104.111. The USD/JPY pair remained bearish and placed losses on Wednesday. The USD/JPY pair has posted slight losses on Wednesday despite the broad-based U.S. dollar strength. The Japanese Yen has gained about 1.2% throughout the last three weeks in October and has weighed on the USD/JPY pair. The USD/JPY pair dropped on Wednesday to its lowest level since September 21.

The U.S. dollar was strong on Wednesday as its safe-haven status got attention after European nations started re-imposing lockdown measures to control the virus’s spread. However, the U.S. dollar’s strength could not reverse the USD/JPY pair’s movement on Wednesday as traders were focused more on the Bank of Japan’s decision in its upcoming monetary policy meeting on Thursday.

Bank of Japan is up to hold its monetary policy meeting on Thursday, and investors were pricing the potential moves by it ahead of the meeting. The Bank of Japan is expected to keep its rates unchanged at -10bps while maintaining a 10-year JGB yield target at 0.0%. The Bank of Japan has extended a deadline for two virus linked funding programs and enlarged asset purchases. As mentioned by the quarterly assessment report, the central bank has downgraded this fiscal year’s economic and inflation outlooks.

As the outlook reviews have already been priced in the market, any hint over additional monetary easing through Q.E. in December on Thursday could have a major impact on the Japanese yen and ultimately on the USD/JPY pair. Furthermore, the coronavirus cases in the United States were rising day by day and weighed on local currency as the chances for a fresh lockdown increased with the increased number of COVID-19 infections. Over the last seven days, the U.S. reported about half a million new coronavirus cases, and it has raised both economic and health-related concerns that have weighed on the local currency U.S. dollar. The USD/JPY pair also followed these rising concerns and kept moving in the downward direction on Wednesday.

On the data front, from the U.S. side, at 17:30 GMT, the Goods Trade Balance for September came in as -79.4B against the anticipated -84.8B and supported the U.S. dollar. The Prelim Wholesale Inventories from the U.S. in September came in as -0.1% against the projected 0.4% and supported the U.S. dollar. The strong U.S. dollar failed to reverse the USD/JPY pair’s negative momentum on Wednesday, and the pair kept falling towards its multi-week lowest level.

Daily Technical Levels

Support Resistance

104.22     104.73

104.05     105.07

103.70     105.25

Pivot point: 104.56

USD/JPY – Trading Tips

The bearish bias in the USD/JPY continues to extend the bearish bias; however, it’s trading within a choppy trading range now. The choppy range may provide resistance at 104.505 to 104.200 area. Violation of this range can trigger further selling until the 103.900 level. The MACD and RSI support selling bias today; therefore, we will be looking to enter a selling trade below 104.24 today as a violation of this level has high odds of leading the USD/JPY pair further lower towards the 103.900 level. Good luck! 

Categories
Forex Assets

What Should You Know Before Trading The CAD/EGP Forex Exotic Pair

Introduction

The CAD/EGP is an exotic currency pair with the CAD representing the Canadian Dollar, and EGP – the Egyptian Pound. Forex trading in such an exotic currency pair is accompanied by higher volatility. The CAD is the base currency, while the EGP is the quote currency in this pair. Therefore, the price attached to this pair shows the amount of EGP that 1 CAD can buy. Let’s say that the price of CAD/EGP is 11.7692. This price means that for every 1 CAD, you can buy 11.7692 EGP.

Spread

In the forex market, the difference between the buying and selling prices of a currency pair is called the spread. The spread for CAD/EGP is: ECN: 3.7 pips | STP: 8.7 pips

Fees

There are no broker fees associated with the STP accounts. For the ECN account, however, the trading fee is determined by your broker.

Slippage

Slippage in forex is the difference between the price that a trader requests the broker to complete a trade and the price that the broker executes the trade. This difference is determined by the brokers’ speed of execution and market volatility.

Trading Range in the CAD/EGP Pair

Forex traders endeavor to know the average number of pips that a particular currency pair moves within a given timeframe. The trading range represents the volatility of a currency pair within a particular timeframe. The knowledge of a pair’s trading range makes for a useful risk management tool.

If, for example, during the 1-hour timeframe, the CAD/EGP pair has a trading range of 10 pips, then someone trading this pair can expect to gain or lose $8.5 within this period. Below is a table showing the minimum, average, and maximum volatility of CAD/EGP across different timeframes.

The Procedure to assess Pip Ranges

  1. Add the ATR indicator to your chart
  2. Set the period to 1
  3. Add a 200-period SMA to this indicator
  4. Shrink the chart so you can determine a larger period
  5. Select your desired timeframe
  6. Measure the floor level and set this value as the min
  7. Measure the level of the 200-period SMA and set this as the average
  8. Measure the peak levels and set this as Max.

CAD/EGP Cost as a Percentage of the Trading Range

In the forex market, trading costs include brokers’ fees, slippage, and spread. i.e.

Total cost = Slippage + Spread + Trading Fee

Below are analyses of percentage costs (in pips) to be expected when trading the CAD/EGP pair using either the ECN or the STP account.

ECN Model Account

Spread = 3.7 | Slippage = 2 | Trading fee = 1

Total cost = 6.7

STP Model Account

Spread = 8.7 | Slippage = 2 | Trading fee = 0

Total cost = 10.7

The Ideal Timeframe to Trade CAD/EGP

As can be seen from the tables above, trading the 1-hour timeframe with either the ECN or the STP account carries the highest trading costs. We can deduce that during times of low volatility, the trading costs are higher. However, for short term traders, timing their trades when volatility is above average during the 1H, 2H, 4H, and the 1D timeframes ensure they incur lower trading costs with the CAD/EGP pair.

The higher timeframes provide the longer-term traders of the CAD/EGP pair lower trading costs. Forex traders can reduce the trading costs by using limit order types, which removes the risks of slippage. Here’s a demonstration of how this works in the ECN account.

Total cost = Slippage + Spread + Trading fee

= 0 + 3.7 + 1 =4.7

Notice that when the slippage cost is eliminated by using limit orders, the total costs are significantly reduced. The highest cost, for example, reduces from 113.56% to 79.66%.

Categories
Forex Signals

USD/JPY Takes Dip Amid Downward Channel – Brace for Selling! 

During the Europen session, the USD/JPY continues trading lower amid a downward channel at 102.298 level. The USD/JPY pair moved in a bearish direction and posted big losses on Tuesday. The USD/JPY pair was down on Tuesday amid the broad-based U.S. dollar weakness along with the rising risk-averse market sentiment on the back of fresh tensions between the U.S. and China. The safe-haven appeal was also supported by the rising number of coronavirus cases and lockdowns that drove the stock market on the downside and weighed on the USD/JPY pair as well.

The U.S. Dollar Index that measures the value of the greenback against the basket of six currencies dropped by 0.3% to 92.8 level on Tuesday that weighed on the U.S. dollar and dragged the USD/JPY pair prices.

On the coronavirus front, the United States, Russia, France, Italy, Netherland, Spain, and many other nations across the globe set a new record for the number of daily coronavirus cases. The U.S. reported more than 74,300 new cases in a single day, France reported more than 52,000 daily cases over the weekend. The global record for the infections was recorded as 43.4 million on Tuesday by the Johns Hopkins University.

The rising number of coronavirus cases urged governments to re-impose lockdown measures to curb the virus’s spread. These lockdowns in a situation where economies were still under recovery phase from the previous lockdown effects raised a high appeal for the safe-haven market sentiment in the market. The risk-averse sentiment supported the safe-haven Japanese Yen that ultimately weighed on the USD/JPY pair on Tuesday.

Meanwhile, on the data front, at 09:59 GMT, the BOJ Core CPI for the year dropped to -0.1% from the forecasted 0.0% and weighed on the Japanese Yen that failed to reverse the negative movement of the USD/JPY pair. At 18:00 GMT, August’s Housing Price Index rose to 1.5% from the anticipated 0.7% and supported the U.S. dollar. The S&P/CS Composite-20 HPI for the year also advanced to 5.2% from the projected 4.2% and supported the U.S. dollar. At 18:59 GMT, the Richmond Manufacturing Index for October raised to 29 against the expected 18 and supported the U.S. dollar but failed to impress investors; thus, the USD/JPY pair continued moving in the downward momentum on Tuesday.

However, at 19:00 GMT, the C.B. Consumer Confidence for October was dropped to 100.9 from the anticipated 102.1 and weighed on the U.S. dollar that added further pressure on the USD/JPY pair. The U.S. dollar failed to cheer the positive macroeconomic data on Tuesday because of the stalled talks for the next round of the U.S. stimulus package. The stalemate between the White House and the House of Representative Speaker Nancy Pelosi over the U.S. stimulus aid package’s size led to delayed talks till November 3rd election results and weighed on the U.S. dollar.

The USD/JPY continues to extend its bearish momentum as the pair trades at the 104.298 level. On the 4 hour timeframe, the USD/JPY has formed a downward channel that’s driving bearish movement in the market, and it may support the pair around 104.300 and 104.007 area. Conversely, the continuation of an upward movement is likely to drive the buying trend until the 104.778 level. Check out the sell setup below…


Categories
Forex Basics

Similarities Between Trading and Standard Betting

Most of the time, when I explain to people what my way of life is, they think that the forex trading I do every day is actually some kind of gambling. There are, after all, some things that are similar, as no trader has a crystal ball to predict how the markets will move. Even so, there are many ways in which forex traders can understand markets and make educated decisions, decisions about their positions. Seeing this, I would like to suggest that before accusing a forex trader of being betting, you should consider how the trader operates and what your long-term goals are.

Coincidences Between Trade and Gambling

Consider some of the coincidences between trading and betting. The most realistic thing is that there is no guaranteed result. In both cases, participants invest their money in the market and expect to make a profit instead of losing. From this point of view, buying the Swiss franc or betting on the outcome of a game is not going to be very different. You win or lose.

A professional poker player and a professional forex trader should accept that it is impossible to predict with certainty the outcome of a bet or trade. In both cases, you put your money at risk in the hope that it will produce a return. Both professionals must understand that losing is part of the afterlife.

To negotiate or to gamble? It is also possible that a “black swan event” occurs in the world of currency trading that has an equivalent in the world of betting. In the world of financial markets, a “black swan event” is a big headline that crosses the wires causing the market to have a very volatile reaction. For example, a headline could appear in which one country is threatening another with military action. This will usually send foreign exchange markets on a wild trip. An example would be when Iraq invaded Kuwait. Not only did it affect currency markets, but it also affected the oil market, as might be expected. In the betting world, a black swan event would be the equivalent of your opponent having four bundles at the poker table, something that can happen but is very rare and will cause many problems.

Finally, a great coincidence between betting and trading is the psychological strength that both activities require. Gamblers and traders must be prepared to deal with losses, such as not overreacting to losses and avoiding over-trading or over-gambling in order to compensate for losses.

Differences Between Trading and Betting

It is obvious that there are many differences between trading and gambling. For beginners, if you are a proficient currency trader you will have a trading system with positive long-term expectations. As a professional trader, you should have tried your trading system, you will know the advantages and disadvantages and you will understand that there are times when you will lose money consistently, but over time you will recover. When it comes to gambling there is less science and much more luck, so your results over time could not be as consistent.

Similarly, if you are a professional trader, understand that there are specific circumstances that make you put money on the market. This is called your trading edge. As a professional trader, you will probably not bother trading in inappropriate circumstances, because you understand that this is not the time when you will make money. In this sense, there is a big difference between trading and betting- trading, when done properly, there has to be some process behind it, while gambling does not have this.

Technical analysis is also a great contributor to the differences between trading and betting, as it can have a battery of indicators or a trading system that gives you a clue as to when conditions might be right. Obviously, it will be a little different in each game, but in general, it is not simply betting on a random result on dice, cards, or the wheel of fortune, in fact, it does not have much to support its thesis, certainly not as much as a financial chart.

Finally, one of the biggest differences between trading and a beginner’s betting is money management. A professional trader will not risk much of his capital on a particular operation, while a novice gambler could bet everything, which is reckless.

Trading is Betting? That’s Up to You

In the end, the answer to this question depends on you. For many novices, trading is betting, because they are carrying out operations based on their emotions and not on analysis. But, as you develop your skills and strategies, there is no doubt that forex trading can become more like a science than luck, separating you from betting in an important way.

Success for both traders and gamblers relies heavily on controlling emotions. But this coincidence doesn’t make them the same. Although there are some correlations, a solid currency trader will feel secure in the science of trading, allowing him to get a “trading edge” that will take him much further than bets could carry him.

Categories
Forex Signals

GBP/AUD Trend Pullback

Categories
Forex Course Forex Daily Topic

160. What are Currency Crosses and Why Should You Trade Them?

Introduction

Currency crosses are currency pairs from major and commodity currencies eliminating the US Dollar. Trading cross currency pairs require knowledge of the two countries’ economic conditions, which is not related to the USA.

Major Vs. Cross Currencies

More than 80% of the forex market transactions happen through the US Dollar as it is the reserve currency in the world. Most of the commodities and agricultural products are valued in US dollars.

Therefore, if we want to buy something from a country, we should exchange the currency into the US Dollar to make the transaction. As a result, most of the countries keep the US Dollar as the reserve currency. In particular, China, Japan, and Australia are the largest importer of oil; therefore, they keep a vast number of US Dollars in their central banks.

Because of the massive demand for the US dollar, major currency pairs have a higher trading volume, allowing it to have a decent movement. On the other hand, if we eliminate the US dollar from the major currencies, we will find cross pairs, which is also profitable.

Why Trade Currency Crosses?

Instead of trading at major Dollar based currency pairs, we can profit from trading cross pairs. The most significant features of cross currency pairs are that they are not bound to US Dollars and can make a decent move without any intervention of the US economy.

As a result, many traders trade in currency crosses to diversify their portfolio. Cross pairs can make a decent movement, while dollar-based pairs remain corrective. At that time, it is better to go with the moving market than sit back and watch the corrective price.

Moreover, trading cross pairs might be profitable if the trading session is favorable. For example, we can profit from the GBPJPY pair at Asian and London sessions rather than trading in the US session.

Summary

Based on the above discussion, let’s point the core parts of cross-currency trading:

  • Cross currency trading is similar to major currency trading.
  • There is no US dollar in cross currency pairs.
  • Cross currencies are from major and commodity currencies.
  • Cross currency pair can make a decent move without US session.
[wp_quiz id=”86453″]
Categories
Forex Fundamental Analysis

Everything You Should Know About ‘Job Cuts’ As A Forex Fundamental Indicator

Introduction

The labor market plays play a crucial role in determining the strength of the economy. Perhaps one of the most closely watched fundamental economic indicator is the unemployment rate since it is one of the leading indicators of demand. The growth of any economy is entirely dependent on the forces of demand and supply. Entire industries have been built by surging demand and crippled by lack of it.

Understanding Job Cuts

Job cuts represent the number of corporate employees who have been laid off over a given period. The job cuts report shows the national number of people who were laid off. This number is further broken down by industry, ranking those with the most job cuts to the least. The job cuts are compared monthly, quarter-on-quarter, yearly, and year-to-date. The report goes further to include the hiring plans announced by the various sectors, thus showing the potential number of job vacancies.

Therefore, we notice that the job cuts report serves to show job losses and future openings. Thus, it is a powerful indicator in the labor market and the economy since it can be used to predict whether recessions are coming, the state of economic recovery, and show the sentiment about the economy from employers’ perspective.

Using Job Cuts Report for Analysis

As an indicator of economic health, job cuts can signal the following.

An increasing number of job cuts is a precursor to higher unemployment levels and signals a shrinking economy. It is considered a leading indicator of unemployment. With more and more people losing their jobs, households’ disposable income will be on a decline. Consequently, the aggregate demand in the economy will decline, and with it, the aggregate supply. These declines imply that producers are scaling down their operations, matching the lowering demand to avoid market price distortion.

Source: St. Louis FRED

Since the job cuts report is categorized by industry, it serves to show which sectors of the economy are performing poorly. Job cuts are a result of the general challenging operating environment. It shows that companies are attempting to reduce operating costs as a result of a decline in demand. With this report, we can analyze which sectors are hard hit by tough economic times and which sectors are resilient. For investors, this analysis is instrumental in deciding which sector to invest in. the report can also be used to show which industries are worse affected by economic recessions.

It will be useful for policymakers to implement sector-specific policies to help cushion the labor market in the future. The job cuts report can be used to establish which economic sectors are susceptible to business cycles by analyzing which sectors have the most cuts in times of recessions. During a recession, the aggregate demand is falling, and when the economy is recovering, the aggregate demand increases. Thus, it is expected for job cuts to reduce in time of recovery and economic expansion.

Similarly, investors can use historical figures to help pinpoint the peak and trough levels of the business cycle. Typically, the economy has the most job cuts when the recession is at its worst. This point can be considered the trough – and it precedes a recovery. Here would be the optimal point of investing for investors who would want to capitalize on the effects of recovery. When the economic recovery is at its peak and unemployment levels are their lowest, it signifies that the economy might overheat.

Source: St. Louis FRED

Together with the analysis of business cycles, the job cuts report can provide a clear picture of the number of temporary workers in the labor market. It goes to reason that in times of recovery, businesses tend to hire more workers. However, businesses most impacted by the economic cycles would opt to engage temporary labor instead. In times of recession, most of these jobs are lost. Therefore, the job cuts report can be used to identify which industries hire the most temporary workers.

Job cuts could also be a result of automation, not entirely because of a decrease in the aggregate demand. It is worth noting that the automation of business processes results in improved efficiency, higher output, and possibly higher quality of goods and services. While all these might be good for the businesses and possibly the economy, the effects of the jobs lost will still be reflected in the economy.

Impact on Currency

When analyzing the labor market, most forex traders concentrate their attention on the employment report. However, job cuts report is released ahead of the employment situation report; it can provide leading insights. Here are some of the ways job cuts can impact the forex market. The job cuts are used to forestall recessions and recoveries.

When the job cuts are increasing, it signals that the aggregate demand in the economy will decline. Businesses scaling down operations implies low investor confidence in the economy, which could mean there is a net outflow of capital. Increasing unemployment levels, a shrinking economy, and more households relying on the government social security programs signal a recession. Expansionary fiscal and monetary policies will be implemented. One such policy includes lowering interest rates, which make the currency depreciate relative to others.

A reduction in the job cuts signals economic recovery, making the currency increase in value relative to others. When job cuts are steadily reducing, businesses are retaining more of their employees as time goes by. This retention is a sign of improving economic fundamentals.

Sources of Data

Challenger, Gray & Christmas publishes the US job cuts data. Challenger, Gray & Christmas is a global outplacement and career transitioning firm. Comprehensive historical coverage of the US job cuts is accessed at Trading Economics.

How Job Cuts Data Release Affects Forex Price Charts?

The most recent release of the US Challenger job cuts was on October 1, 2020, at 7.30 AM ET and accessed at Investing.com. The screengrab below is of the monthly Challenger job cuts.

Low volatility is to be expected when the job cuts report is released.

In September 2020, the number of US job cuts was 118.804K compared to 115.762K in August. In terms of the YoY change, the September job cuts represented a 185.9% change compared to a 116.5% change in August.

Now, let’s see how this release made an impact on the Forex price charts.

EUR/USD: Before the Challenger Job Cuts Release on October 1, 2020, 
Just Before 7.30 AM ET

Before the new release, the EUR/USD pair was trading in a general uptrend. As shown in the above 5-minute chart, the candles were forming above a rising 20-period MA.

EUR/USD: After the Challenger Job Cuts Release on October 1, 2020, 
at 7.30 AM ET

After the US job cuts report release, the pair formed a bullish 5-minute candle as expected, due to the weakening of the USD. Subsequently, the pair continued trading in a subdued uptrend with the 20-period MA flattening.

Bottom Line

The job cuts report plays a vital role in the economy, especially now, by showing the state of economic recovery from the coronavirus-induced recession. However, in the forex market, the job cuts report is a low-impact indicator since most traders and analysts pay the most attention to the employment situation report. The low impact nature can be seen as the release of the Challenger job cuts report failed to advance the bullish momentum of the EUR/USD pair.

Categories
Forex Signals

AUD/CAD Breaking Below Upward Channel – Is there a Sell Trade?

The USD/CAD extended its previous session bullish bias and hit the session high around above 0.9416 level. However, the bullish sentiment around the currency pair was being supported by a modest pickup in the ongoing drop in crude oil prices, which tend to undermine demand for the commodity-linked currency – the loonie. Hence, the broad-based U.S. dollar managed to gain some positive traction on the day amid growing market worries about surging coronavirus cases in Europe and the United States, which keeps the market trading sentiment under pressure and undermined the greenback. 

In addition to this, the long-lasting impasse over the next round of the U.S. fiscal stimulus measures added further burden on investors’ sentiment and benefitted the USD’s status as the global reserve currency. Across the pond, the reason for the currency pair bullish bias could also be attributed to the weaker crude oil prices, which undermined the demand for the commodity-linked currency the loonie and contributed to the currency pair gains. As of writing, the AUD/CAD currency pair is currently trading at 0.9396 and consolidating in the range between 0.9416 – 9330.

Despite the optimism over a potential treatment/vaccine for the highly infectious virus, the market risk sentiment remains depressive with Wall Street hugging the sellers and S&P 500 Futures flashing losses amid a combination of factors. Be it the worrisome headlines concerning Brexit or the tension between the US-China, not to forget the coronavirus issues, the market trading sentiment has been flashing red since the week started, which ultimately keeps the safe-haven assets supportive on the day. 

At the coronavirus front, the prevalent worries over the resurgence of the coronavirus pandemic raised fears of global economic recovery, which keeps the market trading sentiment under pressure. The coronavirus COVID-19 cases continue to climb in Europe, U.K., and the U.S. As per the latest report, the U.S. has witnessed its highest ever number of new COVID-19 cases over the weekend, while France is also reporting new case records and Spain announced a state of emergency. As in result, the imposition of stricter lockdown measures to stop the second wave of COVID-19 cases, along with receding hopes for a pre-election fiscal deal also weighed on market trading sentiment.

This, in turn, the broad-based U.S. dollar succeeded to extend its early-day gains and remained well bid on the day as investors turned to the safe-haven in the wake of risk-off market sentiment. However, the gains in the greenback could be temporary due to the worries that the economic recovery in the U.S. could be stopped because of the reappearance of coronavirus cases. Besides this, the gains in the U.S. dollar were further boosted by a lack of progress toward a U.S. stimulus package, which puts traders in a cautious mood. However, the gains in the U.S. dollar kept the currency pair higher. Whereas, the U.S. Dollar Index that tracks the greenback against a basket of other currencies rose to 93.028.

Across the pond, the crude oil prices failed to stop its last week losing streak and remained depressed around below the $38.50 mark. However, the reason for the bearish bias around the crude oil prices could be attributed to the ever-increasing COVID-19 worries, which raised fears of renewed lockdown measures and depressed hopes for a swift recovery in the fuel demand. Across the pond, the anticipation of a rise in Libyan crude supply also played its major role in undermining crude oil. 


Entry Price – Sell 0.9389

Stop Loss – 0.9429

Take Profit – 0.9329

Risk to Reward – 1:1

Profit & Loss Per Standard Lot = -$400/ +$400

Profit & Loss Per Micro Lot = -$40/ +$40

Fellas, now you can check out forex trading signals via Forex Academy mobile app. Follow the links below.

iPhone Users: https://apps.apple.com/es/app/fasignals/id1521281368

Andriod Users: https://play.google.com/store/apps/details?id=academy.forex.thesignal&hl=en_US


Categories
Forex Course

159. Understanding Forex Assets Classes

Introduction

The forex market is the world’s biggest financial market, where daily turnover is more than 6 trillion dollars. The most exciting feature of the forex market is that it has an enormous number of trading instruments that allow traders to diversify their portfolio. Besides significant currency pairs, cross pairs are very profitable as it can make e decent move.

What is the Currency Pair?

In the stock market, investors’ trade in a particular stock of a company. This is not similar to the currency market. In the forex market, traders usually trade on a currency pair instead of a single currency.

The combination of two currency indicates the economic condition of two separate countries. Therefore, if we want to trade on a currency pair, we should know at least two countries’ economic conditions. For example, if we want to buy EURJPY pair, our analysis should indicate that the European economy will be more durable than the Japanese economy.

Major vs. Cross Currency Pair

US Dollar is the most traded currency in the world. Therefore, any currency pair from the developed country with the US Dollars will represent the major currency pair.

A list of 6 major currency pairs are mentioned below:

  1. EURUSD
  2. GBPUSD
  3. USDJPY
  4. USDCAD
  5. USDCHF
  6. AUDUSD

If we eliminate the USD from these major pairs, we will find the cross currency pairs. Let’s say the value of EURUSD is 1.0850, and the value of AUDUSD is at 0.7150. Therefore, the value of EURAUD would be 1.39 (1/1.085X 1.085/0.7150).

Other examples of Cross currency pairs are EURGBP, EURCAD, GBPCHF, GBPAUD, CADJPY, EURJPY, etc.

The condition for cross currency pairs are-

  • The currency should be from the major pairs.
  • The cross pair should eliminate the US dollar.

Is Cross Currency Pair Trading Profitable?

Trading cross currency pairs is similar to trading major currency pairs as both technical and fundamental analysis work well in cross currency pairs.

For example, we can make a decent profit from the GBPJPY pair if we can evaluate the UK and Japan’s economic condition.

Conclusion

Trading in a currency pairs means to anticipate the price based on the technical or fundamental analysis. Therefore, if we know the two countries’ economic conditions, we can make a decent profit from cross-currency pairs.

[wp_quiz id=”86447″]
Categories
Forex Signals

EUR/JPY Breaking Below Intra-day Support – Brace for Selling!


Entry Price – Sell 123.855

Stop Loss – 124.255

Take Profit – 123.455

Risk to Reward – 1:1

Profit & Loss Per Standard Lot = -$400/ +$400

Profit & Loss Per Micro Lot = -$40/ +$40

Fellas, now you can check out forex trading signals via Forex Academy mobile app. Follow the links below.

iPhone Users: https://apps.apple.com/es/app/fasignals/id1521281368

Andriod Users: https://play.google.com/store/apps/details?id=academy.forex.thesignal&hl=en_US

Categories
Beginners Forex Education Forex Basics

Basic Forex Market Concepts to Become Familiar With

If you’ve recently stepped into the world of forex trading, or if you’re considering it, then there’s a lot you need to know. Everything can seem complicated at first, but some of the most basic concepts are simple and easy to understand. For example, if you’ve ever traveled overseas and exchanged currency, then you’ve participated in the foreign exchange market. We’ve outlined some of the most basic forex concepts below. 

Currency Pairs

If you’re trading stocks, there are literally thousands of options to choose from in worldwide companies. Major currency pairs are a lot more condensed. There are 8 major countries that make up the majority of trading and therefore are considered major currency pairs:

  • United States (USD)
  • Europe (Germany, France, Italy, and Spain) EUR
  • United Kingdom (GBP)
  • Japan (JPY)
  • Canada (CAD)
  • Australia (AUD)
  • New Zealand (NZD)
  • Switzerland (CHF)

These currencies are paired against another currency, like so: USD/EUR. When you trade in the foreign exchange market, you are actually buying one currency and selling another. This could basically be summed up to say that you are using the proceeds from the first currency that is sold to purchase the second currency. Interest rates and economic data can affect the prices of these pairs.

Any currency pair that doesn’t include the US dollar is considered a minor currency pair. Here are a few examples:

Exotic currency pairs are also available for trading, although they may not be as available through your broker as major and minor currency pairs. Exotics are made up of a major currency and a currency from a developing country. For example:

  • EUR/TRY (Euro/Turkish Lira)
  • USD/HKD (US dollar/Hong Kong dollar)
  • GBP/ZAR (British pound/South African Rand)

Generally, exotic pairs are more volatile instruments because they are attached to some countries that might experience political instability, more government debt, and so on. 

Leverage

One of the main benefits of trading forex is the ability to use leverage, which essentially involves borrowing money from your broker in order to make larger trades. If you don’t have a lot of money in your account, this can really increase your investment power. You’re required to put up a certain level of margin to do this in case the trade fails. You’ll also see a lot of different leverage offers out there. Some regulators restrict their maximum leverage cap to 1:30, while others push it to 1:100, 1:200, 1:300, or higher – even up to 1:1000 or more. Do be warned, however, that leverage is often referred to as a “double-edged sword” because of its ability to cause a great gain or a significant loss of money. You’ll always want to stick with smaller leverage until you can handle taking more risk.

What Drives Prices?

There are a few key factors that drive prices in the forex market:

  • Inflation rates
  • Interest rates 
  • Country’s current account balance
  • Government debt
  • Terms of trade
  • Political stability 

If you aren’t familiar with the ways that these factors can change a currency’s value, be sure to do more research on the subject. 

What you Need to Get Started

Becoming a forex trader might seem difficult, but you don’t need much to get started. This is something that anyone can do if they apply themselves and put in the time. Here are the essentials required for trading forex:

  • A device (computer, laptop, phone, tablet, etc.) with a working internet connection
  • An education (you can get this online for free!)
  • A trading account (there are thousands of brokers out there with options for beginners)
  • A deposit (some brokers will allow you to open an account with as little as $5)

As you can see, the four things you need to start trading aren’t difficult to acquire. You probably already have a device with a connection, otherwise, you wouldn’t be able to read this article. Most people have at least $5 – $100 they can invest and it’s easy to open a trading account. The part that takes the most time is education, but there are multiple resources online to help with that.

Categories
Forex Basics

How to Deal with Trading Burnout

To many outsiders, trading might seem like an easy task. You just sit around your computer, pay attention to the news, enter a few trades, and the money comes rolling in with little effort. Yet real forex traders know how stressful it actually is and how much goes into making trading decisions. All of the stress can lead to trading burnout, which is also caused by certain circumstances, including personal losses, bad market conditions, unmet goals, trading too much, etc. If you’ve found yourself in a slump lately, you’re likely dealing with trading burnout, so read on to find ways to deal with this problem.

Look for Warning Signs 

Sometimes, you’ll just know that you’ve been overworking yourself because you’ll notice the physical symptoms or just feel like you’re no longer interested in putting in an effort. Other times, burnout might sneak up on you and you’ll go on stressing yourself out without dealing with it at all. You can start by knowing the signs of burnout so that you’ll more easily recognize when it’s happening to you: 

  • Physical symptoms, like headaches or sickness
  • Issues with overeating or not eating enough or the desire to drink more than usual
  • No longer caring about your trading plan or results
  • Little desire to trade when you once enjoyed doing it
  • Doubting your ability to trade

If you find yourself displaying any of these symptoms, it’s better to take a step back and deal with the problem rather than to continue on trading like nothing is wrong. These symptoms will affect your life negatively, especially physical symptoms like headaches. You’ll also see a hit to your trading results, as the lack of motivation can cause you to stray from your trading plan and to put less effort into your trading decisions. If you don’t believe us, just try looking back at your trading journal to check how your profits have changed since you first began dealing with the stress. 

Fortunately, there are some steps you can take to help de-stress and to become more invested in trading again so that your results will improve:

-Think back to when you first started trading. You were probably nervous but full of passion and excitement. Remember when things started making sense when you realized your trading plan worked, or the first time you made a profit. Try to revisit your happiest trading memories from the early days before you let it stress you out.

-Try to find someone you know that you can share your feelings, results, and ideas with when it comes to trading. If you don’t know anyone that does trade, try turning to online message boards to stay engaged with others that have this similar interest.

-Sometimes, you might just need to take a break from trading and spend some time doing something you enjoy. Whether that comes in the form of a trip to the beach, pampering yourself, or going out for a nice dinner, spending some time doing something less stressful from time to time can help you get your head back in the game. 

-You can also take an off day every now and then and just rest if it helps. Giving your mind a break can allow you to start fresh the next day.

-If you find that you’re often stressed because you aren’t meeting your goals, try setting smaller goals, or revising your trading plan if it requires too much from you.

Categories
Forex Course

158. Where to Find Authentic Forex News and Market Data?

Introduction

Fundamental analysis is an integrated part of forex trading. It provides an exact logic and reason behind the movement of a currency pair. However, the fundamental analysis depends on several fundamental releases and news. Therefore, it is evident for a trader to know the source of this news.

What is Forex News and Market Data?

Forex news is economic, geopolitical, and financial news that may directly affect the price of a currency pair. Moreover, fundamental data are economic releases that show the current and upcoming economic conditions of a country.

The price of currency pairs depends on many factors, and traders evaluate it to anticipate the market movement. For example, if a country achieved its targeted inflation rate, and the central bank raised the interest rate, it will indicate stronger economic conditions that may influence traders to take traders in a specific direction.

However, it is essential to find the source where the forex news and market data are available.

Where to Find Forex News and Market Data

Forex trading becomes very easy nowadays as most economic news and market data are available on the internet as soon as it releases. Therefore, forex trading becomes very attractive to retail traders as they can operate all their activities from home with a computer and a stable internet connection.

Let’s have a look where we can find this information:

Forex Brokers

Many forex brokers provide integrated market news and an economic calendar where the upcoming economic releases and events are scheduled. It will update as soon as the news comes and will provide historical data. Some brokers provide exclusive technical and fundamental analysis based on forex news and market data, which is also helpful for traders.

News Portal

Besides the forex broker, there are many websites where forex economic calendar and events are released. It also provides technical and fundamental analysis based on the available information. However, some trading portals offer live charts with economic data.

Image Source: www.forexfactory.com

Forex Indicator

Besides the MT4 and MT5 trading platform’s stock indicator, several custom-based indicators show the upcoming news in a box within the price chart. When the news comes, it shows the result immediately on the chart. On the other hand, MT4 and MT5 have a built-in economic and fundamental news service, which is very useful.

Conclusion

It is not very hard to find forex news and market data as it is available publicly, and anyone can access it. However, the challenging part is getting the news immediately after release. The news’s timing may differ based on the quality of the internet connection and execution speed of the news providing website.

[wp_quiz id=”86437″]
Categories
Forex Service Review

FX Sniper Yellow Indicator Review

FX Sniper Yellow is an indicator that can be used exclusively to trade with Forex on your Metatrader trading platform. The main feature of FX Sniper Yellow is that it is able to analyze the behavior of market participants and predict changes in price direction even before the movement begins. Something that seems incredible.

Most indicators are delayed indicators and are quite useless. FX Sniper Yellow is an indicator that promises to anticipate market changes, calling itself a leading Indicator. FX Sniper Yellow displays the arrows in its chart showing the most likely direction of price action. FX Sniper Yellow never repaints and once the candle is closed the signal is confirmed, and the arrow will never disappear.

Indicator Entries

  • Use alerts (true/false): to activate alerts
  • Pops alerts (true/false): to activate popup alerts
  • Email alerts (true/false): to enable email alerts
  • Pushers (true/false): to activate Push Notification alerts
  • Sound alerts (true/false) to activate Sound alerts
  • Soundfile: is the file to be used for sound alerts

The size and color of the arrows can be set manually in the Color tab of the indicator.

Trading Rules

  1. You have to enter the trade at the opening of the next candle in the direction of the signal (SELL/BUY)
  2. Place the stop loss at the top (SELL) or bottom (BUY) of the ATR-based signal or stop candle.
  3. Take reward benefit/ the risk will be 2:1 or 3:1
  4. You can filter the input signals to go with the trend only. Therefore, we recommend using an additional trend indicator to your liking.
  5. Filtering signals with a trend is optional. This is not mandatory.
  6. This indicator can be used with any time frame.
  7. This indicator can be used for trading Forex, binary options, and also raw materials, stocks, futures, etc…

Free Version

You can download the free version of the indicator on the MQL5 market. This free version only works with Metatrader’s Strategy Tester. Or if you want to buy the full version, its price is 197 USD, or 27 USD monthly. You can find it in the MQL market, in the indicators section. Despite being a product that has been in the market for years, we have not found reviews from users who have tried it

Categories
Forex Course

157. What Expectations Do Forex Market Have On The Financial News?

Introduction

Economic releases and news are essential for traders who make trading decisions based on fundamental analysis. Economic news is publicly available as soon as it releases. Therefore, traders can access it from any internet connection enabled device. As economic releases directly affect the currency market, traders must understand how to use it.

Types of Economic News

There are three types of economic news for the currency market- low impact, medium impact, and high impact. Among these types, the high impact news is essential as it immediately impacts a currency pair. Some example of high impact economic news is-

  • Interest rate decision
  • Inflation report
  • Retail Sales
  • PMI
  • GDP
  • Export and Import
  • Foreign Currency Reserve

Besides, the high impact news, medium, and low impact news often create a good movement in the market, which is not very frequent. Therefore, we should stick to high and medium impact news only.

How Economic News Affect the Currency Pair?

There are three significant elements of the economic news that a trader should consider while doing analysis. They are:

  • Previous Release- Previous data is the most recent release used to compare with the current data.
  • Expectation- Before releasing every news, analysts project the data. If the news comes better than expected, it will be shown in green and indicate a positive effect on the currency.
  • Current Release- It is the most important part as trading decisions depend on it. The current release is the data that usually release on a particular day.

Let’s have a look at how to read the news:

  • The current release is better than the Previous release- Good for the currency
  • The current release is better than the expectation- good for the currency
  • The current release is worse than the previous release- bad for the currency
  • The current release is worse than the expectation- bad for the currency.

Image Source: www.forexfactory.com

In the above image’s marked area, we can see that the US monthly retail sales came at 1.2%, where the previous data was 8.4%, and the expectation was 2%. As the news massively declined from 8.4% to 1.2%, the US Dollar became weaker than the Euro as indicated in the image below:

Conclusion

As of the above discussion, we can say that better than expected and previous data may positively impact the currency, and weaker than expected data will negatively impact a currency. However, we should consider the overall fundamental outlook of a country to take the ultimate trading decision.

[wp_quiz id=”86431″]
Categories
Forex Market Analysis

Daily F.X. Analysis, October 23 – Top Trade Setups In Forex – European PMI In Highlights! 

The economic calendar is filled with medium impact economic events such as Unemployment Claims, C.B. Leading Index m/m, and Existing Home Sales from the United States on the news front. Besides, the Consumer Confidence from the Eurozone will also remain in the highlights today. The market may show some price action during the U.S. session on the release of U.S. Jobless Claims. 

Economic Events to Watch Today  


EUR/USD – Daily Analysis

The EUR/USD closed at 1.18184 after placing a high of 1.18666 and a low of 1.18111. The EUR/USD pair was down and remained bearish on that day. As the market sentiment deteriorated and the U.S. dollar moved stronger across the board, the EUR/USD pair dropped on a session by 0.3% and remained one of the worst G10 performers on Thursday.

The common currency put an end to a four-day rally on Thursday as the hopes of the next round of U.S. stimulus deal faded away. 

The U.S. President Donald Trump crushed the risk appetite on Thursday after blaming Democrats for not compromising an acceptable agreement. This raised the U.S. dollar on board from its seven-week lowest level. The hopes for the next round of U.S. stimulus package were faded after Trump blamed Democrats that they were unwilling to compromise on the relief aid bill’s size. However, the talks were continuing, and it is uncertain whether a stimulus package is delivered before the Presidential elections or not.

The faded hopes dampened the risk sentiment and added strength to the U.S. dollar that ultimately added weight on the EUR/USD pair on Thursday. Furthermore, the rising number of coronavirus cases in Europe also weighed on the EUR/USD pair. In Europe, the daily number of infections reached record levels, with Spain becoming the first western country to report one million cases. These rising numbers of coronavirus cases from Europe also undermined the Euro currency’s confidence, ultimately added to the losses of the  EUR/USD pair.

On the data front, at 11:00 GMT, the German GfK Consumer Climate came in as -3.1 against the forecasted -2.9 and weighed on Euro currency that added in the losses of EUR/USD pair. At 18:52 GMT, the Consumer Confidence from Europe was also declined to -16 from the projected -15 and weighed on the single currency and added in the losses of EUR/USD pair. From the U.S. side, the Unemployment Claims from last week were dropped to 787K against the projected 860K and supported the U.S. dollar. At 19:00 GMT, the Existing Home Sales also raised to 6.54M against the forecasted 6.20M and supported the U.S. dollar that ultimately weighed on EUR/USD pair.

Apart from macroeconomic data, the European Central bank has also hinted that the Eurozone’s economy was in for a bumpy road ahead. The President of ECB Christine Lagarde also warned about the effects of the second wave of coronavirus on the economy. So, the weak outlook of the Eurozone economy also weighed on EUR/USD pair.

Daily Technical Levels

Support    Resistance

1.1828     1.1889

1.1795     1.1915

1.1768     1.1949

Pivot Point: 1.1855

EUR/USD– Trading Tip

The bullish bias of the EUR/USD has weakened as the pair fell from the 1.1880 level to a 50% Fibonacci retracement level of 1.1805 level. This level’s violation may trigger further selling until the 1.1769 area that marks 61.8% Fibonacci retracement for the EUR/USD. The EUR/USD is likely to exhibit further selling bias today, especially after violating the 1.1770 level to 1.1740 level. The MACD and RSI are also supporting the bearish bias; therefore, bearish bias remains dominant today. The EUR/USD may face resistance around 1.1837 and 1.1880 level today.


GBP/USD – Daily Analysis

The GBP/USD closed at 1.30822 after placing a high of 1.31517 and a low of 1.30704. Overall the GBP/USD pair remained on the downside all through the day. The GBP/USD pair gave up some ground and remained bearish on Thursday amid the broad-based U.S. dollar come back. However, the GBP/USD pair managed to stay in the upper half of its weekly range.

The British Pound fell on Thursday, although the talks between the E.U. & U.K. resumed on the day. The reason could be attributed to the brinkmanship from Britain amid negotiations, risk an accidental no-deal Brexit. On Thursday, the top E.U. Brexit negotiator Michael Barnier arrived in London to intensify talks with his British counterpart David Frost to break the impasse and find a solution to key sticking points, fisheries, and state aid.

The fisheries have long been a debating point in the Brexit negotiations as the U.K. has been determined to control access to its waters after the transition period ends. U.K. has refused to stick with the E.U.’s common fisheries policy that set fishing quotas among the E.U. member states. The transition period has come near to end with just months to go, and the U.K. has refused to allow talks to run past the year-end deadline. According to a spokesman for UK PM Boris Johnson, the time has remained very short as the U.K. has been reportedly clear that any agreement should be placed before the end of the transition period.

The concerns have raised in the market that the U.K.’s strategy to be somewhat tough on talks and deadlines could risk an accidental no-deal Brexit as the end of the year is coming ahead. These concerns weighed on the Sterling and added the GBP/USD pair’s losses on Thursday.

On the data front, the CBI Industrial Order Expectations from the U.K. came in as -34 against the forecasted -50 and supported British Pound. 

However, from the U.S. side, the Unemployment Claims from the previous week declined to 787K against the forecasted 860K and supported the U.S. dollar. The Existing Home Sales also supported the U.S. dollar after rising to 6.54M from the anticipated 6.20M. The positive data from the U.S. exerted pressure on GBP/USD pair on Thursday. Meanwhile, the Bank of England Governor Andrew Bailey told of strong demand to invest in climate change technology. He also sketched a strong demand for green investment. Looking forward, market participants will await the release of PMI for services and manufacturing activities to find a fresh clue about GBP/USD pair.

Daily Technical Levels

Support    Resistance

1.3049     1.3129

1.3021     1.3179

1.2970     1.3208

Pivot point: 1.3100

GBP/USD– Trading Tip

The GBP/USD traded bearishly below the 1.3165 resistance area to trade at the 1.3070 level that marks the 38.2% Fibonacci retracement level for the Sterling. On the further downside, the GBP/USD pair may take another dip until the 61.8% Fibo level of 1.3018 as the MACD is still pointing towards the selling area. At the moment, Sterling’s immediate resistance holds at the 1.3070 mark; however, the closings below this level is supporting the selling bias. Consider opening sell trades below the 1.3100 level today. 


USD/JPY – Daily Analysis

The USD/JPY pair was closed at 104.884 after placing a high of 104.921 and a low of 104.474. The movement of the USD/JPY currency pair stayed bullish throughout the day. The USD/JPY pair traded with a positive note during the whole Thursday session after a goodish pickup in the U.S. dollar demand. The rebounded U.S. dollar helped currency pair USD/JPY to gain positive traction and move away from the six-week lowest level it touched on Wednesday.

The slow progress in the U.S. stimulus measure package attracted some buying in the greenback that dampened the hopes that financial aid will be delivered before elections. The statement by House of Representatives Speaker Nancy Pelosi that soon there will be pen to paper on the stimulus bill failed to impress investors, and the USD/JPY pair continued moving in the upward direction.

Pelosi even said that the stimulus package could be passed in the House before election day. Still, investors were somewhat unconvinced that the bill could pass through the Senate due to the strong opposition from Republicans over a bigger stimulus deal. This, in turn, weighed on risk sentiment and supported the Japanese Yen that ultimately capped further upside in the USD/JPY pair prices.

Apart from developments surrounding the U.S. fiscal stimulus, the USD bulls further took clues from the better than expected release of the U.S. initial jobless claims. The number of Americans filed for unemployment benefits declined to 787K during the previous week for the first time against the projected 860K and supported the U.S. dollar. The decline in unemployment claims means less need for a U.S. stimulus package and more strength for the U.S. dollar and USD/JPY pair.

On the data front, the C.B. Leading Index from the U.S. dropped to 0.7% against the expected 0.8% and weighed on the U.S. dollar. The Existing Home Sales advanced to 6.54M in comparison to projected 6.20M and supported the U.S. dollar. Another favorable economic data release gave strength to the U.S. dollar that pushed the USD/JPY pair even higher on grounds.

Meanwhile, the rising number of coronavirus cases across the globe and fears for economic recovery due to lockdowns imposed to curb the spread of the virus raised the safe-haven appeal, supported the Japanese Yen, and weighed on the USD/JPY pair to limit its bullish move on Thursday.

On Thursday, the U.S. Dollar Index measures the greenback against the six currencies’ basket surge by 0.4% to 92.97. The U.S. dollar index fell to its seven-week lowest level at 92.46 on Wednesday but recovered from there on the next day amid a strong U.S. dollar despite the talks for stimulus package continued. However, traders’ focus will now be shifted towards the final presidential debate between President US Donald Trump and his Democratic rival Joe Biden.

Daily Technical Levels

Support    Resistance

104.18     105.35

103.68     106.00

103.02     106.51

Pivot point: 104.84

USD/JPY – Trading Tips

The USD/JPY traded dramatically bearish to drop from 105.460 level to 104.349 level. Like other pairs, the USD/JPY has also entered the oversold zone, and now sellers seem to be exhausted. On the higher side, the USD/JPY pair has reversed some of the losses to trade at the 104.700 level. On the higher side, the pair may go after the 38.2% Fibonacci retracement level of 104.900 and 50% Fibo level of 105. Let’s consider taking a buying trade over 104.350 area today. Good luck!