Categories
Forex Basic Strategies

The Best Tools to Trade Pullbacks Effectively

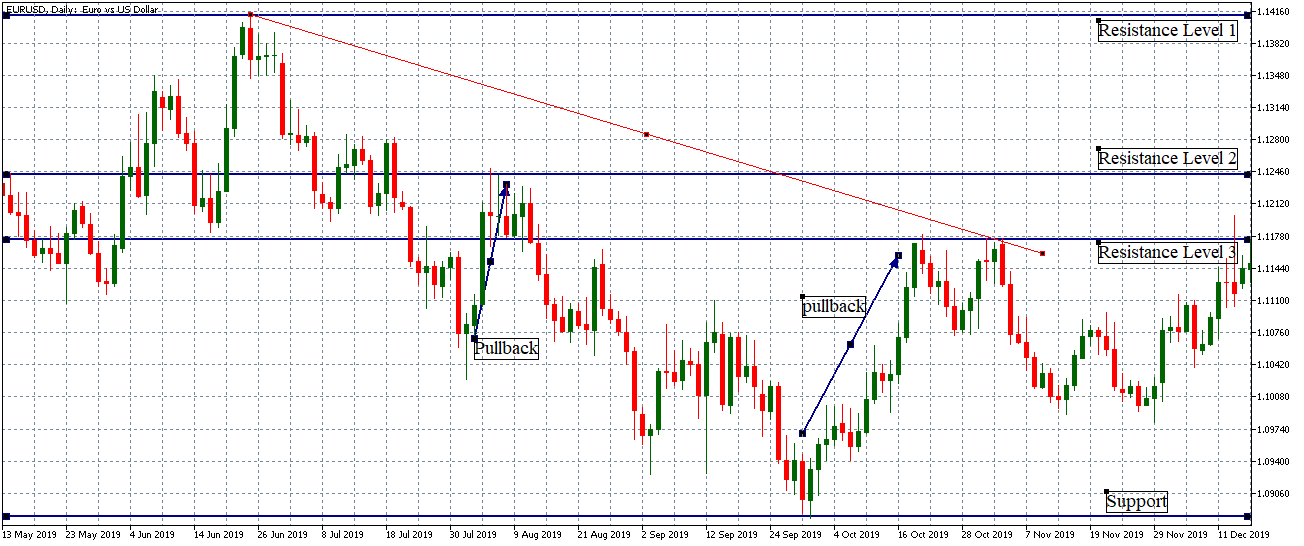
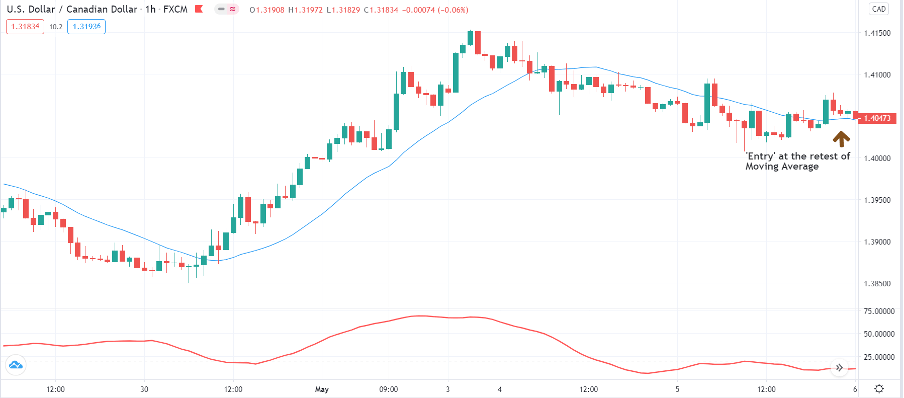
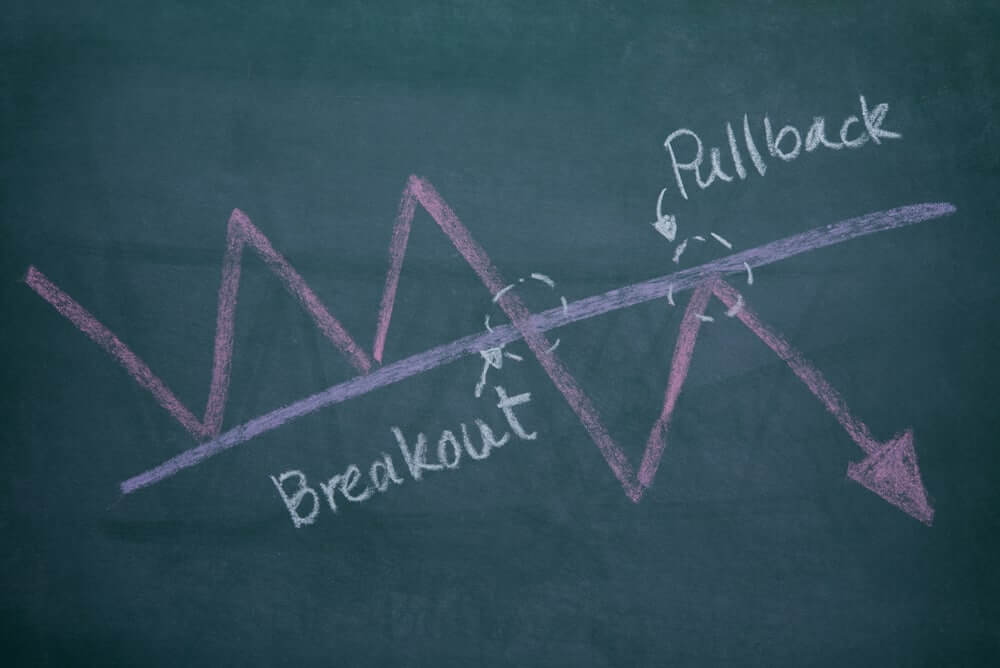
A Pullback is a pause, retracement, or consolidation of a price from the most recent peak during an ongoing trend. The pullback is widely seen as a trading opportunity after the underlying asset experienced a large upside or downside move. For example – Any forex pair is in a strong uptrend, and some healthy news came, and price action dropped back to the most recent support area that indicates the professional traders are booking the profits.

Pullbacks happen all the time, and if you learn how to trade them successfully, it can be a great skill as a trader. Trading the pullback is the easiest way to trade the market, sometimes you will recognize the high probability pullback trades and sometimes extreme volatile pullbacks, and you can enhance your repertoire and find many higher probability trades. If you are new in the market, then pullback trading is a fantastic and easy way to find superior risk-to-reward ratio trades. In this article, we will explore five trading strategies that provide excellent pullback trades.

Pullback Trading Strategies

Two-Legged Pullback To The MA 

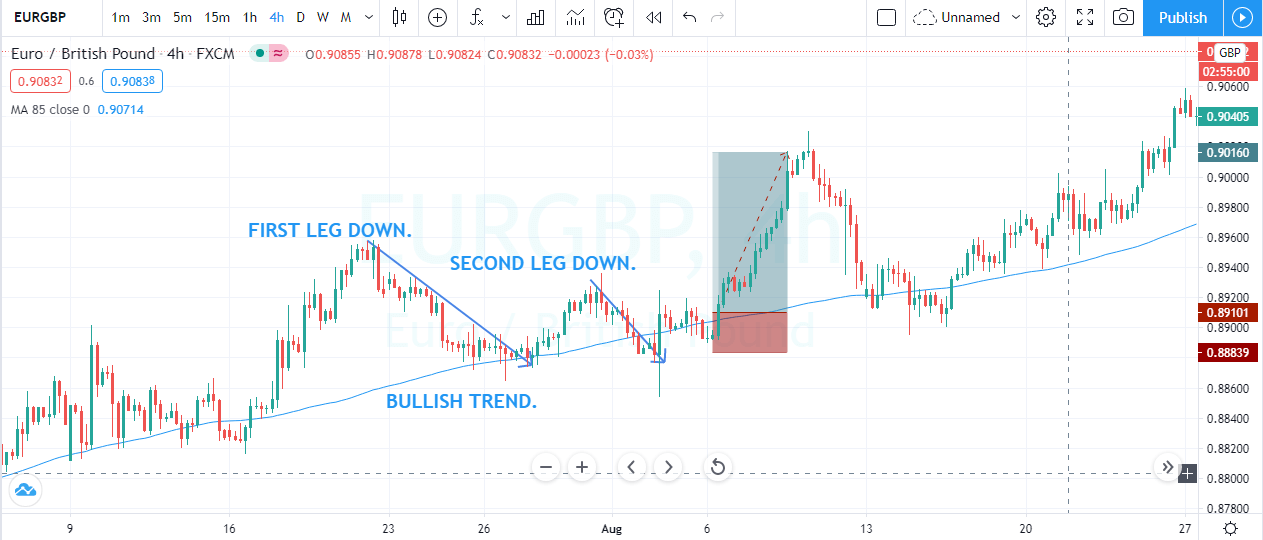
Al Brooks popularized the concept of two legs pullback in his price action books. He explained most of the time, price action print two legs to reach the moving average. We backtested his strategy and found out that his techniques work very well in the trending market, but sometimes in the strong trending market, you will only witness one leg.

This is because most market operators are in a hurry to move the market; this may be because of any fundamental news. To filter out all the low probability trades, it is advisable to find a trending market and then wait for the price action to print the two legs towards the moving average, and when all the moves complete, take the buy entry.

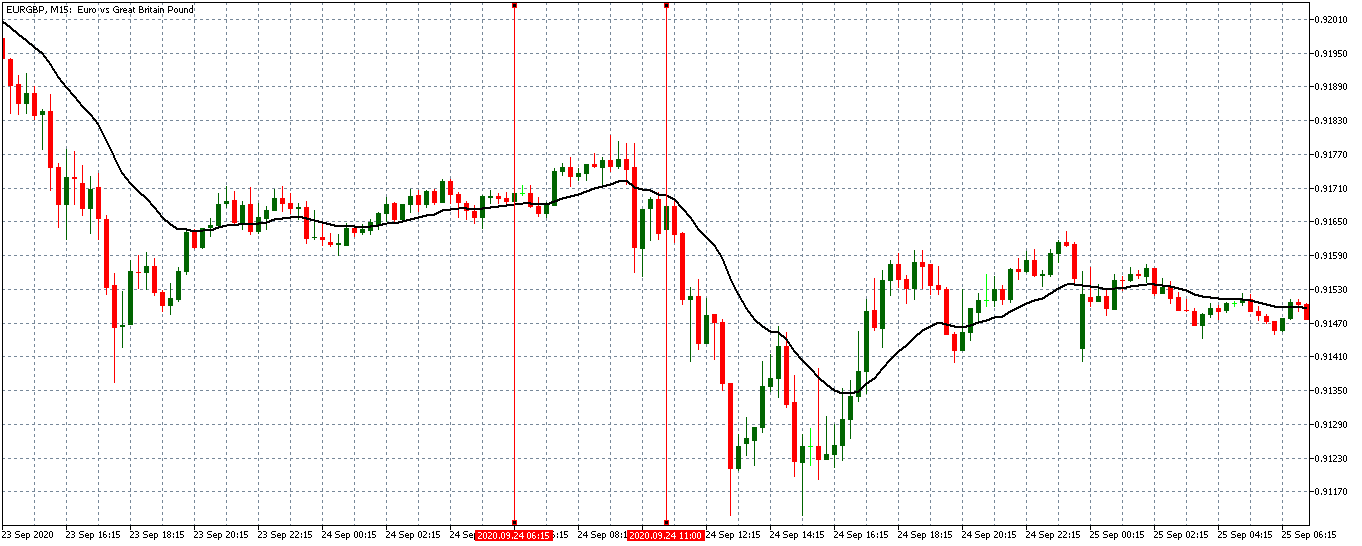
The image below represents the buying trade in the EURGBP forex pair. The moving average indicates the buying trend in the currency. Price action pulled back to the moving average, prices responded from the moving average and goes a bit higher and end up printing the second leg. The second leg goes down to the moving average, but the strong buyers smack back up and close above the moving average. Furthermore, the price slows down a bit, and we took buying entry with the stops below the entry, and for taking profit, we choose the brand new higher high.

Candlestick Pattern + MA

This method will use the bullish engulfing candlestick pattern with a moving average to successfully trade the market.

Here we need two ingredients.

  1. Price action pullback to the moving average.
  2. The market forms a bullish engulfing pattern.

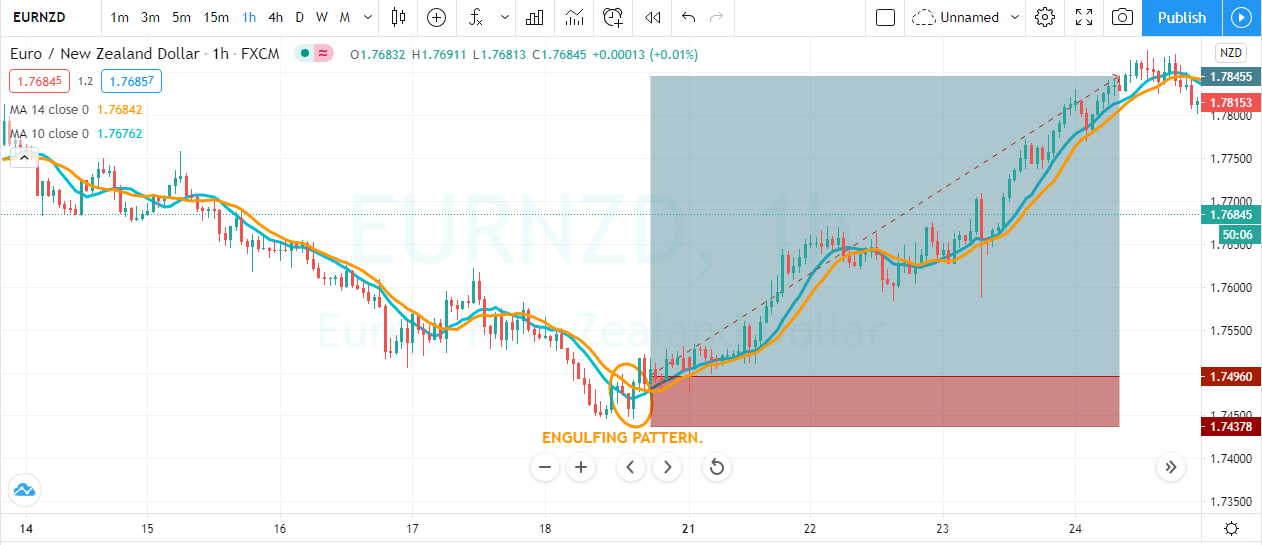
First of all, look for the strong trending market and wait for price action to approach the moving average. At this stage, if the price action prints the engulfing pattern,  it’s the right time for you to go for a buy entry. Otherwise, no entries are allowed for you. An  Engulfing Pattern indicates the sellers try to print the brand new lower low, but because of dynamic support of moving average prices pulled back and buyers end up eating all the sellers. As a result, we witnessed the Bullish Engulfing pattern.

The image below represents the buying trade in the EURNZD forex pair. As you can see, at the end of the downtrend, price action goes above the moving average, and we witnessed the engulfing pattern. The trading pattern closed above the moving average, which was a confirmation of buyers came back to the show and were expecting the brand new higher high.

Trendlines + Channel Trading

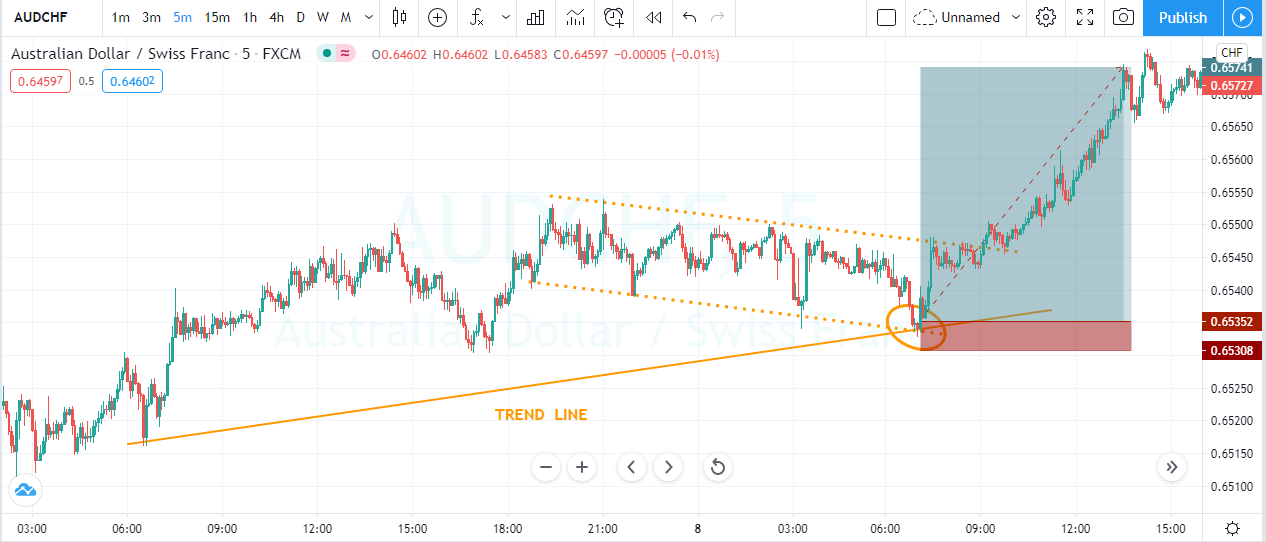
This one is the simple trading approach, which is not much popular, but it often generates wonderful trading results. First of all, you must draw the trend line to the ongoing trend, and when the price action pulls back enough, then draw the price channel to identify the oversold and overbought area. When price action approaches the trend line as well as the lower line of the price channel, it is an indication to go long.

The image below represents the buying entry in the AUDCHF forex pair. The trend line was the indication that the buyers are leading the show. During the pullback phase, when enough sellers approach the trend line and the lower channel line, it gave the strong buying candle. The reason we got the strong candle is because for the support and resistance trader, the zone was a dynamic support area to go long.

RSI + Stochastic Indicator

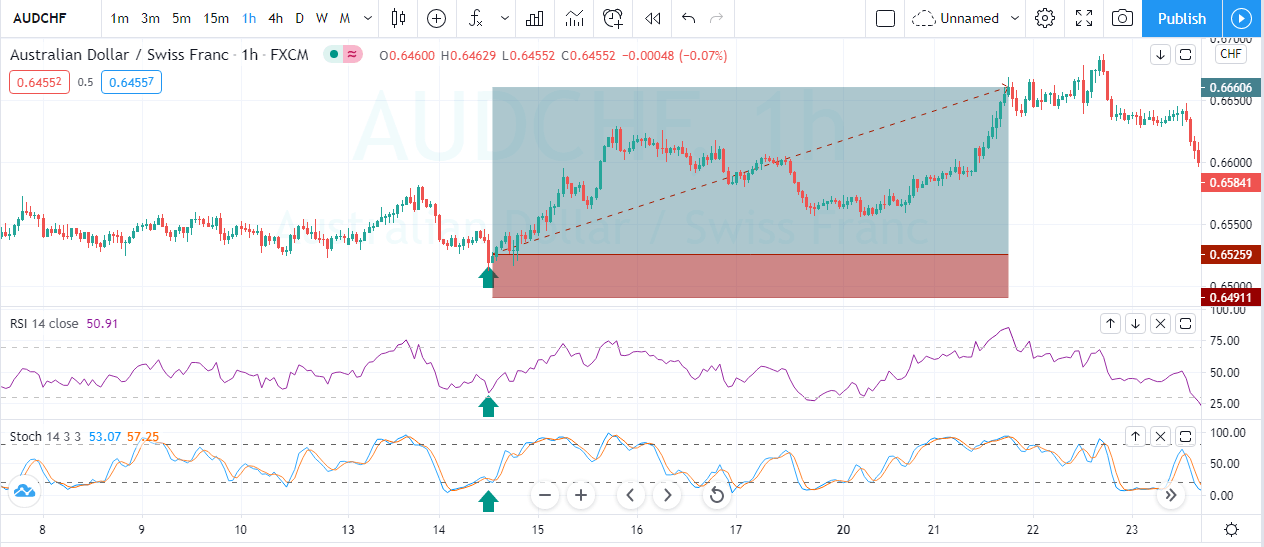
In this approach, we are using the two oscillators to trade the pullbacks. Stochastic and RSI both are oscillators, and they both oscillate between the significant levels. In an uptrend, wait for the price action to pull back. When the stochastic and RSI gave the oversold signal, it is a perfect time to go for a brand new higher high.

The image below indicates the buying trade in the AUDCHF forex pair. The pair was overall in an uptrend, and during the pullback, both of the indicators were showing the oversold signals, and the reversal at the oversold area was a great sign to go long. When both oscillators indicate the same sign, there is no point in going for more significant stops. When both oscillators gave the reversal signal at the significant resistance level, that’s a perfect time to close your trade.

Conclusion

All the pullback strategies share the same goal, which is to time the market. The better you master the skill of timing before the take-off, the more profits you will make. If you are a newbie trader, then master these strategies first on the demo and then apply to the live market because trying any of these strategies in the live market is dangerous without having any experience.

So never try anything on the live account. Instead, practice them on demo first and then make a profit on a live account. When you master these strategies, then you can very easily design a pullback strategy for yourself. Whichever strategy fits nicely into your trading approach, master it.

Categories
Forex Basics

How to Successfully Trade Forex While Working a Full-Time Job

When you consider becoming a forex trader, do you find yourself thinking of a list of reasons why you just can’t realistically do it?

We could probably debunk a lot of those, but today, we will talk about time. As far as excuses NOT to trade go, the lack of time is one of the top reasons why many people never even try. Many of us are already juggling full-time jobs while struggling to keep up with our personal lives, run errands, clean our houses, raise children, and the list goes on. How could you possibly add trading into the mix when there’s so much going on already? 

Believe it or not, it’s possible to take up trading in your free time, even if you do work full-time. This might mean taking on more responsibility, but isn’t it worth it if you’re getting paid? Allow us to provide some tips that can help you with time-management so that you don’t have to miss out on all that trading has to offer: 

Study Charts in Your Free Time

A lot of people assume that traders sit around looking at charts all day long, therefore, they don’t think they have the time to study charts as they should. In reality, it’s possible to do analysis around your job’s schedule. This means nighttime analysis if you work during the day and vise versa. Research and planning can also be done in one’s spare time, including weekends and non-market hours. 

Don’t forget to do the following when you run your analysis:

  • Keep your specific strategy in mind when studying the charts. Stop for the day if you don’t see a set-up that supports your strategy.
  • Try not to perform analysis if you’re stressed out or emotional. If you often feel this way after work, try to do as much as you can on the weekends when you aren’t as burned out or get some of it done before you head to work for the day. 
  • Set a time limit for analysis and stick to it.

Avoid Trading if Necessary

We mentioned earlier that you shouldn’t analyze charts when you’re stressed out or emotional, but you’ll also want to take it a step farther and avoid trading altogether during these times. If you don’t have a clear head, you’re more likely to make mistakes, such as overlooking data, entering trades without proper evidence that you should, putting yourself down if you lose money, and so on. If you simply avoid emotional trading altogether, you’ll be less likely to make mistakes that are influenced by those strong emotions. Likewise, you aren’t doing yourself any favors by forcing trades when there isn’t any evidence to do so. Both of these issues will likely cause you to lose money when you could have kept your account balance the same by knowing to do nothing. 

Focus 

You want to be sure that you can focus solely on trading when you decide to do it, so try to plan it around your schedule the best way you can and avoid distracting situations. If you can, try trading in your car while on break at work or take your laptop into another room if you have household distractions to deal with. Silence your phone and avoid background noises as well if possible. It might be difficult to find the time for distraction-free trading at first, but there are usually ways to make this possible if you’re creative enough, even if you have to tweak your daily schedule. It also helps to make yourself available during specific times, like when a certain currency pair you’d like to trade is most active. Most movements for currency pairs occur during two different timeframes:

  • From 8 a.m. to 11:00 a.m. EST
  • From 1:00 a.m. to 8:00 a.m. EST

This provides separate opportunities to trade when the market is more active, so you’ll want to take advantage of these two options. You could trade before going to work by waking up earlier, for example. 

Use the Right Strategies 

Those that are juggling trading with working a full-time job can take advantage of certain strategies that involve holding trades for shorter periods of time, like scalping or day trading. Scalping provides an advantage because traders often open and close trades quickly in order to profit from small price movements, meaning that you could accomplish some trading activity during a short break. Day trading is another potential solution where traders only open trades for a few hours at a time and close them out by the end of that trading day. You could open a few positions, check on them during your break, and close them if necessary. You’ll basically be making money in the background while you work your regular job if you can get the hang of multitasking. 

Remember that Consistency is Key

If you can develop a solid trading plan and follow it consistently, you’ll be more likely to bring home consistent profits. This means you need to set a schedule and stick to it, so it isn’t a good idea to switch strategies. Instead, traders should follow the same rules and guidelines, even if they do take a loss, and stick with their trading plan through thick and thin. This can also help you get into a good trading routine that will keep you going if you ever quit your job to become a full-time trader.

Do You Want to Become a Full-time Trader?

If you’re dreaming of quitting your desk job, know that you aren’t alone. However, there are a few things to consider first, so don’t march out without thinking things through. Here’s what you need to know:

  • Full-time trading won’t be as time-consuming once you’ve developed your strategy and gained enough practice, as many trading decisions will come to you without much thought. You’ll have a much easier time analyzing charts and information as well, which cuts back on time.
  • Think before you quit your job and remember that profits aren’t guaranteed in trading, while you know you’ll be bringing home a paycheck from your regular job. You need to be making consistent profits before you make the decision to let everything ride on trading profits. 
  • If you quit your job at the wrong time, you’re more likely to make emotional trading mistakes because of the financial burden that will be on your shoulders. This is why it’s a good idea to ensure that you’re earning enough to support yourself and to have some backup cash in the bank to ease some of that post-job stress.
  • Consider copy trading or using a trading robot if you’re still feeling pressed for time. Both can trade for you automatically, but you’ll want to be sure to choose a reliable option and keep a close eye on the results. 
Categories
Forex Fundamental Analysis

US 10-Year TIPS Auction – Everything About This Macro Economic Indicator

Introduction

For any long-term investment, taking the future rate of inflation into account is paramount. The reason for this is because inflation eats into the expected returns. Thus, if you could find a way to insulate your investments from this, you most definitely will. The goal of any inflation-protected investment is to ensure that you are cushioned from the reduction in the purchasing power.

Understanding the US 10-Year TIPS Auction

TIPS refers to Treasury Inflation-Protected Securities. As the name suggests, these are US government-issued securities meant to provide investors with protection against the effects of inflation.

US 10-Year TIPS are Inflation-Protected treasury bonds issued by the US Department of the Treasury. The principal on these bonds is meant to finance spending activities by the US government and is redeemable after ten years.

TIPS auction refers to the sale of the inflation-protected treasury bonds by the US Department of Treasury. Originally, the 10-Year US TIPS are auctioned twice a year – in January and July. The reopening auctions are done in March, May, September, and November. Thus, these auctions are scheduled every two months.

Discount rate: The percentage difference between the price at which the TIPS is bought at auction and the one at which it can be redeemed.

Maturity: For the US Treasury Inflation-Protected Securities, the maturity period refers to the maximum time an investor can hold the bonds before redemption. These bonds are usually issued with a maturity period of 5, 10, and 30 years from the auction date. Usually, the minimum duration of ownership is 45 days. Therefore, one can choose to sell their TIPS before maturity or hold them until maturity.

How to Buy TIPS

TIPS can only be bought in electronic form. The minimum amount of TIPS one can purchase is $100 and increments of $100 after that. The maximum amount that a bidder can purchase in a single auction is $5 million. During the auction, the interest rate on the TIPS is determined by the competitive buyers.

The competitive bidders usually specify the yield that they are willing to accept. The competitive bidders for TIPS are large buyers such as brokerage firms, investment firms, and banks. The competitive bidders set the yield for the TIPS, which requires one to have an in-depth knowledge of the money markets. Competitive bidders are required to submit the number of TIPS they intend to buy and the return on investment they seek. This return is the discount rate.

Not all competitive bids are accepted at the auction. When the competitive bid is equal to the high yield, less than the full amount wanted by an investor might be accepted. The bid might be entirely rejected if it is higher than the yield accepted during the auction. The non-competitive bidders are regarded as “takers” of the yield set by the winning competitive bidders.

Once the bidding process is over, the treasury distributes the issuance. Let’s say, for example, that in an auction, the US Department of Treasury is auctioning $20 billion worth of TIPS. If the non-competitive bids are worth $5 billion, they are all accepted. The remaining $15 billion is then distributed among the competitive bidders. The lower competitive bids are filled first until the $15 billion is exhausted.

Using the US 10-Year TIPS Auction for Analysis

Since the TIPS’s primary goal is to safeguard against the effects of inflation, the interest rate paid on them can be used as an indicator of possible inflation rates in the future.

Before we explain how the US 10-year TIPS auctions can be used for analysis, here are two things you need to keep in mind.

  • TIPS’s interest rate is paid semi-annually at a fixed rate, which is usually based on the adjusted principal.
  • Whenever inflation rises, the interest rate rises, and when there is deflation, the interest rate drops.

Once TIPS have been auctioned and traded in the secondary market, when inflation in the economy rises, the principal on TIPS increases as well. Thus, the interest rate payable on these TIPS increases as well. During the TIPS’ subsequent issues, the interest rate payable will reflect the prevailing rate of inflation. Furthermore, the discount rate set at the auctions can be used to gauge the level of confidence that investors have in the US economy. The lower discount rate shows that the current investment atmosphere in the economy is risky; hence, investors are willing to take lower returns than risk losing their principal in other markets.

On the other hand, when investors can get better returns in other markets within the economy, they would demand a higher discount rate. Furthermore, when there is deflation in the economy, the principal on the TIPS falls along with the interest rates payable.

Impact on Currency

Theoretically, the auction of the US 10-year TIPS can impact the currency in two ways. By showing the confidence level in the economy and by showing the prevailing rates of inflation.

When the interest rate payable on the TIPS increases, it shows that the levels are increasing. This increase shows that the economy is growing, which is good for the currency. Furthermore, the higher discount rate at auctions implies that investors can get better rates elsewhere in the economy.

Conversely, the currency will depreciate relative to others when TIPS’s interest rate decreases, which implies that there is deflation in the economy. This instance can also play out if discount rates at the auction are at historical lows. It shows that the economy is performing poorly and that investors may not get better returns elsewhere.

Sources of Data

US Department of Treasury is responsible for the auction of the US 10-year TIPS. The data of the latest TIPS auction can be accessed from Treasury Direct. Treasury Direct also publishes data on the upcoming TIPS auction, which can be accessed here.

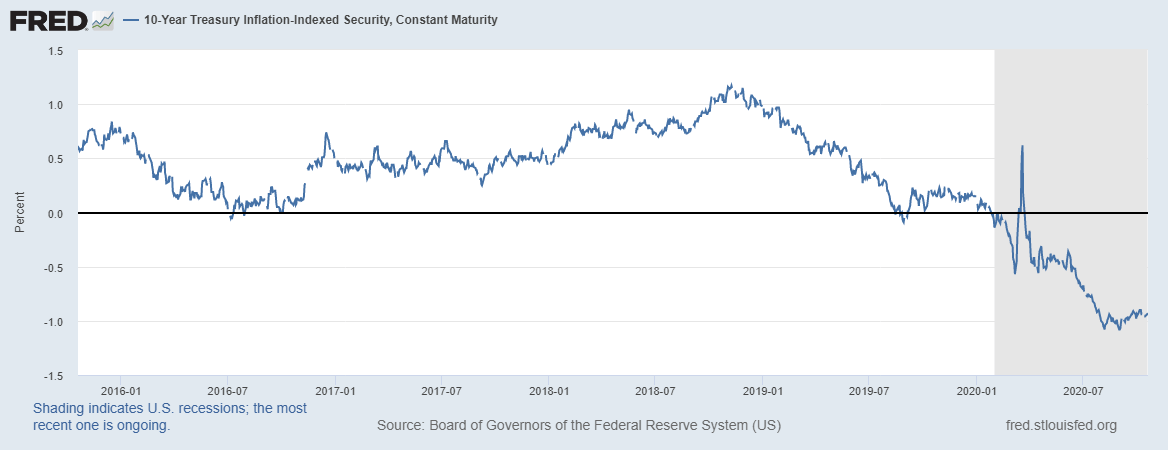
St. Louis FRED publishes an in-depth series of the US 10-year TIPS.

Source: St. Louis FRED

How US 10-Year TIPS Auction Affects the Forex Price Charts

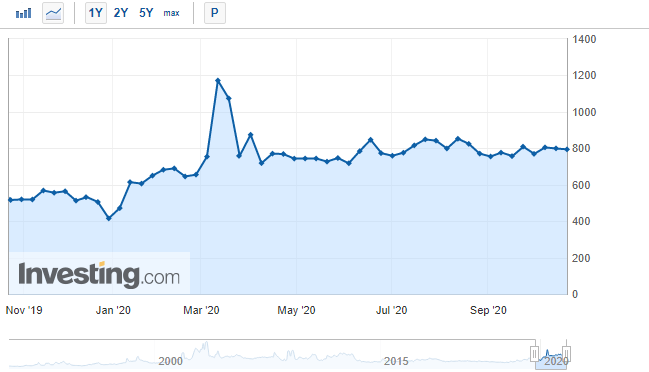
The most recent auction of the US 10-year TIPS was on September 17, 2020, at 1.00 PM EST. The data on the auction can be accessed at Investing.com. The US 10-Year TIPS auction is expected to have a low impact on the USD, as shown by the screengrab below.

During the recent auction, the rate for the 10-year TIPS was -0.996% compared to -0.930% on the July auction.

Let’s see what impact this release had on the USD.

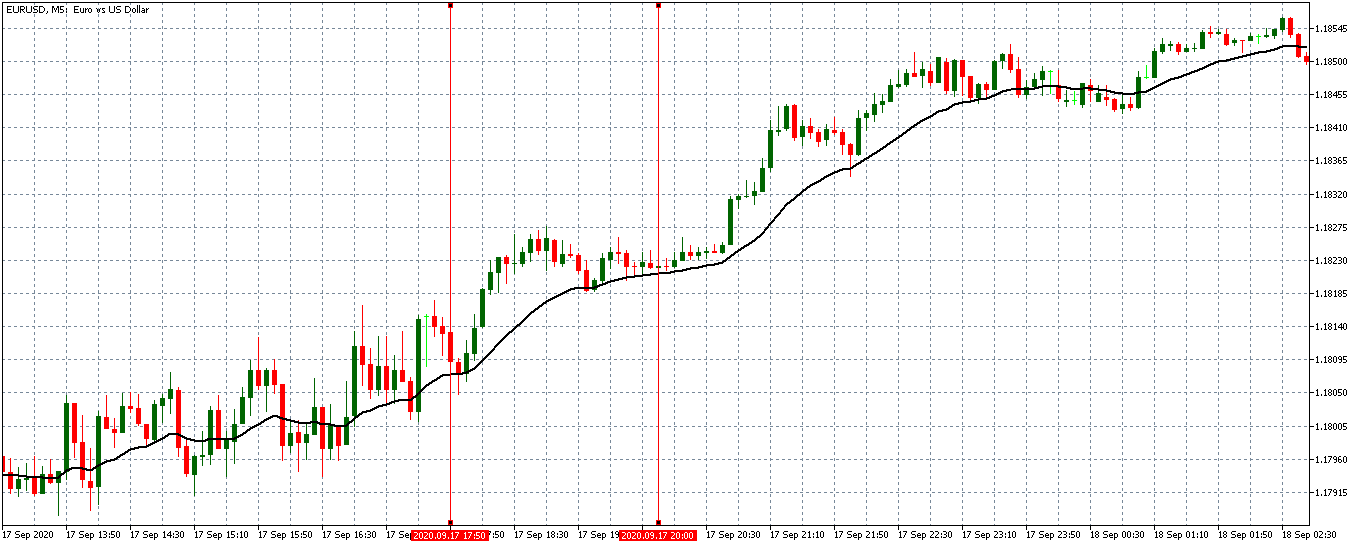
EUR/USD: Before US 10-Year TIPS Auction on September 17, 2020, 
Just Before 1.00 PM EST  

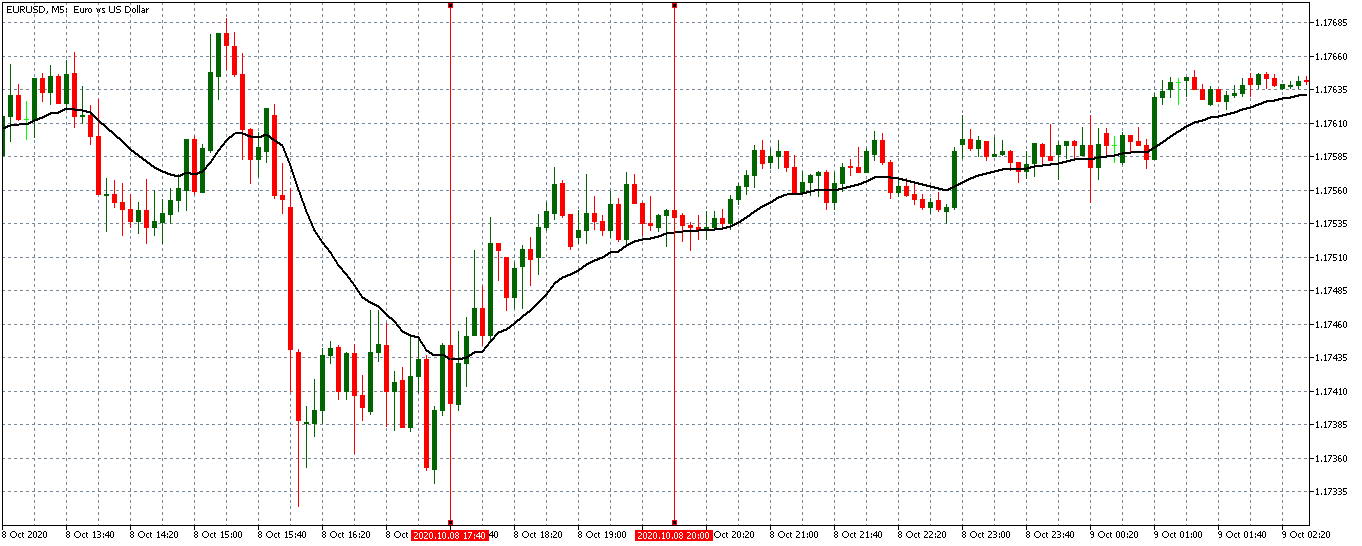
Before the auction, the EUR/USD pair went from trading in a steady uptrend to a subdued uptrend. The 20-period MA can be seen going from a steep rise to almost flattening as the candles formed just above it.

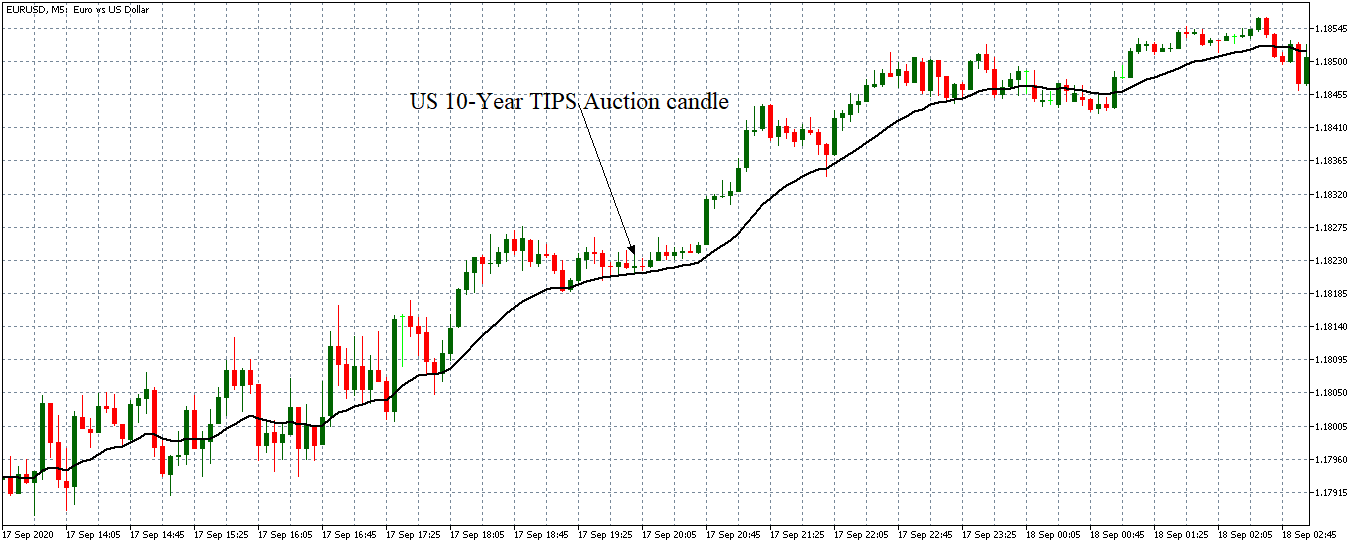
EUR/USD: After US 10-Year TIPS Auction on September 17, 2020, at 1.00 PM EST

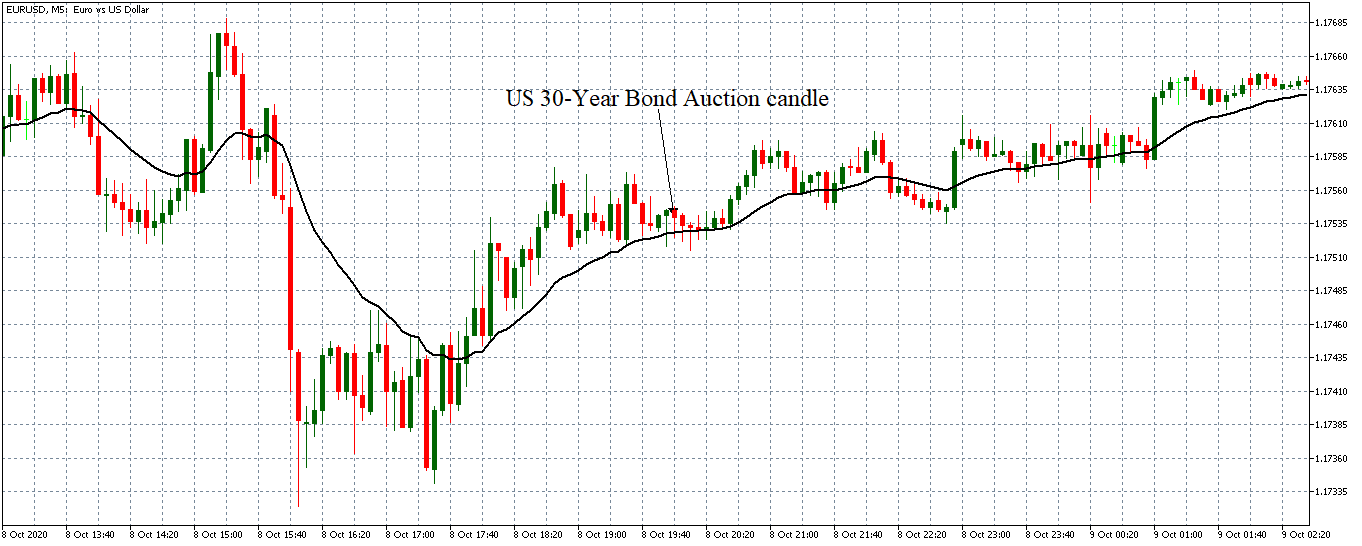
Immediately after the release of the auction data, the pair formed a 5-minute “Doji” candle. Subsequently, the EUR/USD pair continued to trade in the subdued uptrend with candles forming just above an almost flattened 20-period MA.

Bottom Line

From these analyses, we can establish that the US 10-year tips auction has no significant impact on the forex price charts. The reason for this could be because most forex traders do not keep an eye on bond auctions but instead focus on more mainstream indicators like the CPI and GDP.

Categories
Forex Course

177. Simple Guide To Find the ‘Commitment of Traders’ Report

Introduction

The previous lesson covered what the Commitment of Traders report is. In this lesson, we will focus on how and where you can retrieve the COT report. The COT report is prepared and published every Friday at 3.30 PM ET by the US Commodity Futures Trading Commission. However, you can access the latest report and those from previous issues at the CFTC website.

The CFTC publishes beforehand the release schedule for the COT report. This schedule can be accessed here. The commission also keeps an archive of all past reports. The historical Commitment of Traders reports can be accessed here.

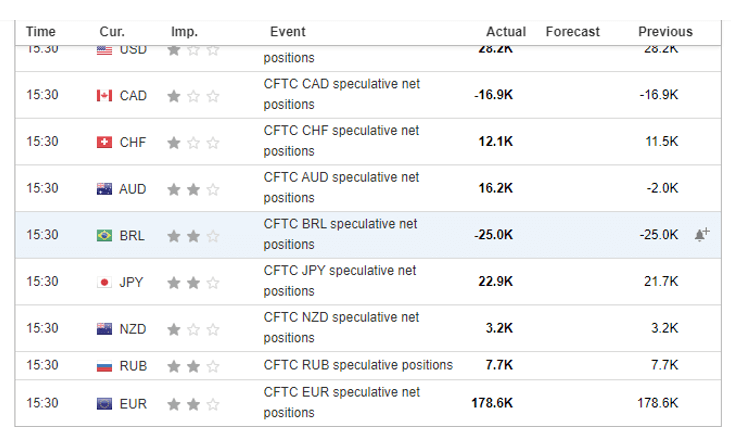
For forex traders, reading through the COT report might seem cumbersome. If you are interested in trading the forex market using the COT report, some economic calendars make available relevant snippets of select speculative net positions from the report. Below is a screenshot from Investing.com showing the latest release of the COT report on September 18, 2020, at 3.30 PM ET.

If you are interested in an in-depth review of the latest Commitment of Traders report, below is a step by step procedure of how to access it.

Step 1: to view the latest COT report, go to the CFTC website.

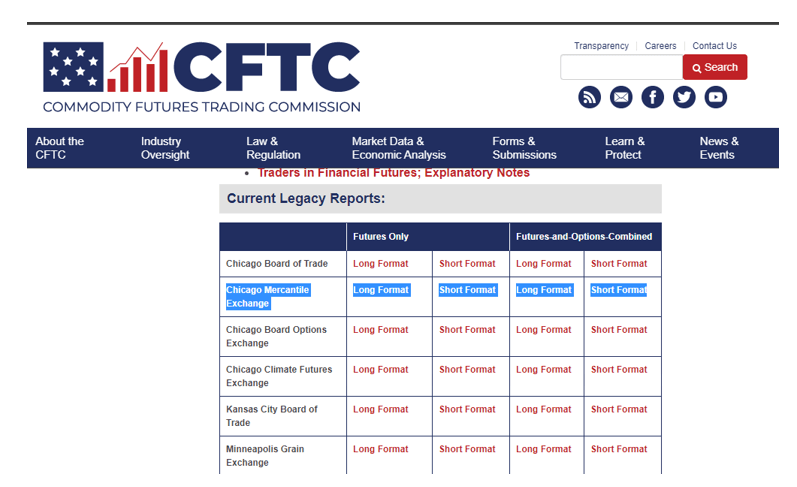
Step 2: After accessing the CFTC website, the next step is to find the right report for the forex market. The CFTC published multiple Commitment of Traders reports. These reports include markets other than the Chicago Mercantile Exchange that also contain other non-futures derivative contracts.

The COT report that has data on the forex market is the ‘Current Legacy Reports.’ Under the ‘Current Legacy Reports,’ select the formats belonging to the Chicago Mercantile Exchange.  Below is a screengrab of the from the CFTC website.

To access the COT report, select ‘Short Format’ under the ‘Futures Only’ tab.

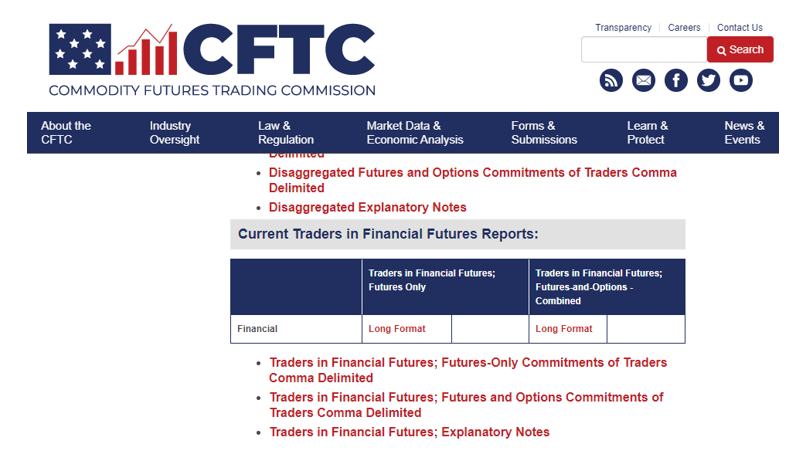
Alternatively, if you want a more comprehensive report on the future positioning of traders in the financial sector, you should look at the ‘Current Traders in Financial Futures Report.’ Below is a screengrab from the CFTC website showing this section.

Step 3: After opening the ‘ Short Format’ of Chicago Mercantile Exchange section of the COT, the next step is to identify which currency you are interested in.

Although it looks disorganized, searching through the report is relatively easy. Use the ‘search function’ of your browser to bring up the ‘search box.’ Type the currency you want to analyze. In this case, we searched for the CAD. The search results will appear, as shown in the screengrab below.

I hope you found this guide informative. Please let us know if you have any questions in the comments below. Don’t forget to take the below quiz before you go. Cheers!

[wp_quiz id=”89672″]
Categories
Forex Basics

Is Forex Trading Honestly Really Worth Your Time and Effort?

It is a well-known fact that forex trading brings together a truly vast range of diverse personalities all over the world, and being such an incredibly big and booming market, it easily arouses interest in individuals regardless of their background and past academic and professional achievements. Naturally, we all desire to gather as many pieces of information right from the start, so we browse the internet in search of evidence that would confirm our compatibility with the market demands and benefits.

Not only do we want to see the fruits of our labor as fast as possible but we also realistically demand to have a clear vision of what responsibilities and tasks we can or cannot expect to take on or carry out ourselves. This thirst for concrete and relevant facts can now be quenched because the entire mental turmoil boils down to the question of whether forex trading is really worth it. For these reasons, let’s objectively analyze the key aspects that determine our motivation, satisfaction, and persistence in this market. 

Education

Forex is, fortunately, or unfortunately, an entire field that is defined by specific terminology and rules that all need to be studied and understood. On a positive note, having a subject so well defined and studied as extensively offers more and more sources of information than ever before, including articles, podcasts, social media posts, videos, and trading courses. The ease of access and the myriad of places and vehicles to get educated, however, do not always support the learning process because the information offered does not always reflect original thought and what we can expect in real trading situations.

What is more, while cramming a whole set of new vocabulary and concepts they have never heard before, traders with experience in some other markets (e.g. stocks) may increasingly face difficulty due to seemingly identical tools and techniques. And, while there is so much to learn, potential or beginner traders also need to bear in mind that this is just the theoretical side of what needs to be done and that all theory ought to be properly exercised and tested to reach excellence just like in any other learning program. Nevertheless, after completing this stage, traders can rest assured that they will likely never need to go back to studying the basics, provided that they invested them conscientiously and whole-heartedly.

The Costs 

People are, understandably, drawn to trading currencies because they are keen on improving their finances. Nonetheless, forex newbies often discover later on how they already need to have a specific sum of money prepared in advance to be able to enter the market. Even though investing occurs in one of the later stages in a beginner’s trading development, we do not want to have any relevant items of information escape our focus, so we must learn about brokerage, commission, spread, and all other more obscure fees. An important part of this topic includes the topics of risk and leverage that, if not properly handled, may affect your trades and ultimately your account. If traders do not learn how to properly manage their trades and restrain their shadier personality traits (e.g. greediness, fear, impatience, laziness, etc.), their accounts may suffer consistent or intermittent blows that may never be compensated for by any wins no matter how big they are.

Time Committment

Time is an invaluable asset and the reason why many experts opted to put effort into learning how to trade currencies in the first place. Now, even though traders at the beginning of their careers may have already heard professionals talking about how their routines changed after learning about forex, they should still not forget that it is the decisions we make each step that have a say in how our life is going to look like in the future. First of all, in order to become knowledgeable about forex, you will need at least six months to study theory and start a demo account where you can apply what you learned.

Under the condition that you spent the learning period actively and without being superficial, you can become a professional trader (i.e. someone trading real money) even after a year, after which you will be able to tweak and improve your system if and when needed. It is also important to include psychological growth in this section because trading tends to bring out our worst fears and limitations in people, and overcoming emotional hurdles often takes more than 12 months. Finally, you may also need to consider a bigger time frame if you wish to make some significant lifestyle changes, as many traders become dependent on trading all day, missing out on the opportunity to experience a different type of routine.

Prospective Returns

You will double your investment in the blink of an eye, they say on various blogs, but they fail to mention that the market conditions and simple math will not let you go beyond a specific percentage simply because the big banks would lose their profit in that case. Some of the most prominent figures in this market make 20% per year, and while this can turn out to be quite a large sum, you need to calculate your own return based on your initial investment. Therefore, if you deposit 500 USD and manage to get a 13% return, you will get a realistic image of your yearly earnings from trading currencies. Also, if you happen to struggle with your algorithm and start taking severe losses, understand that the world forex does not offer any trick by which you can magically let you start over with a clean slate. Despite these difficult aspects of trading currencies, you can always present your records to a company that would pay you to trade on their behalf and increase your returns in that manner.

Routine

We all have a different starting point in terms of age, available capital to invest, social obligations, and work/school schedule, among others. Any trader wishing to become successful at forex needs to set aside a designated period in a day or a week that he/she would dedicate to learning and testing. Some traders may choose to do currency trading on the side, keeping their day jobs or prioritizing other trading activities, while others may want to focus on forex only. Therefore, both before and after one feels ready to start investing real money, it is absolutely crucial that each step be free of the stress and the turmoil of the outside world. A proper routine also entails methods to calm oneself down and direct one’s attention to trading alone.

Another vital piece of advice for all traders, be they beginner- or professional level, concerns developing the habit of meticulously recording each trade. Not only does proper data management help traders track their growth, improve their trading systems, and perfect their strategies but it also leaves room for traders to enter into a trading agreement with a desirable company, fund, or institution as discussed above. 

Potential or beginner traders have much to ponder on before changing their lives in a way that would impact their finances, time, and schedule. Some people may be quite reluctant to apply anything new in their life and others cannot bear the idea of having to sit down to study or take records each time they enter or exit trades. The key ingredient in all this decision-making is the individual vision of the future and balanced expectations of oneself and forex. Forex can offer much, but at the same time, it is you and you alone who need to make things happen. It is important to be honest with oneself from the very start as well as be prepared for a steep learning curve before being able to reap the benefits of this market. 

Categories
Forex Assets

Analysing The Costs Involved While Trading The AUD/MXN Exotic Pair

Introduction

In this exotic forex pair, the AUD represents the Australian dollar, while the MXN – the Mexican Peso. Exotic currency pairs have higher volatility in the forex market when compared to the other major pairs. Here, AUD is the base currency, where MXN is the quote currency. It means that the AUD/MXN exchange rate shows the amount that 1 AUD can buy in terms of MXN. Let’s say that the exchange rate for the AUD/MXN is 15.0346; it means that 1 AUD can be exchanged for 15.0346 MXN.

AUD/HUF Specification

Spread

When you go long in the forex market, you buy the currency pair from your broker at a higher price than when you sell it. The spread in forex is the difference between these two. The spread for the AUD/MXN pair is – ECN: 2 pips | STP: 7 pips

Fees

Some forex brokers charge a commission for every trade on ECN type accounts, depending on the value of the trade. STP accounts do not incur any trading fees.

Slippage

Sometimes when you place a market order, your broker will fill it in with a different price. This is slippage in forex trading; it is caused by increased volatility and the speed at which your broker executes the trade.

Trading Range in the AUD/MXN Pair

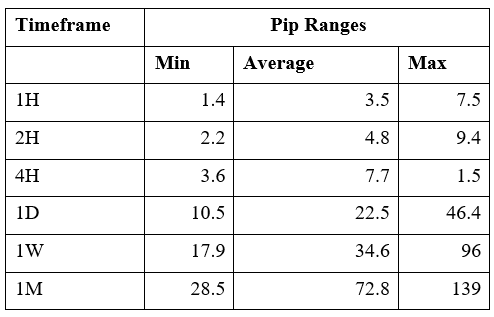
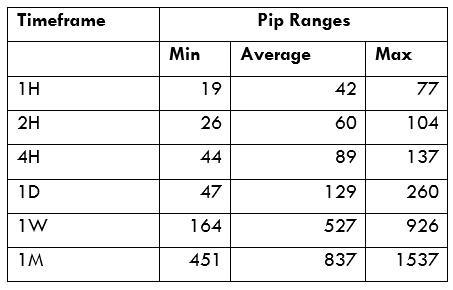
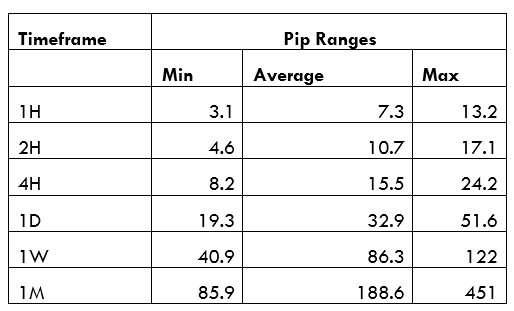
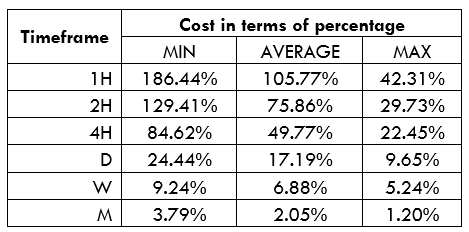
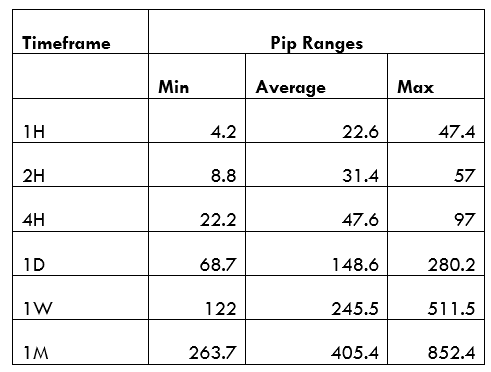
The trading range analyzes the spread between the highest and the lowest price movements across multiple timeframes. The trading range analysis ranges from the minimum, average, to the maximum volatility across all timeframes. It is used to assess the potential profitability of a currency pair across all timeframes.

The Procedure to assess Pip Ranges

  1. Add the ATR indicator to your chart
  2. Set the period to 1
  3. Add a 200-period SMA to this indicator
  4. Shrink the chart so you can determine a larger period
  5. Select your desired timeframe
  6. Measure the floor level and set this value as the min
  7. Measure the level of the 200-period SMA and set this as the average
  8. Measure the peak levels and set this as Max.

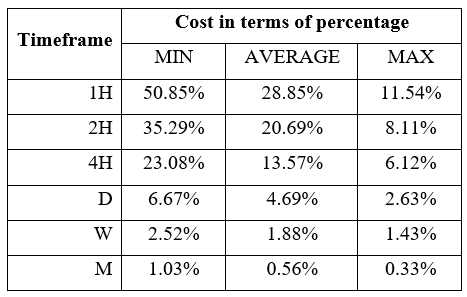
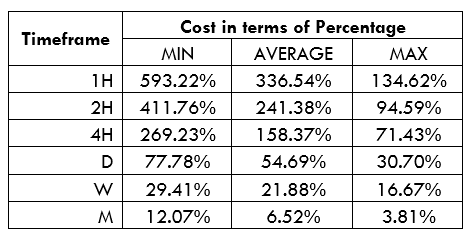
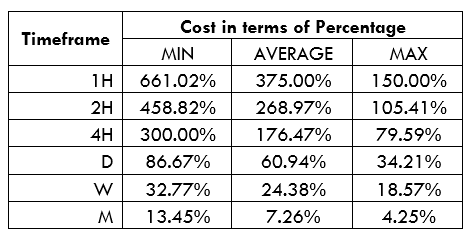
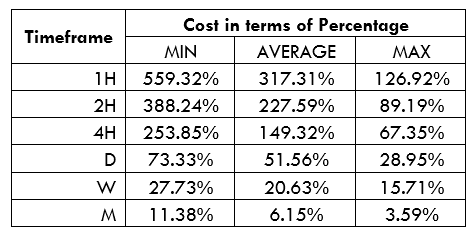
AUD/MXN Cost as a Percentage of the Trading Range

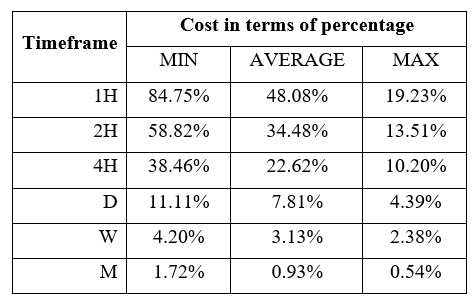
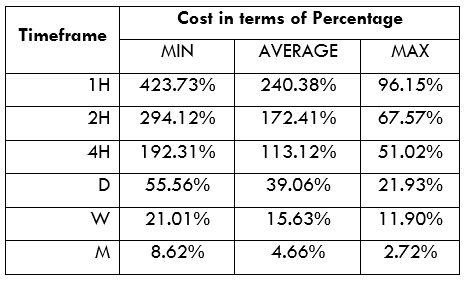
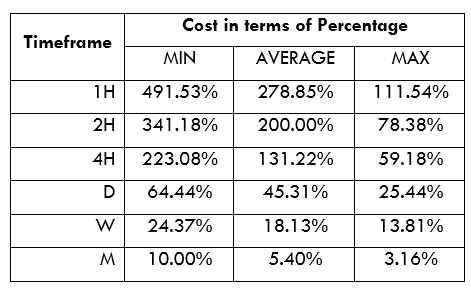
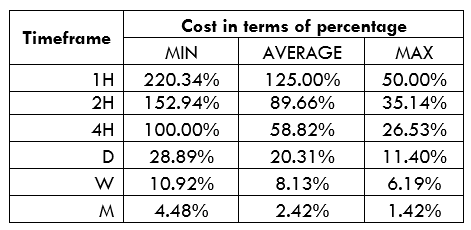
Further analysis of profitability can be aided by analyzing the percentage of the total cost to the volatility. These costs are put in terms of percentages of the volatility on all timeframes.

ECN Model Account costs

Spread = 2 | Slippage = 2 | Trading fee = 1 | Total cost = 5

STP Model Account

Spread = 7 | Slippage = 2 | Trading fee = 0 | Total cost = 9

The Ideal Timeframe to Trade  AUD/MXN Pair

For the AUD/MXN pair, the ideal trading timeframe appears to be the longer timeframes since trading costs are at their lowest here. We notice that the trading costs for the AUD/MXN pair decrease as the timeframes become longer. Also, note that at longer timeframes, the volatility is higher.

For traders wishing to trade the AUD/MXN pair for the shorter-term, timing their trades with when the volatility increases towards the maximum can help. More so, adopting the use of forex limit orders will lower the trading costs by ensuring there are no slippages.

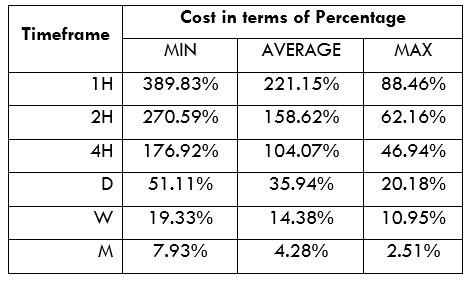
ECN Account Using Limit Model Account

Total cost = Slippage + Spread + Trading fee = 0 + 2 + 1 = 3

Notice how using the forex limit order types reduces the overall trading costs across all timeframes. The maximum trading cost of the AUD/MXN pair, for instance, decreased from 84.75% of the trading range to 50.85%.

Categories
Forex Basics

Is Forex Taking Over Your Life? Here Are the Warning Signs…

We all have a different amount of time to dedicate to trading. Some of us might struggle to find the time because we’re juggling work, children, and other factors, and we might even feel guilty that we don’t spend more time online. Others might have the chance to trade full-time, which isn’t such a bad thing. If you eat, sleep, and breathe trading, you might find that some of these signs sound relatable. 

You Stop Missing Out on Good Opportunities

Sooner or later, we all make bad decisions when we’re trading, with one of the most common regrets being missed trade setups that could have made a lot of money. It’s difficult to watch a trade you hesitated on become profitable, some might even say it’s worse than actually losing because it’s easy to obsess over the money you could have made. Those that spend more time trading look at this issue with a different mindset, as they learn to leap on opportunities, rather than hesitating. Ask yourself if you’re commonly missing out on opportunities, or if you never fail to enter the market when you’re the timing seems right. 

You Look at Probabilities

Experienced traders know that it’s important to think in terms of probabilities when it comes to entering trades. Are you more likely to win or lose? Is the risk worth the reward? These traders also think ahead when planning out their next move and have a game-plan to follow, whether the trade behaves as they expected or vice versa. If the trade moves with you, you’ll know when to trail your stop, yet you’ll have stops in place to cut your losses in case the market moves against you. Being prepared by thinking of different outcomes and planning accordingly are signs that you’re a prepared trader. 

You Don’t Beat Yourself Up

Nobody wants to lose money, yet we all deal with it in different ways. Some traders just roll with the punches, while others obsess over the money they’ve lost. Taking losses too seriously is a sign that you haven’t been trading for that long or that you haven’t quite figured out how to manage the rollercoaster of emotions that trading presents. On the other hand, a trader that can keep it together without stressing when they lose has probably spent a great deal of time trading and simply understands that bad trading days aren’t out of the ordinary.

You’re Better at Spotting Behavior Patterns

Traders are always looking at trends and patterns, as checking the market’s previous patterns helps us make more accurate predictions. We look at the way that price behaved in past events and become better at spotting patterns that will help us make decisions about the future price. Yet you might not realize that this instinct of spotting behavior can carry into your everyday life. Have you noticed that you pay more attention to other people’s behavior patterns? For example, you might adjust a restaurant recommendation that you’d make to a friend because you noticed that they aren’t too fond of Italian food, even though you love it. Or maybe you tell a friend that a party starts at 7 when it really starts at 8 because you’ve learned to expect them to be late for everything. This is one way that forex trading can help make you more observant, both when it comes to looking at the market and everyday life. 

You Don’t Fight Your Instinct

You’ve probably had a gut feeling about something at several different points in your life. Maybe you’ve even heard the phrase “a woman’s intuition is always right”. The thing is, some of us trust that little voice in our head, while others ignore it. When you’re trading, you might get a gut feeling that tells you to enter a trade you’re unsure about. If you’ve been there, think about the outcome of your decision to either ignore or follow along with your instinct. In most cases, experienced traders will tell you that it’s better to trust these gut feelings than it is to fight them. If you’ve been around long enough to know that your trader’s instinct is usually right, you learn not to question that feeling whenever it strikes.

Categories
Forex Risk Management

How to Mitigate Forex Trading Risks and Profit More

Risk, something that people either love or hate, it is something that is there in everything that we do, every single day. When it comes to trading there are of course a lot of risks, the majority of the risks that we put ourselves under are in relation to the money that we have put into our accounts, there are, however, a number of different risks including those to our health and more importantly mental health. There are many different things that you can do when it comes to trading to help mitigate some of the risks, and when you have negated some of the risks you will also open the doors to better profits, so we are now going to be looking at some of the things that you can do to help reduce the risks that you are taking for a hopefully more safe and consistent trading experience.

One of the things that are being pushed out a lot in advertising and by various social media influencers is the leverage that you are able to use. To put things simply, the higher the leverage that you are using, the higher the risk that you are putting onto your account. Think about it, if you have $100, and a leverage of 100:1, this means that you will be trading with $10,000, you will be able to place larger trade sizes up to example 0.10 lots. But if you had leverage of 1000:1 you would be trading with a balance the equivalent of $100,000, allowing you to put on a trader of 1 lot. If the markets move a single pip in the wrong direction. With the 1000:1 account, you will lose $10, with the other $1. So it will take a much smaller movement for the account to blow on the 1000:1 account than it would with the 100:1 account, so keeping the leverage at a sensible level will limit your trade sizes but at the same time help to protect your account from bigger losses.

Stop losses, use them, their functionality is in their name, they help to stop further losses, they are one of the primary tools that you can use to help prevent losses and to protect your account. Stop losses are incredibly easy to implement when placing a trade. You can input the stop loss at the same time, the way it works is simple: you set a price in the market, if the markets fall down to that level, then your trade will be automatically closed. It is a fantastic way to protect your account, especially if you are not able to sit at the computer, it will allow you to walk away knowing that your account is still safe, even with a loss. Your trading strategy should have a risk to reward ratio built into it, this is the loss site of that ratio and ensures that your trades remain within your strategy, it also helps to take awesome of the psychological stress away from the trades, as you have already decided what the maximum loss is and so do not need to stress when deciding whether or not you need to close the trade or not.

Volatile conditions can be amazing for your profits, but also for your losses. Trading during times where there is a lot of volatility can make things a little more risky to your account, this is mainly due to the fact that the markets and the prices will be jumping up and down quite a bit more as well as there being higher spreads from the brokers. Trading during these moments can help you to produce some incredible profits, but there is also the risk, putting on stop losses during these times would be vital, but when there are huge amounts of volatility, the markets could actually pass through those levels for greater losses, so it is often a good idea to simply avoid trading during these conditions in order to remain safe.

Try to limit the amount that you are trading with each trade, if you are only risking 2% of your account with each trade, then you will be able to survive quite a few losses in a row without putting your account in danger. This can be limited through the use of stop losses that we mentioned above as well as limiting the trade size that you are using. Being able to limit the losses with each trade is one of the fundamental parts of a risk management plan. Of course, you will still need to put the proper analysis in motion in order to put on your trades, just because the account is protected from larger losses does not mean that you can simply put on any trade that you want, this will ultimately lead to losses.

Another option that you can use is to use a higher time frame of chart. Doing so will enable you to take slightly longer-term trades and to better view what trends are taking place. The higher p the time frame is on the charts, the longer term that you are looking to trade for, this also means that you will be putting in smaller trades and holding them for longer. When you trade on a lower time frame, you will be looking for quicker profits, so the trade size will be larger to make it more worthwhile, but you will only hold the trade for a short period of time. So a way of limiting your trade size is to trade on the target timeframe, the profits can be just as big, they will just come a little later down the line.

Those are some of the things that you can do to help overcome some of the risks that come with trading, there are of course some other things that you can do too, you should always be looking to help improve your own risk management and to protect your account, how you do it is up to you, but take some of what is written here and you will be on a good path in order to protect your forex trading account.

Categories
Forex Basic Strategies Forex Daily Topic

Trading The Forex Market Like A Pro Using The Williams %R Indicator

Introduction

In the forex market, the Relative Strength Index (RSI) is the most sought after technical indicator for measuring overbought and oversold conditions in the market. However, there are times when RSI can give misleading signals. To overcome some of these limitations of RSI, we use William’s %R (Williams Percentage Range) to help us identify when an asset is oversold or overbought.

Having determined that the asset has moved too much in one direction, we can position ourselves on the other side of the market after suitable confirmation. In today’s article, let’s discuss a strategy based on William’s %R indicator to identify when the market has become overbought or oversold. Let us first get into the specifications of the strategy.

Time Frame

The strategy works well on higher time frames such as ‘Weekly’ and ‘Daily.’ Therefore, the strategy is suitable for swing and long-term traders.

Indicators

We use the following indicators in the strategy:

  • William’s %R
  • Simple Moving Average (standard setting)

Currency Pairs

The strategy applies to all currency pairs listed on the broker’s platform, including major, minor, and exotic pairs. This is one of the distinguishing features of the strategy.

Strategy Concept

The William’s %R indicator usually ranges between 0 to -100, where a reading of 0 to -20 tells us that the asset is overbought. On the other hand, if %R falls in the range of -80 and -100, the asset is said to be oversold. As with other technical indicators, %R generates accurate trading signals when used in conjunction with other analytical tools such as chart patterns and systems.

Just because an asset may appear overbought and oversold based on the %R, this doesn’t necessarily mean that the price will reverse. Hence, we include a few concepts of the chart pattern and price action to confirm that the reversal is real. The more we wait, the higher the confirmation. But this reduces the risk-to-reward (RR) ratio moderately. This depends more on the type of trader if he is more conservative or aggressive.

In the strategy, we firstly establish a trend that is mostly in the overbought or oversold situation. This means William’s %R should indicate an overbought situation of the market for a major part of the trend during an uptrend. On the other hand, in a downtrend, William’s %R should indicate an oversold market situation for a major part of the trend. When the trend remains in the overbought or oversold condition for most of the time, the reversal tends to be sharp in nature.

This is why the above condition is important for the strategy. Next, we wait for the ‘Bullish Engulfing’ pattern to appear on the price chart, in a reversal of a downtrend. Likewise, in a reversal of an uptrend, we wait for the ‘Bearish Engulfing’ pattern to appear on the chart. This is the first sign of reversal. The reversal is confirmed when the price starts moving above the moving average, in a downtrend, and below the moving average, in an uptrend.

Stop-loss for the trade will be placed below the ‘engulfing’ pattern in a ‘long’ position and above the ‘engulfing’ pattern in a ‘short’ position.

Trade Setup

In order to explain the strategy, we will be executing a ‘long’ trade in EUR/USD currency pair using the below-mentioned rules. Here are the steps to execute the strategy.

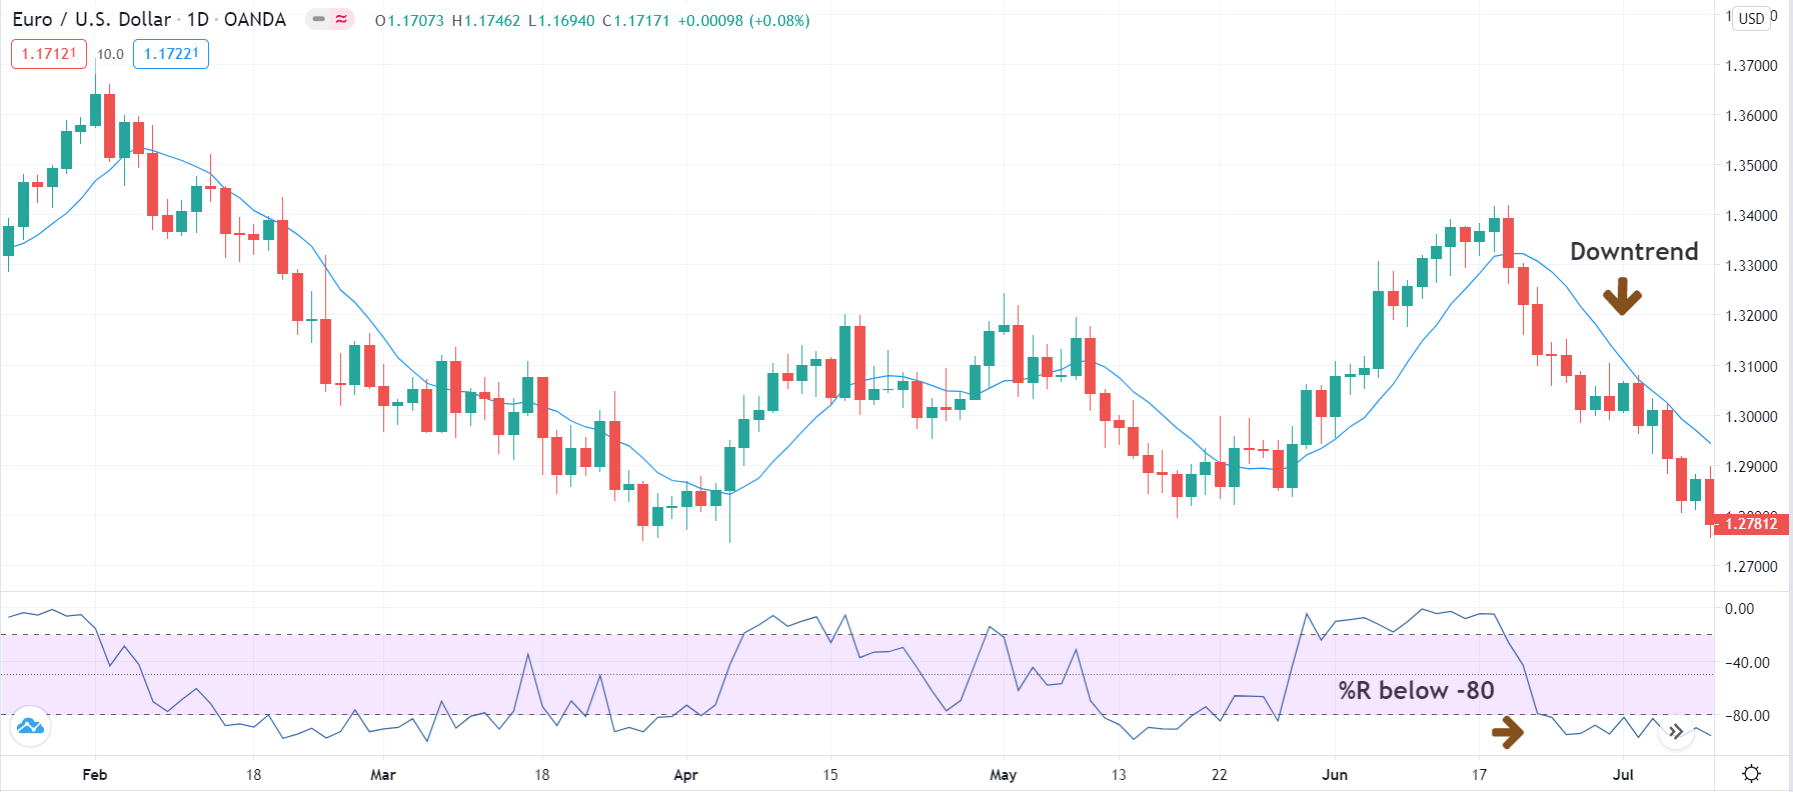
Step 1: The first step of the strategy is to identify the major trend of the trend. An easy to determine trend is if the price is below the simple moving average, the market is in a downtrend, and if the price is above the simple moving average, the market is in an uptrend. Here we need to make sure that William’s %R indicates an overbought/oversold market situation for the major part of the trend.

The below image shows an example of a downtrend that is oversold.

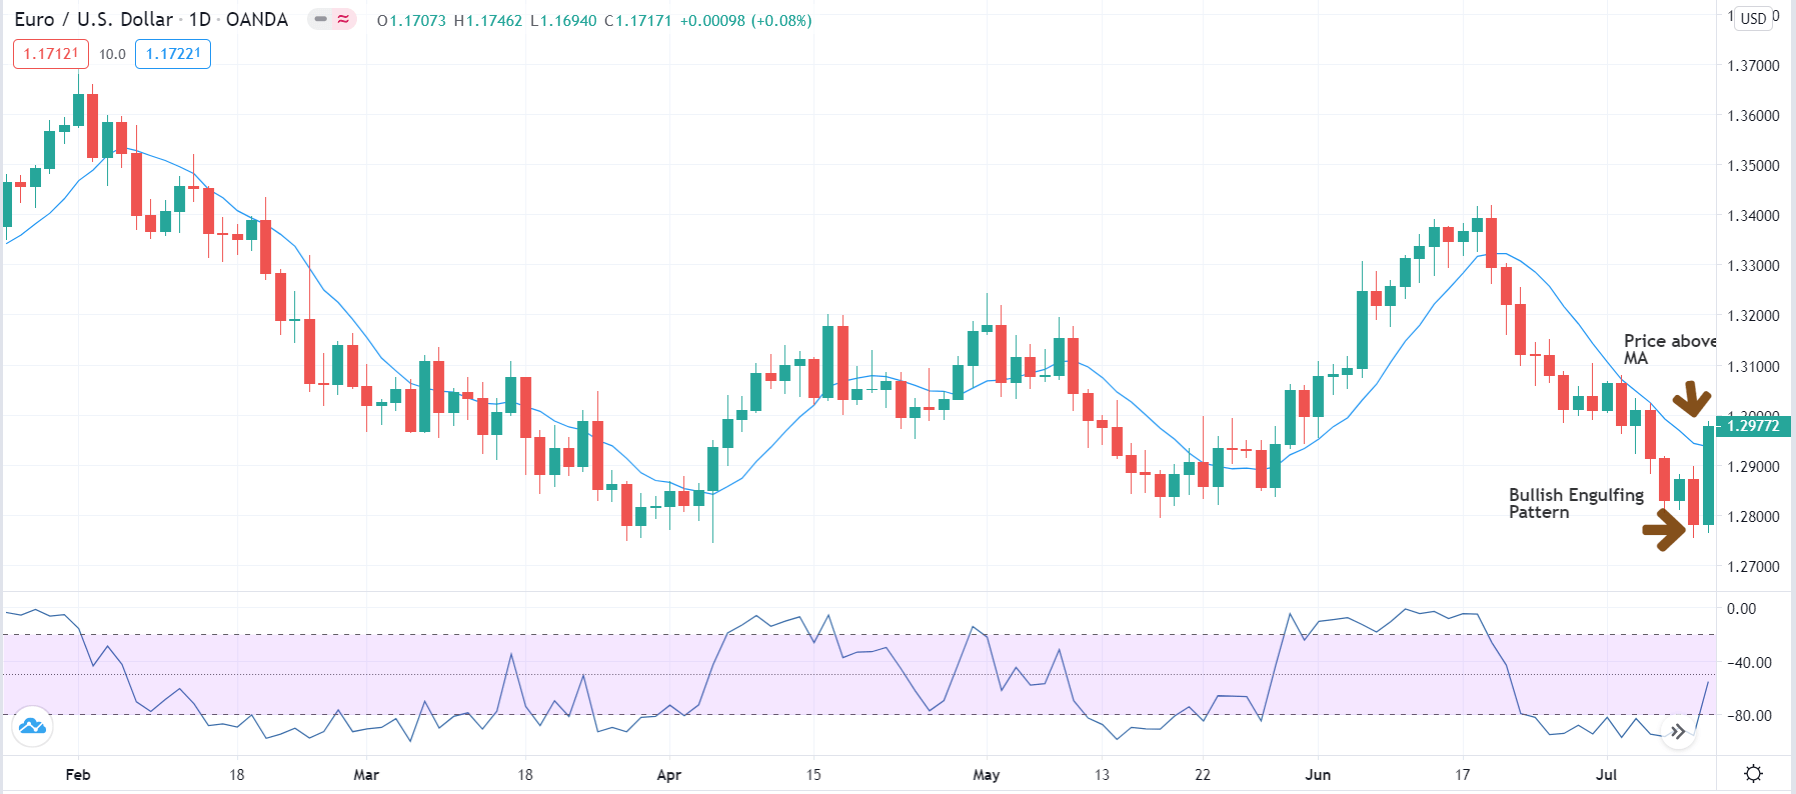
Step 2: The next step is to wait for the market to present the ‘Engulfing’ pattern on the chart. In a downtrend, the ‘Bullish Engulfing’ pattern indicates a reversal of the trend, while in an uptrend, the ‘Bearish Engulfing’ pattern indicates a reversal of the trend. If the second of the engulfing pattern closes above the MA in a reversal of the downtrend, the reversal will be more prominent. Similarly, if the second candle closes below the MA in a reversal of the uptrend, the reversal can be resilient.

Step 3: The rule of entering the trade is fairly simple. We enter ‘long’ when the price starts moving further above the moving average after the occurrence of an ‘engulfing’ pattern. Similarly, we enter ‘short’ when the price starts moving further below the moving average after the occurrence of the ‘engulfing’ pattern.

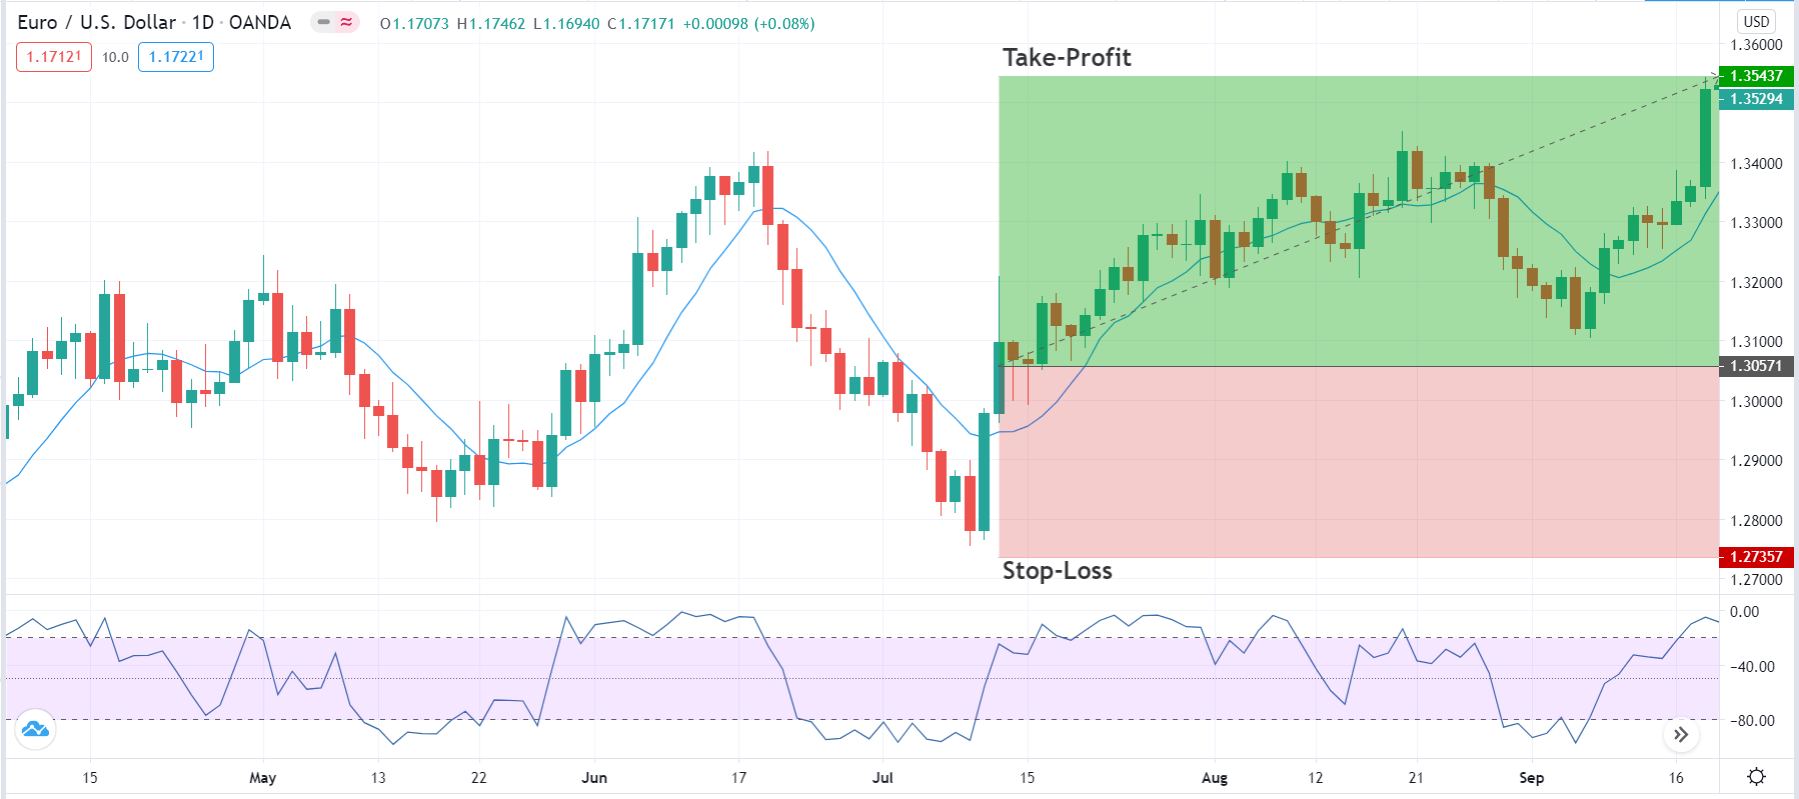
Step 4: Lastly, we need to determine the stop-loss and take-profit for the trade. In a ‘long’ position, stop-loss is placed below the ‘Bullish Engulfing’ pattern. In a ‘short’ position, it is placed above the ‘Bearish Engulfing’ pattern. The take-profit is set at a point where the resultant risk-to-reward (RR) ratio of the trade will be 1.5. However, partial profits can be taken at the opposing ‘support’ and ‘resistance’ levels that might be a hurdle for the price.

In our example, the risk-to-reward (RR) ratio of 1.5 was achieved after a period of one month since traded on the ‘Daily’ time frame.

Strategy Roundup

William’s %R is a very powerful indicator that helps us identify opportunities during a reversal phase of the market. It is important to note that %R should never be used in isolation. Combining the %R indicator with chart pattern, price action, and market trend gives us an edge in the market, which is difficult to get when applied individually. Trade executed using the above strategy can longer than expected to give desirable results since it is based on a higher time frame.

Categories
Forex Market Analysis

Daily F.X. Analysis, November 20 – Top Trade Setups In Forex – Eyes on Retail Sales!

The broad-based U.S. dollar failed to stop its overnight losses and remain bearish on the day mainly due to the mixed U.S. Stimulus story. Moreover, the doubts over the U.S. economic recovery in the wake of coronavirus resurgence also weigh on the U.S. dollar. On the news front, eyes will remain on U.K.’s and Canada’s core retail sales to determine further market trends. 

Economic Events to Watch Today  


EUR/USD – Daily Analysis

The EUR/USD currency pair managed to stop its previous day losing streak and remain bullish around the 1.1886 level mainly due to the broad-based U.S. dollar selling bias, triggered by the cautious sentiment around the U.S. stimulus story, which ultimately lends support to the currency pair. However, Mnuchin’s call to recollect funds allocated to Federal Reserve, which eventually weighed on the market trading sentiment, failed to provide any support to the greenback as the Republican heavyweight McConnell recently showed readiness to resume the discussions with the Democrats on a new COVID-19 relief package, which ultimately undermined the U.S. dollar. 

That’s very surprising as the U.S. dollar usually draws bids alongside losses in the equities market. On the contrary, the buying interest around the single currency was capped by the intensifying virus fugues in Europe, which eventually becomes the key factor that has been capped further upside in the currency pair. At the moment, the EUR/USD currency pair is currently trading at 1.1888 and consolidating in the range between the 1.1865 – 1.1891.

The equity market has been declining since the day started amid mixed concerns over the U.S. stimulus story. The Mnuchin’s asked the Federal Reserve to return the remaining coronavirus stimulus funds, which could limit the central bank’s capacity to give additional support to businesses at a time when the coronavirus second wave is accelerating. Let me remind you that these funds were meant for global lending to local government, non-profits, businesses. These factors have been weighing on the market trading sentiment, which could be considered as the main factors that cap further downside in the safe-haven U.S. dollar losses.

On the contrary, Republican heavyweight McConnell recently showed a willingness to continue the negotiations with the Democrats on a new COVID-19 relief package. This news is negative for the U.S. dollar, as a stimulus package would have the effect of reducing the U.S. dollar.

As in result, the broad-based U.S. dollar failed to stop its overnight losses and remain bearish on the day mainly due to the mixed U.S. Stimulus story. Moreover, the doubts about the U.S. economic recovery in the wake of coronavirus resurgence also weigh on the U.S. dollar. Thus, the U.S. dollar losses could also be a key factor that kept the currency pair higher. Meantime, the dollar index unchanged at 92.306 (=USD), off Thursday’s low of 92.236, though it is still down 0.3% on the week.

On the bearish side, the intensifying market worries regarding the continuous hike in new coronavirus cases in Europe and the United States keep fueling the doubts over the global economic recovery through imposing back to back lockdown restrictions on economic and social activity, which eventually weighed on the shared currency and becomes the key factor that kept the lid on any additional gains in the currency pair. 

In the absence of significant data/events on the day, the market traders will keep their eyes on the ongoing drama surrounding the U.S. stimulus package. In the meantime, the risk catalyst like geopolitics and the virus woes, not to forget the Brexit, will also be key to watch for a fresh direction. 

Daily Technical Levels

Support   Resistance

1.1836       1.1880

1.1820       1.1908

1.1791       1.1924

Pivot point: 1.1864

EUR/USD– Trading Tip

On Friday, the EUR/USD is trading with a bearish bias at the 1.1844 level, having violated an upward trendline on the hourly chart. On the lower side, the support stays at 1.1832, and below this, the EUR/USD may find next support at 1.1814. On the higher side, the resistance can be found at the 1.1867 level. The bullish bias remains dominants today as the MACD and 50 periods EMA support a bullish trend. We are already holding a buying trade from yesterday; therefore, you are advised to follow our forex signals page for more updates on the EUR/USD pair. 


GBP/USD – Daily Analysis

During Friday’s European trading session, the GBP/USD currency pair managed to gain positive traction for the second straight session and refresh the intra-day high around closer to 1.3300 level mainly due to the broad-based U.S. dollar fresh weakness, backed by the doubts over the next round of the U.S. fiscal stimulus measures, which eventually undermined the U.S. dollar and contributed to the currency pair gains. 

On the contrary, the worsening coronavirus (COVID-19) conditions in the U.S. and Europe raised the fears of global economic recovery, which could be considered one of the key factors that kept the lid on any additional gains in the currency pair. In the meantime, the gains in the currency pair were also capped by negative Brexit news. At a particular time, the GBP/USD currency pair is currently trading at 1.3275 and consolidating in the range between 1.3247 – 1.3288.

According to the latest report, the European Union (E.U.) prepares for no-deal Brexit plans after the discussions’ dragging. The fears of no-deal Brexit were further bolstered after E.U.’s Chief Negotiator Michel Barnier self-isolated after a member of his team contracted the infection.

Despite the fears of no-deal Brexit and the Sino-American skirmish, not to forget the record single-day increase in COVID-19 cases, the currency pair managed to gain positive traction amid a weaker U.S. dollar. At the USD front, the broad-based U.S. dollar failed to gain any positive traction and edged lower on the day as doubts over the U.S. economic recovery remain amid the coronavirus crisis. The losses in the U.S. dollar kept the currency pair higher. Meantime, the dollar index unchanged at 92.306 (=USD), off Thursday’s low of 92.236, though it is still down 0.3% on the week.

In the absence of significant data/events on the day, the market traders will keep their eyes on the ongoing drama surrounding the U.S. stimulus package. In the meantime, the risk catalyst like geopolitics and the virus woes, not to forget the Brexit, will also be key to watch for a fresh direction. 

Daily Technical Levels

Support    Resistance

1.3155       1.3236

1.3118       1.3280

1.3073       1.3317

Pivot point: 1.3199

GBP/USD– Trading Tip

Most technical levels are the same as Sterling didn’t make any significant change in the market. The GBP/USD pair is trading bullish at the 1.3279 level, holding over the 1.3227 support level, which is extended by an upward trendline on a 2-hour timeframe. The Cable is likely to face immediate resistance at the 1.3297 area, which will be confirmed if the candle starts closing below this level. However, the bullish breakout of the 1.3297 level can drive further upside movement until the 1.3370 level today. 


USD/JPY – Daily Analysis

A day before, the USD/JPY pair was closed at 103.795 after placing a high of 104.207 and a low of 103.650. The currency pair USD/JPY remained bearish for the 5th consecutive session on Wednesday and dragged its prices below the 103.700 level. The USD/JPY pair was extending its losses due to the U.S. dollar weakness on Wednesday despite the latest optimism regarding the coronavirus vaccine. On Wednesday, Pfizer announced that its vaccine was 95% effective in its study and planning to seek authorization within days.

This news added to the market’s risk sentiment and supported the equity market by providing a 0.45% gain to Dow Jones and 0.04% to NASDAQ. The latest news from Pfizer and BioNtech failed to impress the market, and the pair USD/JPY continued following the U.S. dollar’s weakness on Wednesday. The currency pair was under pressure as the coronavirus situation was getting worse day by day in the U.S. as the death toll surpassed 250,000 level in the major economy. According to Johns Hopkins University, the coronavirus has cost almost 250,180 American lives so far, and the count was increasing day by day. This raised fears that more restrictions could be imposed in many states, which would slow down the economic recovery. These fears weighed in the local currency U.S. dollar, and hence, USD/JPY remained under pressure for the 5th consecutive session on Wednesday.

Given the rising number of infections in the country, the States like California and Illinois stretched their restrictions to battle the rising number of cases as any financial aid package was not close to being delivered by Congress. The rising number of coronavirus cases in the U.S. has forced U.S. officials to announce that public schools in New York City will close again on Thursday as the city has reached a 3% coronavirus test positivity rate. These fears also kept the U.S. dollar under pressure on Wednesday.

The House Speaker Nancy Pelosi and Senate Minority Leader Chuck Schumer urged the Senate Majority Leader Mitch McConnell to resume talks related to the coronavirus relief package. However, McConnell was insisting on a targeted package. The U.S. dollar came under further pressure after the hopes for the talks for further stimulus package increased and weighed on the USD/JPY pair.

On the data front, at 02:00 GMT, the TC Long Term Purchases surged to 108.9B from the expected 41.5B and supported the U.S. dollar. At 18:30 GMT, the Building Permits for October came in line with the projections of 1.55M. The Housing Starts rose to 1.53M from the expected 1.45M and supported the U.S. dollar that ultimately capped further losses in the USD/JPY on Wednesday. On the Japanese side, the Trade Balance for October raised to 0.31T against the 0.11T and supported the Japanese Yen that added further pressure on the USD/JPY pair on Wednesday.

Daily Technical Levels

Support    Resistance

103.58       104.16

103.32       104.48

102.99       104.74

Pivot point: 103.90

USD/JPY – Trading Tips

The USD/JPY extends its bearish trend below the 104.430 level, falling from the 104.850 support area. On the lower side, the USD/JPY pair is likely to find support at the 103.800 level, and violation of this level can also extend further selling bias until 103.227. On the higher side, the USD/JPY safe-haven pair may find resistance at 104.400 and may help us capture a selling trades below this level as the MACD and RSI support the selling trend today. Good luck! 

Categories
Forex Elliott Wave Forex Market Analysis

Is NZDJPY ready for a New Upward Move?

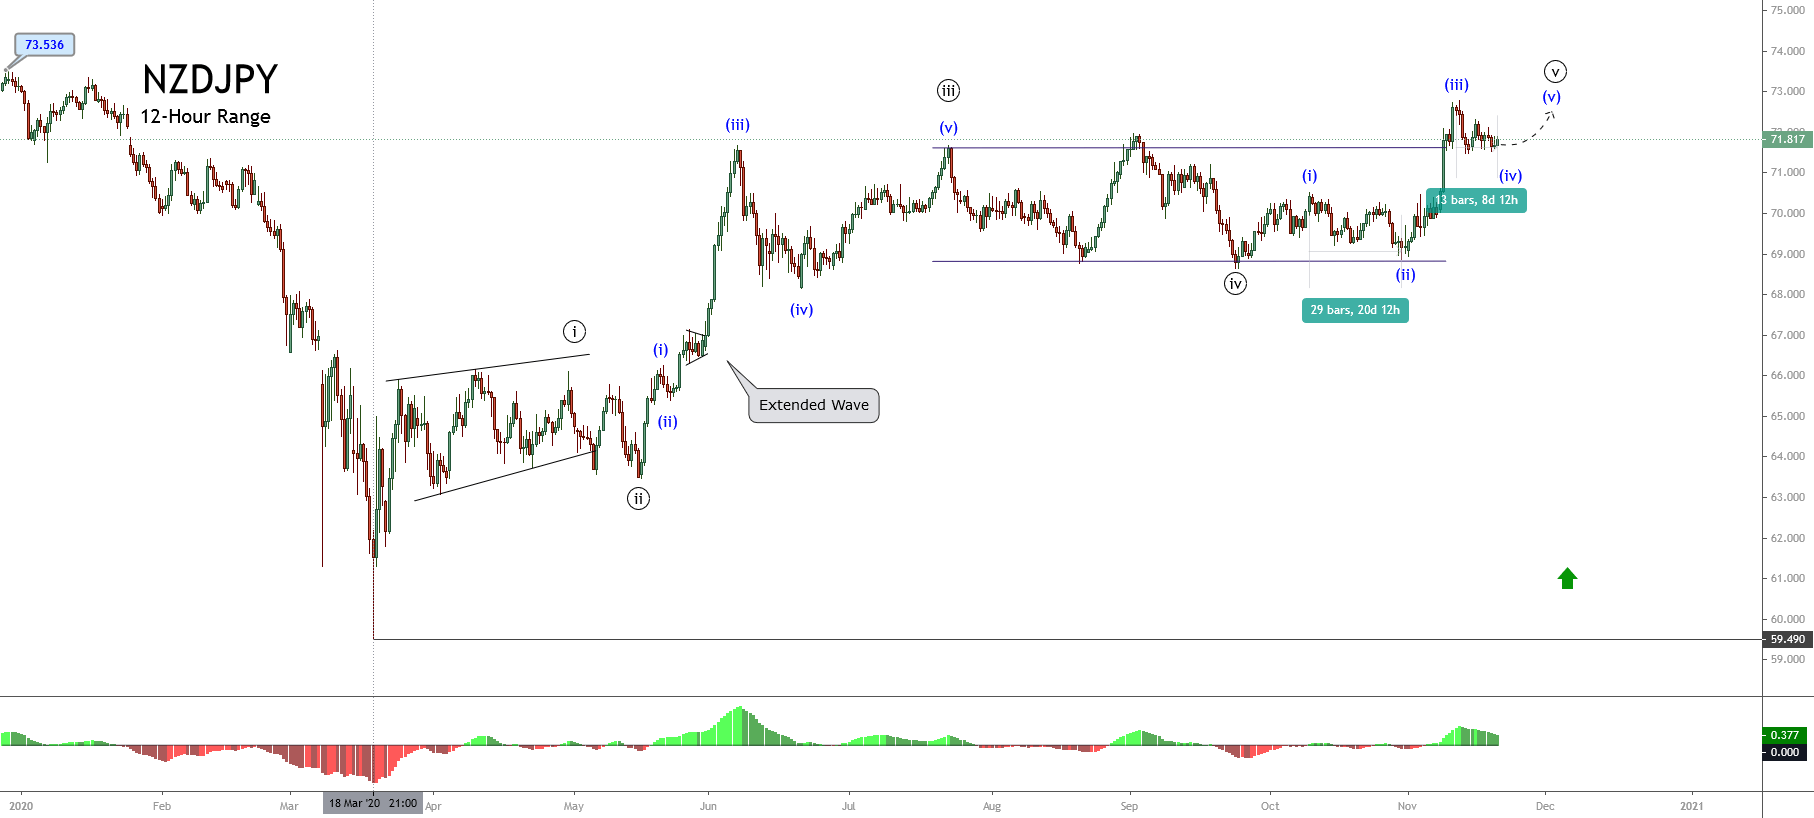
The Elliott Wave perspective of the NZDJPY pair reveals it is moving in an incomplete impulsive sequence that began on March 18th when the price found fresh buyers at 59.49.

Elliott Wave Landscape

In its 12-hour chart, NZDJPY is seen progressing in its fifth wave of Minute degree labeled in black. Its internal structure reveals a sideways action corresponding to the fourth wave of Minuette degree identified in blue. Looking at this context, the cross would likely develop a new upward movement, which should correspond to the fifth wave of Minuette degree of the fifth wave of Minute degree,  following the Elliott Wave theory.

In this regard, the next movement corresponding to the fifth wave in blue of the fifth wave in black should be a terminal move. However, this potential sequence will not necessarily be an ending diagonal pattern.

On the other hand, as exposed in the previous chart, the third wave of Minute degree corresponds to the extended movement of the complete impulsive sequence of Minute degree. Therefore, under the EW rules, the fifth wave cannot be an extended move.

Finally, considering that the fifth wave doesn’t reveal a reversal formation, the current uptrend is likely to continue mostly bullish.

Short-term Technical Outlook

The short-term Elliott wave outlook for the NZDJPY cross displayed in the following 4-hour chart reveals the incomplete internal sequence that currently appears advancing in its fourth wave of Minuette degree identified in blue. At the same time, the corrective wave in progress is running in wave b of Subminuette degree labeled in green.

Once NZDUSD completes its wave b (labeled in green), it could develop a new decline corresponding to wave c. This intraday downward movement, subdivided into five internal segments, could fail below the latest lows, with its potential support on 71.411, where the NZDJPY cross could find fresh buyers expecting to boost its price toward the potential target zone located between 72.569, even till the psychological barrier at 73.002. This likely decline could be a “bear trap,” the big market participant could use to incorporate their long positions.

On the other hand, looking back in our first 12H chart, considering that the third wave is the extended wave,we can perceive two potential scenarios for the wave (v), in blue.

  • Scenario 1: Wave (v) doesn’t surpass the end of wave (iii) located at 72.791 and starts to decline, unveiling the bearish pressure for the cross. In this case, the price likely would pierce and close below level 71.411.
  • Scenario 2:  Wave (v) exceeds the end of wave (iii). In this case, the bullish pressure continues; therefore, the cross retracement could find support above the recent low located at 71.51.

Finally, the invalidation level corresponding to the intraday bullish scenario is 70.511, corresponding to the end of wave (i) identified in blue.

Categories
Forex Signals

Trend Pullback On CAD/CHF Pair

Categories
Forex Market Analysis

Daily F.X. Analysis, November 19 – Top Trade Setups In Forex – U.S. Jobless Claims in Focus! 

The economic calendar is filled with medium impact economic events such as Unemployment Claims, C.B. Leading Index m/m, and Existing Home Sales from the United States on the news front. Besides, the Current Account from the Eurozone will also remain in the highlights today. The market may show some price action during the U.S. session on the release of U.S. Jobless Claims.

Economic Events to Watch Today  


EUR/USD – Daily Analysis

The EUR/USD pair was closed at 1.18539 after placing a high of 1.18908 and a low of 1.18491. The EUR/USD pair dropped on Wednesday after placing gains for four consecutive days. The EUR/USD pair remained on an upbeat track last days amid the market sentiment’s risk-on market sentiment due to the vaccine optimism. The riskier currencies gathered strength against the safe-havens like the USD and posted gains over the last week. However, on Wednesday, the EUR/USD pair started to decline as Europe’s lockdown situation started to raise fears for economic recovery.

However, the second wave of the coronavirus in Europe started to show signs of slowing. The latest numbers showed a stabilization in new cases in Germany, Spain, Italy and a decline in Belgium, France, and the Netherlands. Despite this, the experts have warned that it was too early to get complacent. The lockdowns and tough social restrictions were reintroduced across numerous European countries in October due to the increased spread of the second wave of coronavirus. These restrictions have been placing a threat on European nations’ economic recovery and weighed on Euro currency that has dragged the EUR/USD pair down on Wednesday.

On the data front, at 02:00 GMT, the TC Long Term Purchases from the U.S. raised to 108.9B against the forecasted 41.5B and supported the U.S. dollar that ultimately added losses in the EUR/USD pair. At 18:30 GMT, the Building Permits from October remained flat with the anticipations of 1.55M. The Housing Starts were raised to 1.53M from the projected 1.45M and supported the U.S. dollar that weighed on EUR/USD pair on Wednesday.

From the European side, at 15:00 GMT, the Final CPI for the year came in line with the expectations of -0.3%. The Final CPI for the year also remained flat as expected, 0.2%. European data failed to impact the EUR/USD pair on Wednesday, and the pair continued following the U.S. dollar’s movement.

The losses in the EUR/USD pair were limited after the risk sentiment was improved in the market due to the latest optimism regarding the coronavirus vaccine. Pfizer and BioNtech announced that they would be filing for emergency authorization of their vaccine in the coming days from the U.S. This raised the optimism that vaccines will soon be available in the market, and the chaos will be lifted from the economy, and it will start to recover. The riskier currency Euro gained traction and capped further losses in the EUR/USD pair on Wednesday.

Daily   Technical Levels

Support Resistance

1.1836      1.1880

1.1820      1.1908

1.1791      1.1924

Pivot point: 1.1864

EUR/USD– Trading Tip

The EUR/USD is trading with a bearish bias at the 1.1844 level, having violated an upward trendline on the hourly chart. On the lower side, the support stays at 1.1832, and below this, the EUR/USD may find next support at 1.1814. On the higher side, the resistance can be found at the 1.1867 level. The bullish bias remains dominants today as the MACD and 50 periods EMA support a bullish trend. We are already holding a buying trade from yesterday; therefore, you are advised to follow our forex signals page for more updates on the EUR/USD pair. 


GBP/USD – Daily Analysis

The GBP/USD closed at 1.32670 after placing a high of 1.33120 and a low of 1.32410. The pair GBP/USD continued its bullish momentum for the 4th consecutive day on Wednesday and reached near 1.33200 level. The latest rise in the GBP/USD pair was driven by the growing hopes that a Brexit deal could be within reach after the French President Emmanuel Macron was ready to cave in on demands from the U.K. for full sovereignty waters that will likely rein in access for French fishermen.

This news raised hopes for a Brexit deal before the end of the transition period and supported the British Pound that ultimately lifted the GBP/USD pair higher on board. The Irish Minister Micheal Martin also said that a landing zone for an agreement was within sight just a day ahead of the European Union Summit when the E.U. Brexit negotiator Michel Barnier will brief E.U. leaders about the two weeks of talks held with the U.K.

Chances are increased that an agreement will be made as soon as Monday and will be approved within a week, most likely at the next E.U. Summit on December 10. After that, the European Parliament would have to rubberstamp the agreement to ensure a deal was placed before the end of the transition period on Dec.31st.

All these hopes lifted the British Pound as the chances of a deal were clear for the first time, and things were going in favor of the U.K. However, analysts were concerned that inflation was likely to slow in the months ahead. The GBP/USD pair picked up its pace towards an upward direction due to renewed Brexit optimism and reached near 1.3200 level on Wednesday. On the data front, At 12:00 GMT, the Consumer Price Index for the year raised to 0.7% from the expected 0.5% and supported the Sterling. The year’s Core CPI also raised to 1.5% against the anticipated 1.3% and supported British Pound. The RPI from the U.K. also rose to 1.3% from the expected 1.2% and supported British Pound that ultimately added further gains in GBP/USD pair. At 12:02 GMT, the PPI Input for October surged to 0.2% against the expected 0.0% and supported the British Pound. At the same time, the PPI Output in October remained flat with the expectations of 0.0%. The Housing Price Index from the U.K. also surged to 4.7% against the forecasted 2.9% and supported the British Pound.

The U.K.’s positive macroeconomic data supported the British Pound against the U.S. dollar and raised the GBP/USD pair on Wednesday.

While from the U.S. side, at 02:00 GMT, the TC Long Term Purchases rose to 108.9B against the anticipated 41.5B and supported the U.S. dollar. At 18:30 GMT, the Building Permits for October remained flat with the projections of 1.55M. The Housing Starts surged to 1.53M from the anticipated 1.45M and supported the U.S. dollar that ultimately capped further gains in GBP/USD pair on Wednesday.

Meanwhile, the Bank of England’s Chief Economist Andy Haldane said that the economic outlook for 2021 was materially brighter than he had expected just a few weeks ago despite the short-term uncertainty from a renewed coronavirus lockdown in England. He said that Britain’s economy shrank by almost 20% in the second quarter of 2020, more than any other peer economy, and at the end of September, it was still 8.4% smaller than a year before. He struck a somewhat positive note in line with his previous assessments of Britain’s recovery on Wednesday that raised the British Pound on board against the U.S. dollar. This also benefited the GBP/USD pair on Wednesday, and hence, the pair ended its day with a bullish candle.

Daily Technical Levels

Support   Resistance

1.3155      1.3236

1.3118      1.3280

1.3073      1.3317

Pivot point: 1.3199

GBP/USD– Trading Tip

The GBP/USD pair is trading bullish at the 1.3279 level, holding over the 1.3227 support level, which is extended by an upward trendline on a 2-hour timeframe. The Cable is likely to face immediate resistance at the 1.3297 area, which will be confirmed if the candle starts closing below this level. However, the bullish breakout of the 1.3297 level can drive further upside movement until the 1.3370 level today. 


USD/JPY – Daily Analysis

The USD/JPY pair was closed at 103.795 after placing a high of 104.207 and a low of 103.650. The currency pair USD/JPY remained bearish for the 5th consecutive session on Wednesday and dragged its prices below the 103.700 level. The USD/JPY pair was extending its losses due to the U.S. dollar weakness on Wednesday despite the latest optimism regarding the coronavirus vaccine. On Wednesday, Pfizer announced that its vaccine was 95% effective in its study and planning to seek authorization within days.

This news added to the market’s risk sentiment and supported the equity market by providing a 0.45% gain to Dow Jones and 0.04% to NASDAQ. The latest news from Pfizer and BioNtech failed to impress the market, and the pair USD/JPY continued following the U.S. dollar’s weakness on Wednesday.

The currency pair was under pressure as the coronavirus situation was getting worse day by day in the U.S. as the death toll surpassed 250,000 level in the major economy. According to Johns Hopkins University, the coronavirus has cost almost 250,180 American lives so far, and the count was increasing day by day. This raised fears that more restrictions could be imposed in many states, which would slow down the economic recovery. These fears weighed in the local currency U.S. dollar, and hence, USD/JPY remained under pressure for the 5th consecutive session on Wednesday.

Given the rising number of infections in the country, the States like California and Illinois stretched their restrictions to battle the rising number of cases as any financial aid package was not close to being delivered by Congress. The rising number of coronavirus cases in the U.S. has forced U.S. officials to announce that public schools in New York City will close again on Thursday as the city has reached a 3% coronavirus test positivity rate. These fears also kept the U.S. dollar under pressure on Wednesday.

The House Speaker Nancy Pelosi and Senate Minority Leader Chuck Schumer urged the Senate Majority Leader Mitch McConnell to resume talks related to the coronavirus relief package. However, McConnell was insisting on a targeted package. The U.S. dollar came under further pressure after the hopes for the talks for further stimulus package increased and weighed on the USD/JPY pair.

On the data front, at 02:00 GMT, the TC Long Term Purchases surged to 108.9B from the expected 41.5B and supported the U.S. dollar. At 18:30 GMT, the Building Permits for October came in line with the projections of 1.55M. The Housing Starts rose to 1.53M from the expected 1.45M and supported the U.S. dollar that ultimately capped further losses in the USD/JPY on Wednesday. On the Japanese side, the Trade Balance for October raised to 0.31T against the 0.11T and supported the Japanese Yen that added further pressure on the USD/JPY pair on Wednesday.

Daily Technical Levels

Support   Resistance

103.58      104.16

103.32      104.48

102.99      104.74

Pivot point: 103.90

USD/JPY – Trading Tips

The USD/JPY extends its bearish trend below the 104.430 level, falling from the 104.850 support area. On the lower side, the USD/JPY pair is likely to find support at the 103.800 level, and violation of this level can also extend further selling bias until 103.227. On the higher side, the USD/JPY safe-haven pair may find resistance at 104.400 and may help us capture a selling trades below this level as the MACD and RSI support the selling trend today. Good luck! 

Categories
Forex Basics

Things That Successful Forex Traders Would NEVER Say

We see all sorts of advice printed all over the internet about what successful traders do and what new traders do. With there being so many different sources of information it is very easy for some of it to get muddled up and confused with each other, this is just a natural thing to happen. We have seen quotes thrown about from so-called successful and profitable traders that make us think twice, they seem a little out of place. So we have come up with a list of things that you simply won’t hear a successful person saying, if they do, then we would question how successful they are and also their honesty and integrity in what they are saying. So let’s just in and look at some of the things that successful traders simply would not say…

“I never lose!”

If anyone tells you that they never lose, then I would question them as a person. Either they have the perfect strategy, they are incredibly lucky or they are simply outright lying. Losing is a major part of trading, the majority of profitable traders may even lose more taxes than they win, but due to their strategies and plans in place, they are still profitable. There is no holy grail strategy, there is no way to simply win every trade, a good trader will be able to admit that as they are happy with their strategy, they are not there to try and impress others. The markets move up and down, they jump about and they are unpredictable, no one can predict it 100% of the time, if they could they would be the richest person in the world right now. People like to try and exaggerate their success stories, but if you see someone stating that they never lose, they are most likely not that successful, a successful trader will admit their losses and even embrace them.

“You should be trading every day.”

Something that a lot of newer traders are told, you need to practice and trade every day if you want to become successful, at the very beginning this may be the case, there is so much to learn that you simply need to in order to take it all in. As you progress and become more used to the markets and get a better understanding of them, you will soon begin to realise that you do not need to trade quite as much. In fact, you will find yourself taking entire days or even a week away from trading. Certain aspects of your life such as your mental wellbeing need to take priority at times, if you are beginning to get stressed, take a break, you do not need to be there every day. One way that successful traders remain consistent is knowing when to take breaks and knowing that they do not need to take every opportunity that comes up. Patience is another virtue that successful traders use, knowing when to take a trade and knowing when to simply sit back and watch. Not doing anything can sometimes be the better option and a successful trader will not shy away from admitting that.

“I taught myself everything I know.”

The simple response to this is, no you did not, this term basically means that he did not receive any help from anyone else or from any other sauces. This is simply not going to be the case, even the best traders in the world speak to others about their trading in order to ensure they are doing the right things and to get feedback on how they are performing, if someone states that they are not then this is most likely not the case. Many traders go on training courses, join trading communities, or simply speak to others face to face. It is a valuable source of information and feedback and it is something that all successful traders will do. It is near impossible to learn the different strategies and risk management without having some sort of input from the outside world.

“I know everything about trading.”

No, you do not, simple as that. The world of forex and trading is huge, so huge that there are probably things about it that have never actually been written or discovered yet. It is simply not humanly possible to know everything and a successful trader will know this, they will know that you need to be constantly learning. Part of learning to trade is having the understanding that you will be continuing to learn throughout your entire trading career. If someone was to simply state that they know everything, then they are most likely in a position where they do not truly understand how vast the idea of forex and trading is, which in our eyes would make them not quite as much of an expert as they may believe that they are.

“My strategy always works!”

When you first start it you probably created a trading strategy yourself or took an idea from someone else. For many when beginning this is the only strategy that you have. You would have then experienced a market change and this made it so that your strategy was no longer effective within the markets. A successful trader knows that this is the case. Due to this, they understand that the strategy that they are currently using or even their favorite strategy will not work in all market conditions. Instead, a successful trader will have multiple different strategies that they can use depending on the current market conditions. If someone states that their strategy works in all conditions, then they simply have not yet had the markets go against them and their strategy.

“Don’t worry about money management.”

One of the biggest things in trading is your money management, how you will protect your account and your capital. If anyone states that it is not that important then we would discount pretty much everyone else that they say. Money management and risk management is 10% important, it is one of the most important things that you can do, it is there to protect you and can prevent you from losing your account. Any and all successful traders are most likely successful because they have a good plan in place to protect them from their losses.

“Doubling down is good.”

When a trade is going the right way, a lot of traders would add to that trade which is fine as this increases profits, however, when a trade is going the wrong way, why would you want to add to the losing position? The sad thing is that there are actually a lot of different strategies that use this method, most popular is the grid or martingale strategies, both of which can very easily blow your account. A successful trader will not be using these strategies and they certainly won’t be adding to their losing positions, so if you see someone doing this, they are actually playing a very risky game, not something a consistently successful trader would do.

So those are a few of the things that you just won’t hear a successful trader say. Normally those saying them are people who are trying to exaggerate their success or their abilities, a successful trader won’t need to do this as their results will speak for themselves, so if you see people making comments like this, do not take their word for granted, they may be trying to pull your leg.

Categories
Forex Fundamental Analysis

Everything About ‘Germany Ifo Business Climate Index’ Forex Fundamental Indicator

Introduction

Although government expenditures play an important role in the economy, investments by the private sector can be said to be the backbone of any economy. Therefore, when the private sector businesses have a rosy outlook on the economy, it can be expected that they will increase their investments. For governments, economists, financial analysts, and forex traders, tracking investors’ expectations can help understand and even predict the future economy.

Understanding Germany Ifo Business Climate Index

The Ifo business climate index is used to rate the current business climate in Germany and also rates the expectations of businesses for the next six months. Thus, we can say that the Ifo Business Climate is a leading indicator of economic development in Germany.

Source: Ifo Institute

Since Germany is the largest economy in the Euro area, this index plays a vital role in influencing the E.U’s overall economic activity.

Calculating the Germany Ifo Business Climate Index

The Ifo Institute for Economic Research conducts a monthly survey of about 9000 businesses operating in Germany. The businesses operate in the construction, wholesaling and retailing, manufacturing, and service sectors – i.e., the survey covers the entirety of the German economy.

In the survey, the respondents are required to give their assessments of the current business environment and what they expect over the coming six months. In their responses, they can say that the current business environment is “good,” “satisfactorily,” or “poor.” For their expectations, they can respond as either “more favorable,” “unchanged,” or “more unfavorable.”

The Ifo then weighs these responses. The weight attached is based on the importance of the industry’s contribution to the overall economy. Their importance is gauged by the percentage of employees they have and their contribution to the GDP.

The balance in the current business situation is determined by the difference between the percentage of “good” and “poor” responses. Similarly, the balance business expectations are the difference between the percentage of the “more favorable” and “more unfavorable” responses. The business climate is calculated by taking the average of the balances of the current business situation and the expectations.

The Ifo index is seasonally adjusted to ensure that some of the recurring patterns are eliminated from the time series. To seasonally adjust the data, the Ifo Institute employs the X-13ARIMA-SEATS procedure developed by the U.S. Census Bureau.

Using the Germany Ifo Business Climate Index in Analysis

There are several ways in which this index can be used to show how the German economy is progressing.

When the index increases over time, it shows that the businesses are more inclined to increase their capital expenditure and investments in various projects in the economy. In doing so, they effectively ensure that the economic output will increase, which leads to higher GDP. Similarly, an increase in investments into economic projects and capital expenditures leads to an increase in production activities, which leads to higher employment levels.

Therefore, we can say that when the Ifo business climate index increases, it is expected that the rate of unemployment will reduce. Conversely, the rate of unemployment should be expected to rise when the Ifo business climate index drops. This is because the drop in the index implies that businesses expect business conditions will be more favorable. They will be prompted to cut back on investments and scale down core operations to mitigate losses. The resultant effect is lower levels of GDP and a higher unemployment rate.

Over the long term, the Ifo business climate index may be used to show the trends in business cycles and even used to predict recessions and economic recoveries. One of the primary drivers of any business is profiteering, which comes from their products’ demand. When businesses anticipate the demand to fall, their expectations are “more unfavorable.”

We know that the aggregate demand depends on the households’ demand. Therefore, when the demand is expected to fall, households are expected to have lesser disposable income, which could result from low wages and prevalent job losses; these are characteristics of a contraction. Therefore, when the Ifo business climate is continuously dropping, we can expect that the economy might go through bouts of recession.

On the other hand, if the Ifo business climate is steadily rising, it shows that the economy will undergo a steady period of expansion. This expansion comes from the fact that businesses will expect the demand for their goods and services to increase. This instance implies that households have more disposable income, which means wages have increased or employment increased.

Furthermore, when the economy has been through depression or recession, an improvement in the Ifo business climate index shows that the future is “more favorable.” It means that businesses do not expect the ongoing stage of recessions or depression to persist into the future. These expectations imply that businesses expect to increase their investments, a clear sign of economic recoveries.


Source: Ifo Institute

Impact of Germany Ifo Business Climate Index on the Euro

Germany is the largest economy in the E.U.; therefore, its economic outlook is bound to significantly impact the Euro since the EUR fluctuates depending on the economic performance of its member countries.

When the Germany Ifo Business Climate Index rises, it means that the German economy is expected to grow. Furthermore, the benefits of the resultant expansion of business operations in Germany might spill over to other countries in the E.U. in terms of job creation. As a result, the EUR will appreciate relative to other currencies.

Conversely, the EUR is expected to depreciate relative to other currencies when the Germany Ifo Business Climate Index continually drops. This drop signifies a potential contraction of the German economy, which may affect other EU-member countries.

Sources of Data

The Ifo Institute for Economic Research is responsible for conducting the surveys, aggregating data, and publishing the Germany Ifo Business Climate Index. Trading Economics has a historical time-series data of the Germany Ifo Business Climate Index.

How Germany Ifo Business Climate Index Release Affects The Forex Price Charts

The Ifo Institute for Economic Research published the latest business climate index on September 24, 2020, at 8.00 AM GMT. The release can be accessed at Investing.com. From the screengrab below, we can see that the German Ifo business climate index is a high-impact indicator.

In September 2020, the German Ifo business climate index was 93.4, lower than the analysts’ expectation of 93.8.

Let’s see how this lower than expected release impacted the EUR/GBP price action.

EUR/GBP: Before Germany Ifo Business Climate Index Release on 
September 24, 2020, just before 8.00 AM GMT

Before the release of the index, the EURGBP pair was trading in a weak uptrend. The 20-period M.A. was almost flattening. They adopted a weak downtrend moment before the release.

EUR/GBP: After Germany Ifo Business Climate Index Release on 
September 24, 2020, at 8.00 AM GMT

After the release of the Germany Ifo Business Climate Index, the pair formed a 15-minute bullish candle but adopted a strong downtrend afterward. The 20-period M.A. steeply fell with candles forming further below it. This trend shows that the EUR weakened against the GBP since the Germany Ifo Business Climate Index was weaker than expected.

As shown by the above analyses, the Germany Ifo Business Climate Index has a significant impact on forex price actions.

Categories
Forex Market Analysis

Daily F.X. Analysis, November 18 – Top Trade Setups In Forex – Series of Inflation Reports Ahead! 

On the news front, eyes will remain on the low and medium series impacts economic evens from U.K., Eurozone, and Canada. Its the CPI figures which are coming from all three major economies during European and the U.S. sessions. The U.K. and Eurozone Inflation reports are expected to remain neutral, with no major change expected, and these may have a muted impact on the market. However, the Canadian CPI is expected to perform slightly better, surging by 0.2% vs. -0.1% dip during the previous month. It may support Lonnie pairs today.

Economic Events to Watch Today  


EUR/USD – Daily Analysis

The EUR/USD pair was closed at 1.18605 after placing a high of 1.18935 and a low of 1.18423. The EUR/USD pair continued to move in bullish track for the 4th consecutive day on Tuesday amid the downbeat economic data from the U.S. and broad-based U.S. dollar weakness. The improved risk sentiment in the market continued supporting the EUR/USD pair on Tuesday in the early trading session, which pushed the currency pair towards a fresh weekly high at 1.1894. The risk sentiment was supported by the latest optimism from the vaccine candidates of Pfizer and Moderna. After the latest announcement from Moderna that its vaccine was 94.5% effective in last stage trials, the risk sentiment picked its pace and favored the riskier assets like EUR/USD pair.

However, the currency pair could not remain on the top for long and started losing some of its daily gains on Tuesday amid the risk-off market environment in the second half of the day. The U.S. dollar gained traction in the second half and weighed on the currency pair EUR/USD after the chances for a further stimulus package from Congress declined.

The U.S. Dollar Index was down to an 8-day lowest level of 92.26 in the first half of the day because of the rising number of coronavirus cases and lockdown restrictions in the economy. The increased number of coronavirus cases from the U.S. forced governments to impose restrictive measures to control the spread of the virus, and the chances for quick economic recovery faded that ultimately weighed on the U.S. dollar and helped EUR/USD pair to reach a new weekly high level.

However, the U.S. dollar lost its momentum after the release of its macroeconomic data on Tuesday. At 18:30 GMT, the Core Retail Sales for October dropped to 0.2% from the estimated 0.6% and weighed on the U.S. dollar. In October from the U.S., the Retail Sales also dropped to 0.3% from the expected 0.5% and weighed on the U.S. dollar. The Import Prices in the U.S. for October were declined to -0.1% from the estimated 0.2%and weighed on the U.S. dollar that helped EUR/USD pair to post gains.

At 19:00 GMT, the Capacity Utilization Rate from the U.S. raised to 72.8% against the forecasted 72.3% and supported the U.S. dollar that capped further gains in EUR/USD pair. The Industrial Production remained flat with the anticipations of 1.1% in October. At 20:00 GMT, the Business Inventories for September surged to 0.7% against the projected 0.5% and weighed on the U.S. dollar. The NAHB Housing Market Index from the U.S. surged to 90 from the estimated 85 and supported the U.S. dollar that eventually weighed on the EUR/USD pair and capped further gains.

From the European side, at 14:02 GMT, the Italian Trade Balance raised to 5.85B against the forecasted 4.30B. It supported the single currency Euro that ultimately added gains in the EUR/USD pair.

Furthermore, the European Central Bank President, Christine Lagarde, sounded pessimistic on Tuesday concerning the economic outlook and said that there was very negative news on the second wave of coronavirus in the economy before vaccine news. She expected a massive effect of the second wave of COVID-19 on the European economy into 2021. These comments from Lagarde also kept the pair EUR/USD under pressure on Tuesday.

Daily Technical Levels

Support   Resistance

1.1837      1.1890

1.1814      1.1918

1.1785      1.1942

Pivot Point: 1.1866

EUR/USD– Trading Tip

The EUR/USD is trading with a bullish bias, holding mostly above the upward trendline support level of 1.1850. Closing of candles above the 1.1869 level is likely to drive bullish movement in the EUR/USD pair until the 1.1885 level. The bullish bias remains dominants today as the MACD and 50 periods EMA support a bullish trend. We are already holding a buying trade from yesterday; therefore, you are advised to follow our forex signals page for more updates on the EUR/USD pair. 


GBP/USD – Daily Analysis

The GBP/USD pair was closed at 1.32483 after a high of 1.32724 and a low of 1.31863. The GBP/USD pair raised and continued its bullish track for 3rd consecutive day on Tuesday amid the latest Brexit hopes.

Due to the increased number of COVID-19 cases from across the globe, and the restrictive measures by countries to curb the virus’s spread, the demand for safe-haven currencies increased. In contrast, the riskier currencies like the British Pound remained under pressure.

The Sterling remained supportive in this risk-off mode due to the latest comments from the U.K. chief negotiator, David Frost, that boosted the Brexit deal’s confidence. According to a news report by the U.K. newspaper, The Sun, the previous concerns about the differences in key issues vanished after Britain’s chief negotiator David Frost commented to Boris Johnson that he expects a trade deal signed early next week.

After these comments from David Frost, the GBP/USD pair rallied and started moving upward for the 3rd consecutive day.

Meanwhile, the risk sentiment buoyed by the latest optimism regarding the vaccine development from Moderna also supported the British Pound’s bullish momentum and added further to the gains of the GBP/USD pair on Tuesday. Furthermore, the U.S. dollar weakness also played an important role in pushing the currency pair GBP/USD higher on Tuesday with poor macroeconomic figures. At 18:30 GMT, the Core Retail Sales for October declined to 0.2% from the expected 0.6% and weighed on the U.S. dollar. In October from the U.S., the Retail Sales also fell to 0.3% from the anticipated 0.5% and weighed on the U.S. dollar. The Import Prices in the U.S. for October fell to -0.1% against the projected 0.2%and weighed on the U.S. dollar that added further gains in the GBP/USD pair on Tuesday.

At 19:00 GMT, the Capacity Utilization Rate from the U.S. surged to 72.8% against the anticipated 72.3% and supported the U.S. dollar that capped further gains in GBP/USD pair. The Industrial Production came in line with the projections of 1.1% in October. At 20:00 GMT, the Business Inventories for September increased to 0.7% against the estimated 0.5% and weighed on the U.S. dollar, which added strength to the GBP/USD pair. The NAHB Housing Market Index from the U.S. rose to 90 from the projected 85 and supported the U.S. dollar.

Meanwhile, the governor of Bank of England, Andrew Bailey, said that the development of seemingly effective coronavirus vaccines was a bigger step forward for the economy that could lower uncertainty and get firms to reinvest. He also said that the business investment had been unusually weak since the financial crisis and weighting on productivity. Bailey also said that the changes due to coronavirus would more likely be within the services sector as it can be seen with a focus on digital services over the face to face work taking hold. Moreover, the Bank of England Deputy Governor Dave Ramsden said that positive news about the coronavirus vaccine could help reduce the risks facing Britain’s economy. Still, the central bank was unlikely to revise up its forecasts as a result.

Daily Technical Levels

Support   Resistance

1.3155      1.3236

1.3118      1.3280

1.3073      1.3317

Pivot point: 1.3199

GBP/USD– Trading Tip

The GBP/USD pair is trading bullish at the 1.3279 level, holding over the 1.3227 support level, which is extended by an upward trendline on a 2-hour timeframe. The Cable is likely to face immediate resistance at the 1.3297 area, which will be confirmed if the candle starts closing below this level. However, the bullish breakout of the 1.3297 level can drive further upside movement until the 1.3370 level today. 


USD/JPY – Daily Analysis

The USD/JPY pair was closed at 104.184 after placing a high of 104.598 and a low of 104.069. The pair USD/JPY continued its bearish trend for the 4th consecutive day on Tuesday amid broad-based U.S. dollar weakness and Japanese yen strength due to safe-haven appeal.

On Tuesday, the USD/JPY pair fell below 104.1 level after the safe-haven demand rose due to the increasing number of coronavirus cases and the restrictions from all over the world. Many countries started imposing restrictive measures to control the spread of coronavirus that raised concerns over the global economy’s recovery that lifted the safe-haven appeal. The rising safe-haven demand supported the safe-haven Japanese Yen and weighed on the USD/JPY pair on Tuesday.

The safe-haven demand deteriorated a little after the latest optimism regarding the vaccine development from Moderna that gave an efficacy rate of 94.5%. However, there was still a long way to go before the vaccine can be delivered to everyone. According to Federal Reserve Vice Chairman Richard Clarida, the chances for the U.S. economic recovery have been improved due to candidates’ successful test from both Moderna and Pfizer Inc.

On the U.S. front, the U.S. dollar was weak due to the poor macroeconomic data on Tuesday. At 18:30 GMT, the Core Retail Sales for October fell to 0.2% from the anticipated 0.6% and weighed on the U.S. dollar that added pressure on the USD/JPY pair. In October from the U.S., the Retail Sales also declined to 0.3% from the forecasted 0.5% and weighed on the U.S. dollar that weighed on USD/JPY pair. The Import Prices in the U.S. for October were declined to -0.1% from the estimated 0.2%and weighed on the U.S. dollar added pressure on the USD/JPY pair.

At 19:00 GMT, the Capacity Utilization Rate from the U.S. surged to 72.8% against the estimated 72.3% and supported the U.S. dollar that capped further losses in the USD/JPY pair. The Industrial Production came in line with the anticipations of 1.1% in October. At 20:00 GMT, the Business Inventories for September rose to 0.7% against the projected 0.5% and weighed on the U.S. dollar that added pressure on the USD/JPY pair. The NAHB Housing Market Index from the U.S. surged to 90 from the expected 85 and supported the U.S. dollar that eventually capped further losses in the USD/JPY pair.

Moreover, the Federal Reserve Chairman, Jerome Powell, said on Tuesday that as the coronavirus cases were increasing to an alarming rate, it was the time when there was a bigger need for further coronavirus relief from Congress. Powell also noted that the recent announcements from Pfizer and Moderna were certainly good news in the medium term; however, major challenges and uncertainties remain in the near term.

Powell also said that Congress should deliver direct financial support targeted to specific groups instead of using the Federal Reserve’s lending tools. Powell’s comments also weighed on the USD/JPY pair as the need for further support from the Fed and Congress weighed on the U.S. dollar.

Daily Technical Levels

Support   Resistance

103.95      104.51

103.73      104.85

103.39      105.08

Pivot point: 104.29

USD/JPY – Trading Tips

The USD/JPY extends its bearish trend below the 104.430 level, falling from the 104.850 support area. On the lower side, the USD/JPY pair is likely to find support at the 103.800 level, and violation of this level can also extend further selling bias until 103.227. On the higher side, the USD/JPY safe-haven pair may find resistance at 104.400 and may help us capture a selling trades below this level as the MACD and RSI support the selling trend today. Good luck! 

Categories
Forex Basics

The Most Difficult Parts of Forex Trading (and How You Can Easily Overcome Them)

Forex trading is hard. Anyone says otherwise either got incredibly lucky or had the work done for them. Here, we’re going to take a look at the most difficult problems associated with FX trading, and tell you exactly how to overcome them.

The fact is that the majority of people who try to trade the forex markets end up losing the money that they put in, the majority of traders fail. Then there are those that have had a successful month, this doesn’t mean that the next month is going to be profitable, in fact for the majority it won’t be. Trading is not easy, but it is incredibly rewarding.

We are going to be looking at what different parts of trading the majority of traders find the hardest and potential ways that you can help yourself get through those checkpoints. You may not find them all difficult, too many find other things difficult that others find easy, that is the thing with trading, each and every individual will have a different experience. So let’s take a look at some of the things that people find difficult when trading.

Choosing the Right Trading System

There are a lot of trading systems out there, hundreds, in fact, some are very similar to each other, however, others are incredibly different, being able to find the right one for you can be a daunting task. Many traders when starting out will decide to jump between a number of different strategies trying to find what works for you, there is nothing wrong with this. However, doing it too much and not giving each strategy enough time will mean that you will pretty much never find the strategy that works for you. There are a lot of reasons why a strategy may not work for you, it may require more money than you have, it may require higher leverages than your account has, you need to make sure that it matches what you have, which can be quite hard to find.

The other issue that people often come across is the fact that the most publicised strategies are either quite dangerous ones like the martingale strategy or strategies that have been marketed by so-called trading gurus as a marketing tool in order to try and get more people to sign up for their course. You will want to try and filter out these kinds of strategies, as they are often quite easy to get into and learn, but the results will leave a lot to desire. Do some research and take your time when deciding on your strategy.

Controlling Emotions

Emotions can be a real killer when it comes to trading and they have caused a lot of people to blow their accounts. There are two main emotions that are the most important to try and control, there is greed and there is overconfidence. They often come from completely different things, greed from wanting more, and overconfidence from thinking that they know the markets and each decision that they make is simply right, whichever emotion you are feeling, you will want to try and suppress them and to not allow them to take over your trading.

This is of course much easier said than done, both of those emotions are incredibly powerful and can really affect your trading. Those that fall for greed will start to put on additional trades and larger, riskier trades than you would normally put on. People who are overconfident will start to put on trades without putting in the proper amount of analysis that your strategy normally demands, you may also start to put on larger trades which can add to the risk that your account is under. 

It is not an easy thing to control those emotions either, the powerful ones, but it is important that you work out some things that you can do in order to help you get past them. Knowing what coping methods work for you is important, it may be as simple as getting out of the house for a few minutes, doing some online shopping, or talking to someone, whatever works for you, be sure that you are able to do it should you feel any of these emotions start to come up, just do not let them influence your trading, that will only lead to increased risks and the potential loss of your account.

Staying Motivated After Losses

Losses are not great, they make us feel a little crap and a little demotivated, they can even make us want to quit entirely, especially if they come after a lot of preparatory work. We need to have a way to keep ourselves motivated though. All traders, and we mean all traders will experience losses. In fact, some of the most successful traders of all time had losing months at the start. They still probably do, but the reason that they are successful is that they were able to motivate themselves afterward in order to keep going. Each loss should be a learning experience, learn from what you did wrong, motivate yourself to try again with your new-found knowledge and the results should be better. You need to remember that while losses can make us feel bad, they are just a stepping stone to better trading, so do not feel disheartened and try and push yourself to move on, do not let the loss start to make you doubt or even worse, do not let the emotions take over your trading, this will add risk and potentially further losses.

Being Consistent

One of the hardest things to do in trading and forex is to be consistent, if we could all do it then we would all be rich by now. Many many traders have had a profitable month, which is great, but that is no guarantee that their next one or the one after that will be profitable and that is where things start to fall apart. Your strategy may work really well, but then when the condition of the market begins to change, your strategy may not be quite as effective as it was before. Without adapting it to the new market conditions, you will end up with a loss and your results and profitability will not be as consistent.

In order to remain consistent, you need to be able to adapt your strategy or to have multiple strategies available to you that you can jump between. That is however a lot of work and many people who have just had a profitable week or month will simply want to stick with that as it works, but as we discussed above, this will only lead to added risks when the markets do decide to change. Consistency is great. It just so happens to be one of the hardest things to be when it comes to forex and trading.

So those are some of the more difficult things when it comes to forex and trading, trading forex as a whole is pretty difficult, but if you are able to get around some of the things mentioned above then you will be in a good position for the future. Do not be hard on yourself if you fail at times, that is part of the learning process. Instead, use those losses and mistakes as a learning experience, that is what will allow you to get past them and to become a better trader.

Categories
Forex Market Analysis

Daily F.X. Analysis, November 17 – Top Trade Setups In Forex – Retail Sales in Focus! 

TheThe eyes will remain on the retail sales, Capacity Utilization Rate, and Industrial Production from the United States on the news side on the news side. Retail sales are expected to drop, and they may place bearish pressure on the U.S. dollar. At the same time, the Capacity Utilization Rate and Industrial Production are expected to perform better.

Economic Events to Watch Today  


EUR/USD – Daily Analysis

The EUR/USD pair was closed at 1.18537 after placing a high of 1.18686 and a low of 1.18139. EUR/USD pair remained on positive foot for the 3rd consecutive day and posted gains on Monday. In the early trading session, risk sentiment started to dominate financial markets after Moderna announced that its COVID vaccine candidate showed 94.5% effectiveness in the latest trials. However, the single currency Euro found it hard to take advantage of the improved market mood since the European Central Bank made it clear that they will act in the upcoming December meeting.

While speaking at an event on Monday, the European Central Bank and policymaker Pablo Hernandez de Cos said that foreign exchange moves between the USD and the EUR had reached a concerning phase. De Cos further said that the monetary aid should be increased to avoid market destruction, given the worsening outlook for economic activity and inflation.

These comments from ECB policymaker, along with the hopes for further easing from ECB next month, exerted high pressure on the single currency that capped further gains in EUR/USD pair on Monday. However, the currency pair remained positive for the day, even though the European economy was hit hard by the coronavirus pandemic.

According to Johns Hopkins University, more than 54 million people had been infected by COVID-19 globally. In Europe, governments scrambled amid an alarming rise in numbers as France’s health authorities reported 9406 new cases on Monday. Germany postponed its decision on further lockdown measures until next week.

The German Chancellor Angela Merkel said that she wanted to impose further restrictions immediately, but she did not have a majority, so the decision was postponed until November 25. The tightening of lockdown measures was something nobody wanted, and that helped the single currency Euro and supported it. Meanwhile, Sweden placed a nationwide limit of eight people for all gatherings to slow down coronavirus spread. The limit will take effect from November 24 and will last for four weeks.

Despite all these tensions regarding the coronavirus pandemic, the single currency Euro struggled to hold near its best levels against its rival, the U.S. dollar, on Monday. The higher market sentiment also supported Euro amid the coronavirus vaccine news.

On the data front, the Empire State Manufacturing Index for November declined to 6.3 against the forecasted 13.8 and weighed on the U.S. dollar that added gains in EUR/USD pair on Monday. Other than macroeconomic data, the U.S. dollar was already weak in the market due to the rising number of coronavirus cases in the U.S. The weak U.S. dollar added further to the upward movement of the EUR/USD pair.

Daily   Technical Levels

Support Resistance

1.1821      1.1877

1.1789      1.1901

1.1765      1.1932

Pivot point: 1.1845

EUR/USD– Trading Tip

The EUR/USD is trading sideways, holding mostly below the double top resistance level of 1.1860 level. Still, recently it has formed a Doji pattern followed by bullish candles, suggesting that the buyers are exhausted, and sellers may enter into the market soon. Therefore, we can expect the EUR/USD price to trade bearish until the 1.1838 level, the support level extended by an upward trendline on the hourly timeframe. Bullish crossover of 1.1865 level can also trigger buying until 1.1910.


GBP/USD – Daily Analysis

The GBP/USD pair was closed at 1.31999 after placing a high of 1.32422 and a low of 1.31654. The British Pound was high on Monday as the Brexit talks were resumed between the E.U. and the U.K.

There were increasing signs that little progress could be made in this week’s trade talks. The Brexit optimism with the resumed trade talks drove the British Pound higher on Monday that ultimately pushed the GBP/USD pair on the upside.

However, the pair failed to remain there for long as some investors started giving warning that a deal between the E.U. and the U.K. was unlikely this week in the wake of turmoil in the U.K. government. The two of Prime Minister Boris Johnson’s pro-Brexit advisors, Cummings and Cain, were ousted last week. Moreover, the prospects of failure to reach a deal were fading away with the hopes that if an agreement would not be reached, the deadline could stretch into the final weeks before the end of the transition period on December 31.

The negotiations are potentially stretching into December as the deadline of November 19 was close, and the differences in both sides were larger. Ireland’s foreign minister initially warned that a deal f this size is difficult to reach within a week or ten days, although the talks could continue for a further two weeks. The Brexit deal has left to solve 3 key sticking points, including the level playing field, governance, and fisheries. The control over fisheries has been highlighted as one of the main hindrances, as French President Emmanuel Macron has been reluctant to give Britain’s demand for full sovereignty over access to its waters amid concerns French fishers could lose out.

However, the GBP/USD pair posted gains as the UK PM Boris Johnson’s office said in a statement that they were confident that the U.K. would prosper if they fail to reach a trade deal with the E.U. Apart from Brexit, the GBP/USD pair’s gains were lost a bit after the UK PM Johnson self-isolated himself after having close contact with a coronavirus case despite without symptoms and being well. Johnson has already contracted coronavirus case back in April.

The number of coronavirus cases in the U.K. stayed above 20,000 per day despite the ongoing restrictive measures. Meanwhile, a medical adviser in the U.K. said that the government would have to consider strengthening the three-tier system of restrictions used to control coronavirus spread when the full lockdown in England ends. These tensions kept the GBP/USD pair under pressure on Monday and kept the gains limited.

Meanwhile, a U.S. drugmaker Moderna also announced that its vaccine was proven 94.5% effective in preventing the coronavirus that raised risk sentiment in the market and supported the risk perceived British Pound and added in the gains of GBP/USD pair on Monday. Furthermore, Britain reported that it had secured about five million doses of an experimental coronavirus vaccine developed by Moderna after reporting positive trial results. The health minister Matt Hancock from the U.K. said that the earliest doses are expected for delivery in Spring.

On the data front, the Rightmove HPI from Great Britain was released on Monday at 05:01 GMT, which came in as -0.5% in November against October’s 1.1%. From the U.S. side, the Empire State Manufacturing Index was declined to 6.3 against the forecasted 13.8 and weighed on the U.S. dollar and added strength to GBP/USD pair on Monday.

Daily   Technical Levels

Support Resistance

1.3155      1.3236

1.3118      1.3280

1.3073      1.3317

Pivot point: 1.3199

GBP/USD– Trading Tip

The GBP/USD pair is trading at 1.3208 level, holding over 1.3189 level, which is extended by an upward trendline on a 2-hour timeframe. The Cable has recently crossed over the resistance level of the 1.3185 resistance level as the candle’s closing above this level may drive further upward movement in the market. The MACD and RSI support buying trend, and considering the trendline support and oversold indicators, it is worth giving a buy shot to GBP/USD pair. Let’s consider buying over 1.3160 level today. 


USD/JPY – Daily Analysis

The USD/JPY pair was closed at 104.565 after placing a high of 105.135 and a low of 104.361. The pair followed its previous day’s bearish trend and dropped for 3rd consecutive day on Monday. The USD/JPY pair surged to its previous daily high level on Monday in early trading hours after the news from another drug maker came in about their vaccine’s efficiency. The Moderna reported that its vaccine’s last stage clinical trials were 94.5% effective. After this news, Moderna became the second company to announce its results from last stage clinical trials.

This news raised the risk sentiment in the market and weighed on the safe-haven Japanese Yen that kept the USD/JPY pair higher at the beginning of the Asian session. However, the gains started to fade as the market participant realized the difficulty of vaccine availability and its usage. The vaccine requires -70C temperature to be stored to be transported, that is not an easy task. Furthermore, there was also a lack of information regarding the time duration for the immunity induced through the vaccine. This can only be ascertained after the vaccine becomes available to the general public for usage.

These uncertainties raised the market’s safe-haven status and supported the Japanese Yen that ultimately weighed on the USD/JPY pair and forced it to lose some of its earlier daily gains. Meanwhile, on the U.S. front, the U.S. dollar was also weak on the day as the rising number of coronavirus cases raised fears for further restrictions and raised the hopes for further stimulus aid from the government.

The global cases of coronavirus reached 54 million, out of which 11 million were reported from the United States, according to the Johns Hopkins University. The rising number of coronavirus in the United States raised hopes that the Fed will announce further easing or a larger monetary aid to support the economy after the victory of Joe Biden in the U.S. presidential election this month.

Biden always favors a larger stimulus package to provide strength to the economy through the coronavirus crisis. With him becoming the U.S. 46th President, the chances for a massive stimulus bill for the U.S. economy have increased, which started to weigh on the U.S. dollar and ultimately dragged the USD/JPY pair’s prices on the downside.

On the data front, the Prelim GDP Price Index from Japan was released at 04:50 GMT that raised to 1.1% in the 3rd quarter against the expected 1.0% and supported the Japanese Yen that ultimately added further losses in the USD.JPY pair on Monday. The Prelim GDP for the 3rd Quarter from Japan also raised to 5.0% against the projected 4.4% and supported the Japanese Yen that dragged the USD.JPY pair on the downside. On the U.S. front, the Empire State Manufacturing Index in November dropped to 6.3 from the projected 13.8 and weighed on the U.S. dollar that dragged the USD/JPY pair further on the downside.

Daily   Technical Levels

Support Resistance

104.24      105.02

103.91      105.47

103.46      105.81

Pivot point: 104.69

USD/JPY – Trading Tips

The USD/JPY is with a bearish bias at the 104.400 level, falling from the 104.850 support area. On the lower side, the USD/JPY pair is likely to find support at the 104.141 level, and violation of this level can also extend further selling boas until 103.500. On the higher side, the USD/JPY safe-haven pair may find resistance at 104.845 and may help us capture a selling trades below this level as the MACD and RSI support the selling trend today. Good luck! 

Categories
Forex Fundamental Analysis

The Impact Of The ‘US Redbook’ News Release On The Forex Market

Introduction

The growth in any economy is primarily driven by the growth of retail sales to households. For this reason, monitoring retail sales data can be the most suitable way of gauging if the economy is expanding or not. In most national retail sales data, the data is collected through surveys. However, having an index solely based on the growth of same-store sales can help provide a more accurate sense of growth in the retail industry.

Understanding US Redbook

Redbook Research Inc. is an American company primarily dealing with market research on the momentum of retail sales, macro and quantitative analysis, and consumer demand factors in public and private retail sectors. The company publishes the Johnson Redbook Retail Sales Index, also known as the US Redbook, which is considered one of the most respected proprietary indicators on retail sales in the US.

The Redbook index measures the growth in the US retail sector. The index uses a sales-weighted of the year-over-year growth in sales of the same store. About 9000 large general merchandise stores primarily operating in the US retail sector are sampled. When these sampled stores’ monetary value is measured, their combined output accounts for about 80% of the national retail sales. Note that in the US, the official government retail sales data is compiled and released by the Department of Commerce.

The Redbook index is published weekly. In this publication, the report extensively analyses and explains the current trends in retail sales and the economy. Since households’ demand is highly elastic, the weekly US Redbook publication can capture the most recent trends in consumer demand. Thus, the Johnson Redbook Retail Sales Index provides advance data on the trends in retail sales in the US.

In this report, the comprehensive analysis covers the sales in the current month, the quarterly sales, year-on-year and annual sales, company rankings, and data on historical sales. The 9000 retailers are categorized into; Apparel Specialty, Sporting Goods, Home Improvement, Home Furnishings, Books, Toy & Hobby, Department, Discount, Footwear, Furniture, Drug, Electronic, Jewellery, and Miscellaneous.

Using US Redbook in Analysis

We have already established that the US Redbook’s retail index provides a comprehensive and advance trend in household consumption patterns.

When the weekly US Redbook retail index increases, it means that households’ consumption is on the rise. At its core, higher levels of consumption are driven by increased disposable income in the economy. An increase in household consumption means that there is a general increase in demand in the economy. When households’ demand increases, it could mean that the economy’s unemployment levels have reduced. Since more people are gainfully employed, there is increased disposable income for households, hence the increase in consumption represented by the rise in the Redbook index. Similarly, it could also mean that wages received by households are increasing, which increases disposable income.

Conversely, when the weekly Redbook retail index drops, it means that households have reduced disposable income. The reduction in disposable income could directly result from increasing levels of unemployment or a reduction in wages received by households. With less disposable income, people will be forced to cut back on their consumption. In both these cases, the US Redbook retail index increase implies that the economy is expanding; conversely, a drop in the index shows that the economy is contracting.

Source: Trading Economics

The US Redbook retail index can also be used as a precursor to economic recessions and recoveries. We already know that the majority of growth in the economy is driven by consumer demand. It is estimated that household consumption accounts for up to 70% of economic growth. Now, picture this. When the consumer demand is consistently dropping, suffice to say the GDP should also be expected to drop significantly. This period will be marked by a reduction in production and increased unemployment levels. Note that recession is described as a consistent drop in GDP for two successive quarters.

Source: St. Louis FRED

At the onset of the 2020 coronavirus pandemic, the weekly US Redbook retail index continuously dropped. From the period between March to May, the index dropped steadily. This period coincided with a drop in the US GDP. Due to the nationwide imposed lockdowns and social distancing rules, unemployment surged to historic highs of 14.7%. Naturally, demand in the economy was depressed.

In times of recessions, the US Redbook retail index can be handy in changes in household consumption. Policymakers can implement several expansionary policies meant to stimulate the economy. Since the official government retail sales data is published monthly, the US Redbook can be used to show any immediate response by households. The US Redbook index can therefore be used to show if the expansionary policies are working as they are expected to. One such instance can be seen after the US government implemented the 2020 stimulus package worth $2 trillion. The US Redbook retail index can be seen to be rising from the lowest points of May 2020.

Impact of US Redbook on USD

When the US Redbook retail index increases, we can expect the USD to appreciate relative to other currencies in the Forex market. A consistently rising index implies that the economy is steadily expanding, the unemployment rate is falling, and there is a general increase in money in the economy. In such a situation, governments and central banks might step in with contractionary fiscal and monetary policies. These policies are meant to prevent the economy from overheating and avoid unsustainable inflation levels due to the increase in the money supply. Such policies make domestic currency appreciate.

Conversely, a dropping US Redbook retail index shows that the general economy might be contracting. Consequently, expansionary fiscal and monetary policies like lowering interest rates might be implemented to stimulate the economy. Such policies make the domestic depreciate relative to others.

Sources of Data

Redbook Research Inc. published the weekly, monthly, and annual US Redbook Retail Sales Index. In-depth and historical data on the US Redbook Index is available at Trading Economics.

How US Redbook Index Release Affects The Forex Price Charts

Redbook Research Inc. published Retail Sales Index the latest data on October 20, 2020, at 8.55 AM EST. The news release can be accessed at Investing.com. This release is expected to have a low impact on the USD.

The MoM index increased by 1.0% in the latest publication compared to 0.4% in the previous reading. Similarly, the YoY index showed an increase of 2.5% compared to the previous 1.2%.

Let’s find out if this release has an impact on the USD.

EUR/USD: Before US Redbook Release on October 20, 2020, just before 8.55 AM EST

Before the release of the US Redbook data, the EUR/USD pair was trading in an almost neutral trend. The 20-period MA is seen to be flattening with candles forming just around it.

EUR/USD: After US Redbook Release on October 20, 2020, at 8.55 AM EST

The EUR/USD pair formed a 5-minute bearish candle immediately after the publication of the US Redbook report. Subsequently, the pair continued trading in the earlier observed subdued uptrend.

Bottom Line

This article has established that the US Redbook report is a crucial leading indicator of retail sales and consumer demand. However, in the forex market, its significance is diminished since most traders pay close attention to the US Department of Commerce’s monthly retail sales data.

Categories
Forex Assets

Exploring The Costs Involved While Trading The AUD/HUF Forex Exotic Pair

Introduction

The AUD/HUF pair is an exotic forex pair with the AUD representing the Australian Dollar and the HUF representing the Hungarian Forint. When trading in such an exotic currency pair, forex traders should anticipate higher volatility. The base currency in this pair is the AUD, while the HUF is the quote currency. Hence, the exchange rate of the AUD/HUF represents the amount of HUF that a single AUD can purchase. If the exchange rate of AUD/HUF is 221.51, it means that you can buy 221.51 HUF using 1 AUD.

AUD/HUF Specification

Spread

One of the ways forex brokers earn their revenue is through the spread. This is the difference in value between the price they sell a currency pair to you and the price at which they buy the same pair from you.

The spread for the AUD/HUF pair is – ECN: 22 pips | STP: 27 pips

Fees

For traders with the ECN account, they get charged a fee for opening positions. Note that not all brokers charge this commission. Forex brokers do not charge a fee on STP accounts.

Slippage

Every forex broker has different execution speeds. In times of high volatility, your order may be executed at a price other than the one you requested. This difference is slippage.

Trading Range in the AUD/HUF Pair

The trading range in forex trading is used to analyse the fluctuation in the price of a currency pair across multiple timeframes. The volatility, as measured with the trading range, is pips from the minimum, average, to the maximum for all timeframes. With this information, you can deduce the most profitable timeframes to trade.

The Procedure to assess Pip Ranges

  1. Add the ATR indicator to your chart
  2. Set the period to 1
  3. Add a 200-period SMA to this indicator
  4. Shrink the chart so you can determine a larger period
  5. Select your desired timeframe
  6. Measure the floor level and set this value as the min
  7. Measure the level of the 200-period SMA and set this as the average
  8. Measure the peak levels and set this as Max.

AUD/HUF Cost as a Percentage of the Trading Range

Now that we’ve established the volatility,  we can proceed to calculate the trading costs incurred when trading these timeframes. The trading cost is expressed as a percentage of total costs to the volatility.

Below are the trading costs of the AUD/HUF pair for both ECN and STP accounts.

ECN Model Account costs

Spread = 22 | Slippage = 2 | Trading fee = 1

Total cost = 25

STP Model Account

Spread = 27 | Slippage = 2 | Trading fee = 0

Total cost = 29

The Ideal Timeframe to Trade  AUD/HUF Pair

From the above analyses, we can see that the trading cost of the AUD/HUF pair decreases with an increase in volatility. Since the volatility also increases with the timeframe, trading the AUD/HUF over longer timeframes incurs lower costs.

Although the lower timeframes have higher trading costs, these costs can be reduced by timing trades when volatility approaches the maximum. Furthermore, slippage costs can be avoided if traders use forex limit order types. With the forex limit orders, trades are executed at precise price points, avoiding the impact of slippage. Let’s look at an example of this using the ECN account.

ECN Account Using Limit Model Account

Total cost = Slippage + Spread + Trading fee

= 0 + 22 + 1 = 23

Notice that the trading costs have been reduced in all timeframes. For example, the highest cost has been lowered from 423.73% to 389.83%.

Categories
Forex Fundamental Analysis

What Is Long Government Bond Auction and What Should You Know About It?

Introduction

Every government must finance its expenditures with a mixture of debt and revenue. Through debts, governments issue a mixture of short-term and long-term debt instruments to the public. When these debt instruments are being issued, they have an interest rate, one which government will pay the debt holders until maturity. For economists and financial market analysts, the interest rate paid can be used to analyze the government’s creditworthiness and the expected rate of inflation.

Understanding Long Term Bond Auction

A bond in finance is a fixed-income asset issued by an entity to borrow money from investors. Investors get to receive a fixed interest depending on the quantity they purchase. This fixed interest, called a coupon,  is usually paid at predetermined intervals until the bond reaches maturity.

Maturity is the duration in which an investor must hold the bond before they can redeem and get their principal back. It is the bond’s maturity that determines whether it is categorized as a short-term or long-term bond.

Long-term bonds are bonds that have maturities of more than one year.

On the other hand, long bonds are bonds with the longest possible maturity that the issuer can issue. For most governments, long bonds usually have a maturity of up to 30 years.

Long bond auction refers to when bond issuers offer the sale of long bonds to the public. It is at these actions where the rate is fixed. This rate is what bondholders will receive for holding the long bonds until maturity.

Bond yield is the return an investor can expect to receive from buying a bond. The bond yield usually comes into consideration when the bond starts trading in the secondary market. We will later see how this yield can be used for analysis.

Here is a list of long government bonds for the developed economies.

  • Austria 10-year bonds
  • The US 30-year bonds
  • Dutch 10-year bonds
  • Portugal 10-year bonds
  • Spain 50-year Obligation
  • France 30-year OAT
  • UK 30-year Treasury Gilts
  • Germany 30-year Bunds
  • Italy 30-year BTPs

The rate attached to these long bonds during auctions can tell us a lot about investor sentiment of these economies.

Using Government Long Bond Auction in Analysis

The rate ascribed to the bond at auction is what bondholders will expect to receive at predetermined intervals until maturity. Comparing this rate with the rates on past auctions, we can form an opinion about the debt situation of the country and the expected rate of inflation by the investors.

For investors, buying a bond is the equivalent of owning an asset that has a predetermined future cash flow. Since it is virtually unheard of for governments to default on interest rate payments or the repayment of principal upon maturity, long government bonds can be said to be risk-free. With this in mind, the only potential risk that bondholder faces is inflation. In fact, inflation has been called the “bond’s worst enemy.”

You see, a rise in inflation means that some percentage will erode the future purchasing power of money. This erosion of the value of future cash flows means that investors must demand a higher interest rate at long bond auctions. At the back of their minds, investors envision that the rate they demand at bond auctions must also include the expected inflation rate. Effectively, higher rates on bonds help mitigate the erosion in purchasing power of their future cash flows.

Source: St. Louis FRED

At the auction, the bond buyers would feel the need to bid for higher rates if they believe that the rate of inflation will remain relatively stable. In this scenario, they can be assured that the purchasing power of their expected cash flows won’t be eroded. So, what does long bind auction tell us about inflation? The rate at an auction will increase compared to the previous auction if investors believe that future inflation will rise. Conversely, the rate at the auction will decrease when investors hold the conviction that future inflation will remain relatively stable.

The other way government long bond auction can be used for analysis is by using the bond yield. For most economists and financial analysts, the yield is the most closely monitored aspect of a bond. The reason for this is because bond yield offers broad information about a country’s debt situation. Here’s the formula for calculation the bond yield.

Let’s use some simple calculations to illustrate how this works.

Say when the bond is being issued, it has a price of $1000 with an annual coupon payment of $50. Remember that the coupon payments are fixed and cannot change; investors can expect to receive this $50 until maturity.

In this case, the bond yield is 50/1000 * 100 = 5%

Now, imagine that the economic situation of a country is worsening, and it becomes increasingly indebted. In this case, the price of the bond will decrease, let’s say to $900, which means that the yield on the bond increases to 5.56%. Conversely, if the country’s economic performance improves, the bond prices will increase, meaning that the yield will fall. In our example, if the price increased to $1050, the yield will decrease to 4.76%.

Impact of Government Long Bond Auction on Currency

Using the yield on the long government bonds published during an auction, we can determine the economic performance. Therefore, when the yield increases, it means that economic performance in the country is worsening. To forex traders, this can be taken as a deep-seated economic contraction, which will make the domestic currency depreciate relative to others. On the other hand, if the yield falls during an auction, it could be considered a sign of economic prosperity. In this case, the domestic currency will appreciate.

Sources of Data

Globally, the central banks are responsible for auctioning long government bonds. Trading Economics has an exhaustive list of global government bonds and their yields. The United States Department of the Treasury, through TreasuryDirect, publishes the data on the US bond auctions.

How Government Long Bond Auction Affects The Forex Price Charts

The recent auction of the US 30-Year Bond was on October 8, 2020, at 1.00 PM EST and accessed at Investing.com. Low volatility is expected upon the release of the auction date.

In the October 8, 2020, auction, the yield on the US 30-year bond auction was 1.578% higher than the 1.473% of the previous auction.

Let’s see if this auction impacted the USD.

EUR/USD: Before Government Long Bond Auction on October 8, 2020, 
just before 1.00 PM EST

The EUR/USD pair was trading in a steady uptrend before releasing the US 30-Year Bond Auction yield. The 20-period MA can be seen rising with candles forming above it.

EUR/USD: After Government Long Bond Auction on October 8, 2020, at 1.00 PM EST

The pair formed a 5-minute bearish “hammer” candle immediately after the publication of the US 30-year bond yield. Subsequently, the pair traded in a subdued uptrend. The release of the data had no impact on the USD.

The auction of long government bonds serves a vital role in the economy. However, as we have observed in the above analyses, their impact on the forex market is not significant.

Categories
Forex Assets

Costs Involved While Trading The AUD/PHP Forex Exotic Pair

Introduction

In this exotic forex pair, the AUD is the Australian Dollar, and the PHP is the Philippine Peso. Note that trading with such exotic pairs is accompanied by periods of high volatility compared to major forex pairs. The AUD is the base currency, while the PHP is the quote currency. Therefore, in forex trading, the price of the AUD/PHP represents the amount of PHP you can purchase using 1AUD. Say that the price of AUD/PHP is 34.057. It means that with 1 AUD, you can buy 34.057 PHP.

AUD/PHP Specification

Spread

In the forex market, when going long, you buy a currency pair from the broker at a “bid” price. When you go short, you sell the currency pair to the broker at the “ask” price. The difference between the two prices is the spread.

The spread for the AUD/PHP pair is – ECN: 10 pips | STP: 15 pips

Fees

Forex traders using ECN type accounts get charged a trading fee by their brokers depending on the size of their position. STP type accounts rarely attract any trading fees from the brokers.

Slippage

If you have ever opened a trade during periods of increased volatility, you will notice that your order price differs from the execution price. This difference is slippage. It can also be caused when your broker is slow to execute your order.

Trading Range in the AUD/PHP Pair

The trading range refers to the analysis of the fluctuation of a currency pair over various timeframes. With the trading range, we can determine volatilities from minimum to the maximum across all timeframes. This information will be useful in deciding profitability across these timeframes.

The Procedure to assess Pip Ranges

  1. Add the ATR indicator to your chart
  2. Set the period to 1
  3. Add a 200-period SMA to this indicator
  4. Shrink the chart so you can determine a larger period
  5. Select your desired timeframe
  6. Measure the floor level and set this value as the min
  7. Measure the level of the 200-period SMA and set this as the average
  8. Measure the peak levels and set this as Max.

AUD/PHP Cost as a Percentage of the Trading Range

The percentage of the trading range is when we take the total costs associated with trading a particular pair and express it as a percentage of the volatility. Below are the percentage of the trading range for ECN and STP accounts.

ECN Model Account costs

Spread = 10 | Slippage = 2 | Trading fee = 1

Total cost = 13

STP Model Account

Spread = 15 | Slippage = 2 | Trading fee = 0

Total cost = 17

The Ideal Timeframe to Trade  AUD/PHP Pair

We can observe from the above analyses that longer timeframes produce higher volatilities. More so, as the volatility increases, the trading costs decrease. Therefore, shorter-term traders of the AUD/PHP pair experience higher trading costs than longer-term traders.

However, trading costs can be reduced if traders were to open their positions when the volatility is approaching the maximum. Notice that across all timeframes, the trading costs are lower when volatility changes towards the maximum. Furthermore, using forex limit order types can be used to lower trading costs. Such order types eliminate the slippage costs. Here’s a demonstration.

ECN Account Using Limit Model Account

Total cost = Slippage + Spread + Trading fee

= 0 + 10 + 1 = 11

By getting rid of the slippage costs, we have effectively lowered trading costs across all timeframes.

Categories
Forex Course

174. Summary – Multiple Timeframe Analysis

Introduction  

This lesson is basically an overview of what we have covered so far in the Multiple Timeframe series. Multiple timeframe analysis in forex is observing the price action of a selected currency pair under different timeframes. Most forex brokers will provide you with several timeframes. These timeframes are categorized in minutes from 1-minute timeframe to 30-minute timeframe, hourly timeframes from 1-hour timeframe to 12-hour timeframe, the daily timeframe, weekly timeframe, and the 1-month timeframe.

Everything we learned so far!

As we discussed in our first lesson, multiple timeframe analysis involves using at least three timeframes to make a trade. A longer timeframe is used to establish the dominant market trend. Depending on your forex trading style, this dominant trend is used as the prevailing primary trend to anchor your trades. The rationale behind using the longer timeframe to establish the primary trend is because longer timeframes take long to be formed and are not susceptible to the micro fluctuations in price.

The dominant trend is broken down using a medium timeframe to establish the magnitude of the trend. Finally, a shorter timeframe is used as a trigger timeframe by finding the best points to enter and exit a trade. The most common technique of trading multiple timeframes in the forex market is trading three timeframes.

Trading multiple timeframes in forex, therefore, means using multiple timeframe analysis to inform your trading decision. The choice of timeframes used in your analysis entirely depends on the type of forex trader you are.

The table below summarises the type of forex trader and the preferred timeframes.

Note that the above table is merely a guideline. We recommend selecting your desired timeframes for analysis based on your trading style and comfort of analysis. Therefore, the best timeframes to trade in forex will depend on factors such as market volatility and your trading style.

Some of the importance of multiple timeframe analysis in forex include:

  • The ability to determine the magnitude and significance of economic indicators;
  • Identifying support and resistance levels which aid to execute various forex orders and in setting ‘take profit’ and ‘stop-loss’ levels;
  • Helps to identify market trends and their magnitude at a glance quickly; and
  • Helps in forex forecasting by eliminating the lagging effects of most technical forex indicators.
[wp_quiz id=”89204″]
Categories
Forex Fundamental Analysis

The Impact Of ‘Machinery Orders’ Fundamental Indicator News Release On The Forex Market

Introduction

Industrial and manufacturing productions are one of the pillars of any economy. Whenever policies are implemented, governments tend to focus on ways to improve or increase production in the country. The main significance of manufacturing and industrial production is that they create employment opportunities in the local economy and ensure value addition to domestic products, making them competitive in the international markets. Furthermore, they contribute majorly towards technological advancements, which is why data on machinery orders is vital.

Understanding Machinery Orders

As an economic indicator, machinery orders measures the change in the total value of new orders placed with machine manufacturers, excluding ships and utilities.

The data on machinery orders are categorized into orders by; the private sector, the manufacturing sector, governments, overseas orders, and orders made through agencies. All these orders exclude volatile orders from power companies and those of ships.

Source: Cabinet Office, Government of Japan

The machinery orders by electric companies and that of ships are considered too volatile. This volatility is thanks to the fact that ships and the machinery used by electric companies are extremely expensive. Furthermore, these orders usually are placed once over long periods. Therefore, including these orders might unfairly distort the value of the machinery orders data.

To get a clear picture of what machinery, in this case, means, here are some of the components that are included in the machinery orders data. They are metal cutting machines, rolling machines, boilers, power units, electronic and communication equipment, motor vehicles, and aircraft.

Machinery orders from the government are categorized into; transport, communication, ministry of defence, and national and local government orders.

In the industrial sector, machinery orders are categorized by the manufacturing and nonmanufacturing sectors. The nonmanufacturing orders include agriculture, forestry, fishing, construction, electric supply, real estate, finance and insurance, and transportation. Some of the categories of orders in the manufacturing sector include; food and beverages, textile, chemical and chemical production, electrical and telecommunication machinery, and shipbuilding.

Using Machinery Orders for Analysis

By now, you already understand that machinery orders data encompass every aspect of the economy. It ranges from domestic government orders, agriculture, manufacturing and production, services delivery, and even foreign orders. As a result, the monthly machinery orders data can offer a treasure of information not only about the domestic economy but also foreign economies as well.

Source: Cabinet Office, Government of Japan

When companies invest in new machinery, it is considered a capital investment. Capital expenditure is usually considered whenever there is an anticipation of increased demands and services provided by the company. In this case, companies must scale up their operations to increase supply to match the increased demand. In the general economy, an increase in aggregate demand can result from increased money supply in the economy. Thus, it can be taken as a sign that unemployment levels in the economy have reduced or that households are receiving higher wages. Both of these factors can be attributed to an expanding economy.

Note that machinery, in this case, means heavy-duty machinery. Typically, these types of machinery take long in the production and assembly lines. At times, orders have to be placed weeks or months in advance. Therefore, the machinery delivered now may have possibly taken months in the assembly line. When the machinery orders increase, we can deduce that these machinery producers and assembly plants have to employ more labor.

Consequently, an increase in machinery orders means that unemployment levels will reduce. In turn, households’ welfare will improve, and aggregate demand for consumer products will rise. In the end, discretionary consumer industries will also flourish. A decrease in the machinery orders will tend to have the opposite effect.

Suffice to say, the machinery in question here are not cheap. Most companies finance their capital expenditure using lines of credit. Therefore, an increase in machinery orders could imply the availability of cheap credit in the economy. Access to cheap financing by companies and households stimulates the economy by increasing consumption and investments. As a result, the increased aggregate demand leads to an increase in the GDP and expansion of the economy.

Machinery orders data can also be used as an indicator of the economic cycles and to predict upcoming recessions and economic recoveries. When firms anticipate that the economy will go through a rough patch and demand will fall, they cut back on production. Scaling down operations means that they won’t be ordering any more machinery to be used in the production. Conversely, when companies are optimistic that the economy will rebound from recession or a depression, they will order more machinery to scale up their production in anticipation of the increased demand. Furthermore, when the economy is going through an expansion, the aggregate demand tends to increase rapidly. This rapid increase forces companies to increase their machinery orders to enable them to keep up with the demand.

Impact on Currency

The machinery orders data is vital in showing the current and anticipated state of the economy. For the domestic currency, this information is crucial.

The currency will appreciate when the machinery orders increase. Machinery orders are seen as a leading indicator of industrial and manufacturing production. Therefore, when the orders increase, the economy can anticipate an increase in industrial production. And along with it, a decrease in the level of unemployment. Generally, the increase in machinery orders means that the economy is expanding.

Conversely, when machinery orders are on a continuous decline, it means that businesses expect a more challenging operating environment. They will scale down their operations in anticipation of a decline in the demand for their goods and services. In this scenario, higher levels of unemployment should be expected in the economy. Since the economy is contracting, the domestic currency can be expected to depreciate relative to others.

Sources of Data

In this analysis, we will focus on Japan since one of the world’s leading producers of heavy machinery. The Cabinet Office, Government of Japan, releases the monthly machinery orders data in Japan. Trading Economics publishes in-depth and historical data of the Japanese machinery orders.

How Machinery Orders Data Release Affects The Forex Price Charts

The Cabinet Office, Government of Japan, published the latest machinery orders data on October 12, 2020, at 8.50 AM JST. The release can be accessed at Investing.com. The release of this data is expected to have a low impact on the JPY.

In August 2020, the monthly core machinery orders in Japan increased by 0.2% compared to the 6.3% increase in July 2020. During the same period, the YoY core machinery orders were -15.2% compared to -16.2% in the previous reading. Both the MoM and YoY data were better than analysts’ expectations.

Let’s see how this release impacted the AUD/JPY forex charts.

AUD/JPY: Before the Machinery Orders Data Release on October 12, 2020, 
just before 8.50 AM JST

Before the release of Japan’s machinery orders data, the AUD/JPY pair was trading in a steady downtrend. The 20-period MA was falling with candles forming below it. Fifteen minutes before the news release, the pair formed three bullish 5-minute candles showing that the JPY was weakening against the AUD.

AUD/JPY: After the Machinery Orders Data Release on October 12, 2020, 
at 8.50 AM JST

As expected, the pair AUD/JPY pair formed a long 5-minute bearish candle. Subsequently, the pair traded in a renewed downtrend as the 20-period MA steeply fell with candles forming further below it.

Bottom Line

Although the machinery orders data is a low-impact economic indicator, its release had a significant impact on the forex price action. This is because better than expected data shows that the Japanese economy might be bouncing back from the coronavirus-induced recession.

Categories
Forex Course

173. How To Trade Using Three Different Trading Timeframes?

Introduction

Our previous lesson covered how to use multiple timeframe analysis to find better entry and exit points. Timeframes in forex trading can be categorised into three: long timeframe, intermediate timeframe, and short timeframe. This lesson will illustrate how you can trade with three timeframes depending on the type of forex trader you are.

Depending on your forex trading style, the long timeframe is used to determine the prevailing market trend; the intermediate timeframe used to show the consistency of the observed trend, while the short timeframe used to determine the best entry and exit points for a trade.

Long Timeframes in Forex

The long timeframes are used to establish the prevailing primary trend of a currency pair. Depending on the trading style, the long timeframes in forex ranges from a 30-minute timeframe to a 1-month timeframe.

Day trader long timeframe: 1-hour GBP/USD chart

For a forex day trader, a 1-hour timeframe shows the prevailing and dominant downtrend in the GBP/USD pair. Using this timeframe, you can establish support and resistance levels.

Intermediate timeframes in Forex

These timeframes are used to establish the current market trend. The intermediate timeframe in forex helps you to determine the magnitude of the trend observed with the long timeframe. It is expected to see more price fluctuations when using this timeframe, but the general trend should align with the long timeframe.

Day trader intermediate timeframe: 30-minute GBP/USD chart

As can be seen, the price pullbacks are more visible using the intermediate timeframe. The price fluctuations are more pronounced as you can see how the primary trend observed with the long timeframe is broken down.

Shorter timeframes in Forex

Depending on your forex trading style, the shorter timeframes show the most current and shorter changes in the price movements.

The shorter timeframes are used to determine the best entry and exit points of a trade. With shorter timeframes, you can quickly establish whether the price has reached the support and resistance levels.

Day trader shorter timeframe: 15-minute GBP/USD chart

Using the 15-minute timeframe, the day trader can quickly establish the entry positions for shorting the EUR/USD when the price bounces from the resistance levels.

Trading three timeframes helps you establish the dominant trend, narrow this trend down while determining its magnitude, and finally establish the best entry and exit points.

[wp_quiz id=”89198″]
Categories
Forex Basics

Do You Really Need VPS Service to Trade Forex?

VPS (Virtual Private Server) offers multiple uses for businesses or any user that needs to access their accounts remotely. In the world of Forex trading, VPS is particularly useful for traders that would like to keep their system running without watching the screen constantly or who need to access their accounts remotely. There are several benefits to using VPS:

  • If your broker doesn’t offer mobile or web-based trading platforms, VPS will still allow you to manage the account from a different device.  
  • Many VPS providers offer their own power supply, which will keep your machine running, even if the power goes out. 
  • VPS can offer faster execution and less slippage, thanks to high-priority server upkeep. This reduces losses caused from re-quotes, which can be caused by slower computers or internet connections. 
  • If you use charts, indicators, and other similar programs, VPS will help eliminate the need to reinstall and update settings for all these programs. Instead, you can maintain charts using your VPS connected devices. 

Setting up your VPS Account

First, you’ll need your main desktop or laptop and the remote device you plan on using, which could be a smartphone, tablet, or another laptop. You’ll also need a VPS account and internet connection through your home router. 

  1. The first step is signing up for a VPS account. You’ll be able to create a customized IP address with no need for remembering random letters or numbers. The service should link your hostname to your IP address automatically.
  2. Next, you must configure your router so that you can access your trading account from the remote device. Port-forwarding tools are typically found under the Security section in your Network Settings. Under Device IP, you’ll input the internal IP address from your remote device. 
  3. Windows users will then need to enable the Remote Desktop Connection by clicking System > Services/Maintenance > System > Remote Settings. Choose the option “Allow users to connect remotely to this computer”.
  4. Finally, you’ll need to install any specific software that is required on both your home PC and your remote device. 

Associated Costs

When choosing a VPS provider, you need to ensure that the provided technology is suitable. Windows users need to check for Hyper-V Technology, and OpenVZ is the best option for Linux-based operating systems. You’ll also want a provider with a good uptime record, around 99.99% is great. Once you find an option that fits within these recommendations, then it’s time to start looking at prices. Unfortunately, you usually get what you pay for when it comes to VPS, so it may be best to avoid cheaper companies. Some may offer multiple plans with different monthly costs, so this could be a good option that helps one to avoid paying for things they do not need. You can also possibly save money by subscribing for a longer period. We found a Lite account for $3.73 a month with a 99.99% uptime record, with better, more expensive options as well. This is where you’ll need to do some comparison shopping.

Categories
Forex Basics

Is Forex Trading Taking Over Your Life? Here are the Warning Signs…

Do you find yourself devoting a large amount of time to trading? Believe it or not, spending excessive amounts of time trading isn’t such a bad thing, as long as you avoid burnout. In fact, some of the perks and downsides to trading often enough can even carry on into your everyday life. Just take a look at the following signs to find out if this is happening to you.

You Don’t Spend as Much Time Looking on the Bright Side

Full-time traders actually tend to have more of the “glass is half-empty” mindset, which can cause them to think worst-case scenarios when it comes to making decisions. This is because as a trader, you constantly have to think of what you’re risking and what you’ll lose if the market moves against you so that you can be prepared by setting proper stop losses, etc. Before we even open positions, many of us try to look ahead to check for any factors that might cause things to turn out differently than we expected, so we’re always prepared in case things go horribly wrong. If you spend a lot of time trading, you might find yourself thinking of everything that could go wrong in everyday life as well. Remember, it’s good to be careful and to weigh decisions, but you shouldn’t allow yourself to become too anxious when making life decisions.

You’re More Prone to Overthinking

When you’re trading, there’s so much to consider, from technical and fundamental analysis to microeconomic events, to how much you might lose on the trade you’re entering – it’s enough to make your head spin. Many traders find themselves going back and forth in their minds wondering if they’ve made the right decision to enter trades, thinking of what they could have done differently, how they might have interpreted a piece of information in the wrong way, and so on. As a trader and in everyday life, you might start thinking of every possible scenario for a situation because you become so used to overthinking. If this sounds familiar, try to relax a little and have more confidence in your trading plan, or you might find yourself too anxious to enter trades at all. This leads to a common anxiety-fueled trading problem known as analysis paralysis, but that’s a subject for another time. 

You Have More Realistic Expectations

While our first two signs can cause a negative impact on traders, this one can actually help you out. Many beginners start out with unrealistic expectations about what trading will be like, especially when it comes to the amount of money they will make. The more time you spend online, the more you realize what is and isn’t possible, so you learn to adjust your expectations and you can avoid disappointment. This can also help you understand what to expect from central bank announcements and other news that can affect the market so that you’ll stay calm when others might be panicking. Learning how to look at the bigger picture and mastering the ability to set realistic goals will do you a favor when you’re living your life as well, as you will be better prepared and more likely to avoid disappointment when things don’t go your way. 

You Don’t Beat Yourself Up Over Losses

The world may be divided in many ways, yet we can all agree that losing money is never a good thing. However, it’s something that is bound to happen from time to time if you’re a trader. Have you accepted this fact, or do you find yourself becoming emotional whenever you suffer a loss? More experienced traders understand that losses are inevitable, so they just brush it off and move on. This doesn’t mean you shouldn’t ever feel a little sting when things go wrong, however, learning to manage these emotions will make you a better trader in the long run. Keep in mind that there’s nothing you can do to change the outcome once the money is gone but learning from your mistakes can help you to avoid losing money to the same problem in the future. This applies to whether you lost money trading, gambled it all away in Vegas, or lost it in some other kind of situation. 

You Start Noticing the Spreads on Foreign Exchange Counters in Airports

Prior to starting your trading career, you probably didn’t pay much attention to the foreign exchange counter prices when buying foreign currency in airports. Unfortunately, airports are usually one of the most expensive places to purchase foreign currency because of poor exchange rates and high fees. Once you become an adept trader, you’re far more likely to shake your head at these prices and you might even decide to buy at the bank instead. This is one way that being a trader can help you to make decisions that are more financially savvy, where others just don’t realize that they are practically being robbed by paying such high prices. We all know movie theatre popcorn prices are insane as well – some of us choose to buy there regardless, while others eat beforehand or sneak snacks in with us to avoid it. Still, it’s good to be aware when you’re being charged high prices so that you can decide for yourself whether it’s better to pay there or to look for another option.  

Categories
Forex Market Analysis

Daily F.X. Analysis, November 13 – Top Trade Setups In Forex – CPI, Employment in Focus! 

The eyes will remain on the U.S. Core PPI m/m and the Prelim UoM Consumer Sentiment from the United States on the news side. Both of the events are expected to drive some movement in the U.S. dollar and related currency pairs. During the European session, the French Final CPI m/m, Flash Employment Change q/q, and Flash GDP q/q will remain in highlights as these are coming from European counties; therefore, we can expect support to the Euro pairs.

Economic Events to Watch Today  


EUR/USD – Daily Analysis

The EUR/USD pair was closed at 1.18054 after placing a high of 1.18230 and a low of 1.17584. The currency pair EUR/USD reversed its Wednesday’s movement and raised on Thursday despite coronavirus worsened Europe’s situation. Italy was now expecting to enter a nationwide lockdown due to the increased number of coronavirus cases and curb the virus’s spread that should have caused the EUR/USD pair to continue movement in the downward direction. Still, the pair surged on the back of the weak U.S. dollar.

The U.S. dollar has suffered from risk-on markets sentiment, with investors becoming more optimistic after Pfizer’s 90% effective coronavirus vaccine. The greenback was also weak due to the declining CPI data from the U.S. At 12:00 GMT, the German Final CPI for October came in line with the expectations of 0.1%. At 15:00 GMT, the Industrial Production in September from Eurozone declined to -0.4% against the forecasted 0.6% and weighed on Euro and capped further gains in EUR/USD pair.

At 18:30 GMT, the Consumer Price Index for October fell to 0.0% against the projected 0.1% and weighed on the U.S. dollar and supported the EUR/USD pair’s upward direction. The Core CPI for October also declined to 0.0% from the projected 0.2% and weighed on the U.S. dollar and added further in gains of EUR/USD pair. However, the Unemployment Claims from last week fell to 709K against the projected 730K and supported the U.S. dollar and capped further gains in currency pair EUR/USD pair.

Moreover, the U.S. political uncertainties also continued weighing on the U.S. dollar after the victory of Joe Biden and becoming 46th U.S. President. Donald Trump has failed to concede Biden’s victory and has left the markets uncertain about what could happen next as Trump attempts to challenge the vote. 

Meanwhile, the U.S. dollar was also under pressure because of the rising number of coronavirus infections on Wednesday. The cases increased to 142,000 new cases in a single day, and the hospitalization rate also increased and reached 65,000, the highest during the pandemic. These virus conditions in the U.S. also weighed on the U.S. dollar and supported the upward movement of the EUR/USD pair.

On the other hand, the ECB President Christine Lagarde said that she believes that the region’s monetary authority will move to launch a digital version of the Euro in the next two to four years. Previously, ECB officials disclosed that they were researching a central bank digital currency.

On the virus front, the ECB President, Christine Lagarde, said that the coronavirus vaccine had reduced the uncertainty and complete lockdown was not the best way to deal with the second wave. These comments from Lagarde also supported the upward movement of the EUR/USD pair on Thursday.

Daily Technical Levels

Support   Resistance

1.1738      1.1827

1.1697      1.1875

1.1648      1.1917

Pivot point: 1.1786

EUR/USD– Trading Tip

The EUR/USD continues to trade sideways at the 1.1804 area, facing immediate support at the 1.1749 level along with resistance at the 1.1835 level. On the further higher side, the violation of the 1.1835 level can extend the buying trend until 1.1907. On the lower side, the support level prevails at 1.1749 and 1.1680 level. The MACD and EMA are also neutral; therefore, we may see selling below the 1.1835 and bullish above the same level today.


GBP/USD – Daily Analysis

The GBP/USD pair was closed at 1.31222 after a high of 1.32281 and a low of 1.31062. The pair GBP/USD continued following its previous day movement and extended its losses on Thursday. On Thursday, the Bank of England Governor said that he hoped a goodwill spirit would prevail between Britain and the European Union countries to smooth over unavoidable trade disruptions after the end of the Brexit transition period on Jan-1st.

Bailey also told a panel discussion with the U.S. Federal Reserve Chair Jerome Powell and European Central bank President Christine Lagarde that he felt very uncomfortable at the huge amount of economic uncertainty created by a coronavirus. On Thursday, Bailey said that he was encouraged by the latest coronavirus vaccine developments, which reduce economic uncertainty.

He also said that the trade talks were continuing between Britain and the European Union, but he could not judge the outcome. He said that he hoped that if there will be a trade agreement, there will be a goodwill spirit. However, he also told the panel Britain’sain’s financial sector was ready for the end of transition periods irrespective of a deal and was better prepared than the rest of the economic sectors. Bailey’s comments raised concerns in the market sentiment and kept the British Pound under pressure that left the GBP/USD pair on the downside.

On the data front, at 05:01 GMT, the RICS House Price Balance from the U.K. for October raised to 68% from the forecasted 54% and supported GBP. At 12:00 GMT, the Prelim GDP for the 3rd Quarter declined to 15.5% against the expected 15.8% and weighed on British Pound and added in the losses of GBP/USD pair. For September, the U.K.’s Construction Output raised to 2.9% against the forecasted 2.1% and supported British Pound. The GDP for September from the U.K. also declined to 1.1% against the estimated 1.5% and weighed on British Pound and further supported the GBP/USD pair’s losses.

The Goods Trade Balance came in as expected -9.3B. The Index of Services for the Quarter also declined to 14.2% from the forecasted 14.6% and weighed on British Pound and added losses in currency pair. The Industrial Production for September again fell to 0.5% from the estimated 0.9% and weighed on GBP. The Manufacturing Production in September from the U.K. dropped to 0.2% against the projected 0.7% and weighed on GBP. The Prelim Business Investment dropped to 8.8% in September from the projected 14.4% and weighed on local currency Sterling and further pushed the pair on the downside.

From the U.S. side, at 18:30 GMT, the Consumer Price Index for October was dropped to 0.0% against the expected 0.1% and weighed on the U.S. dollar and capped further losses in GBP/USD pair. The Core CPI for October also dropped to 0.0% from the expected 0.2% and weighed on the U.S. dollar. However, the Unemployment Claims from last week fell to 709K against the estimated 730K and supported the U.S. dollar and added losses in GBP/USD pair on Thursday.

Daily Technical Levels

Support   Resistance

1.3170      1.3291

1.3119      1.3361

1.3050      1.3412

Pivot point; 1.3240

GBP/USD– Trading Tip

The GBP/USD pair is trading at 1.3116 level, holding over 1.3110 level, which is extended by an upward trendline on a 2-hour timeframe. The Cable has recently completed 38.2% Fibonacci retracement, and now it’s holding above the double bottom support level of 1.3110 level. On the higher side, the pair may surge until the resistance level of 1.3190 level. The MACD and RSI support selling trend, but considering the trendline support and oversold indicators, it is worth giving a buy shot to GBP/USD pair. Let’s consider buying over 1.3110 level today. 


USD/JPY – Daily Analysis

The USD/JPY pair was closed at 105.121 after placing a high of 105.476 and a low of 105.068. The pair USD/JPY reversed its direction and started falling on Thursday amid the broad-based US dollar weakness. The decreased risk sentiment due to the escalated second wave of the coronavirus in the United States weighed on the USD/JPY pair on Thursday. The investors started to fear that governments might respond by imposing the lockdown restrictions that will slow down the economic recovery.

The United States reported about 140,453 cases on a single day on Wednesday, and it was the ninth straight day of above 100,000 cases. According to Johns Hopkins University, about 10.4 million Americans have been infected by the coronavirus so far, and nearly 242,000 have died from it. These concerns raised the safe-haven appeal and supported the Japanese Yen that ultimately weighed on the USD/JPY pair on Thursday.

On the data front, at 04:50 GMT, the Core Machinery Orders from Japan for September came in as -4.4% against the expected -1.1% and weighed on the Japanese Yen. The Purchasing Price Index (PPI) from Japan remained flat with the expectations of -2.1% for the year. At 09:30 GMT, the Tertiary Industry Activity for September raised to 1.8% against the anticipated 1.3% and supported the Japanese Yen and weighed on the USD/JPY pair.

From the US side, at 18:30 GMT, the Consumer Price Index for October was dropped to 0.0% against the anticipated 0.1% and weighed on the US dollar and dragged the pair USD/JPY on the downside. The Core CPI for October also dropped to 0.0% from the anticipated 0.2% and weighed on the US dollar and added further in the USD/JPY pair’s losses. However, the Unemployment Claims from last week were declined to 709K against the anticipated 730K and supported the US dollar that capped further losses in the USD/JPY pair.

Meanwhile, on Thursday, the Federal Reserve Chairman Jerome Powell cautioned that the US economy would further need support from Congress and the central bank even if a coronavirus vaccine becomes available by the end of the year. He said that despite the vaccine’s availability, there still will be millions of people left who have lost their job to the pandemic, and they will still struggle to find work as the economy will attempt to recover from the economic downturn.

He added that in the Federal Reserve’s eyes, the terrible rise in COVID-19 cases across the country was the “main risk” for the US economy. He added that the coronavirus’s third wave had forced several states to re-impose lockdown restrictions and caused people to lose confidence. He stressed that the economy would not fully recover until people are confident that it was safe to resume activities involving the crowd. These comments from Powell also weighed on the US dollar and added in the losses of the USD/JPY pair on Thursday.


Daily Technical Levels

Support   Resistance

103.82      106.29

102.27      107.21

101.35      108.75

Pivot point: 104.74

USD/JPY – Trading Tips

The USD/JPY is trading sideways between 105.650 – 104.900 level, and violation of this level can extend the selling trend until the next support level of 104.430 mark. Simultaneously, the bullish breakout of the 105.650 level may open further room for buying until the 106.142 level. Overall, the eyes will remain at 104.835 level to trade bearish below this level until 104.435 and 104.175 level today. Good luck! 

Categories
Forex Signals

AUD/USD Maintain Bullish Streak Despite Risk-off Sentiment – Trade Plan!  

Today in the Asian trading session, the AUD/USD currency pair erased some of its earlier gains but still trading on the bullish track and taking rounds just closer to the 0.7250 level, mainly due to the broad-based U.S. dollar weakness. Hence, the broad-based U.S. dollar was being pressured by the doubts persist over the global economic recovery from COVID-19. This, in turn, undermined the greenback and contributed to the currency pair gains. 

On the other hand, the optimism over the coronavirus (COVID-19) vaccine/treatment also lends some minor support to the currency pair by underpinning the perceived risk currency Australian dollar. On the contrary, the intensified clashes between the US-China over the Hong Kong crackdown could be regarded as one of the important factors that might cap further upside momentum for the AUD/USD pair. The AUD/USD pair is currently trading at 0.7237 and consolidating in the range between 0.7228 – 0.7242.

The intensifying market worries regarding the continuous surge in new coronavirus cases in Europe and the United States keep fueling the doubts over the global economic recovery through imposing new lockdown restrictions on economic and social activity, which eventually weighed on the market trading sentiment. As per the recent report, the U.S. coronavirus cases reached a new daily record high, with 140,543 reported. Almost 10.4 million peoples in the U.S. have been infected by the Covid-19 so far. While almost 242,000 have died from this, according to the Johns Hopkins University report. As in result, New York has announced a 10 p.m. curfew on bars, gyms, and restaurants to curb the spread. Afterward, Chicago also followed the footsteps of New York and restricted activities.

In addition to the U.S., Europe also imposed lockdown again last week, threatening the oil outlook and undermining oil prices. It is worth recalling that Sweden declared a partial lockdown shutting down bars and restaurants for the 1st-time since the virus started. Thus, the back to back lockdowns restrictions keep harming the crude oil demand.

Besides the virus woes, the reason for the downbeat market sentiment could also be associated with the long-lasting US-China tussle, which fueled further after the U.S. warned China over the Hong Kong crackdown during the previous day. Apart from this, the Trump administration shows a willingness to limit investments in Chinese companies, fueling the already intensified tussle. 

Despite the risk-off market sentiment, the broad-based U.S. dollar failed to extend its previous day gains. It slipped lower mainly due to the heavy optimism over the potential vaccine for the highly infectious coronavirus disease. Apart from this, coronavirus’s resurgence keeps fueling the fears that the U.S. economic recovery could be halt, which also keeps the USD under pressure. However, the U.S. dollar losses could be considered the major factor that pushes the currency pair higher. Meanwhile, the U.S. Dollar Index that tracks the greenback against a bucket of other currencies dropped to 92.957.

In the absence of the major data/events on the day, the market traders will keep their eyes on the continuous drama surrounding the U.S. stimulus package. In the meantime, the risk catalyst like geopolitics and the virus woes, not to forget the Brexit, will also be key to watch for a fresh direction. 


Daily Support and Resistance

S1 0.7128

S2 0.7186

S3 0.7208

Pivot Point 0.7245

R1 0.7267

R2 0.7304

R3 0.7363

The AUDUSD traded with a bullish bias, but it recently has violated the upward channel at the 0.7245 level. The Aussie has now entered the new region, and it has formed a downward channel on the smaller timeframe now, which is likely to extend resistance at 0.7245 level along with support at 0.7200. A bearish breakout of 0.7200 level can open further room for buying until 0.7122 level. The MACD is also in support of selling; therefore, we should look for selling trades below the 0.7245 level today. Goold luck! 

Categories
Forex Basic Strategies

Apply These Special Techniques to Trade Reverse Splits

In the financial markets and in the stock market, there are different ways in which companies can manipulate their stock prices, including the reverse split of shares. Manipulation is not always bad. Sometimes, a company has legitimate reasons to change the price of its shares. But that’s not the case when what we’re dealing with is a reverse split in the world of penny stocks.

In fact, for me, it is not excessively important if a company manipulates their actions. Splits aren’t always bad, it depends on the company and why it’s doing it. However, I think it is wise to know well what a reverse split means does and why most penny stocks do it. So, let’s dig deeper into the reverse split of actions. We’ll look at some examples and look at whether they’re good or bad.

What is a Reverse Split?

A reverse split happens at the moment that a company decreases its share amount at the same time that increases the price of the same. A company cannot magically increase the price of its shares, this phenomenon is due to reverse split. Therefore, you have to “get rid” of the stocks to increase their price. As you see, they are simple mathematics.

It seems harder than it really is. Technically, the company doesn’t dispose of the stock, it just combines the existing stock. I’ll tell you what it means later. What does a reverse split mean for an investor? We need to keep in mind that traders and investors have different approaches to seeing markets.

Investors hold equity positions for an extended period of time, usually to obtain a slow and steady profit. Traders, on the other hand, enter and exit the positions of relatively fast action, for potentially faster profits. I have no mania for investors, but investing in the fraudulent stock companies I usually operate in is a very risky gamble.

I make this claim because many times, split is mainly applied to penny stocks. A large company with a price of $100 per share will normally not split: the price of its shares is probably already good. Technically, a reverse split means nothing to an investor: consider the keyword “technically”. I’ll talk about whether a reverse split is good or bad for a company’s shareholders in a short time, but first I wish to clarify something else.

Reverse split basically means nothing to an investor because the value of their position in the company does not change. It simply means owning fewer shares at a higher price. Is a reverse split good or bad for shareholders? Just because a reverse split is not significant to an investor doesn’t mean it’s a good thing. In fact, it’s usually bad news. That may sound confusing, so I’ll look at it. I’ve seen toxic companies do reverse splits for over 20 years. And it usually doesn’t end well.

Why? The reasons for the split must be analysed or divided. A large and reputable company with a stock price of $100 per share is probably financially stable. But a penny stock at a price of 50 cents a share probably isn’t as financially stable. In fact, the company may need to raise money through public offerings. But penny stock bids are often toxic and almost always end horribly badly.

Institutional investors do not want to invest in a company with a low share price with tons of negotiable shares, making it difficult for their investment to make money. Therefore, a company can make a reverse split to look more attractive to potential investors. It reduces the number of shares and increases the price, which greatly facilitates public offers. Public offers dilute the company’s shares and make the company less valuable over time. Reverse splits can be a way for a scam company to hide how toxic it is, usually, is a bad sign for the average shareholder.

How does a reverse split work? Let’s look at a super basic example:

Let’s say Company A has a share worth $100. Since the price of your stock is $100 and you only have one share, the company is worth $100. The total value of a company is usually based on the price of its shares and the stock count. This is known as market capitalization, about which you can read more here.

We have Company B with 10 shares, each stock with a price of $10. That company also has a value of $100. Therefore, the two companies have the same economic value., but their stock prices are different. If Company B wants to increase the price of its shares, it could do a reverse split. But this does not increase the value of the company.

It simply means that the company’s share price is higher. So, if Company B wants the price of its stock to be $100 per share, it would merge the existing 10 shares into a single share now worth $100. Of course, a company cannot simply split up. It has to be managed by its investors who have to approve the split.

Impact on the Reverse Split Market

I’m gonna say it again. A reverse split does not affect the valuation of the company. There is no technical impact on the market for a reverse split of shares in terms of the value of the company. By this, we do not mean that affects shareholders in a long term. The market impact of a stock reverse split is that it reduces the number of marketable shares of the company by combining multiple shares into one. This allows a company that decides to do a reverse split only with the intention of doing something nice skewed things.

Companies that do reverse splits have more capacity to participate in toxic financing, which can be extremely bad for shareholders. Again, this is only if the company decides to participate in toxic financing such as offers in the market. The fact that a company carries out a reverse split of shares does not necessarily mean that it will get involved in toxic financing. But from what I’ve seen in the last 20 years, a lot of them do. But unless the company becomes involved in toxic financing, there is no real impact on the market of a reverse split of shares.

Why Companies Do Reverse Splits

The inverse spits are fundamentally a remedy designed for companies to increase the price of their shares and try to attract investors. Sometimes it’s a way for companies to remain listed on a larger stock exchange.

This is another reason why reverse divisions can be bad news for shareholders. But really, if a company is doing a division to stay on the list, it already had clear problems before the division.

An example. A requirement to stay on Nasdaq’s list is that the price of the company’s shares must be above $1. In a letter from the SEC to Accentia Biopharma, (NASDAQ: ABPI) on the price of its shares in 2008: 

“Market Rule 4310(c)(8)(E) states that Nasdaq may, at its discretion, require an issuer to maintain a price of at least $1.00 per share for a period exceeding ten business days in a sequential manner but normally not more than 20 business days in a row, before determining that the issuer has demonstrated a capacity to maintain long-term compliance”

This is part of the warning that the SEC issued to ABPI about keeping the price of its shares above $1 per share. If ABPI did not comply, it would be removed from Nasdaq. It was finally removed from the list. When companies receive such letters, they usually do a reverse split in order to comply with the requirement.

Do you see why reverse divisions are usually bad news for long-term investors? It may indicate the long-term failure of a company to consistently meet the quotation requirements of a major market, which is not good.

Calculator of a Reverse Split

So, you know a little bit more about reverse splits and what they mean, now I want to help you understand and show you what the calculus for the price of recent reverse split shares. It’s actually quite simple. When a company announces that it will do a reverse split, it also has to announce what that division number will be. Here is another theoretical example. The same concept applies to a real action that makes this type of division and we will cover some real examples later.

Let’s say Company A announces a reverse split of 1:10.

This means that 10 shares held by a shareholder-owned before the split, they will now have one.

Now, suppose Company A had a 50-cent share price before the split. To find out the share price after the split, simply multiply the share price by 10. In this case, an inverse division of 1:10 would mean that Company A would then be traded at $5 per share.

Most stock prices will not be so simple: the price obviously will not always be a round number. In addition, each division is different. Some companies only do a reverse split 1:2, while others can do 1:30 or even 1:50.

In any case, just take the last number of the ratio and multiply it by the share price to find the price per share after the split of the company.

Examples of a Reverse Split

Let’s look at some real examples…

Many penny stocks do a reverse split at some point. Not all but many do.

Pro tip: Know how to calculate a reverse split.

Reverse share divisions can influence stock prices after the split.

Again, the division does not change the value of the company, but it may highlight any reasons of interest to the company. The main question right now would be, how can we find information about reverse splits or other relevant news in the stock world? Use a filter like StocksToTrade. Its new Breaking News feature alerts operators to the latest news, such as reverse splits.

Now, let’s look at some examples of reverse splits.

XpresSpa Group, Inc (NASDAQ: XPSA)

The reverse split of this action took place on June 11, 2020. I completely don’t know why XSPA made the decision to make a stock reverse split, and I won’t waste my time researching right now. If the action leaves good news and comes into play, that’s what I really care about.

Sonnet BioTherapeutics Holdings, Inc. (NASDAQ: SONN)

This reverse split of shares occurred on April 2, 2020. It was actually a 1:26 split: 26 actions of action before division became an action after division. That’s a pretty big jump. Think how a few days after the reverse split, the shares had a giant volume and had a massive move of around $16. This is quite common with the reverse split but does not mean that it always happens.

Remember, many fraudulent companies use reverse split as a way to participate in toxic funding. That usually means they will increase the price of their shares to raise money. That is usually clear from the candle on the daily chart. In the case of SONN, it peaked at over $16 the day news came out, before falling below $10. It would not be strange if SONN had released many of his actions in that movement.

Cyclacel Pharmaceuticals, Inc. (NASDAQ: CYCC)

This action was split on April 15, 2020, only a few days before its massive execution to approximately $19 per share. But like SONN, CYCC seems to have been involved in some toxic funding. Watch carefully the candle that corresponds to the day of its execution. The great wick shows how high it arrived before falling to new lows in the day.

Most likely, CYCC had shares it wanted to release, so it released a juicy press release to generate some enthusiasm. This is an added reason why you should not believe the hype that some news has.

It’s okay to operate on these moves, don’t get me wrong. But many of these companies launch news to raise their short-term stock prices. That is why it is advisable to get in and out of these operations quickly.

Categories
Forex Course

172. Using Multiple Timeframe Analysis To Identify Accurate Entries & Exits

Introduction 

At this stage, you are now familiar with how to conduct multiple timeframe analysis for the different type of forex trades. In the previous lesson, we covered why you should look at multiple timeframes when trading forex. Now, let’s narrow down to how you can use multiple timeframe analysis to determine which price levels make the best entry and exit points to match your trading style.

Why is it important? 

Using longer timeframes helps get the bigger picture while the shorter timeframes show you how the dominant trend is constituted. Support and resistance levels are used to determine the best entry and points of a trade. To properly illustrate this, we will use the example of a forex swing trader.

For a forex swing trader, positions are left open from overnight up to a few weeks. Daily timeframes are used to establish the dominant market trend for a currency pair. This timeframe will help you establish long-term support and resistance levels.

Forex Swing Trader Daily Timeframe for EUR/USD Primary Trend

The daily forex timeframe for the EUR/USD shows that the pair is on a downtrend, as evidenced by the lower lows and lower highs. The lowest low from the daily timeframe will enable the forex swing trader to establish the support level. Lower highs are formed when the price of the pair attempts a ‘pull-back.’ These lower highs will be used to set the resistance levels.

Since the dominant trend is downward, the resistance levels will be used as the ‘high swings, ’ which will be the best entry point for a short position. The resistance levels are used since the currency pair’s price is unlikely to break above this level.

Forex Swing Trader EUR/USD 4-hour Trigger Timeframe

To determine the best entry and exit points, as a forex swing trader, you use the 4-hour timeframe. When the 4-hour candles don’t breach the resistance level, you open a short trade and exit when the 4-hour candle touches the support level at the low swing.

This strategy can be adopted for the other type of forex trades.

Using multiple timeframe analysis for different forex orders

With a top-down analysis approach, different types of traders can use multiple timeframe analysis for executing different types of forex orders. Take a forex day trader, for example.

Forex Day Trader 1-hour Primary Trend Timeframe for EUR/USD

After establishing the support and resistance level, the forex day trader can use the resistance level to set the sell limit or the buy stop order. The support level is ideal to set the buy limit or the sell stop orders. The ‘stop-loss’ and ‘take profit’ levels can then be set to exit these trades depending on your risk management measures.

[wp_quiz id=”89182″]
Categories
Forex Signals

AUD/USD Weakens Despite the Intensifying Coronavirus (COVID-19) – Upward Channel Breakout! 

During Thursday early Asian trading session, the AUD/USD currency pair successfully extended its overnight winning streak. It drew some further bids around below 0.7300 level, mainly due to the risk-on market sentiment, which underpins the perceived risk currency Australian dollar and contributes to the currency pair gains. Hence, the market trading sentiment was being supported by optimism over a potential vaccine for the highly infectious coronavirus disease. 

Besides this, the upticks in the equity markets were further bolstered by the updates suggesting continuous progress of Brexit talks between the U.K. and the European Union (E.U.), which extended further support to the currency pair. Across the pond, the broad-based U.S. dollar bearish bias, triggered by the marker risk-on mood, has played its significant role in supporting the currency pair. Furthermore, the greenback declines were further bolstered by the intensifying doubts over the U.S. economic recovery in the wake of the intensified U.S. cases. 

Conversely, the long-lasting coronavirus woes throughout the world and delays in the U.S. covid stimulus package keep challenging the upbeat market sentiment, which becomes the key determinant that deposited the lid on any additional gains in the currency pair. In the meantime, the gains in the currency pair were further capped by the Weaker Aussie data, which showed that the Consumer confidence in Australia declined more than expected in November. The AUD/USD is trading at 0.7284 and consolidating in the range between 0.7275 – 0.7294.

The market trading bias has been sluggish since the day started. Hence, mixed trading could be attributed to the mixed signals concerning the coronavirus (COVID-19) and the global monetary policy moves, not to forget about the U.S. election results. Talking about positive factors, the leading vaccine producers like Pfizer and Moderna keep struggling to find the deadly virus’s best cure. In the meantime, the U.S. infectious disease expert Dr. Anthony Fauci recently boosted coronavirus (COVID-19) vaccine optimism during the latest comments. He noted that the data from a large trial of its experimental COVID-19 vaccine anywhere between “a couple of days” to “a little more than a week.”


Daily Support and Resistance

S1 0.7176

S2 0.723

S3 0.7255

Pivot Point 0.7285

R1 0.7309

R2 0.7339

R3 0.7394

The AUDUSD is trading with a bullish bias at a 0.7303 area, having crossed over an immediate resistance level of 0.7287. At the moment, this level is working as a support for the AUD/USD pair. On the higher side, resistance stays at 0.7341 and 0.7411 level today. Bullish bias seems strong over 0.7287 today. Good luck! 

Categories
Forex Signals

USD/CAD Heading North – Is It a Good time to go long?

Today in the early Asian trading session, the USD/CAD currency pair successfully extended its previous day recovery streak and remained bullish around above the mid-1.3000 level. However, the bullish sentiment around the currency pair could be attributed to the modest downticks in the crude oil prices, which ultimately undermined the demand for the commodity-linked currency the loonie, and contributed to the currency pair gains. On the contrary, the broad-based U.S. dollar weakness, triggered by the multiple factors, has become one of the major factors that kept the lid on any further gains in the currency pair. Currently, the USD/CAD currency pair is currently trading at 1.3067 and consolidating in the range between 1.3054 – 1.3073.

Despite the renewed optimism about a potential treatment/vaccine for the highly infectious virus, the market trading sentiment has ben flashing mixed signals as the coronavirus woes overshadowed vaccine hopes. However, the increasing market worries over the potential economic fallout from the constant rise in new COVID-19 cases keep weighing on the market trading sentiment. As per the latest report, the country keeps reporting record cases daily, more than 100K per day. Essentially all American states are getting a worse status report of the COVID-19, strengthened by record hospitalizations and daily cases rising past-100,000 in the last few days. As in result, New York has declared a 10 p.m. curfew on bars, gyms, and restaurants to curb the spread. It is also worth mentioning that the COVID-19 hospitalizations in the U.S. exceeded 60,000.

On the bullish side of the story, the prevalent optimism over the potential vaccine for the highly infectious coronavirus disease helps the market trading sentiment limit its deeper losses. The leading vaccine producers like Pfizer and Moderna still show progress over the vaccine for the deadly virus. This was witnessed after the U.S. infectious disease expert Dr. Anthony Fauci said that Moderna could begin analyzing vaccine data within days. However, the market trading mood mostly ignored the U.S. official’s another push to keep vaccine optimism high amid surging virus cases and hospitalizations in the U.S.

Despite the risk-off market sentiment, the broad-based U.S. dollar failed to extend its overnight gains. It edged lower on the day, mainly due to the heavy optimism over the potential vaccine for the highly infectious coronavirus disease. Apart from this, coronavirus’s resurgence keeps fueling the fears that the U.S. economic recovery could be halt, which also keeps the greenback under pressure. However, the U.S. dollar losses could be considered the major factor that pushes the currency pair down. Meanwhile, the U.S. Dollar Index that tracks the greenback against a bucket of other currencies dropped to 92.922.

At the crude oil front, the WTI crude oil prices failed to extend its overnight winning streak and remained under some selling pressure on the day. However, the fresh declines in crude oil could be attributed to reports suggesting the next wave of lockdowns throughout the world, which is threatening the crude oil demand once again. Apart from this, the reason for the modest losses in crude oil prices could also be associated with the latest reports suggesting that OPEC’s oil output in October rose by 320,000 BPD in the wake of recovery in Libya’s production. Thus, the pullback in oil prices undermined demand for the commodity-linked currency – the loonie and remained supportive of the USD/CAD pair’s ongoing recovery momentum.

Moving ahead, the market traders will keep their eyes on the U.S. economic calendar, which highlights the latest data concerning U.S. inflation and jobless claims. In the meantime, the Brexit trade talks’ updates could not lose their importance on the day.


Daily Support and Resistance
S1 1.2951
S2 1.3003
S3 1.3032
Pivot Point 1.3055
R1 1.3084
R2 1.3107
R3 1.3158

The USD/CAD is trading with bullish sentiment at 1.3094, facing immediate resistance at 1.3100. Crossing above this level may drive further upward movement until 1.3177 level. On the downside, the USD/CAD may find support at 1.3025, and below this, the next support level stays at 1.2975 level. The MACD is in support of buying; thus, we may look for a buying trade over the 1.3105 level today. Good luck!

Categories
Forex Assets

What Everyone is Saying About Palladium Is Dead Wrong and Here’s Why…

Uncommon sight among brokers’ product offers, palladium is a newcomer in traders opportunity scanners. Even rarer is to see some educational material on key aspects of trading palladium. This article is following the series devoted to precious metal trading for traders that come from forex. The system we have devised follows a structure and can be applied to the precious metals market too, although you would need to be familiar with it as this article is just an add-on.

In the precious metals article, we have talked about the general fundamental and technical adjustments from forex trading so you can refer for more details. Spot palladium or XPD/USD if traded against the US dollar is one of the most lucrative assets counting all the 28 major forex currency pairs, and it has its own price action detached from other markets correlations. We will address the fundamental aspects of palladium and technical facts that can help all traders but understand the principles of supply and demand apply to precious metals more than in forex, a key difference that can also cause a change in our algorithms. 

Palladium became the most expensive out of the 4 precious metals we focus on. XPD took charge over gold just a few years back, rallying multiple times over and over. Today it is more precious although this is not the important part nor why it is a lucrative asset to trade if done the right way. The price jump attracted the views of many traders causing the brokers’ reaction and add it to the asset range. Nowadays you can even buy physical palladium coins and bars. Since 2016 palladium quadrupled in value, it had a bull rally spanning over 3 years and is still going despite all. Of course, there is a fundamental reason for this bullish sentiment and a lot of similarities with platinum. The main difference is that platinum is used for purification filters used on diesel engines whereas palladium is for gas engines.

It is also not mined explicitly, only South Africa and Russia have palladium specialized mines, mostly palladium is a by-product from other resources such as nickel and silver. So, the supply structure of palladium is almost the same as with platinum, the fundamental driver for the demand comes from one country – China. This industrial giant with an overwhelming factory building progression drives pollution and also consequently giving cars a priority over the more affordable vehicles such as motorcycles and bicycles – the ones with lesser pollution impact. Heavy polluters like China are about to have a serious problem with the ecology if this pace is going to continue in the next decade, and palladium is going to follow, sharply. Is it going to quadruple in value again is hard to say but the bullish outlook is almost for sure. 

Supply is flat however, keep an eye on the China equities market. This country is the main demand driver but nowadays can be influenced by trade wars, blocks, and other measures by countries that see this progress as a threat. Even though the effect of these measures is not strong, just the news of them could shake trends we follow in the shorter term. 

Aside from the supply and demand fundamentals, palladium is also moving independently from the other metals. The picture below depicts similarly looking charts but a completely different trend direction from August to October 2020. Gold (orange line) has lower highs after a bull run from July, silver too (sky blue line) but with different price action shapes. Palladium (black line) remained bullish and kept the momentum from July with higher highs and higher lows. 

When you go to a weekly chart, palladium is also moving independently giving you another great asset capable of hedging. The weekly palladium chart is going to show 3 steep bullish runs from mid-2018 till now, with two brief corrections in march 2019 and 2020 once COVID-19 started spreading globally. It even seems like the bull runs resumed in June this year since China got rid of the COVID-19. Long term investment overlook in the picture below shows palladium is one of the best choices since 2010, it almost never ceased to rise to today’s price of $2375 in October 2020.

Palladium trends are great for trend following strategies, the momentum keeps it flowing even they are not as smooth as with gold. Followthrough happens often triggering our Take Profit levels. Our algorithm sets the Take Profit level at 1xATR (14), however, you can set the factor to your liking. If you are not familiar with the structure we follow check our previous articles. 

Trade palladium independently what other metals are doing. Whatsmore, you can even ignore interest rates decisions that could shake platinum and other metals trends, according to experience by professional prop traders. Volatility has increased in 2020 after all events involving China, which is probably the country in focus starting from the COVID-19 outbreak to trade wars and economic blocks of some of China’s biggest companies. Palladium reached an all-time high right before the pandemic close to the $2900 level. Is this a good time to buy after a correction? The answer is leaning more to yes than to a no since July palladium resumed its bullish trend with increased volatility and the same momentum. 

To conclude, palladium is the honey badger, does not care what is going on and it needs a pandemic to stop it, but it seems just or a short while. It is hard to discern when it is a good buying point for the long term holding, the bullish trend continues. Also, it is hard to really know if it is going to crash during the pandemic and other fundamental events on the China equities market, right now price action does not imply a correction. Palladium is just a great hedge even for precious metals, the risk-off and risk-on sentiment in the equities and even interest rates do not affect It much. This is an anomaly that reminds of Bitcoin although the hype is with the China GDP and China’s strong progress. Unlike crypto, palladium is physical and will never come a zero in value whatever happens. Palladium is also getting popular, a good choice for buy and hold strategies. This metal is still new to the scene for some investors, a conservative view will still stick to the good ol’ gold and silver.

As a precaution, traders need to keep an eye if palladium is changing its independent nature, in the meanwhile, they are free to reap the mega trends rewards. Whatsmore, from a technical standpoint, indicators you have used in forex are probably not going to like trends like this. The system elements for trade exits and trend confirmations need to be changed. Volatility filters also need to change for weekly chart trading strategies if you plan to use a kind of long-term swing trading – an alternative if buy-and-hold for years is too boring and you also want more out of corrections. Volatility indicators simply need to cope with weekly timeframe price action movements that are not strong enough for most volatility/volume filters to trigger a signal. All this may require you to build and test a completely new set of indicators as our traders recommend, but this is a job professional traders enjoy doing.

Categories
Forex Fundamental Analysis

US Crude Oil Inventories – Understanding This Fundamental Forex Driver

Introduction

Oil is one of the most universally used commodity. Its uses span every aspect of our lives, and we can’t escape from not using it. In the US, for example, the transportation sector consumes about 68% of the total oil in the economy while industries consume 26%. Therefore, by monitoring the inventories of crude oil, we can be able to deduce the changes in economic activities.

Understanding US Crude Oil Inventories

As an economic indicator, the US crude oil inventories measure the change in the stockpile of crude oil in major oil deports in the US. The US Energy Information Administration’s (EIA) publishes the crude oil inventories report weekly. This report tracks the changes in the number of barrels of commercial crude oil that is held by US firms.

The report is called Weekly Petroleum Status Report and is published on Thursday of every week. Below is a list of items from the report.

  • The US petroleum balance sheet
  • US crude oil refinery inputs
  • The daily average of US crude oil imports
  • The daily average of US commercial crude oil inventories. These inventories exclude those held by the Strategic Petroleum Reserve
  • The daily average of the total oil products supplied over the last four-week period

Using US Crude Oil Inventories

The uses of crude oil affect our daily lives. Although there has been a conscious shift towards green energy, crude oil, and its products are very much still part of our lives. To properly understand the implications of crude oil inventories on the US economy, we need to go back to supply and demand basics. Say that a supplier stocks inventory with the knowledge that there is consistent demand.

This demand is based on historical averages, of course. Now, if the supplier starts to notice that their inventory is increasing over time, it could mean that demand for their product is decreasing. Similarly, if their inventory gets depleted faster than average, it could indicate that demand for their product has increased over time. It is the same case with the US crude oil inventories.

When the crude oil invitatories increase, it is an indicator that demand for crude oil has gone down. The two significant consumers of oil in the US are the transportation sector and in industries. Suffice to say, when there is a substantial increase in the US crude oil inventories, the demand from these two sectors can be expected to have significantly declined. Let’s think about what we can infer about the economy using this logic. In nonfarm employment, the US industries are the largest employers in the labor market.

Since crude oil is used to run industries, crude oil inventories can be used as a leading indicator of economic health. A decline in demand for crude oil could mean that the industrial sector is cutting back on production and manufacturing. Being one of the largest employers in the US, scaling down industrial operations translates to massive job losses. There will be an overall increase in unemployment in the economy. The resultant unemployment also has its ripple effects on the consumer economy. Due to the decrease in disposable income, households will only spend on essential goods and services. As a result, the consumer discretionary industry will take a hit.

This increase in the US crude oil inventories can be witnessed towards the end of the first quarter in 2020. At the onset of the coronavirus pandemic, lockdowns and social distancing guidelines halted industrial activities and traveling. The demand for US crude oil took a hit, and inventories dramatically increased.

Source: Investing.com

Conversely, a continuous decrease in the US crude oil inventories could mean that crude oil demand is increasing. Any significant increase in the demand for crude oil can be taken as an increase in economic activities in the US’s transportation and industrial sectors. An increase in crude oil demand in the transportation sector could imply that more people are buying vehicles, which is an indicator of improved household welfare. In the industries, an increase in demand for crude oil means that industrial activities are expanding. This expansion translates to increased job opportunities and lower unemployment rates.

However, note that it is more plausible that a decrease in oil inventories can be a direct result of cutbacks in oil production by drilling companies. Back to the basics of the economy, the laws of supply and demand. It is inherent for any producer to strive to obtain the highest possible price in the market. According to the laws of supply and demand, oil producers might be attempting to stabilize the oil prices by cutting back on production. When prices are falling due to a decrease in demand, crude oil producers will try to cut back on drilling to stabilize the price. After all, it doesn’t make any economic sense to oversupply the market at lower prices while operation costs remain the same. This scenario was witnessed at the beginning of the second quarter of 2020. The graph below shows the decline in oil rigs that were operational in the US at the beginning of Q2 2020.

Source: Trading Economics

Due to depressed crude oil demand, crude oil prices were on a freefall, which led to cutbacks in production, hence a significant decline in inventories. Note that this decline in the US crude oil inventories does not coincide with economic expansion.

Impact of US Crude Oil Inventories on USD

We have observed that the increase in inventories can be associated with a decline in demand for crude oil. This decline in demand can imply that operations in major crude oil dependent sectors are scaling down. These are signs of economic contractions, which will make the USD depreciate in the forex market.

Conversely, when the inventories decrease, it could mean that the demand for crude oil has increased significantly. For economic sectors that are heavily dependent on crude oil, it means that they are expanding. Since this can be an indicator of economic growth, the USD can be expected to increase in value in the forex market.

Sources of Data

The US Energy Information Administration publishes the US crude oil inventories every week. Trading Economics has in-depth and historical time series data on the US crude oil inventories.

How US Crude Oil Inventories Release Affects The Forex Price Charts

The latest publication of the US Crude Oil Inventories was on October 21, 2020, at 9.30 AM EST. This release is available at Forex Factory. When the US crude oil inventories are published, low impact is expected on the USD.

In the latest release, the US crude oil inventories decreased by 1 million barrels compared to 3.8 million barrels in the previous week. This change was more than analysts’ expectations of a 0.5 million barrels decline.

Let’s see how this release impacted the USD.

GBP/USD: Before US Crude Oil Inventories Release on October 21, 2020, 
just before 9.30 AM EST

The GBP/USD pair was trading in a steady uptrend before releasing the US crude oil inventories data. The 20-period MA is seen to be steadily rising with candles forming above it.

GBP/USD: After US Crude Oil Inventories Release on October 21, 2020, 
at 9.30 AM EST

The pair formed a 5-minute bullish candle indicating the weakness of the USD. It continued trading in the steady uptrend for a while before adopting a neutral trend.

The US crude oil inventories data is a low impact indicator in the forex market. As shown above, the release of the data had no impact on forex price action.

Categories
Forex Assets

Trading Costs Involved While Trading The AUD/PKR Forex Exotic Pair

Introduction

In this exotic, AUD is the Australian Dollar, and PKR is the Pakistani Rupee. Trading exotic currency pairs can be highly volatile compared to major currency pairs. The AUD is the base currency, and the PKR is the quote currency. That implies that the exchange rate of the AUD/PKR is the number of Pakistani Rupees that a single Australian Dollar can buy. Thus, if the exchange of AUD/PKR is 112.584, it means that with 1 AUD, you can buy 112.584 PKR.

AUD/PKR Specification

Spread

The spread in forex trading represents the value difference between the buying price of a currency pair and its selling price. These prices are referred to as “bid” and “ask.” The spread for the AUD/PKR pair is – ECN: 32 pips | STP: 37 pips

Fees

Some forex brokers charge a fee whenever a trader opens a position. The fee is not standardized and depends on the broker and the size of the trade. Note that STP accounts normally don’t attract broker fees.

Slippage

Whether long or short, when you open a position, it can be executed at a different price than what you requested. This price difference is called slippage in the forex market and is a direct result of extreme volatility or broker delays.

Trading Range in the AUD/PKR Pair

If you observed a currency pair’s price movement, you’d notice the difference in price changes across different timeframes. That is the trading range and is used to determine the volatility of a pair.

The Procedure to assess Pip Ranges

  1. Add the ATR indicator to your chart
  2. Set the period to 1
  3. Add a 200-period SMA to this indicator
  4. Shrink the chart so you can determine a larger period
  5. Select your desired timeframe
  6. Measure the floor level and set this value as the min
  7. Measure the level of the 200-period SMA and set this as the average
  8. Measure the peak levels and set this as Max.

AUD/PKR Cost as a Percentage of the Trading Range

When you combine the total trading costs of a currency pair, you can analyze the percentage costs across different timeframes. This analysis can help you determine the best time to trade a currency pair.

ECN Model Account Cost

Spread = 32 | Slippage = 2 | Trading fee = 1 | Total = 35

STP Model Account Cost

Spread = 37 | Slippage = 2 | Trading fee = 0 | Total cost = 39

The Ideal Timeframe to Trade the AUD/PKR

As seen above, trading the AUD/PKR pair on shorter timeframes is costlier. In both the ECN and the STP accounts, it is cheaper trading the pair over longer timeframes since the trading costs are lower. Note that the trading costs decrease with an increase in volatility. The lowest trading cost for the AUD/PKR pair is when volatility is at the highest 852.4 pips.

The ideal trading time is evidently on the longer timeframes. But shorter-term traders can open positions when volatility is maximum across 1H, 2H, 4H. and 1D timeframes. Traders can also employ the use of forex pending order types, which eliminate the cost of slippage. Here’s an example with the ECN account.

Total cost = Slippage + Spread + Trading fee = 0 + 32+ 1 = 33

Notice how the trading costs have been reduced across all timeframes when forex pending orders are used. The maximum cost, for example, has reduced from 593.22% to 559.32%.

Categories
Forex Basic Strategies

Reliable ‘ADX’ Trading Strategy To Trade Forex Major Currency Pairs

Introduction 

We have talked a lot about trading strategies involving MACD, RSI, Volume and Stochastic. However, we haven’t covered much about the ADX indicator and its application. Today’s strategy is based on the ADX, which will help us in measuring the strength of a trend on any given time frame. The Average Directional Index (ADX) is a tool that is designed to measure the strength of a trend. When ADX is used in combination with other trading strategies, we get a complete understanding of the market trend and its efficacy.

Learning how to use the ADX is very easy. It ranges from a scale 0-100, 100 indicating a strong trend and 0 indicating a non-existent trend. If the ADX is close to 0, we can expect a sideways action in the market, meaning the market will neither go up or down but stay around the same value for some time. Remember, ADX will tell us about the strength of the trend. It does not guide us in the future direction of the market. For that reason, it is necessary to use concepts of market trend, retracement, and other technical indicators. ADX values of 50 and above are considered high, while ADX values of 20 and below are considered low. Weak trends are indicated by values of 20 and below.

Time Frame

The strategy works well on most time frames, including 15 minutes, 1 hour, 4 hours and Daily. However, we do not recommend applying the strategy on very low time frames due to market noise and liquidity issues.

Indicators

We use the Average Directional Index (ADX) and Simple Moving Average (SMA) indicators in the strategy.

Currency Pairs

The strategy is applicable on most currency pairs listed on the broker’s platform. However, it is advised to apply the strategy on major currency pairs only.

Strategy Concept

The ADX indicator ensures that we only trade when there is a strong trend in the market, regardless of the time frame. Here, even before looking at the candlesticks, we wait for the ADX indicator to show a reading above 60. A reading above 60 signals a strong trend and the likelihood of a trend continuation. We all know that the trend is our friend, but without gauging the strength of the trend, it can be dangerous to be a part of that trend. This is why we use the ADX indicator for trend trading.

The ADX is only limited to understanding the strength of the trend. However, in order to trade a ‘trend’, we also need to look at price action and trend continuation pattern in the market. Therefore, we use the concept of retracement and moving average to time our ‘entries.’ As this a trend trading strategy, we cannot use the rules for catching a reversal in the market.

We determine the take-profit and stop-loss levels based on ‘highs’ and ‘lows’ of the trend and retracement. Let us, straight dive, into the rules of the strategy.

Trade Setup

In order to explain the strategy, we will be executing a ‘long’ trade in USD/CAD currency pair using the rules of the strategy. Here are the steps to execute the strategy.

Step 1: Firstly, we have to plot the ADX and moving average indicators on the chart with their default setting. Before we actually look at the price action of the market, we have to watch the ADX indicator and its indication. Once the ADX crosses above 60, we look at the trend market and wait for an appropriate retracement.

Step 2: After gauging the strength of the trend using the ADX indicator, we need to wait for a suitable price retracement. The retracement, in other words, indicates a halt of the major trend of the market. In an uptrend, if price falls below the moving average and stays there, we say that the market has entered into retracement mode.

In a downtrend, if price rises above the moving average and stays there, we say that the market has entered into retracement mode. At this point, we are not sure if this is a retracement of the trend or is a start of the reversal. In order to confirm that it is a retracement, we again use the ADX indicator and check its reading. An ADX reading below 20 indicates that the ‘halt’ is actually a retracement of the major trend and not reversal.

Step 3: Now that we have got a confirmation from the ADX indicator that the market has gone into retracement mode, we should know how to enter the market. We go ‘long’ in the market when price crosses above the moving average and stays there for at least 4 or 5 candles. Similarly, we go ‘short’ in the market when price crosses below the moving average and stays there for at least 4 or 5 candles. As we just saw, the rule for entering a trade in this strategy is pretty simple and not complex at all.

Step 4: The last step of the strategy is to determine stop-loss and take-profit levels for the trade. We set take-profit near the ‘higher high’ of the uptrend while ‘long’ in the market and near the last ‘lower low’ of the downtrend while ‘short’ in the market. Stop-loss is placed below the previous ‘low’ of the retracement in an uptrend and above the ‘high’ of the retracement in a downtrend.

Strategy Roundup

The new ADX strategy gives very useful information which most of the times we never pay attention to. There are not many indicators which truly tell about the strength of the trend. ADX is one such indicator which tells if the trend is moving in strong fashion or not. At the same time, it is important to consider the strength of the pullback using price action and ADX indicator. Best profits come from catching strong trends, and this strategy helps us in accomplishing that.

Categories
Forex Course

171. The Best Timeframe for Forex Markets

Introduction

In our previous lesson, we looked at which timeframes you should trade in the forex market. We established that the timeframes you trade depend on the type of forex trader that you are. This lesson will cover the best timeframes to trade using illustrations depending on the type of forex trader you are.

Best Timeframe for Forex Position Trading

1-Month EUR/USD Primary Trend Timeframe

The monthly timeframe shows a downtrend in the pair.

1-Week EUR/USD Trigger Timeframe

For a forex position trader, the 1-week timeframe can be used to establish the support level. This level will make the best entry point when the price trends below it.

Best Timeframe for Forex Swing Trading

Daily EUR/USD Primary Trend Timeframe

Forex swing traders trade in the direction of the preceding trend, which in this example, is a downtrend.

4-hour EUR/USD Trigger Timeframe

For a forex swing trader, using the 4-hour timeframe is the best to identify the ideal entry and exit points.

Best Timeframe for Forex Day Trading

1-hour GBP/USD Primary Trend Timeframe

For a forex day trader, the dominant market trend is a downtrend. With this chart, the day trader can establish multiple support and resistance levels. The 15-minute timeframe is used to establish the best market entry positions.

15-minute GBP/USD Trigger Timeframe

With the 15-minute timeframe, multiple entries and exit points can be established.

Best Timeframe for Forex Scalping

15-minute EUR/USD Primary Trend Timeframe

For a forex scalper, the 15-minute timeframe shows an uptrend. The 5-minute timeframe will be used to establish the best points of entry into the market.

5-minute Trigger Timeframe

The 5-minute timeframe presents the forex scalper with the best points for entry into the uptrend market.

Best Timeframe for Fundamental Forex Traders

Fundamental forex traders can also use timeframe analysis to establish the magnitude and volatility resulting from the release of an economic indicator. Therefore, depending on whether the indicator is high- or low-impact, you can determine which timeframe is best to trade.

With high-impact indicators, you can trade from the 30-minute timeframe.

30-minute timeframe for Australia’s GDP data release. September 2, 2020, 1.30 AM GMT

Furthermore, the price action from the release of a high-impact economic indicator can persist in the market for the long-term.

30-minute timeframe for Australia’s GDP data release. September 2, 2020, 1.30 AM GMT

The 4-hour chart shows that the AUD/USD pair continued trending downwards due to the less than expected GDP growth data.

For low- to medium-impact economic indicators, it is best to trade shorter timeframes from 1-minute to 15-minutes.

5-minute timeframe for Australia’s retail sales data release. August 21, 2020, 1.30 AM GMT

At longer timeframes, the effects of these indicators on the price action dissipates.

1-hour timeframe for Australia’s retail sales data release. August 21, 2020, 1.30 AM GMT

[wp_quiz id=”89173″]
Categories
Forex Signals

EUR/JPY Violates Symmetric Triangle Pattern


Entry Price – Buy 124.623
Stop Loss – 124.223
Take Profit – 125.023
Risk to Reward – 1:1
Profit & Loss Per Standard Lot = -$400/ +$400
Profit & Loss Per Micro Lot = -$40/ +$40
Fellas, now you can check out forex trading signals via Forex Academy mobile app. Follow the links below.
iPhone Users: https://apps.apple.com/es/app/fasignals/id1521281368
Andriod Users: https://play.google.com/store/apps/details?id=academy.forex.thesignal&hl=en_US

Categories
Forex Signals

Choppy Session in USD/CAD Continues – Traders Braces for a Breakout Setup!

During Wednesday’s early Asian trading session, the USD/CAD currency pair failed to stop its overnight losses and remain depressed around the 1.3030 level, mainly due to the broad-based U.S. dollar weakness. The prevalent downtrend in the U.S. dollar was mainly tied to the confidence over a potential vaccine for the extremely contagious coronavirus disease, which struggling to keep market trading sentiment positive. Moreover, President-elect Joe Biden faces difficulties from Donald Trump, which also weighs on the already weaker U.S. dollar. The reason for the declines in the currency pair could also be attributed to the fresh upward movement in the crude oil prices, which tend to underpin the commodity-linked currency the Loonie and contributes to the currency pair’s losses. However, the crude oil prices were being supported by fresh released upbeat American Petroleum Institute (API) data. As of writing, the USD/CAD currency pair is currently trading at 1.3028 and consolidating in the range between 1.3024 – 1.3037.

As we already mentioned, the market trading sentiment represented negative performance on the day as the sluggish appearance of Asia-Pacific stocks and declines of the U.S. 10-year Treasury yields tend to highlight the risk-off mood. However, the reason behind the risk-off market bias could be attributed to a combination of factors. Be it the worrisome headlines concerning the Sino-US tussle or the resurgence of the coronavirus. The market trading sentiment has been flashing red since the day started, which ultimately keeps the safe-haven assets supportive on the day. 

At the US-China front, the tensions between the United States and China still do not show any sign of slowing down as the U.S. imposed fresh sanctions on 4-Chinese diplomats over the Hong Kong Security Bill crackdown initially overshadowed the optimism over a potential vaccine and weighed on the market sentiment. Elsewhere, the declines in the equity market were further bolstered after U.S. President Donald Trump’s push to block election results to confuse optimists. 

Despite the risk-off mood, the broad-based U.S. dollar remained depressed. The investors continue to sell U.S. dollars on the back of optimism over a potential vaccine for the highly contagious coronavirus disease. Moreover, the losses in the U.S. dollar could also be associated with political uncertainty in the U.S. Thus, the losses in the U.S. dollar kept the currency pair lower. Meantime, the U.S. Dollar Index, which tracks the greenback against a bucket of other currencies, was down at 92.707.

At the crude oil front, WTI crude oil prices remained well bid around above $41 on the day, backed by the COVID vaccine hopes and the victory of Joe Biden, which boosted the market trading sentiment and demand sentiment the crude oil. Apart from this, China has played a significant role in underpinning global oil demand recovery. They showed that the inventories had declined considerably in recent weeks, indicating the domestic economic recovery. Moreover, the crude oil prices upticks were further boosted after the American Petroleum Institute (API) reported the major draw in crude oil inventories of 5.147 million barrels for the week ending November 6. Thus, the crude oil prices’ upticks underpinned the commodity-linked currency the Loonie and exerted some downside pressure on the currency pair. 


Daily Support and Resistance

S1 1.289

S2 1.2957

S3 1.2995

Pivot Point 1.3023

R1 1.3061

R2 1.3089

R3 1.3156

The USD/CAD pair is consolidating around the 1.3020 area, testing the resistance level of the 1.3033 mark. On the higher side, the bullish breakout of the 1.3033 level can stretch the buying trend until the next resistance level of 1.3098. While on the lower side, the immediate support stays at 1.3000, and below this, the next support is likely to be found around 1.2935 level. Overall, the USD/CAD isn’t moving a lot as traders are enjoying bank holidays in Canada and the U.S. amid Remembrance and Veterans Day. We may have a thin trading volume and volatility in the market today. Good luck!

Categories
Forex Fundamental Analysis

What Should You Know About ‘Mortgage Market Index’ Macro Economic Indicator

Introduction

In the recent past, the real estate market has been a critical indicator of economic performance. As with any other aspect of the financial market that intertwines with consumer demand, the significance of the mortgage market cannot be overstated. Knowing if mortgage applications have increased or reduced can tell a lot about the demand in the housing market and households’ welfare. This index can be a leading indicator of demand in the economy.

Understanding the Mortgage Market Index

Primarily, the mortgage market index tracks the number of mortgage applications over a specific period. In the US, for example, the mortgage market index is compiled by the US Mortgage Bankers Association (MBA). The MBA mortgage market index is released weekly. MBA has an association of about 2200 members encompassing the entire real estate financing industry. The companies included in the association are deal originators, compliance officers, deal underwriters, servicers, and information technology personnel. These companies are active in residential, multi-family, and commercial real estate.

Owing to its vast network of real estate companies across the country, MBA is in the best position to provide comprehensive coverage of the mortgage applications made. The published data shows both seasonally adjusted and unadjusted changes in the US’s number of mortgage applications. Furthermore, the report also includes the Refinance Index,  which shows the number of applications made by households wishing to refinance their mortgages. The report also includes seasonally adjusted and unadjusted ‘Purchase Index,’ which shows the number of outright purchases in the real estate sector during that week.

Furthermore, this weekly report analyses the change in the Adjustable-Rate Mortgage (ARM) applications. As the name suggests, the ARM is a mortgage in which the interest rate payable on the balance varies throughout its life. The number of the Federal Housing Administration (FHA) loans are also included in the report. It further analyses the average contract interest rate for 30-year fixed-rate mortgages with Jumbo loan balances and conforming loan balances. Jumbo loan balances are those above $510,400 while conforming loan balances are less than this amount. Finally, the MBA mortgage market weekly report analyses the change in the average contract interest rate for 15-year fixed-rate mortgages.

Using the Mortgage Market Index in Analysis

The change in the number of mortgages in an economy tells a lot about the prevailing economic conditions. These conditions range from demand in real estate to prevailing monetary policies. Both of these aspects are integral in the growth of an economy.

When the mortgage market index is rising, it means that the number of mortgage applications has increased. The increase in mortgage applications could imply that there is a growing demand for real estate. One thing you have to know, when people decide to invest in the housing market, it normally means that they have increased disposable income and have thus fulfilled all other intermediate needs.

An increase in disposable income in the economy means that more people are gainfully employed or that wages have increased. In both these circumstances, we can deduce that the economy is expanding. The reason for this deduction is because when demand in the real estate market expands, it means that demand in the consumer discretionary industry has also increased. Thus, the output in the economy is higher.

More so, when the mortgage market index rises, it could mean that households and investors in the economy have access to cheap finance. Either they are creditworthiness has improved, or the market interest rates are lower. When the interest rate is lower in the market, it is usually due to the central banks’ expansionary monetary policy.

Such expansionary policies are adopted when the central banks aim to stimulate the growth of the economy. It means that people have access to cheap money and can borrow more. When there is a growing money supply in the economy, households can increase their consumption, and investors can scale up their operations. Overall, the economy will experience an increase in output, thus in the GDP.

Furthermore, it could also mean that households who previously could not afford to service a mortgage can now be able to afford mortgages due to low-interest rates. This scenario played out towards the end of the first quarter of 2020 when the US Federal Reserve made a series of interest rate cuts. The MBA mortgage market index is seen to have hiked. This hike can be taken as a sign that households and investors were taking advantage of the expansionary policies by increasing their holding in the real estate sector.

Source: Investing.com

On the other hand, a drop in the MBA mortgage index means that the demand for demand in the housing market is waning. The decrease in demand could be synonymous with an overall contraction of demand in the economy. The contraction of aggregate demand can be taken as a sign that the overall economy is also contracting. Similarly, it can also be taken as a sign that the public has lost confidence in the housing market as during the 2007 – 2008 housing market crash.

Source: Investing.com

Impact of the Mortgage Market Index on Currency

In theory, the domestic currency should be susceptible to fluctuations in the mortgage market index.

When the index increases, it can be taken as a sign that there is an increased money supply in the economy. Under such circumstances, contractionary monetary and fiscal policies might be implemented, such as hiking the interest rates. When such policies are adopted, the domestic currency tends to increase in value compared to other currencies in the forex market.

Conversely, when the index is continually dropping, it can be taken as an indicator of overall economic contraction. In this instance, expansionary policies might be implemented, like lowering interest rates to encourage consumption and prevent the economy from slipping into a recession. These policies make domestic currency depreciate.

Sources of Data

In the US, the mortgage market index is compiled and published weekly by the Mortgage Bankers Association. A historical time series of the data is available at Investing.com.

How the US Mortgage Market Index Affects The Forex Price Charts

The latest publication by the MBA was on October 21, 2020, at 7.00 AM EST. As seen in the screengrab below, a low impact on the USD is expected when the index is published.

For the one week to October 21, 2020, the mortgage market index was 794.2 compared to 798.9 in the previous publication.

Let’s see how this publication impacted the USD.

GBP/USD: Before US Mortgage Market Index Release on October 21, 2020, 
just before 7.00 AM EST

Before the publication of the US Mortgage Market Index, the EUR/USD pair was trading in a weak uptrend. In the above 5-minute chart, the 20-period MA is almost flattened with candles forming slightly above it.

GBP/USD: After US Mortgage Market Index Release on October 21, 2020, 
at 7.00 AM EST

The pair formed a 5-minute bearish candle after the release of the index. It later traded in a neutral trend as the 20-period MA flattened, and candles formed around it.

Bottom Line

This article has shown that the US MBA Mortgage Market Index plays an essential role as an indicator of demand in the housing market. But as shown by the above analyses, this economic indicator has no significant impact on price action in the forex market.

Categories
Forex Course

170. Why Consider Analysing Multiple Timeframes When Trading Forex?

Introduction 

Our previous lessons have covered trading multiple timeframes in forex and which timeframes are suitable for your trading style. To some forex traders, trading multiple forex timeframes can seem tedious and time-consuming. Here are some of the most important reasons why you should look at multiple timeframes when trading forex.

1. To easily identify trends and their momentum 

Depending on the type of forex trader you are, multiple timeframes will enable you to see the prevailing market trends at a glance by filtering out periodic price spikes. It is easier to identify the direction of the market trends and consolidations, whether in the short- or long-term.

For the long-term market trend, you can use the weekly and the monthly timeframes, while the intermediate market trend can best be identified by the 4-hour to daily timeframes. Timeframes of between five minutes and one hour can be used to determine the short-term market position.

The longer timeframes filter out the short-term price fluctuations, which might otherwise result in trend inconsistencies when viewed alone. The periodic fluctuations in the short-term add up in the long-term. With multiple timeframe analysis, the strength and consistency of the short-term trend can be compared to that in the long-term. This comparison is made by observing whether the prevailing long-term trend was dominant in the short-term as well.

2. To establish the significance of fundamental indicators

Using multiple trend analysis, you can easily establish the magnitude that news release of economic indicators has on a given currency pair. To determine the significance of the economic indicators, you can use different timeframes to establish how long the news release affected price action. The effects of high-impact fundamental indicators can be traced from the shorter timeframe to the longer timeframes. Low-impact indicators only affect price action on the shorter timeframe.

3. Identifying the support and resistance levels

Based on the forex trading style you choose, you can use the more extended timeframe within your category to establish the support and resistance levels in the market trend. Shorter timeframes can then be used to trigger entry and exit points for a trade.

These support and resistance levels are crucial in deciding the forex order type you want to execute. Say, for example, you want to use a buy limit order. You will use the support level as your trigger price. Similarly, the support level can be used as the trigger price for a sell stop order. You can use the resistance level as the trigger price for the sell limit and buy stop orders.

4. To avoid the lagging effects of technical indicators

Technical forex indicators are lagging since they derive their properties from the price action of a forex pair. Therefore, the forecasting significance of multiple timeframe analysis in the forex market can be said to be leading that of the technical indicators. Furthermore, some technical forex indicators can produce conflicting signals. Thus, trading with multiple timeframes improves your forex analysis.

We hope you understood why it is crucial to consider analyzing various timeframes while analyzing the Forex market. Please take the below quiz to know if you got the concepts correctly. Cheers!

[wp_quiz id=”89156″]
Categories
Forex Market Analysis

Daily F.X. Analysis, November 10 – Top Trade Setups In Forex – Risk on Market Sentiment! 

On the news front, the eyes will remain on the European German ZEW Economic Sentiment data and the Industrial Production figures from France and Italy. All of the figures are expected to have dropped, which may put bearish pressure on the single currency Euro. Besides this, the eyes will stay on the labor market figures from the United Kindom. 

Economic Events to Watch Today  


EUR/USD – Daily Analysis

The EUR/USD pair was closed at 1.18133 after placing a high of 1.19198 and a low of 1.17951. The EUR/USD pair rose to its highest since September 02 on Monday but failed to keep its gains and fell to post losses for the day as the U.S. dollar rallied in the American session as risk appetite took over.

Pfizer and BioNtech announced that their coronavirus vaccine was more than 90% effective in preventing the coronavirus. The news about the vaccine optimism raised the risk sentiment further and pushed the pair to its highest in 9 weeks in earlier sessions on Monday.

Pfizer and BioNtech said they would seek the approval authorization for emergency-use from the U.S. later this month. The optimism around the market raised and supported the EUR/USD pair’s upward movement in earlier trading hours.

A vaccine will likely mean the end of lockdowns and restrictions and hence, a sharp economic comeback. However, it will take up to the second half of next year for the vaccine or vaccines to reach enough people to grant a more normal return to activities. Nevertheless, optimism will prevail.

However, the EUR/USD pair failed to keep its gains for the day and started declining on Monday on the back of Joe Biden’s victory in the U.S. presidential election. The political gridlock in the U.S. Senate could stall the prospect of any fresh package of U.S. fiscal stimulus package that failed to keep the U.S. dollar under pressure and weighed on the EUR/USD pair.

On the data front, at 12:00 GMT, the German Trade Balance for September raised to 17.8B against the expected 17.2B and supported Euro that pushed the EUR/USD pair higher on Monday. AT 14:30 GMT, the Sentix Investor Confidence for October came in as -10.0 against the forecasted -15.0 and supported Euro.

Moreover, the European Central Bank (ECB) President Christine Lagarde refrained from touching upon monetary policy in her scheduled speech at the Green Horizon Summit on Monday. She only talked about climate risks and said that the economic challenges of climate transition were phenomenal. The main driver of the EUR/USD pair remained the strength of the U.S. dollar triggered by the faded hopes of additional stimulus measures as the vaccine news raised optimism about the economic recovery.

Daily Technical Levels

Support   Resistance

1.1766      1.1891

1.1717      1.1969

1.1640      1.2017

Pivot point: 1.1843

EUR/USD– Trading Tip

The EUR/USD is trading bullish at the 1.1833 level amid a stronger U.S. dollar. The pair may now head higher until an immediate resistance level of 1.1883. On the 4 hour timeframe, the EUR/USD has formed an upward channel supporting the pair at the 1.18016 level. On the higher side, a bullish crossover of 1.1883 level can extend the buying trend until the 1.1945 area. The MACD entered the oversold zone and now suggesting odds of bullish trend continuation; therefore, we should look for a buying trade over the 1.1801 level.  


GBP/USD – Daily Analysis

The GBP/USD pair was closed at 1.31634 after a high of 1.32081 and a low of 1.31183. Despite higher market sentiment and weaker safe-haven demand on Monday, the British Pound to U.S. dollar exchange rate has been under pressure. The Sterling remained weak despite the increased market sentiment from the news of coronavirus vaccine efficiency.

Pfizer and the BioNtech announced that their vaccine had been proved more than 90% efficient in preventing the coronavirus on Monday. Both companies also said they would be taking approval from the U.S. for the vaccine’s emergency-use later this month. After this news, risk appetite increased in the market, and global equities raised; however, the risk perceived GBP/USD pair remained under pressure on Monday as British Pound was weak due to Biden victory in the U.S. elections.

Joe Biden’s victory decreased the hopes for the U.K. & U.S. post-Brexit trade deal as Joe Biden has already said that if U.K. fails to reach a deal with the E.U., then the US-UK deal will also be jeopardized. As there was no news regarding the progress made in the U.K. & E.U. talks, the British Pound came under fresh pressure after Joe Biden became the U.S.

Meanwhile, on Monday, the governor of Bank of England, Andrew Bailey, explained that what the BoE was doing to ensure the financial system plays its part in tackling climate change. He warned that climate change was a bigger risk than coronavirus. Furthermore, the chief economist from the Bank of England, Andy Haldane, said that a breakthrough in developing a coronavirus vaccine could deliver a vital boost of confidence to consumers and businesses. He added that the economy might have reached a decisive moment after the pharmaceutical company Pfizer announced that its coronavirus vaccine candidate was 90% effective.

He also said that the vaccine could be a game-changer for the economy. He cautioned that it would take several months for the vaccine to be rolled out but would have an immediate effect on consumer and business confidence. He added that the economic cycle would start again as it would unlock the business investments, and the economy will start recovering. The GBP/USD pair remained a little bullish due to high pressure on British Pound on Monday.

Daily Technical Levels

Support   Resistance

1.2997      1.3222

1.2851      1.3301

1.2771      1.3448

Pivot point: 1.3076

GBP/USD– Trading Tip

The GBP/USD is trading with a strong bullish bias due to a stronger Sterling 1.3191 area. The pair has violated the intraday resistance level at 1.3159, which is now working as a support for Sterling. On the higher side, the continuation of an upward trend can lead to the GBP/USD pair until the 1.3226 area. The cable had violated the descending triangle pattern, and ever since, it’s trading with a bullish bias. 


USD/JPY – Daily Analysis

The USD/JPY pair was closed at 105.388 after placing a high of 105.645 and a low of 103.187. The USD/JPY pair surged past the 105.6 level on Monday after the risk-on market sentiment raised and weighed on the Japanese Yen. The safe-haven Japanese Yen came under fresh pressure after the Pfizer and its German partner BioNtech announced that their vaccine candidate was proved more than 90% efficient in its last-stage trials. Both companies announced that they would seek U.S. approval for the emergency-use of vaccine later this month.

The pair USD/JPY witnessed a sharp rise in its prices of almost 3-4% on Monday after the vaccine optimism raised the risk appetite in the market that weighed heavily on the safe-haven Japanese Yen. This ultimately pushed the USD/JPY pair to the highest level since October 20.

The gains in USD/JPY pair were also supported by the victory of Democratic Joe Biden in U.S. elections. Biden was expected to deliver a massive stimulus package that had been weighing on the U.S. dollar. Still, after the news of vaccine development and its efficiency, the need for the massive stimulus package dropped and raised the U.S. dollar onboard. The rising U.S. dollar also helped the USD/JPY pair to post massive gains on Monday.

Meanwhile, on Monday, the Bank of Japan released the Summary of opinions that stated that one member said that the bank needs to ensure its purchases of exchange-traded funds are sustainable. Other members said that BOJ must be ready to ramp up stimulus to cushion the economic blow from the coronavirus pandemic.

On Monday, the Cleveland Federal Reserve Bank President Loretta Mester said that the emergency lending programs the Fed set up during the coronavirus pandemic had reduced distress in financial markets. She also said that there was still a need for lending programs. Mester also said that Fed Chair Jerome Powell would be working with the Treasury Department to determine if the programs should be extended beyond the end of the year. She also stated that the Fed was not out of ammunition to stimulate the economy and that the Fed could provide more accommodation by adjusting its asset purchase program and using other tools.

She said that the economy recovered more strongly than expected, but gains have not been evenly spread. Mester said that economic growth would be more slowly despite the optimistic news about the vaccine on Monday. These comments kept the markets under pressure and capped further gains in the USD/JPY pair.

Daily Technical Levels

Support   Resistance

103.82      106.29

102.27      107.21

101.35      108.75

Pivot point: 104.74

USD/JPY – Trading Tips

The USD/JPY has violated the descending trendline at 104.950 area, and on the lower side, it’s testing the support area of 104.840 level. The USD/JPY pair has recently entered the overbought zone, and now investors may experience a bearish correction in the market. To see a bearish retracement, the USD/JPY pair needs to violate the 104.900 level. Below this, we may see the USD/JPY pair falling until the 104.220 level, and a further breakout can lead it towards 102.400, which seems a bit hard. However, we may see buying over 104.950 levels today until 105.600. Good luck! 

Categories
Forex Risk Management

How to Deal With Overexposure Like A Professional

Risk management in forex is of extreme importance and traders around the world have often struggled with overexposing themselves in one currency. We will address this issue using our trading system as a practical example. Exceeding the 2% risk limit (according to our risk management using our algorithm structure from previous articles) without having any awareness of how these oversights occur is almost every beginner trader’s mistake. These scenarios are frequently driven by a news event or some other occurrence that affects the specific currency they are trading, which consequently leads to an enormous loss. These losses can at times be so grave that they completely extinguish a trader’s account or erase several-month-long work despite traders’ initial efforts to maintain the risk at 2%. Interestingly enough, it typically happens that most trader’s individual trades are properly set at 2% when the exposure to only one of those currencies turns out to be increasingly higher. Today we are going to assess risk from several real-life situations and discuss them in order to gain some insight into how to manage risk better. 

Imagine a situation where a trader who is already going long on EUR/USD gets a new signal somewhere along the line to enter a new trade and go short on EUR/GBP. The trader does not ask any questions and enters the trade as the system suggested, setting the risk at 2%. Naturally, if the system has been properly tested, there is a high chance of winning both trades, which is important for beginners as they often shy away from these situations. Although it may seem like too much risk, these circumstances can prove to be quite fruitful. Despite the fact that these occurrences happen often and that the outcome is generally positive, the trader from the story made a single mistake thinking that the risk on the EUR equals zero. The risk, in fact, is 2% long and 2% short at the same time, which further entails that the trader will not take any other EUR-based trades unless at least a portion of the existing trades is closed. What traders frequently fail to grasp is that the 2% short and long, despite the opposition in direction, cannot cancel one another or equal 0%. 

Another situation involves a trader who received two long signals for EUR/CHF and EUR/USD and decided to enter both trades at the same time. In order to manage risk in these ongoing trades, the trader would need to take 1% from each trade to have a 2% risk on the EUR. If the individual for some reason decided to exit either of the two trades, the risk would come down to 1%. In this case, the traders could enter another trade or a continuation trade of the one that had just been closed. The trouble is that many traders assume that they somehow have their whole 2% here, which then leads to increased risk. The goal here is to fit into that 1% that we have left after the second trade was closed.

Should a trader receive a EUR/USD long signal but then reconsider his/her options because another EUR-based pair is likely to get there in one day, they can take a 1% risk on the first currency pair and wait for the 24h to pass to see what will happen. The other trade may or may not get to the place we hoped or expected it to reach, which can be quite unsettling but does not involve any increased risk or missed-out opportunity since the previous requirement was met. The equity is settled with the EUR, so the trader can, if he/she wishes, enter a new trade later on when an opportunity presents itself. Even if you decide to enter a 2% EUR trade in the beginning without waiting for the situation with the other pair to fully develop, there is no mistake made. The choice falls on the traders alone and no damage is done until the risk limits are properly sit – 1% on one of the two trades or 2% on a single trade. 

Sometimes it happens that the market is quite active and that prices are moving, so you can get several signals on a single currency at a time. What you should do here is divide the 2% by the number of trades you wish to enter. Therefore, if you received four signals for four EUR trades, make sure that each of the four trades has a 0.5% risk. While this may seem like a lot, it actually can prove to be both useful and lucrative as long as the risk is managed well. If you assumed that the EUR is going to do well and your assumptions prove to be correct, you will take wins in all EUR-based trades you entered. However, if your assumptions somehow turn out the other way, your trades are secured because the proper risk management can function as a form of a hedge.

While this is an excellent strategy and a secure way of protecting oneself, this does not imply that any trader should go on a spree looking for several trades involving one currency as this often fails to bring the results we are hoping to get. The system you have worked to build should be enough as a source of signals, so there is no need to go beyond that. Moreover, it is also extremely important for traders to trust their algorithms when we do get several signals for one currency at the same time and not miss opportunities out of fear.

Traders can sometimes be misguided by the sudden success they experience in some of these situations when they win instead of losing despite not having set the risk properly. Such outcomes can be particularly dangerous for the understanding of how risk management truly works. Once the winning part ensues, traders can get so excited that their thinking processes get affected negatively and no logical conclusion can be drawn as a result. In order to overcome this challenge and improve your overall trading, especially if you are at the beginning of your forex career, you should devote time to learn about money management and trading psychology, which will prove to outdo all other forex-related topics by far.

The more advanced traders who have already started backtesting their systems may be experiencing some difficulty due to the inability to apply today’s advice during these processes. The problem with dividing risk while backtesting is that it would make the whole assessment that much longer, so the suggestion here is to test the system on different currency pairs one by one. Overexposure prevention is important but, for the backtesting part, it would dimply overcomplicate everything, However, during the forward testing, whose purpose is to gain more clarity and see the things which may be fixed, you can expect to see some differences. This second part of testing should also serve to prepare you emotionally for trading real money and traders should, thus, be particularly vigilant throughout the process. Any of the parts that you do not focus on entirely or fail to address with a sufficient amount of attention during the demo phase will inevitably haunt you down later on and probably in a much more serious situation affecting your or other people’s finances.

As we described above, the dangers of accidental success are real, which calls for increased attention to testing processes where one can discern what works well and what can potentially endanger his/her entire forex career. If you suddenly go into the negative having taken a few losses in a row after an incredible 15% win is quite indicative of a malfunctioning system. The challenge here is not to interpret the word system as tools, numbers, and indicators alone because, as we said before, money management and trading psychology are superior to any technical aspect of trading in the spot forex market. Even if you have already lost a lot and feel doubtful about your abilities and knowledge on trading, what you can and should do is go back to the basics – start a demo account and devote the proper amount of attention testing requires.

Therefore, to sum it all up, if you are intent on trading a single currency through several trades, make sure that your 2% risk is divided accordingly, based on the number of trades you enter. We can see from this how trading requires precision both in terms of settings and emotions. Traders may know everything there is to know about entering a few trades involving the same currency at the same time, but the excitement and the enthusiasm may still blur their vision and prevent them from interpreting their results in an objective manner. The testing should help traders get accustomed to their systems, wins, and losses, but the topic of risk management cannot unfortunately be applied in this format to backtesting due to its complexity. The psychological side of trading can become increasingly heavy on the trader if they fail to recognize which role their emotions play in risk management, causing traders to either take too little or too much risk. While forex is a complex net connecting various fields of our existence, articles such as this one can serve to guide individuals on their way of bettering themselves, their prospects of making money, and thus their living conditions as well.


Categories
Forex Indicators

What You Need to Know About Trading with the Williams %R Indicator

Do you trade using indicators? Still do not know this indicator created by Larry Williams? The Williams %R indicator, although less popular than others, is worth studying.

Introduction

The Williams %R is an impulse indicator developed by Larry Williams. It moves between 0 and -100, providing information about the weakness or strength of a financial instrument, i.e., stocks, currencies, or commodities. It can be used as overbought/oversold levels, impulse confirmations, and trading signals. Readings from 0 to -20 are considered overbought. Readings from -80 to -100 are considered oversold levels.

Calculus

The formula used to calculate the Williams %R is:

% R = (Maximum – Closing) / (Maximum – low) * -100

Minimum = lowest minimum over the period analysed.

Maximum = highest maximum in the period analysed.

The default setting for the Williams %R is 14 periods. It can be days, weeks, months, or an intraday period of time. An R %of 14 periods would use the most recent closure, the maximum of the last 14 periods and the minimum of the last 14 periods. The Williams %R has only one line by default.

When the indicator is:

-Near zero shows that the price is quoted near or above the maximum during the period analysed.

-If the indicator is close to -100, the price is traded near or below the minimum of the analysed period.

-Above -50, the price is traded within the upper part of the period analysed.

-Below -50, the price is traded at the bottom of the period analysed.

If we look at the daily chart, AAPL shows overbought at the -4 level. Back sessions were at the -80 oversold level.

Interpreting

Williams’ interpretation of %R is very similar to that of the Stochastic Oscillator, except that %R is traced backward and the Stochastic Oscillator has internal smoothing. Williams’ interpretation of %R is very similar to that of the Stochastic Oscillator. Values in the range of 80% – 100% want to tell us oversold, while readings in the range of 0 to 20% suggest that it is overbought.

Like other overbought indicators – oversold, the most favorable thing will always be to wait for the price to change direction before trading. The over-purchase may remain for an extended period of time. For example, if an overbought indicator – oversold (such as Williams’ Stochastic Oscillator or %R) shows an overbought condition, it is advisable to wait for the price to fall, before selling if you already have a long position or a stop loss.

Often, the %R indicator helps to find a turnaround in the stock market almost at the right time. The indicator usually forms a peak and then turns offa few days before the value price turns. Similarly, the %R usually creates a drop and goes up a few days before the price resumes.

Like the vast majority of overbought indicators – overbought, it is much better that we wait for the price to change direction before trading.

Using the William %R Indicator Correctly
  • To identify over purchases in an Index or stock.
  • Centre line of the WILLIAMS %R indicator.
  • Divergences

Let’s look at each of them in the most detail.

To identify levels of over-purchase:

The indicator ranges from 0 to -100. No matter how fast action moves or falls, the Williams %R indicator fluctuates in this range. Oversold and overbought levels can be used to make an identification price extremes, which appear to be unsustainable.

-Williams %R above the threshold of -20 is considered overbought.

-Williams %R below the threshold of -80 is considered to be oversold.

As is known, a market may remain overbought for an extended period of time. Trends with some strength usually present a problem in these oversold levels – overbought already classic. WILLIAMS %R can be overbought (> -20) and prices can simply continue to rise when the uptrend is strong. In contrast, the WILLIAMS %R may be oversold (-80) and prices may simply continue to fall when the trend is strong.

Amazon has a WILLIAMS %R at 14%, in a daily chart. Seeing, from left to right, Amazon came to overbought at -3 in early December, when it traded around 696. Amazon did not reach the peak level as soon as the overbought reading appeared. It took a few days but then we saw a drop of almost 149 points. 19%. From overbought levels of -3.1, the WILLIAMS %R moved around -98 in mid-January towards the oversold terrain. Despite this oversold reading, Amazon continued to fall to the ground on January 20. Traders must always confirm the WILLIAMS %R indicator with price action or price action. On 20 January a Hammer sail was formed with the oversold WILLIAMS %R. This confirms that the short-term soil was reliable and recovered up to $638 a share. The WILLIAMS %R indicator was overbought and again we saw drops. Overbought and oversold levels are marked on the charts.

Centre line of indicator WILLIAMS %R:

The WILLIAMS %R indicator detects bullish and bearish movements in the market by observing when crossing above or below the WILLIAMS% R-50 level. After being overbought and oversold, if the Williams %R crosses the -50 line, it usually indicates a change in movement.

If you can find the Microsoft chart from April 20, the DOJI formed by Microsoft suggests a trend change. It also broke -50 which also suggests a change. In the example illustrated above, the %R of MSFT was overbought, then the share price began to fall and the %R crossed below the -50 line quickly, before most of the bearish movement occurred.

It is advisable to use the price stock with this Williams-based %R strategy to increase the odds of success. . As you may have observed, in the above example, the bar that pushed the reading of the Williams %R, below -50, was a DOJI. This usually warns of a change of trend if the next candle is also bearish. Traders should open short positions in MSFT with Stop Losses just above the DOJI sail. The trader would have entered the market when the bearish momentum was at its highest. Therefore, you could have managed to place a tighter stop loss, which in turn would increase your risk/reward advantage in this particular operation.

It is possible to use this strategy to be able to open a long position when the %R is above -50after it has been oversold for a period of time.

It is highly recommended to use price action in combination with this Williams-based %R strategy to increase the odds of success.

Divergences:

The WILLIAMS %R divergence occurs when there is a difference between what the price action indicates and what the WILLIAMS %R indicates. These differences can be interpreted as a sign of an imminent turn. There are two types of divergences. Bearish and bullish.

Bullish divergence WILLIAMS %R:

A bullish divergence occurs when the WILLIAMS %R is oversold, below -80, increases above -80, remains above -80 in recoil, and then breaks over its previous reaction at a higher level. A bullish divergence forms when prices move to a lower minimum, but the indicator forms a higher maximum.

WILLIAMS% R bearish divergence: when the price reaches a new maximum, but the WILLIAMS %R reaches a lower maximum.

If you can see a Facebook chart, the price dropped to 77.22 on May 5. WILLIAMS %R went straight to the oversold area. It moved up and up even further, but the price dropped to 76.79 on May 12. Once the WILLIAMS %R moved above -80 and we had a bullish enveloping pattern, as shown above, we marked the turn. The price recovered up to $83.

Conclusion

The WILLIAMS %R index is a unique impulse indicator that has stood the test of time. The WILLIAMS %R is best suited to identify possible spins in overbought/oversold levels and bullish/bearish divergences. As with most indicators, WILLIAMS %R should be used in combination with another indicator or with the price action. It is possible and positive to perform the combination of using WILLIAMS %R with price patterns with the objective of increase signal robustness. If you operate intelligently, by combining price action, and use the Williams %R to confirm the momentum in the market, your likelihood of ending a profitable trade would greatly increase.

Categories
Forex Signals

AUD/USD Succeeded to Stop Its Overnight Losses – Combination Of Factors in Play! 

During Monday’s early Asian trading session, the AUD/USD currency pair succeeded to stop its overnight losing streak and caught some sharp bids around above mid-0.7200 level mainly due to the risk-on market sentiment, which tend to support the observed risk currency Australian dollar and offers to the currency pair gains. Therefore, Democratic candidate Joe Biden’s victory in the U.S. presidential elections was supported by the market trading bias. Aside from this, the market trading sentiment was further supported by Brexit’s confidence, which boosted the currency pair. Across the pond, the broad-based U.S. dollar selling bias, triggered by the marker risk-on sentiment, also played its major role in supporting the currency pair. 

Moreover, the U.S. dollar losses were further bolstered by the intensifying doubts over the U.S. economic recovery as U.S. total coronavirus cases surpass 10 million. On the contrary, the long-lasting coronavirus woes in the U.S. and Europe and Trump’s challenges to the election results keep challenging the upbeat market sentiment, which becomes the key factor that kept the lid on any additional gains in the currency pair. The AUD/USD is trading at 0.7269 and consolidating in the range between 0.7268 – 0.7290.

Despite the doubts over the global economic recovery from intensifying coronavirus (COVID-19) woes in the U.S. and Europe, the market trading sentiment ticked up to the 4-week high at the start of the week’s trading and remained supportive by the Democratic candidate Joe Biden’s victory in the U.S. presidential elections. Despite many lawsuits filed by the Trump administration against the result of the presidential election, the market traders still believe that the Republican member will not keep the White House leadership. Although, the optimism surrounding the Bidden victory was further bolstered after the JPMorgan Chief Executive Jamie Dimon said that “We must respect the results of the U.S. presidential election and, as we have with every election, honor the decision of the voters and support a peaceful transition of power.” However, this helped the market’s risk sentiment and undermined the U.S. dollar’s safe-haven demand.

Across the ocean, bullish sentiment around the equity market was further bolstered by the optimism concerning Brexit, which was recently triggered after the European Union’s (E.U.) Brexit negotiator Michel Barnier recently said that he is pleased to be back in London for Brexit talks.

On the contrary, the intensifying coronavirus woes in the U.S. and Europe and intensifying lockdowns restrictions in Europe keep challenging the upbeat market sentiment and become the key factor that kept the lid on any additional gains in the currency pair. As per the latest report, the coronavirus cases (COVID-19) have exceeded 50 million globally over the weekend. At the same time, the number of infections in Europe was registered approximately 300K in one day. At the U.S. front, the U.S. reported a record rise in coronavirus cases for a 4th-consecutive day with at least 131,420 new infections, bringing the country’s total count to around 9.91 million. Simultaneously, the number of deaths in the U.S. was more than 1,000 for a 5th-consecutive day. It is also worth mentioning that 242,230 people have died from the infection in the U.S., and 6,391,208 have recovered so far. Considering the current coronavirus condition in Europe, the major Europeans like Germany and France have imposed severe restrictions to try controlling the spread. 


Moving ahead, the market traders will keep their eyes on the U.S. economic calendar, which highlights updates on inflation and consumer confidence along with Thursday’s report on initial jobless claims. In the meantime, the Brexit trade talks’ updates could not lose their importance on the day.

The AUD/USD consolidates with bullish sentiment at the 0.7294 area, facing a solid resistance at the 0.7294 level extended by a triple top pattern. On the higher side, the upward breakout can drive the buying drift to the 0.7346 mark. Alongside this, the support extends to operate at the 0.7220 mark today. The MACD trades with a mixed bias; nevertheless, it can adapt bullish if AUD/USD runs to crossover 0.7295 mark. Good luck!

Categories
Forex Market Analysis

Daily F.X. Analysis, November 09 – Top Trade Setups In Forex – BOE Gov Bailey Speaks! 

On the news front, the investor’s focus is likely to stay on the German Trade Balance, and the ECB President Lagarde Speaks ahead of the BOE Gov Bailey Speech during the European session today. German Trade Balance is forecasted to improve from 15.7B to 17.2B, and it may help support the Euro as a single currency, while the ECB President Lagarde and BOE Bailey is scheduled to speak at Green Horizon Summit via satellite.

Economic Events to Watch Today  


EUR/USD – Daily Analysis

The EUR/USD pair was closed at 1.18746 after placing a high of 1.18907 and a low of 1.17952. The EUR/USD pair was rose to its highest level since September 15 on Friday. The EUR/USD pair has been holding onto gains as the markets were following the U.S. elections. The lead of Democratic Joe Biden in U.S. elections kept the U.S. dollar under pressure and supported the EUR/USD pair’s bullish momentum.

The safe-haven dollar remained on the back foot throughout the week and pushed the riskier EUR/USD pair to its multi week’s highest level. The greenback was also weak due to the dovish decision by Federal Reserve this week. The Federal Reserve Chairman, Jerome Powell, said that the pace of the recovery was moderated and that fed has discussed the bond-buying scheme. He also showed his concerns about the resurgence of coronavirus in the U.S. and all over the globe and urged lawmakers to act.

On the data front, at 12:00 GMT, the German Industrial Production for September declined to 1.6% from the forecasted 2.6% and weighed on Euro. At 12:45 GMT, the French Prelim Private Payrolls for the quarter raised to 1.8% from the forecasted 0.2% and supported Euro that added in the gains of EUR/USD pair. The French Trade Balance for September came in as -5.7B against the expected -6.9B and supported Euro. At 14:00 GMT, the Italian Retail Sales for September came in as -0.8%against the expected -1.5% and supported Euro and pushed EUR/USD pair higher.

At 18:30 GMT, Average Hourly Earnings from the U.S. for October dropped to 0.1% from the projected 0.2% and weighed on the U.S. dollar and supported the upward trend of the EUR/USD pair. The Non-Farm Employment Change for October elevated to 638K against the predictable 595K and supported the U.S. dollar. In October, the Unemployment Rate from the U.S. dropped to 6.9%from the projected 7.7% and supported the U.S. dollar. At 20:00 GMT, the Final Wholesale Inventories for September came in as 0.4% against the expected -0.1% and weighed on the U.S. dollar that ultimately added strength in the EUR/USD pair on Friday.

The COVID-19 cases have been continuously rising on both sides, Europe and the USA, and once the U.S. elections settle, the par could see a decline in its prices.

The focus of market participants was only on the U.S. election, where over the weekend, the Democratic Joe Biden won the presidency of the United States and became 46th President of the USA. Despite the lawsuits claiming electoral fraud, Biden was elected as U.S. President and weighed on the U.S. dollar that ultimately will help the EUR/USD pair to post further gains.

Daily Technical Levels

Support    Resistance

1.1733      1.1884

1.1647      1.1947

1.1583      1.2034

Pivot point: 1.1797

EUR/USD– Trading Tip

The EUR/USD is trading bullish at the 1.1890 level amid a weaker U.S. dollar. The pair may head further higher until the 1.1945 level, having immediate support at the 1.18826 level. On the 4 hour timeframe, the EUR/USD has violated the double top resistance level of 1.1882 level, which may lead the EUR/USD pair further higher until the 1.1945 mark. The MACD supports buying; therefore, we should look for a buying trade over the 1.1880 level.  


GBP/USD – Daily Analysis

The GBP/USD pair was closed at 1.31474 after placing a high of 131770 and a low of 1.30924. The GBP/USD pair rose to its highest since September 07 on Friday despite the better than expected Unemployment rate and NFP data from the U.S.

The market’s focus was shifted to the U.S. Election results that were showing a Democratic lead; it weighed on the U.S. dollar and contributed to the GBP/USD pair’s gains. The strong Employment figures also failed to improve the mood around the U.S. dollar as investors were not impressed by it, and they continued following the U.S. election results.

Over the weekend, Joe Biden won 290 Electoral College votes against Donald Trump’s 214 that confirmed Biden’s victory as the candidate should secure at least 270 Electoral College votes to win the presidency.

On the data front, at 13:30 GMT, the Halifax Housing Price Index for October declined to 0.3% against the forecasted 1.0% and weighed on British Pound and capped further gains in GBP/USD pair.

On the U.S. front, at 18:30 GMT, Average Hourly Earnings from the U.S. for October fell to 0.1% from the estimated 0.2% and weighed on the U.S. dollar and supported the upward trend of the GBP/USD pair. The Non-Farm Employment Change for October rose to 638K against the estimated 595K and supported the U.S. dollar. In October, the Unemployment Rate from the U.S. fell to 6.9%from the estimated 7.7% and supported the U.S. dollar. At 20:00 GMT, the Final Wholesale Inventories for September came in as 0.4% against the estimated -0.1% and weighed on the U.S. dollar and provided strength to the GBP/USD pair.

The improved employment figures from the U.S. failed to give any strength to the falling U.S. dollar on Friday as the focus of traders was only towards the U.S. election results leading Joe Biden over Donald Trump. Whereas, on the Brexit front, the UK PM Boris Johnson will be under greater pressure to strike a Brexit deal with the E.U. as Joe Biden has won the presidency. It is because a no-deal Brexit could seriously threaten relations with a new Democratic administration.

Joe Biden has already made it clear that there will be no agreement on a post-Brexit UK-US trade deal if the U.K. disagreed with the E.U. The talks between E.U. & U.K. officials were continued throughout the week, and the result of those talks has not been published yet. The market’s focus will be shifted towards economic data and other fundamentals rather than on U.S. elections in the coming week as the uncertainty regarding the U.S. election has faded away.

Daily Technical Levels

Support    Resistance

1.2997      1.3222

1.2851      1.3301

1.2771      1.3448

Pivot point: 1.3076

GBP/USD– Trading Tip

The GBP/USD is also trading with a strong bullish bias due to a weaker dollar in the 1.3181 area. The pair has violated the intraday resistance level at 1.3159, which is now working as a support for Sterling. On the higher side, the continuation of an upward trend can lead the GBP/USD pair until the 1.3226 area. The cable had violated the descending triangle pattern, and ever since, it’s trading with a bullish bias. 


USD/JPY – Daily Analysis

The USD/JPY pair was closed at 103.364 after placing a high of 103.758 and a low of 103.174. The USD/JPY pair was dropped to its lowest since 8th March. The U.S. dollar against the Japanese Yen on Friday dragged the pair to a fresh 8-months lowest level as the chances for Joe Biden to win the U.S. election increases. The USD/JPY pair followed the USD weakness throughout the week and reached the 103 level.

The investors have welcomed a Democrat government’s prospects with a split congress where Republicans can block initiatives to raise taxes or introduce tighter regulations with a risk rally that sent the safe-haven U.S. dollar to multi-month lows against its main rivals.

On the data front, at 04:30 GMT, the Average Cash Earning for the year came in as -0.9% against the forecasted -1.1% and supported the Japanese Yen and added further losses in the USD/JPY pair. The Household Spending for the year came in as -10.2% against the expected -10.5% and supported the Japanese Yen that added further weakness in the currency pair USD/JPY.

From the U.S. side, at 18:30 GMT, Average Hourly Earnings from the U.S. for October weakened to 0.1% from the anticipated 0.2% and weighed on the U.S. dollar added further losses in the USD/JPY pair. The Non-Farm Employment Change for October surged to 638K against the anticipated 595K and supported the U.S. dollar, and capped further losses in the USD/JPY pair. In October, the Unemployment Rate from the U.S. weakened to 6.9%from the anticipated 7.7% and supported the U.S. dollar. At 20:00 GMT, the Final Wholesale Inventories for September came in as 0.4% against the anticipated -0.1% and weighed on the U.S. dollar and dragged the pair USD?JPY to the multi-month lowest level.

The USD/JPY pair’s main driver at the ending day of the week remained the U.S. dollar weakness due to Biden’s prospects in U.S. elections. Over the weekend, the results showed that Biden won 290 Electoral College votes compared to Trump’s 214 and became the 46th President of the U.S. Biden is expected to deliver a larger stimulus package, and the markets were following these hopes that could lead further to the downside of the safe-haven U.S. dollar.

Daily Technical Levels

Support    Resistance

103.09      104.22

102.70      104.95

101.97      105.34

Pivot point: 103.83

USD/JPY – Trading Tips

The USD/JPY has violated the descending triangle pattern at 104.149 area, and on the lower side, it’s testing the support area of 103.270 level. Recently the closing of bullish engulfing patterns may drive an upward movement in the market. On the higher side, the USD/JPY can go after the next 103.850 mark. On the flip side, violation of the 103.215 level can extend selling until the 102.750 mark. The MACD is also showing oversold sentiment among investors; therefore, we should look for a bullish trade over 103.270 and selling below the 103.830 level today. Good luck! 

Categories
Forex Basics

What No One Else is Telling You About a Real Trader’s Daily Routine

What’s the secret to trading success that you won’t read about in books or won’t even hear mentioned too often?

It’s kind of funny but there are some things traders almost never talk about – even among themselves – but when you start to quiz them about these topics, they actually love talking about. They just somehow don’t seem to bring them up on their own. Well, one of these topics is a trader’s daily routine. You’ll never hear a trader start talking about their daily routine and the number of people talking about this versus just about any indicator or trading tool is vanishingly close to zero. And yet, if you ask an experienced trader about their trading routine, you may as well settle down for the long haul because they can talk about this sort of thing for hours and go into great detail.

In fact, we recommend you do talk to more experienced traders about this because the amount of things you’ll be able to learn is equivalent to a small goldmine of knowledge and hints and tips. And the beauty of it is that this is the sort of stuff you’re never going to learn about in books and that nobody really talks about on the forex internet. Instead, most traders sort of work this out by themselves, usually over many years of trial and error. And both the trials and the errors can amount to a painful learning curve that will not only leave you stressed out and dissatisfied, it could also cost you potential gains.

But ultimately, having a well-worked out and systematic daily routine to your trading could mean the difference between being an amateur who’s just playing around with trading for a few extra bucks and a proper, professional forex trader who has made this activity into a veritable career. In other words, into someone who has committed to forex trading on a fulltime basis and is determined to see it through until they retire or – as is the case with most people who have made a genuine commitment to trading – well beyond their retirement and probably until the day they die. In many ways, at one point being a forex trader ceases to be something you do and becomes something you are.

Well, one of the steps along the way to that transition is working out a reliable and consistent but manageable daily routine. You can think about it like this: If you wanted to be a professional in any other business or walk of life, you would have a schedule of working hours and tasks that would shape every day you’re working. 

It’s different when you’re just starting out, of course. That’s when trading has an excitement to it and the adrenaline will keep you going through a lot of bumps on the road for many years. But when you’ve been doing this for many years – over a decade, say – the excitement gets worn down somewhere along the way. Thankfully, it takes a few other things with it. The stupid beginner mistakes are also gone, as are the sleepless nights or the nights spent staring at the charts. Also gone is the undercurrent of anxiety you feel about making mistakes or making the wrong decision. Instead, all of this is replaced by a steady, often repetitive, daily grind. In other words, a routine that makes trading feel more like a business.

Well, part of working out your daily trading routine is making the mental shift from thinking of trading as an activity you do on the side, to thinking of yourself and your trading as a business. And that’s not a bad thing. Making forex trading into a legitimate business – filing business taxes, managing business bank accounts, keeping track of business expenses – makes it seem like a different activity to when you’re just a lone wolf out there on your own, trying to learn how to make trading work for you.

As with any legitimate business, there are going to have to be those few things you have to do regularly and, if you want to be successful, you’re going to have to do them well. Most successful businesses will have set hours – not based on when they want to work but dictated by external factors, such as when it’s optimal to work. Say you have a small restaurant, you’re going to want to catch the lunchtime rush and the evening dinner crowd. It’ll hurt your business if you miss these peak times of the day while your competitors are taking your clientele and you’re still paying rent on the space. And you need to know when those peak times are every day so that you can plan in advance and have everything set up. It’s no good to you if your lunchtime customers are coming in but you’re still cleaning tables and getting the kitchen set up.

Most people don’t treat forex trading like a business – at best they treat it as a side-gig or, at worst, as a hobby. And most people don’t manage to make forex trading successful. But if you do want to make it work for you, you have to make that switch. Therefore, setting out a comprehensive daily routine is a huge part of becoming a truly professional forex trader. The absolute worst thing you can do is go in with no plan, no structure, and no routine. With no routine, you will inevitably end up sitting in front of your system all day long, which will have a few very negative knock-on effects. First, you will not be using that time constructively and most of it will be wasted in endless loops of, “should I trade now? …Or now? …Or now?” And not only this but you will almost certainly end up falling into the trap of over-trading – i.e. trading too often, out of boredom, or because you feel the pressure to make all the time you’re investing count for something.

In a manner of speaking, traders who focus all their energies on equities have it easy. Stock markets are only open for seven and a half hours per day, which is actually very useful. First of all, it gives you a set structure right there – your trading is limited to this window and someone else has decided for you when this window will open and when it will close. Secondly, it only gives you so many hours in which to be an idiot. This is especially useful when you’re starting out because making mistakes will be a big part of what you do. But with forex trading, on the other hand, you have almost all the time in the world to be an idiot and make mistakes because the markets are open for neigh on 24 hours per day. You can sit yourself down in front of your system at just about any time of your choosing and make a mistake. Also, you can get sucked into checking on the markets at all kinds of times of the day. Hey, we’ve all done it. It’s three in the morning but why don’t I just check the markets one more time, just in case. We’ve all been there. But thankfully, because you’re now reading this and with a bit of luck some of it’s getting through, maybe you can recognize this behavior when it crops up and avoid doing it for years on end.

Going from part-time trading to full-time is a tricky business. Your instinct is to think that now things are going to be easier because you have fewer commitments preventing you from trading. But actually, the opposite will turn out to be true – unless you have a strict routine.

Ultimately, this is a question of self-discipline. Those traders who work this out somewhere along the line – whether it is sooner or later will depend on their own personal make-up – will have a much better shot of turning their trading into a successful business. Those who never figure it out will eventually fail and be left by the wayside.

Part of the problem is the essential rhythm inherent to trading. The markets have their own ups and downs, periods of activity, and lulls where nothing is happening. There will be days – sometimes several in a row – where you simply end up doing no trading. The danger here is that you will start to get itchy fingers and will probably end up pulling the trigger on a trade or on several trades that you should have stayed out of. All because you end up feeling like that time you put in just waiting is wasted and you get eager to make up for it. Part-timers don’t suffer from this in the same way because the time they have for trading is more limited by other factors (like their day job) but it is a bit pitfall for full-time traders.
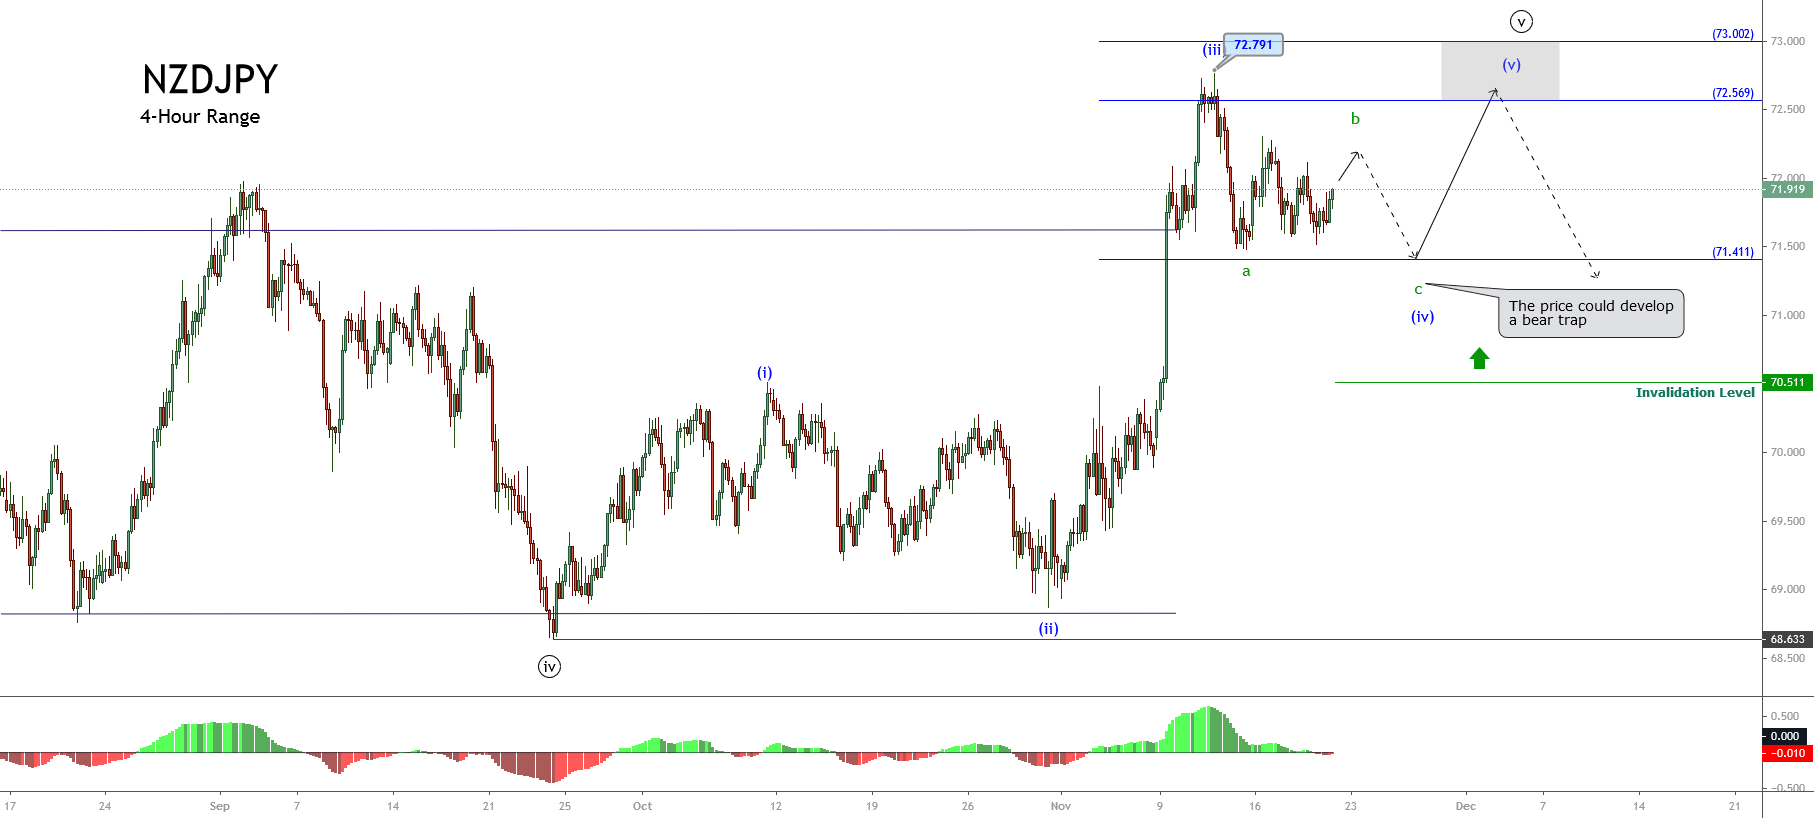
The smarter traders out there will use some of the time they spend in front of their system to run tests of tools or indicators that might end up becoming useful tweaks to their system in the future. That goes some way to alleviating that sense of wasted time.

Designing Your Routine

How you design your daily trading routine will depend on a lot on you. It isn’t entirely up to you because you won’t be able to completely avoid those times when the markets are lively or those news events that come in from time to time to give the price of a pair of currencies a kick in one direction or the other. But you will need to tailor your routine to fit with other parts of your life. Lots of traders out there have families and children and those are a good example of commitments that are external to your trading but that are ultimately more important. You will need to find a balance that works for you and enables you to still live your life the way you want and keep in mind the needs of your family.

But what do you do with those conflicts that are going to crop up from time to time? Say there’s a big news event coming up and it clashes with something else important in your life – say your daughter’s recital for example. This is where that self-discipline comes in because you are going to have to be strict with yourself. If you are a professional forex trader, you will essentially be trading for the rest of your life. That means you will likely see hundreds of similar news events and have plenty of opportunities for those juicy trades. You can get a hold of your fear of missing out and go to your daughter’s recital.

At the end of the day, if you don’t take control of your trading, your trading will take control of you. Everyone out there who has been trading for any meaningful length of time will have had this feeling like the market has begun dictating things in their life. Though you have to factor in big market events into your routine, you also have to make sure that the whims of the market and your desire to always be trading don’t start to impact your quality of life. We all got into trading because we want our lives to be better – if it starts going the other way, you need to be aware of that and you need to rein it in.

One of the ways you can begin to do that is to plan each trading week out in advance. Sit yourself down on Sunday night and go through your calendar of market events for the coming week. If you see gaps where there are likely to be quiet periods in the markets during the week, prepare some testing and research you can do during these times. In order to do this properly, you will need to be on top of the news cycle for the currencies you are trading. You can’t possibly account for the unexpected news events that will come out of the blue – that’s why they’re unexpected. But you do need to have a calendar of the regular news cycle that can become part of how you plan your trading schedule. 

Set up a calendar of regular news events such as central bank announcements, national GDP reports, and other economic forecasts made by governments and the major financial institutions. You can treat this calendar as a constant work-in-progress project. You can constantly be updating it and also you can use it to cross-reference past events so that you build up a good sense of how they affected the markets.

Plan ahead so you can be trading and taking advantage of these times when there is energy in the market as long as they fit into the schedule you set yourself.

Every individual trader will have timeslots when they prefer to be trading – some prefer to trade the European market opens, like the London open, while others prefer to trade the Asian or American opens. How that fits into your schedule will depend on your other life commitments and also the time zone you’re in and trading different peak times in market activity will affect your lifestyle so you need to be sure you are making a conscious decision about when you trade.

Downtime

When you’re planning your week, you also need to plan times when you are away from your system. This is perhaps the hardest part of all. You will know after a while that there are times during the day when there is usually no real benefit to sitting in front of your system and entering trades. These are those times when the markets lose energy and become choppy and you will learn after a time when they usually happen. They can be quite annoying these periods because they usually come in the middle of the working day you set for yourself but they feel like wasted time.

This is where you can put your daily routine to work and schedule yourself tasks that take you away from trading during those quiet times. Doing this has multiple benefits. First, you cut down the chance that you will start entering trades or messing with your stops just out of sheer boredom. Second, it gives you a chance to go and do something other than trading, which will help you come back to your system with a clearer head at a time when actually entering trades is going to be more useful in any case. Thirdly, you won’t have a sense of wasted time and will give yourself a chance to make sure the anxiety this can cause doesn’t build up and make your trade out of panic.

So when you’re sitting down to plan your week, schedule some other activities during those lulls in the market to help you get through each trading day. Lots of traders will use this time to get away from the computer completely. Some use these times to run a second business, while others head down to the gym or go for a long walk. The determined traders will make use of these times to run backtesting on a technical indicator or review past trades. But all of these activities are ultimately beneficial because they stop you from spending those periods just waiting for things to pick up again and, at the end of the day, you won’t feel like that time is wasted.

The Take-Away

Planning your daily routine is one of the hardest things to figure out. In the old days, people were just left to their own devices and had to try to do it by trial and error. You’re lucky that you have read this article because even though it won’t change your life overnight, it will give you an awareness of how important your routine is to your trading. That’s gives you a chance to skip forward a few steps if you are willing and able to put some of this advice into action.

The way to design a workable routine is to treat your trading activities as a legitimate business, with office hours, daily tasks, weekly schedules, and proper planning. Doing this will help you to cut down on those usually terrible trades made out of boredom, out of panic, or for other emotional reasons.

Not only will your trading improve, but your life outside of trading will also improve. You will have to be strict with yourself but every time you are, you will be exercising your self-discipline muscle. In the end, this will make you more effective and ultimately more successful.

Categories
Forex Technical Analysis

Forex and Elections: Opportunity or Uncontrollable Risk?

Forex and all other markets surge with volatility during the US elections. Many promote this event as an opportunity to earn quick money although, in the end, it is the promoter who wins in some way. Traders who have an understanding of how we approach uncontrollable risk coming out from election events know we choose to avoid rather than to bet. The plan we put in place for such occasions is adequate for those who follow our trading ways and systems, however, the tips we are about to present are for everyone. Traders should take these recommendations as they fit, they are just a part of one technical prop trader group researching an experience. One is certain, only when we have a plan or rulebook we also reduce the risk of completely busting our accounts during elections. In our case completely protected since such uncontrollable risk is avoided by simply not trading. We will tackle different markets where buy and hold strategies are applied and a plan for all major 8 currencies regarding elections or other significant events such as Brexit. 

Losing a major part of your hard and slow gains in just a few election days is also very discouraging for traders. But, as our prop traders used to say, you have a decision to make. Decide if you want to have control over your account or leave it to somebody else. By somebody else we mean the big banks, news, how people interpret the news, “experts”, and so on. Technical traders dislike fundamentals, everything out of their technical analysis is detrimental and a risk to change trends before they hit their first targets. Whatsmore, according to this trader group, fundamentals do not always drive the market in a logical way. Fundamentals info will just mess with your trading and this is very amplified during elections. We want as much control over our account as possible and for that we need caution some might consider as too conservative. However, now we are here for the steady long-term trading returns, and the election period does not deserve a chance to ruin that work. So instead of entering the storm and trying to drive through, we just stop and wait for it to pass. If we enter the storm we are leaving the majority of control to its mercy. 

Let’s start with the non-USD currency pairs plan. Elections are one of the biggest market disruptors but other events can also have a similar impact, like viruses, wars, or Brexit, for example. In all such scenarios stop trading all currency pairs that contain that country currency involved. So if New Zealand is having elections, stop trading all NZD pairs. Trades already going should be closed, be it on breakeven, in profit or loss. Stop trading 4 days prior to the event, and 4 days after. Still, if you see things are not calming down, consider waiting some more. 

USD currency pairs are largely dominated by the USD movements. If elections or other major events are related to the United States, shut down all of your trades, from all currency pairs. The avoidance plan also involves 4 plus 4 trading days (not weekends) before and after the event. Now you may wonder why this 4+4 plan. Well, before elections there is a lot of positioning by the big banks, investors, algo traders, and other market participants and prepare to enter the event. This may not shake the market as the election trading itself but still can shake our trades off the direction. You do not want to let others control the trends so you avoid them altogether. Hopefully, revenge trading is not your thing, especially during elections, it is an easy way to bust the account.

So this is why 4 days before the elections and of course, during the elections spreads are extreme, movements do not make any sense and you see some strategies to pop up how to trade this event on social media. These strategies do not follow any trends, in any timeframe because they do not exist. Extreme spikes can crush any predictions or trades you may have in a single candle. Four days after the election the markets exhibit reactionary price action or the shakeout. All this is uncontrollable, the big banks can force the move wherever they see fit and have the media to explain the move with whatever reason tied to elections. 

Market manipulation by these big players in the forex is very present during elections. Let’s take a look at the charts on election day in November 2016:

The ATR (14) value on a daily time frame on the day before the elections (candle marked by a yellow circle) was 65 pips. Election day candle moved down about 100 pips on this EUR/USD pair at price close. This movement pip value does not imply anything unusual. It is the spike that knocked out every possible Stop Loss levels in the emerging downtrend. The spike is about 275 pips on the upside and about 100 down to close the day. The price action like this reminds of flash crashes except this one is on election day we all know when it is going to happen. Interestingly, the price action does not make any deviations if we take into account the range from open to close. It is the intraday action that wreaks havoc. We use the daily timeframe for reasons already explained in previous articles so the indicators used in our algorithm structure do not get thrown off on this chart. But let’s get onto another currency pair without the USD – EUR/GBP.

The same US election day in 2016 is not the flash crash a few weeks before but the day marked in a yellow circle. Notice similar price action on this non-USD currency air, a Stop Loss spike to the up, and then candle close like normal. Flash crashes on the GBP might have thrown some indicators off to the point they are not reliable until they get normal values in balance. According to the ATR (14), volatility before the election day was 67 pips. The move down was about 120 pips and the spike up 121 pips. Even on cross pairs unrelated to the US elections, the big banks have a free pass to whipsaw Stop Losses. Exactly the reason why technical prop traders suggest shutting down all trades before and after US elections on all currency pairs. If we go far away from the USD and pick, for example, AUD/NZD, the situation is the same: 

The election day candle is marked in a yellow circle and has the same properties – with a big Stop Loss hunting wick. The day after has a long wick to the upside in case anyone went short. The next example is on the S&P 500 index, it is not only present on forex. 

Here we see a Stop Loss triggering with an extremely long wick for anyone in a long position on this emerging bullish trend. Even on a weekly timeframe, this push would trigger concentrated Stop Loss levels all traders considered to be at optimal positions. These pending orders were created before the election day since the markets were closed for trading. Traders could just observe how their far Stop Loss gets triggered only to return everything to normal before day close. It is logical to put Stop Loss orders some distance below the last candle lows, in case the equities market crashed. However, this scenario did not happen, yet traders took the loss as it had. The trend continued but without long positions in it. The avoidance plan protects traders from this risk if you are trading on daily and weekly charts. 

Understand that every election is different. This date is specific because Trump won the elections he was not supposed to. In previous elections, Obama was expected to win and he did without much drama. Chaos during the last elections was caused by several drivers and the one in 2020 is going to be for other reasons. If we get very big candle bodies during the next elections, depending on the system you have made, traders may need some time before the elements get back into nominal reading, maybe even more than our proposed 4 days. Accordingly, you will have to adapt to new conditions. Your ATR, confirmation, and volume indicators get out of normal reading consequently setting you money management out of optimal ranges. 250 to 350 pip candles during elections will definitely do this, since ATR is set to 14 periods, you may need to wait for a week to get into normal. Similarly to when flash crashes happen, the procedure is the same. 

These rules might test your patience if you have a habit to have more trades open. Patience will reward you, it is just 8 days out of the 4 years after all. Apart from the good setups for trading during the elections, you might be tempted to trade by social media too. The networks will be full of strategies on how to profit from the election’s hyper movements, causing the fear of missing out on many amateur traders. Prop traders have mastered how to manage feelings like this long ago, and you should follow despite what you read on social networks. This is not the long term game we play. 

Elections in 2020 are going to be very specific also because it seems the final results will be known several days after the election day. According to certain headlines, North Carolina is allowed by Federal court to accept mail-in ballots nine days after polls close. If the results are tight and these polls are decisive we will have chaotic price action on more than one day. How the big banks and investors will react to all this fundamental stimulus is unknown. So even a 4 plus 4 days plan might not be enough since every election is different. Technical traders will have to pay attention to fundamentals too now, adapt to the specifics of every election. After all calms down, usual trading may resume. 
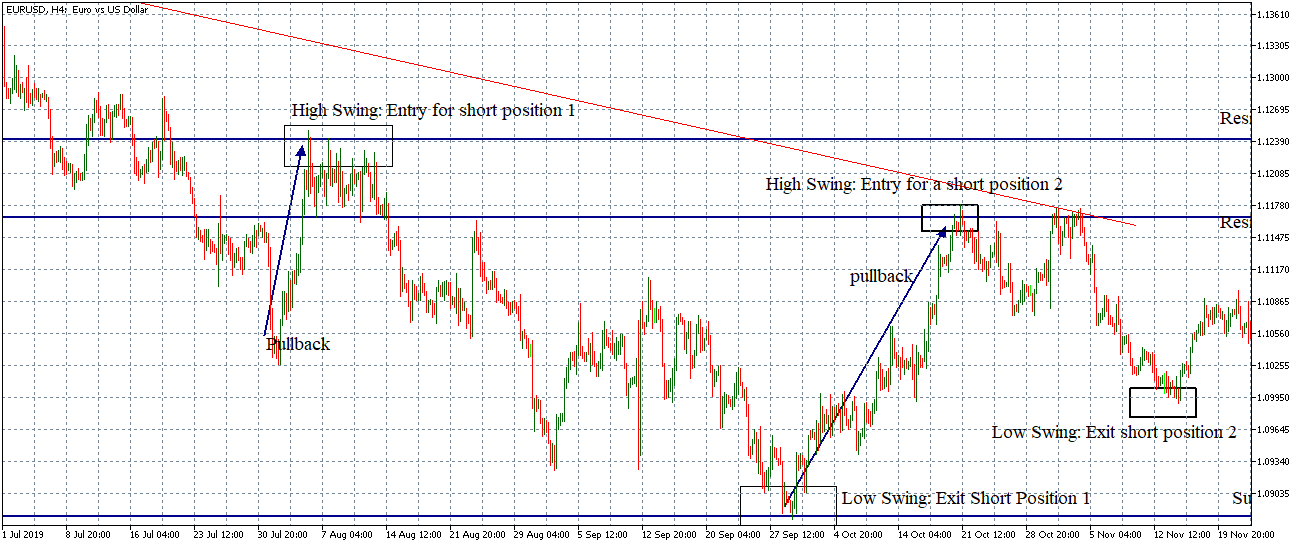
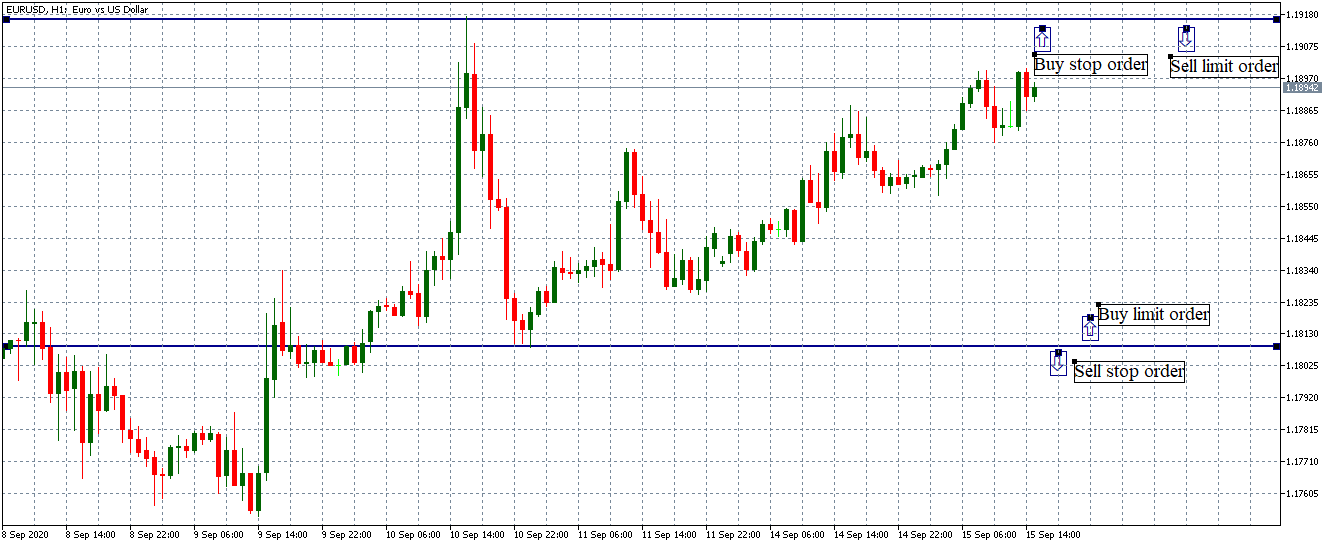
Twitter is a good source to follow like-minded investors who do not involve election trading. If you are not really well informed or follow headlines, follow people that are. Tweeter has several groups that know about the risks and are well informed fundamentally. YouTube can be a second source although you will have to dig through the more popular all-in election trading top lists. 

In other markets, precious metals, oil, crypto, and the like, most of the assets are expressed in the USD, meaning the same avoidance plan applies to them too. However, you may wonder should you make any adjustments to buy and hold strategies investors usually apply to precious metals and crypto. These strategies have such long term goals elections are just an abysmally small period and volatility spark does not affect them at all. If you are true to your buy and hold strategy, you are not going to change anything, elections will be a temptation. These strategies should be designed to last for years. Do not try to make sense to invest more into gold or crypto during elections, chaotic periods logically should drive these safe assets higher, but elections moves do not follow any logic.

If for some reason gold or other non-fiat safe heavens drop more than 10% in the coming weeks, this is actually a good time to average down, look to buy more of these assets as they are likely setting up for a long-term bull rally. Averaging is not something you do in forex trading, however, long term strategies like buy and hold are very good for averaging down. Of course, this is just an opinion from prop traders who are into investing, you can do whatever you want. As a general tip for elections, stay out of trading with a plan, be patient, and know every election is different. Forget what social networks and portals are saying, stay patient, and prudent in your investing. The long game result will prove you are right even if it does not seem so at the moment.


Categories
Forex Market Analysis

Daily F.X. Analysis, November 06– Top Trade Setups In Forex – NFP Figures in Highlights! 

The eyes will remain on the U.S. NFP data on the news side, which is expected to report a slight drop from 661K to 595K during the previous month. Besides, the U.S. Average Hourly Earnings m/m and Unemployment Rate will also remain the main highlight of the day, and these may determine the USD trend for today and next week. Let’s wait for the news.

Economic Events to Watch Today  


EUR/USD – Daily Analysis

The EUR/USD pair was closed to 1.18269 after placing a high of 1.18595 and a low of 1.17106. The EUR/USD pair surged to its highest level since October 23 amid the U.S. dollar weakness ahead of U.S. election results.

The U.S. dollar came under fresh pressure after the chances for Joe Biden looked increasingly likely to claim the U.S. presidency. Furthermore, the U.S. stimulus package’s expectations will be delivered by any elected government after the results will also be announced exerted pressure on the U.S. dollar and supported the EUR/USD pair’s upward momentum.

On the data front, at 12:00 GMT, the German Factory Orders for September declined to 0.5% against the expected 2.1% and weighed on Euro. At 15:00 GMT, the Retail Sales from the Eurozone for September declined to -2.0% against the expected -1.4% and weighed on single currency Euro that capped further upside movement of EUR/USD pair on Thursday.

From the U.S. side, at 17: 30 GMT, the Challenger Job Cuts for the year from the U.S. came in as 60.4% in comparison to the previous 185.9%. At 18:30 GMT, the Unemployment Claims for the last week were rushed to 751K against the estimated 740K and weighed on the U.S. dollar added further in the gins of EUR/USD pair. The Prelim Nonfarm Productivity for the quarter surged to 4.9% against the predicted 3.6% and weighed on the U.S. dollar. At 18:32 GMT, the Prelim Unit Labor Costs for the quarter came in as -8.9% against the expected -10.0% and supported the U.S. dollar that capped further gains in EUR/USD pair.

Meanwhile, the European Commission reduced its economic growth prediction for next year after governments’ reintroduced lockdowns to control the coronavirus infections. On Thursday, the E.U. executive in Brussels anticipated Eurozone growth of 4.2 percent in 2021, down from 6.1 percent anticipated in July. For 2020, it expects the economy to shrink by 7.8 percent.

Furthermore, the ECB Governing Council member and Bundesbank President, Jens Weidmann, said that it was important for the ECB’s monetary policy to remain expansionary on Thursday. These dovish comments from ECB’s governing council member also added further pressure to cap the gains in EUR/USD. However, investors’ focus remained on the U.S. Presidential election as a winner has not been announced. As few states were still counting votes while the U.S. President Donald Trump is already disputing some results in court. It weighed heavily on the U.S. dollar and pushed the EUR/USD pair higher on board.

Daily Technical Levels

Support    Resistance

1.1733      1.1881

1.1648      1.1944

1.1585     1.2029

Pivot point: 1.1796

EUR/USD– Trading Tip

The EUR/USD pair is trading sideways between a narrow trading range of 1.1859 – 1.1759 amid a weaker dollar. A bearish breakout of the 1.1759 level may extend the selling trend until the 1.1727 level. Simultaneously, the bullish crossover of the 1.1859 area can lead the EUR/USD pair until 1.1895. Breakout highly depends upon the U.S. NFP data today.


GBP/USD – Daily Analysis

The GBP/USD pair was closed at 1.31502 after placing a high of 1.31545 and a low of 1.29309. The British Pound remained in demand and moved higher on Thursday against the U.S. dollar as the chances of Biden victory increased with the counting of votes.

The Bank of England announced on Thursday that it would expand its bond-buying structure by £150 billion to £895 billion, more than the estimates of a more modest £100 boost. Moreover, the BoE also renounced from setting negative interest rates that prompted investors to price that contrary development out.

Meanwhile, on late night Thursday, the Federal Reserve decision on interest rate did just like expected and left rates and bond-buying unchanged. The emphasis was on easing an additional stimulus required from the U.S. government and weighing on the greenback throughout this week.

The U.S. Dollar Index slipped to its lowest of 92.4880 on Thursday and gave strength to the rising GBP/USD pair. On the other hand, the Bank of England’s Monetary Policy Committee unanimously voted to maintain its benchmark bank rate at 0.1%. The market attention was captured by the changes to their Quantitative Easing and economic estimates mentioned in the monetary policy report.

The committee told that the rapid rise in COVID infection rates and subsequent restrictions across the U.K. forced it to respond by increasing its asset purchasing program by 150 billion British Pound to a total of 95 billion Pound surpassed the majority of market expectations of just a 100 billion increase.

The program will last until the end of 2021 beyond the summer, and instead of declining, the British Pound increased as the U.S. dollar was also declining on the day amid the election uncertainty. This added support to the GBP/USD pair that rose above the 1.31500 level on Thursday.

On the data front, the Asset Purchase Facility was increased to 895B against the expected 845B. The official bank rate from the Bank of England remained at 0.10%. At 14:30 GMT, the Construction PMI from Britain also declined to 53.1 against the forecasted 55.0.

From the U.S. side, at 17: 30 GMT, the Challenger Job Cuts for the year from the U.S. came in as 60.4% in comparison to the previous 185.9%. At 18:30 GMT, the Unemployment Claims for the last week advanced to 751K against the projected 740K and weighed on the U.S. dollar that added further to the GBP/USD pair’s gains. The Prelim Nonfarm Productivity for the quarter rose to 4.9% against the projected 3.6% and weighed on the U.S. dollar that added strength to the GBP/USD pair. At 18:32 GMT, the Prelim Unit Labor Costs for the quarter came in as -8.9% against the estimated -10.0% and supported the U.S. dollar.

Meanwhile, the U.S. dollar was also weak due to Biden’s chances of victory that would allow the issuance of a massive stimulus package after the election results. These hopes also weighed on the U.S. dollar and supported the GBP/USD pair’s upward trend.

Daily Technical Levels

Support    Resistance

1.2997      1.3222

1.2851      1.3301

1.2771      1.3448

Pivot point: 1.3076

GBP/USD– Trading Tip

Just like the EUR/USD, the GBP/USD is also trading sharply bullish, having violated the narrow trading range of 1.3122 – 1.2940 area. The Cable has recently broken the double top resistance level of 1.3017 level and now heading further higher until the 1.3158 resistance area. Above this level, the odds of buying remain strong today. On the higher side, the Sterling may find next resistance around 1.3182 while the bearish breakout of 1.3037 may lead the Cable towards the 1.3005 level. Price action highly depends upon the U.S. NFP data today.


USD/JPY – Daily Analysis

The USD/JPY pair was closed at 103.514 after placing a high of 104.547 and a low of 103.441. The USD/JPY pair dropped to its lowest level since March 2020 on the back of a weak U.S. dollar due to increasing hopes for Biden recovery. On Thursday, the Federal Reserve kept its benchmark interest rate unchanged at 0-0.25% range along with its target for asset purchases. According to the monetary policy statement, the economic activity and the employment levels have continued recovering, although they remain at levels well below those at the beginning of the year. The Federal Reserve also warned that the weaker consumer demand and the falling oil prices were holding down consumer inflation.

The comments from Fed chair Jerome Powell remained dovish as he affirmed that the pace of improvement has moderated. He also said that the economic activity continued to recover; he also warned about the highly uncertain path ahead that might have increased negative pressure on the U.S. dollar and added in the USD/JPY pair’s losses.

The U.S. dollar reversed its direction on Thursday from the previous day on the back of expectations of Joe Biden’s recovery as the counting of votes was in his favor so far. However, U.S. President Donald Trump has already filed lawsuits for recounting that could delay the results of the U.S. Presidential election.

On the data front, at 17: 30 GMT, the Challenger Job Cuts for the year came in as 60.4% in comparison to the previous 185.9% from the U.S. At 18:30 GMT, the Unemployment Claims for the last week rose to 751K against the expected 740K and weighed on the U.S. dollar and added in the USD/JPY pair’s losses. The Prelim Nonfarm Productivity for the quarter raised to 4.9% against the estimated 3.6% and weighed on the U.S. dollar. At 18:32 GMT, the Prelim Unit Labor Costs for the quarter came in as -8.9% against the projected -10.0% and supported the U.S. dollar.

The main driver of the USD/JPY pair on Thursday was Biden’s chances of winning the U.S. election 2020 as he will issue a massive stimulus package, which would cause a decline in the U.S. dollar strength.

Daily Technical Levels

Support    Resistance

103.09      104.22

102.70 104.95

101.97 105.34

Pivot point: 103.83

USD/JPY – Trading Tips

The USD/JPY has violated the descending triangle pattern at 104.149 area, and on the lower side, it’s heading towards the next support area of 103.300 level. Violation of these ranges may determine the next trend in the USD/JPY pair. A bullish breakout of 104.149 level can extend the buying trend until 104.880. Conversely, the bearish breakout of 103.300 can lead the USD/JPY pair towards the 102.530 area. The MACD is also showing bearish bias among investors; therefore, let’s wait for a breakout before taking the next position in the USD/JPY. Good luck!