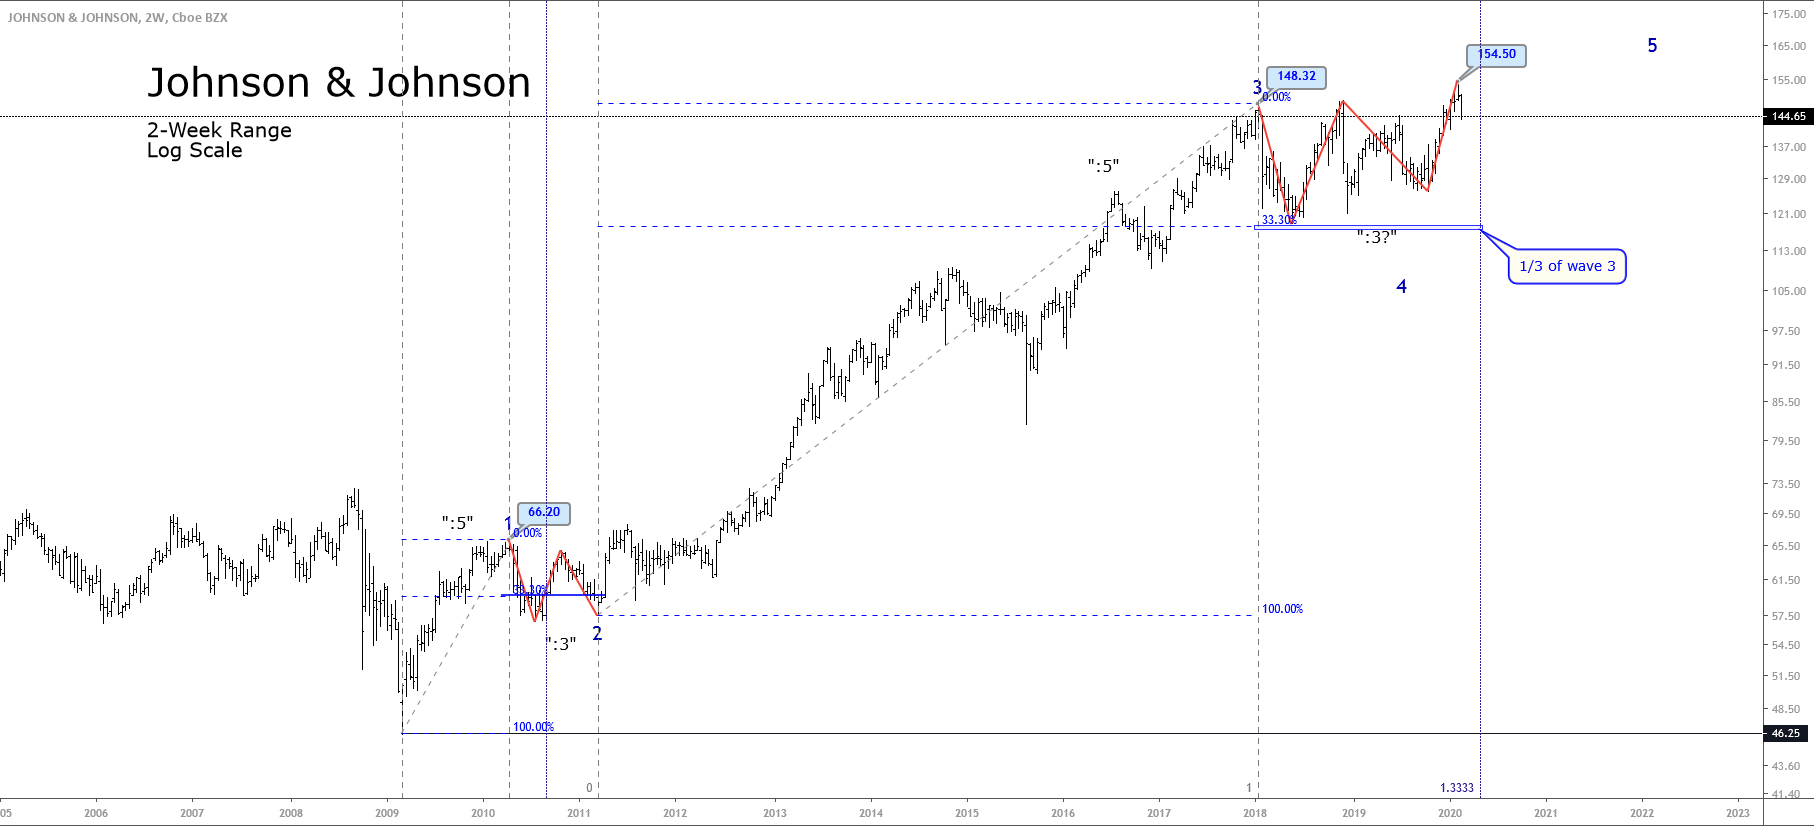
Introduction
We have learned the importance of harmonic patterns in our recent Forex strategy articles. Also, we have understood how to identify and trade many of the famous harmonic patterns like Butterfly, Bat, Gartley, etc. In this article, let’s explore one last pattern in the harmonic group – the Crab pattern.
H.M Gartley introduced the Crab pattern in 2001, and Scott Carney added the respective Fib ratios to it. Just like the other harmonic patterns, the ‘Crab’ is also a reversal pattern that is used to identify when the trend of an asset is going to end and potentially reverse. There are both bullish and bearish Crab patterns, and they indicate bullish and bearish reversals in the market, respectively.
Each leg of the Crab pattern is denoted by a letter, and in total, there are five swing points – X, A, B, C, and D. Just like other harmonic patterns, there are different rules to trade the Crab pattern. Only trade this pattern and take positions if all of these rules get validated.
Crab Pattern Rules
XA – In its bearish version, the first leg of the pattern forms when the price of an underlying asset decline sharply from point X to point A. It can be any random bearish move. (vice-versa in the case of bullish)
AB – The AB leg is the counter-trend move to the previous leg and must retrace from the 38.2% to 61.8% of the distance covered by the first leg.
BC – Concerning the BC leg, price action changes its direction and goes down to 38.2% or 88.6% Fibs ratio of the AB leg.
CD – The CD move is the last and most important leg of the Crab pattern. So for printing this leg, the price action again changes its direction and goes to counter-trend to XA. The CD leg reverses between the 161.8% of the XA leg.
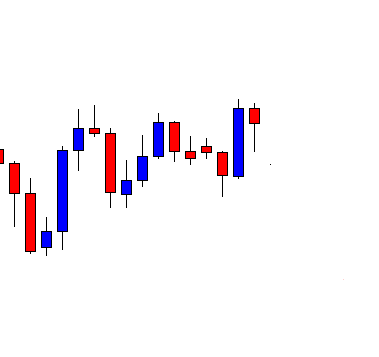
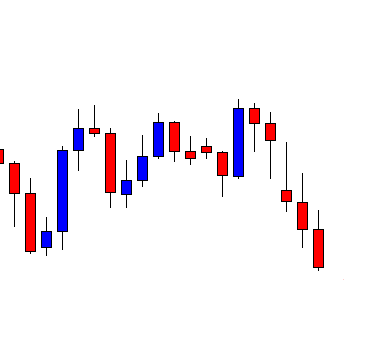
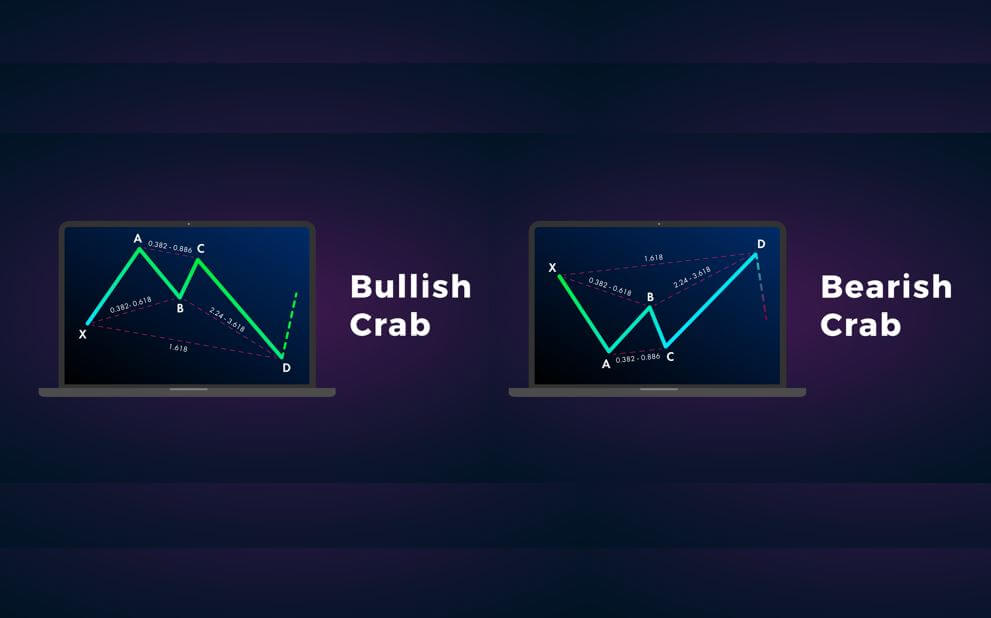
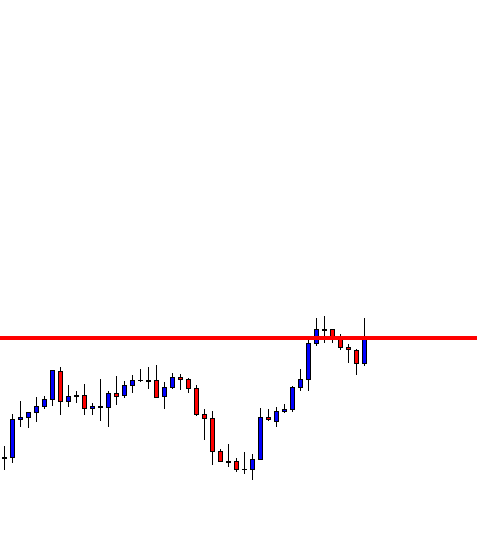
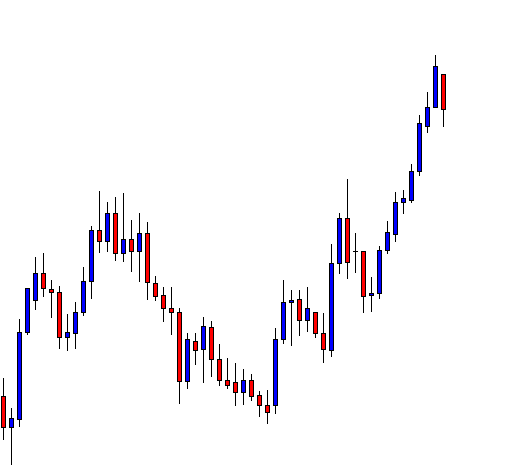
To identify the Crab pattern, one must follow all the above rules. Take a long or short position at point D as this is where the Crab pattern completes. Below is the pictographic representation of bullish and bearish crab patterns.

Crab Pattern – Trading Strategies
Trading The Bullish Crab Pattern
The Crab pattern is quite popular in the market, so the respective tool with embedded Fib ratios is widely available in most of the trading platforms. The images we are using in this article are taken from the TradingView tool. If you are also someone who uses TradingView software, you can find this pattern’s charting tool on a toolbar on the left side.
So, first of all, select the Crab pattern charting tool and follow all the above rules to identify the pattern. Keep in mind that the Fibonacci ratios are incredibly crucial to trade the Crab pattern. If you recognize the pattern on a price chart and if you find the Fibs ratios not matching with the pattern rules, it means that the pattern is invalid. So do not trade that pattern.
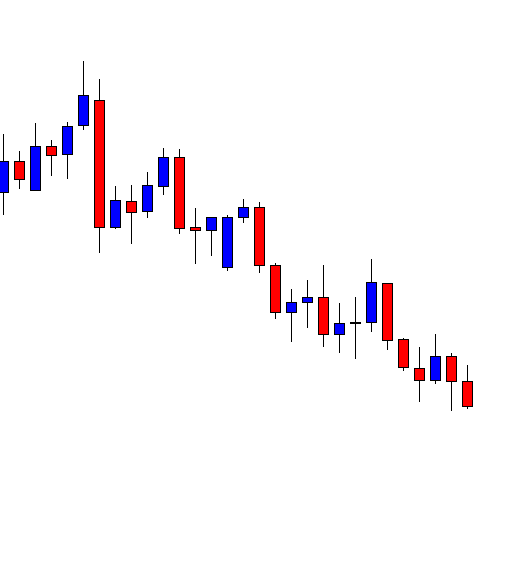
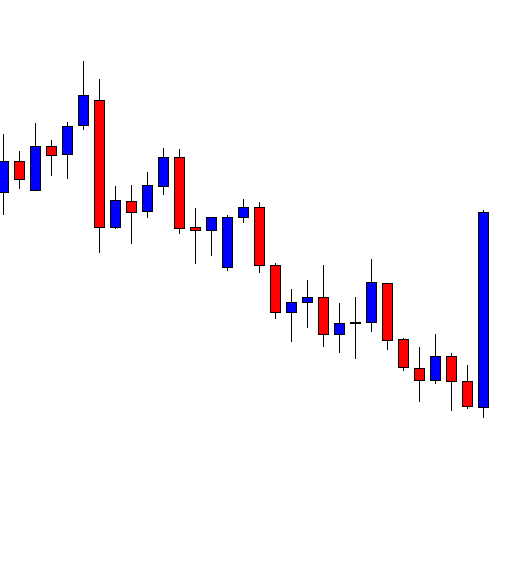
Identifying The Pattern
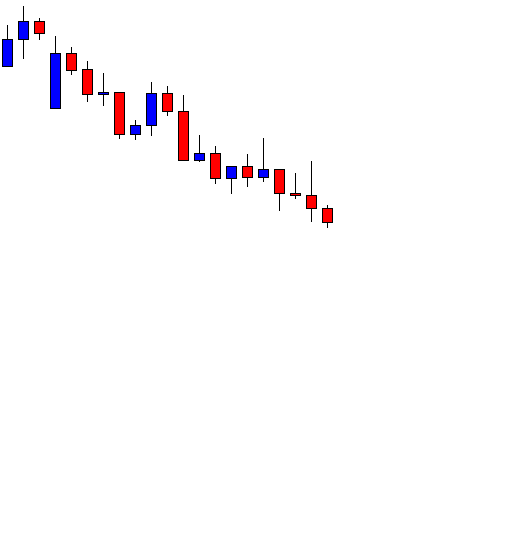
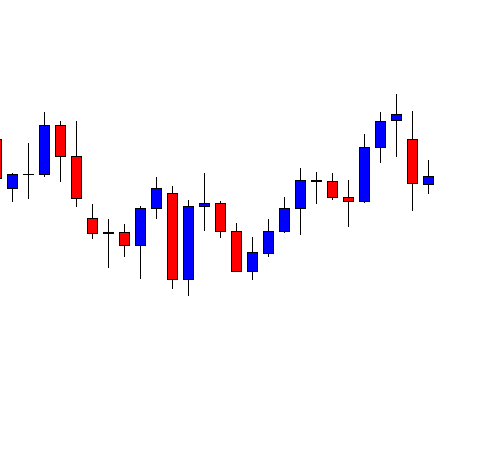
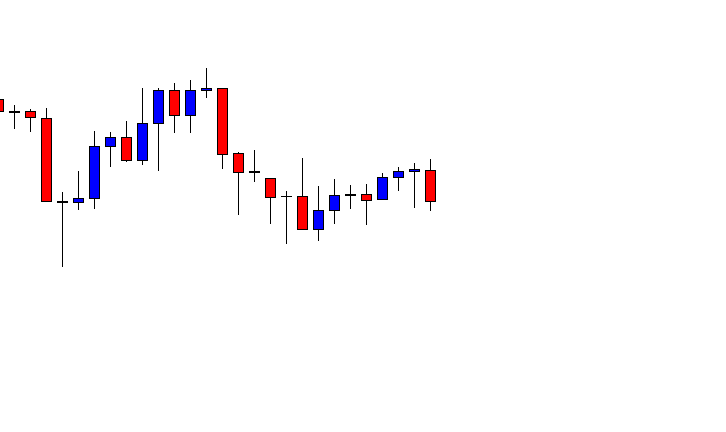
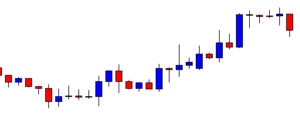
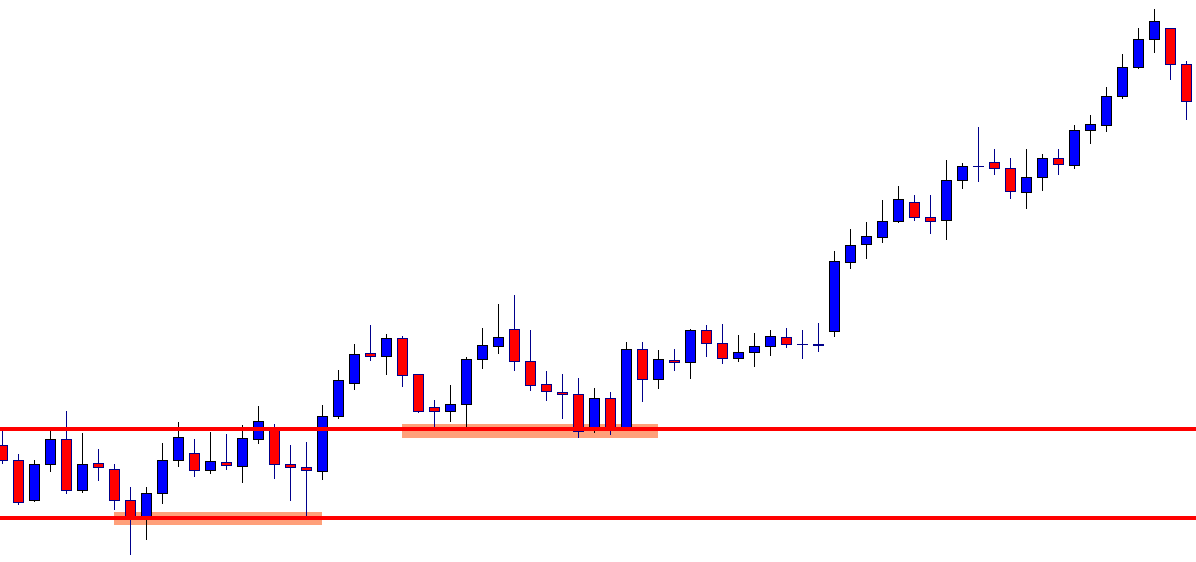
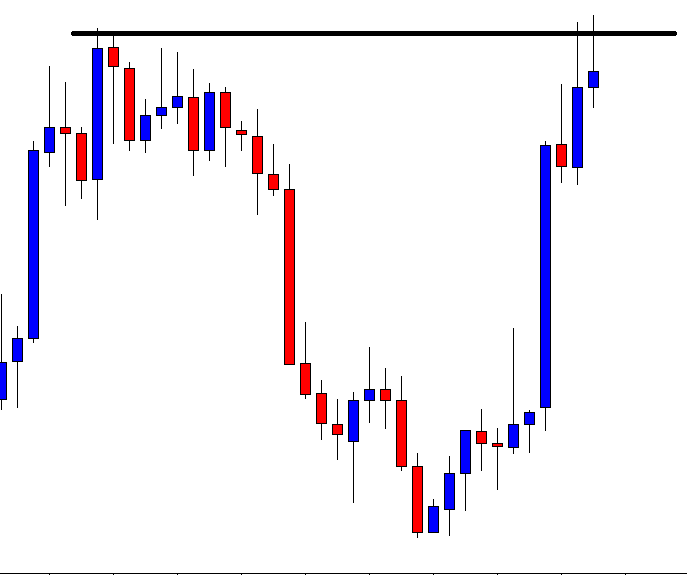
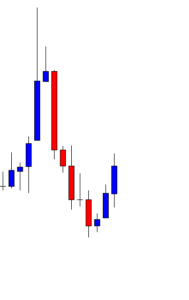
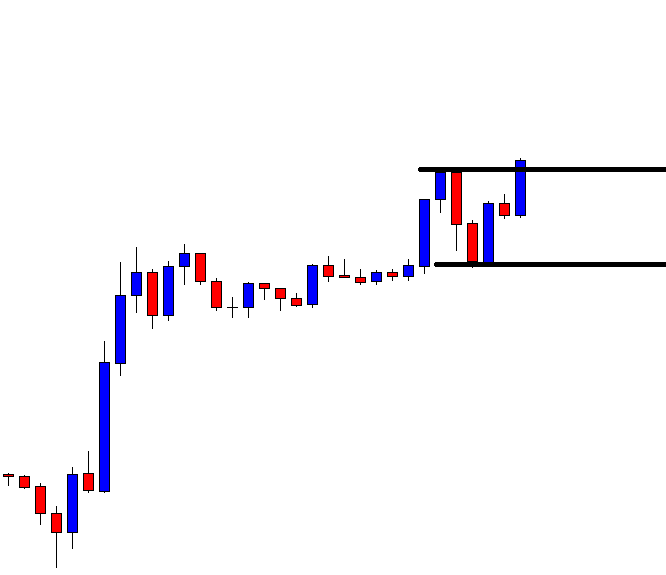
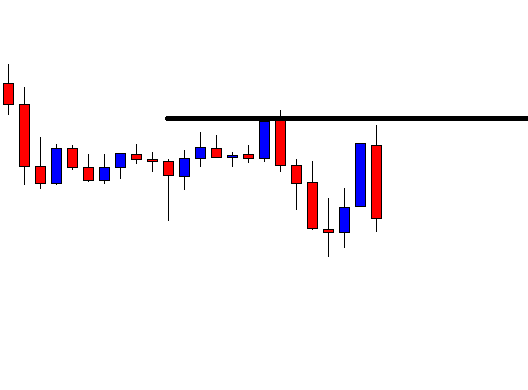
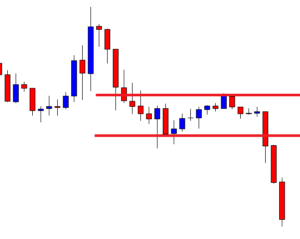
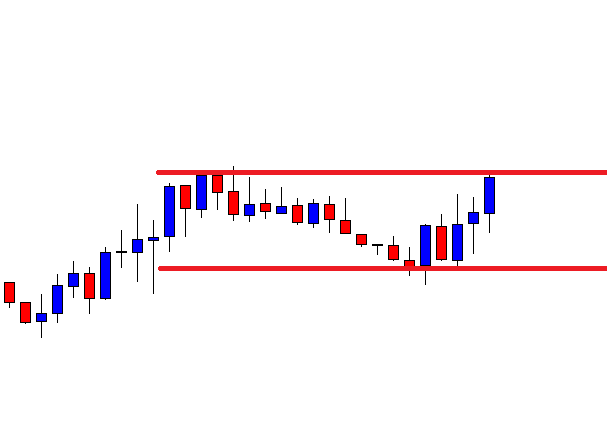
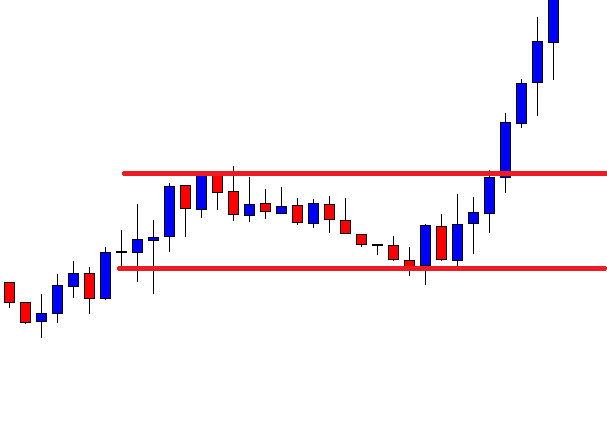
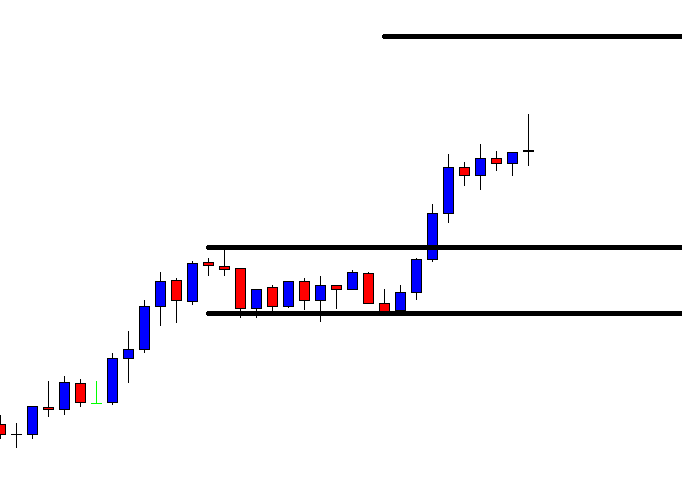
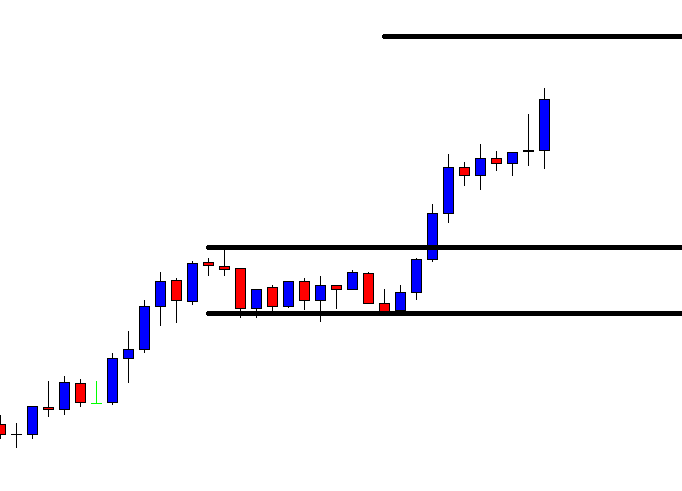
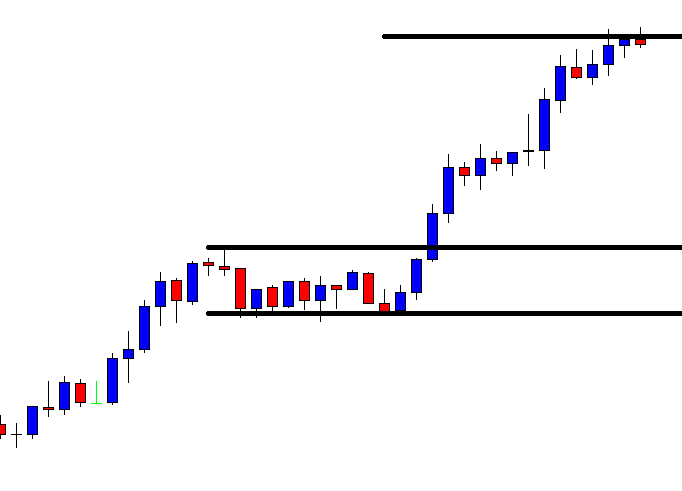
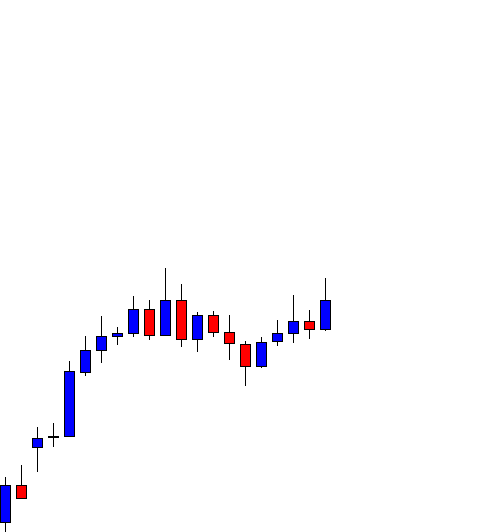
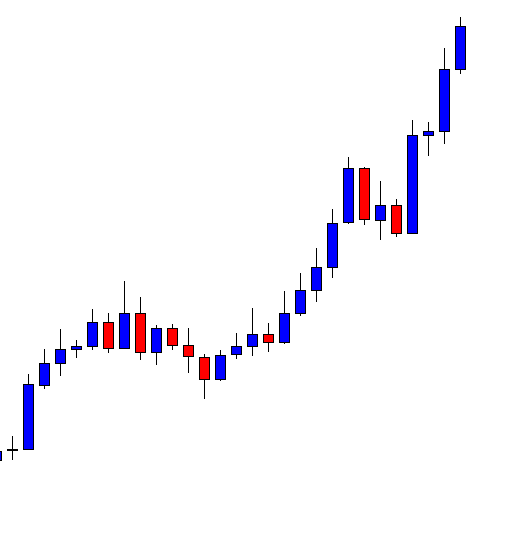
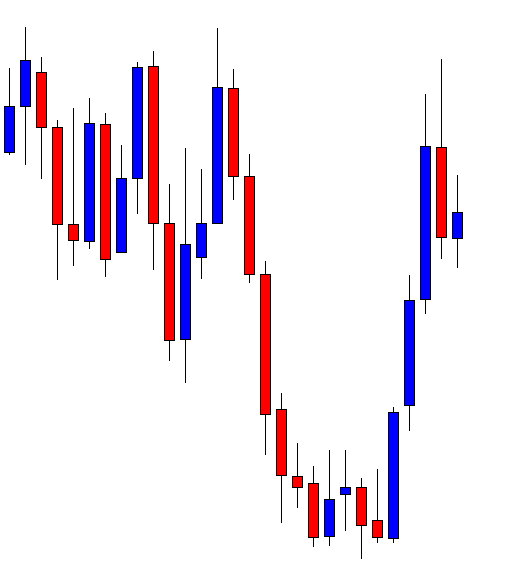
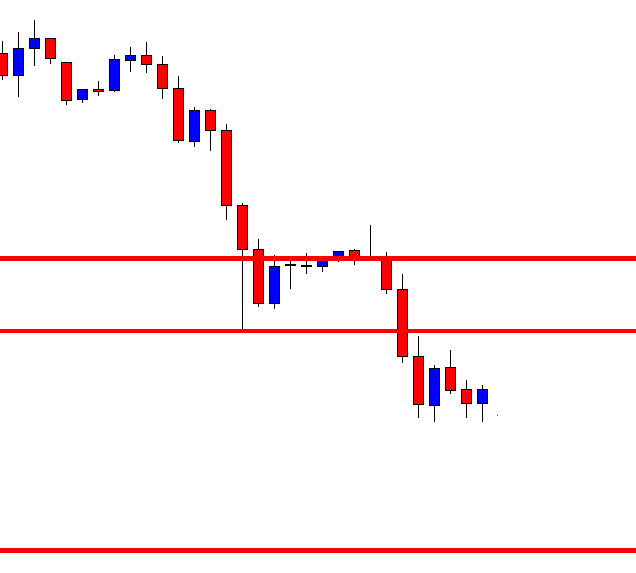
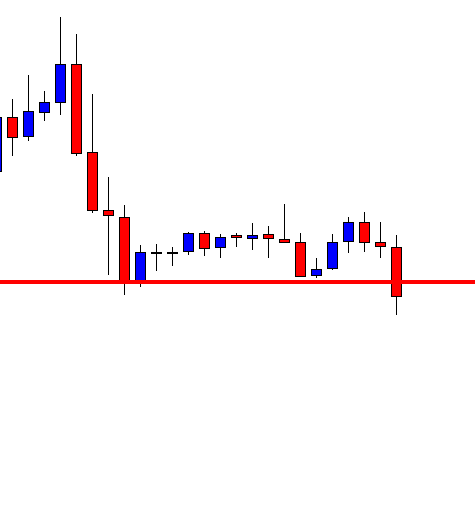
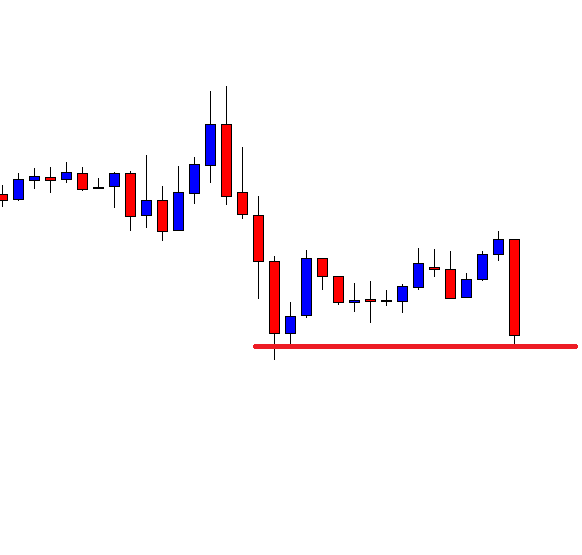
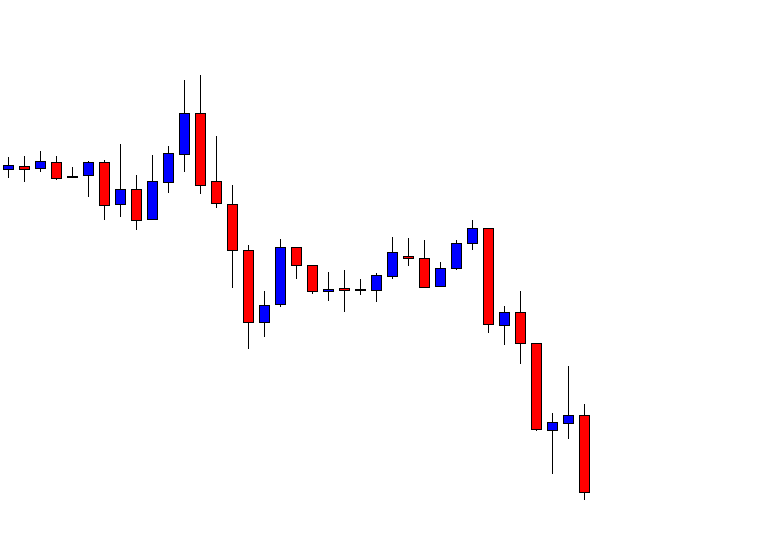
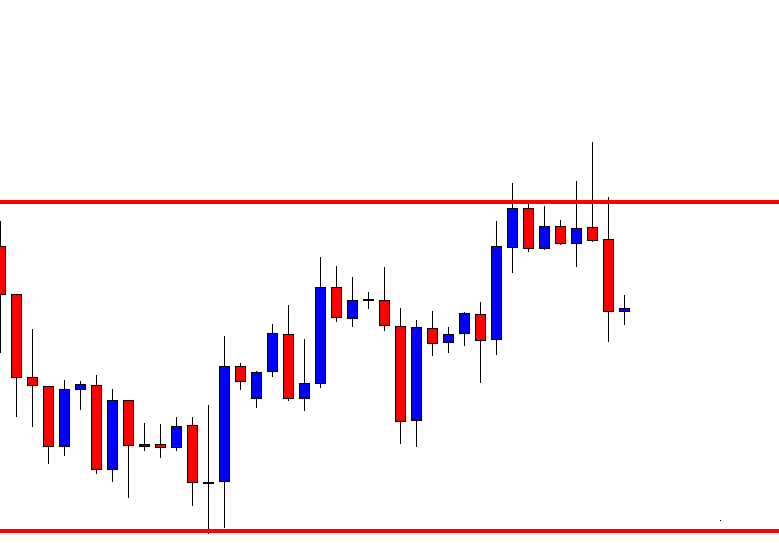
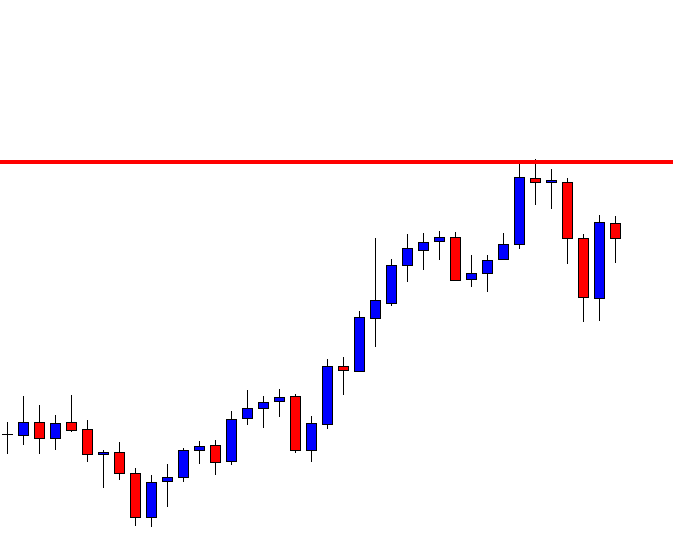
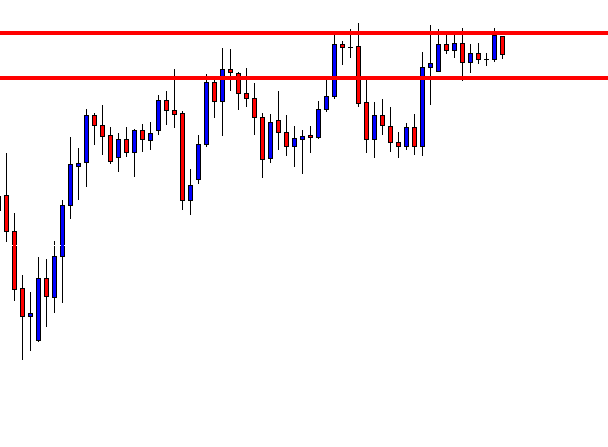
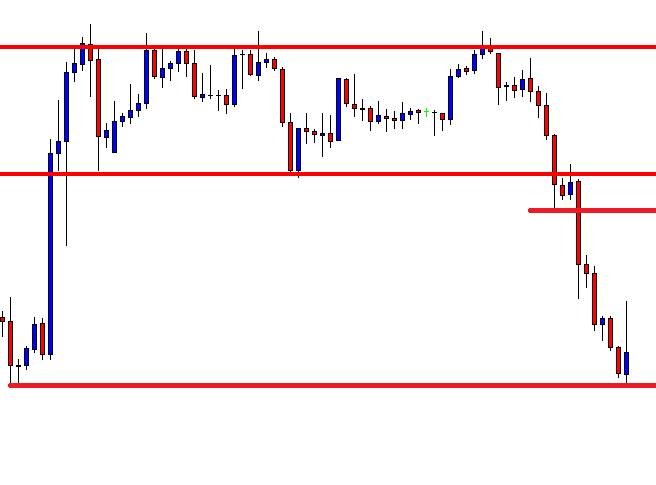
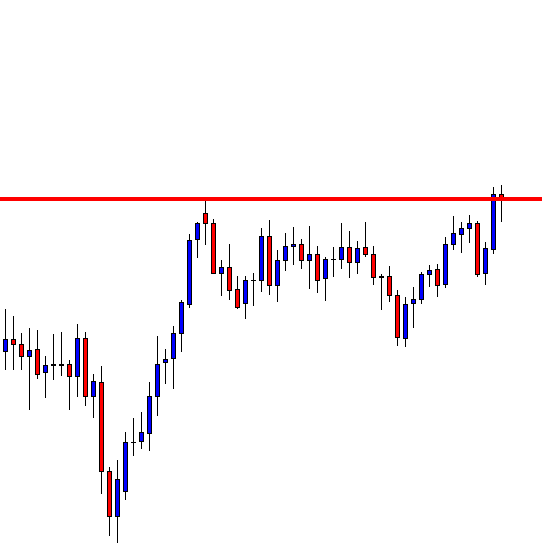
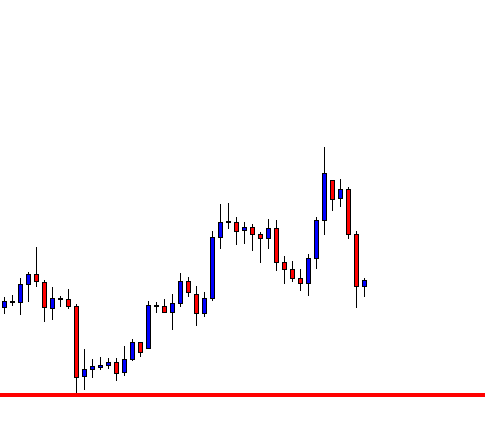
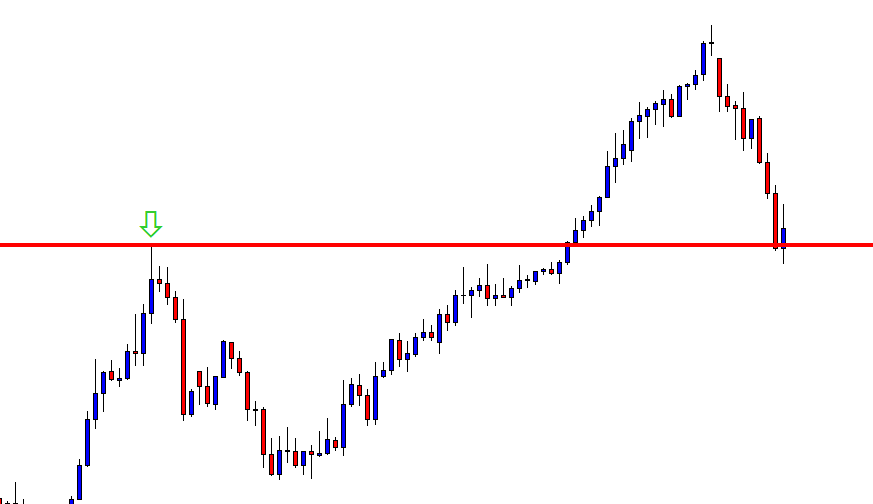
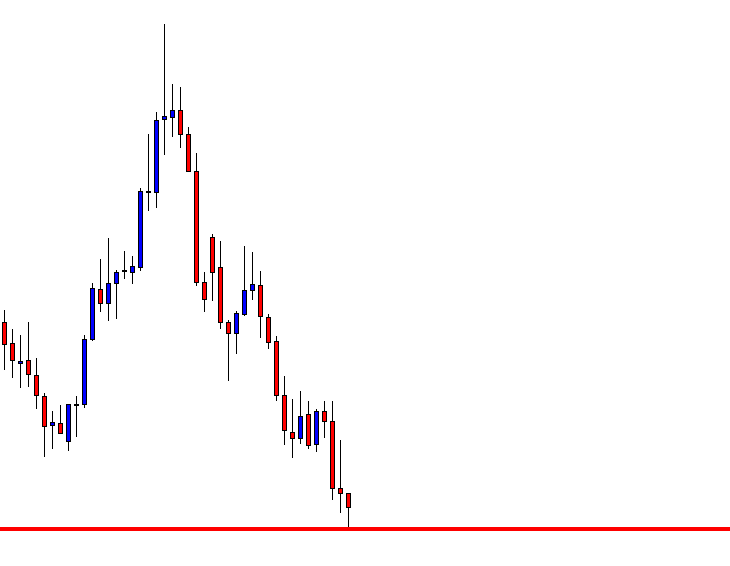
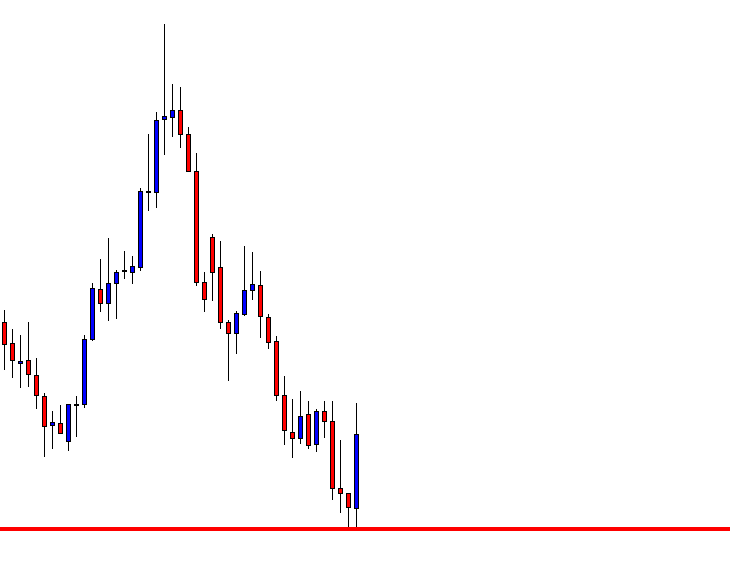
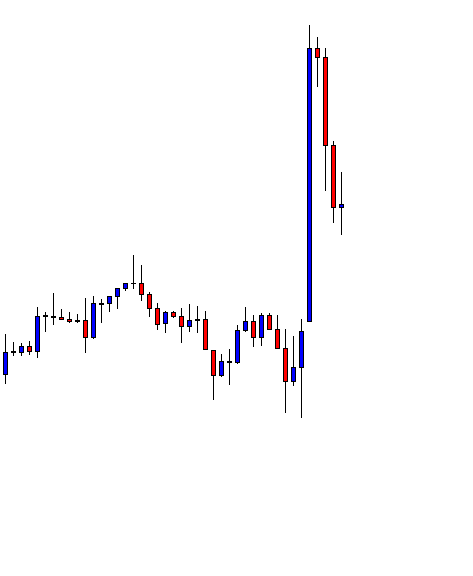
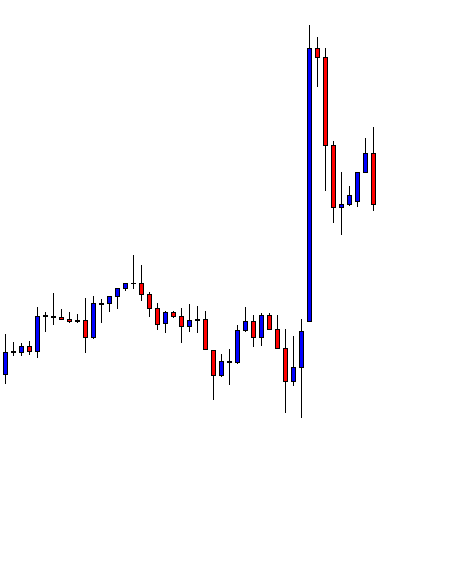
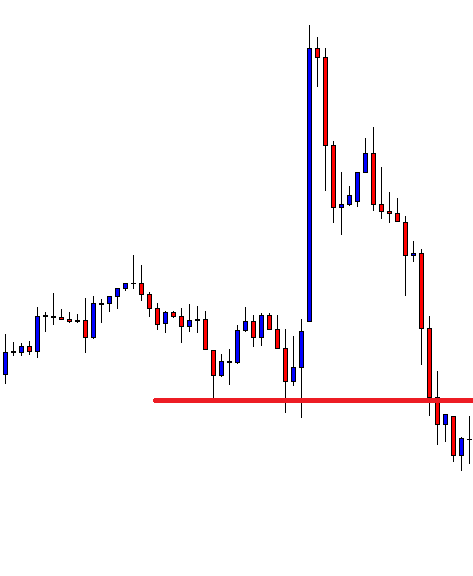
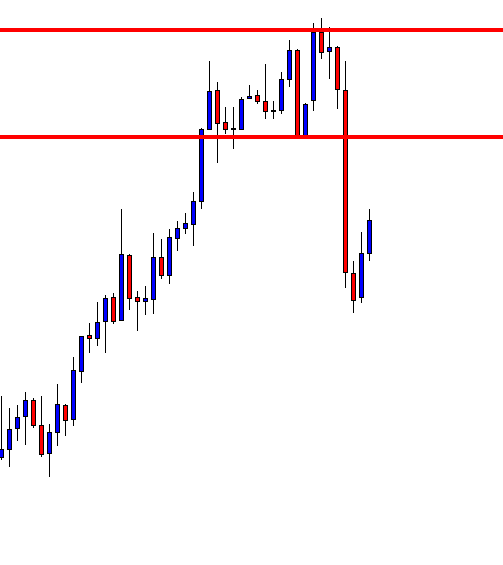
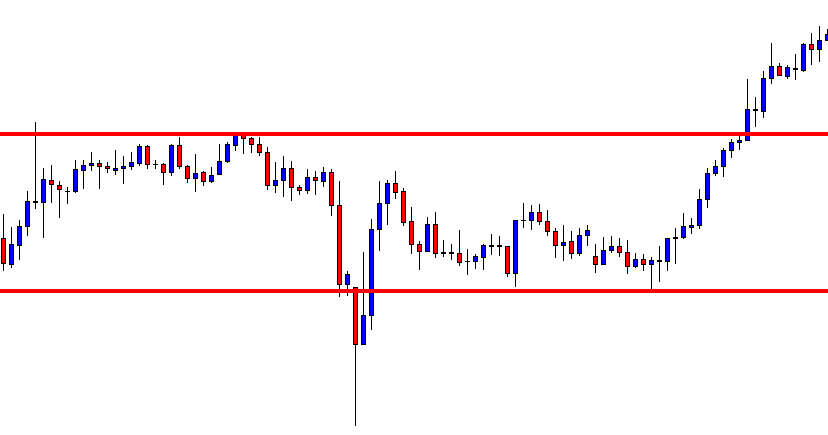
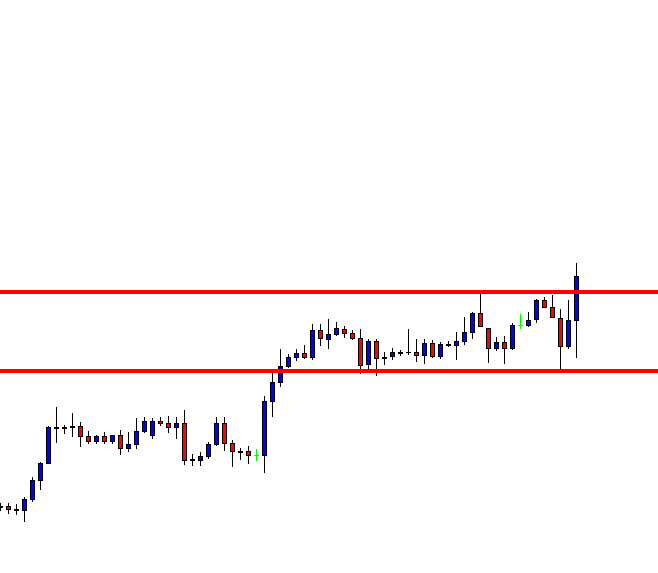
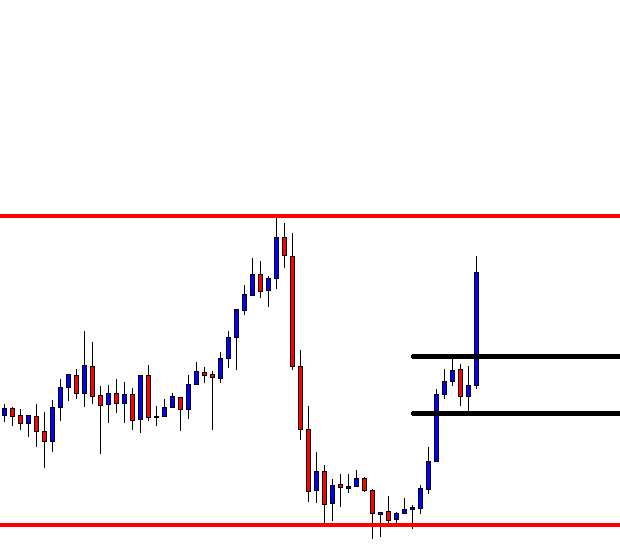
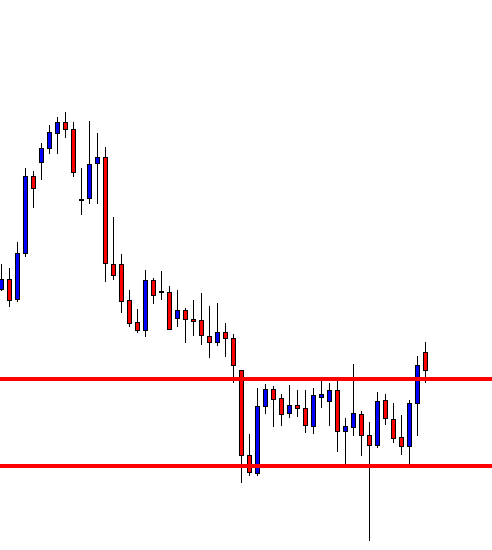
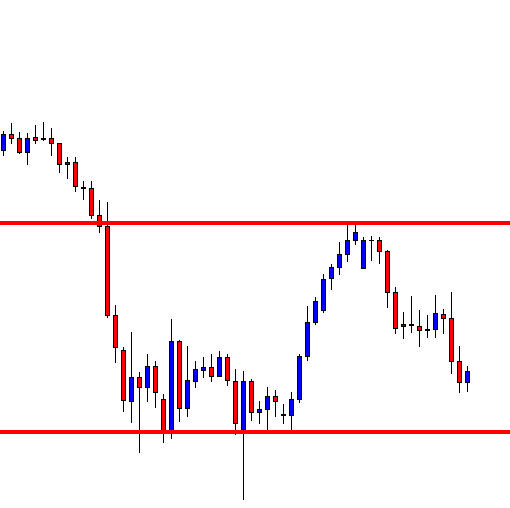
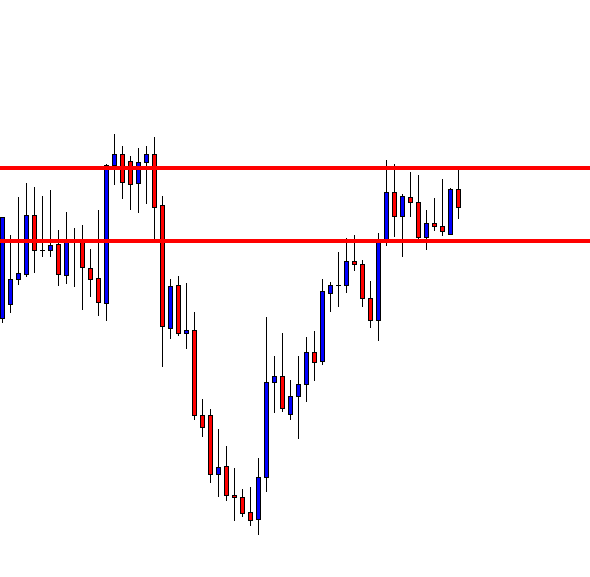
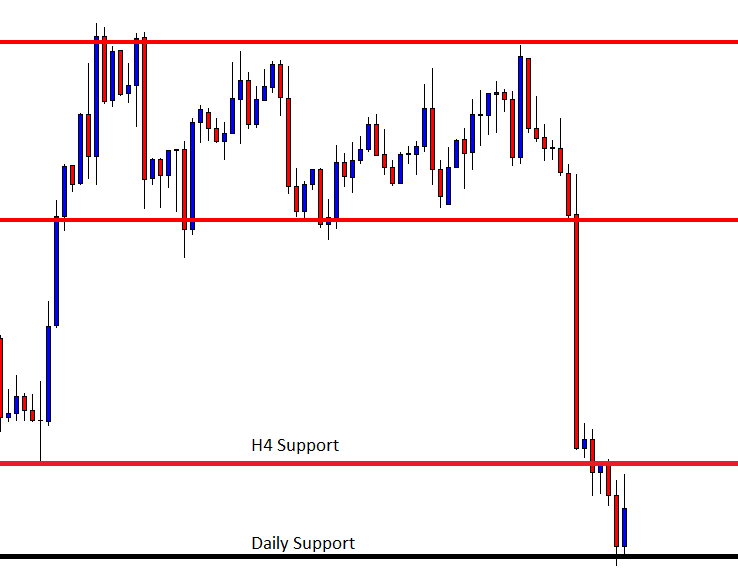
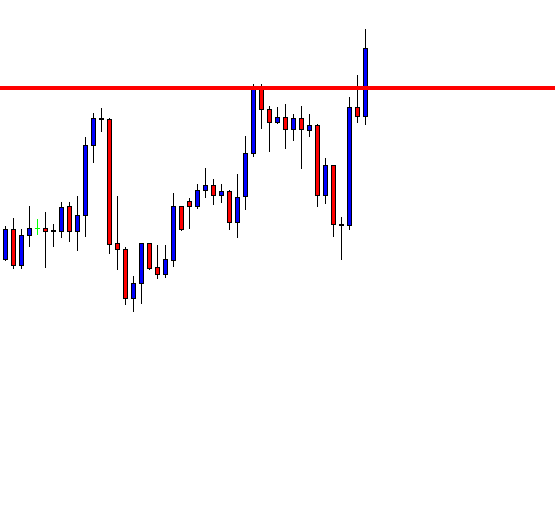
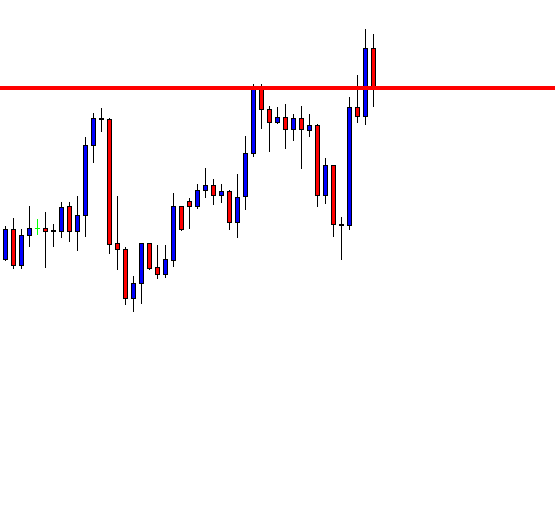
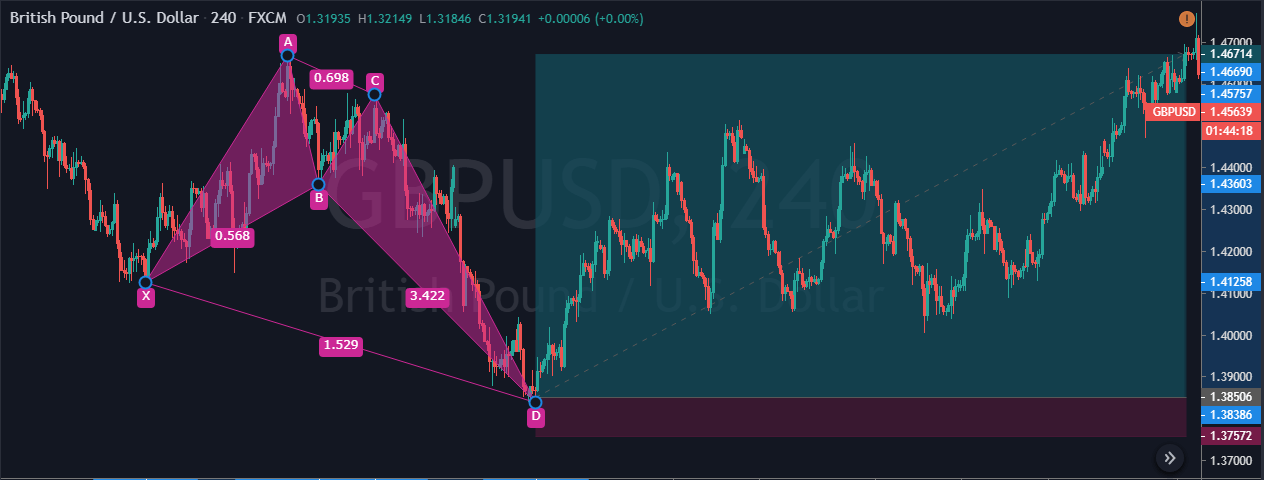
The below image is a four-hour chart of the GBP/USD Forex pair. Overall the market was in a downtrend, but when all the rules of the Crab pattern are met, price action changes direction. As you can see below, XA is any random bullish move. The price action then retraces to 61.8% of the AB leg. Furthermore, the price action goes up again and retraces close to the 38.2% Fib level of the AB leg.
At this stage, price action confirms the three moves of the pattern following all the rules. In the end, the last move of the pattern clears that the Crab pattern was genuine. This move of the pattern is the longest one, and it has reached the 161.8% Fib level of the AB leg.
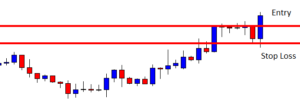
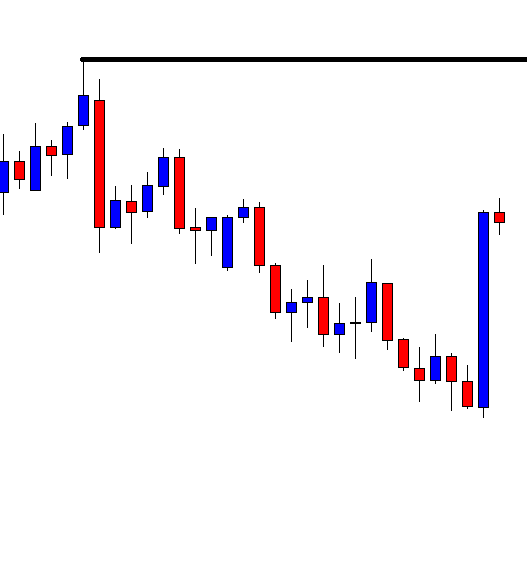
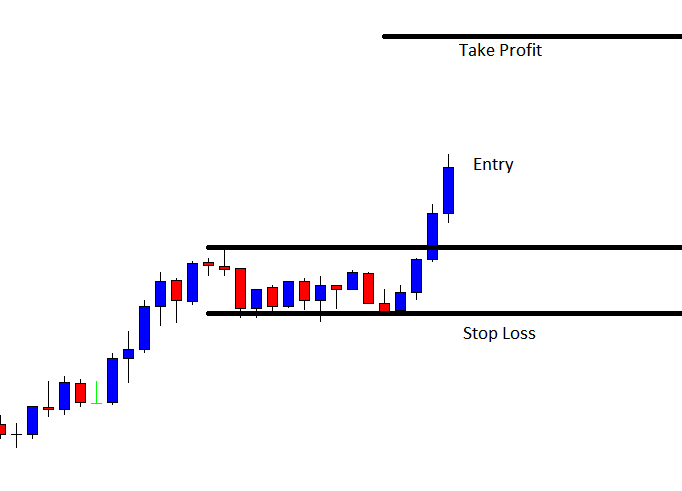
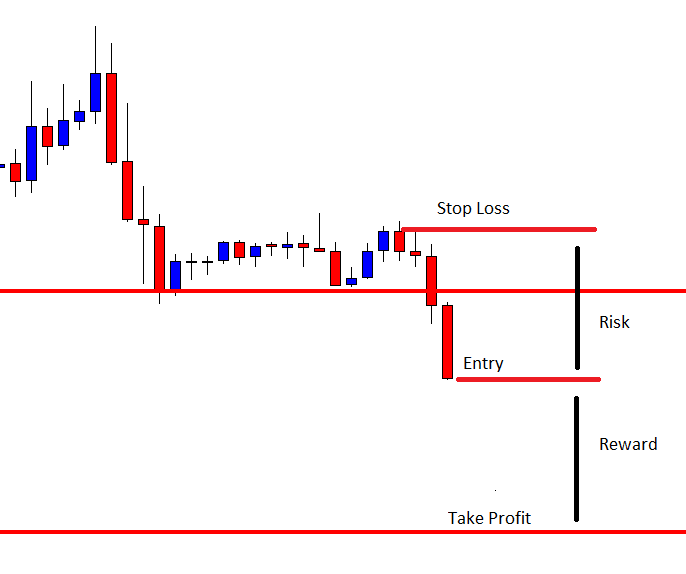
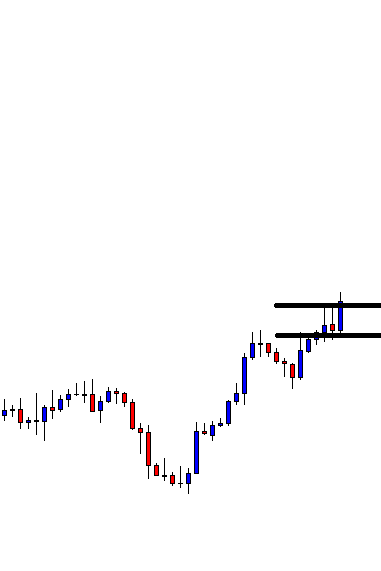
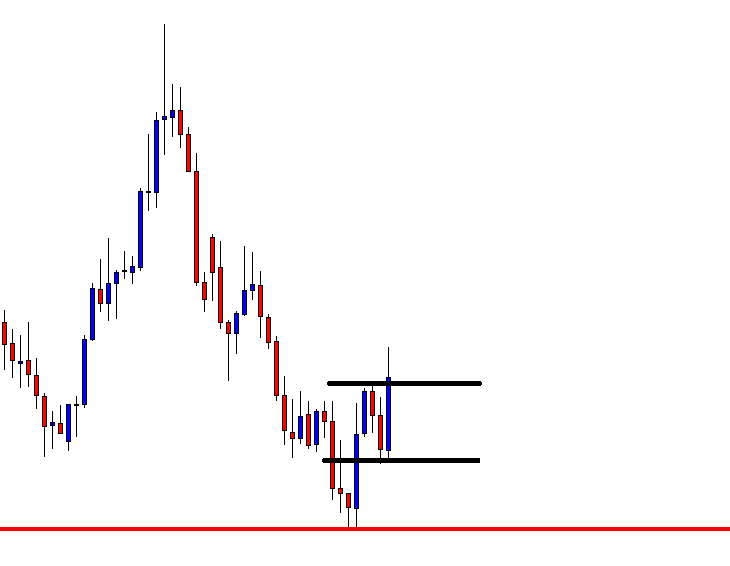
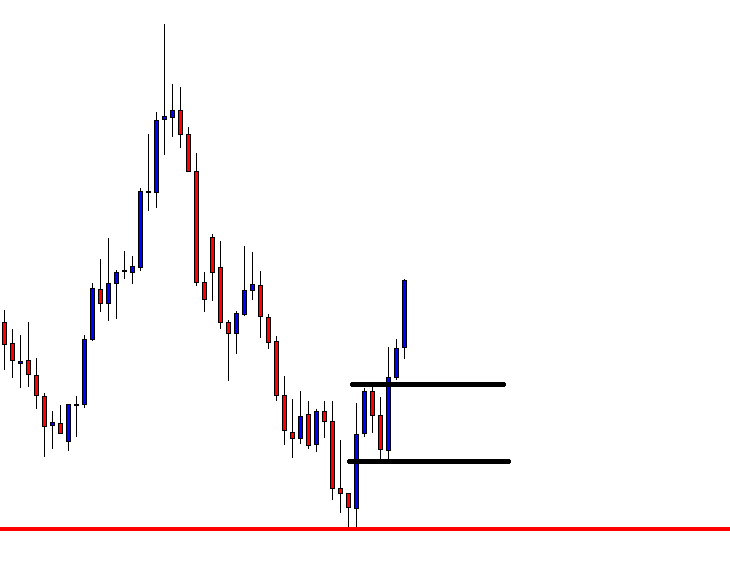
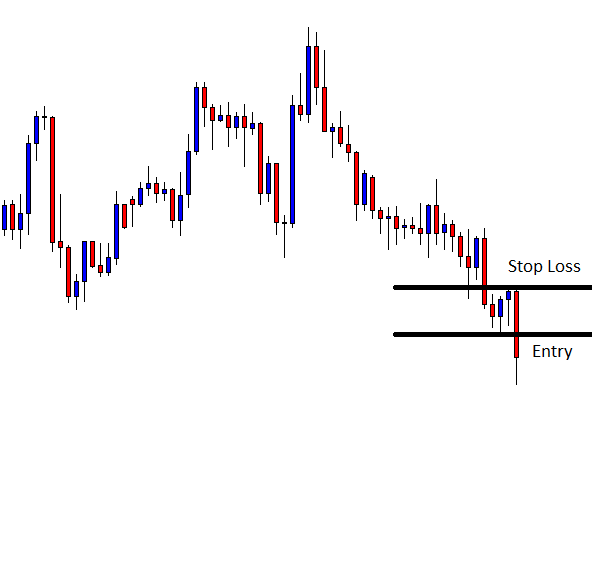
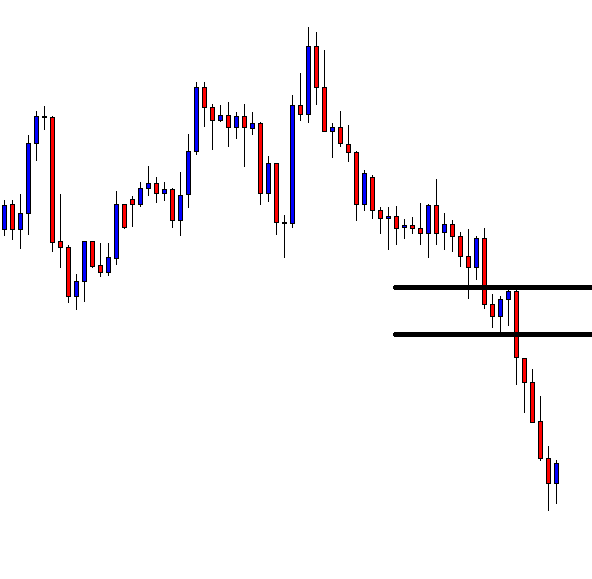
Entry, Stop-Loss & Take-Profit
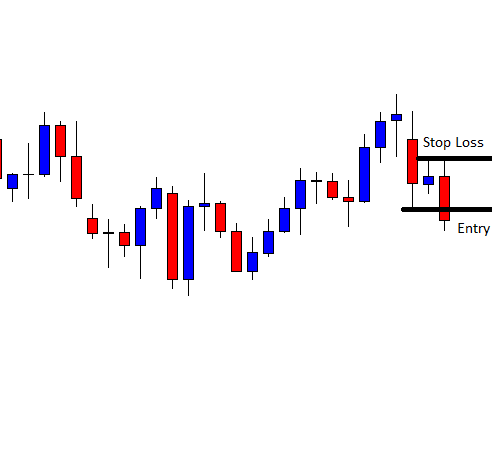
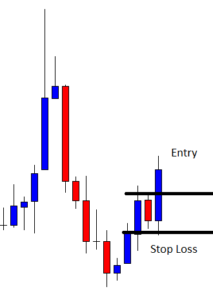
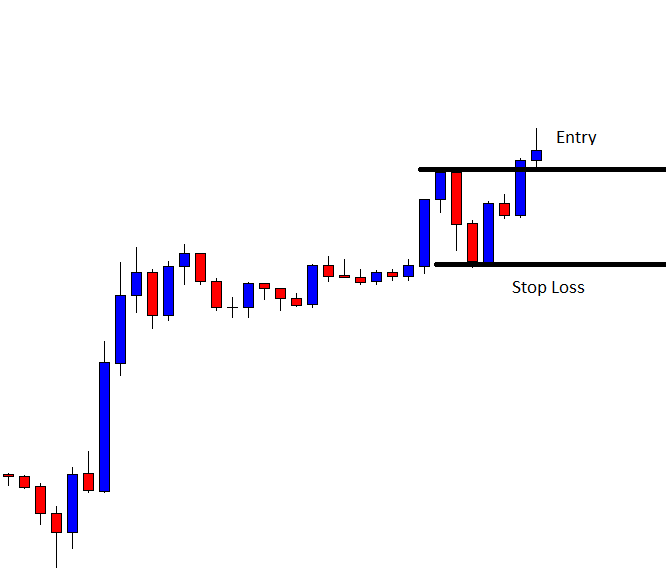
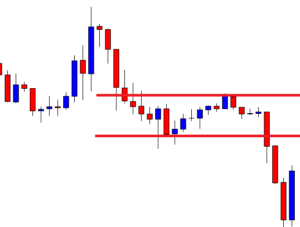
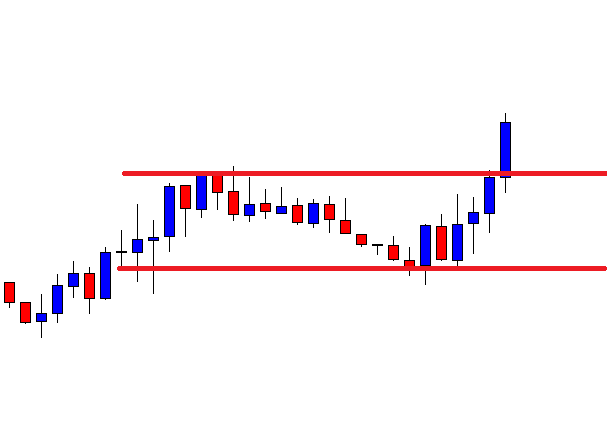
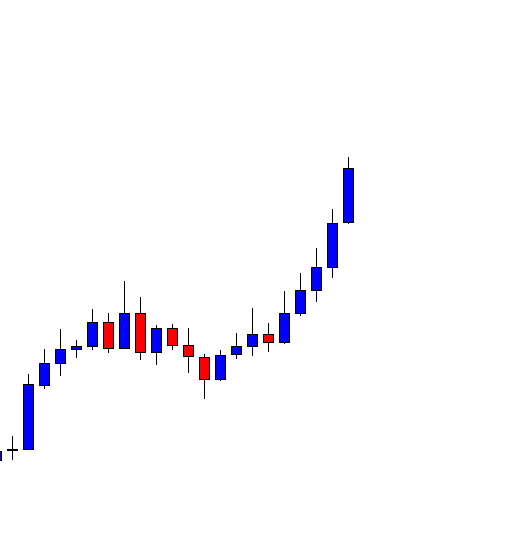
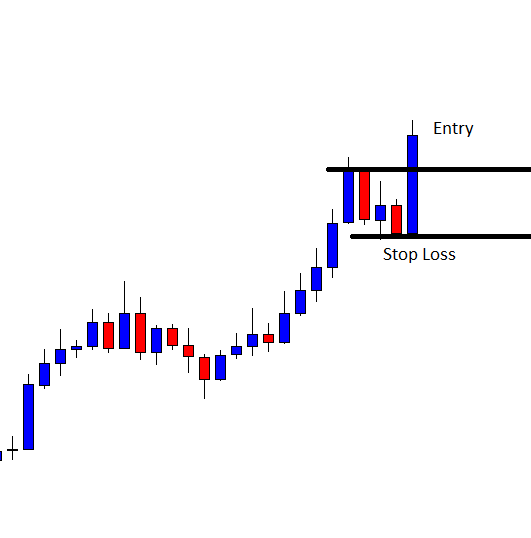
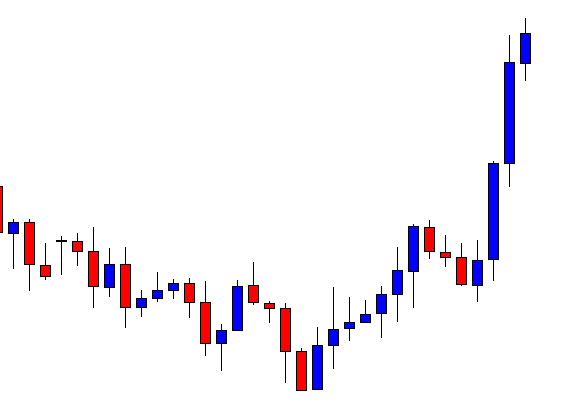
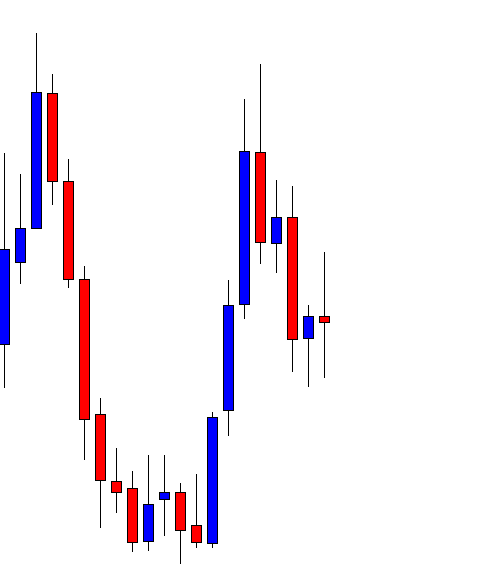
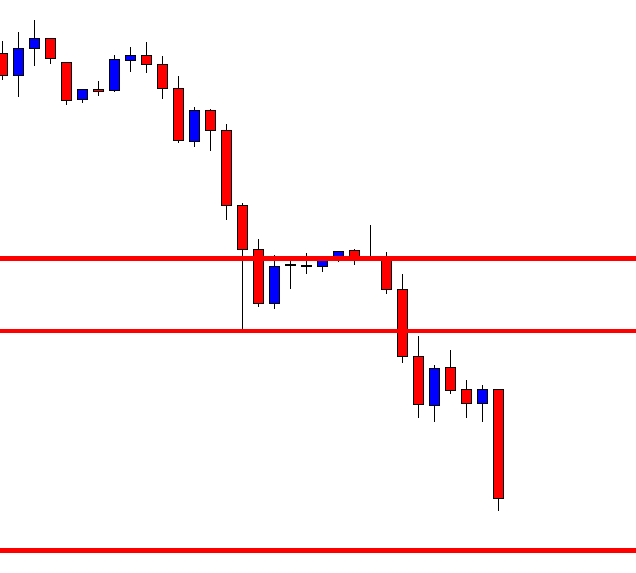
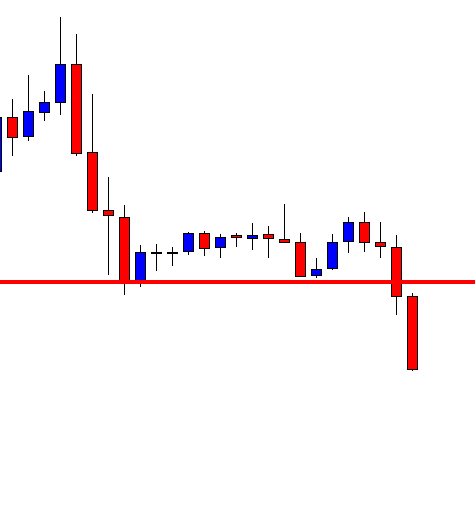
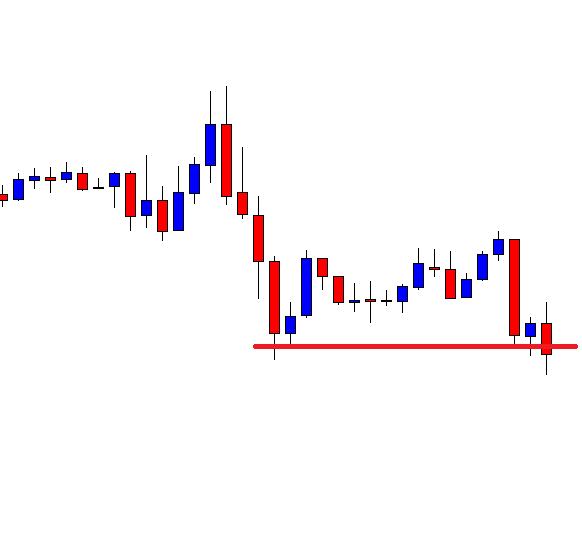
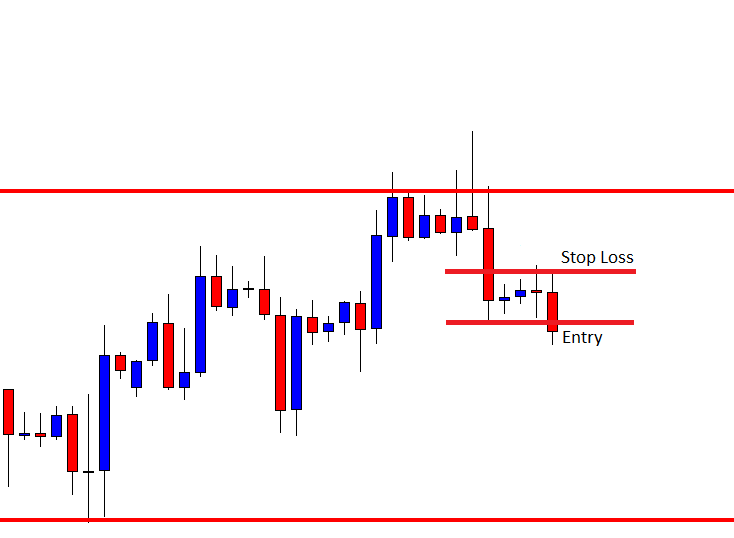
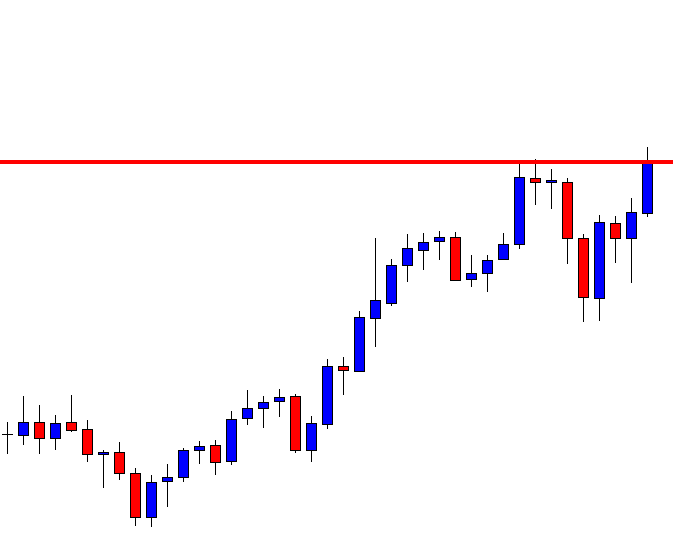
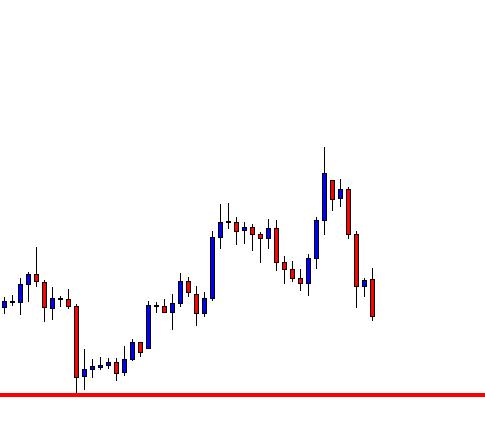
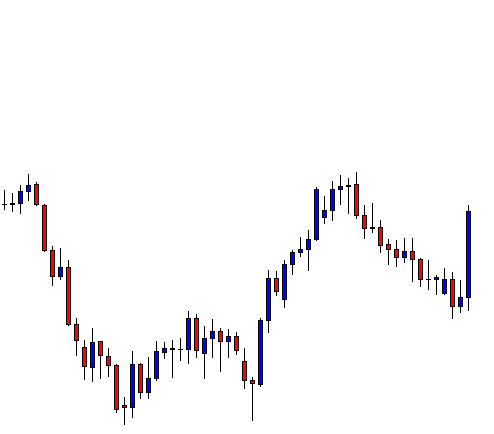
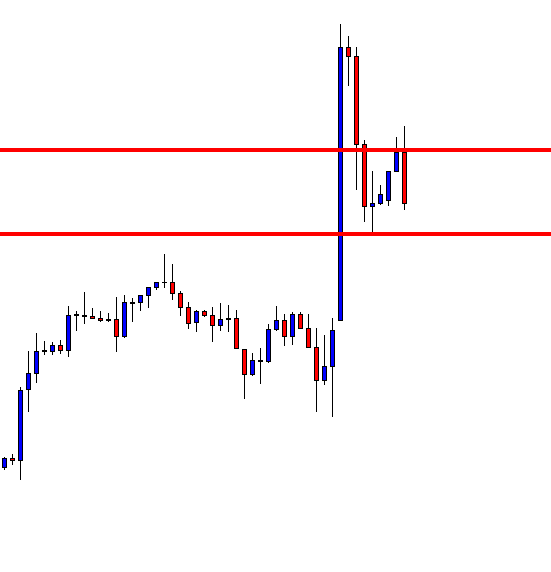
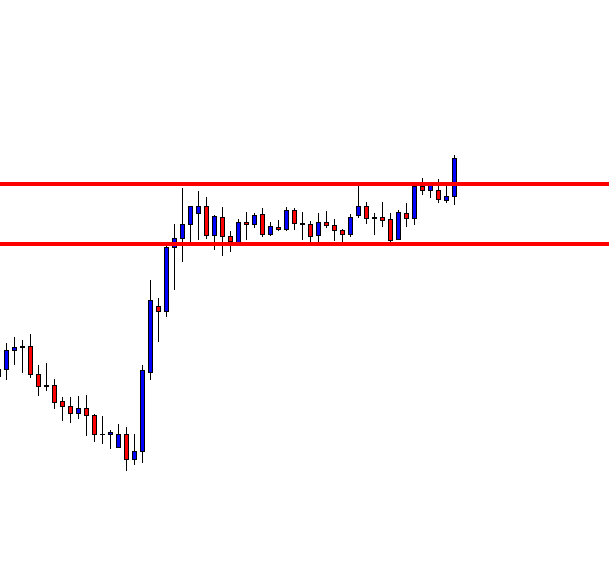
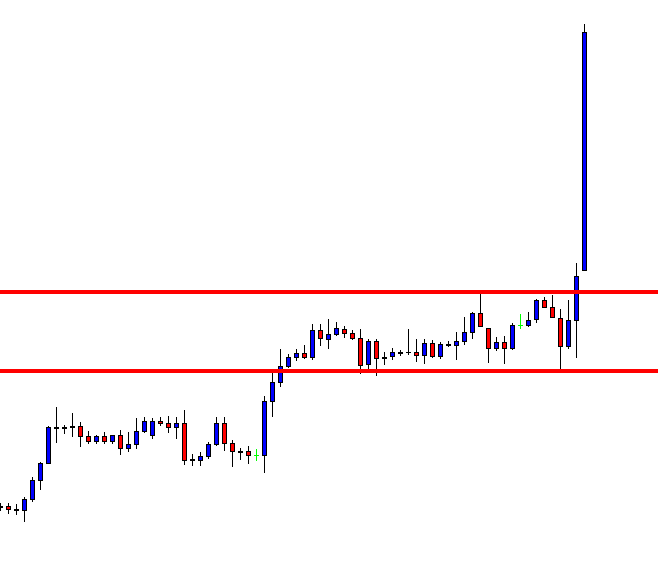
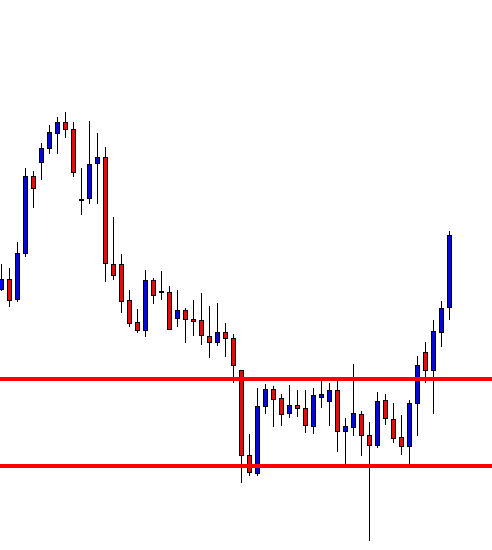
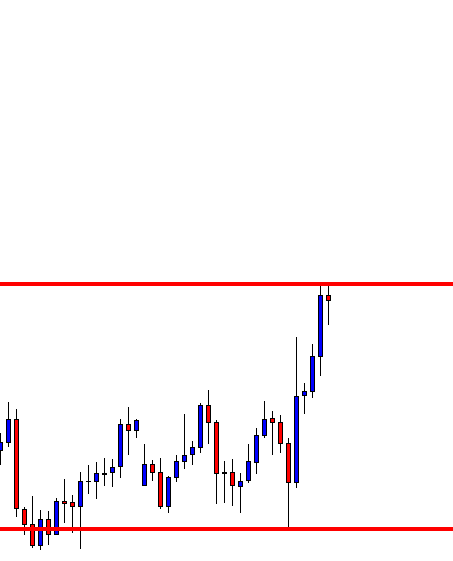
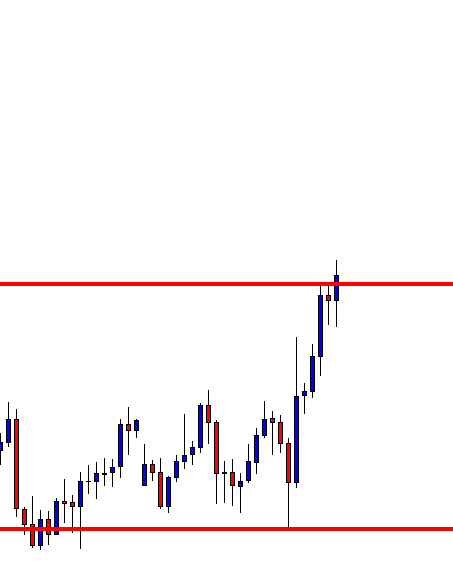
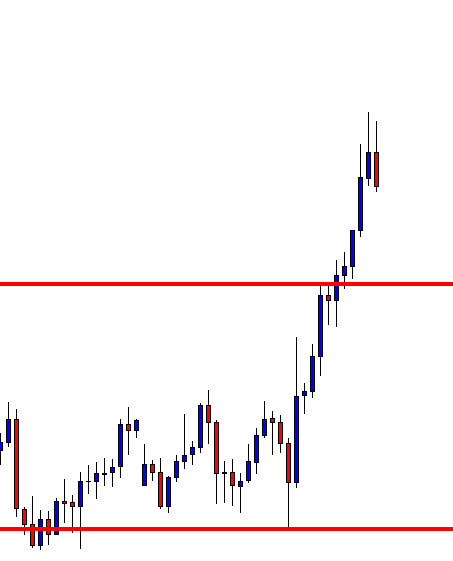
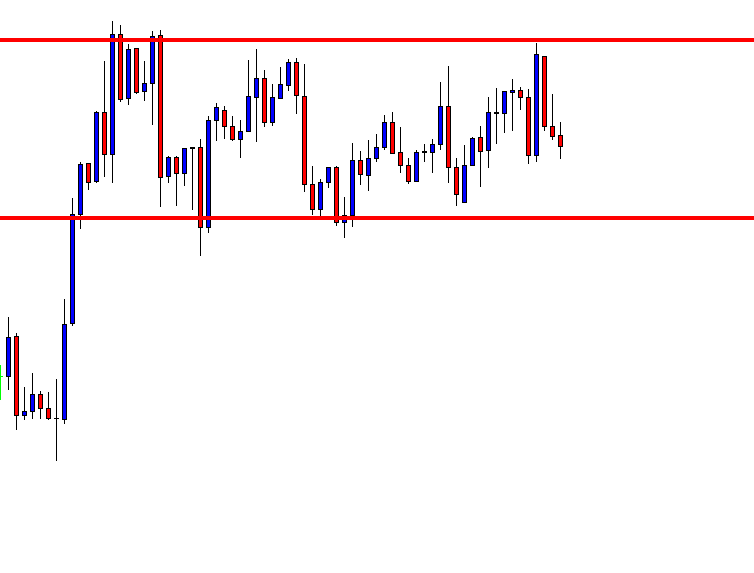
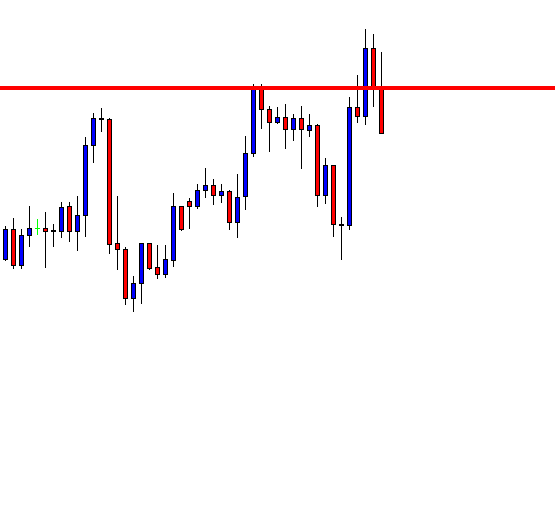
As the price action confirms the pattern, we have immediately entered for a buy. If you are a conservative trader, make sure to wait for a couple of bullish confirmation candles to enter the trade.
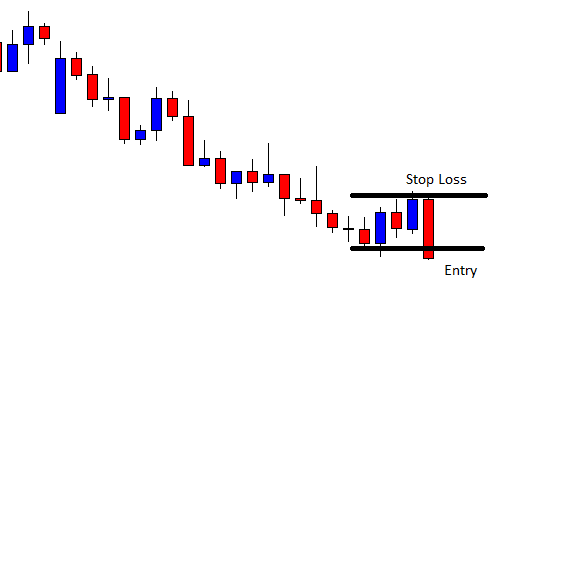
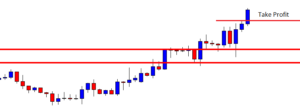
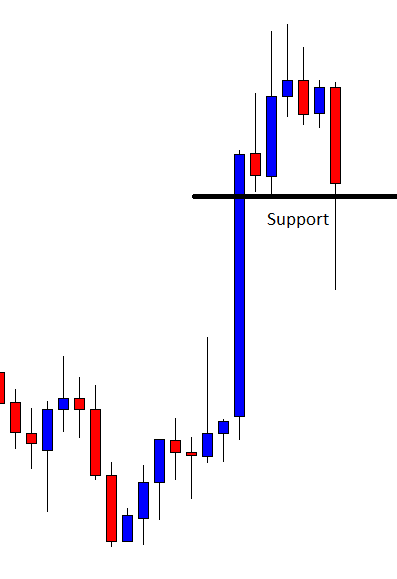
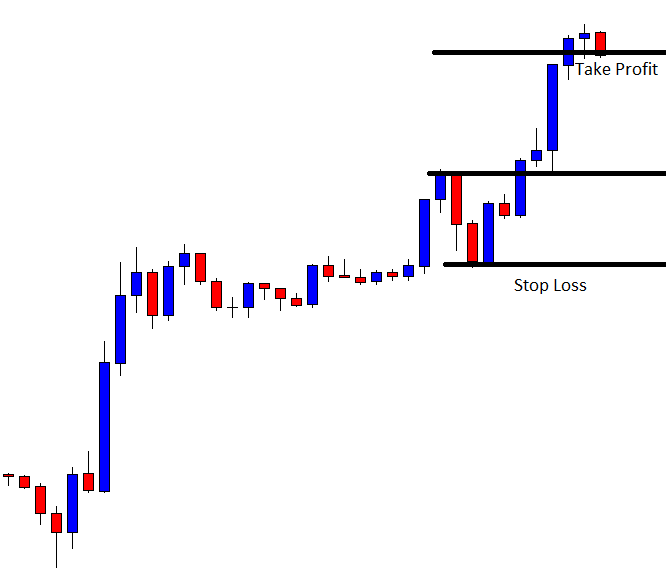
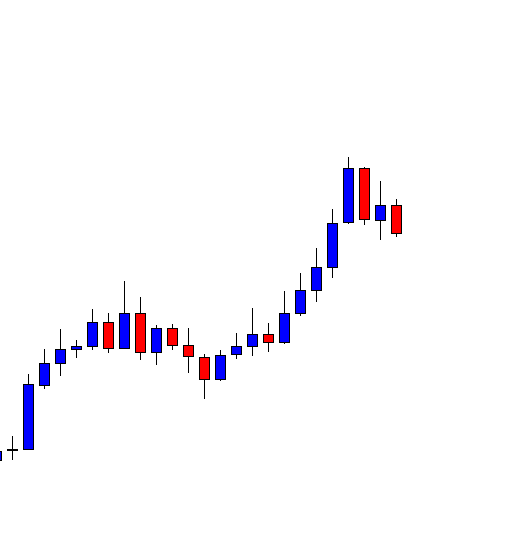
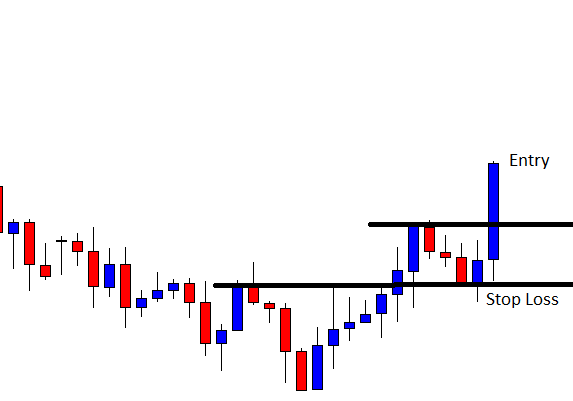
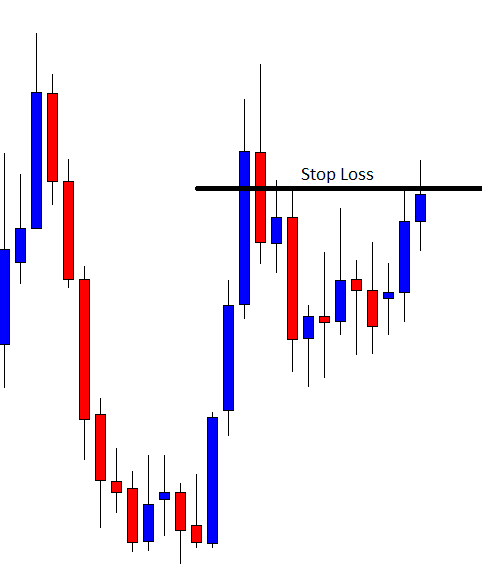
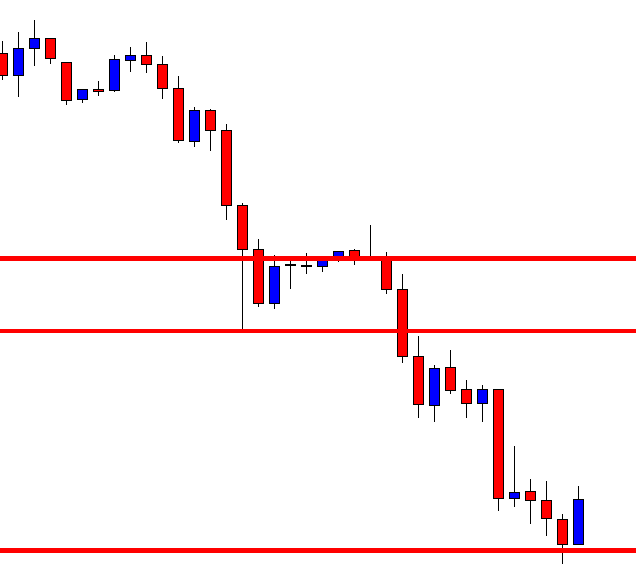
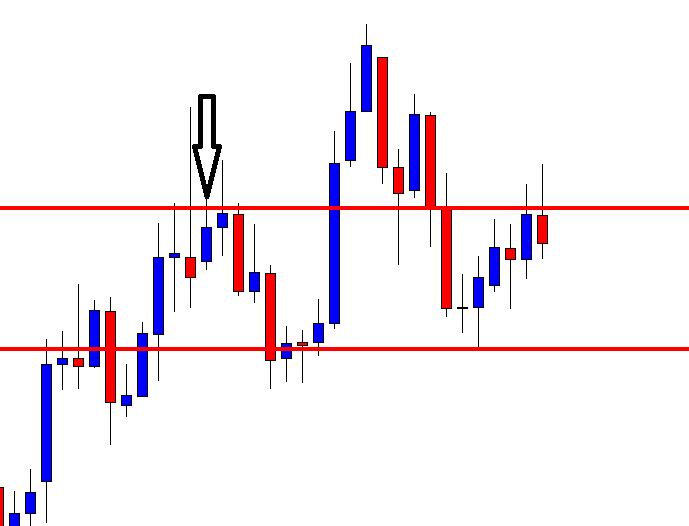
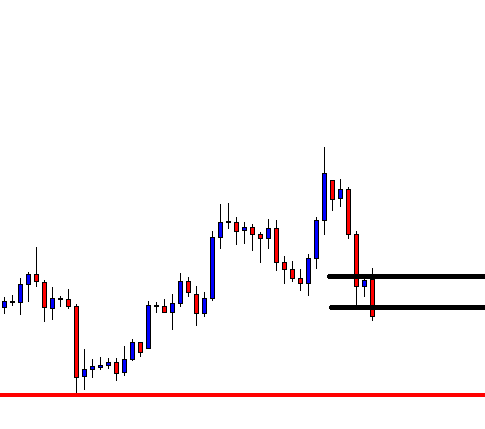
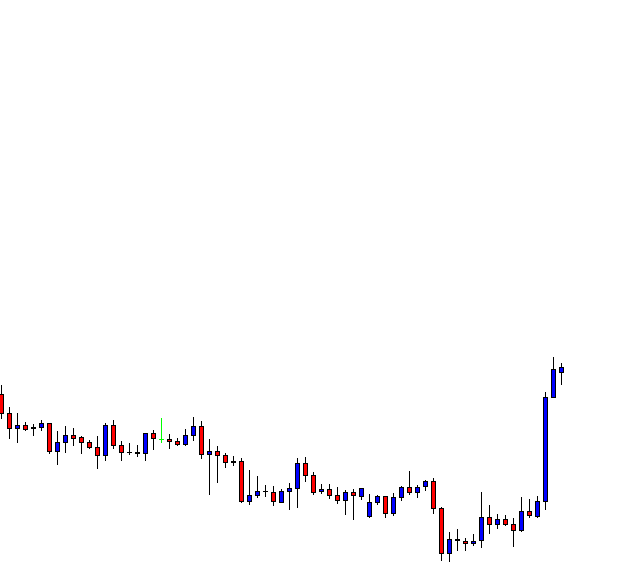
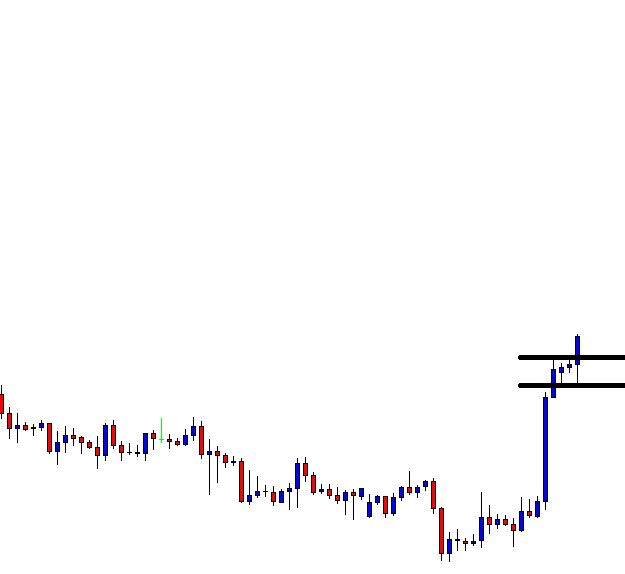
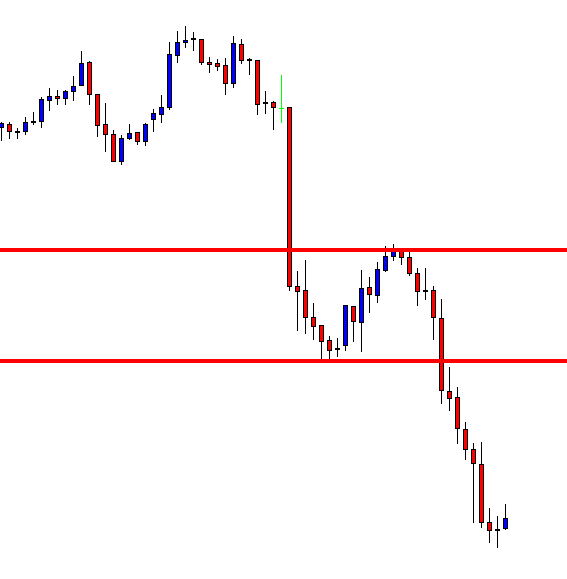
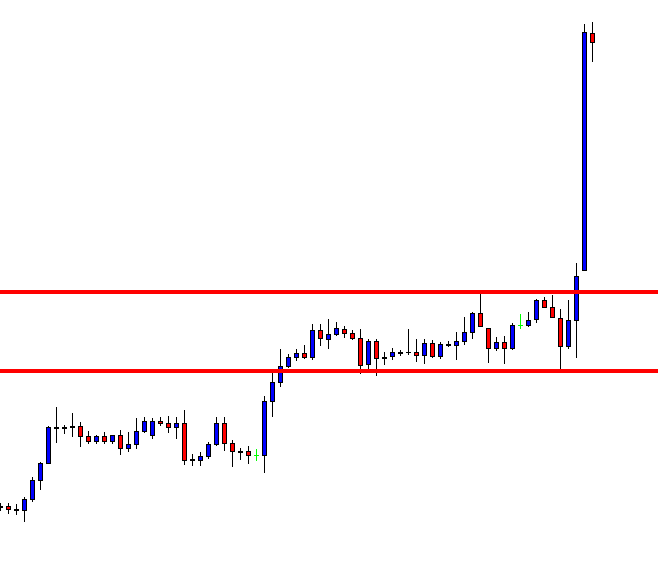
We have four targets (X, B, C, A) to place the take-profit order in the crab pattern. In the beginning, we planned to book full profit at point A, but when the price crosses point B, the market turned sideways. So we have booked half of our profit at point B and then closed our full positions at point A.
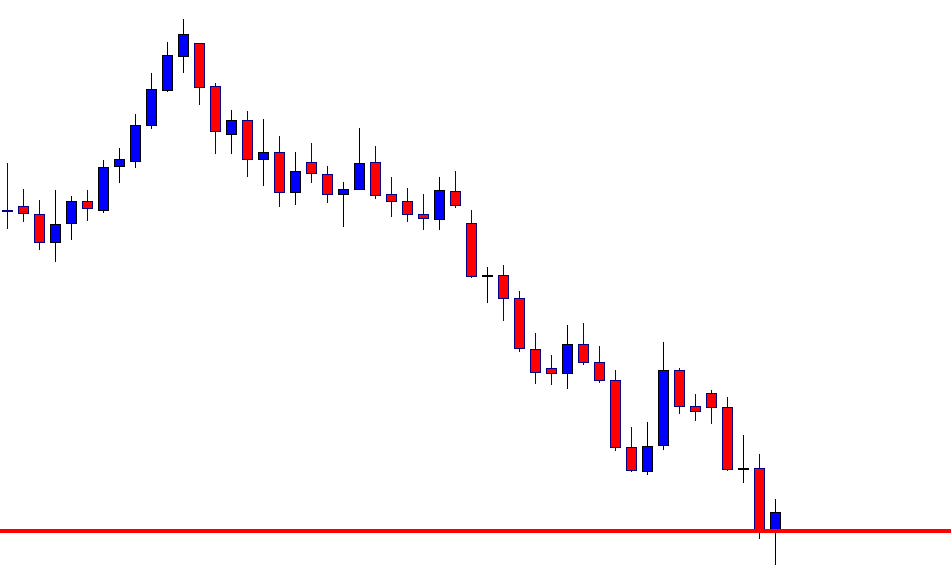
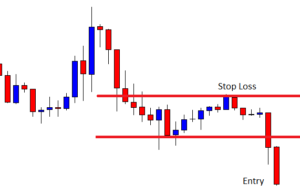
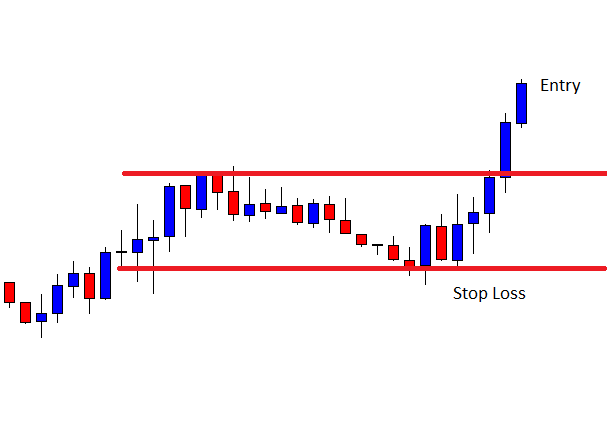
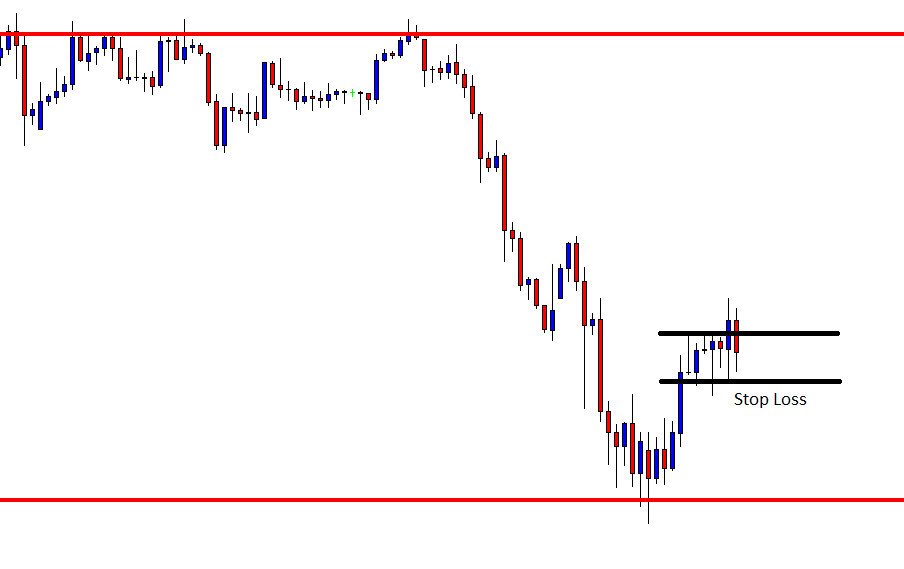
We have seen most of the traders placing their stop-loss way below point D. However, that’s a wrong way to do it because they are risking more because of this simple logic – If the price action breaks point D, it automatically invalidates the pattern. Makes sense? In the above image, we can see that we have placed the stop-loss just below the D point, and overall, it was an 8R trade.
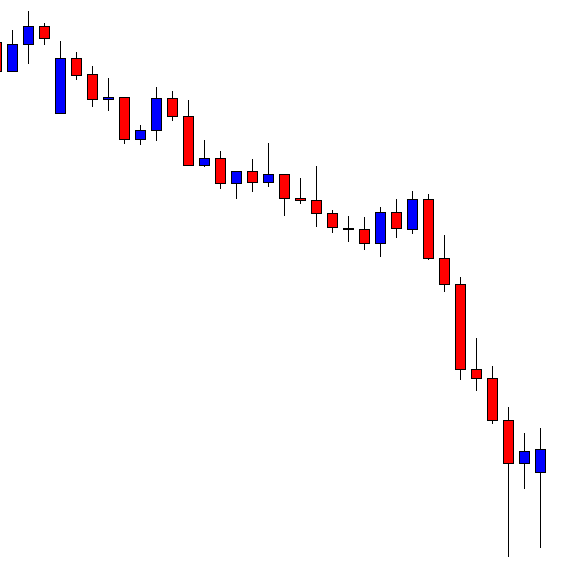
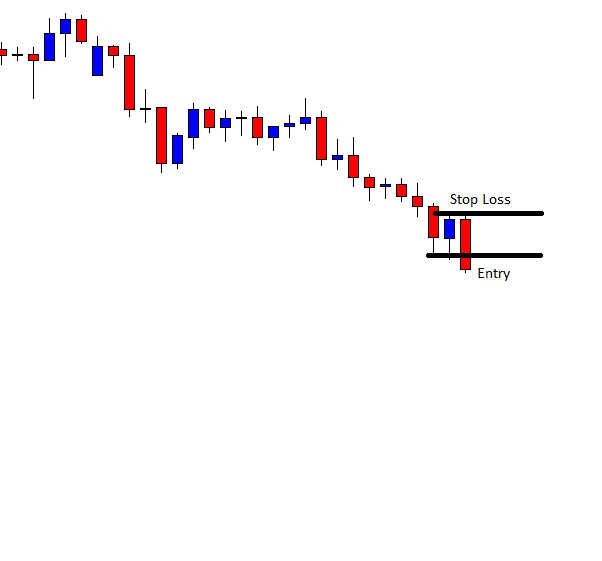
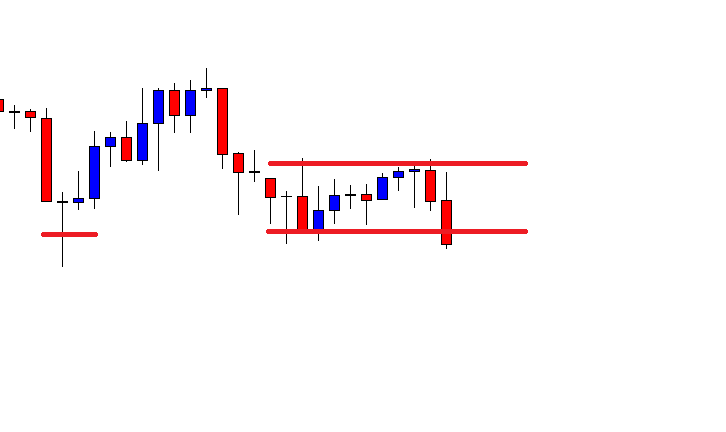
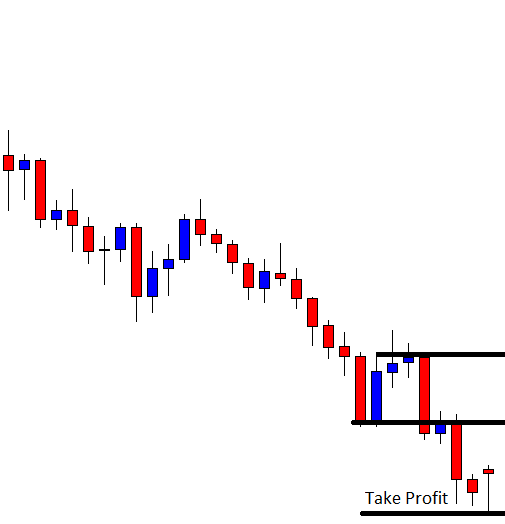
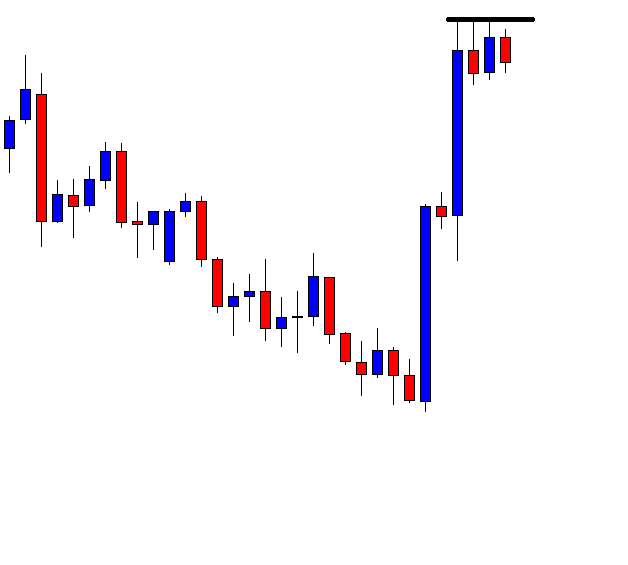
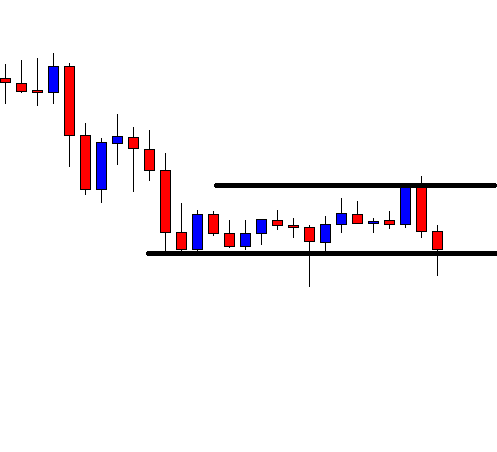
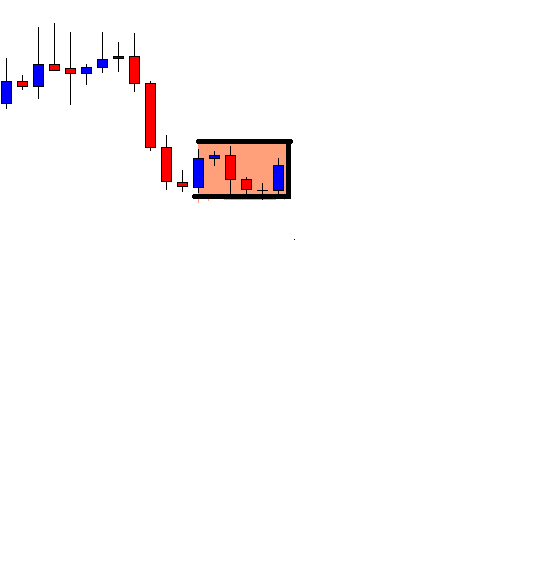
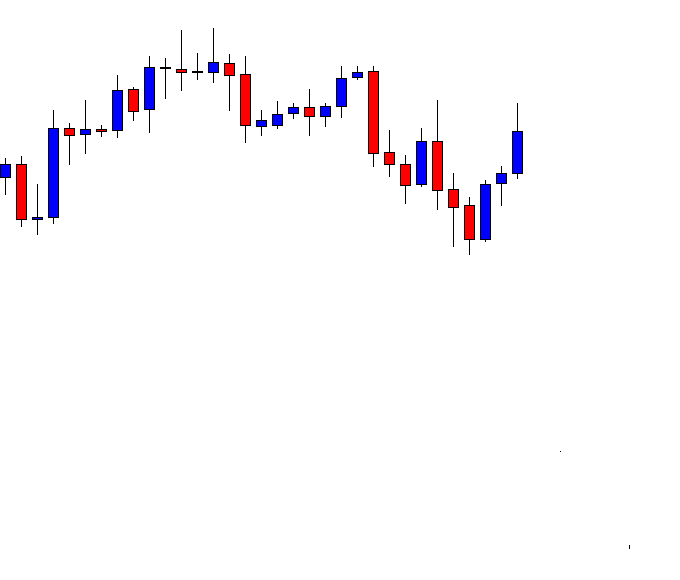
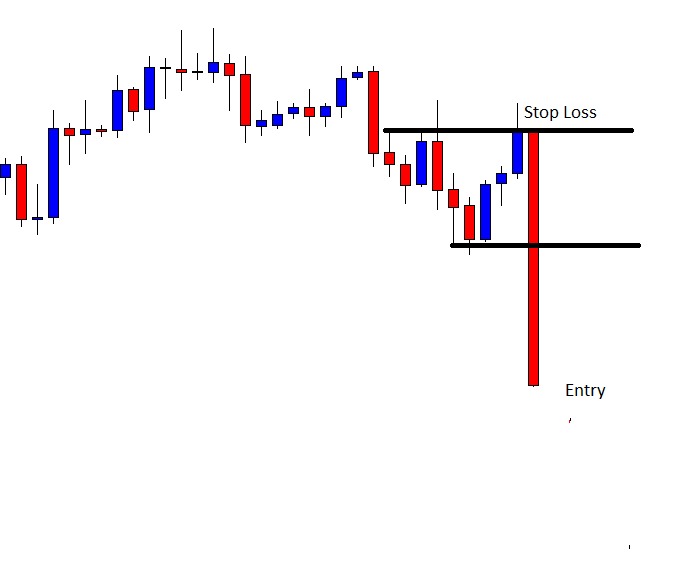
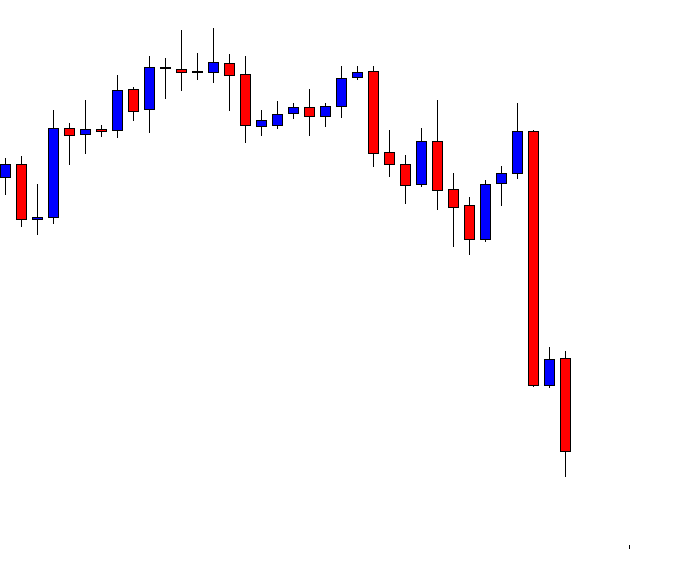
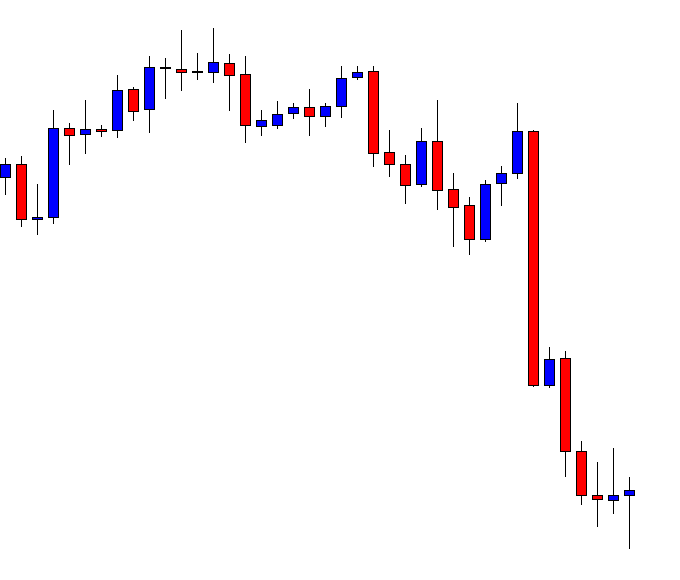
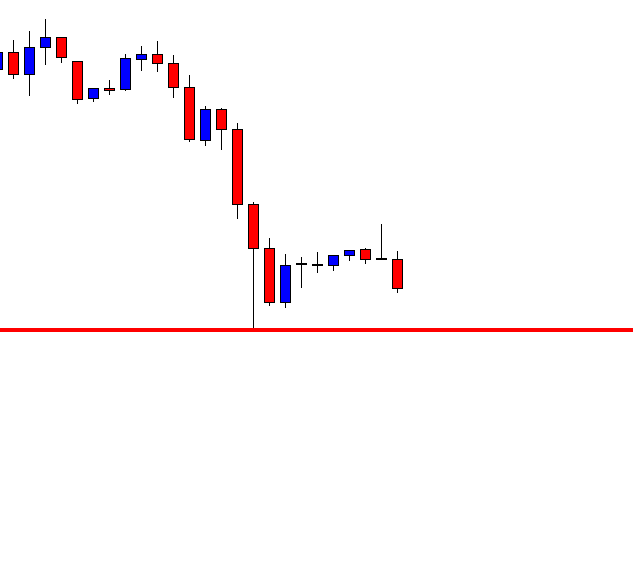
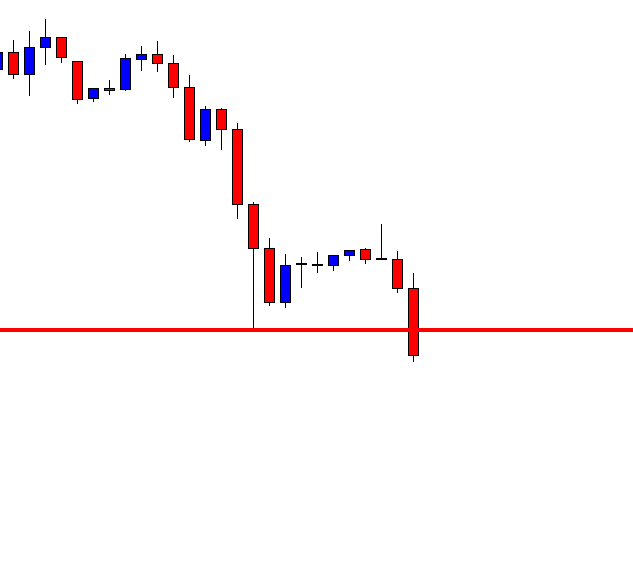
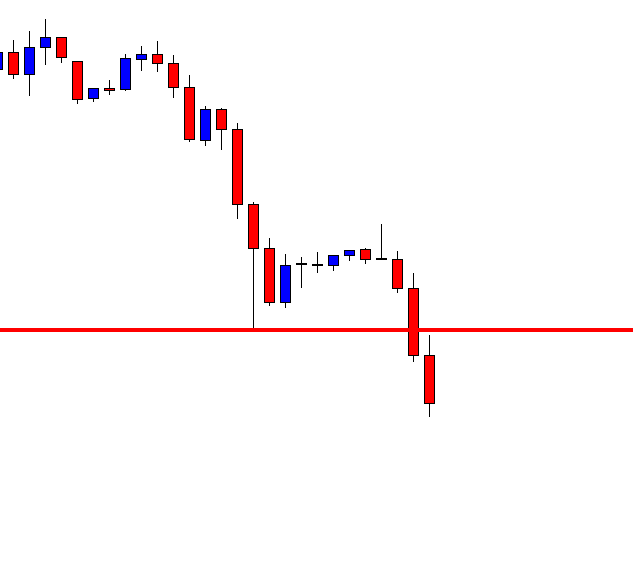
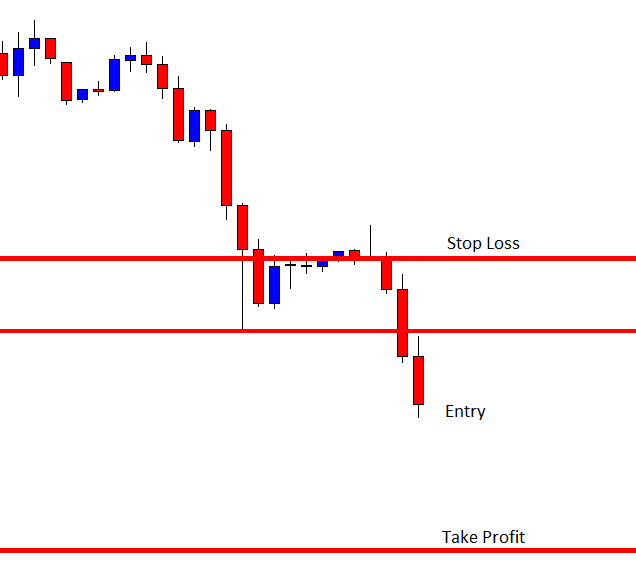
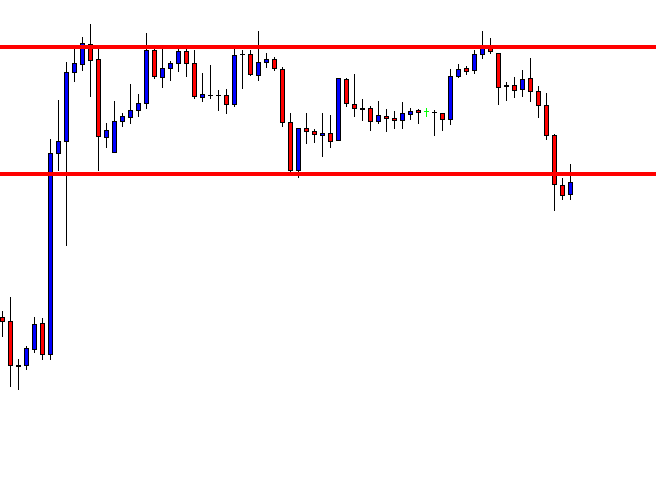
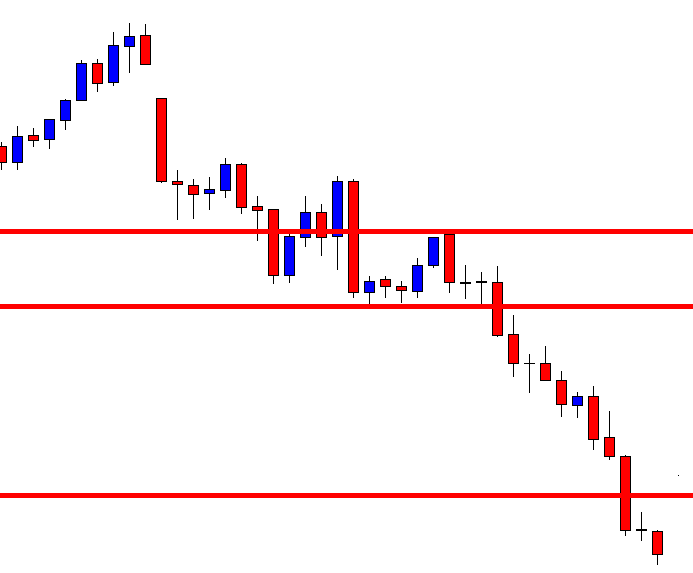
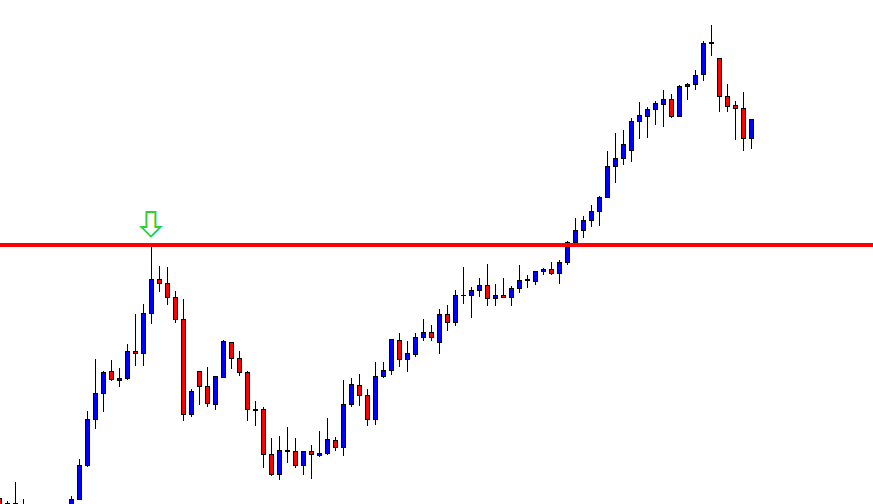
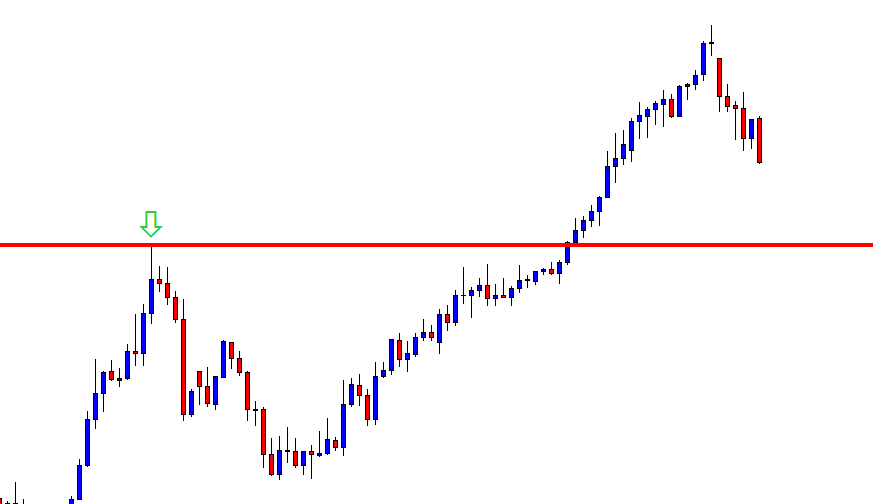
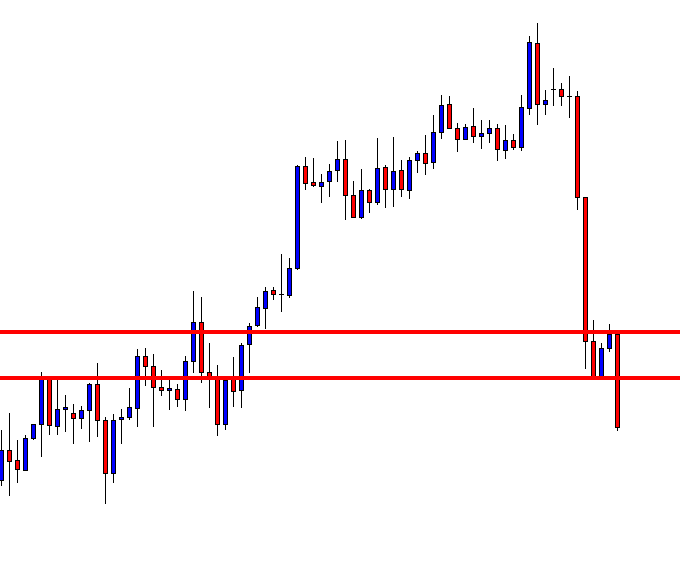
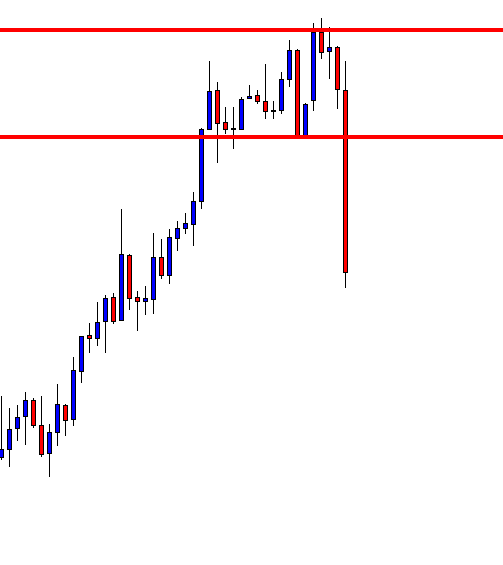
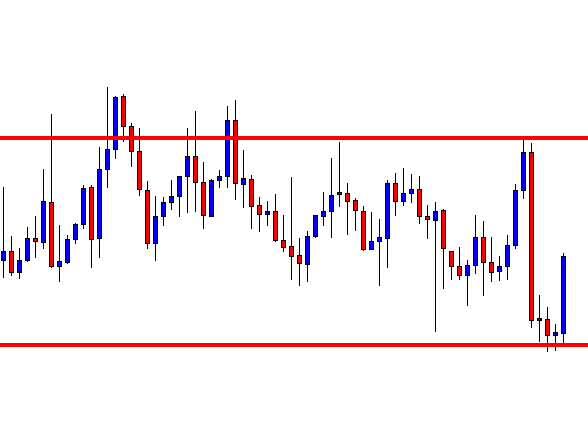
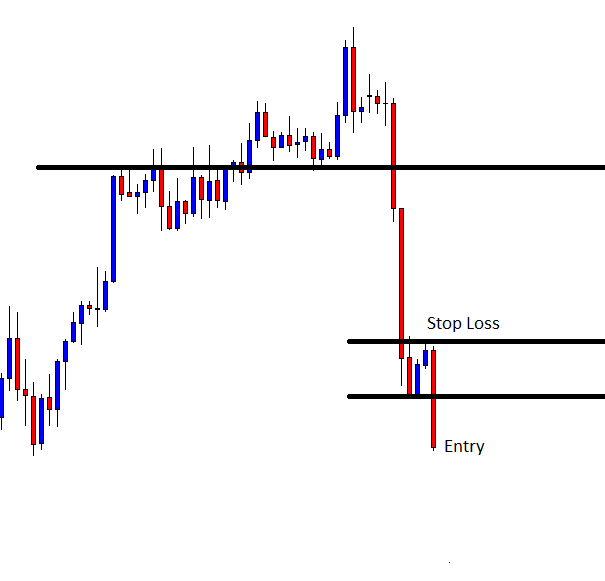
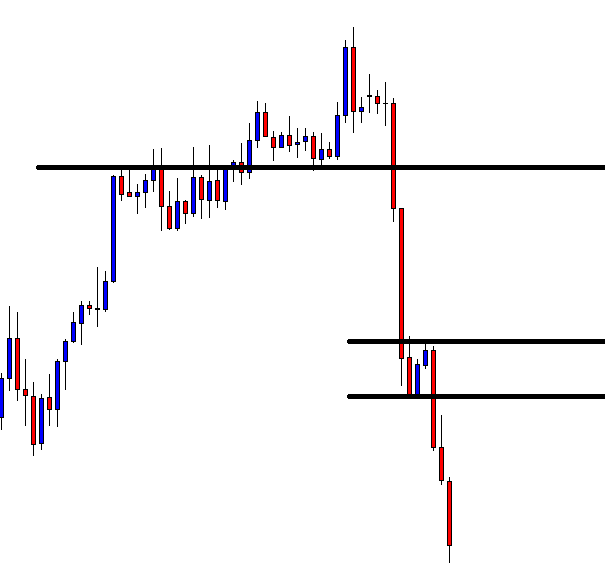
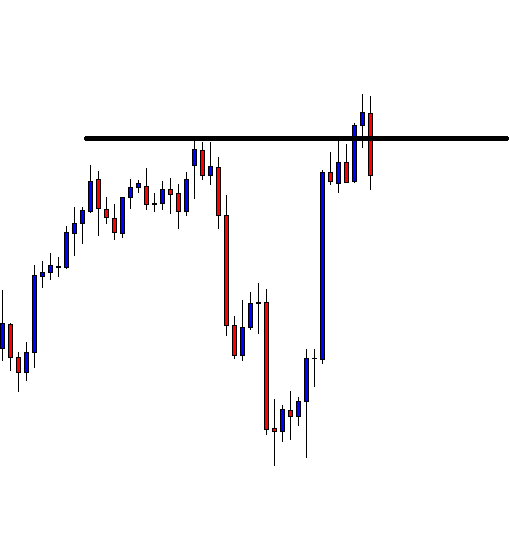
Trading The Bearish Crab Pattern
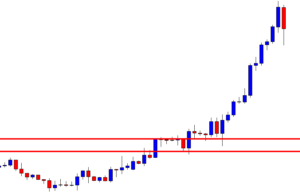
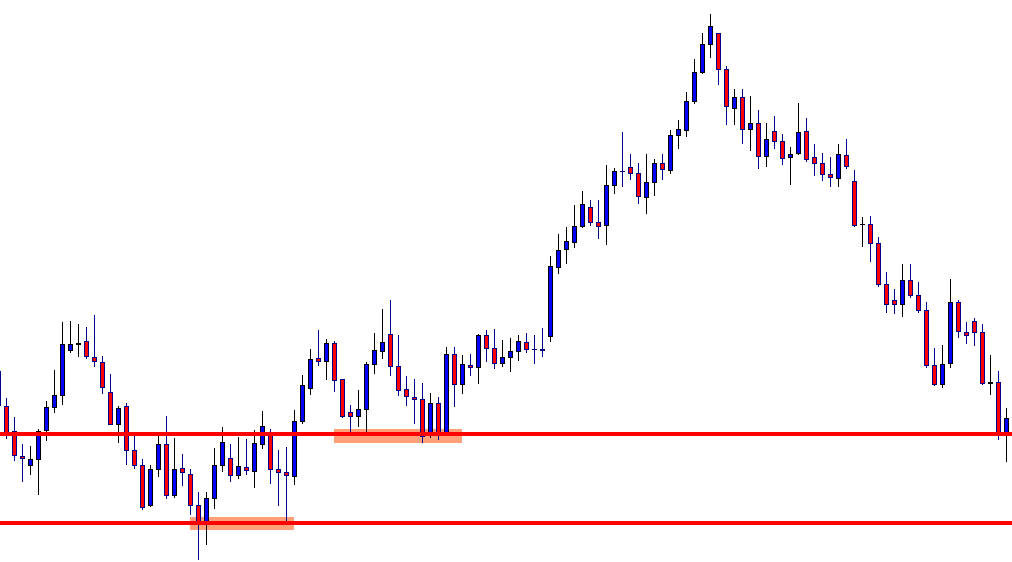
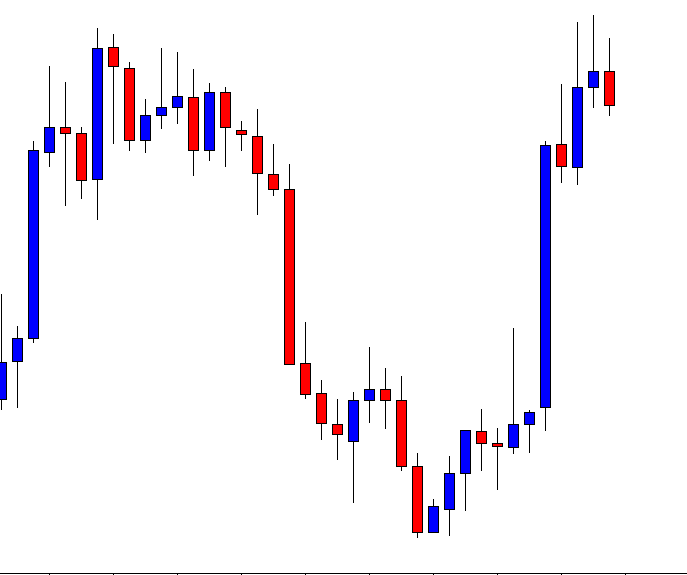
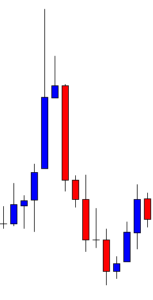
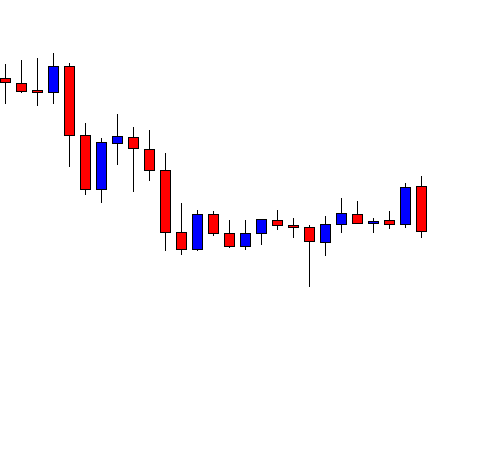
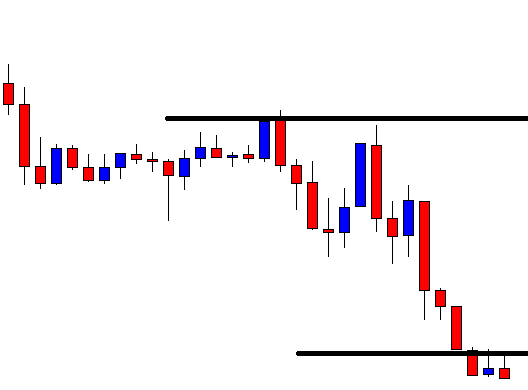
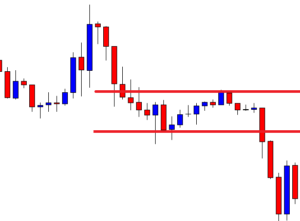
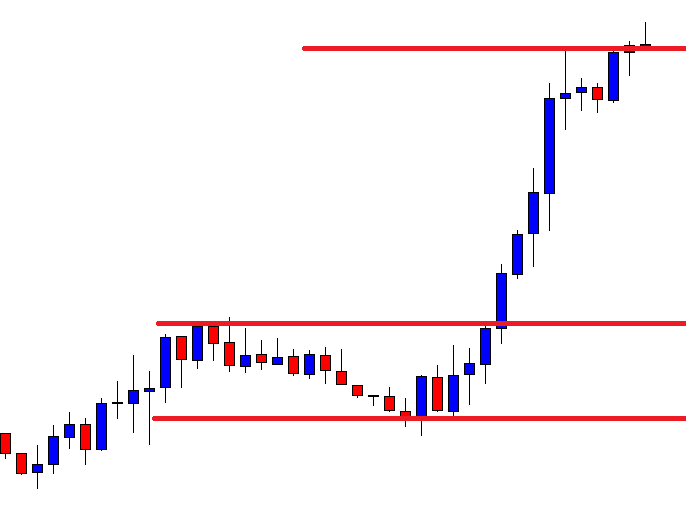
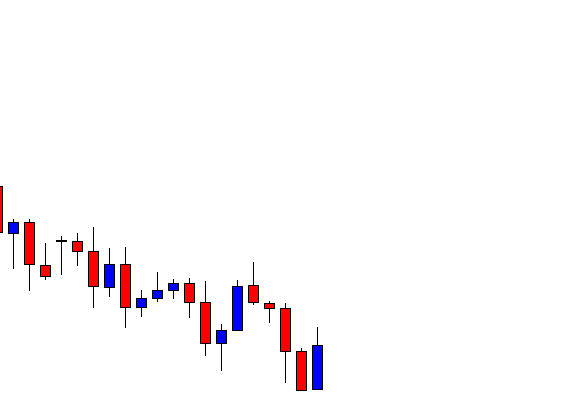
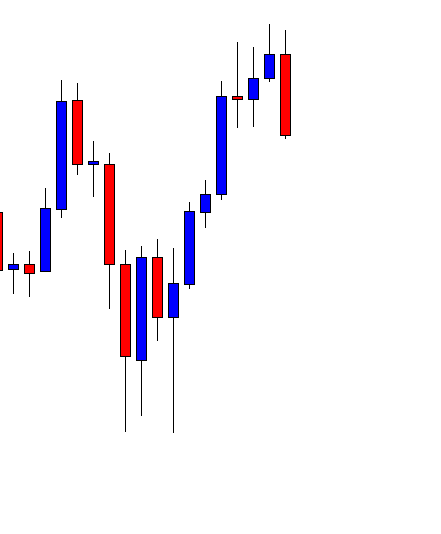
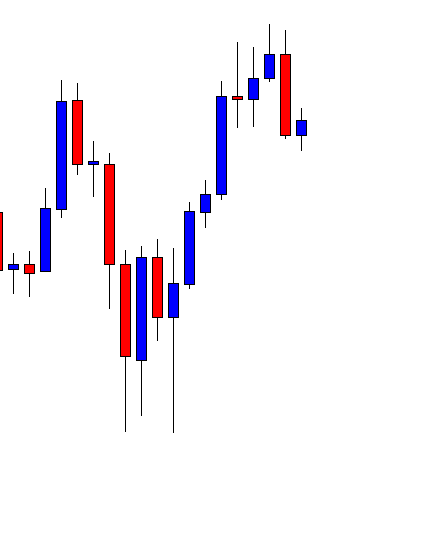
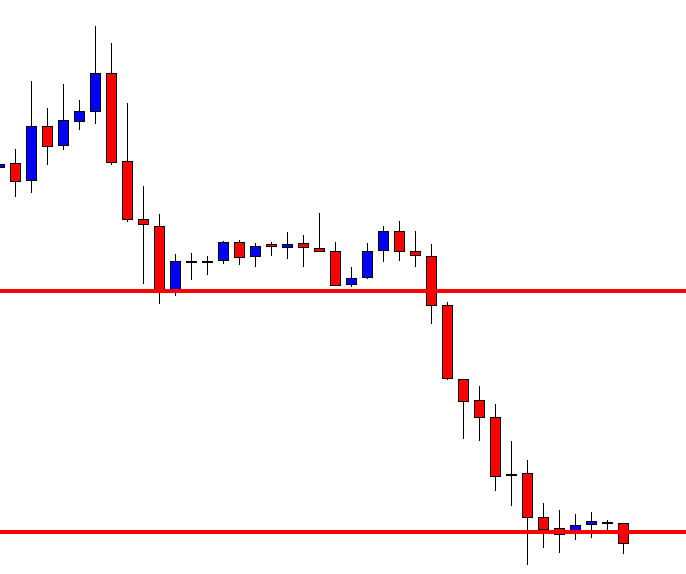
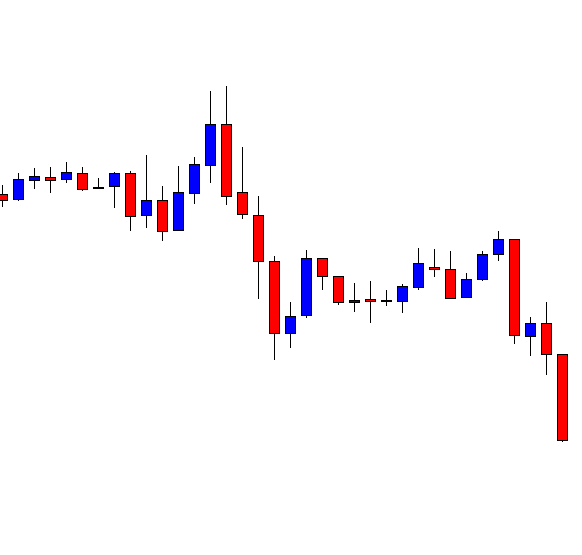
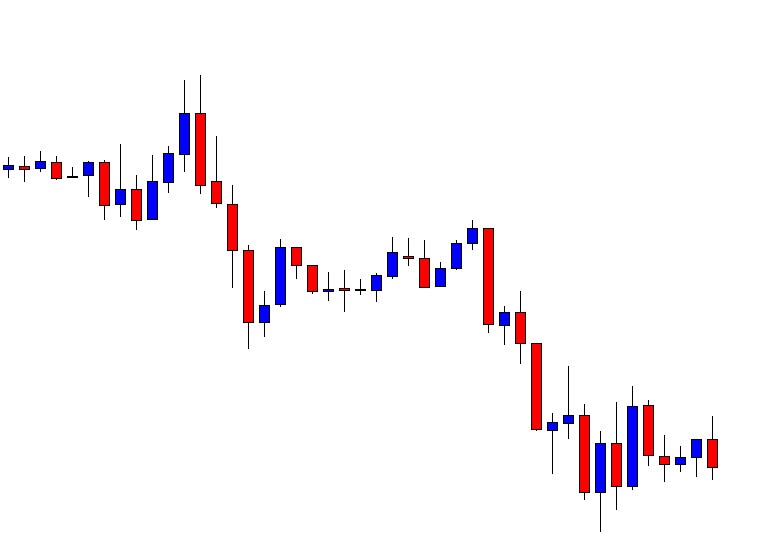
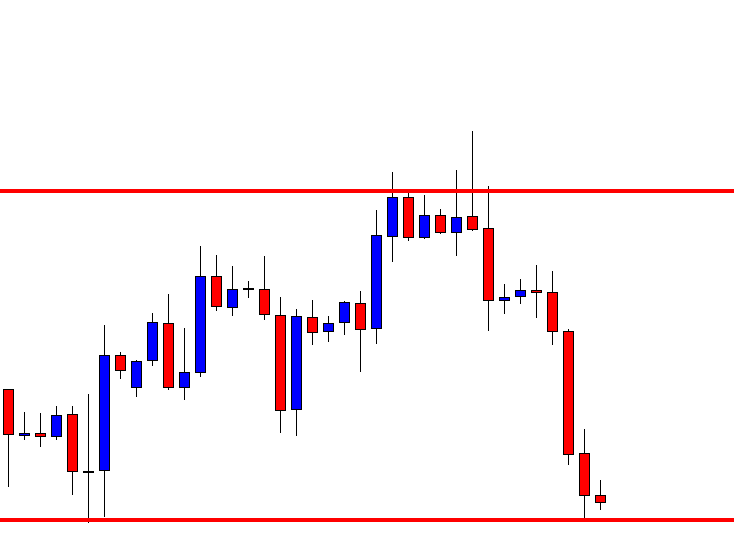
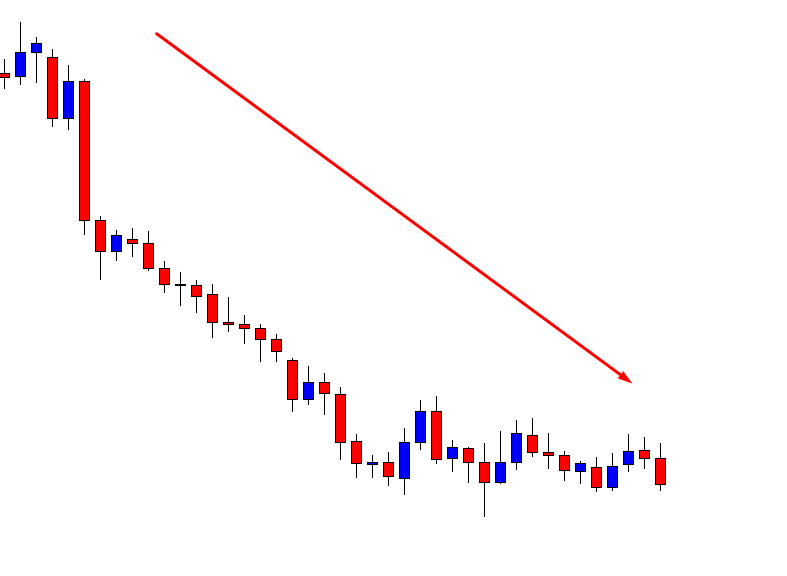
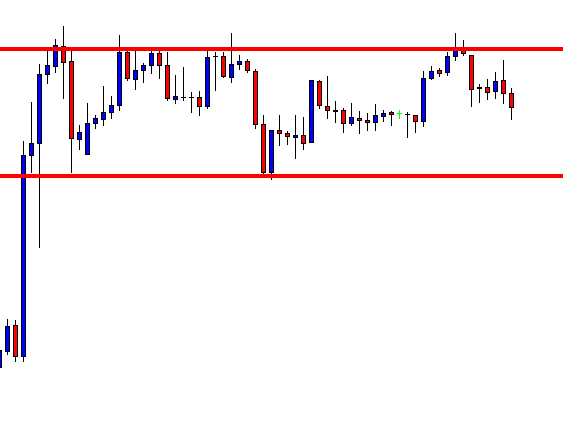
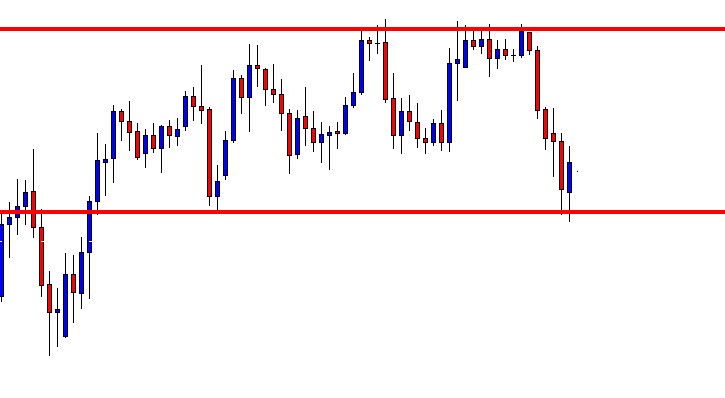
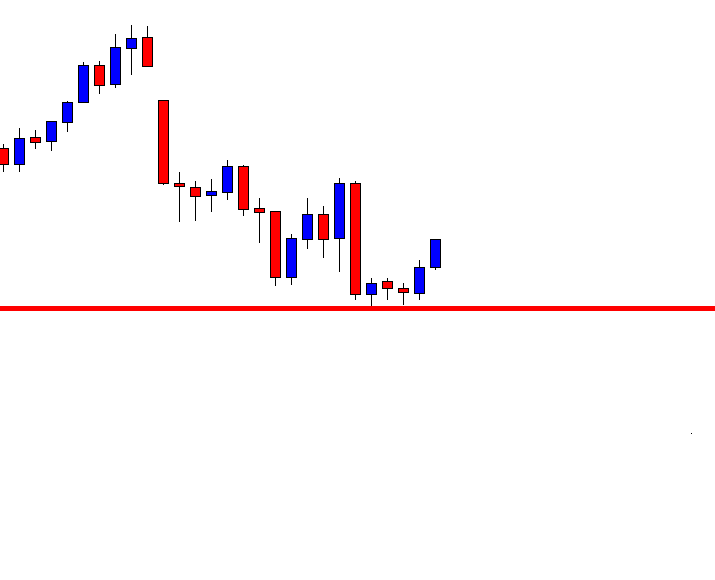
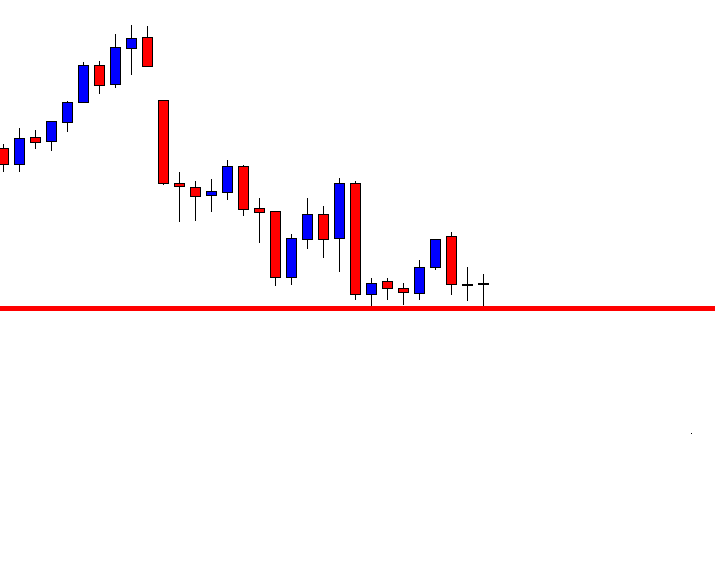
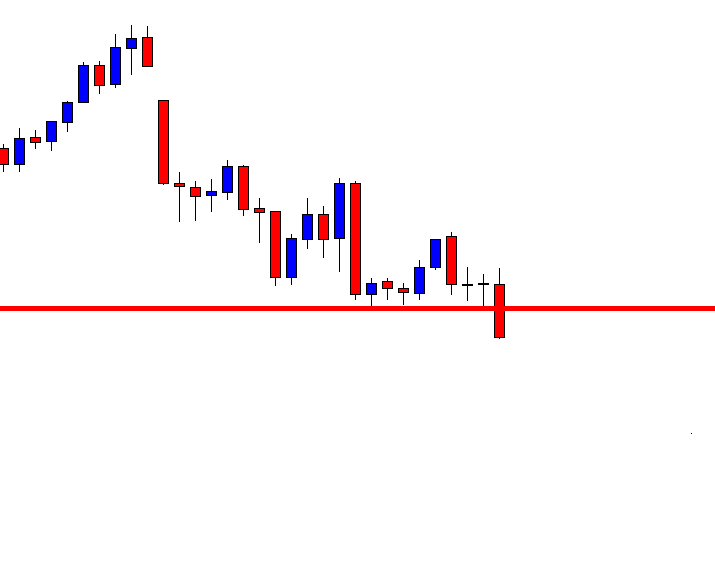
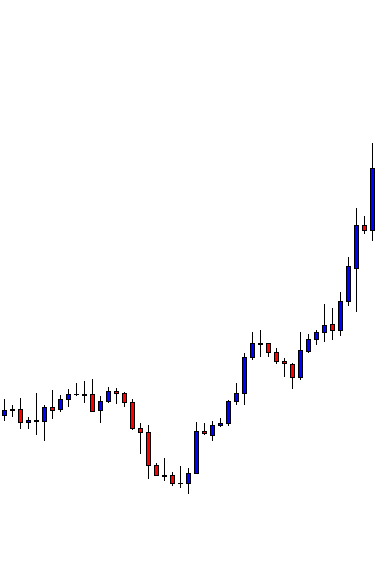
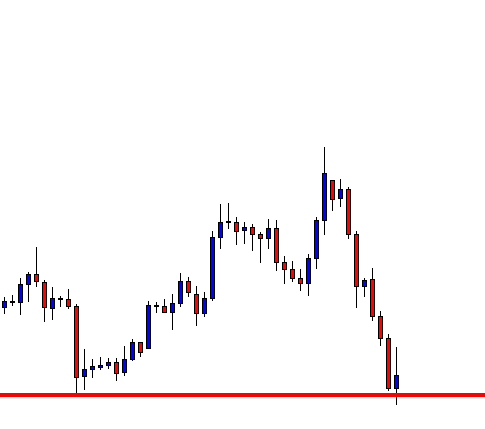
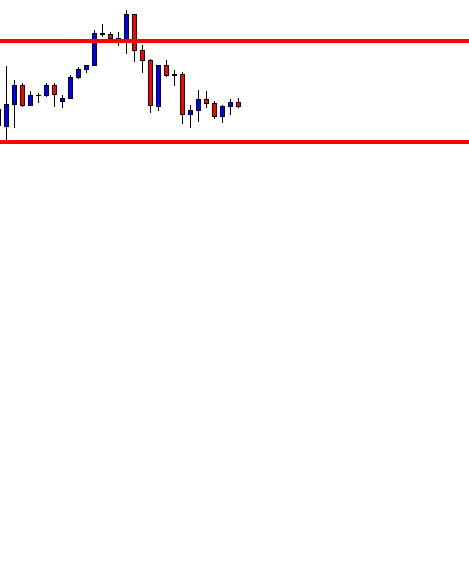
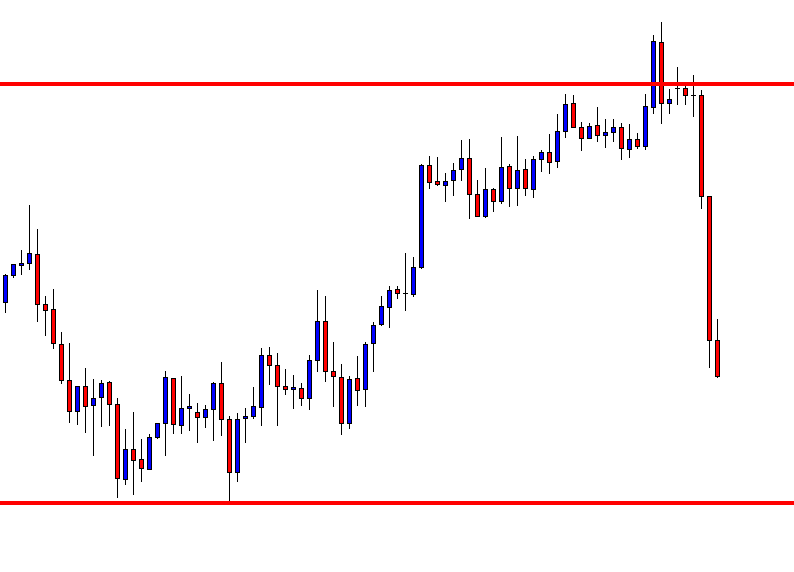
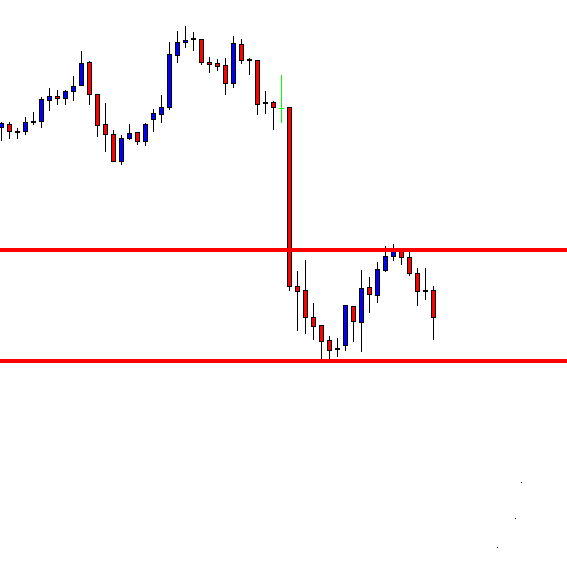
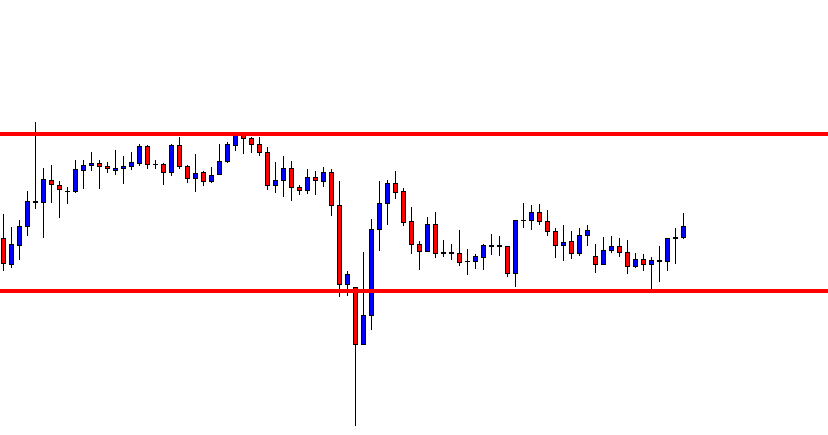
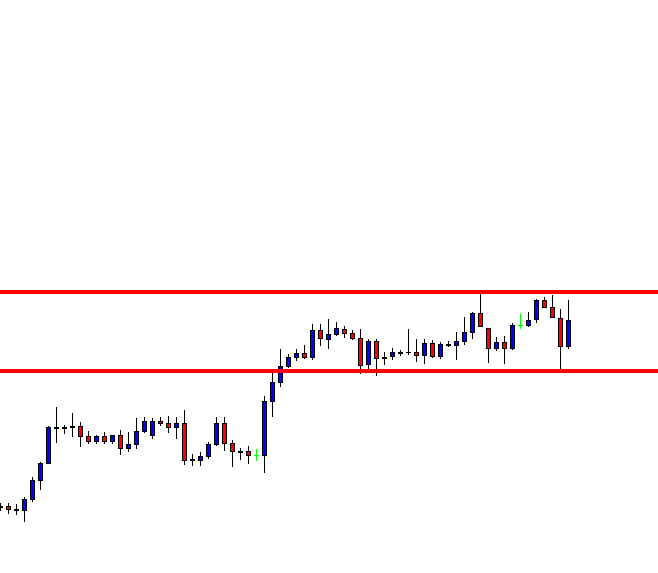
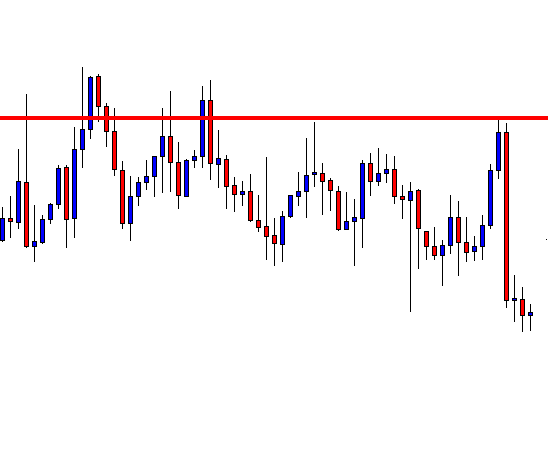
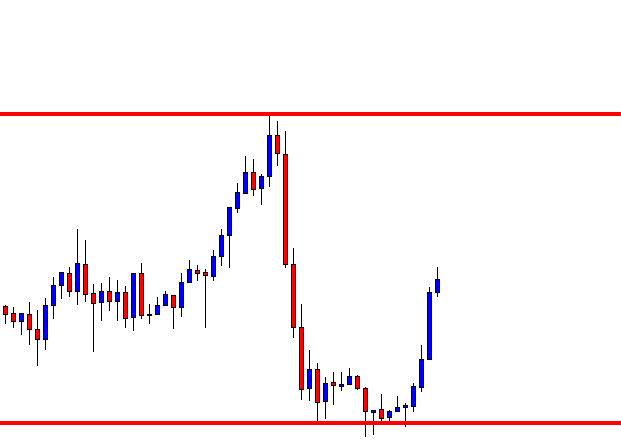
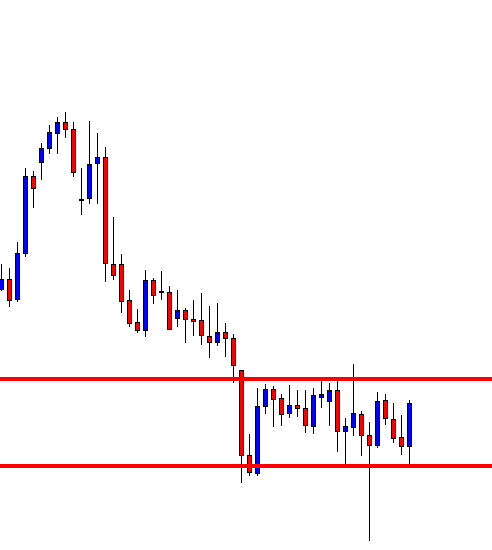
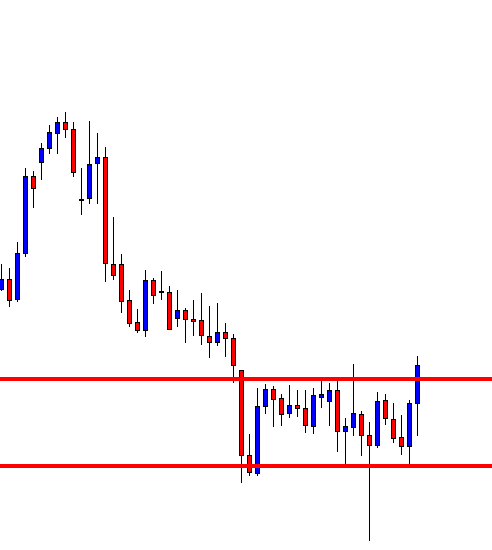
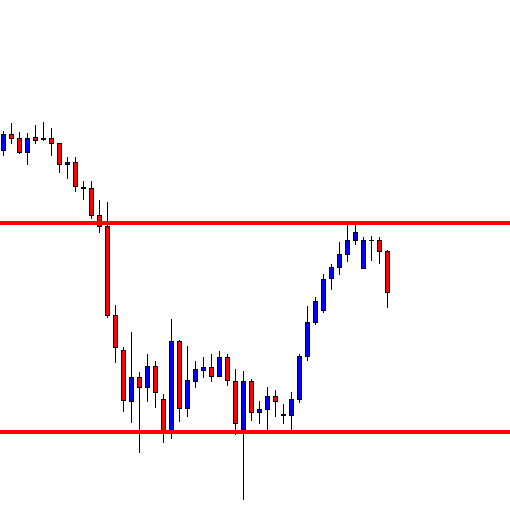
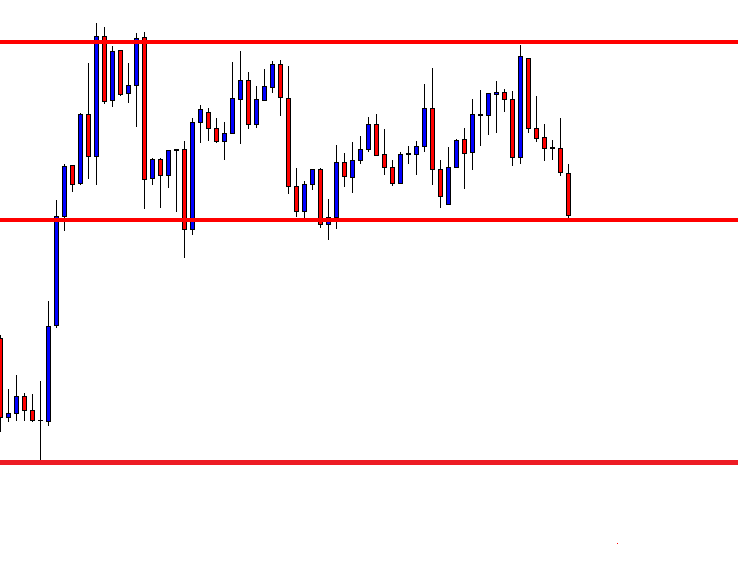
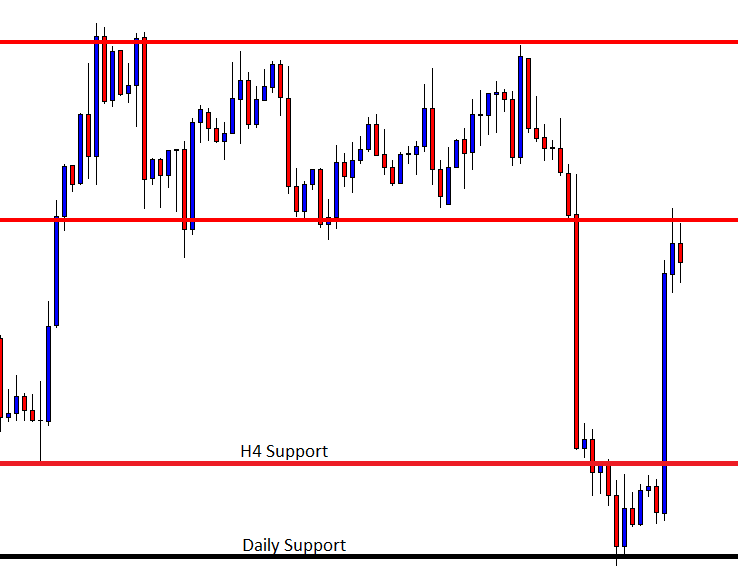
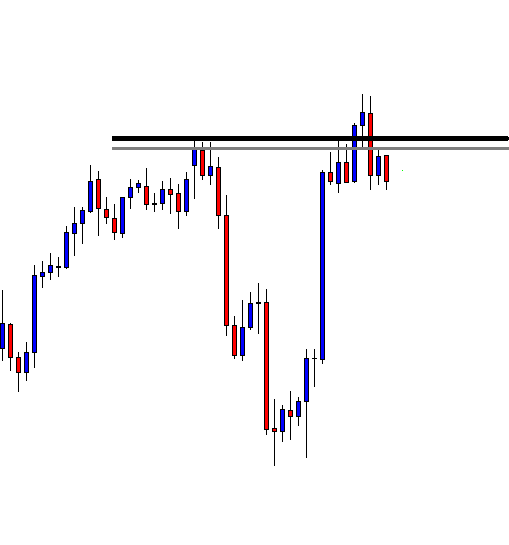
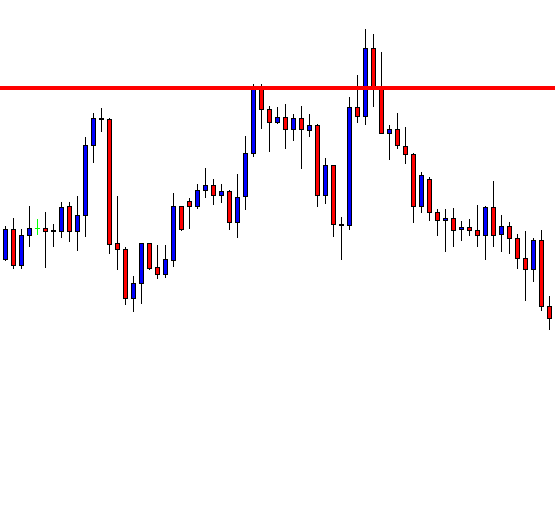
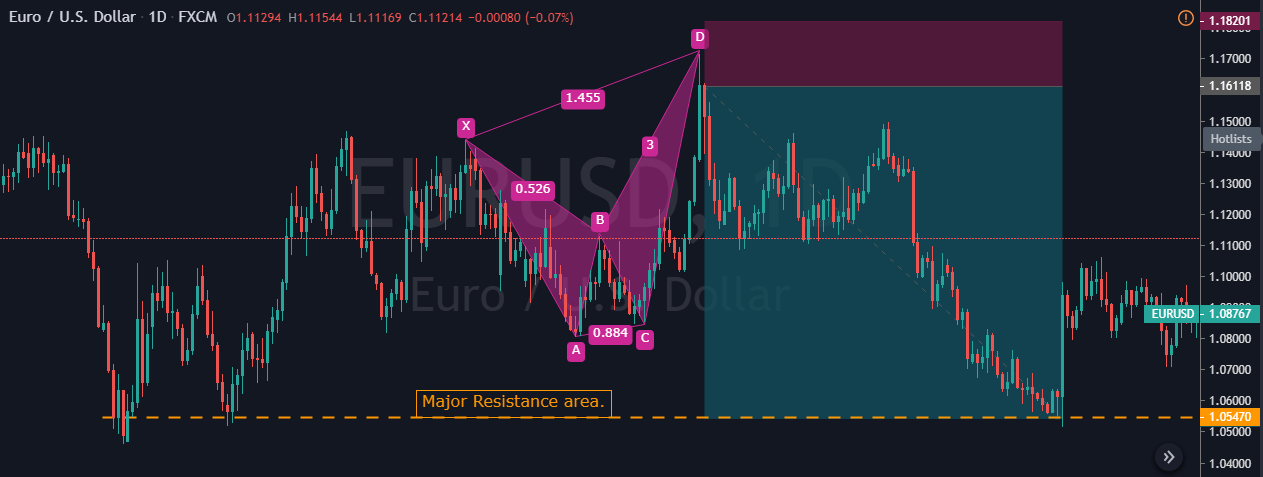
The below Daily chart represents the EUR/USD Forex pair. We have identified the bearish Crab pattern and plotted the Fib ratios on to the chart. As you can see, the market was in an uptrend. The first leg, which is XA, can be considered as a random bearish move. The AB bullish move reached close to the 38.2% of the XA leg. The third leg, BC, goes in the counter direction and retraces to the 88.6% Fib level of the AB move. The last leg is crucial because our decision making depends on this move alone. We can see the last candle reaching close to the 161.8% level of the AB leg, and this confirms the appearance of the bearish Crab pattern.
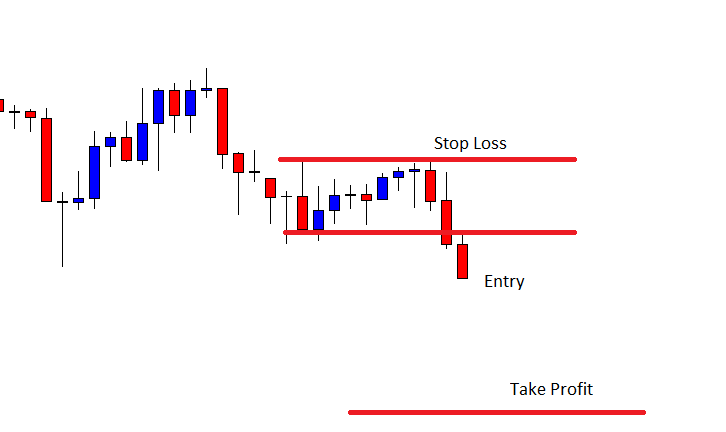
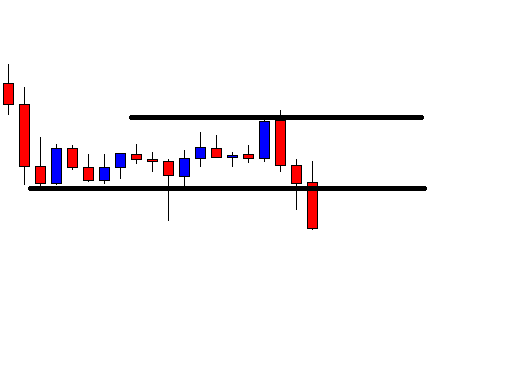
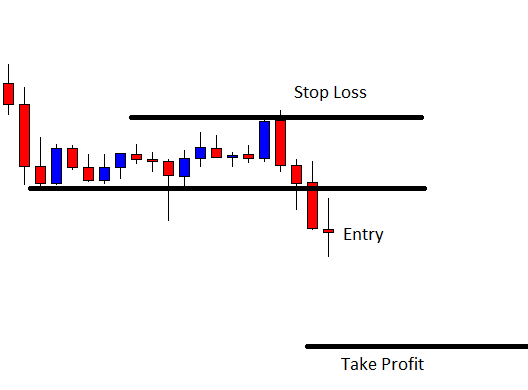
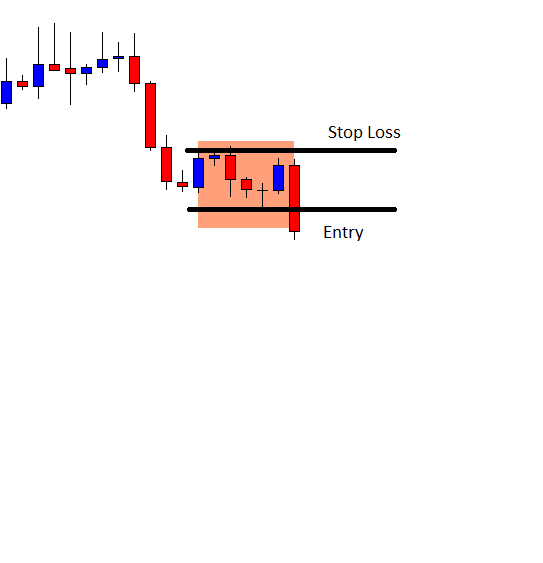
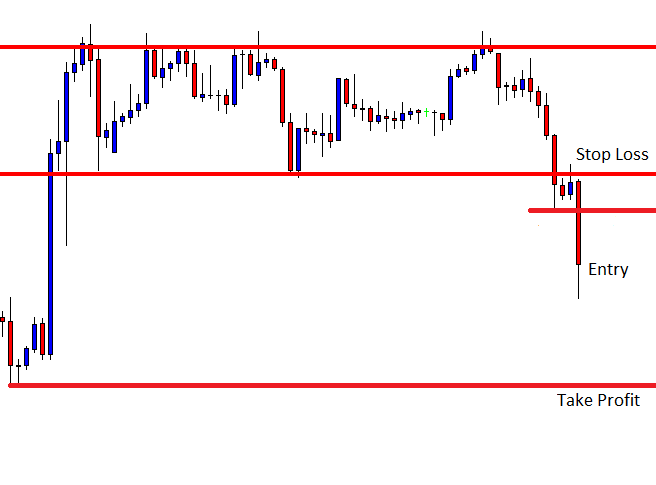
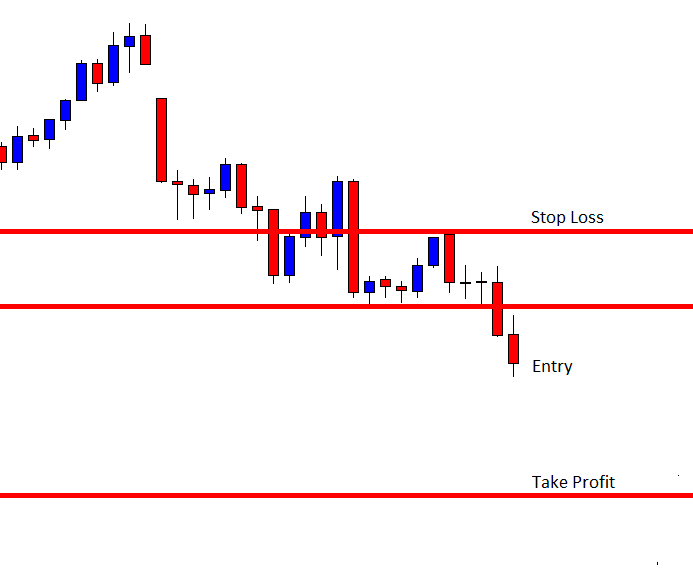
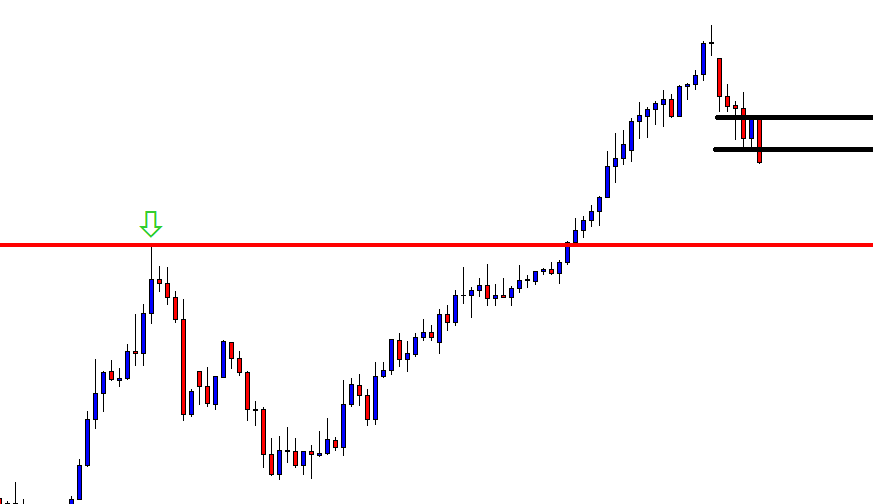
Entry, Stop-Loss & Take-Profit
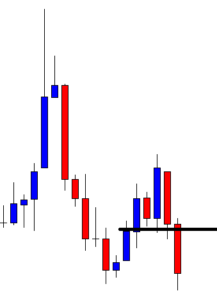
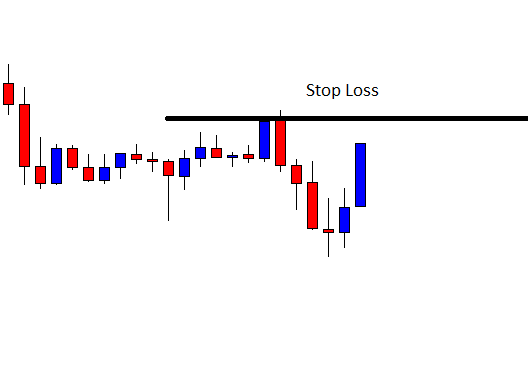
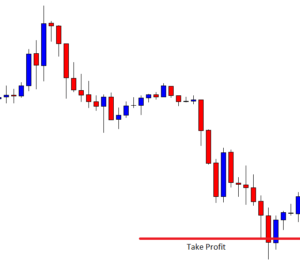
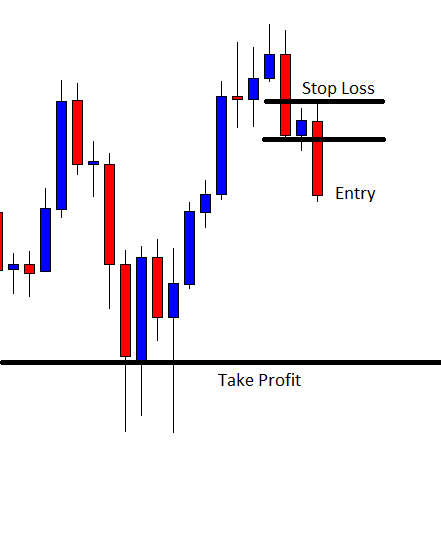
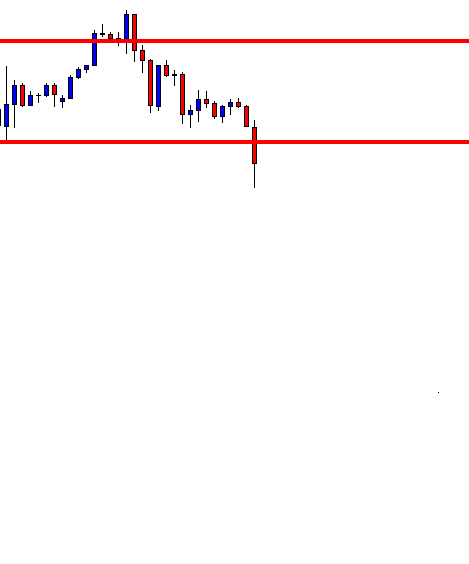
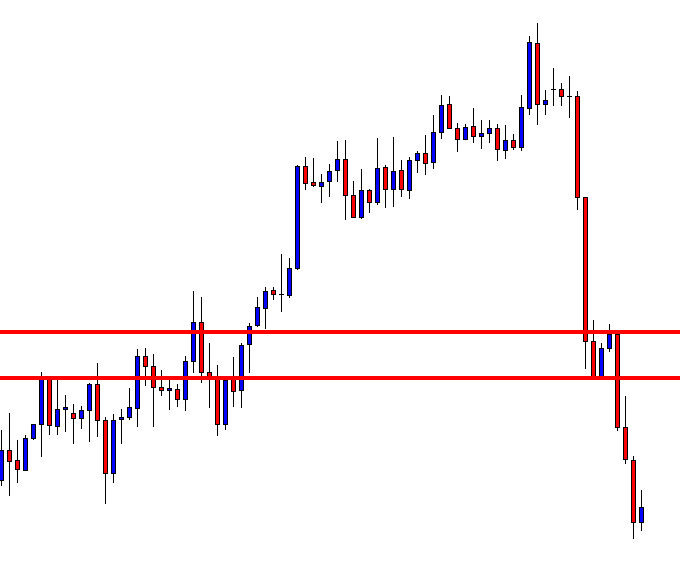
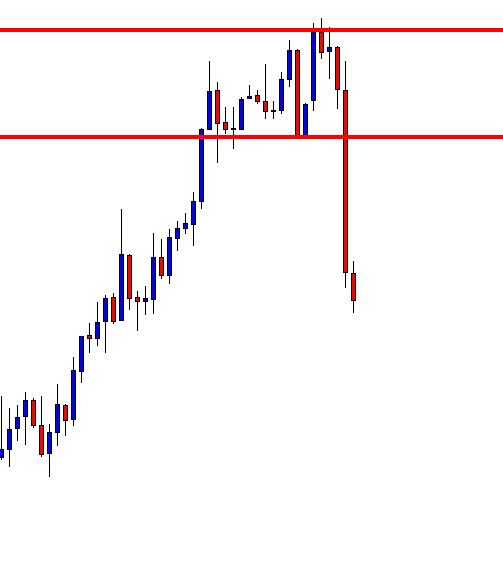
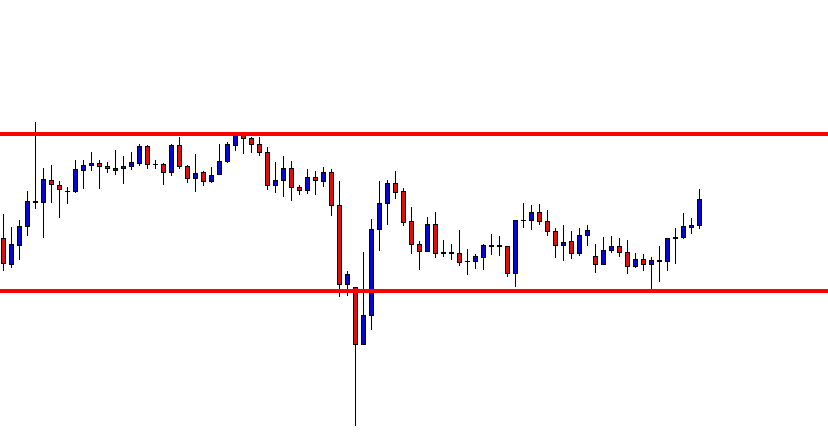
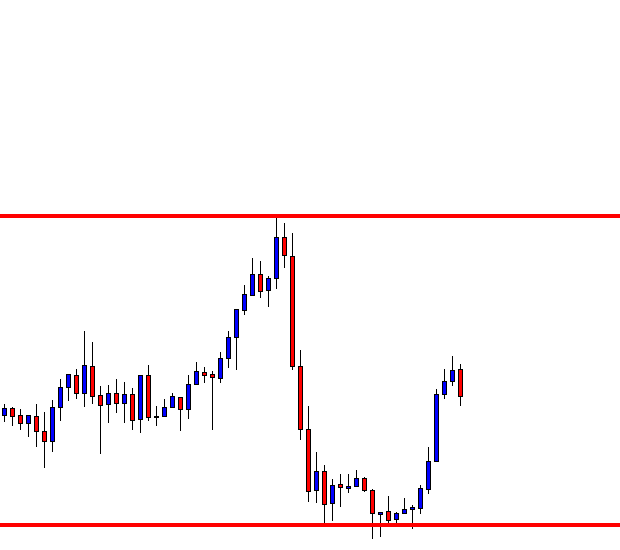
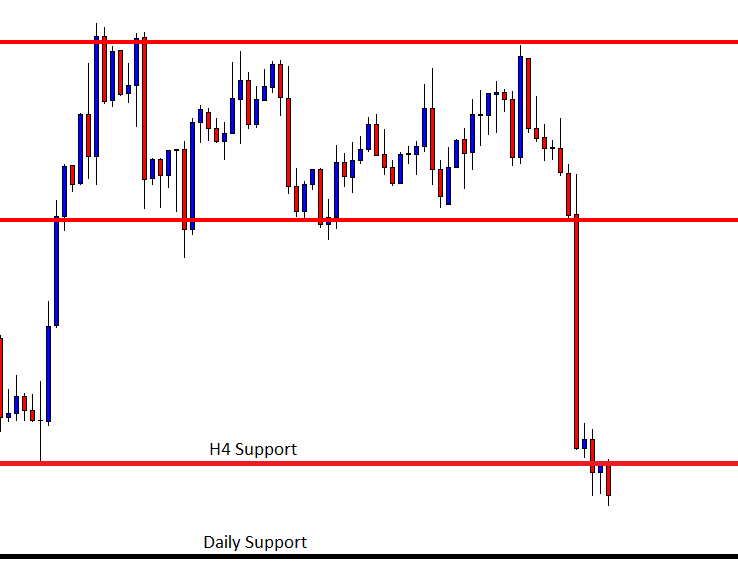
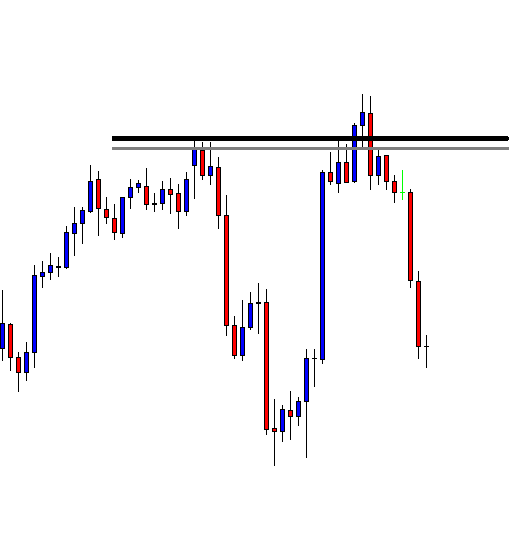
We immediately went short in this Forex pair as soon as the final leg of the pattern closed. For some traders, it might be challenging to take a trade on the face of strong buyers. But when the market follows all the rules of the pattern, you can confidently pull the gun. Furthermore, the bearish candles increase the chance of trade working in our favor. Conservative traders can wait for these confirmations and then take the trade. In the end, price rolls over, and prints a brand new lower low.
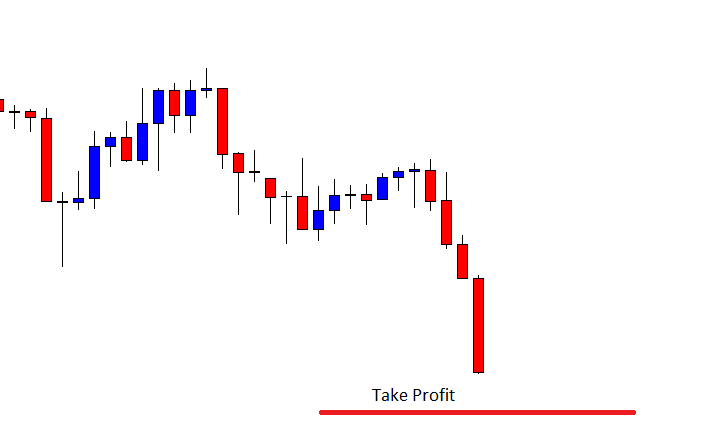
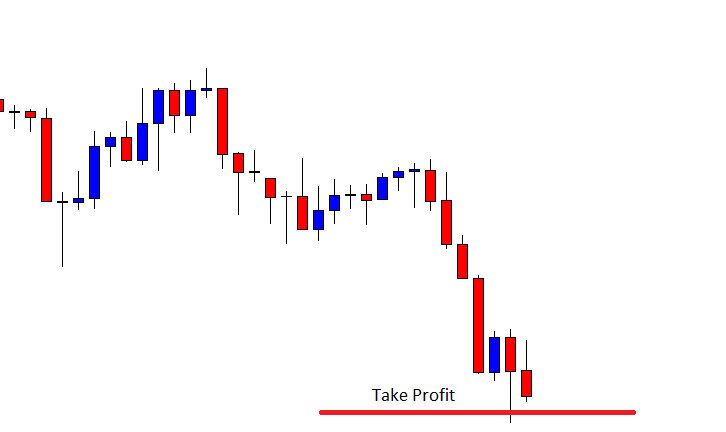
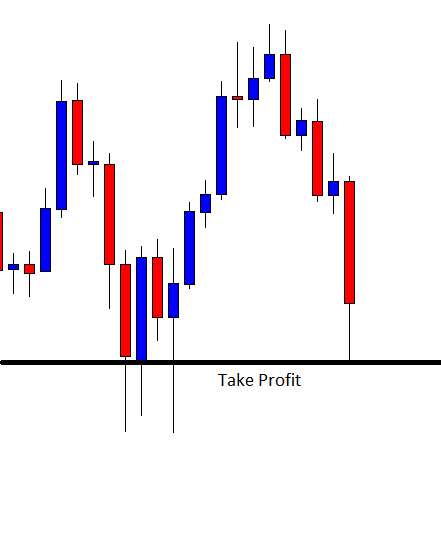
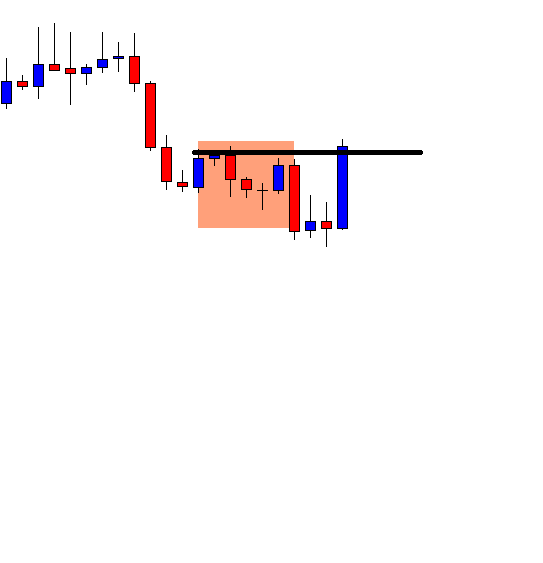
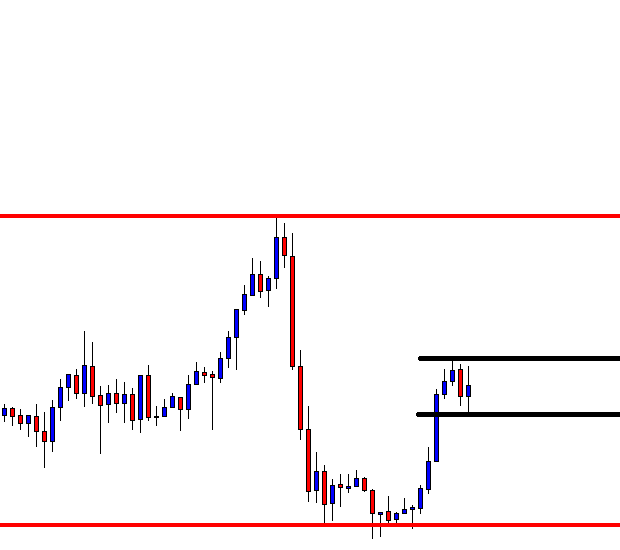
We have followed the same rules of risk management as we have done with a bullish Crab pattern. However, we were being optimistic and placed the take-profit order at the higher timeframe’s major resistance area. If the market had started moving sideways, we would have booked our profits either at B or C or A. Stop-loss is placed just above point D, as discussed before.
Conclusion
The Crab patterns appear less frequently compared to other harmonic patterns in the market. But when it does, it often provides a high risk to reward ratio trades. If you are new to this pattern, you need a bit of experience and skill set to identify and trade this pattern on the price chart. Once you master this pattern, new trading opportunities will emerge, which can exponentially grow your trading account. In the end, trade the bearish Crab only when it appears in an uptrend, and trade the bullish Crab only when it appears in a downtrend. Only then the odds of your trades performing increase.
We hope you find this educational article informative. If you have any queries, please let us know in the comments below. Cheers.