Categories
Forex Fundamental Analysis

What Should You Know About Industrial Production MoM Forex Indicator?

Introduction

Before the Service sector dominated the Industrial sector as a significant contributor to the GDP, it was the industrial production alone that was seen as a measure of economic growth. It still holds for many developing economies. Economies like China, Japan, India, etc. all had significant industrial revolutions that helped their countries to improve their economy. The industrial sector still contributes a considerable percentage to the economy and employs millions of people.

What is Industrial Production MoM?

Industrial Production: It refers to the total output produced by the industrial sector. Here the industrial sector consists of the mining, manufacturing, electric, and gas utility sectors. It is like a mini-GDP report for the industrial sector. By definition, it must be apparent that it primarily deals with tangible commodities or physical goods. On the other hand, The Service sector comprises of non-tangible entities largely.

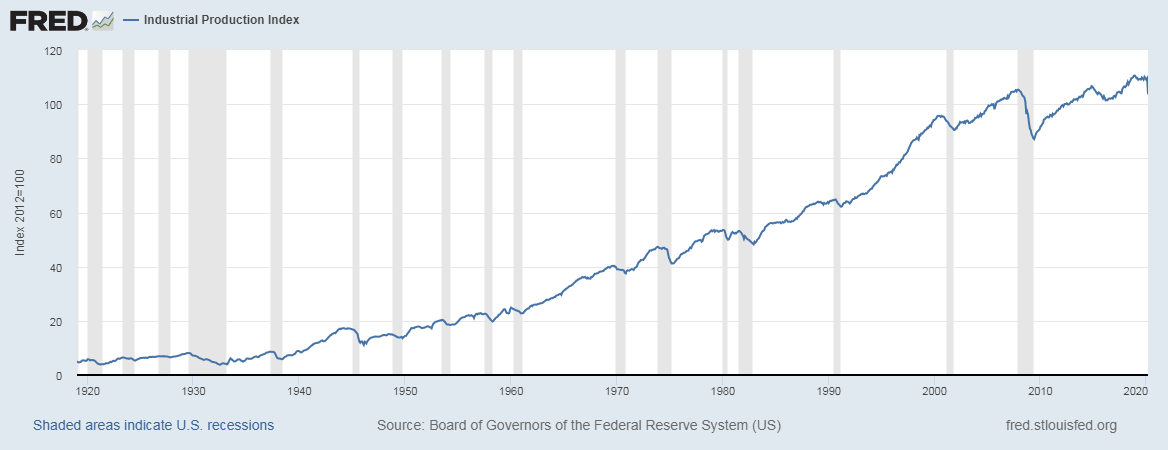
The Industrial Production Index goes as back as 1919 if required, and is published by the Board of Governors of the Federal Reserve System in the United States. The extended time-frame availability of data makes it a more robust, reliable economic indicator as more data points are available relative to other sectors.

The data is aggregated by combining data in different units. Some of the data may be in dollar terms, some may be in tonnes (e.g., the weight of barrels of oils and steel), or inferred by the number of hours worked. The logged-in hours are obtained from the Bureau of Labor Statistics. It is expressed as a percentage of real output relative to a base period. The base year is currently 2012. The methodology incorporated to calculate the Industrial Production is the Fisher Ideal Index, where the contribution of each sector is weighted (the higher the contribution, the higher is the weightage in the index calculation).

Industrial Production Indices comes in YoY and MoM versions comparing production size with the previous year and month, respectively. The YoY figures deem more use to analysts and government officials to analyze the performance of the industrial sector for this financial year. The MoM (Month over Month) figures are useful for closely monitoring for the expected uptrends or downtrends during business cycles. The MoM figures are more useful for investors in this regard.

How can the Industrial Production MoM numbers be used for analysis?

We have to understand the significance of this statistic historically. Before the development of the service sector, i.e., before the era of computers and the internet, the most industrialized countries were the most advanced economies. Countries that had many factories manufacturing tons of commodities were seen as highly advanced economies back in the day. Hence, it is no surprise that at such times the Industrial Production figures were a direct measure for the economy’s economic activity and growth.

The general trend in economic growth has been that underdeveloped economies have the primary sector as a significant contributor to the GDP. The developing economies have the secondary sector (industrial sector) as the primary contributor to the GDP, while the developed economies have the tertiary (or service) sector.

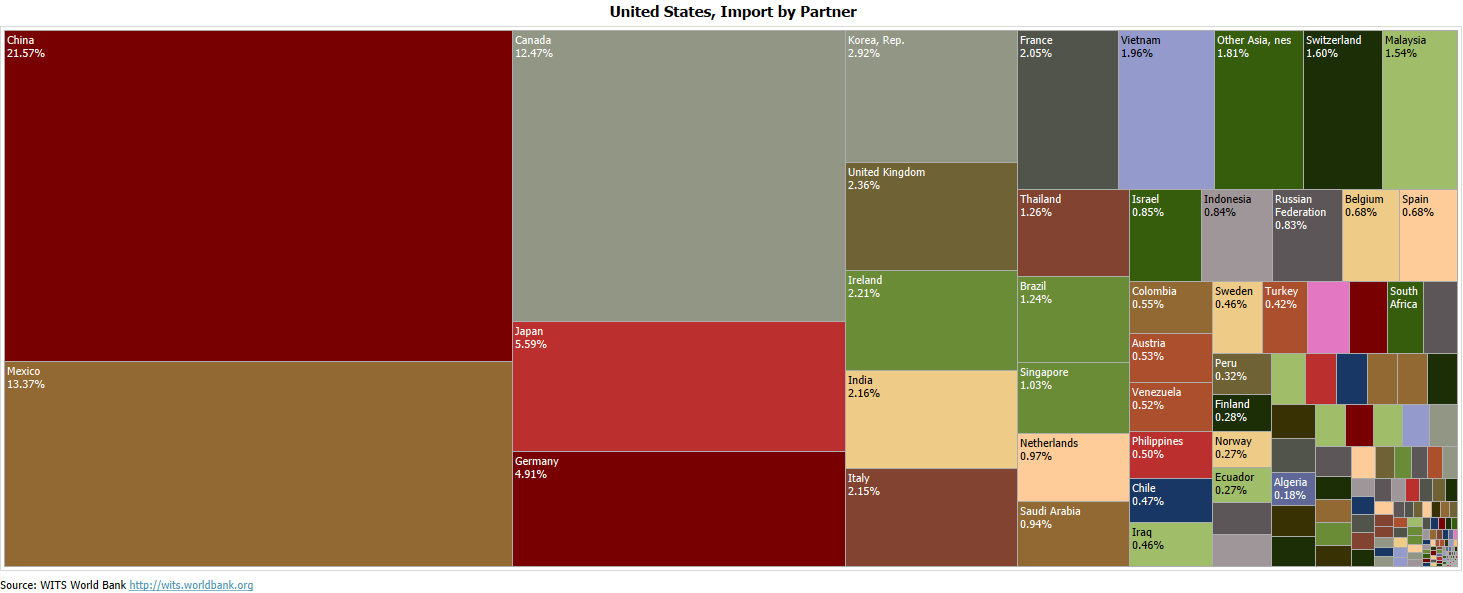
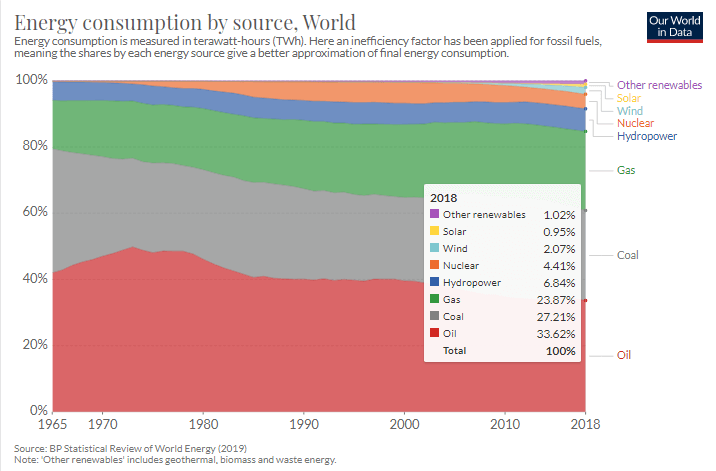
For the United States, the Industrial Sector now contributes less than 20% to the overall GDP, while more than 80% comes from the Service sector itself. Although it may sound like only 20%, it is only in comparison, but individually the industrial sector is in itself huge and employs millions of people. 15-20% is still a significant contribution, and that is the reason why it is still being published as well as analyzed by investors, traders, analysts frequently to infer significant economic conclusions.

With machine automation, the advancement of technologies, and the introduction of artificial intelligence, many traditional jobs in the industrial sector are getting replaced. This trend is likely to continue further down the line. As of now, the Industrial Production figures bear some relevance, though it is only a matter of time that its contribution further falls and is overlooked by investors and analysts.

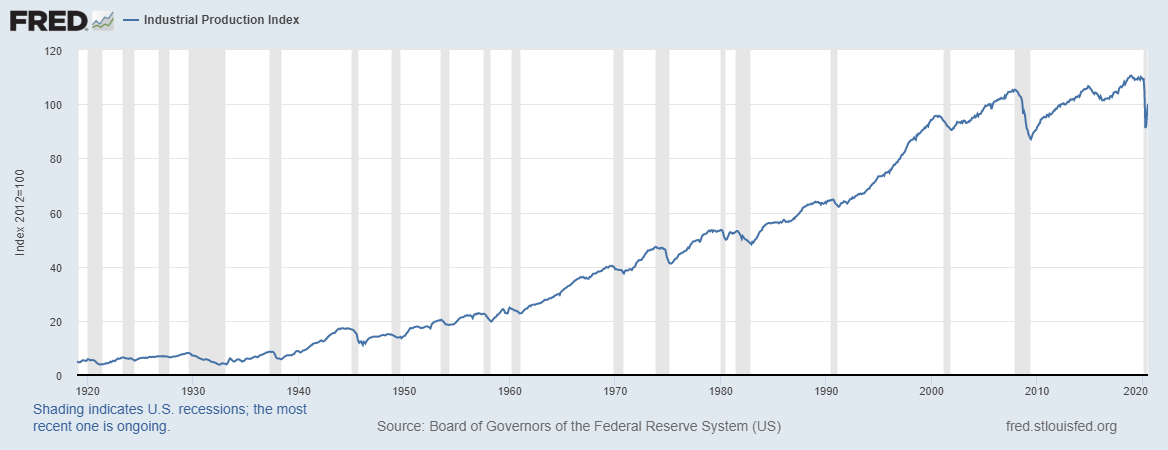
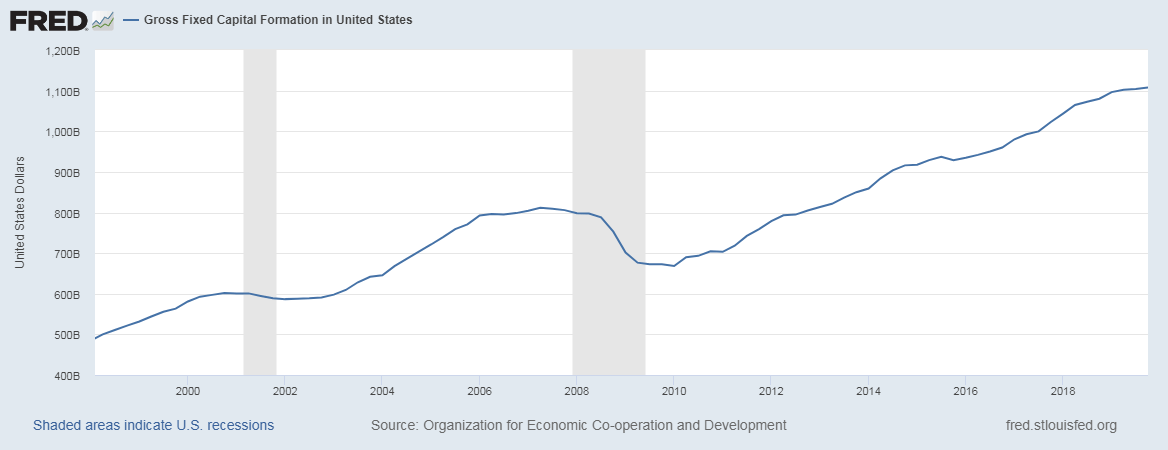
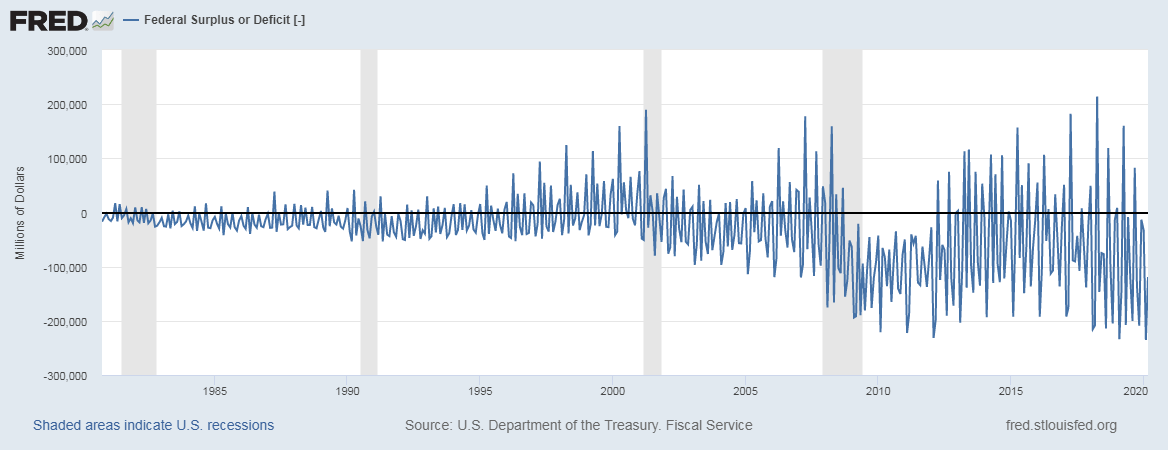
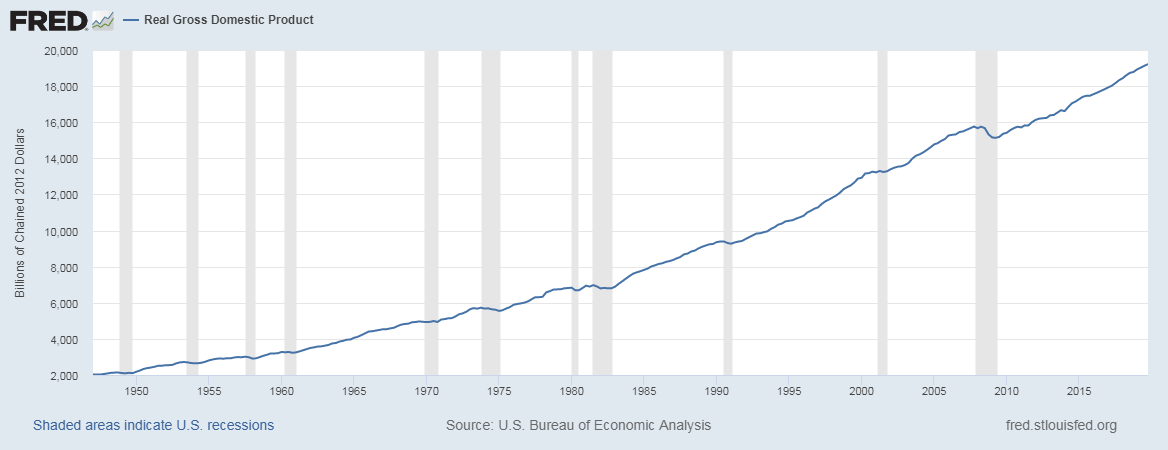
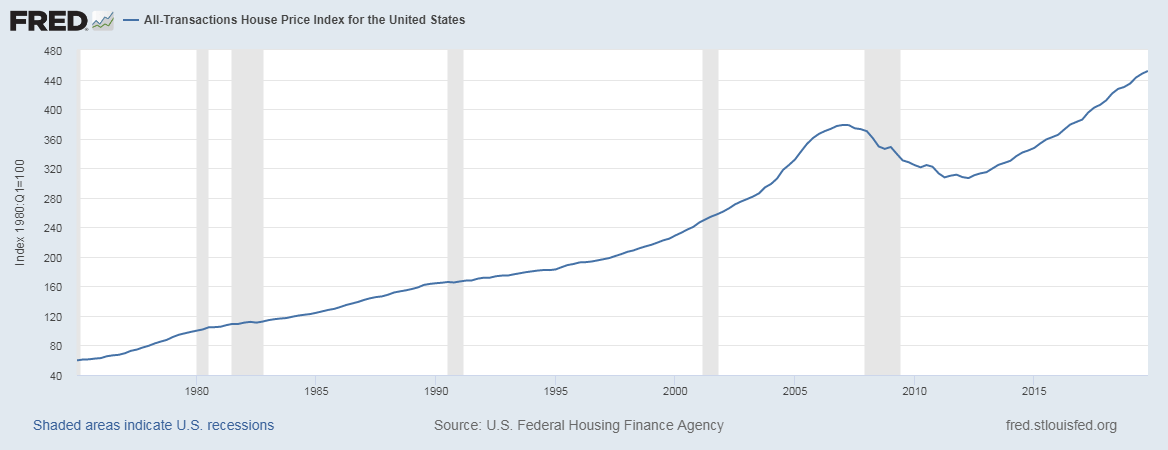
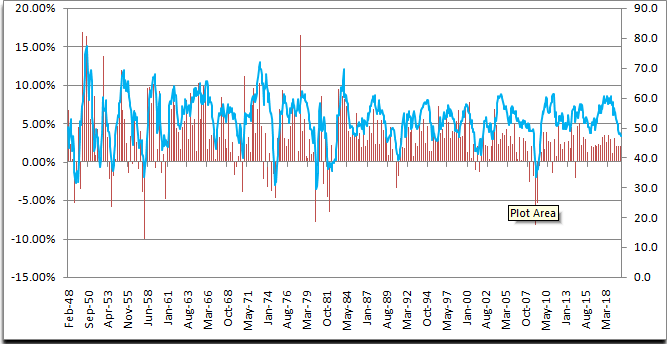
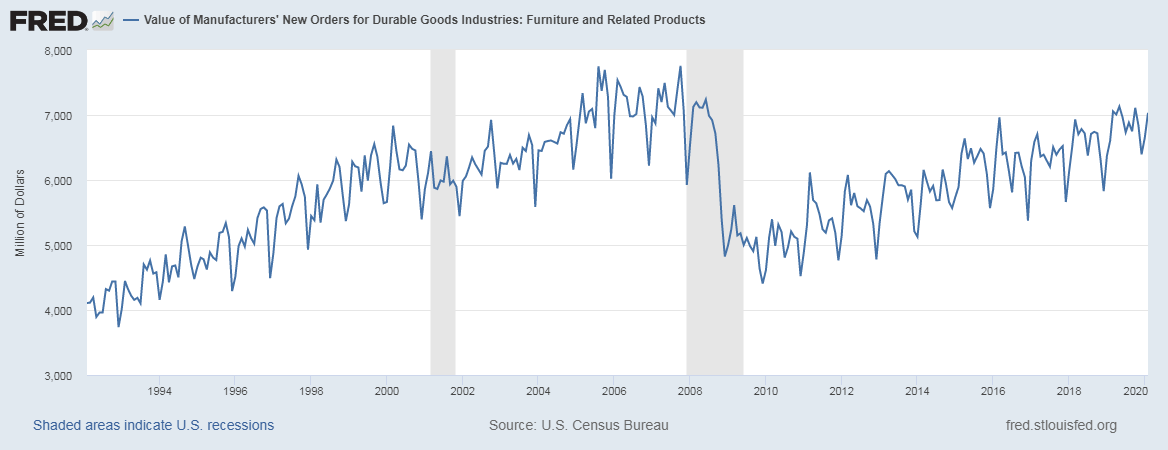
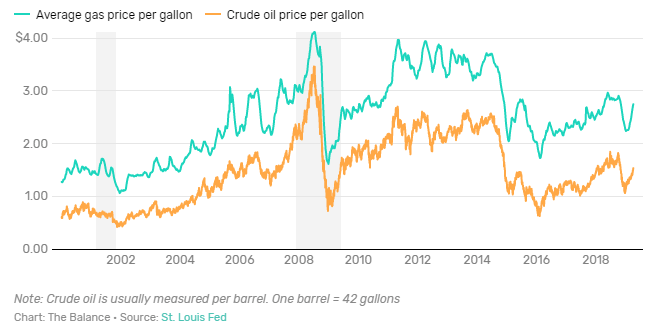
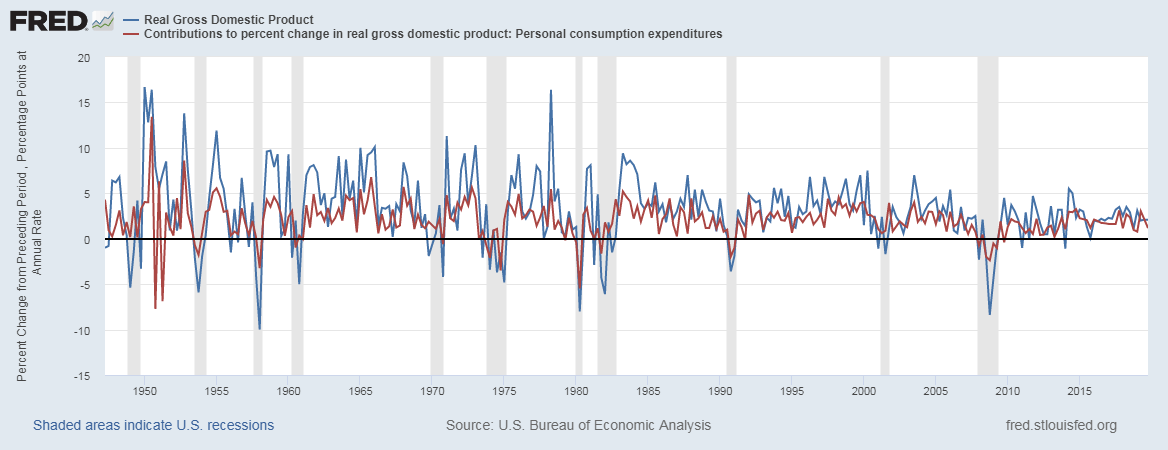
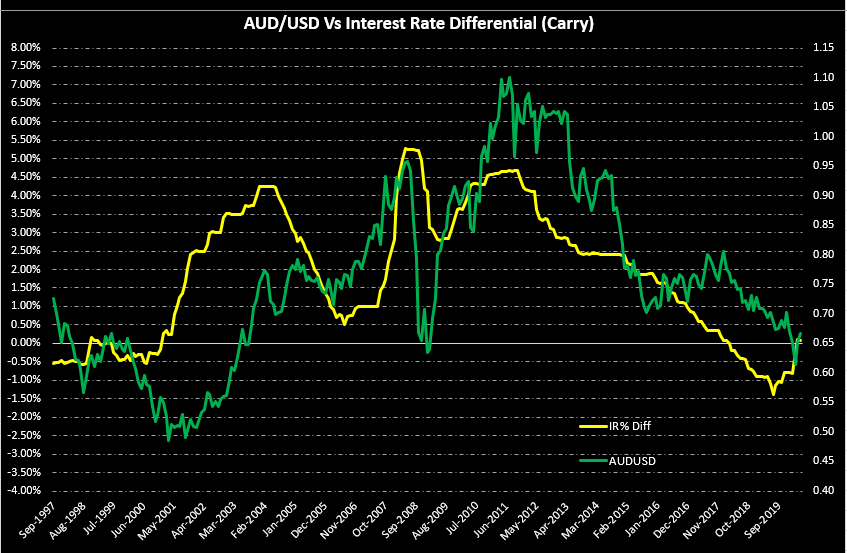
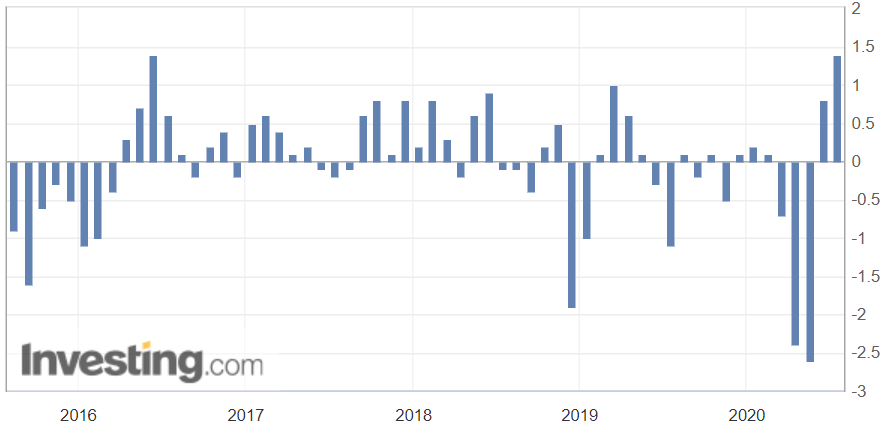
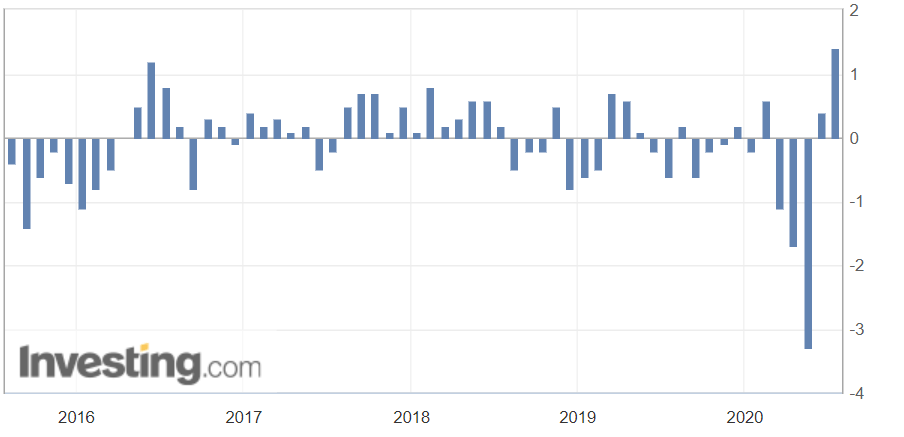
(Image Credit: St. Louis FRED)

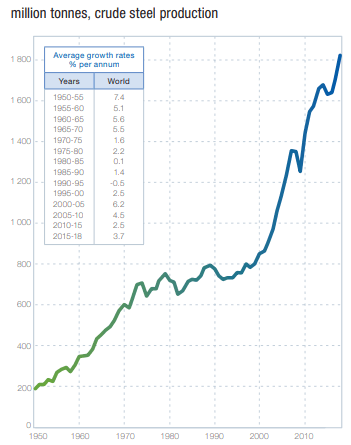
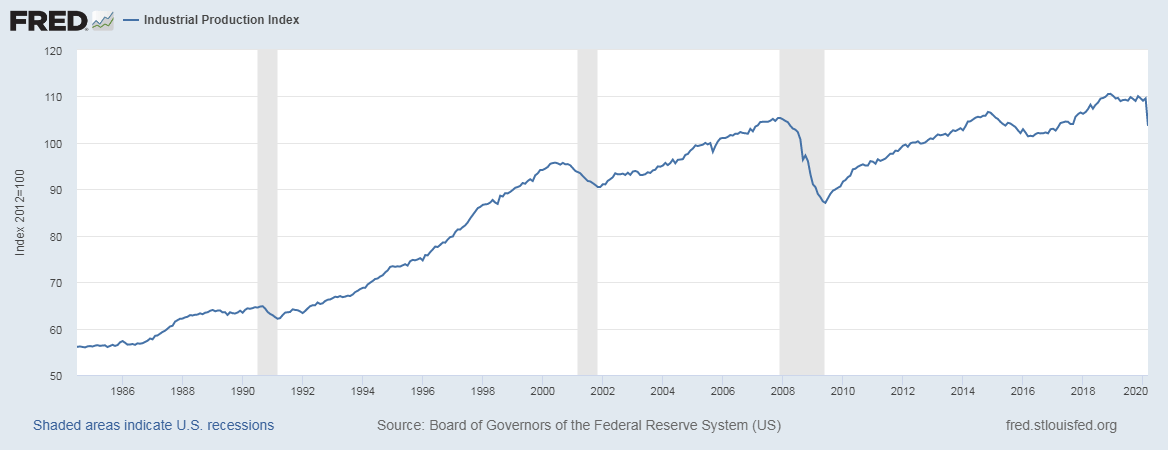
The industrial sector is more sensitive to business cycles as well as economic shocks, as evident from the historical plot. The current COVID-19 pandemic has had a more significant impact on the industrial sector than the service sector due to the nature of business.

Impact on Currency

Since the Industrial Production figures only account for a few sectors of the economy, hence it is not a macroeconomic indicator encompassing all industries into its statistics. For this reason, the relative significance of this indicator in the currency markets is less. Whereas, investors looking to invest in stocks of companies belonging to the Industrial sector use Industrial Production MoM figures to make investment decisions. Overall, it is a low-impact coincident indicator that bears no significant volatility in the currency markets but has a significant influence on the equity markets.

Economic Reports

The Board of Governors of the Federal Reserve System publishes reports of the Industrial Production statistics as part of its monthly “G.17 Industrial Production and Capacity Utilization” report on its official website. It is released around the 15th of the month for the previous month. It is a preliminary estimate and is annotated with a superscript ‘p’ in the tables. It is subject to revision in the subsequent five months as more data becomes available. The report details both seasonally adjusted and unadjusted versions for our convenience.

Sources of Industrial Production MoM

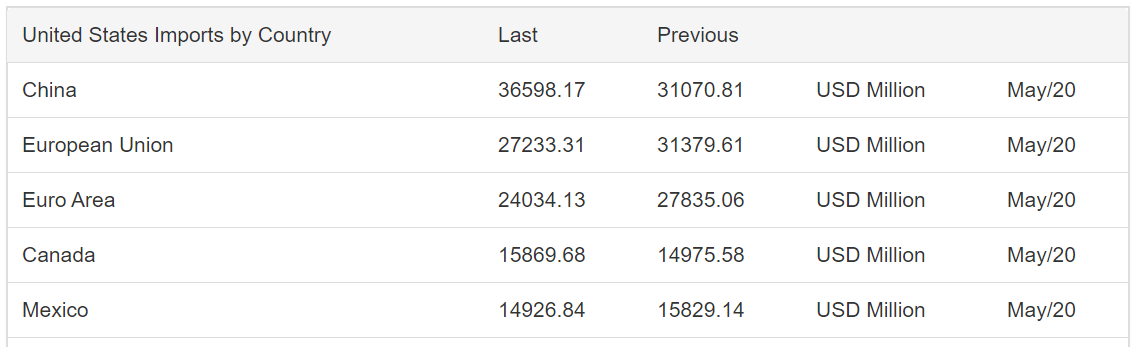
The Federal Reserve publishes Industrial Production MoM reports on its official website. The same statistics are available with more tools for analysis on the St. Louis FRED website. Similar Industrial Production MoM statistics for most countries is available on the Trading Economics website.

How the Monthly Industrial Production Data Release Affects The Price Charts

In the US, the monthly industrial production data is released by the Federal Reserve about 16 days after the month ends. It measures the change in the total inflation-adjusted value of output produced by manufacturers, mines, and utilities. The most recent data was released on August 14, 2020, at 9.15 AM ET and can be accessed at Investing.com here. An in-depth review of the industrial production data release can be accessed at the Federal Reserve website.

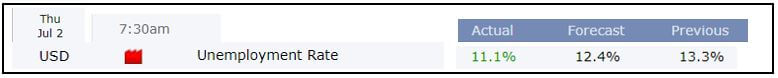
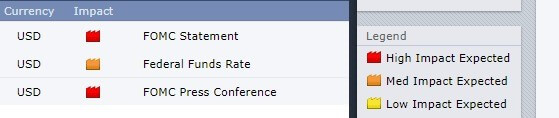
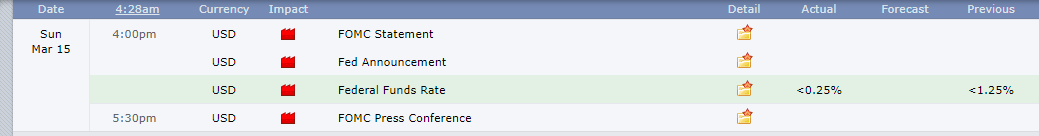
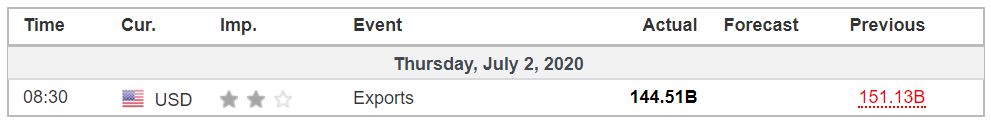
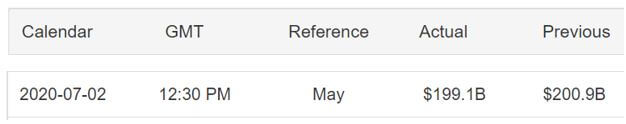
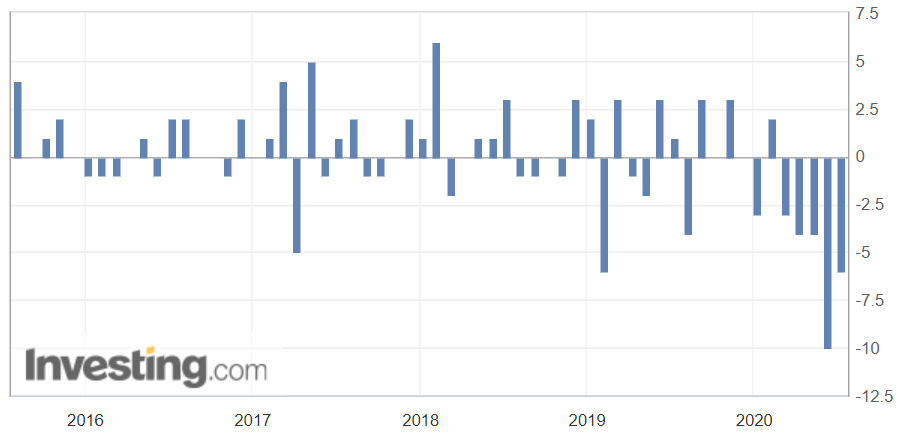
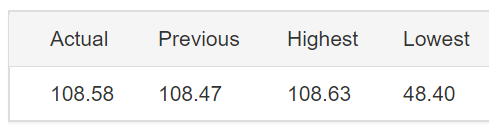
The screengrab below is of the monthly industrial production from Investing.com.

As can be seen, the industrial production data is expected to have a low impact on the USD upon its release.

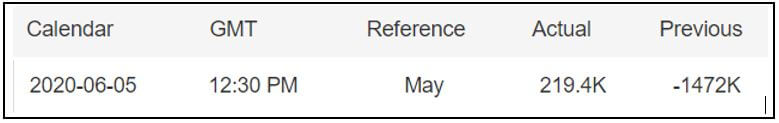
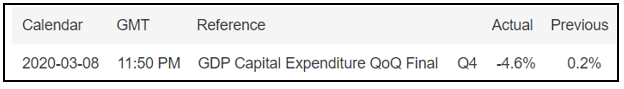
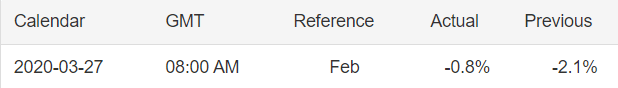
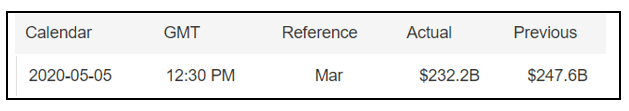
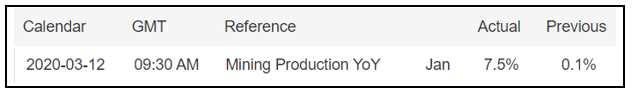
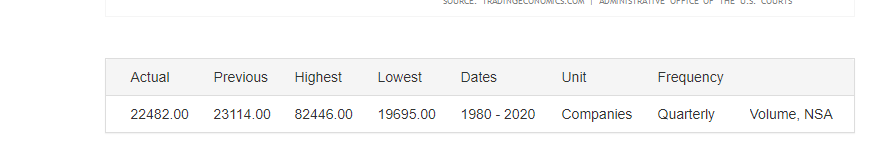
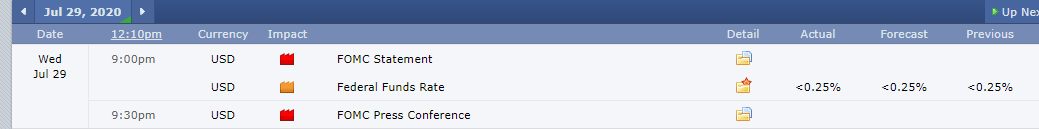
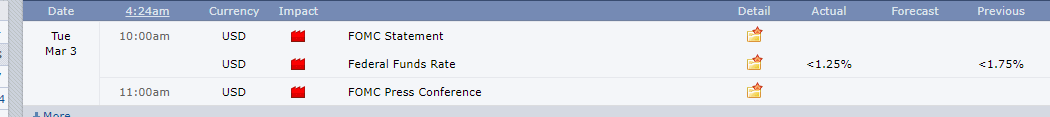
The screenshot below represents the most recent changes in the monthly industrial production in the US. In July 2020, the US industrial production increased by 3% down from a 5.7% increase in June. This change was in line with analysts’ expectations of a 3% change. Therefore, this is expected to be positive for the USD.

Now, let’s see how this release made an impact on the Forex price charts.

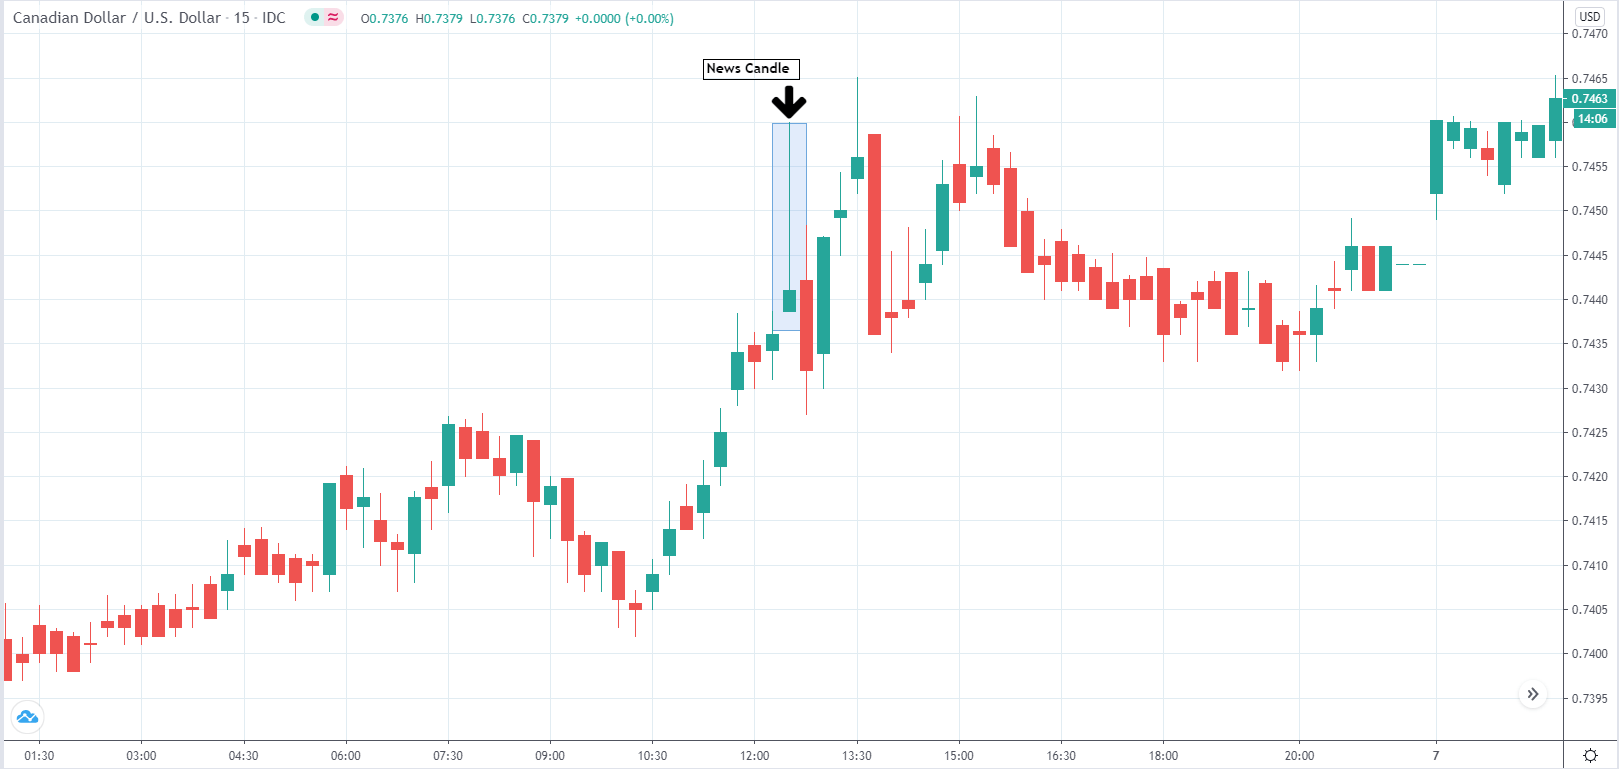
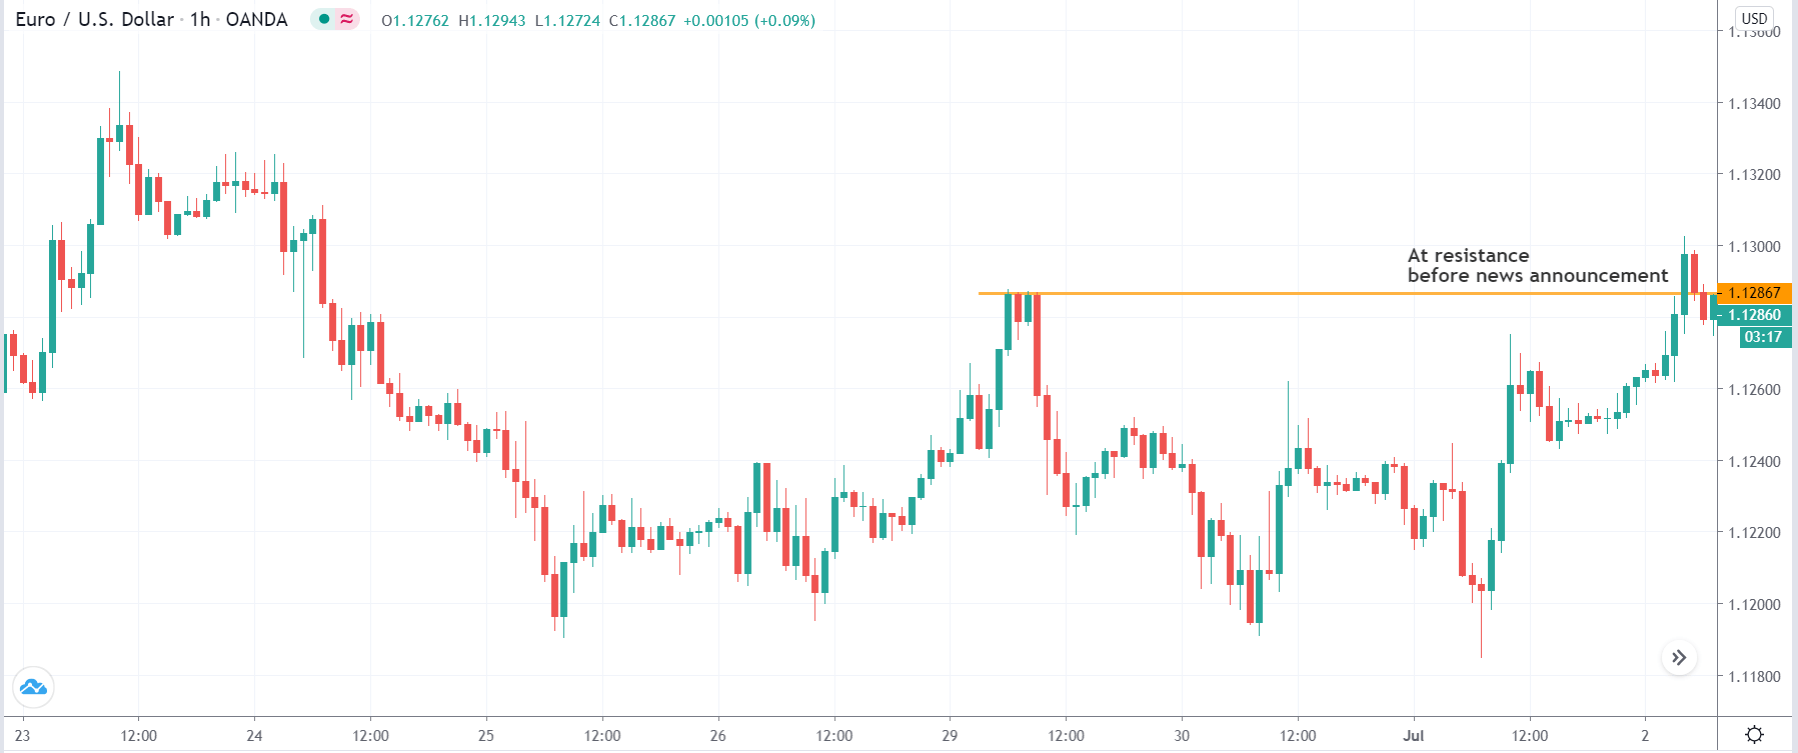
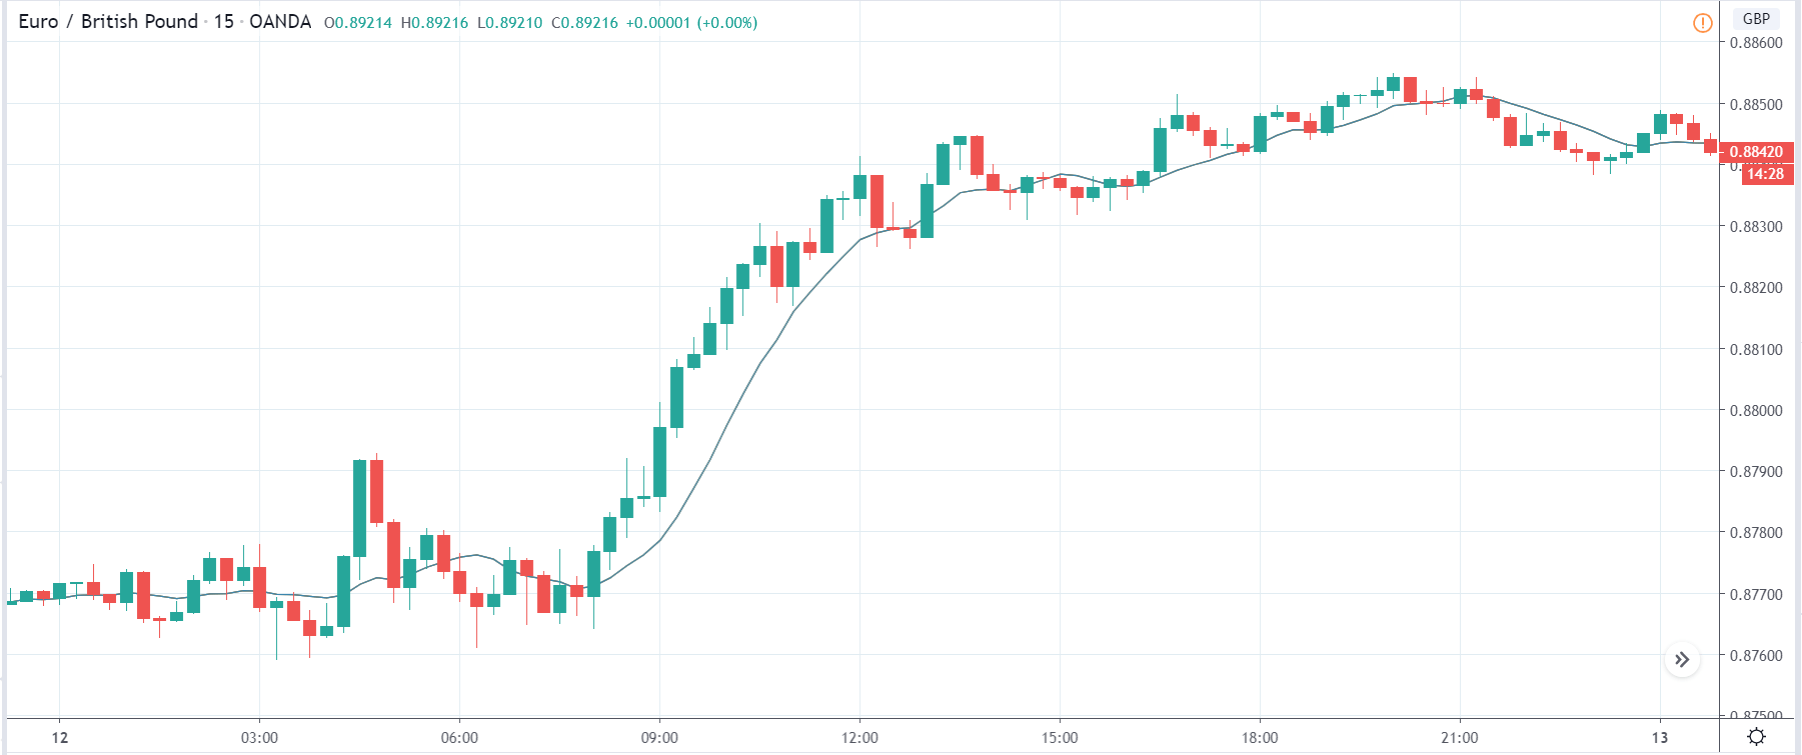
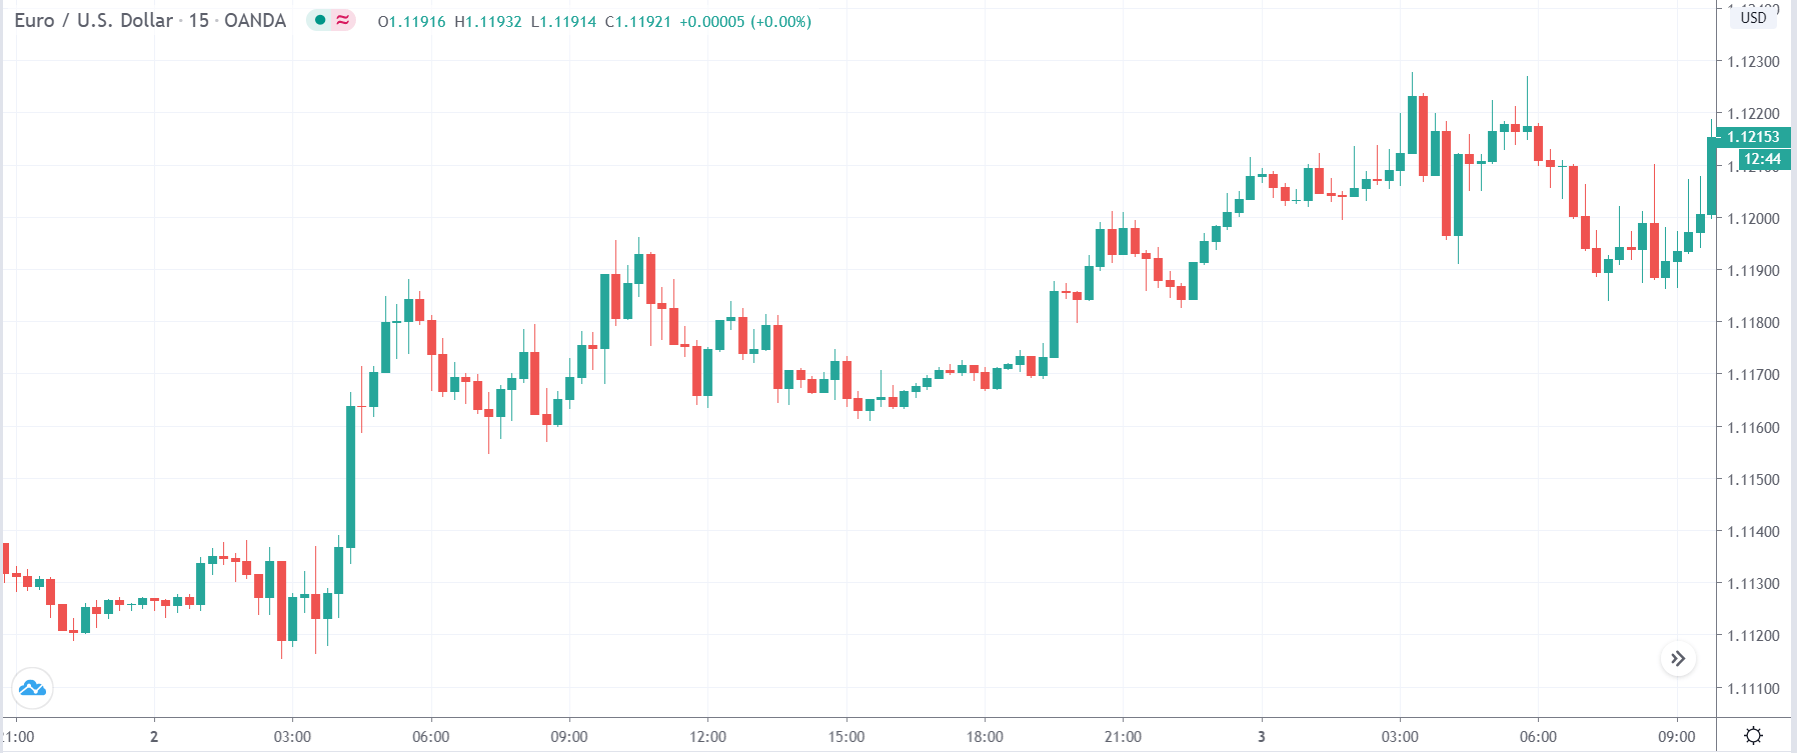
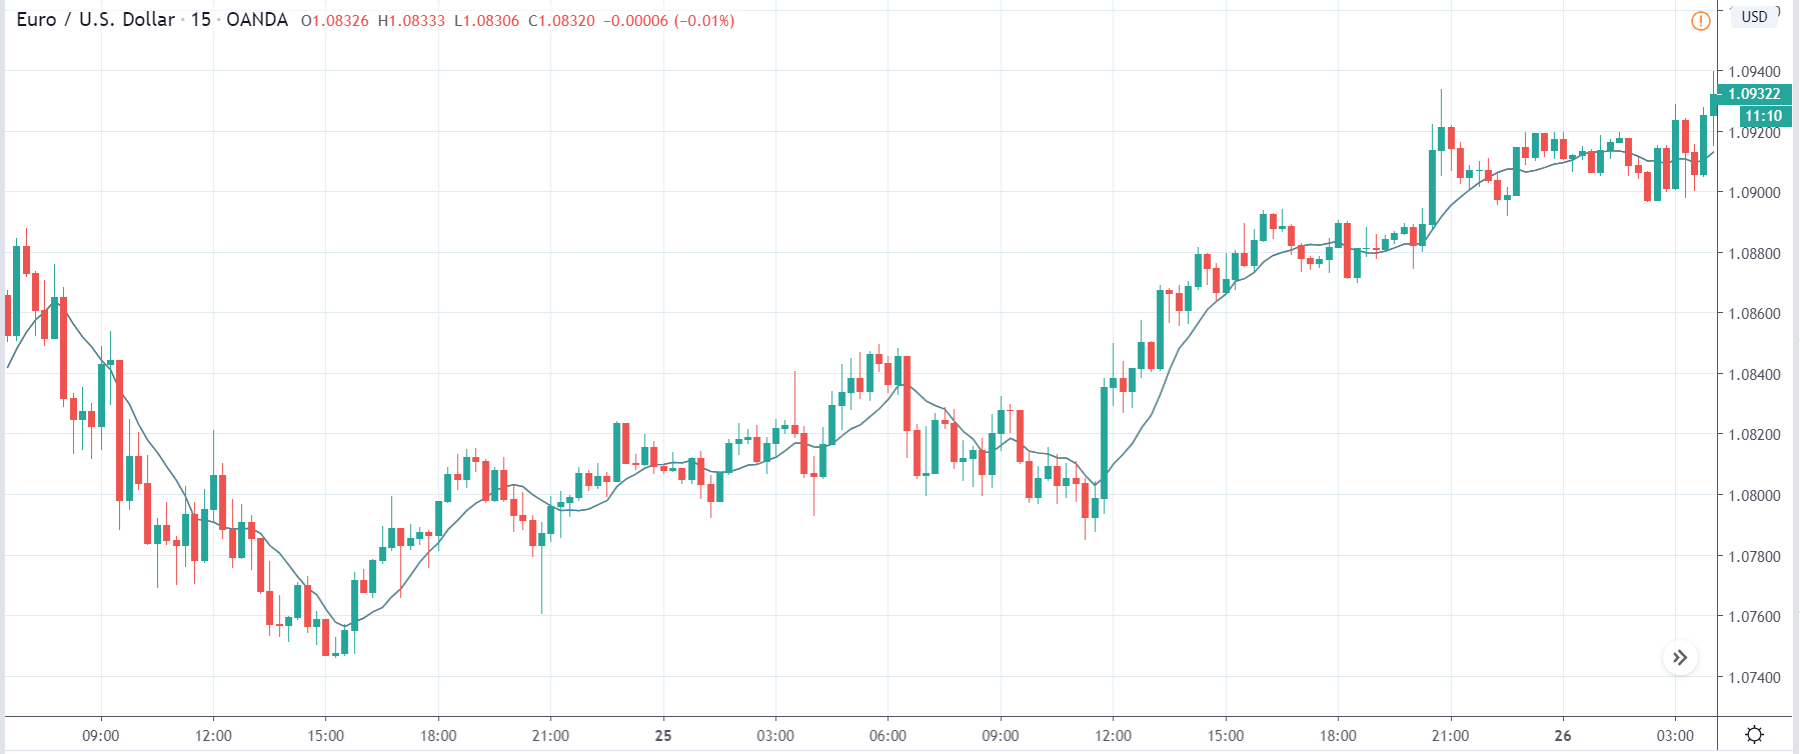
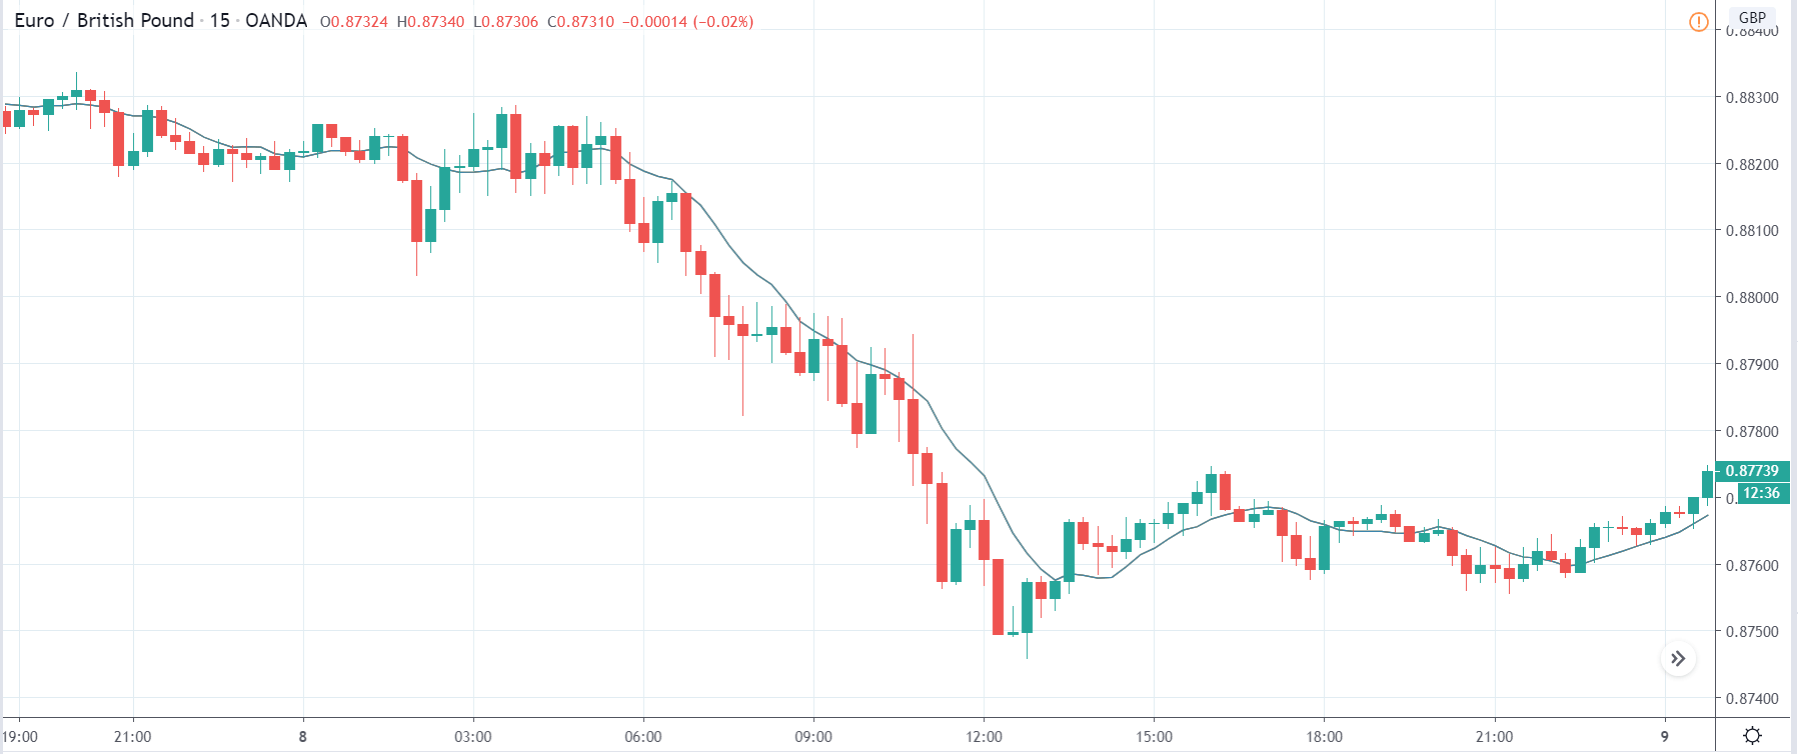
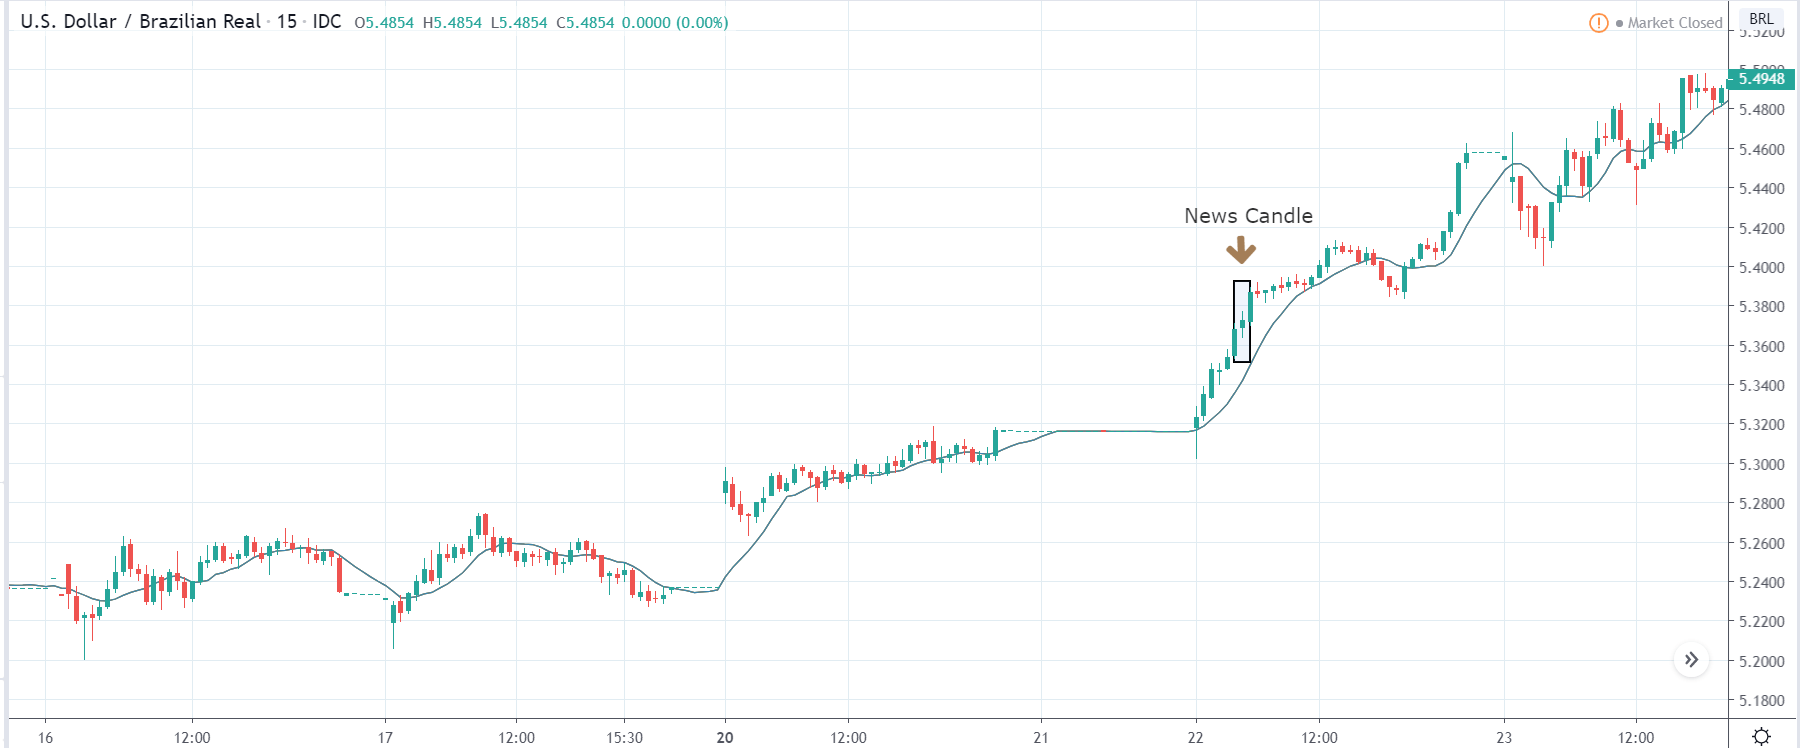
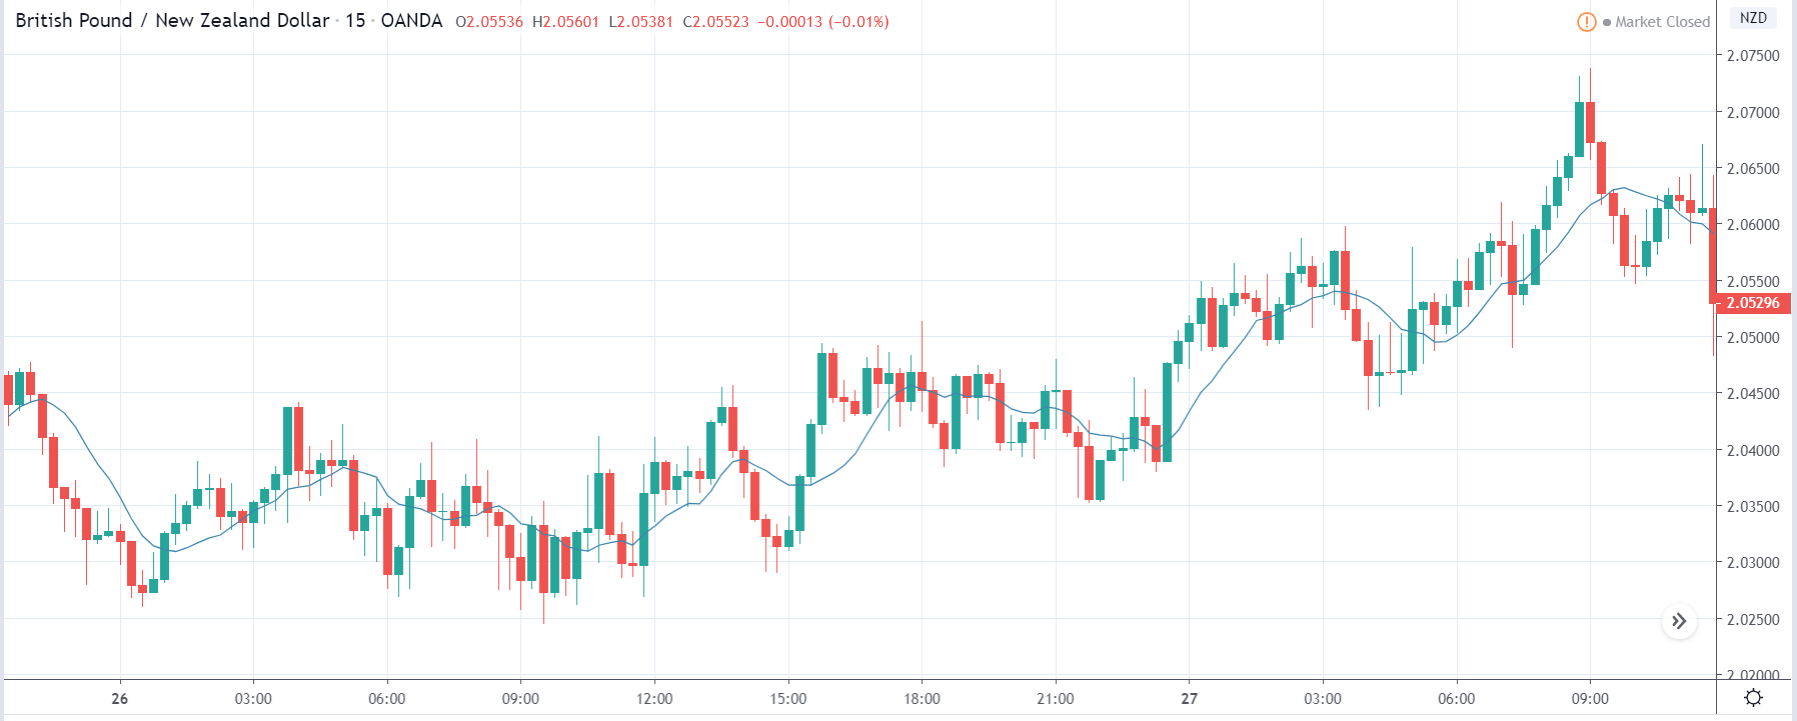
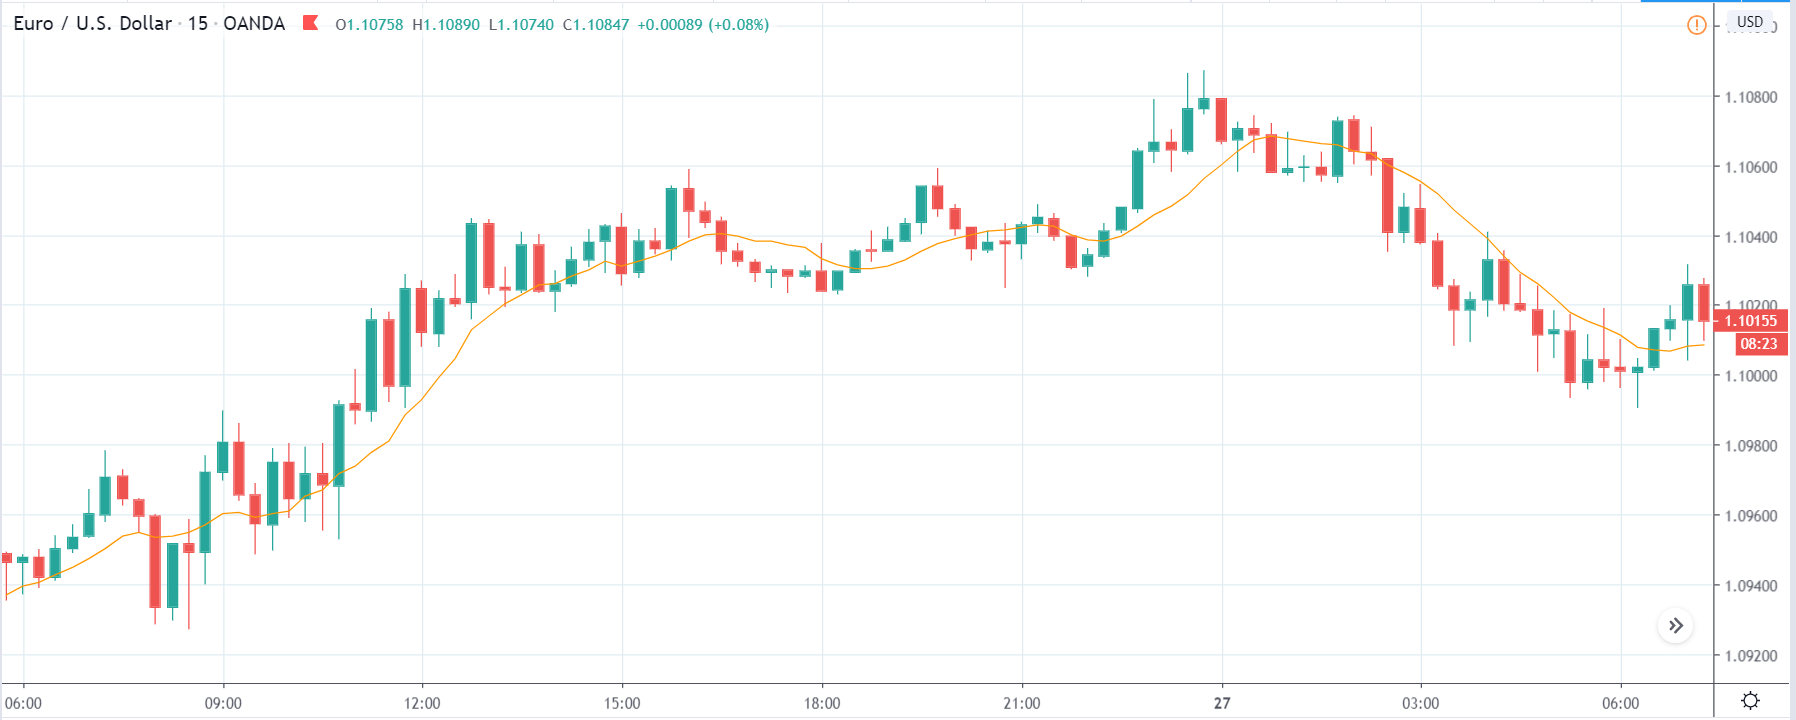
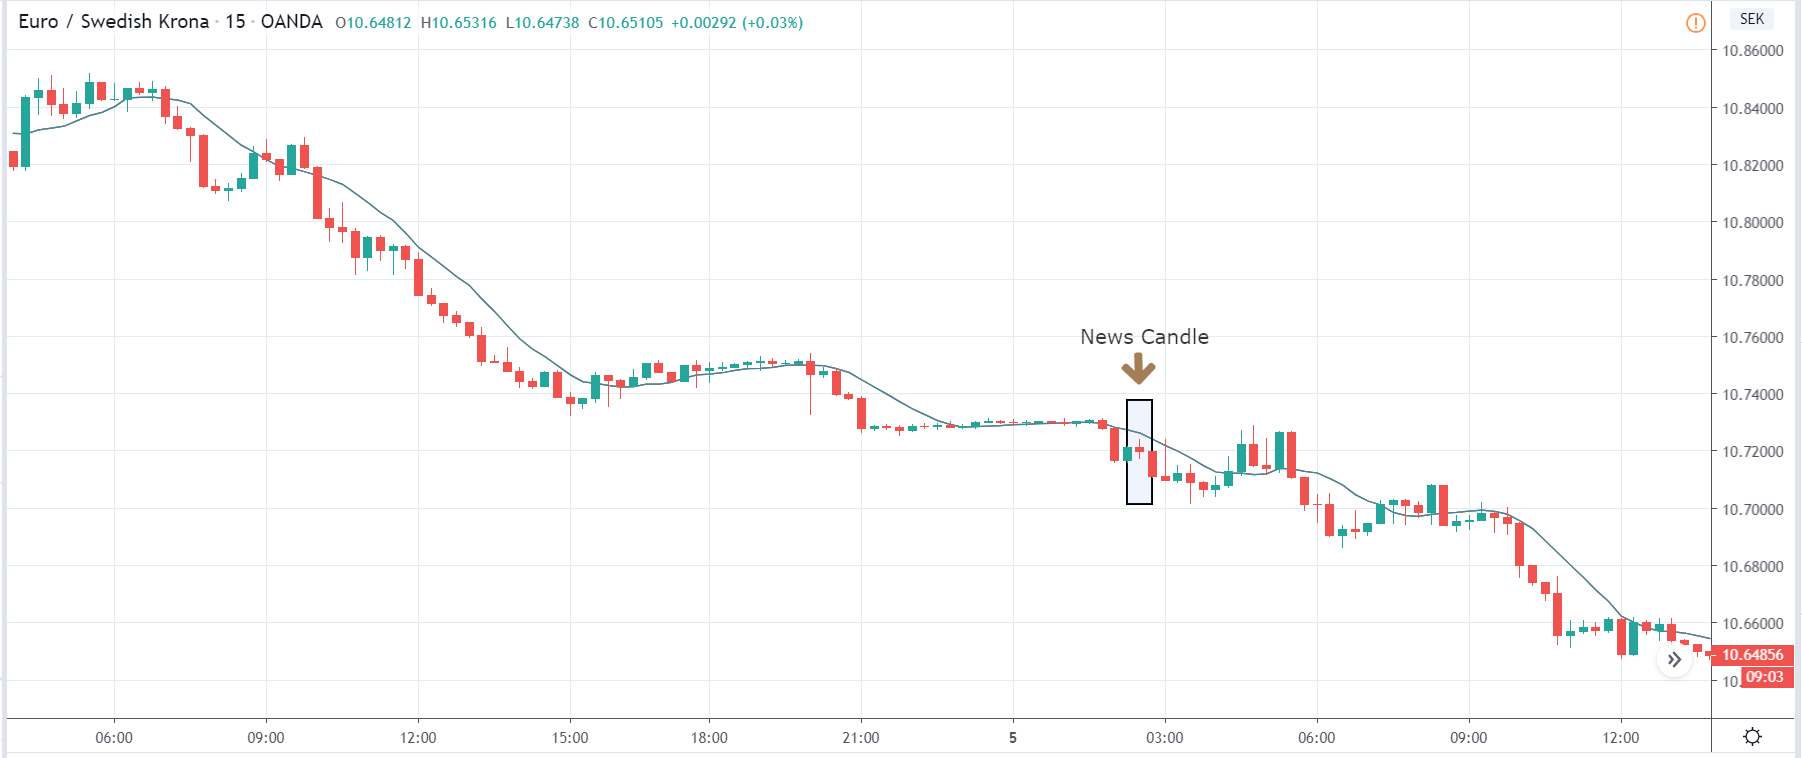
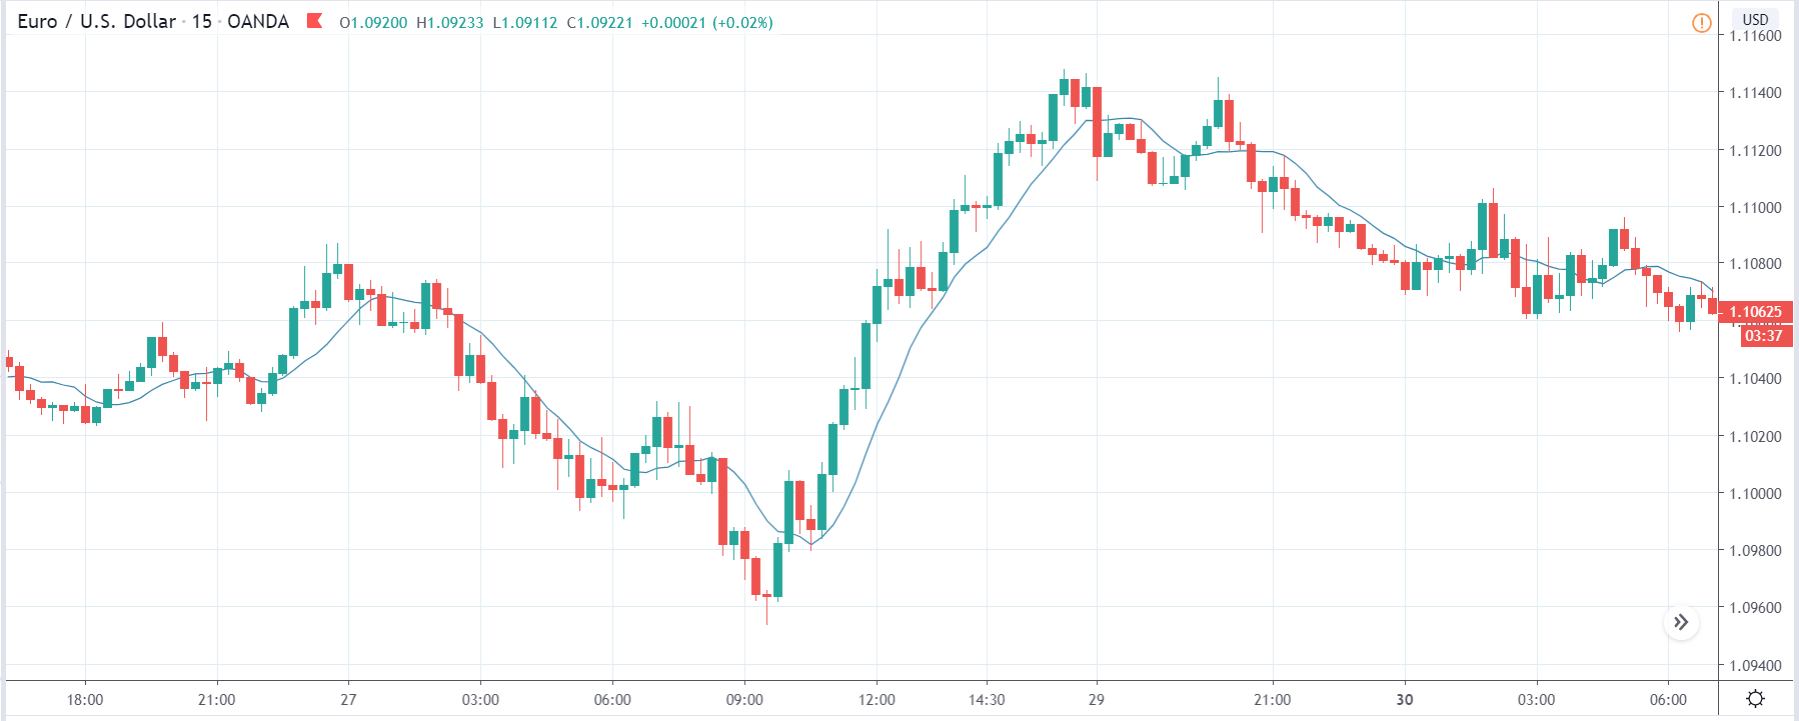
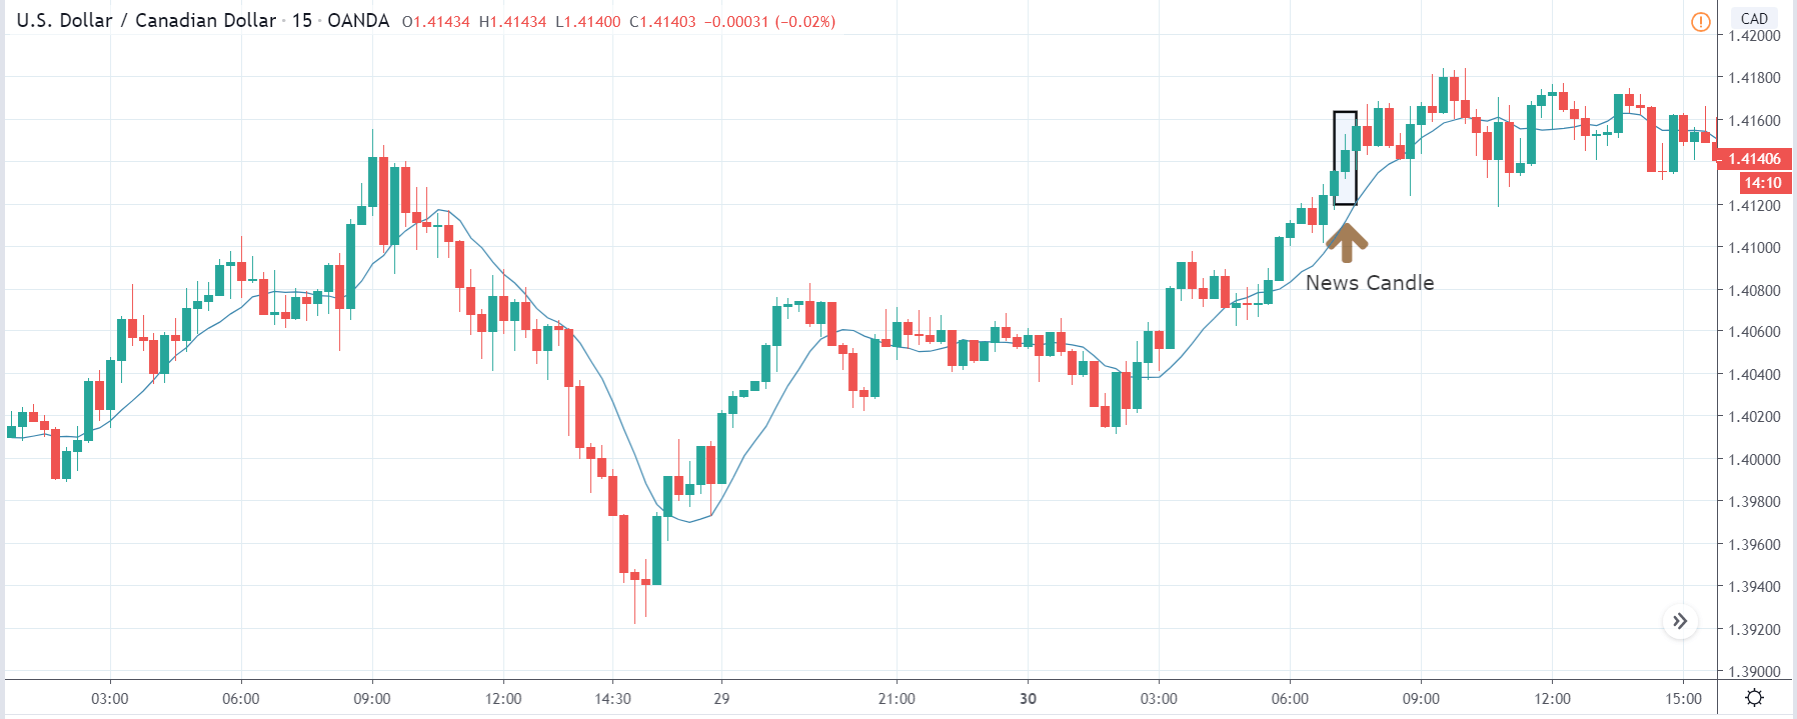
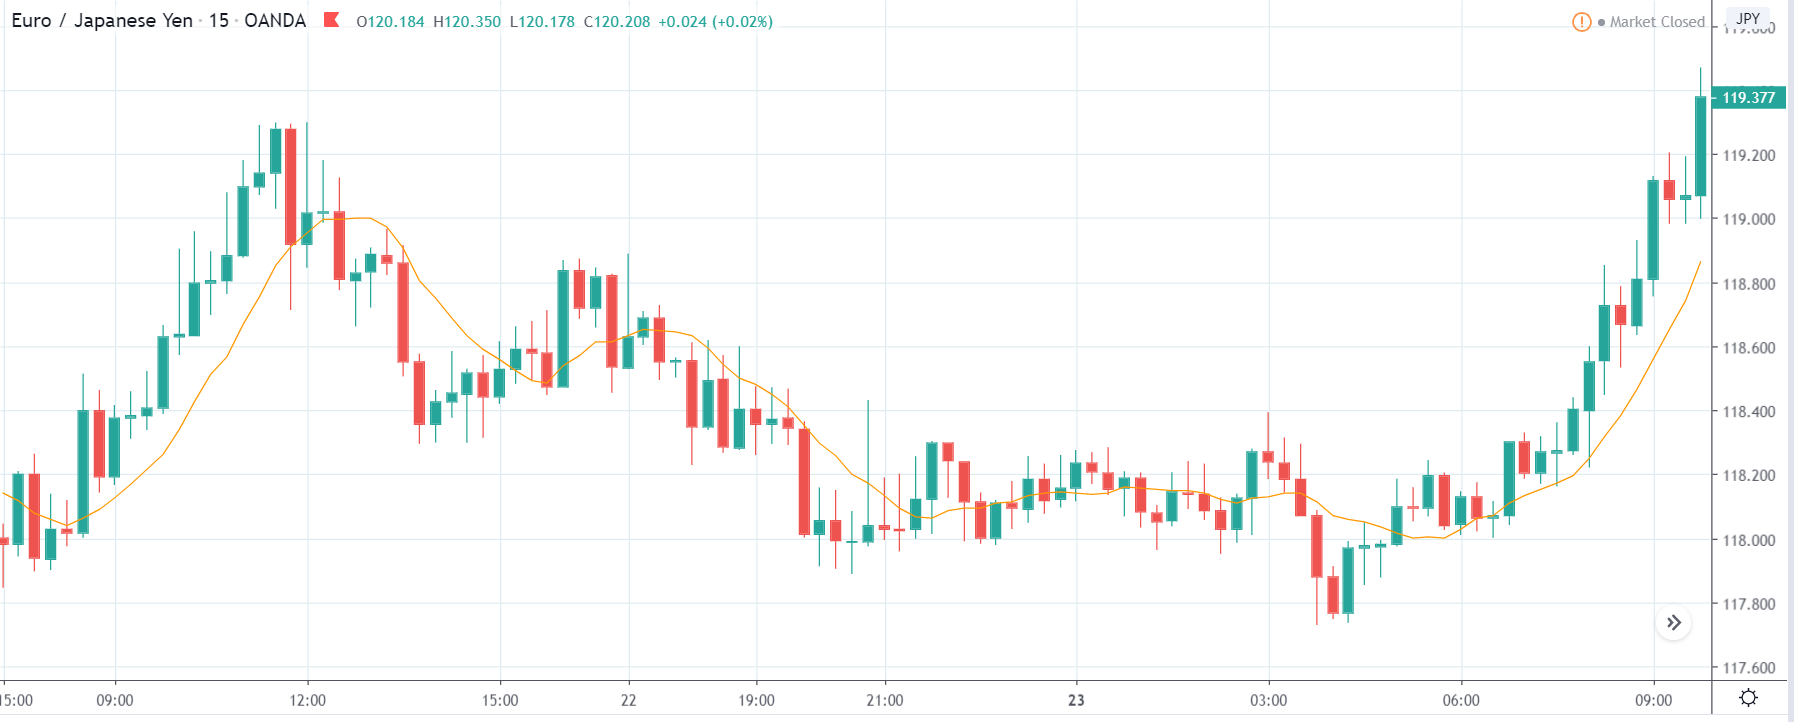
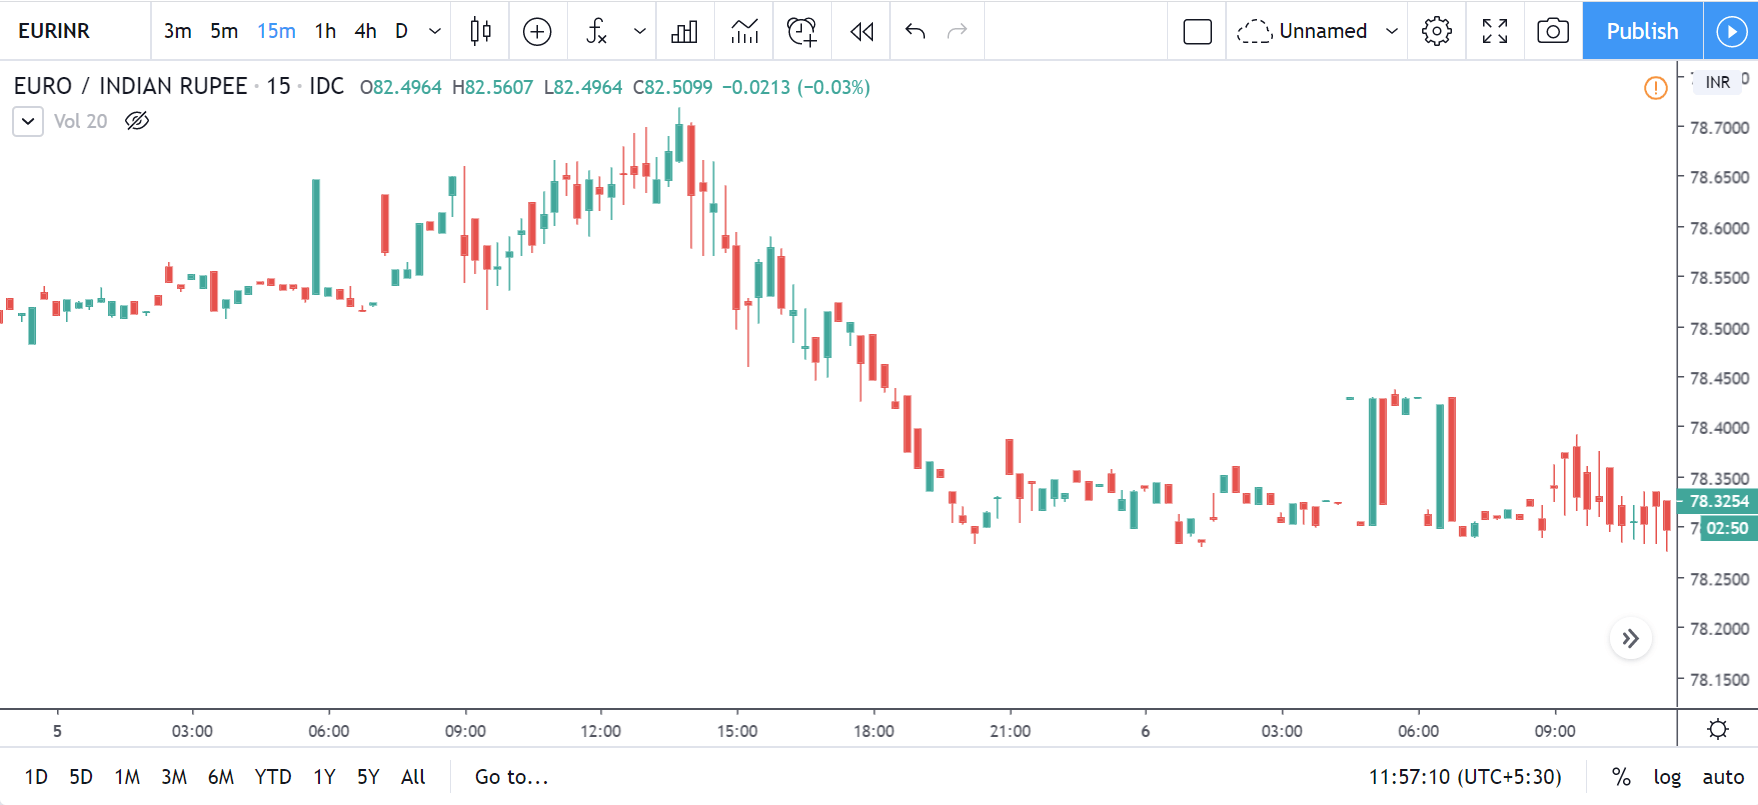
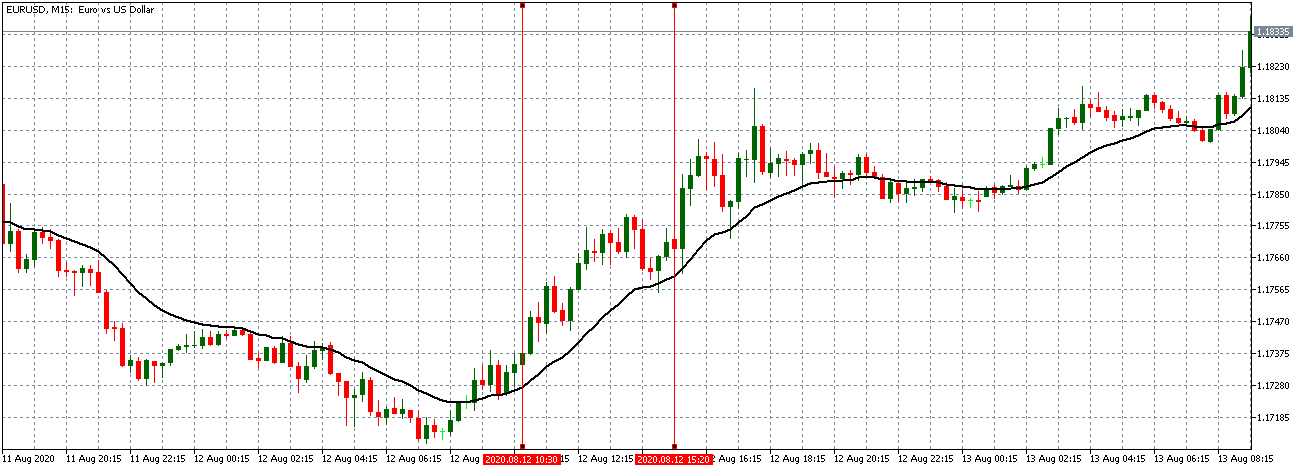
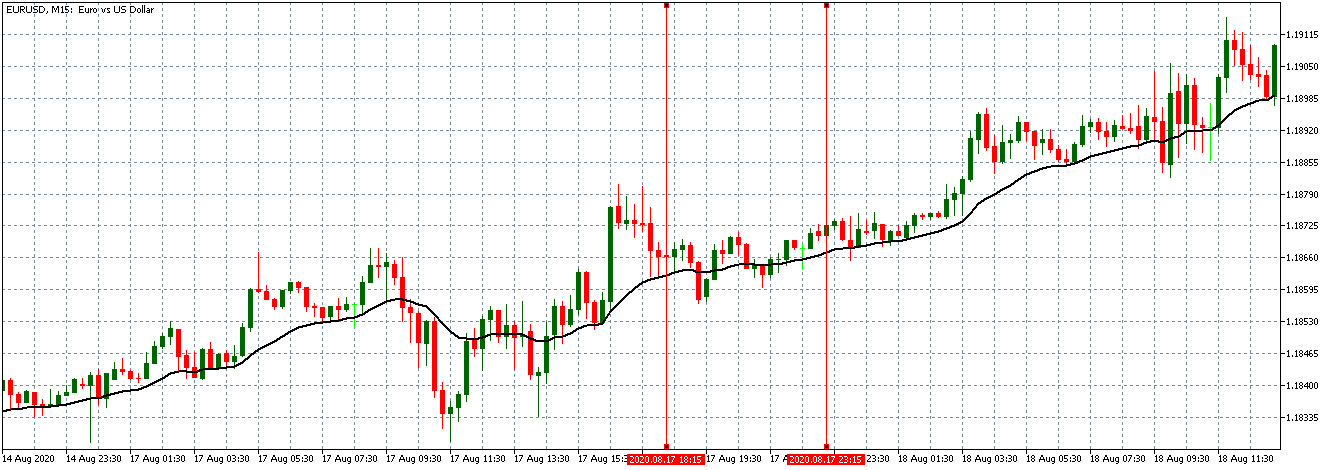
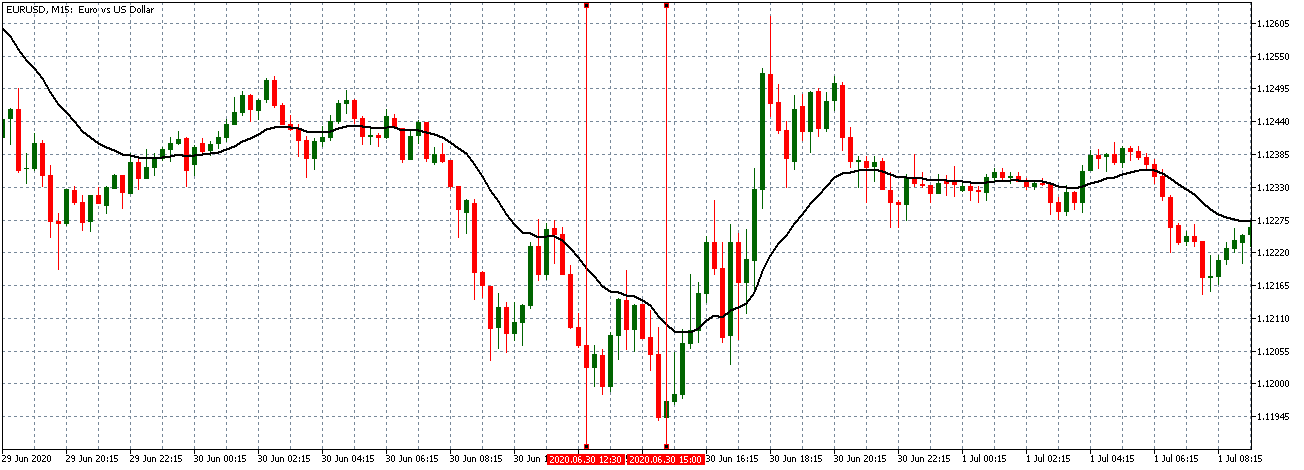
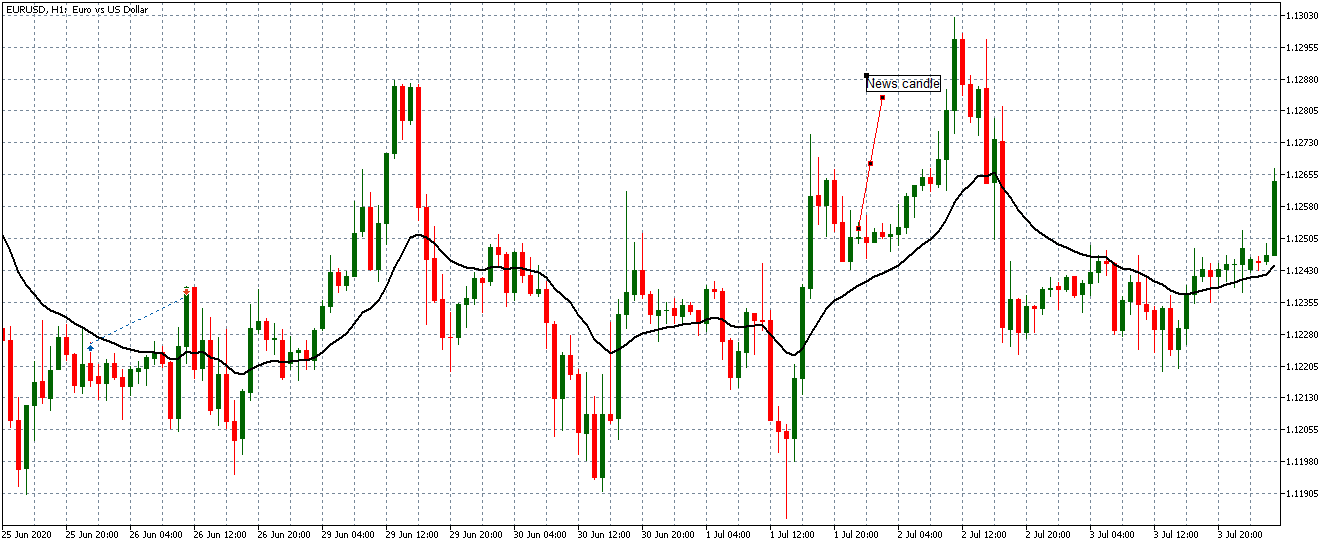
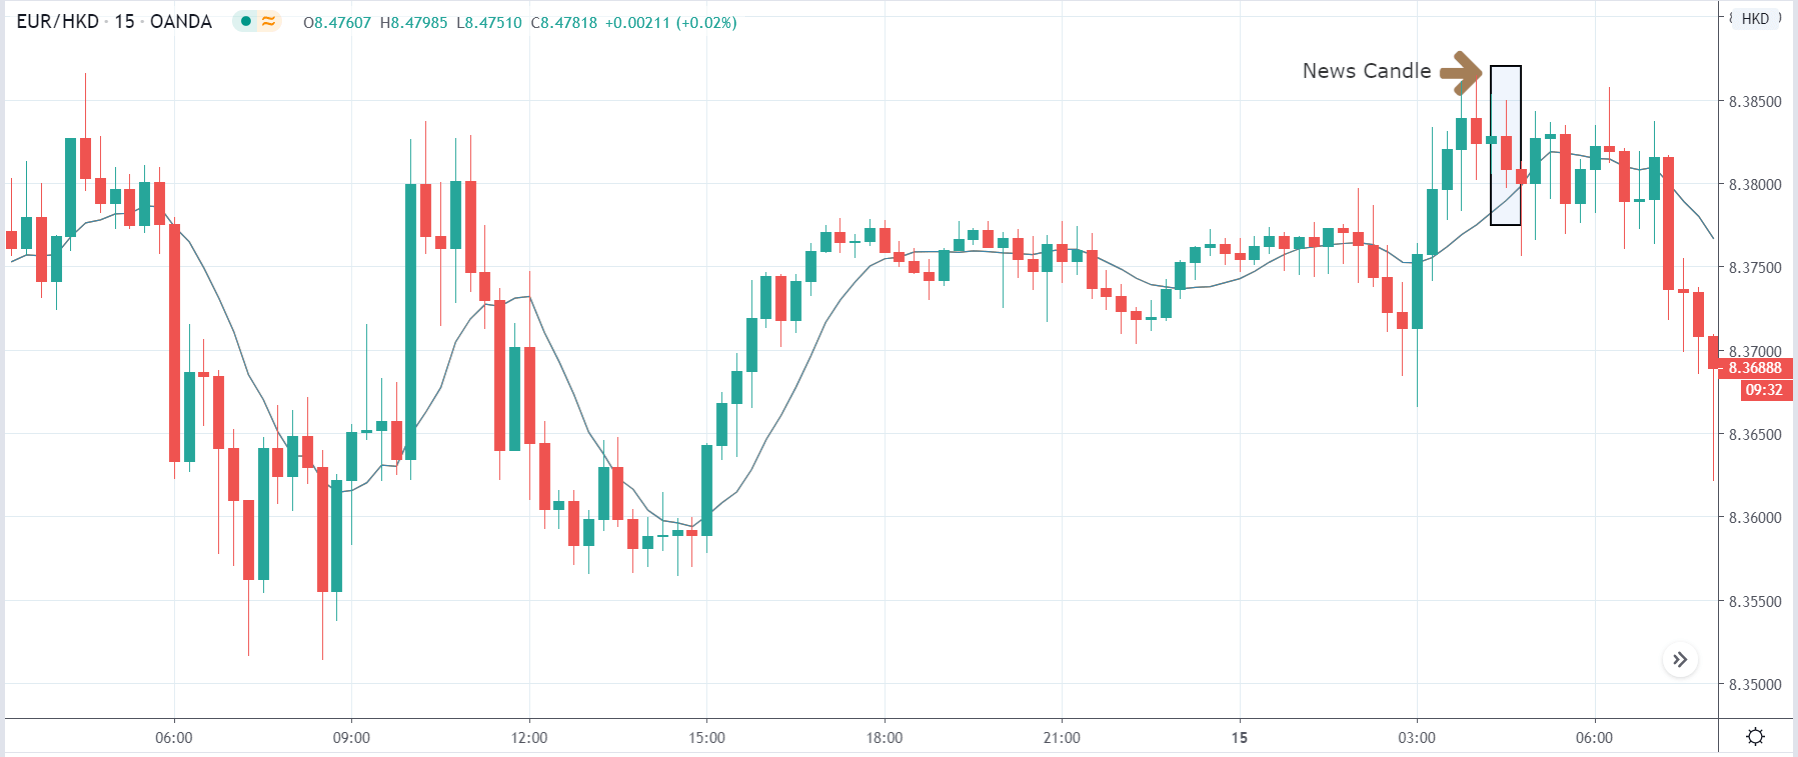
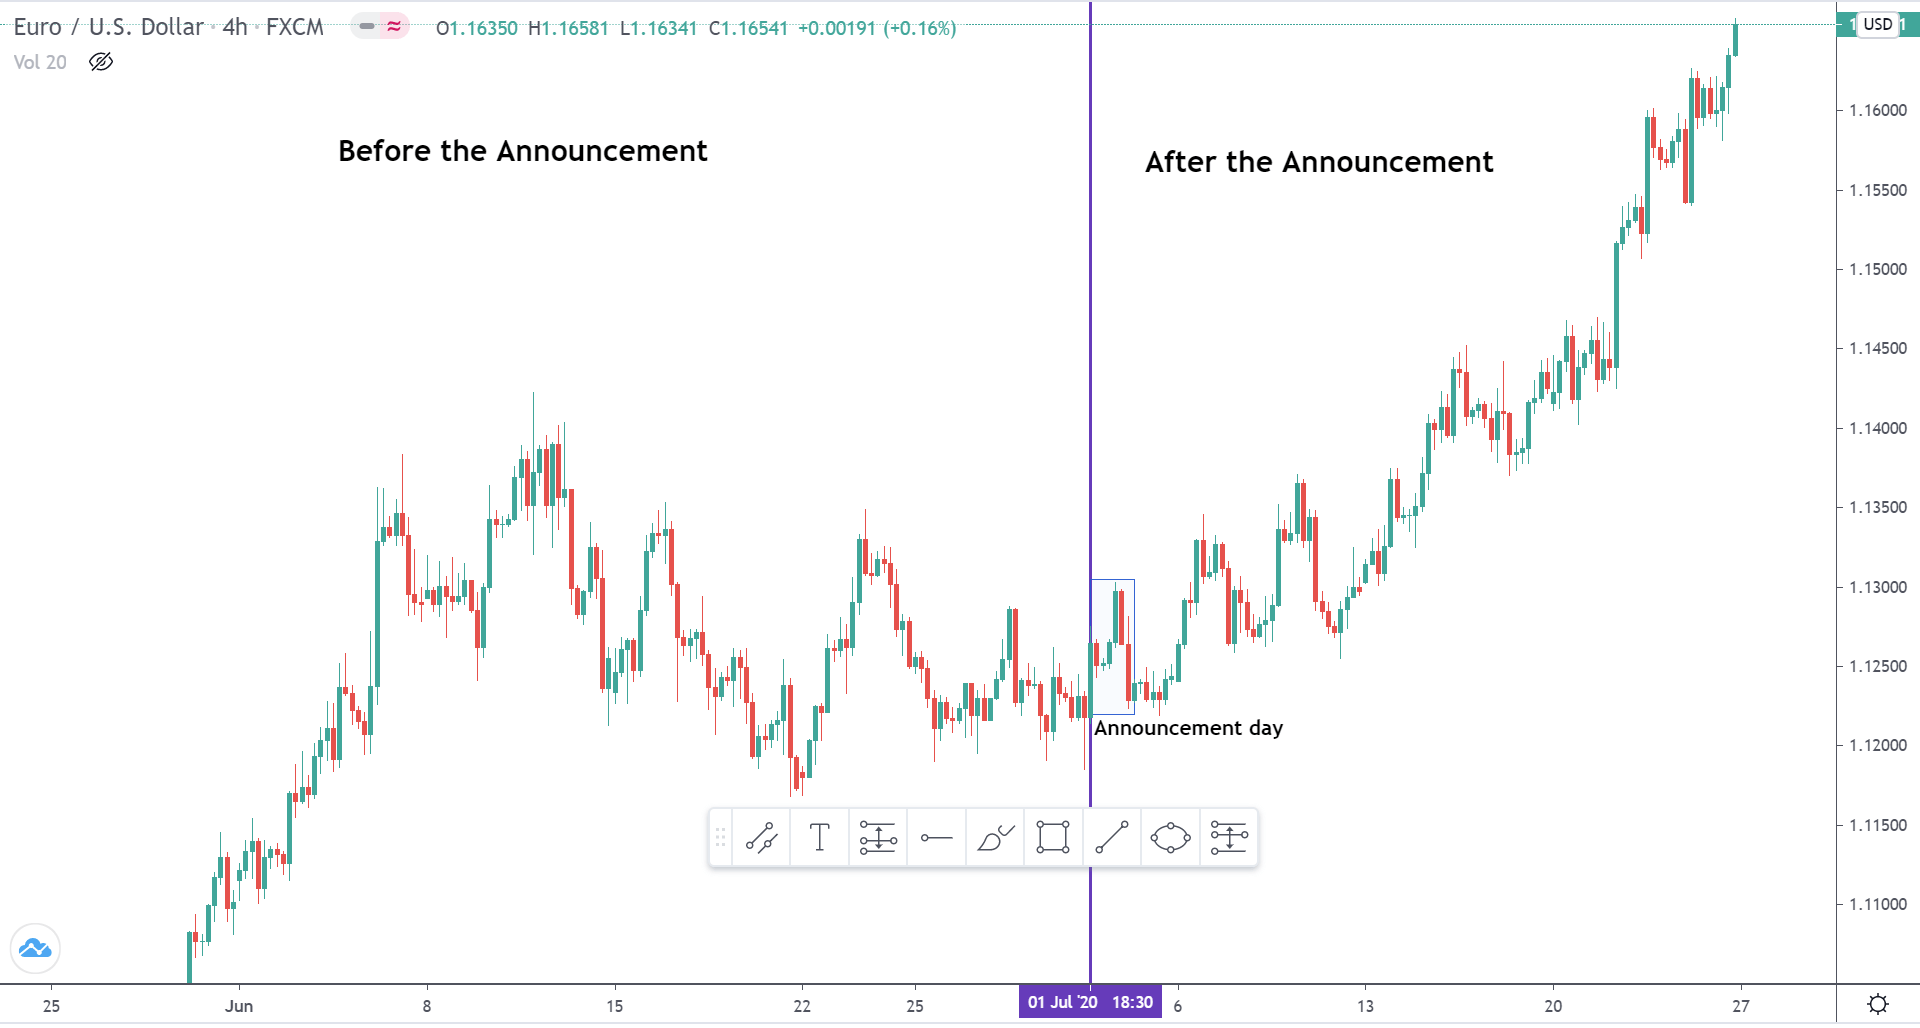
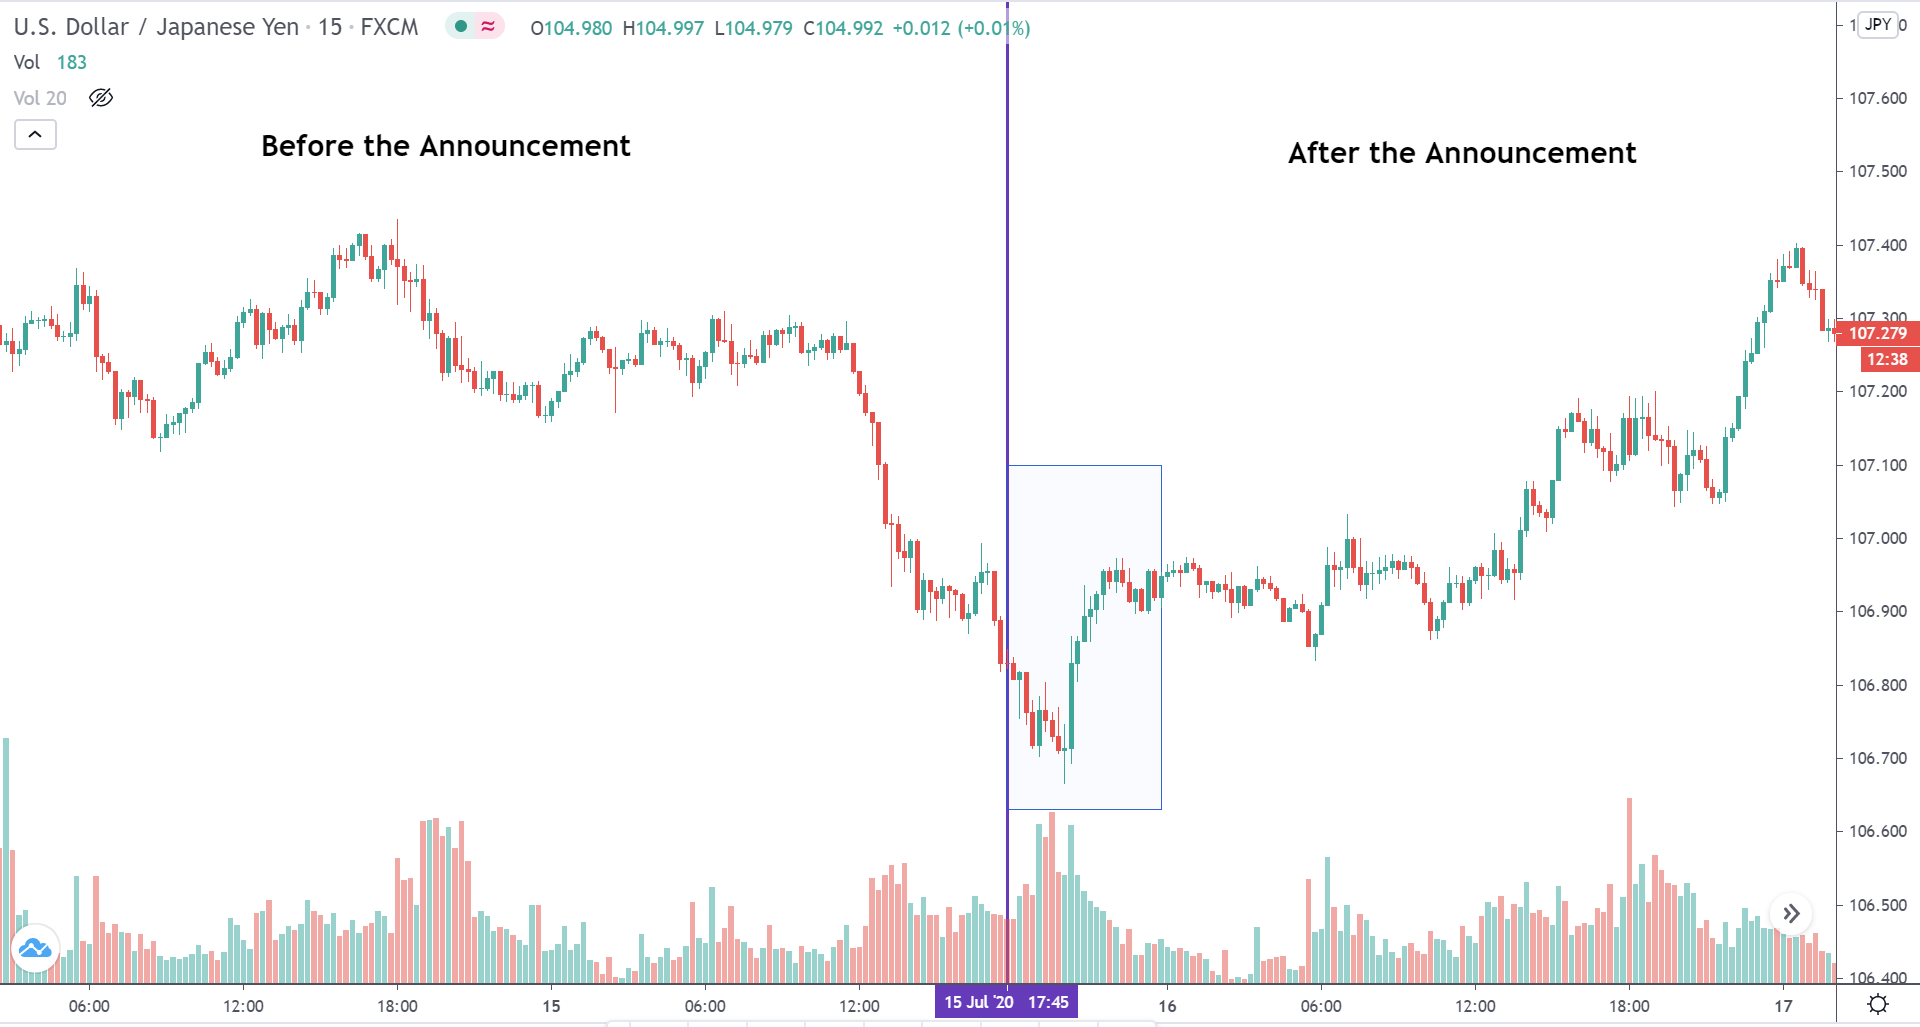
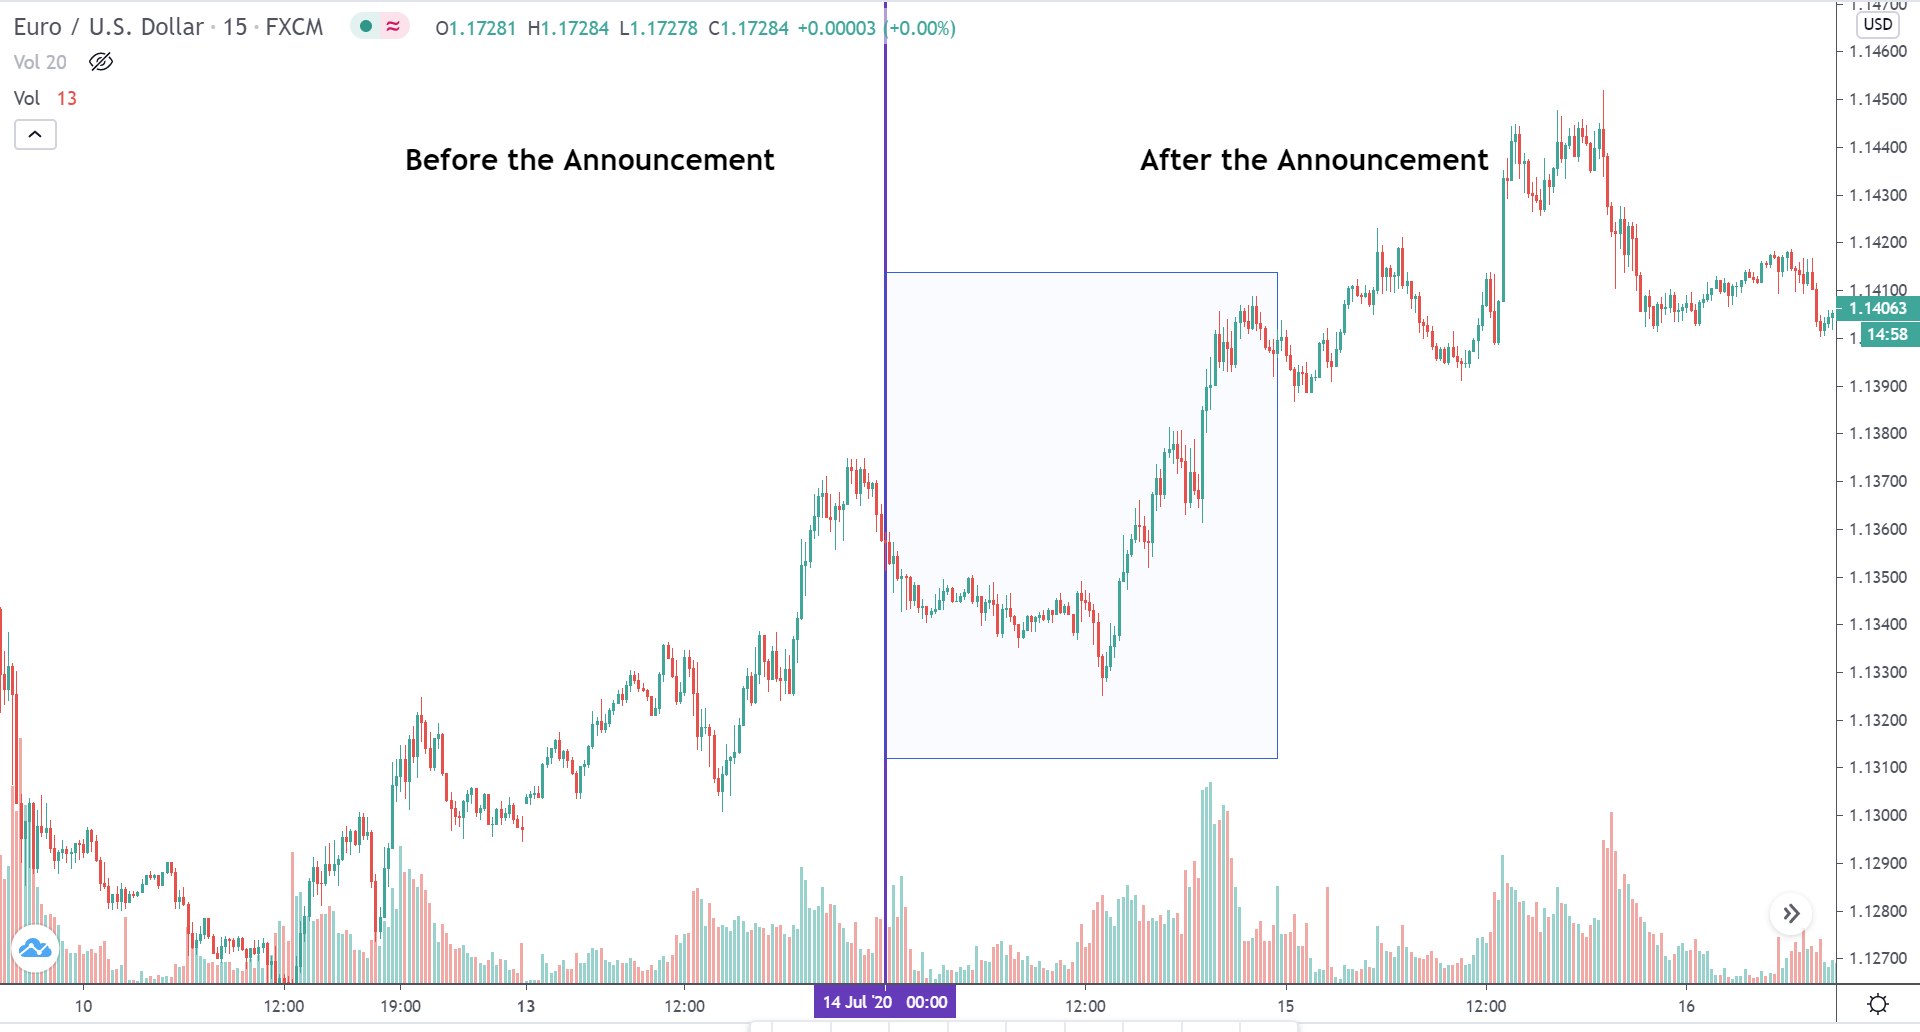
EUR/USD: Before the Monthly Industrial Production Data Release 
on August 14, 2020, Just Before 9.15 AM ET

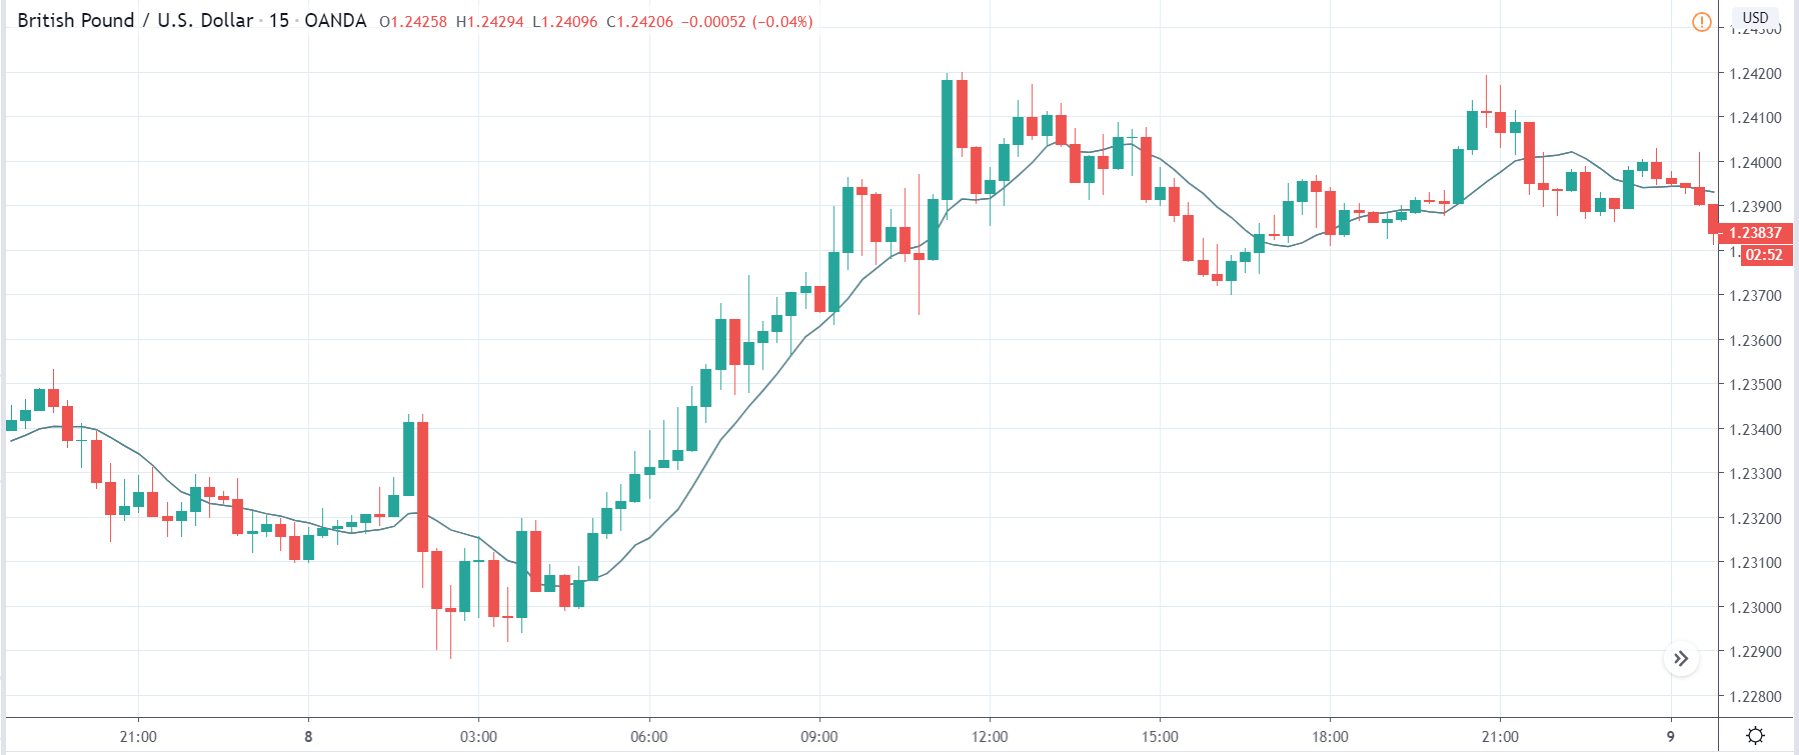
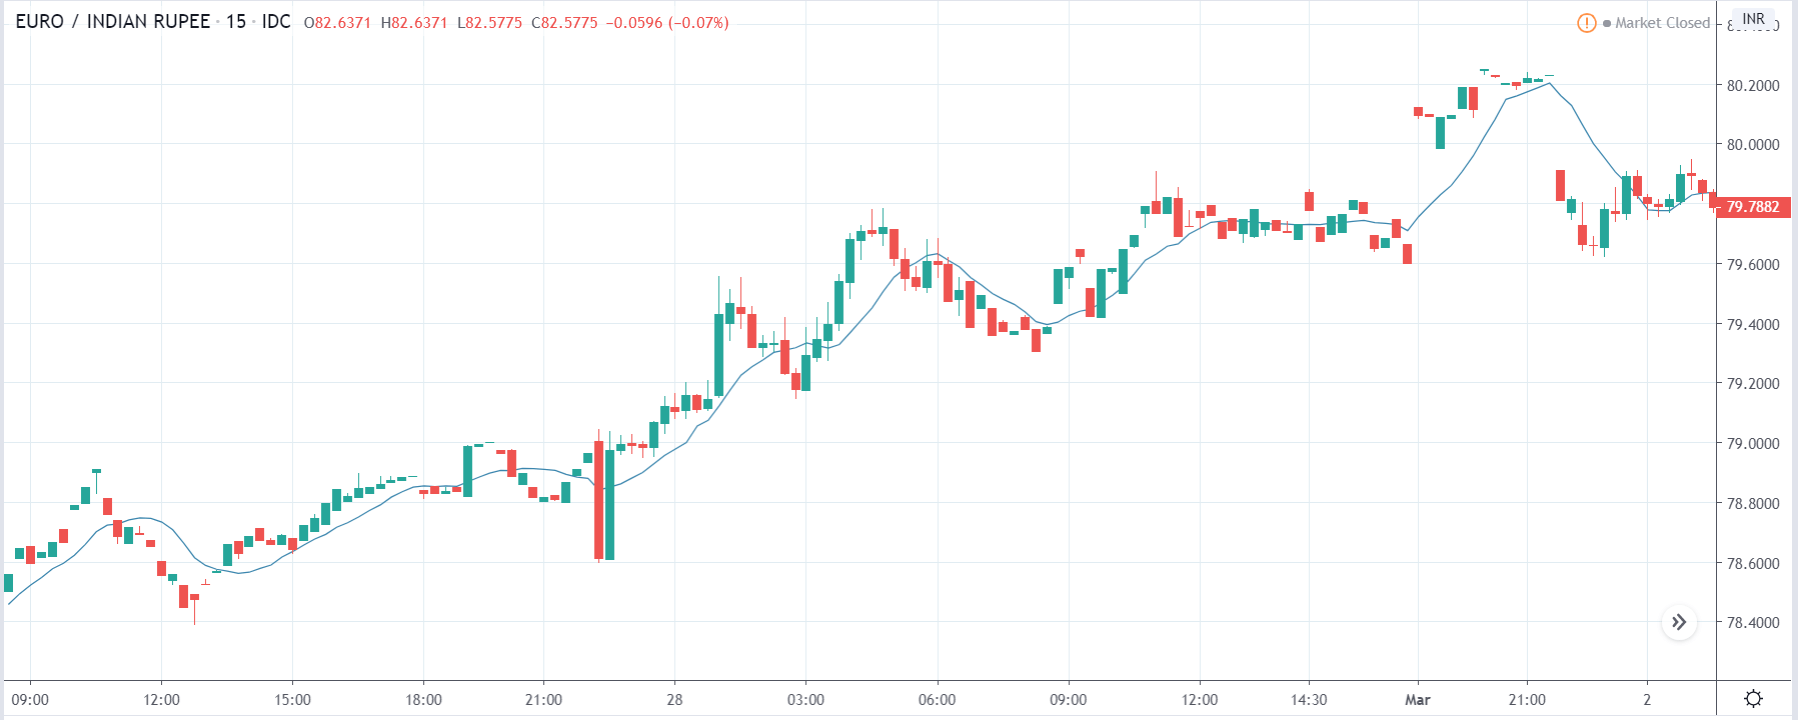
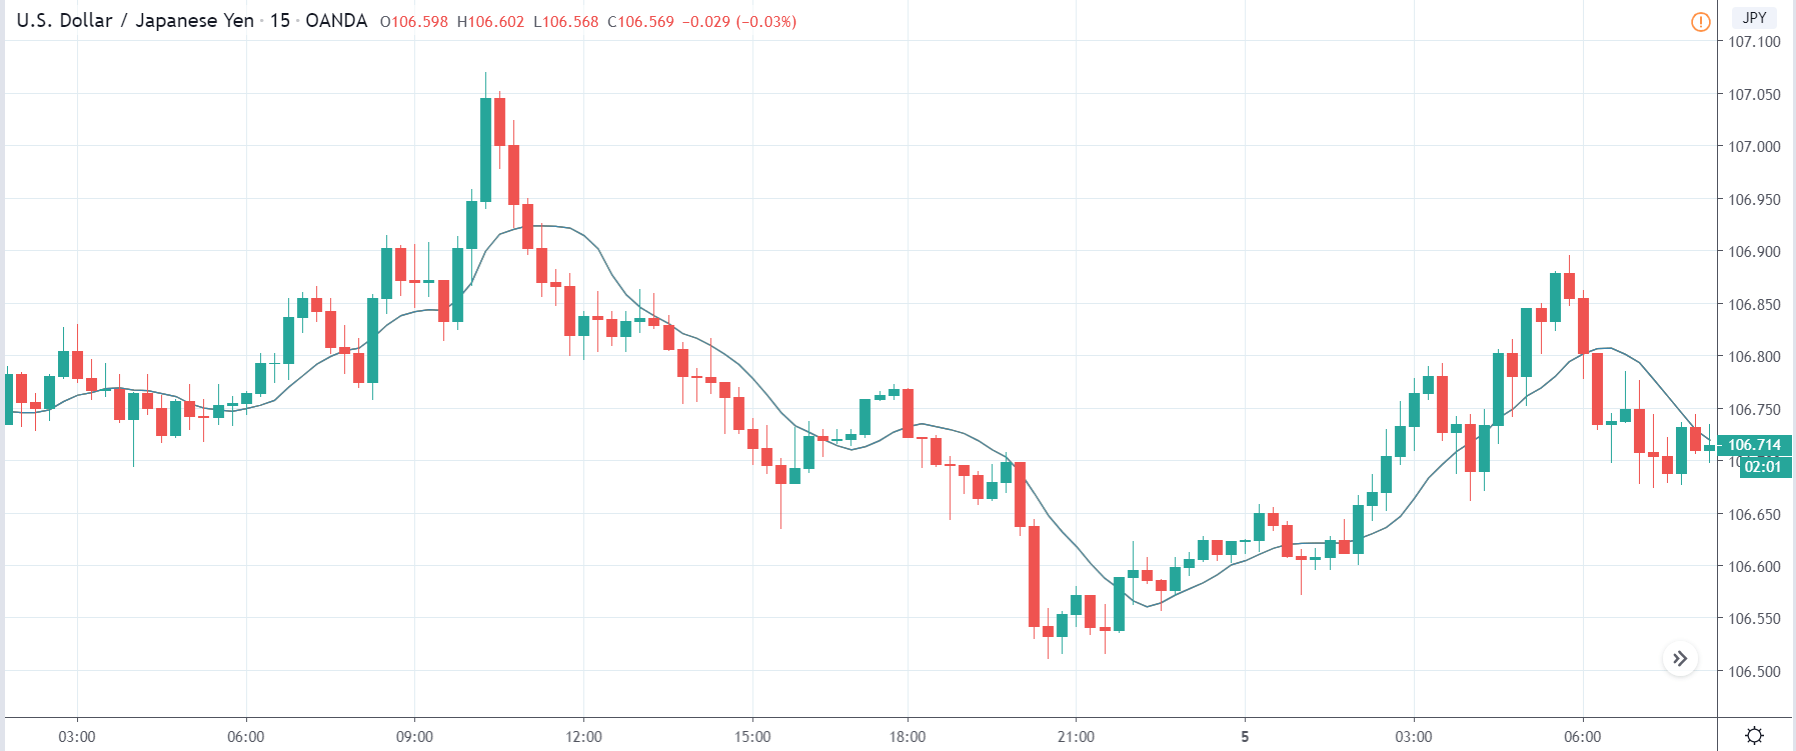
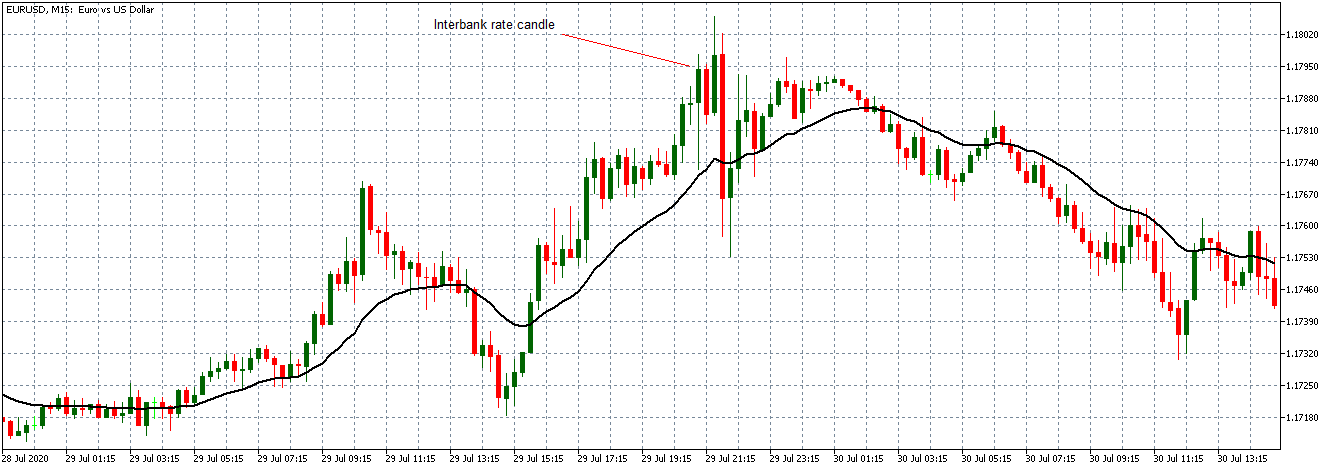
Before the data release, the EUR/USD pair was trading in a renewed uptrend with the 15-minute candles forming above a steadily rising 20-period Moving Average. This pattern indicates that the USD was weakening against the EUR.

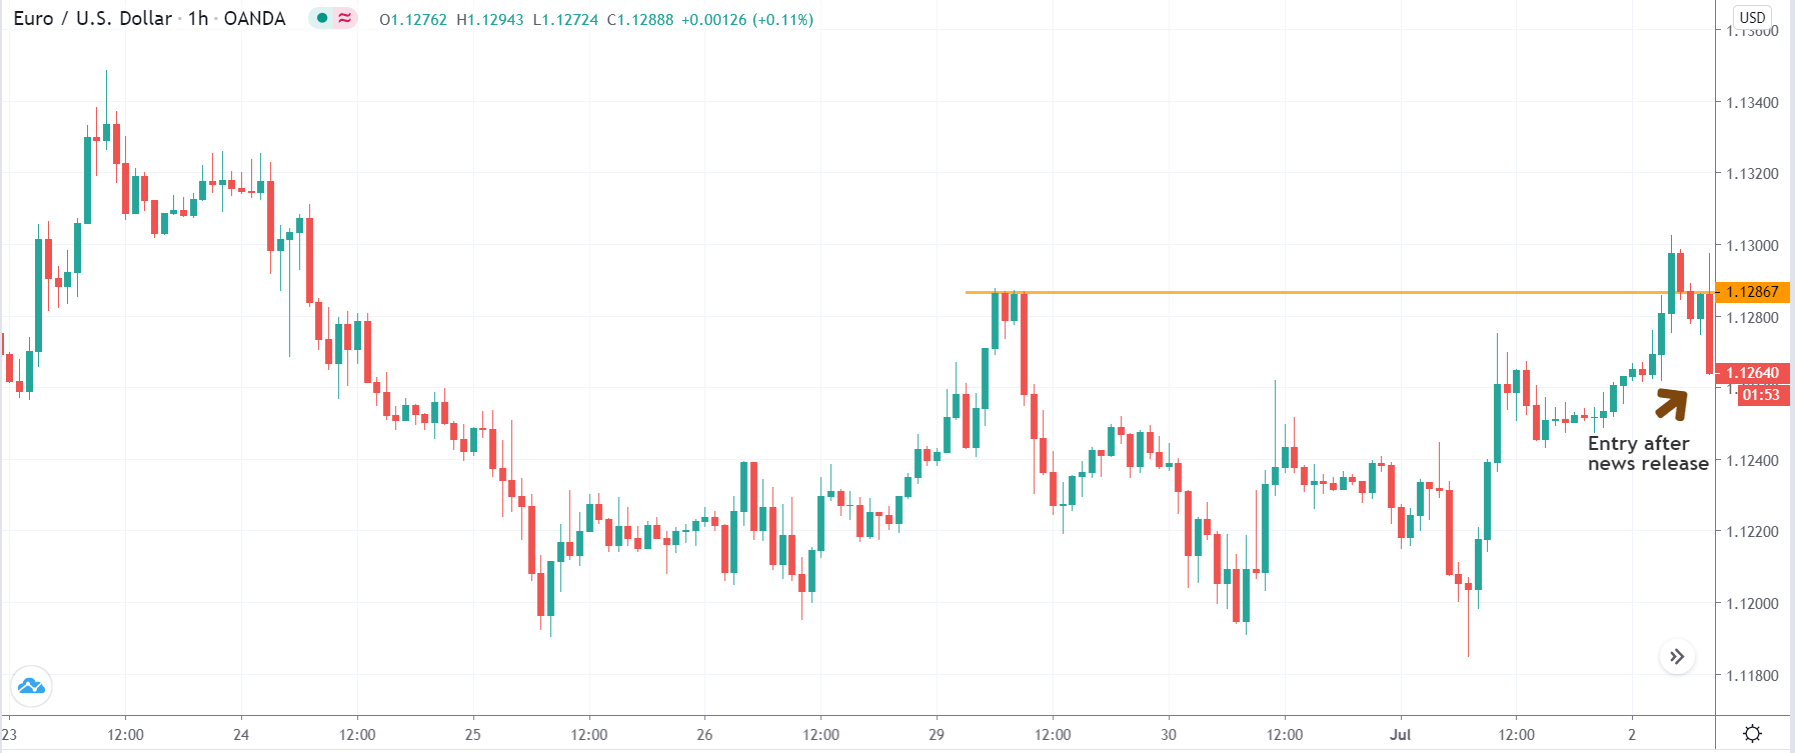
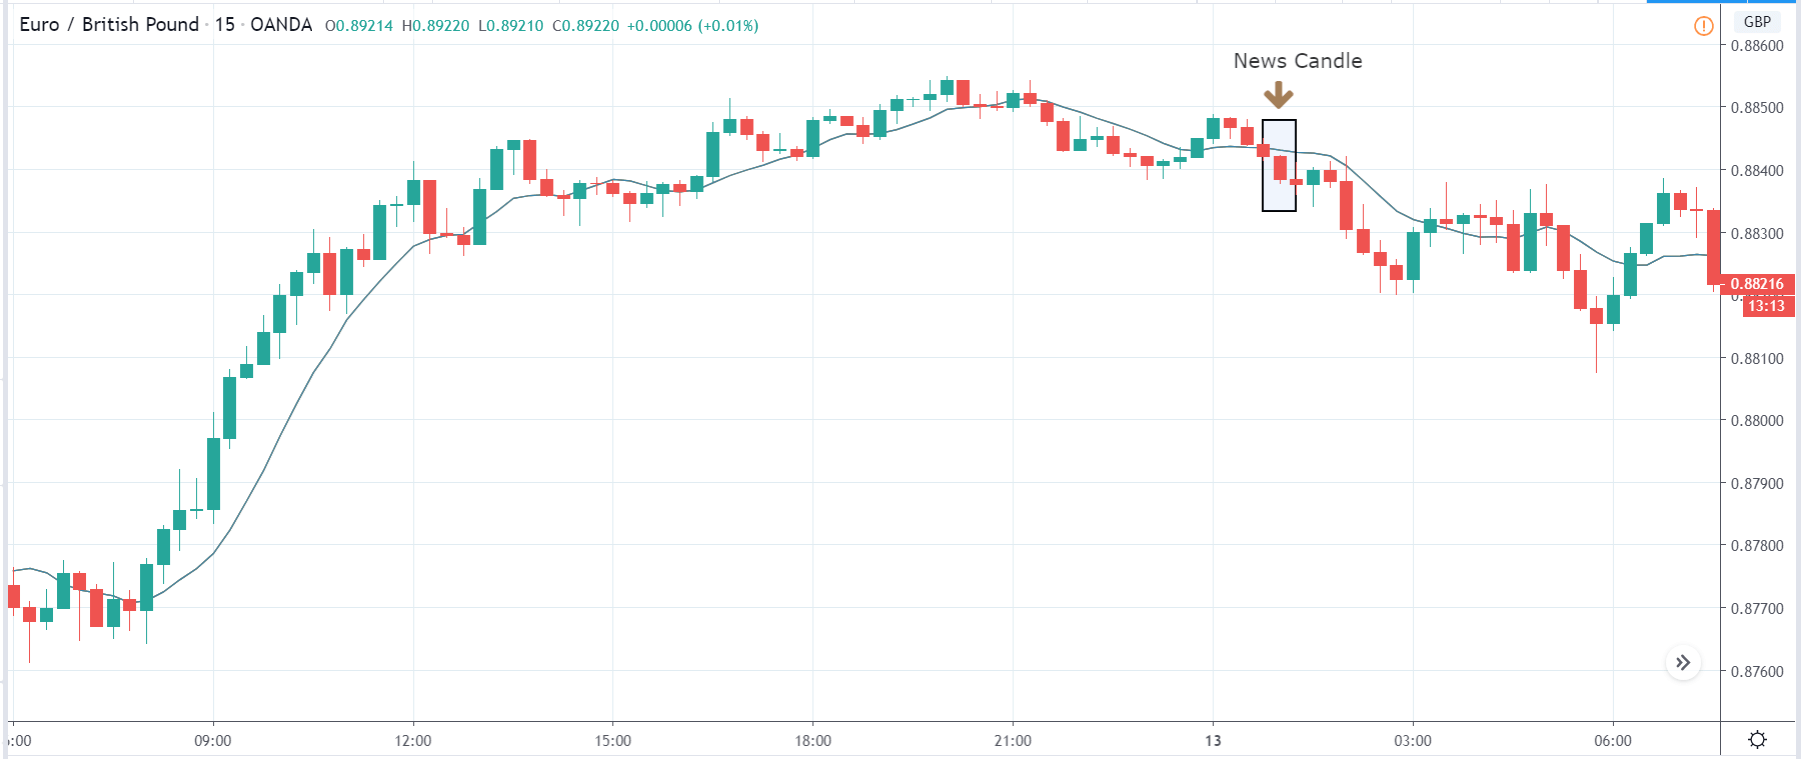
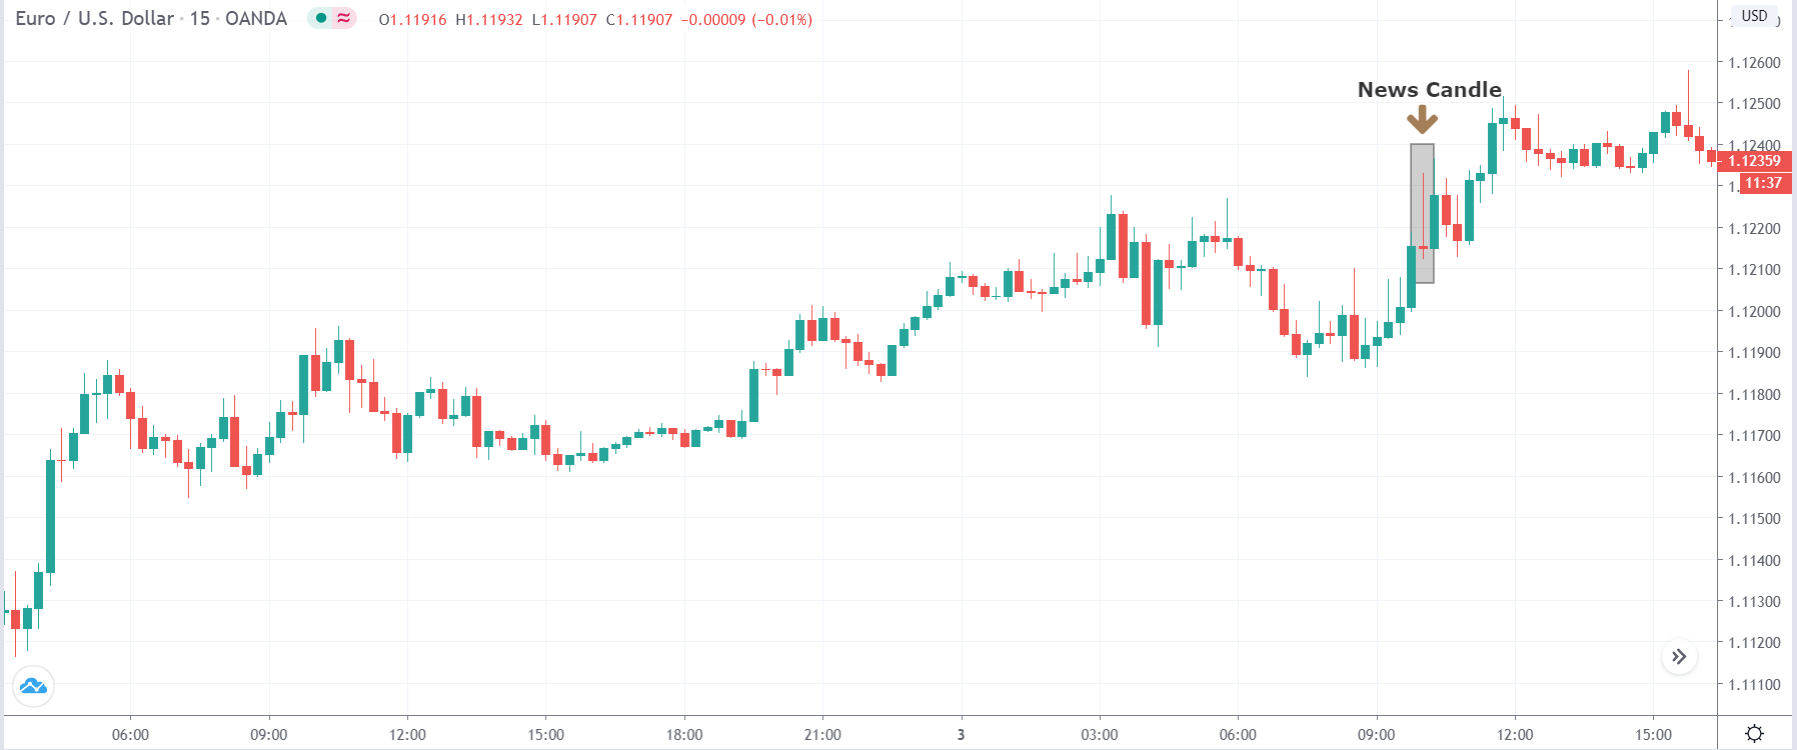
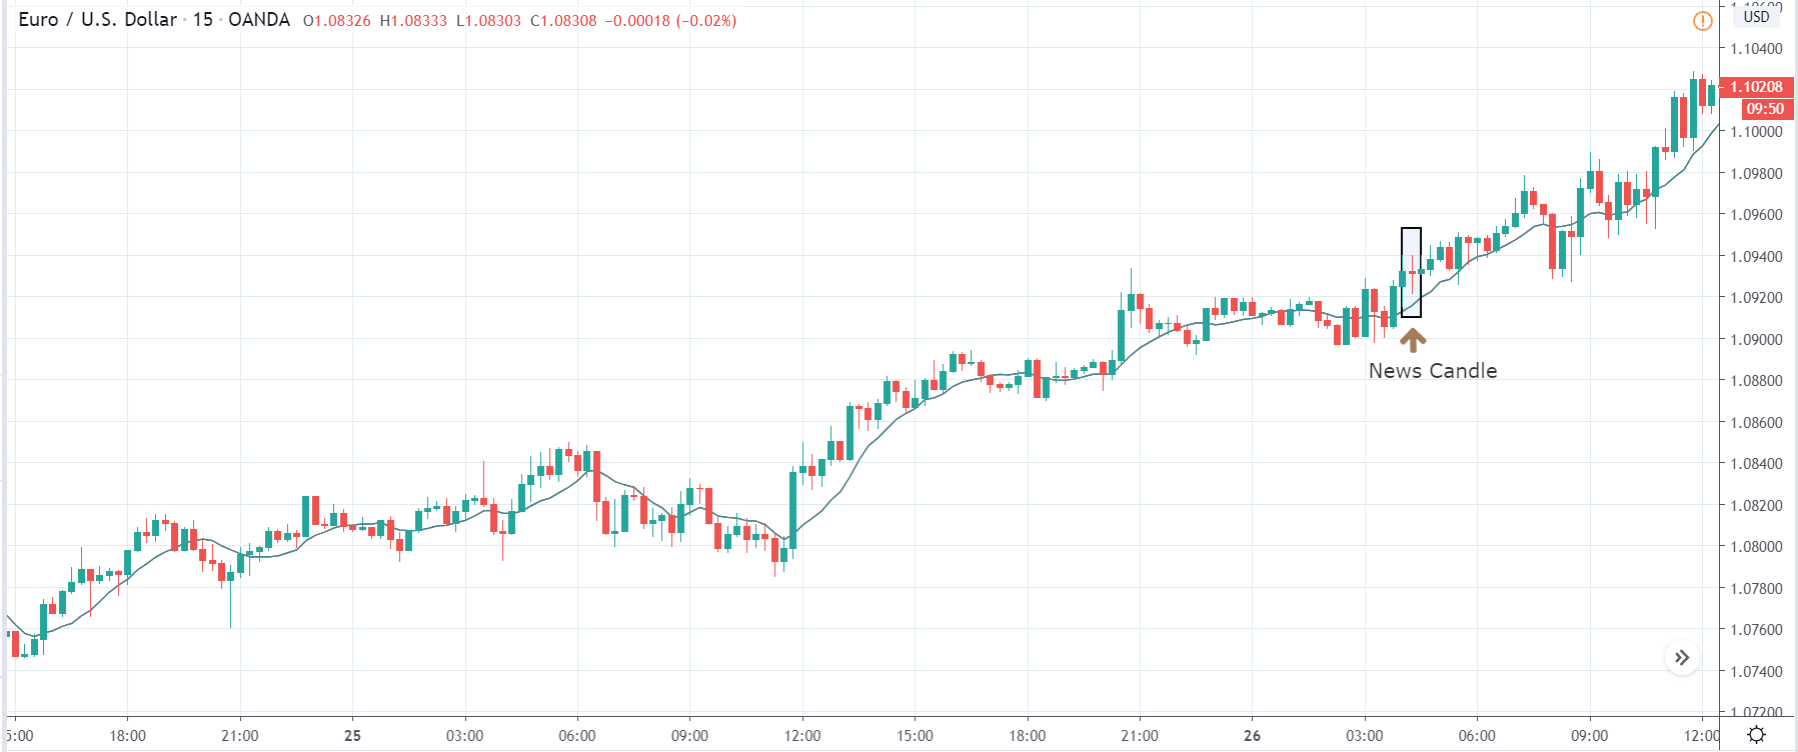
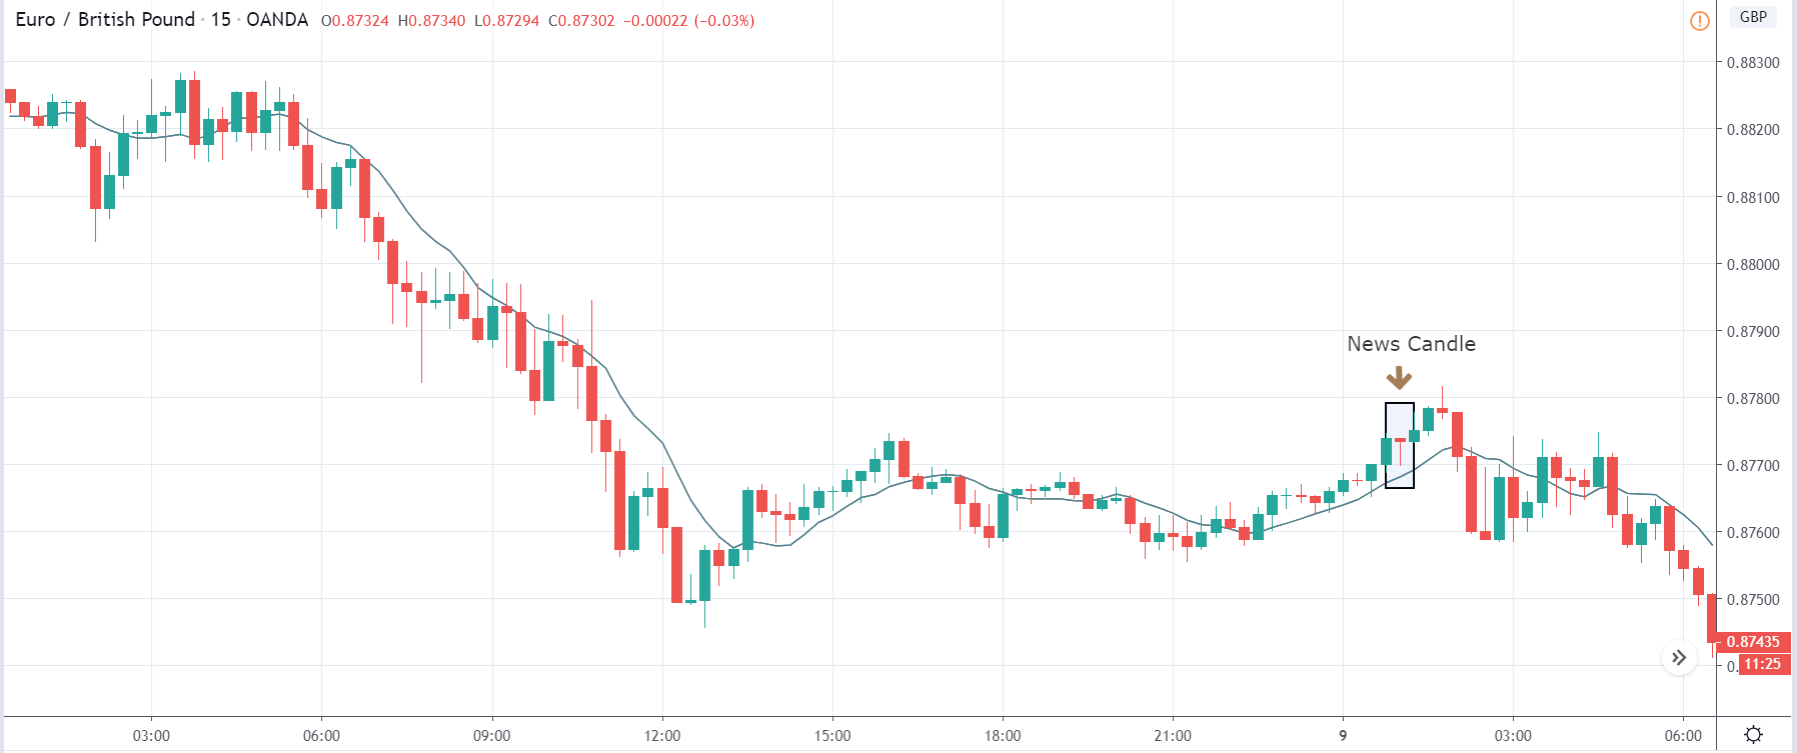
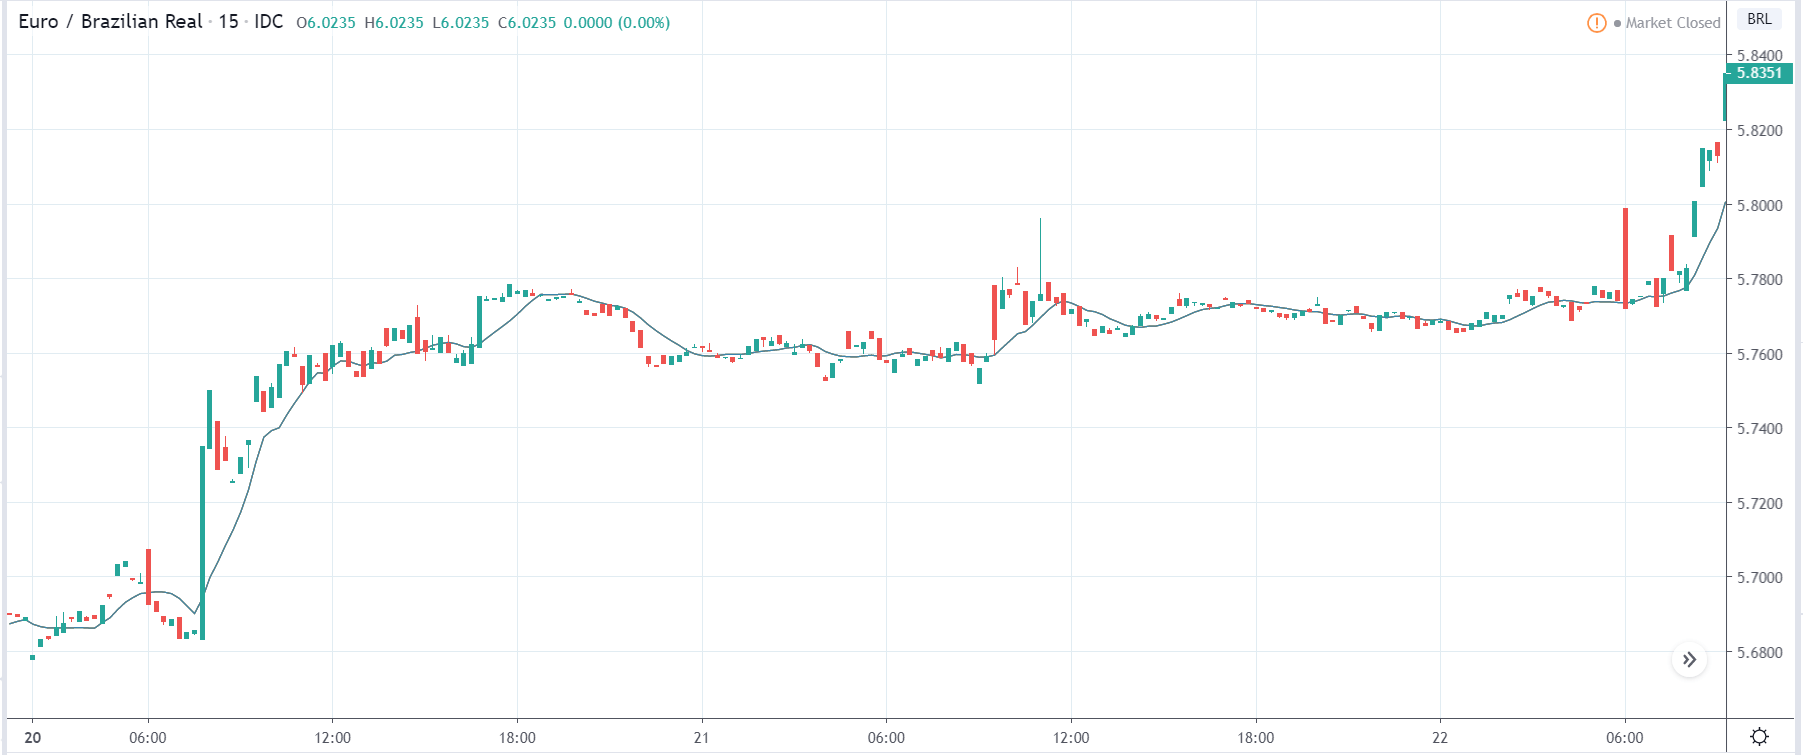
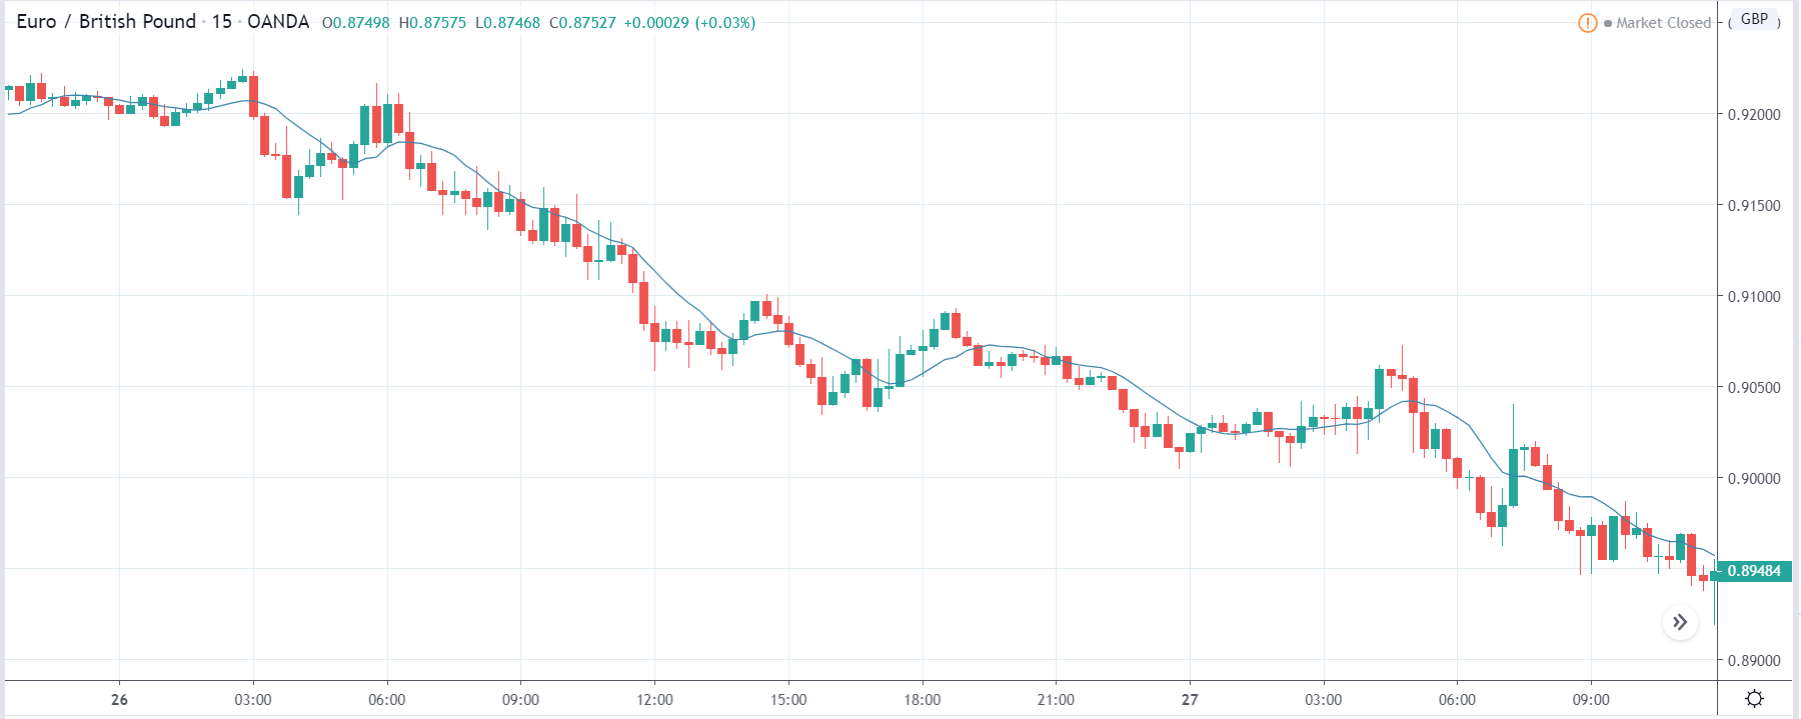
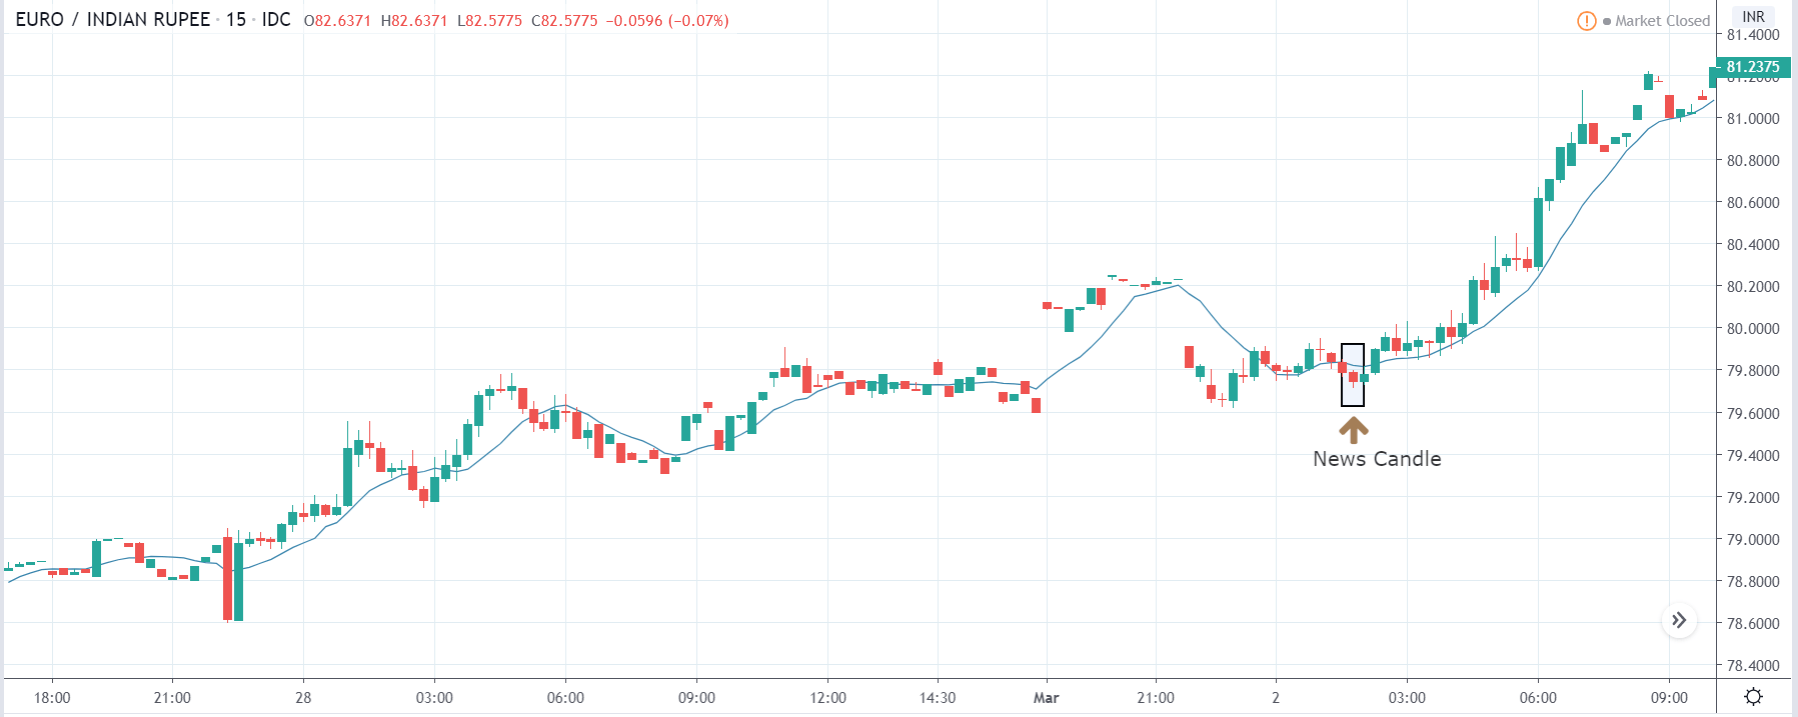
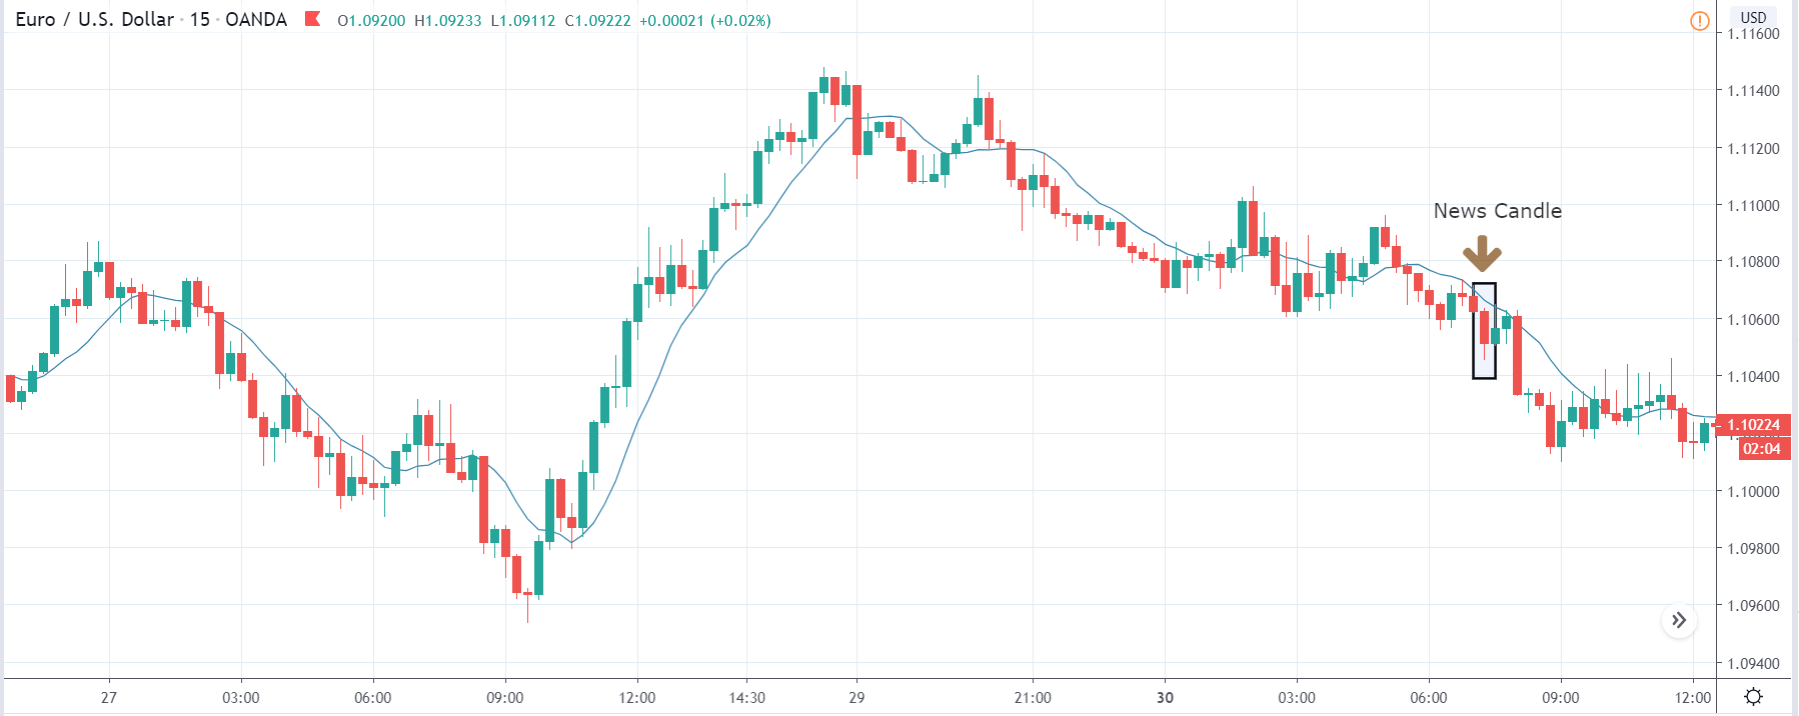
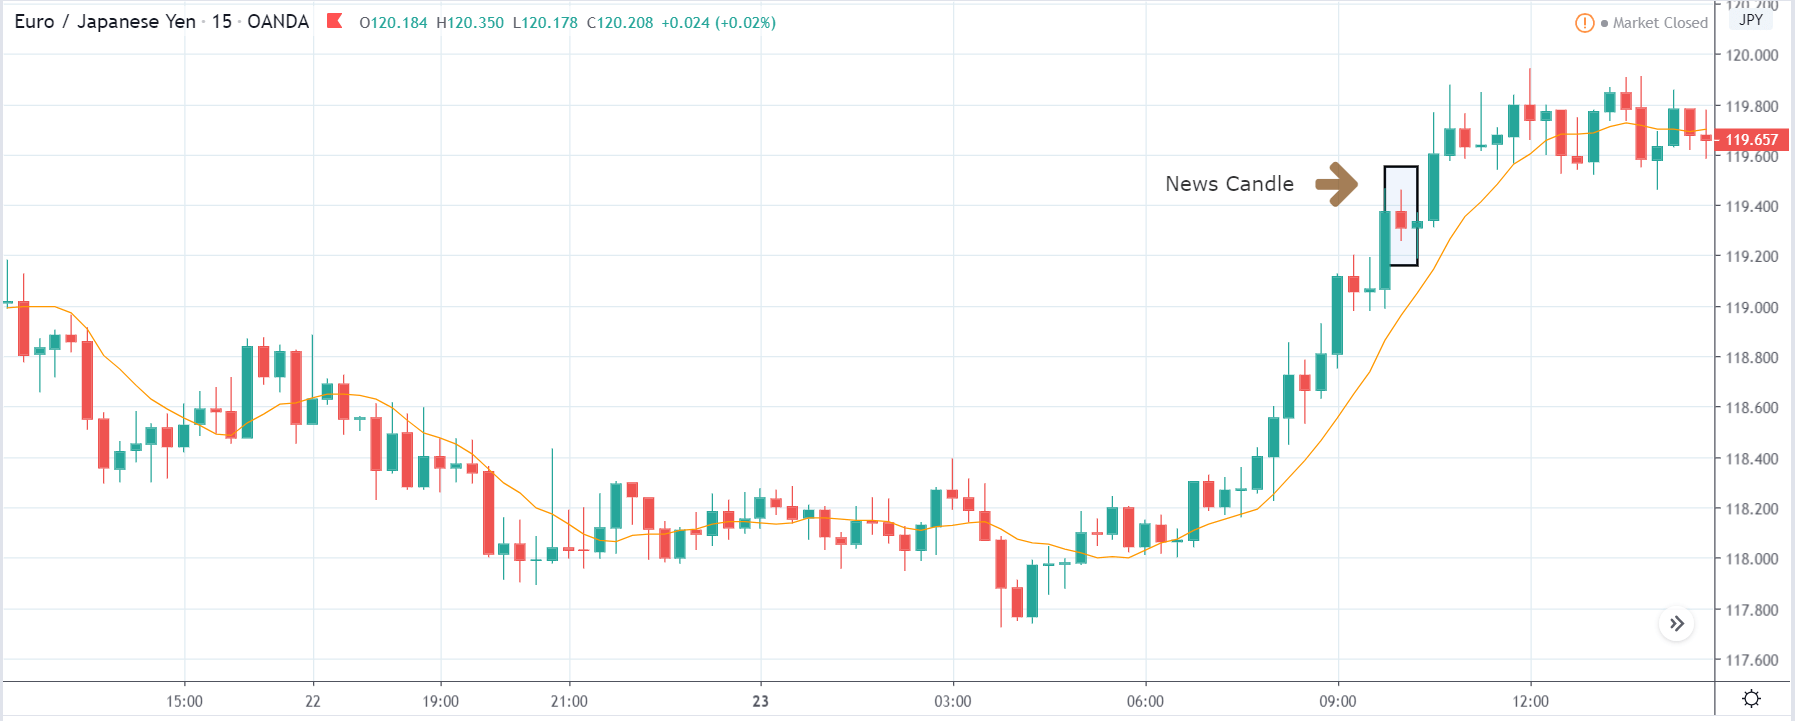
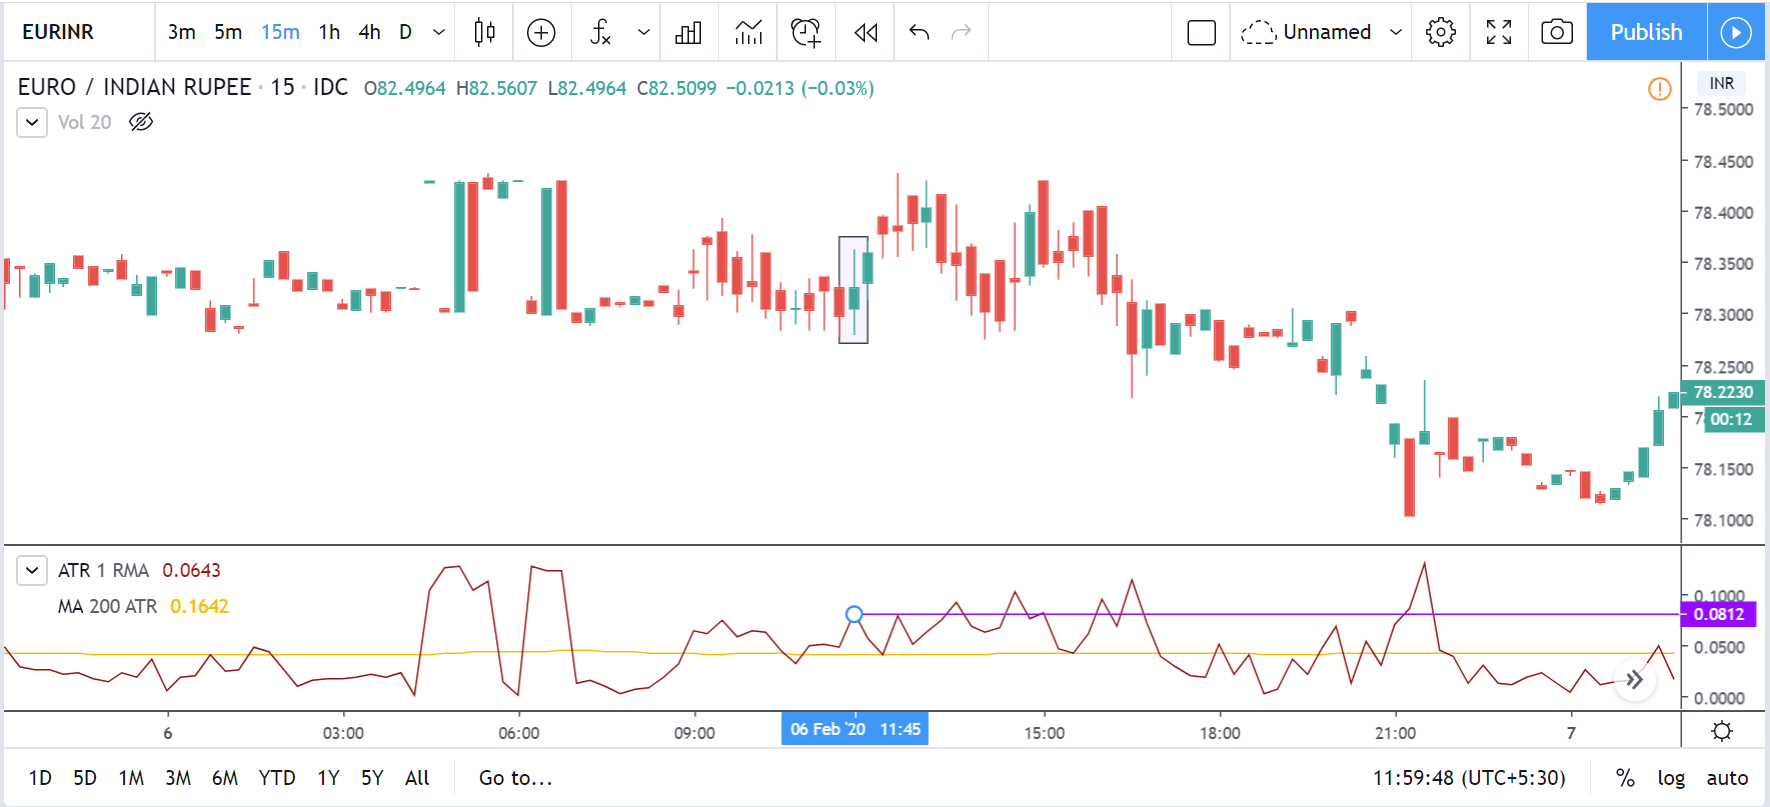
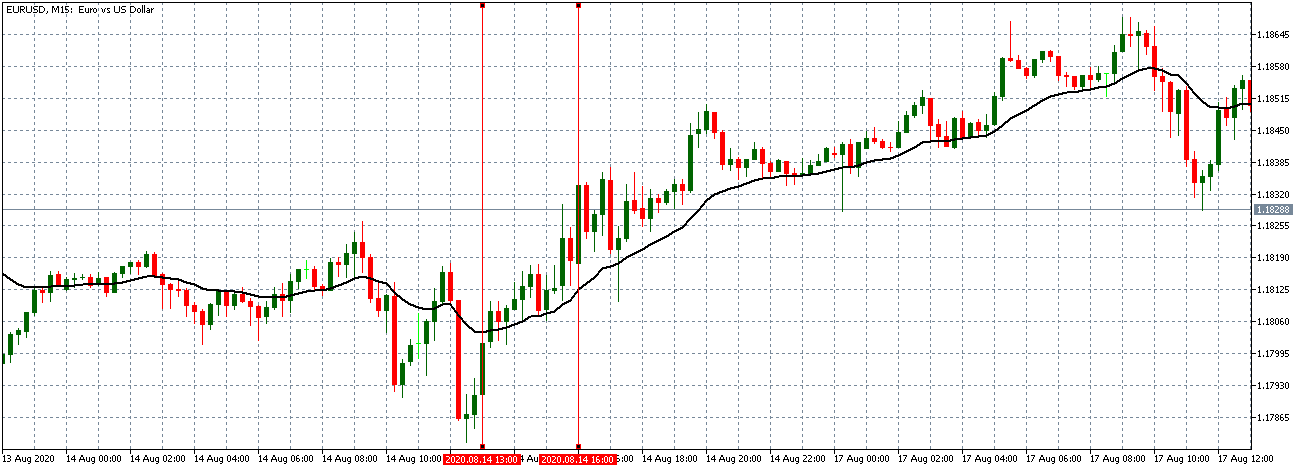
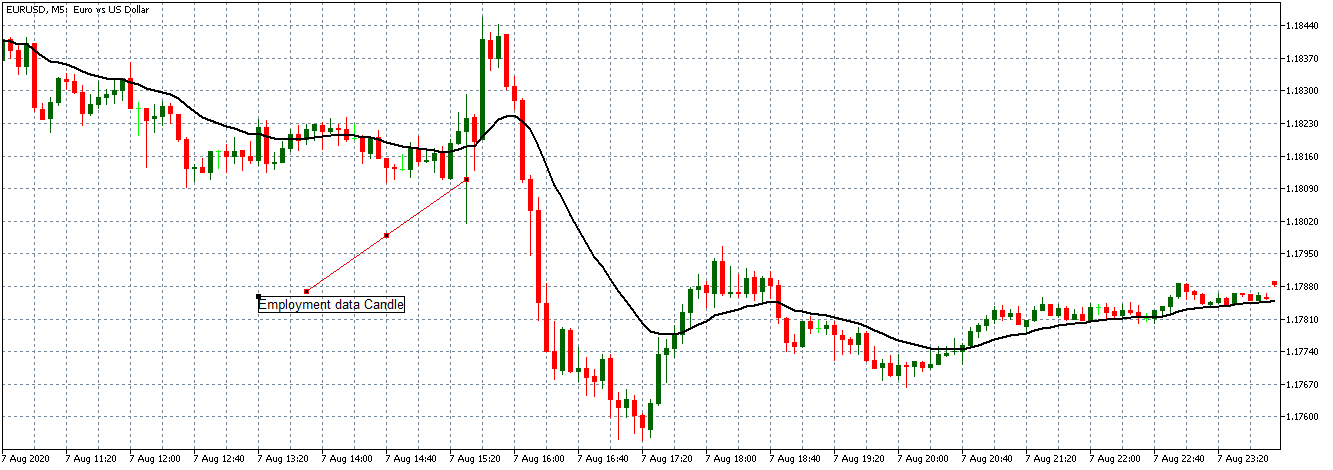
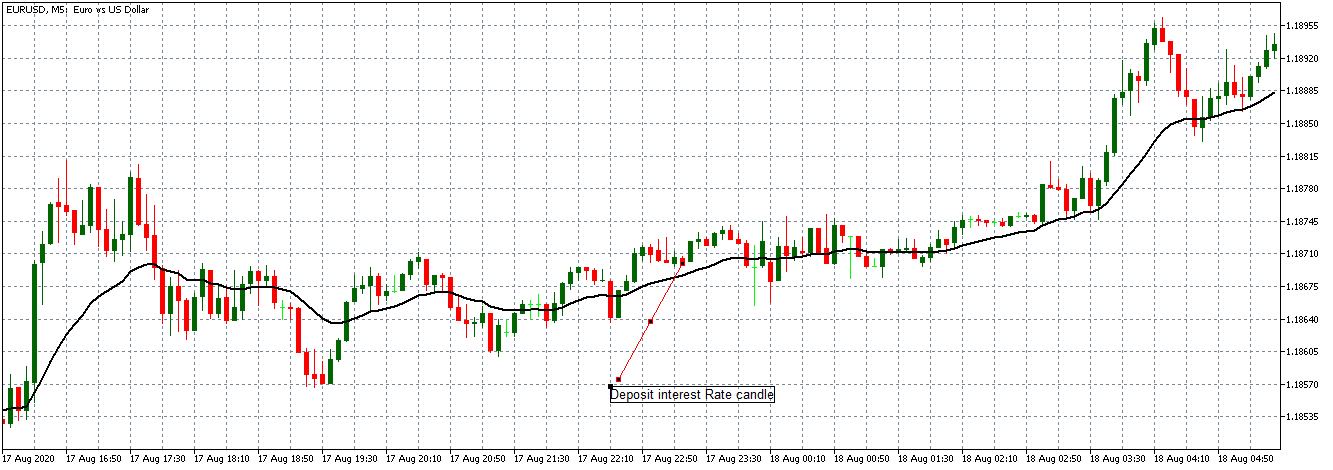
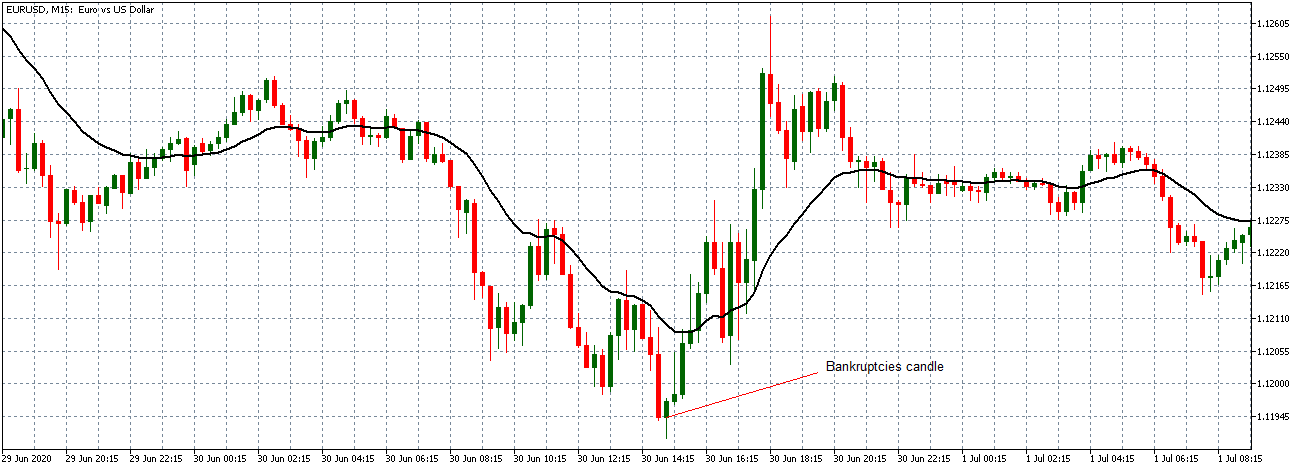
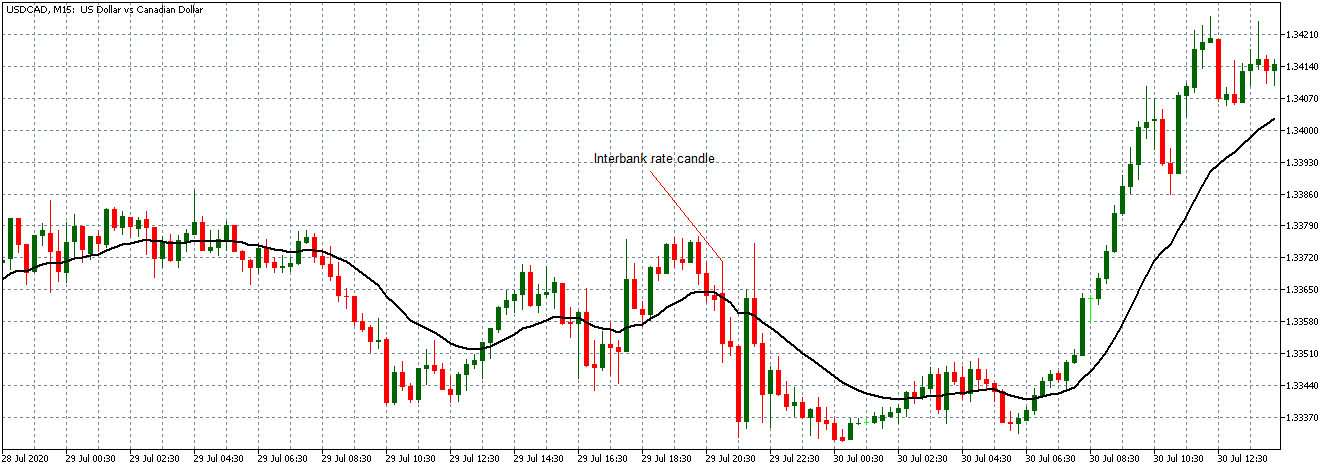
EUR/USD: After the Monthly Industrial Production Data Release 
on August 14, 2020, at 9.15 AM ET

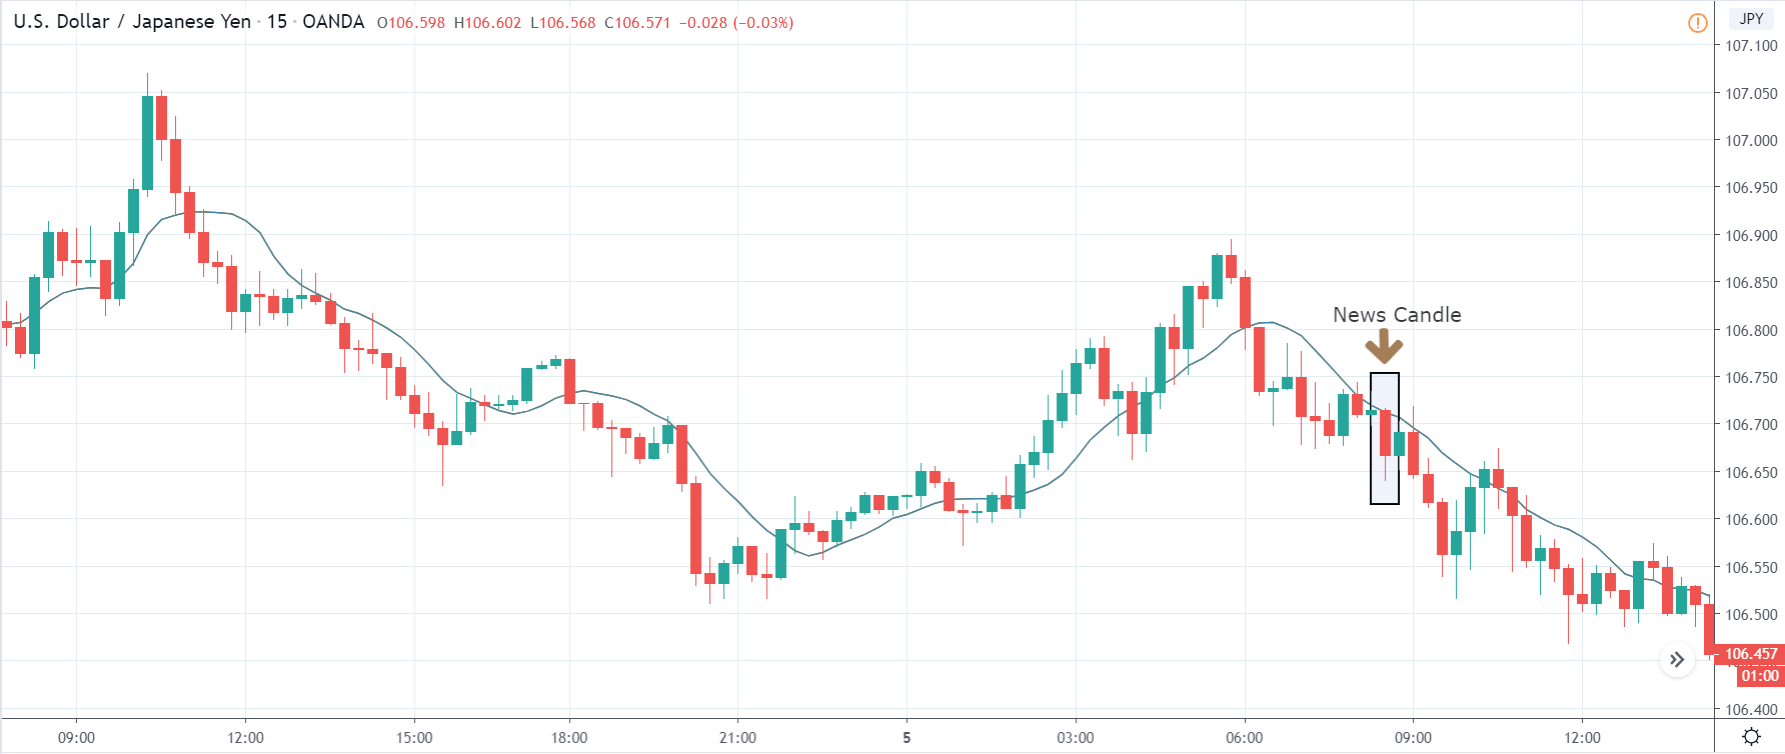
As expected, the pair formed a 15-minute bearish candle after the data release indicating a  momentary strength in the USD. The data was, however, was not significant enough to bring forth a change in the trading pattern. The pair continued trading in the earlier observed uptrend with the 20-period Moving Average steadily rising.

Now let’s see how this news release impacted other major currency pairs.

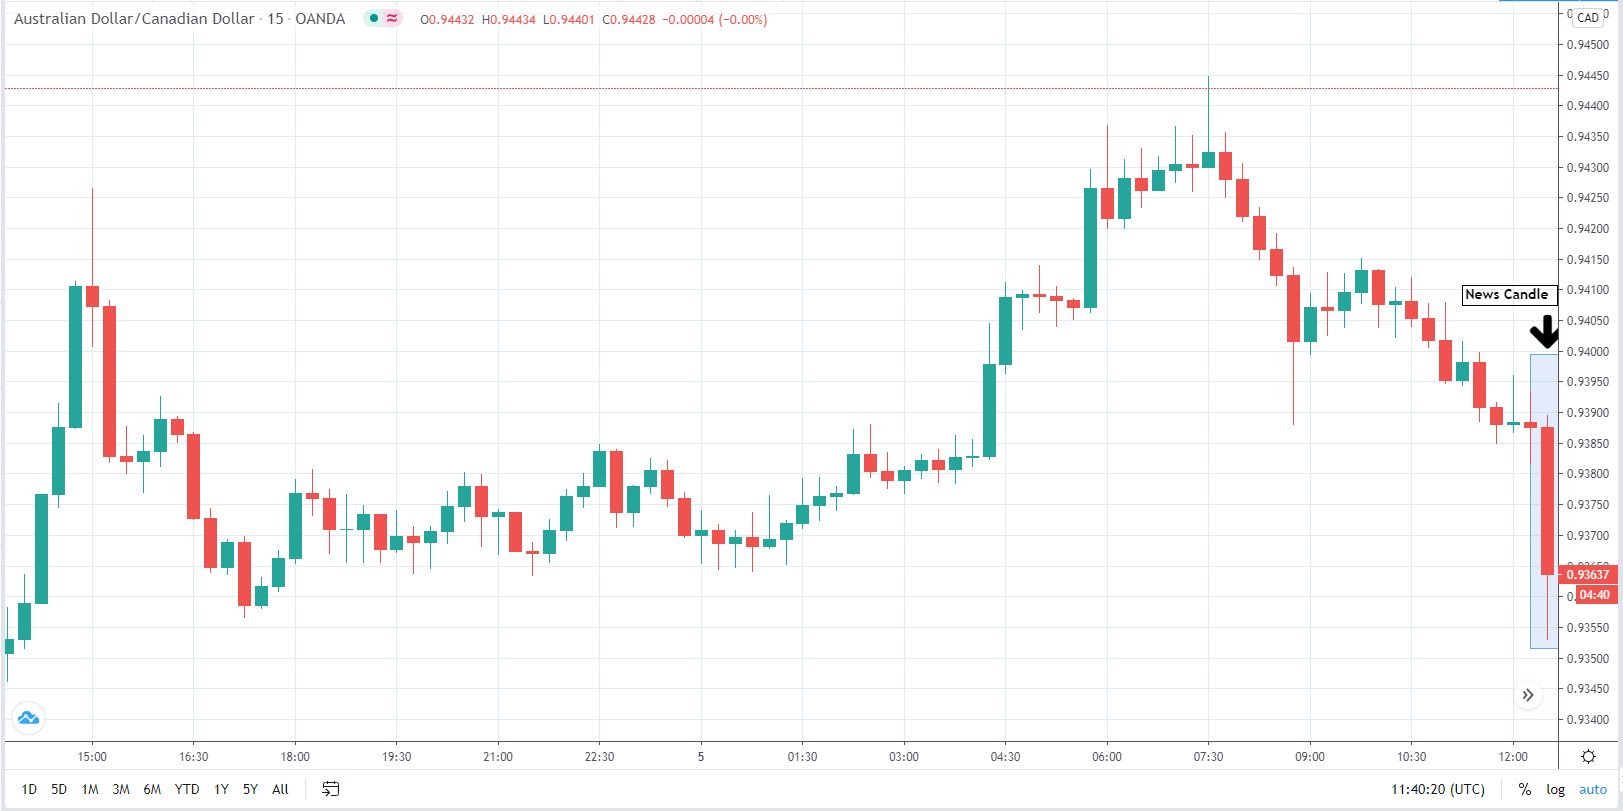
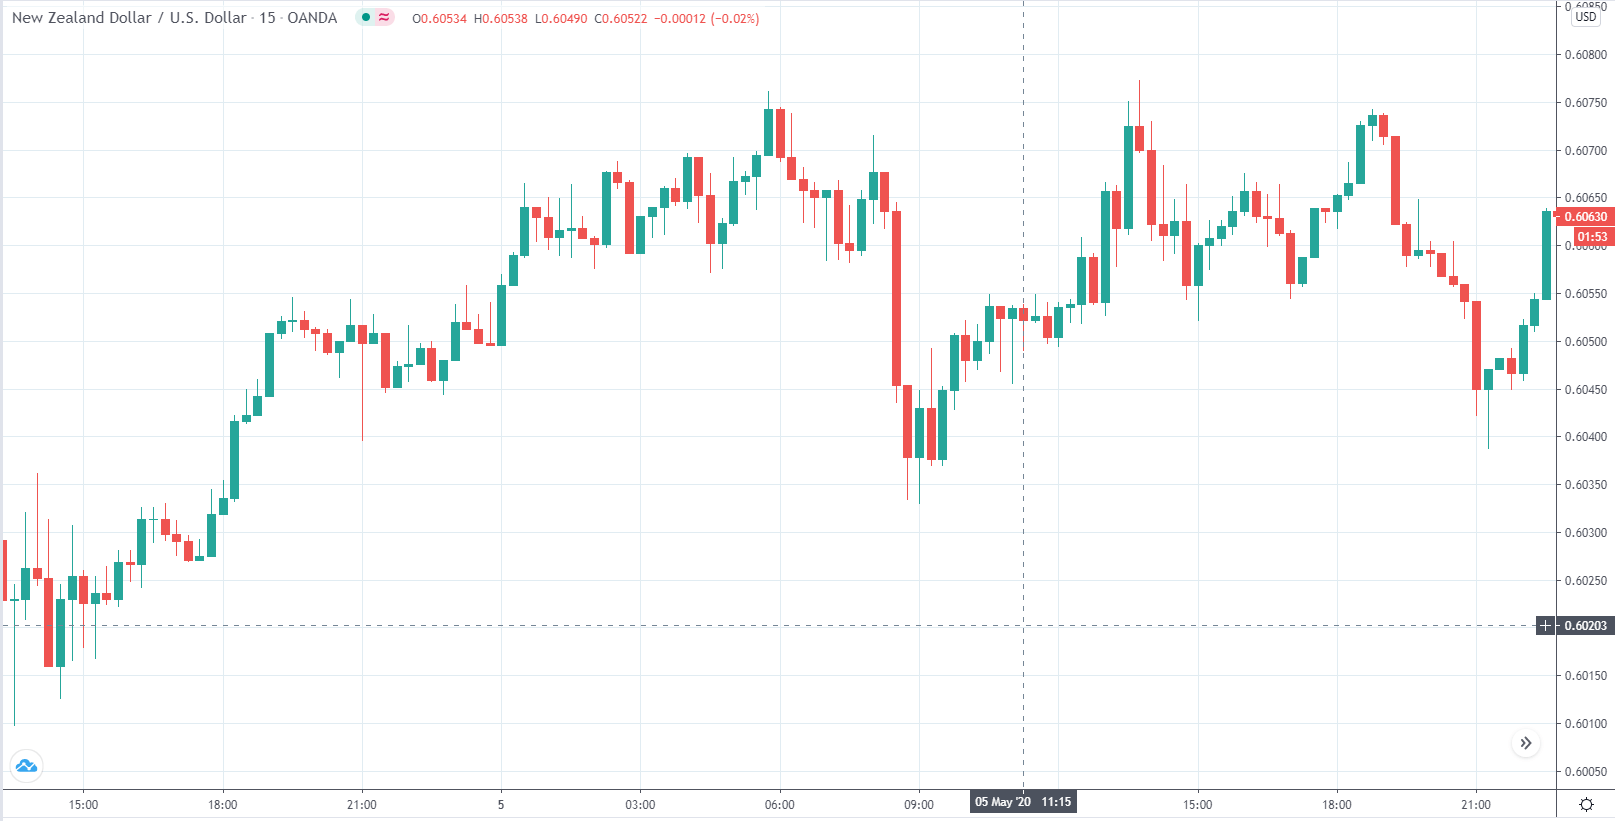
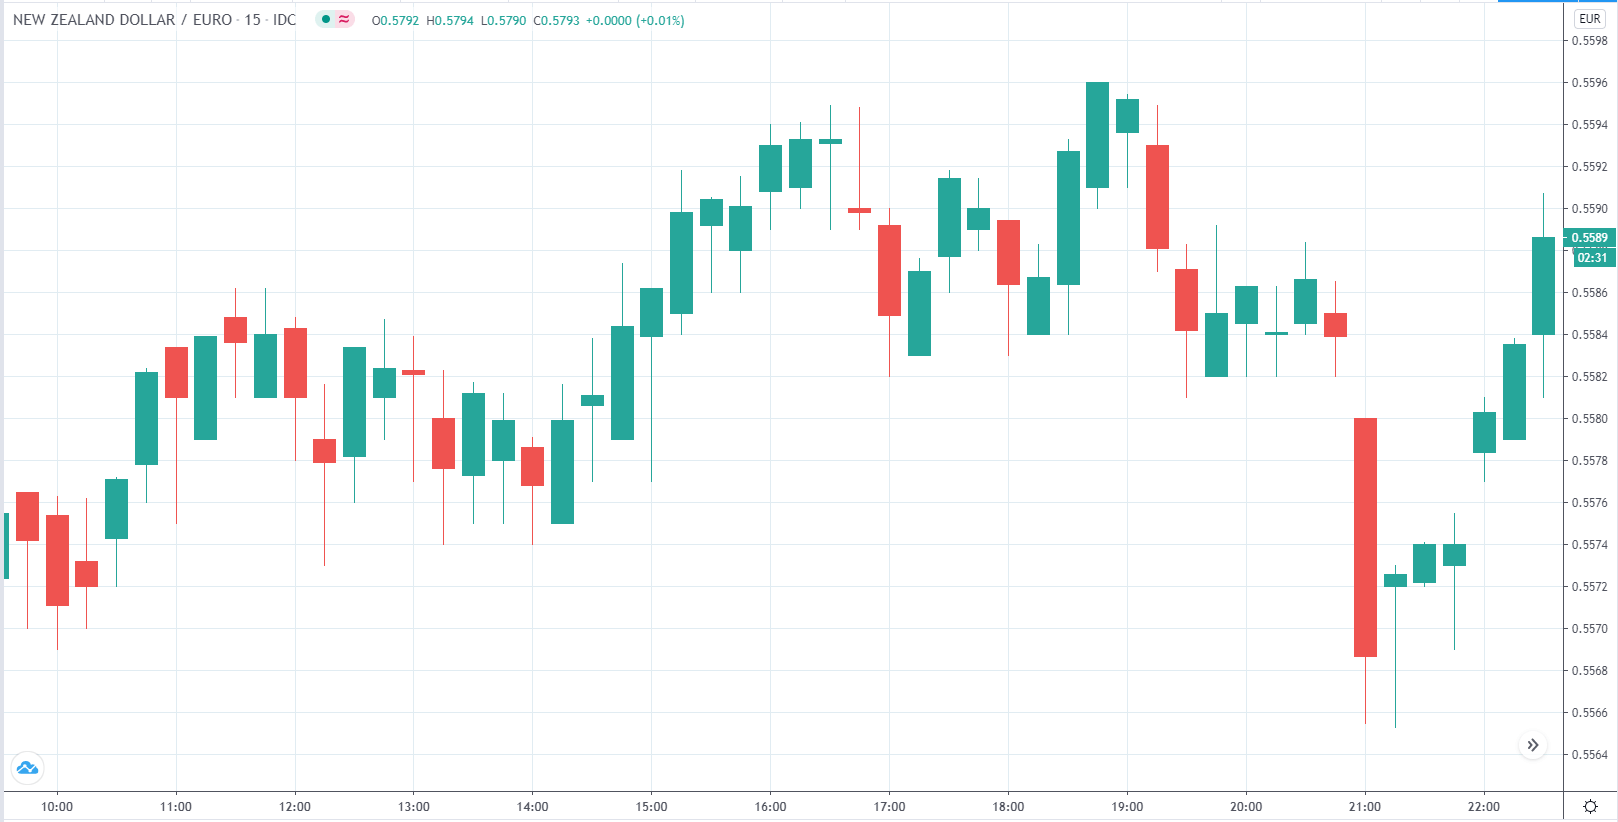
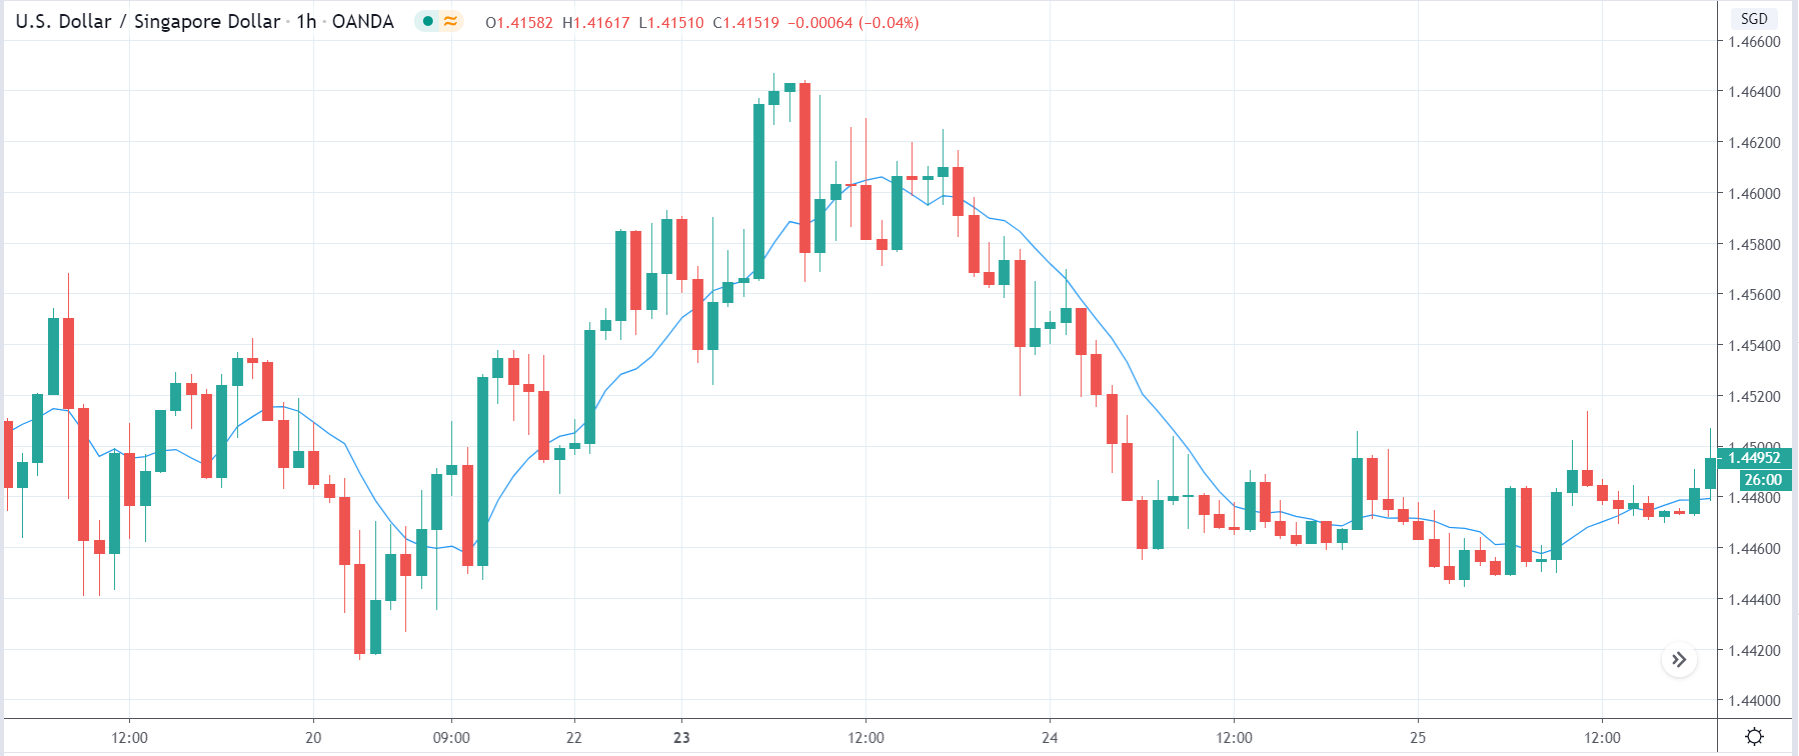
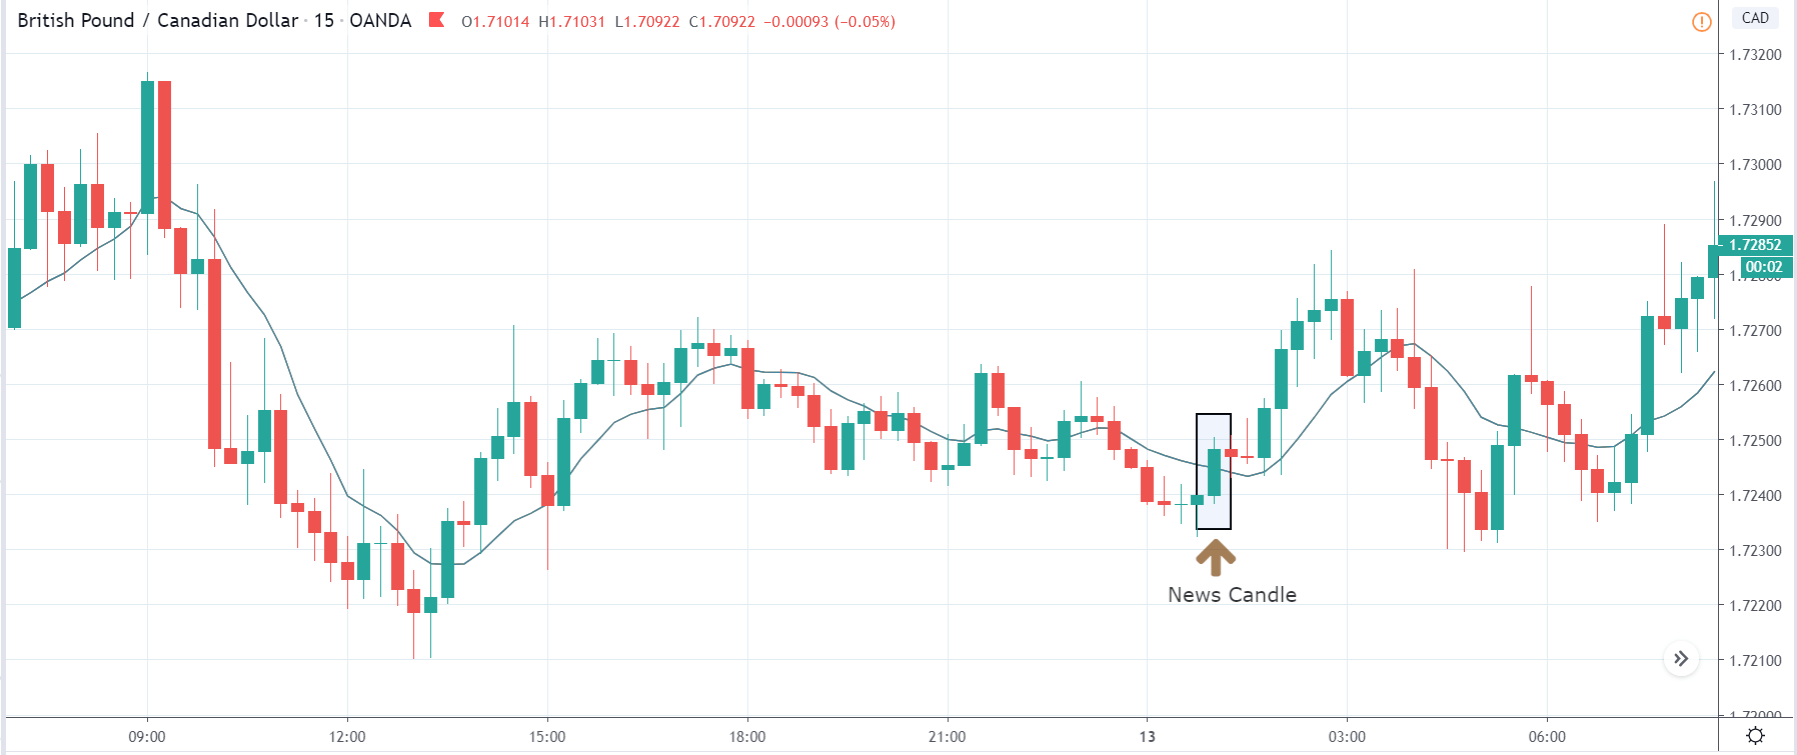
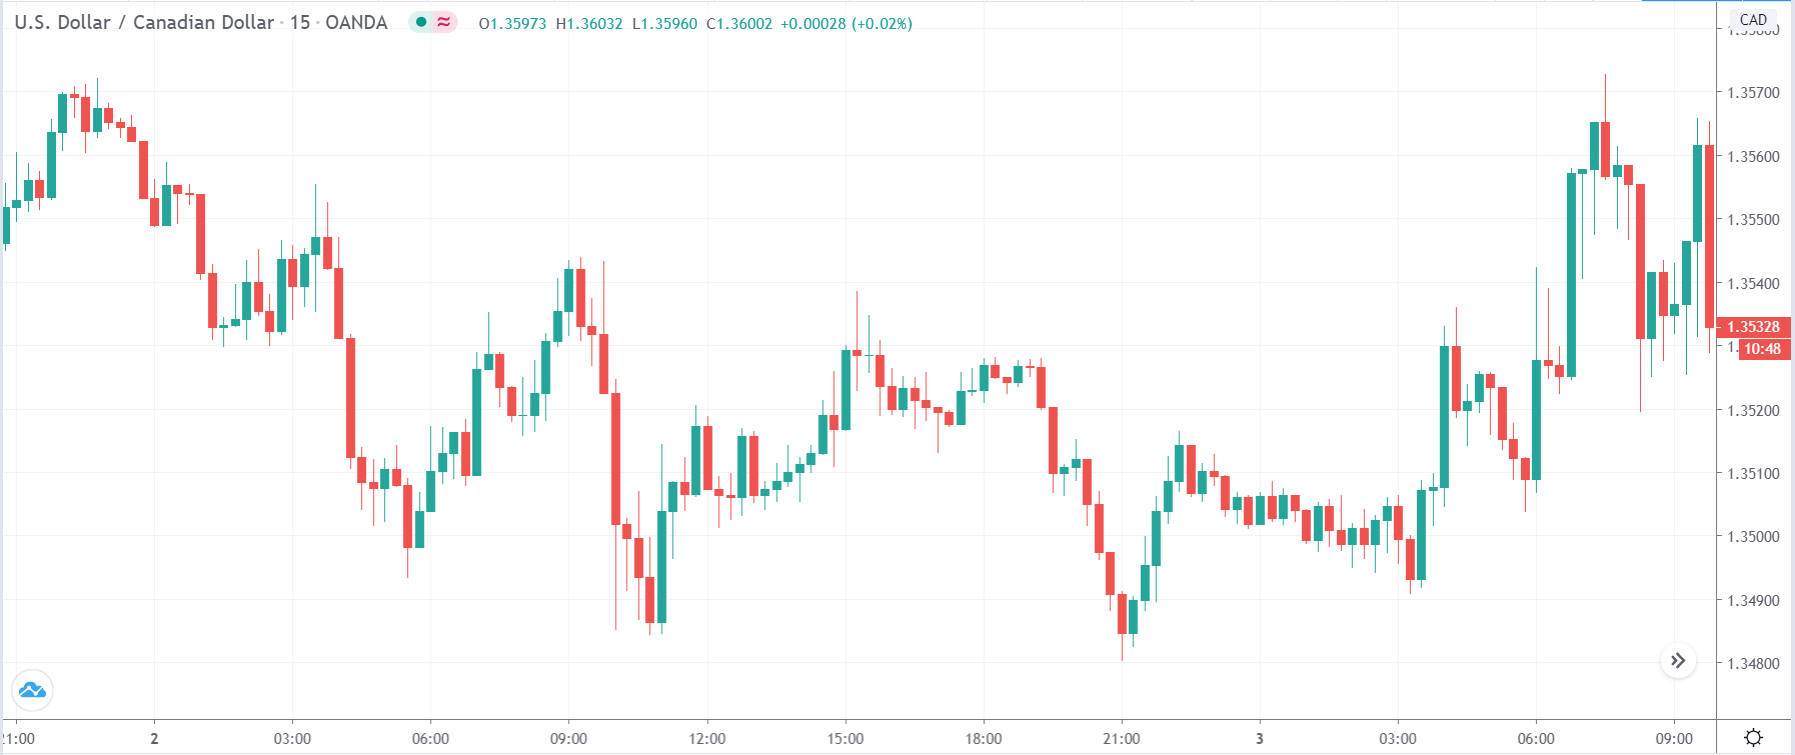
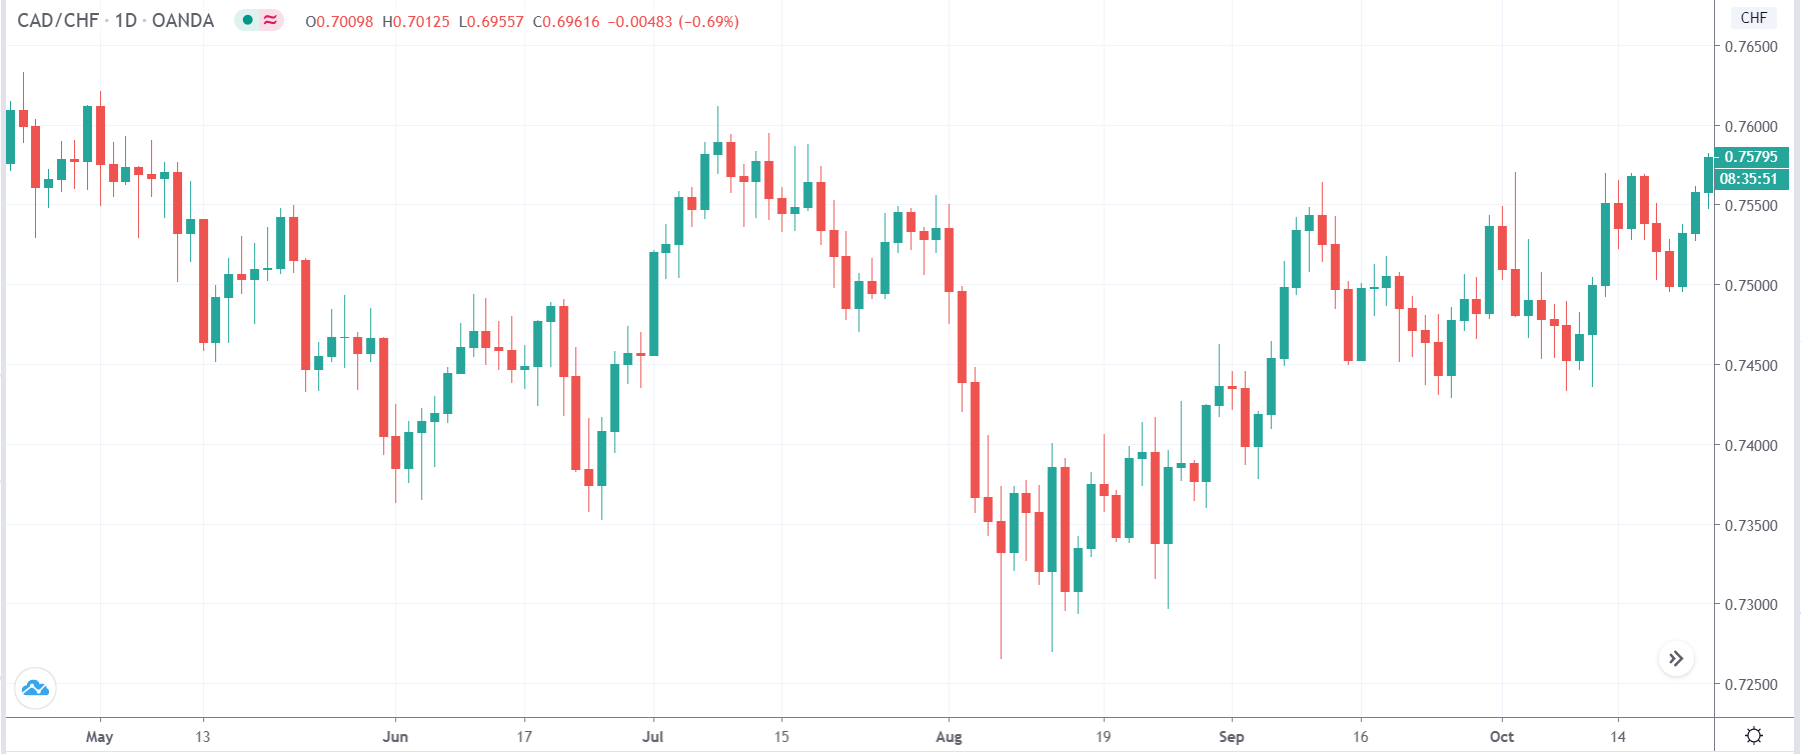
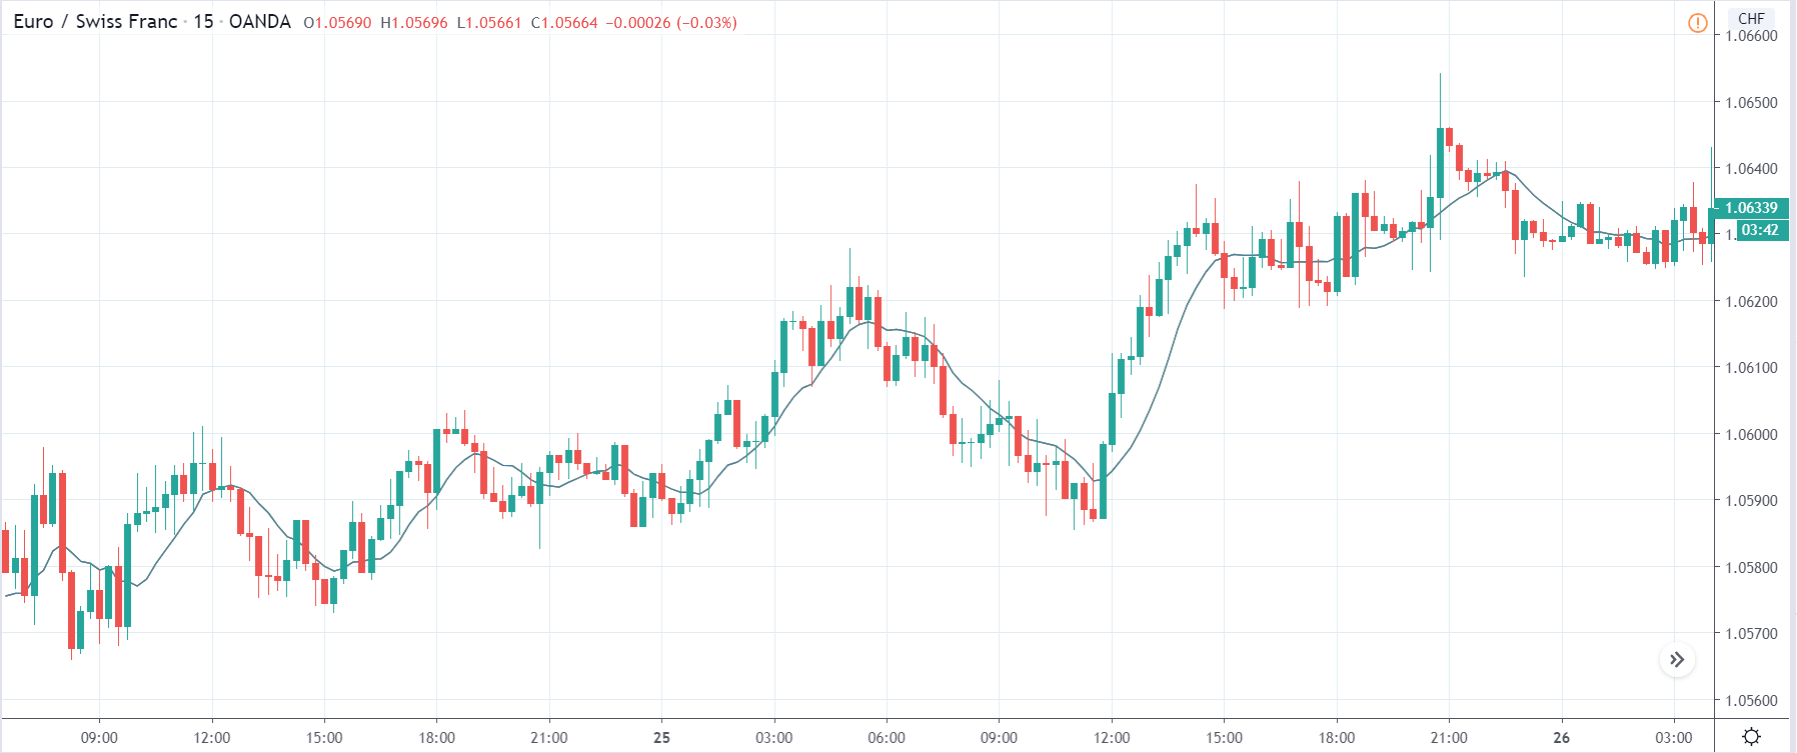
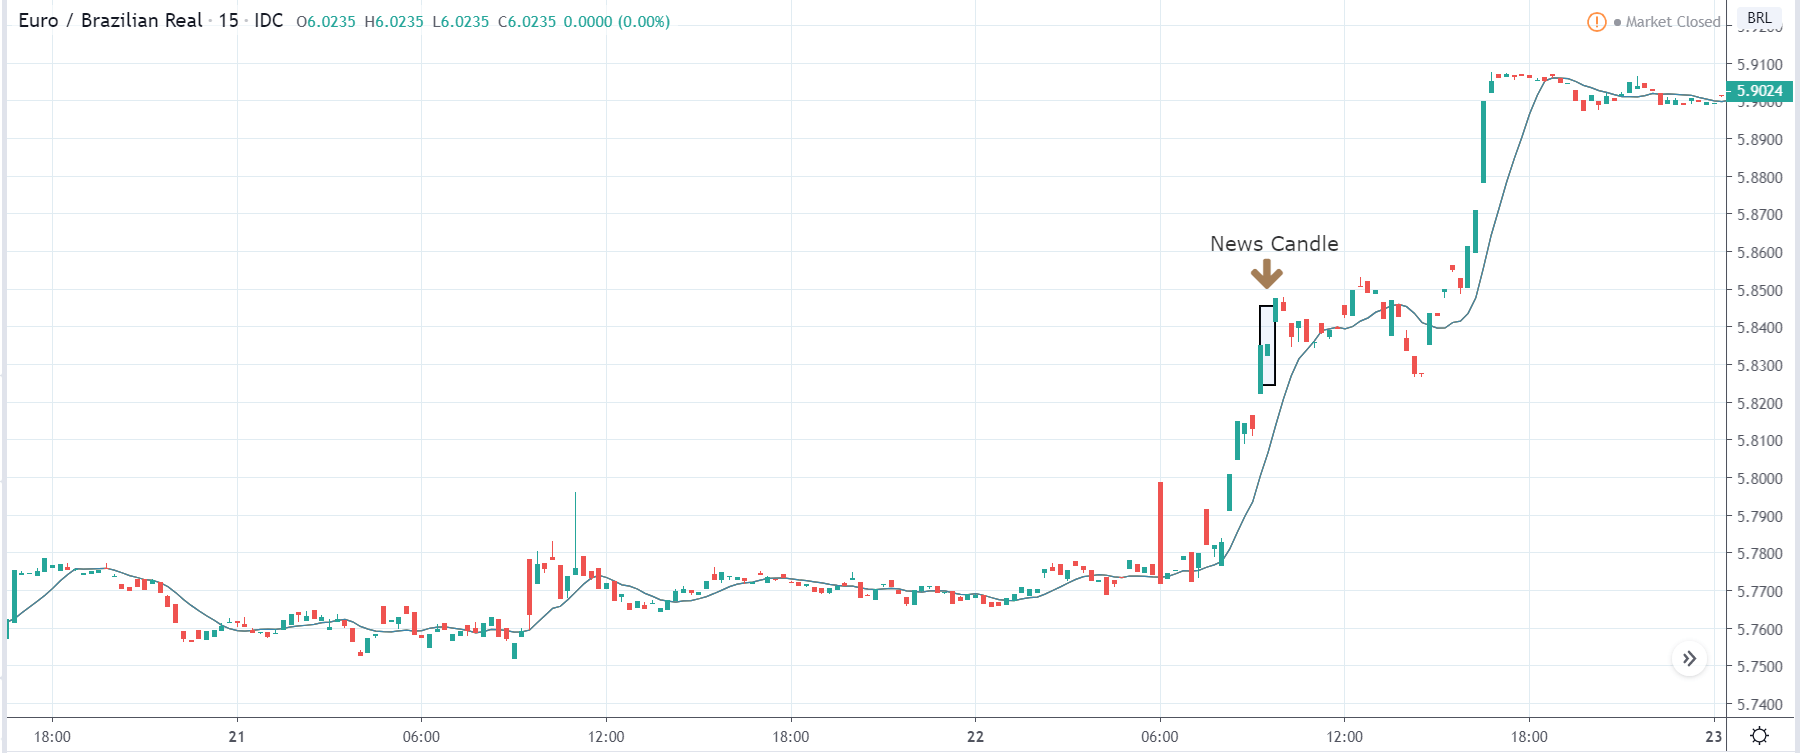
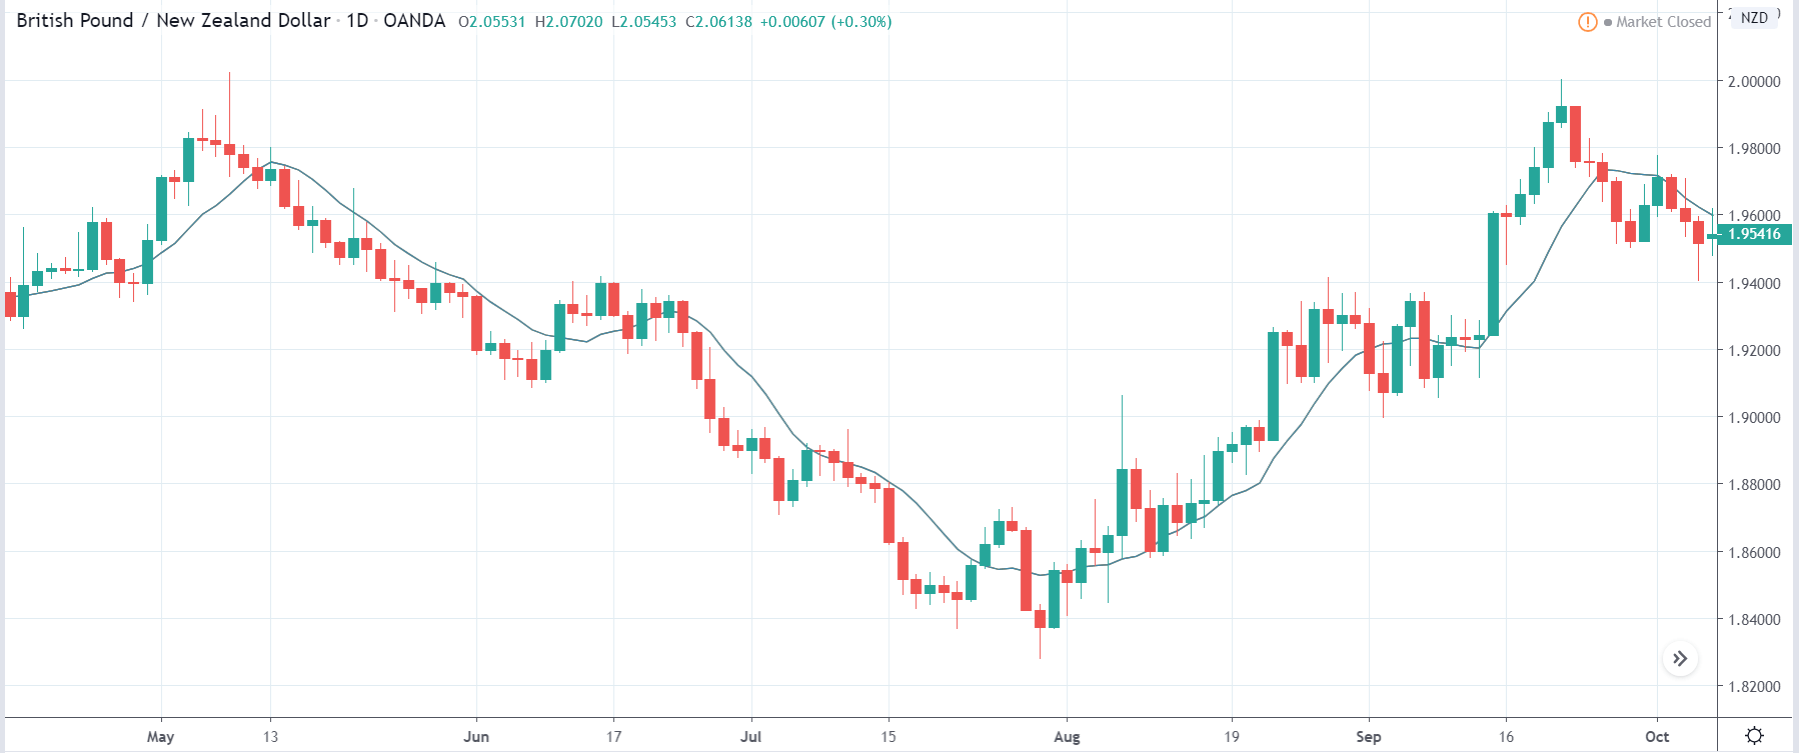
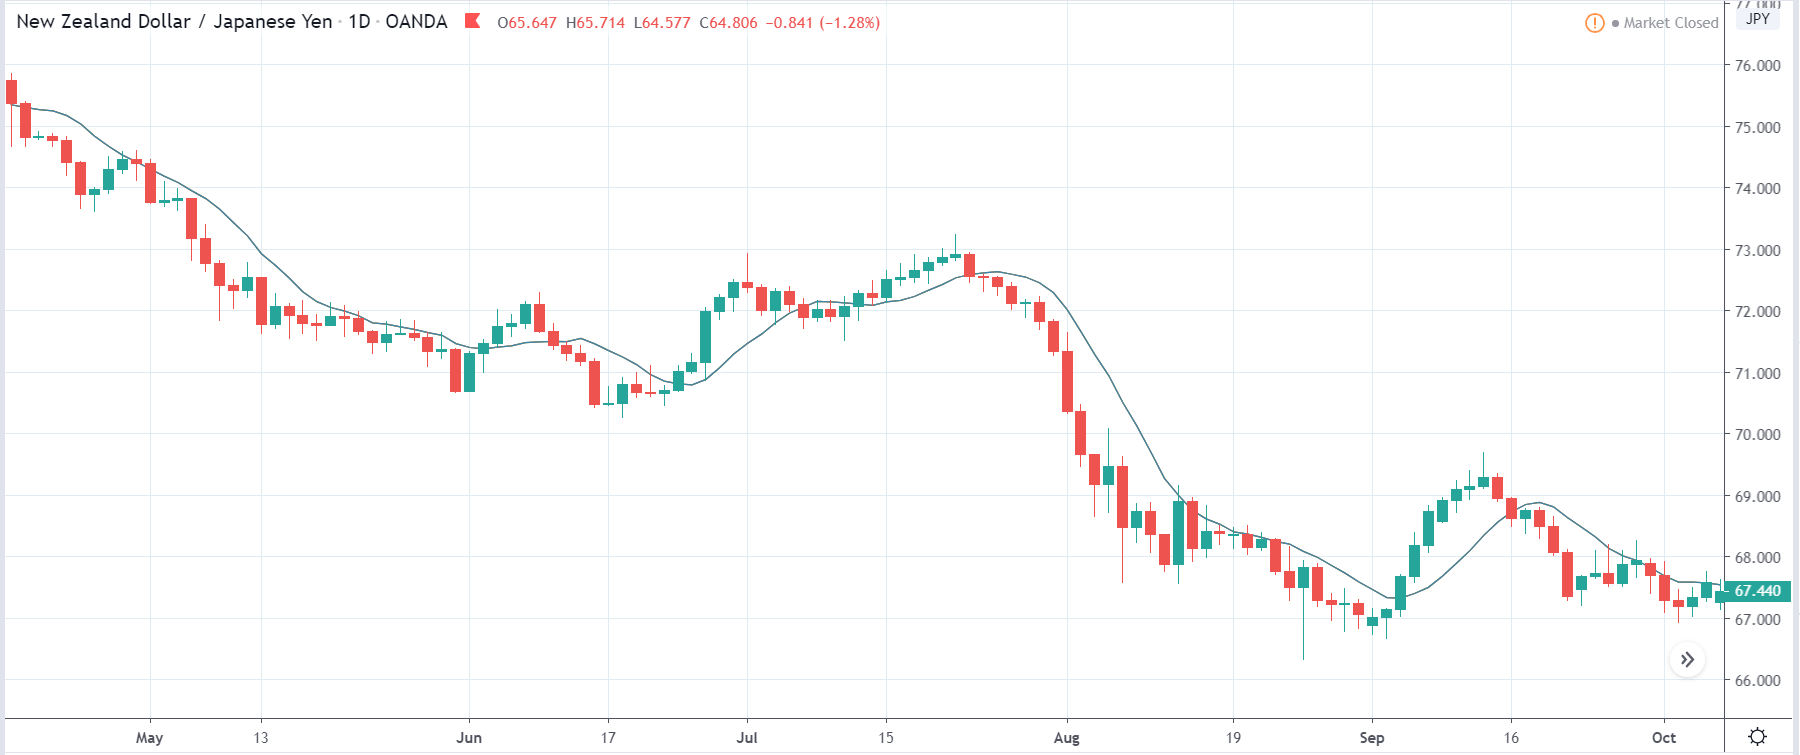
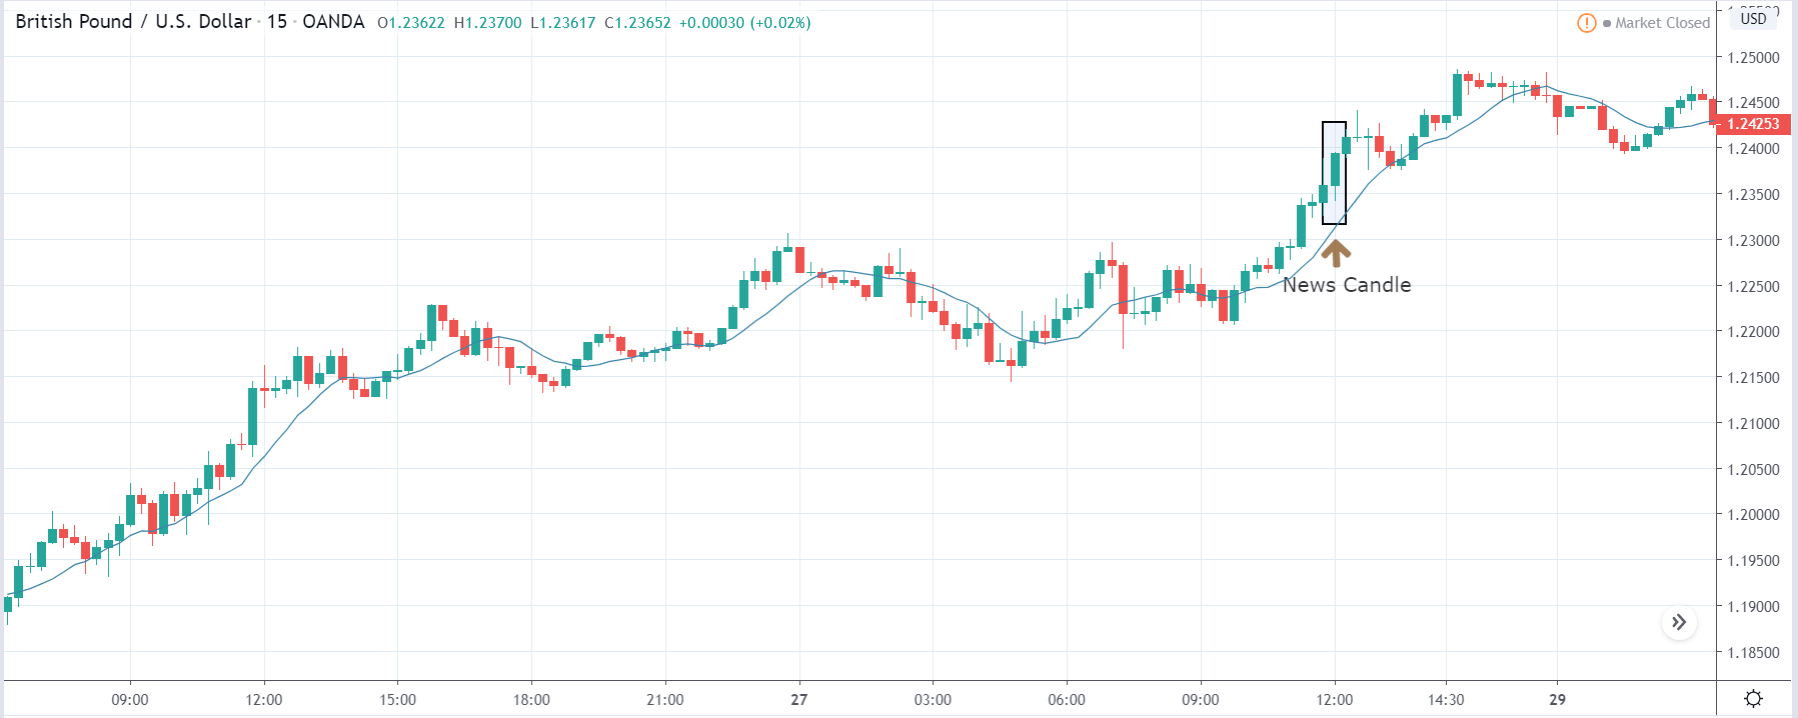
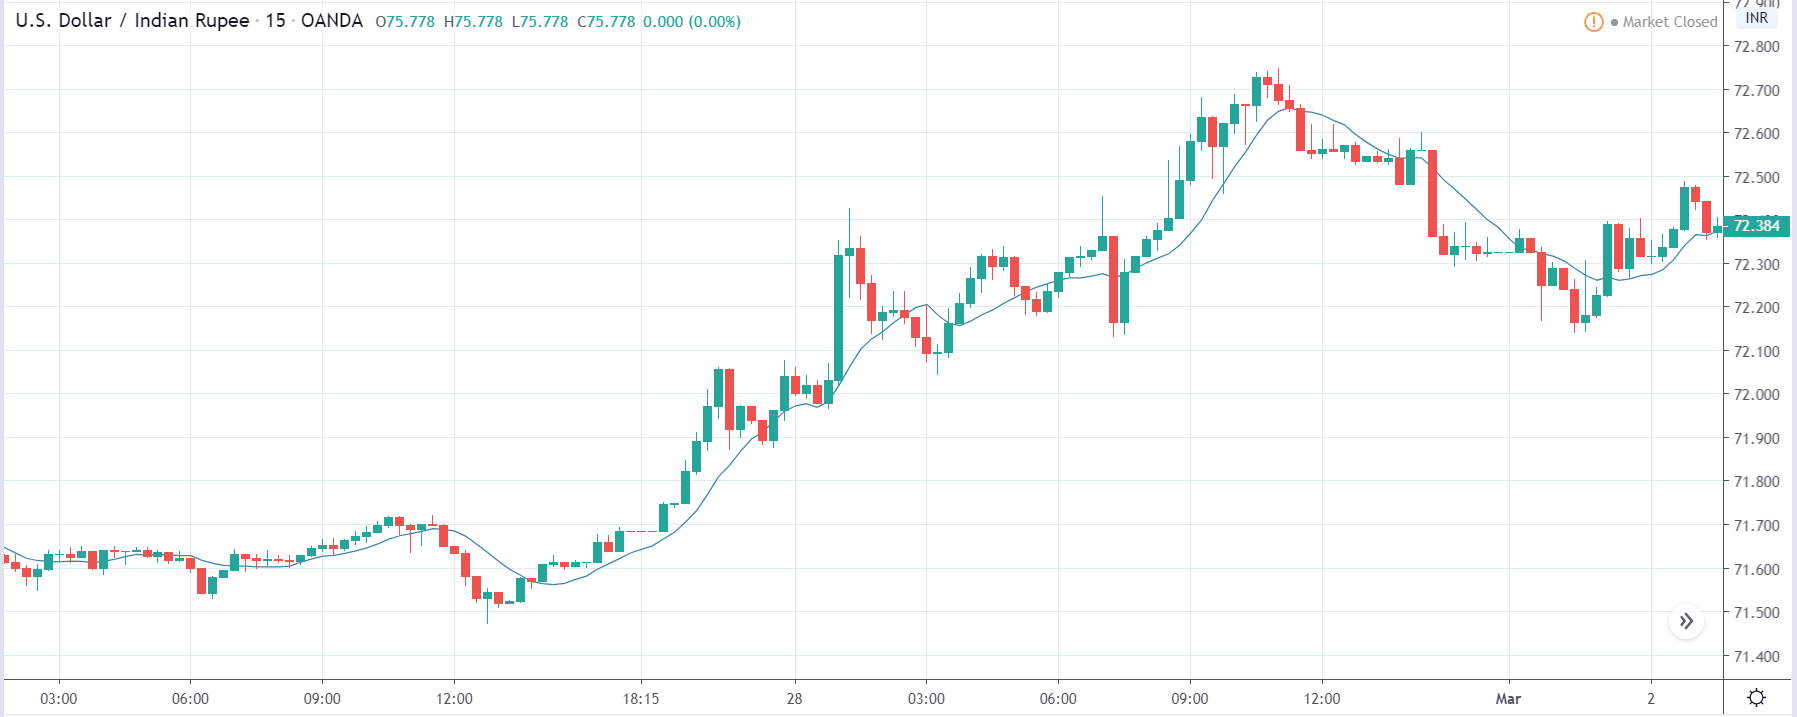
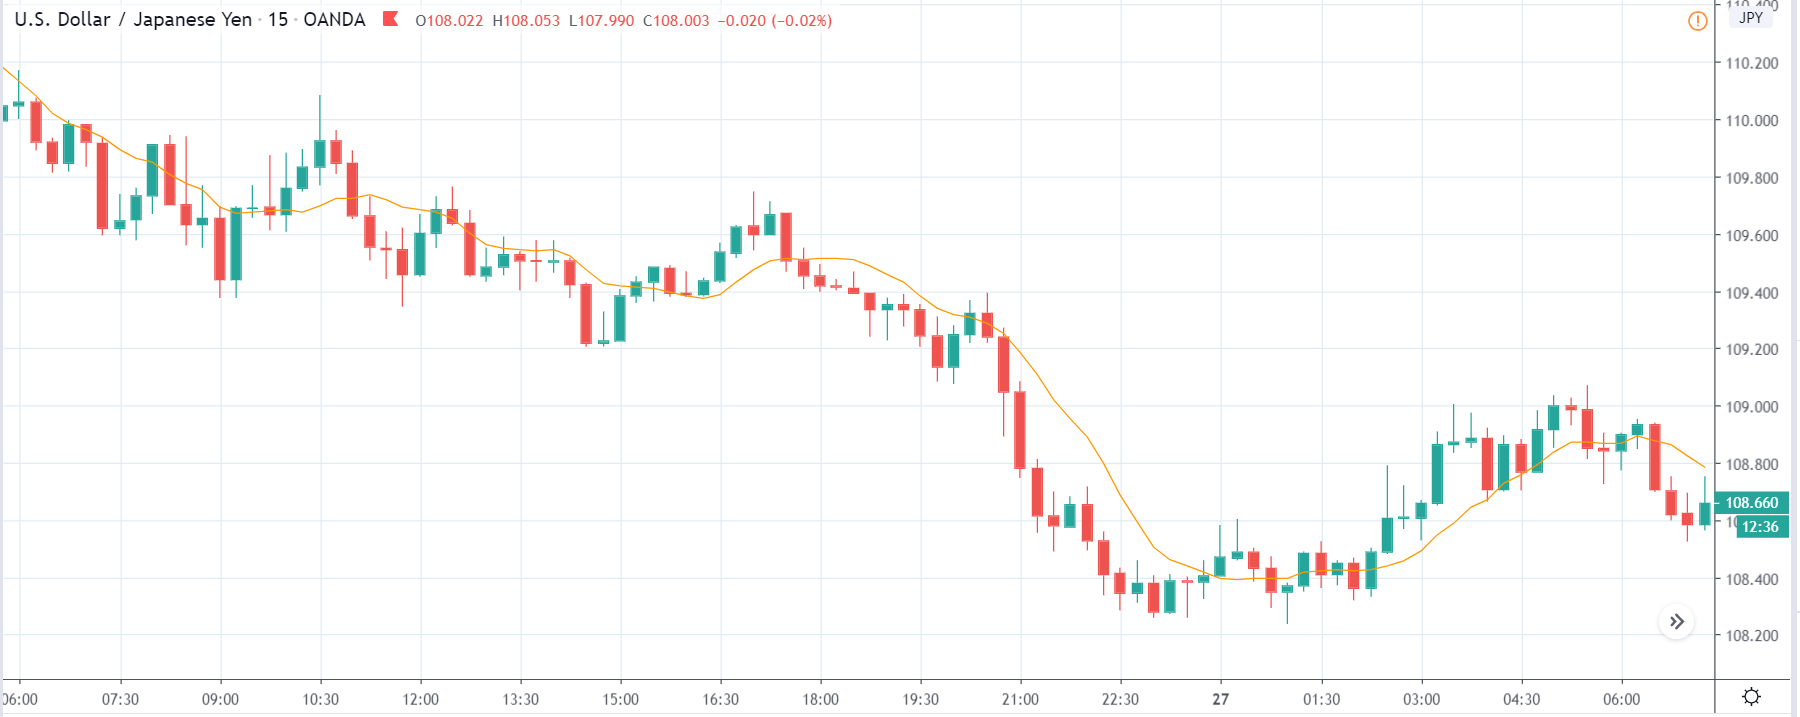
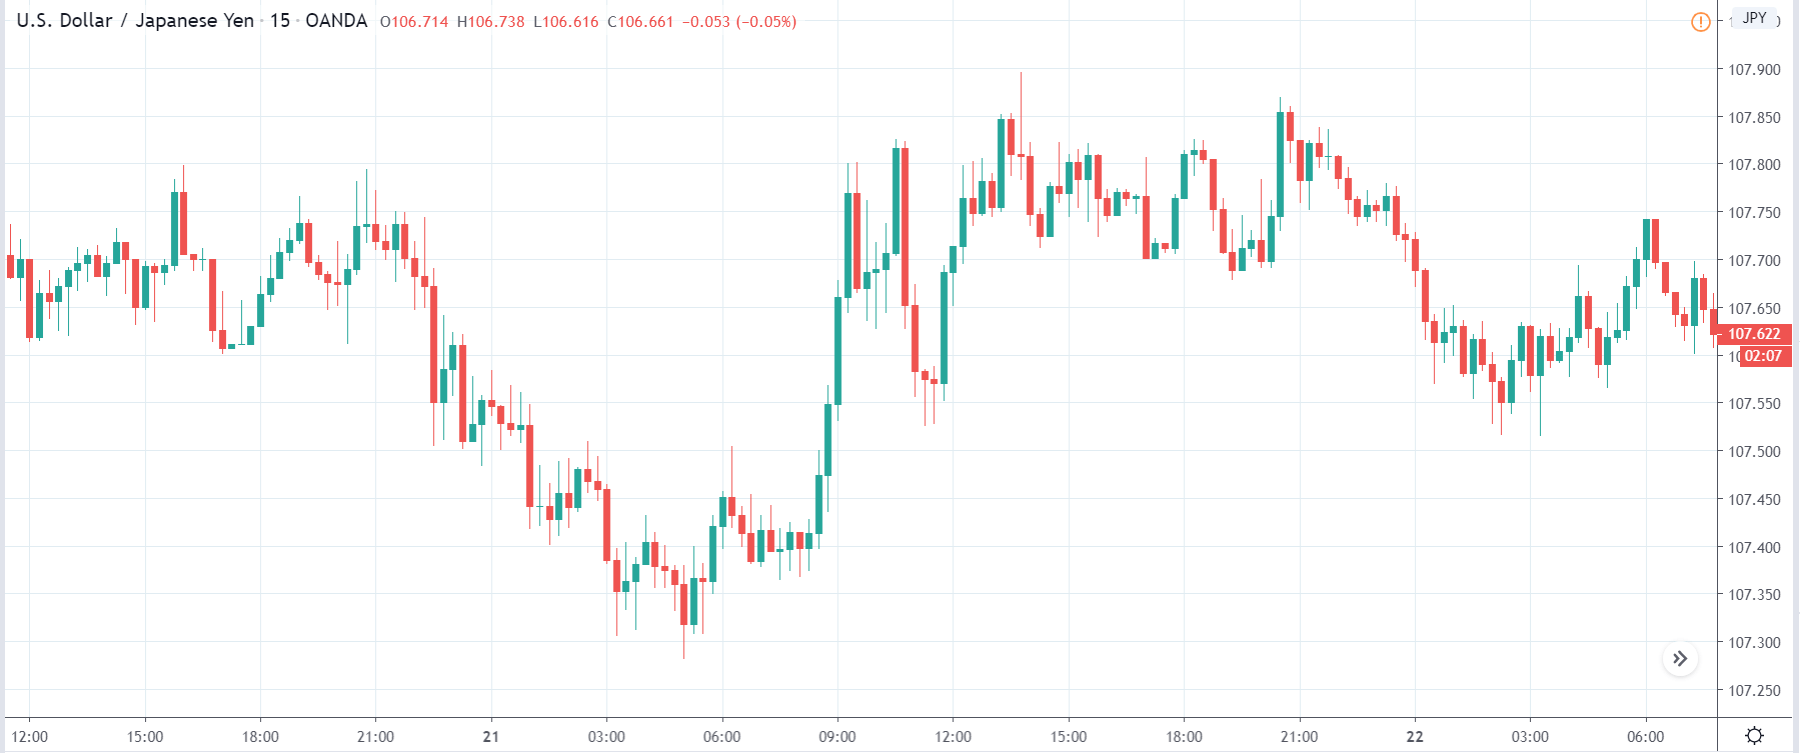
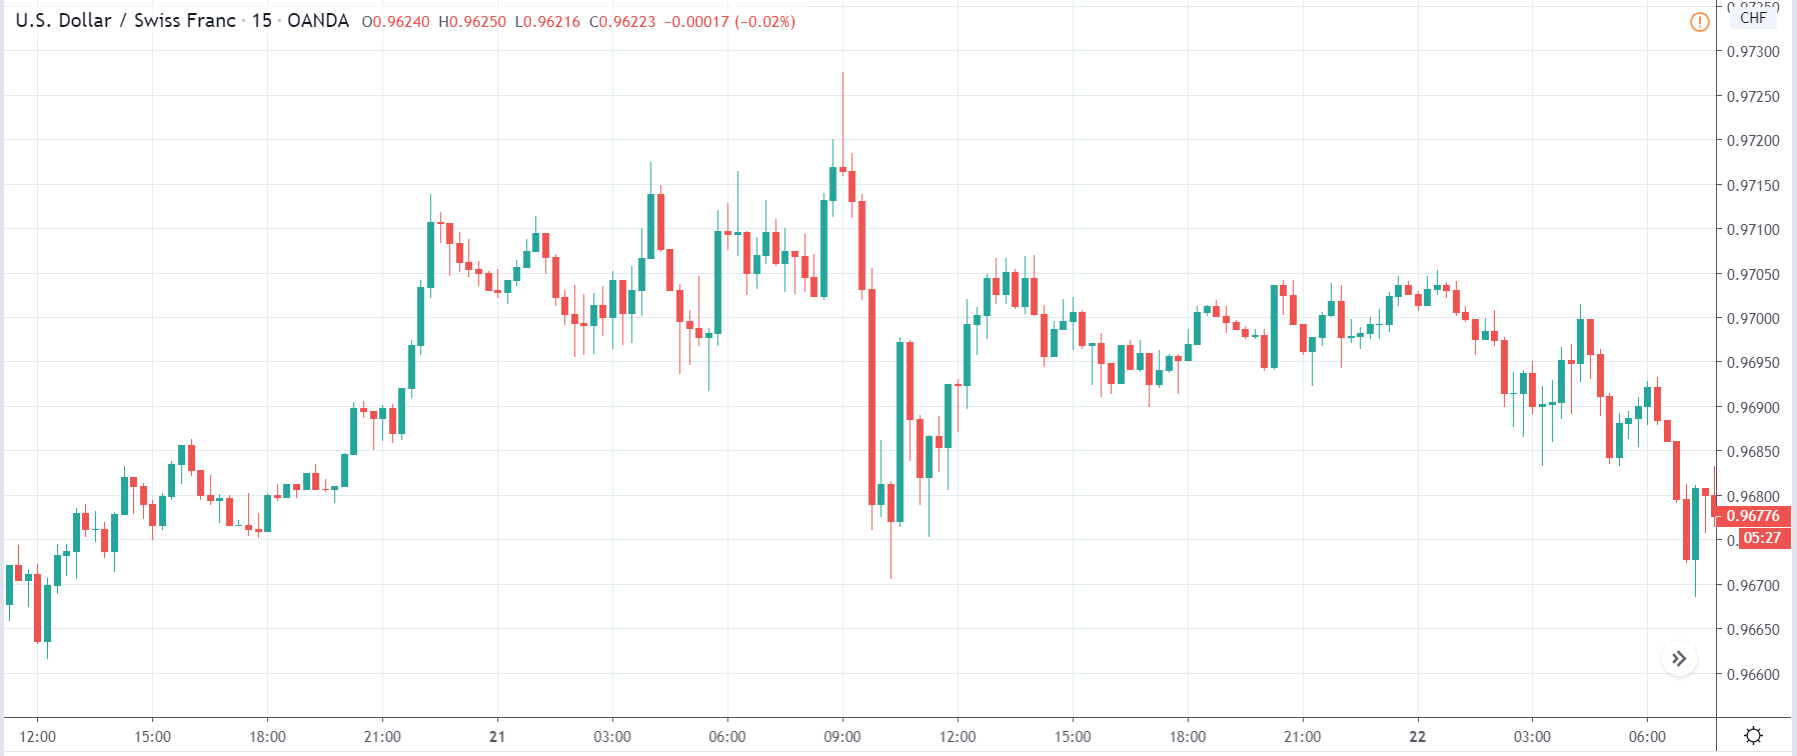
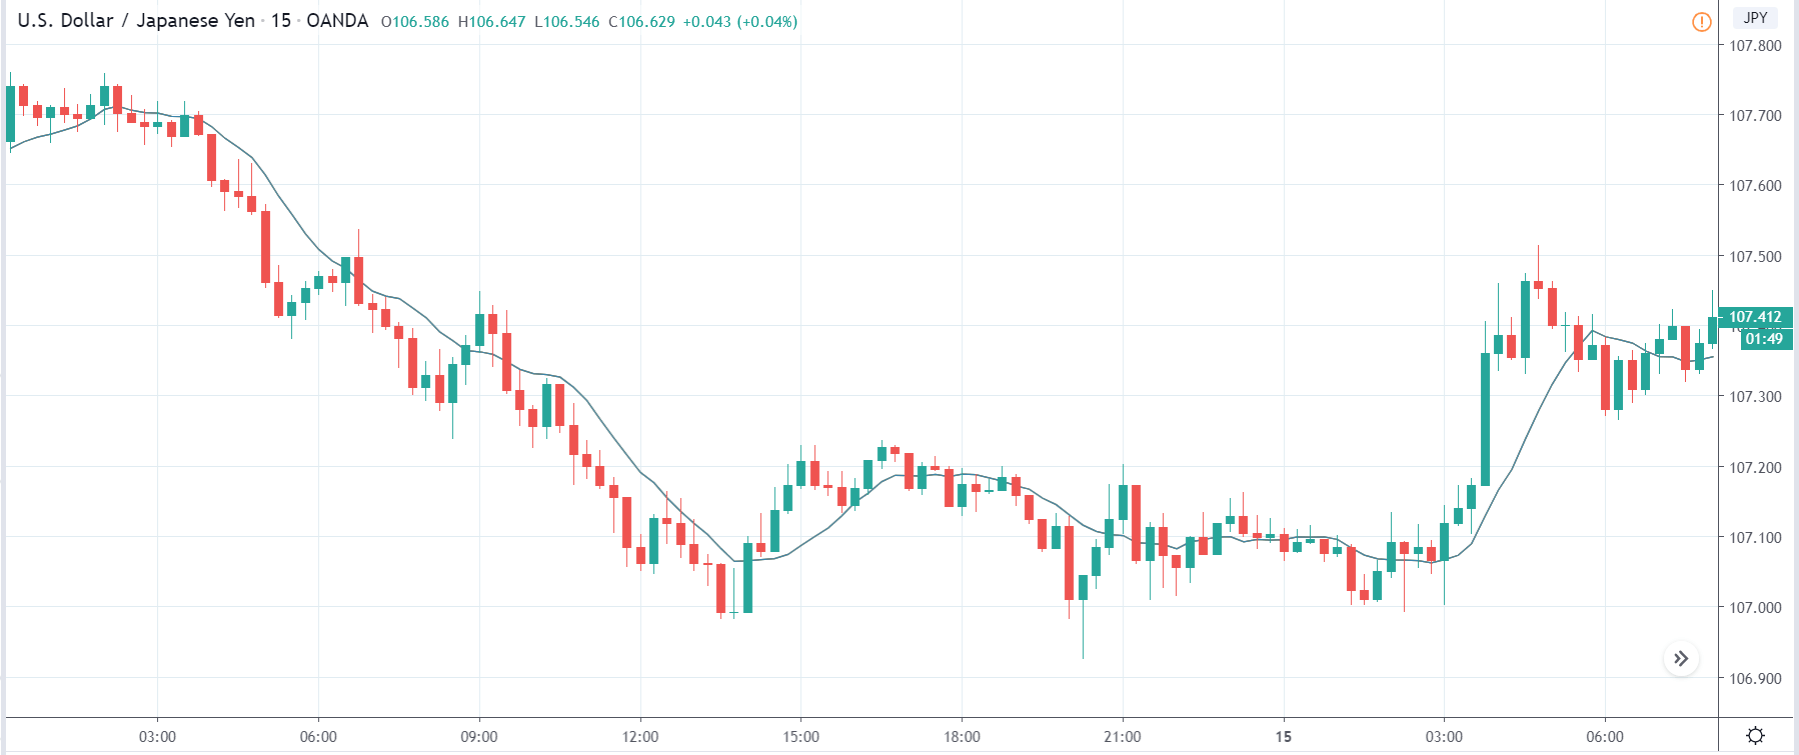
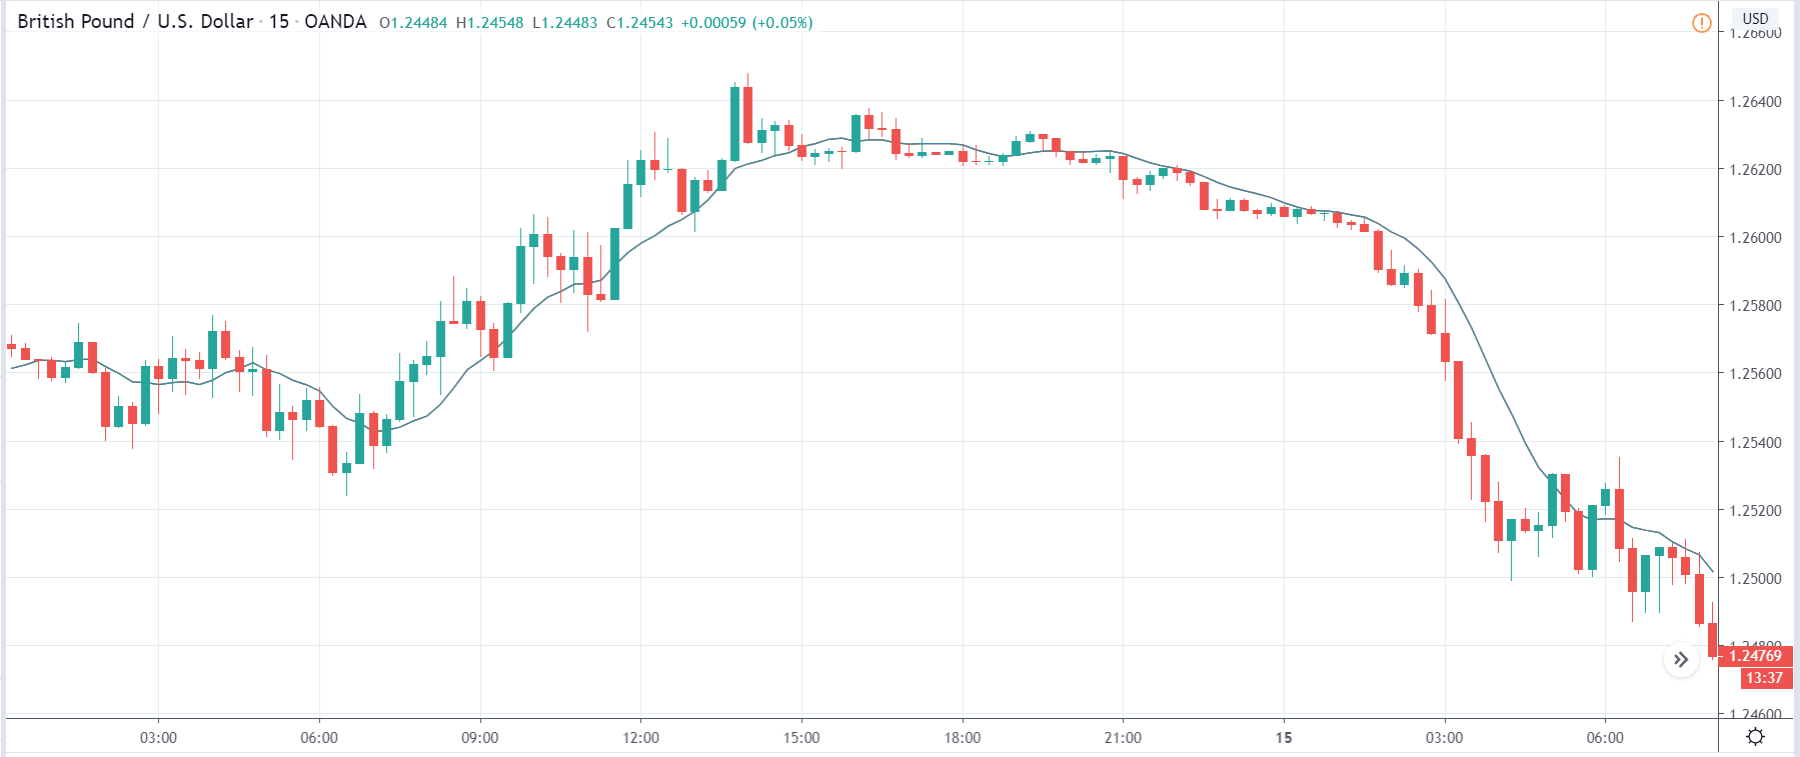
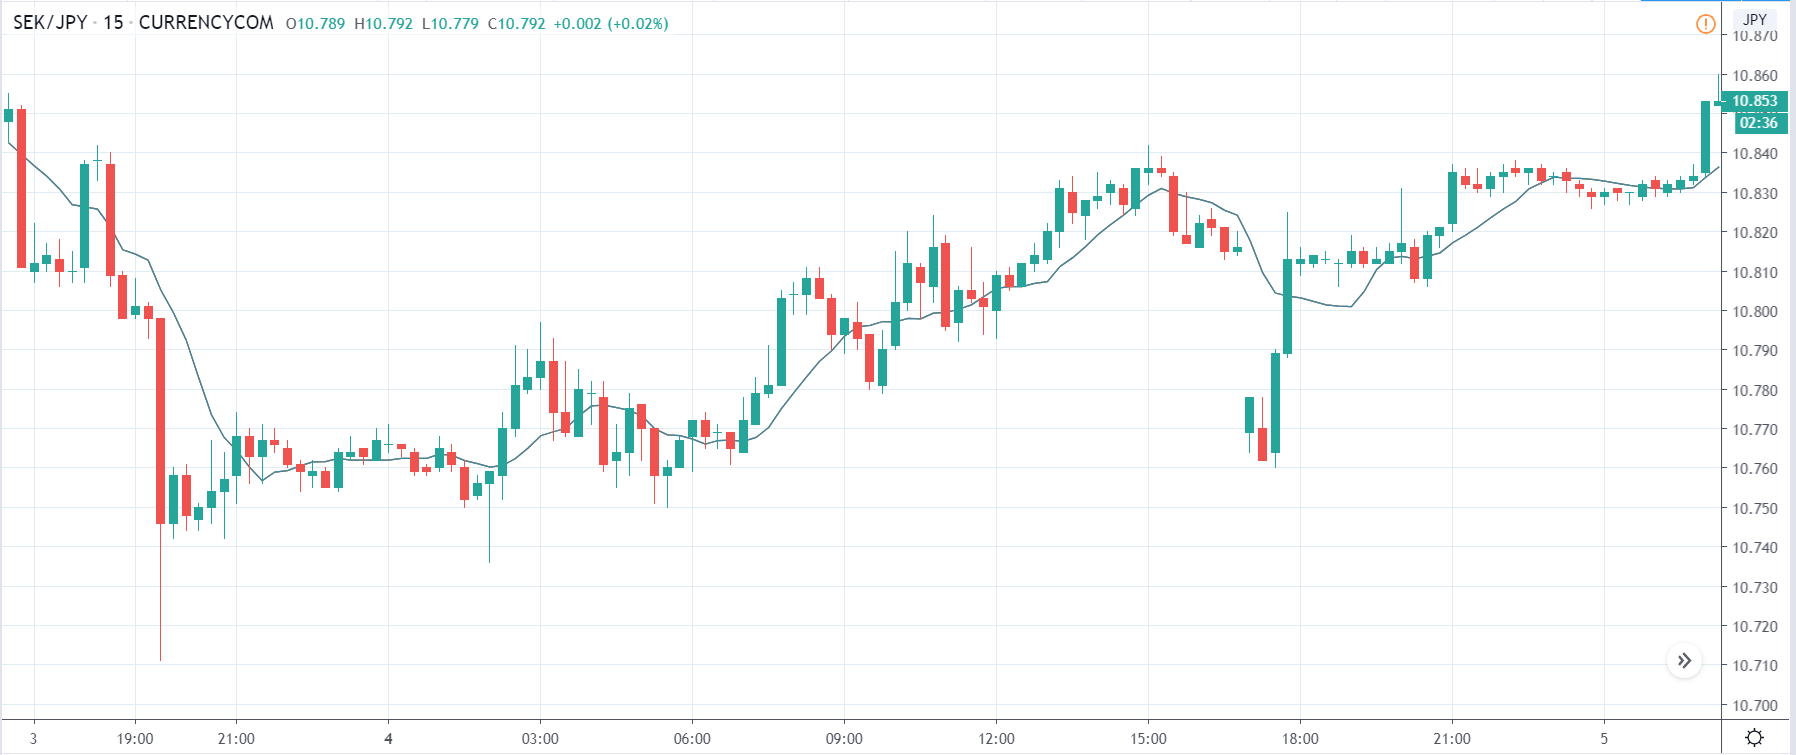
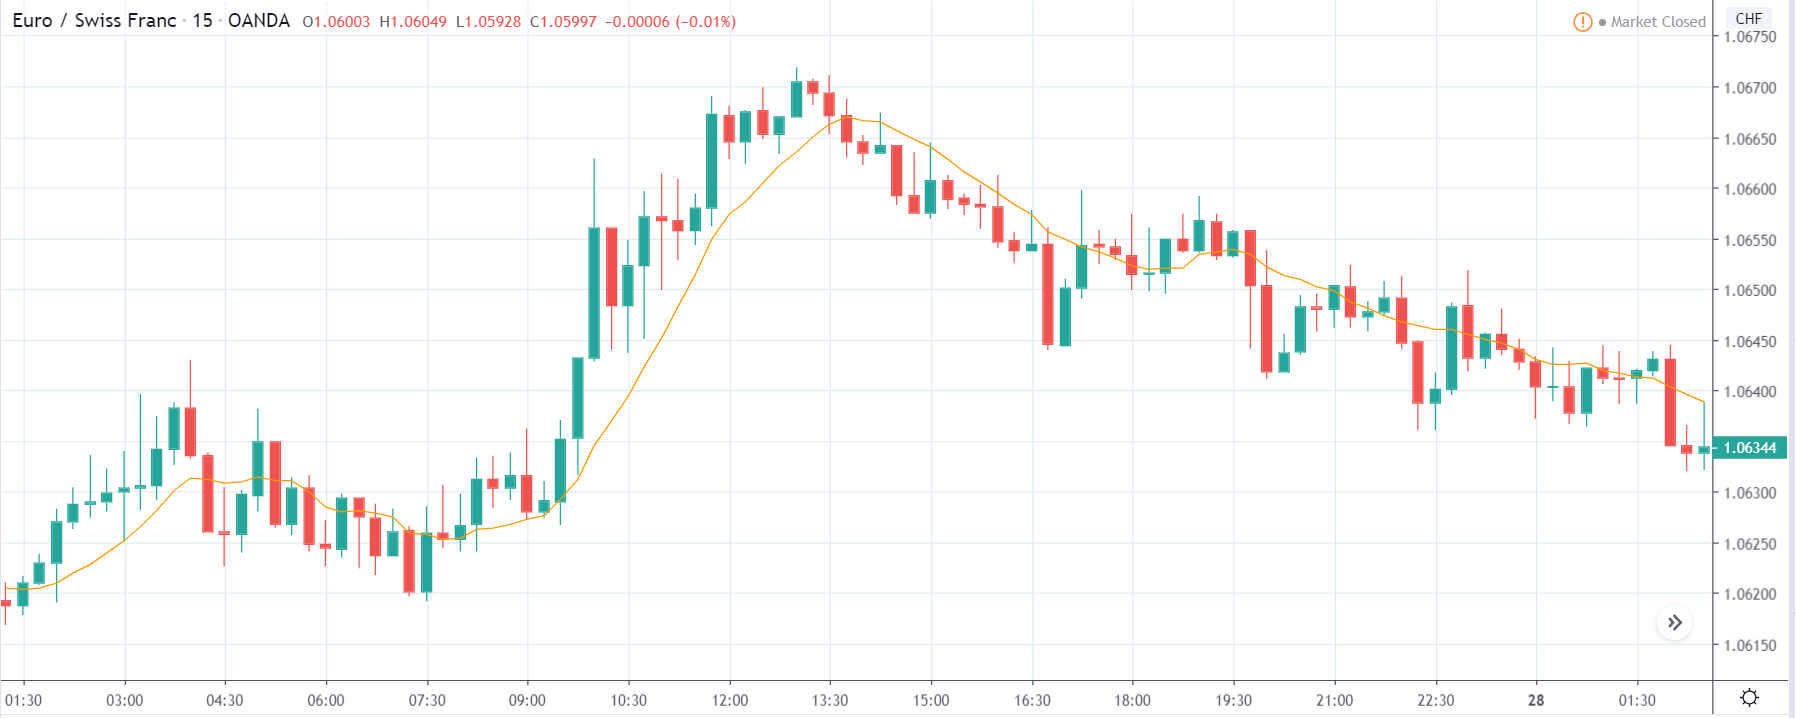
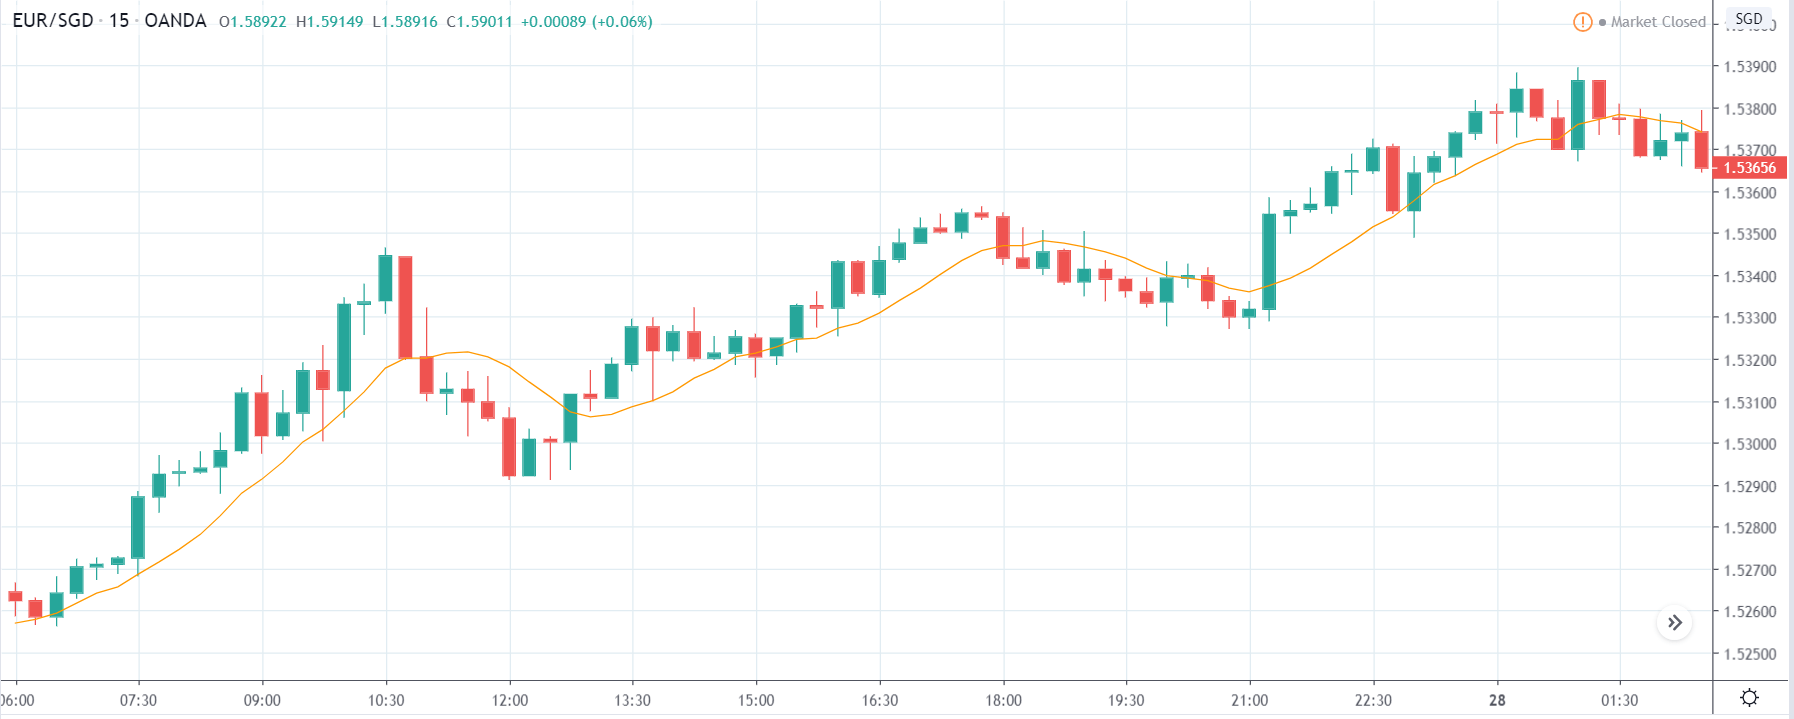
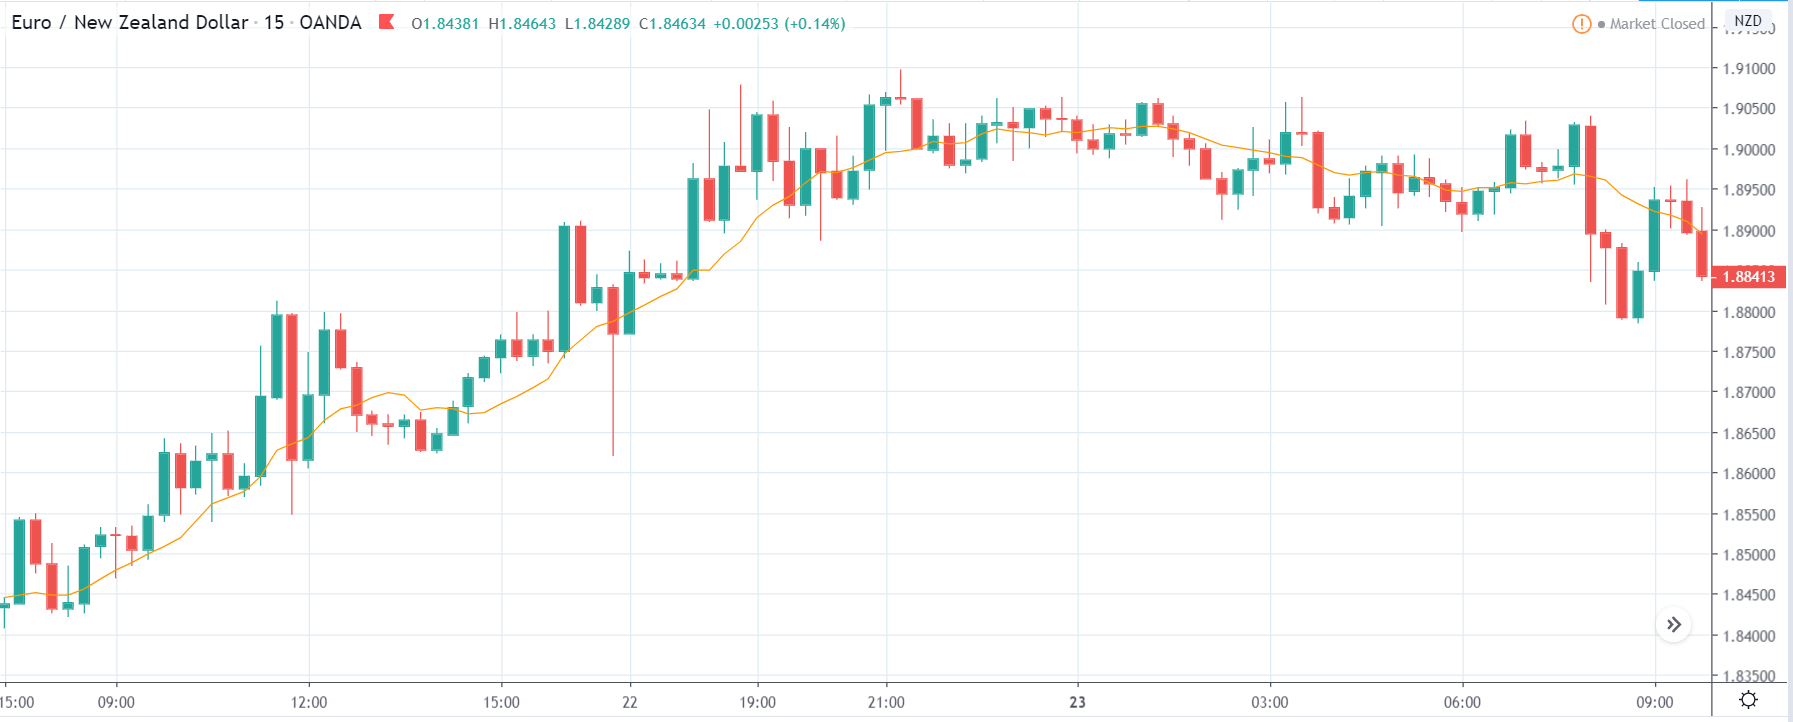
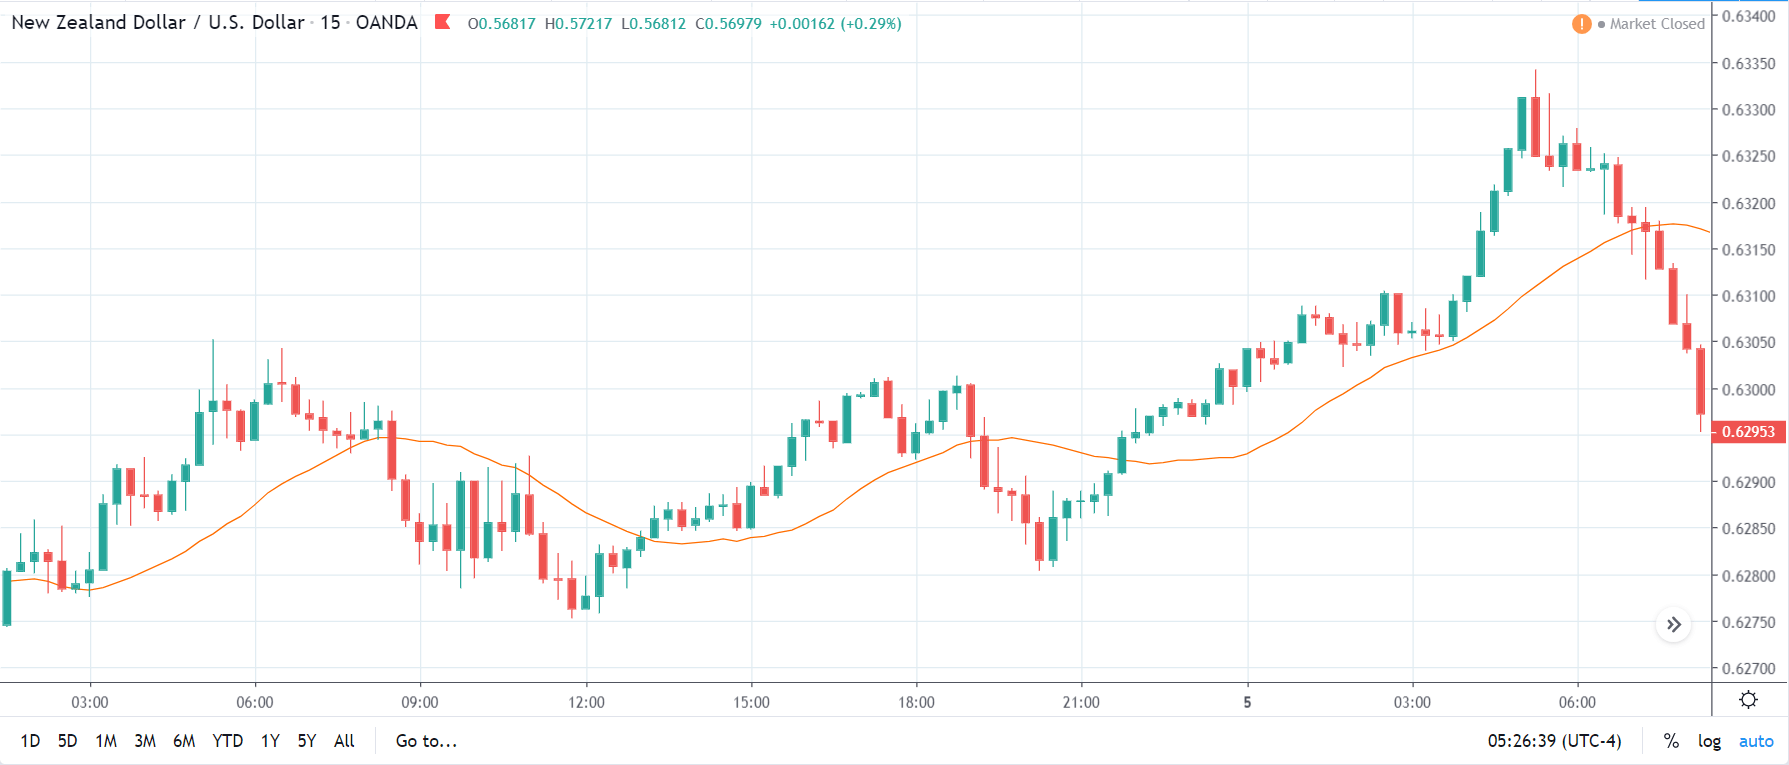
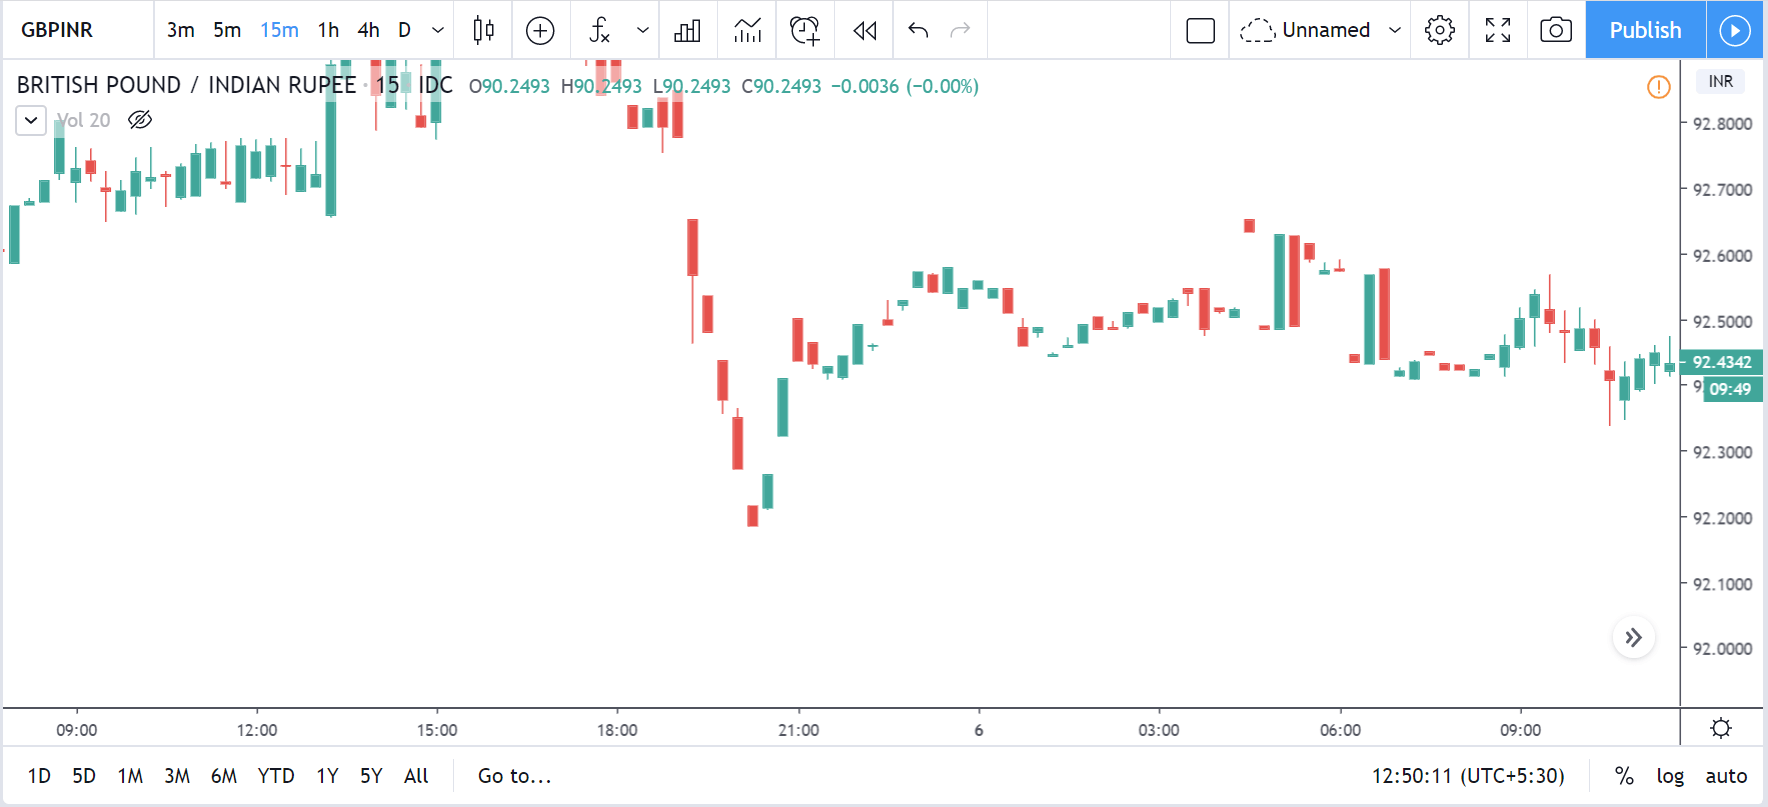
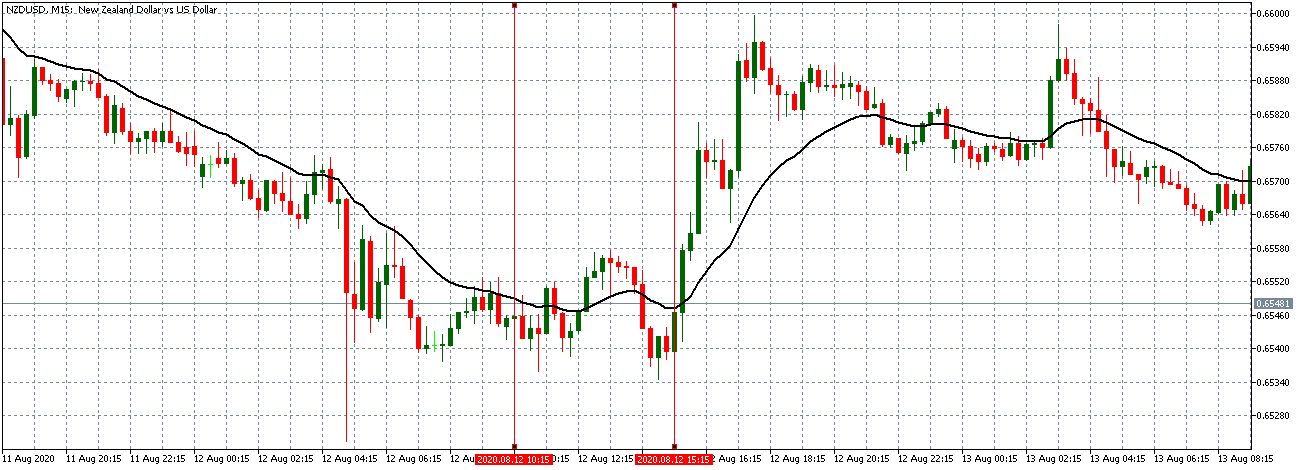
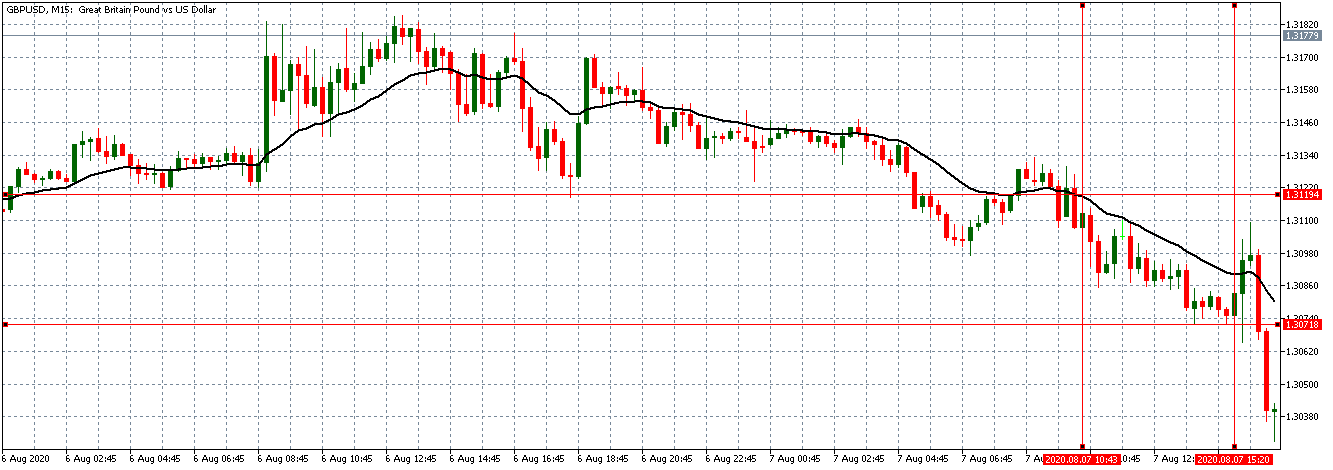
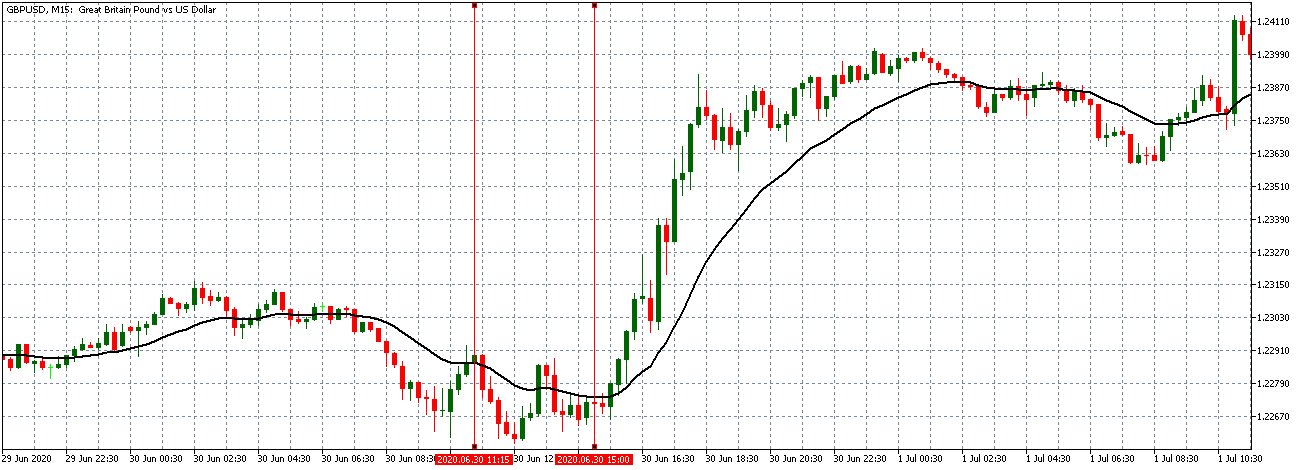
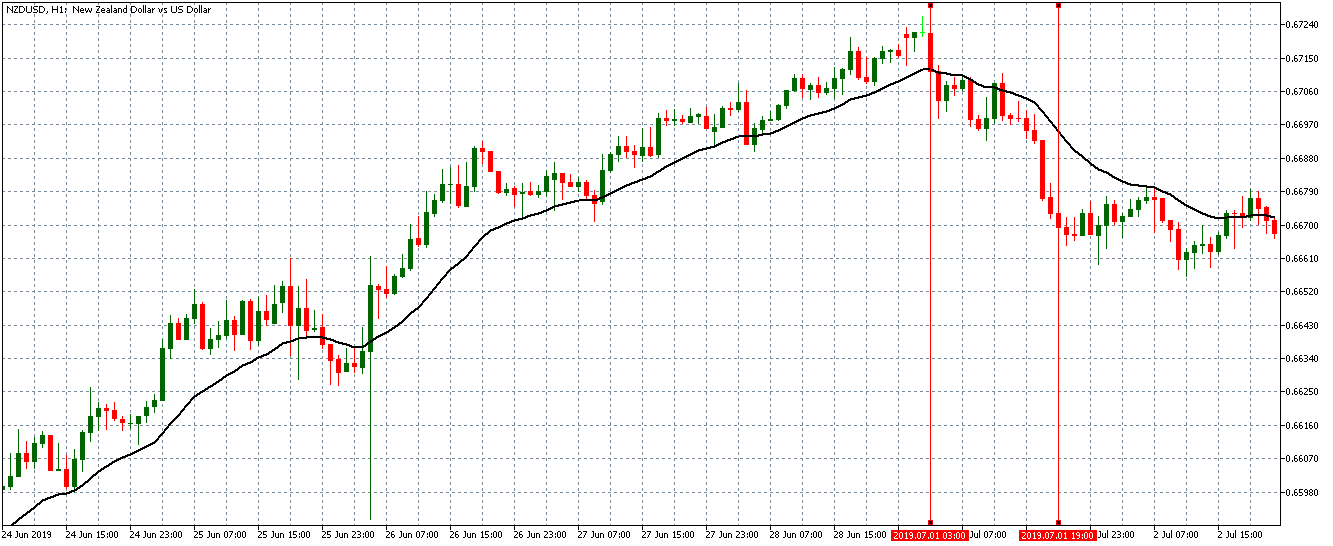
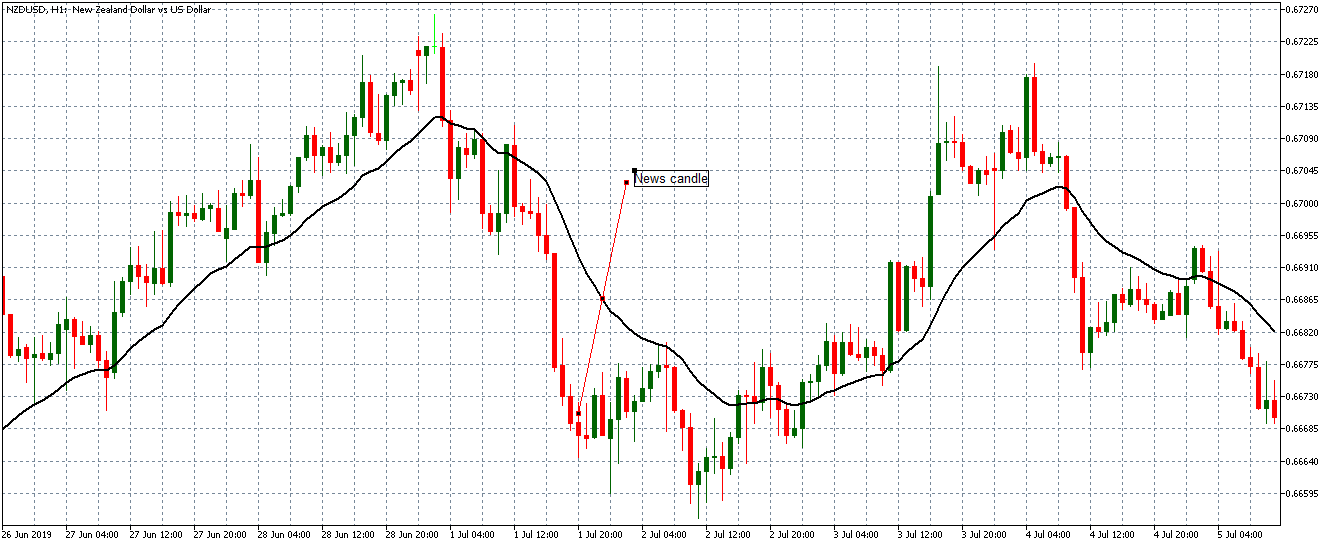
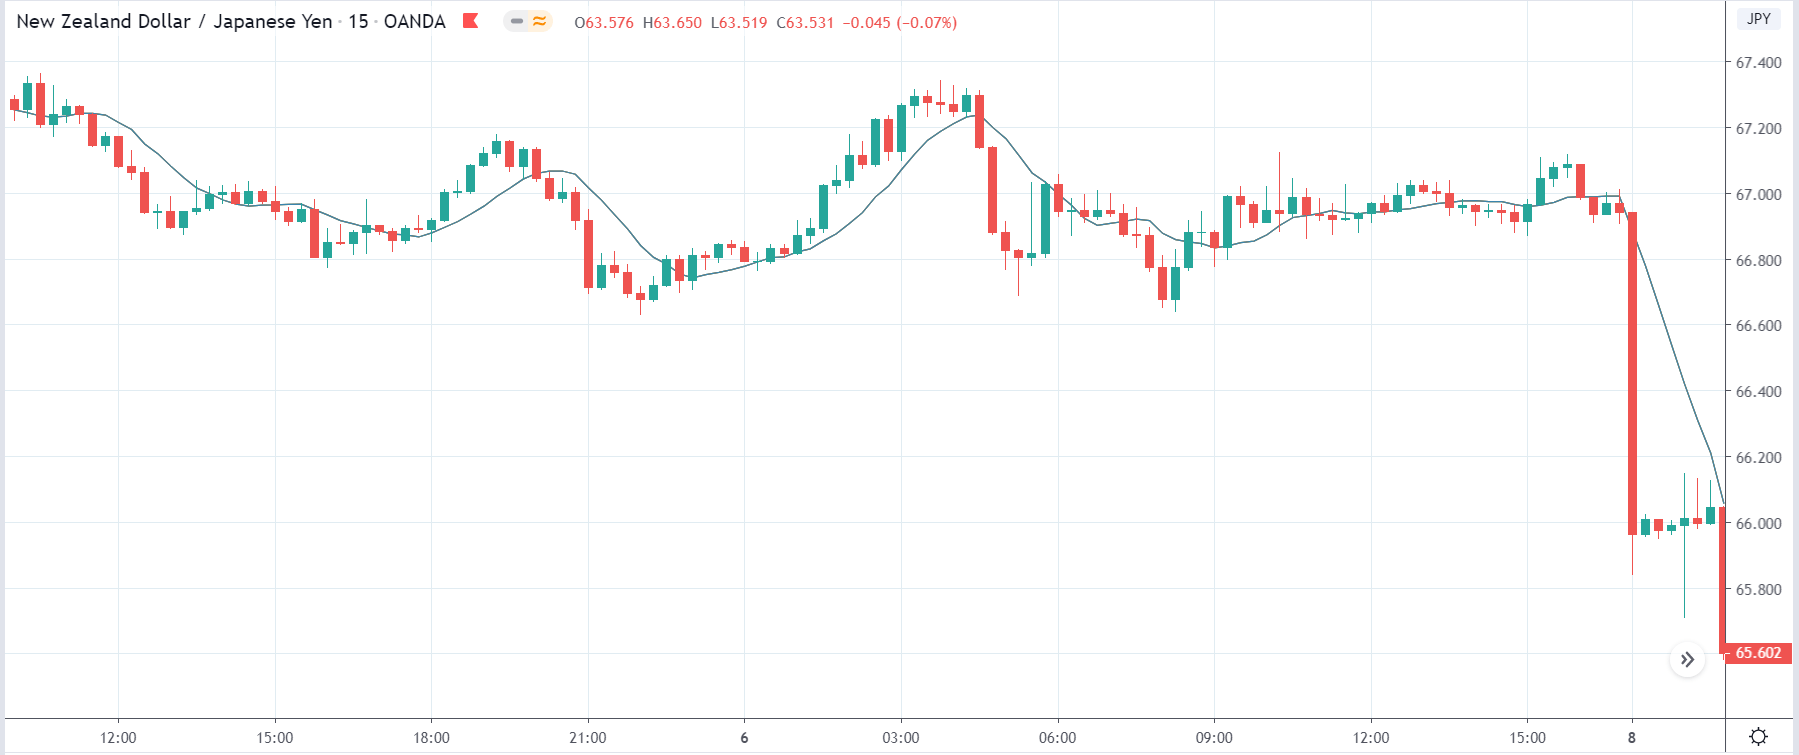
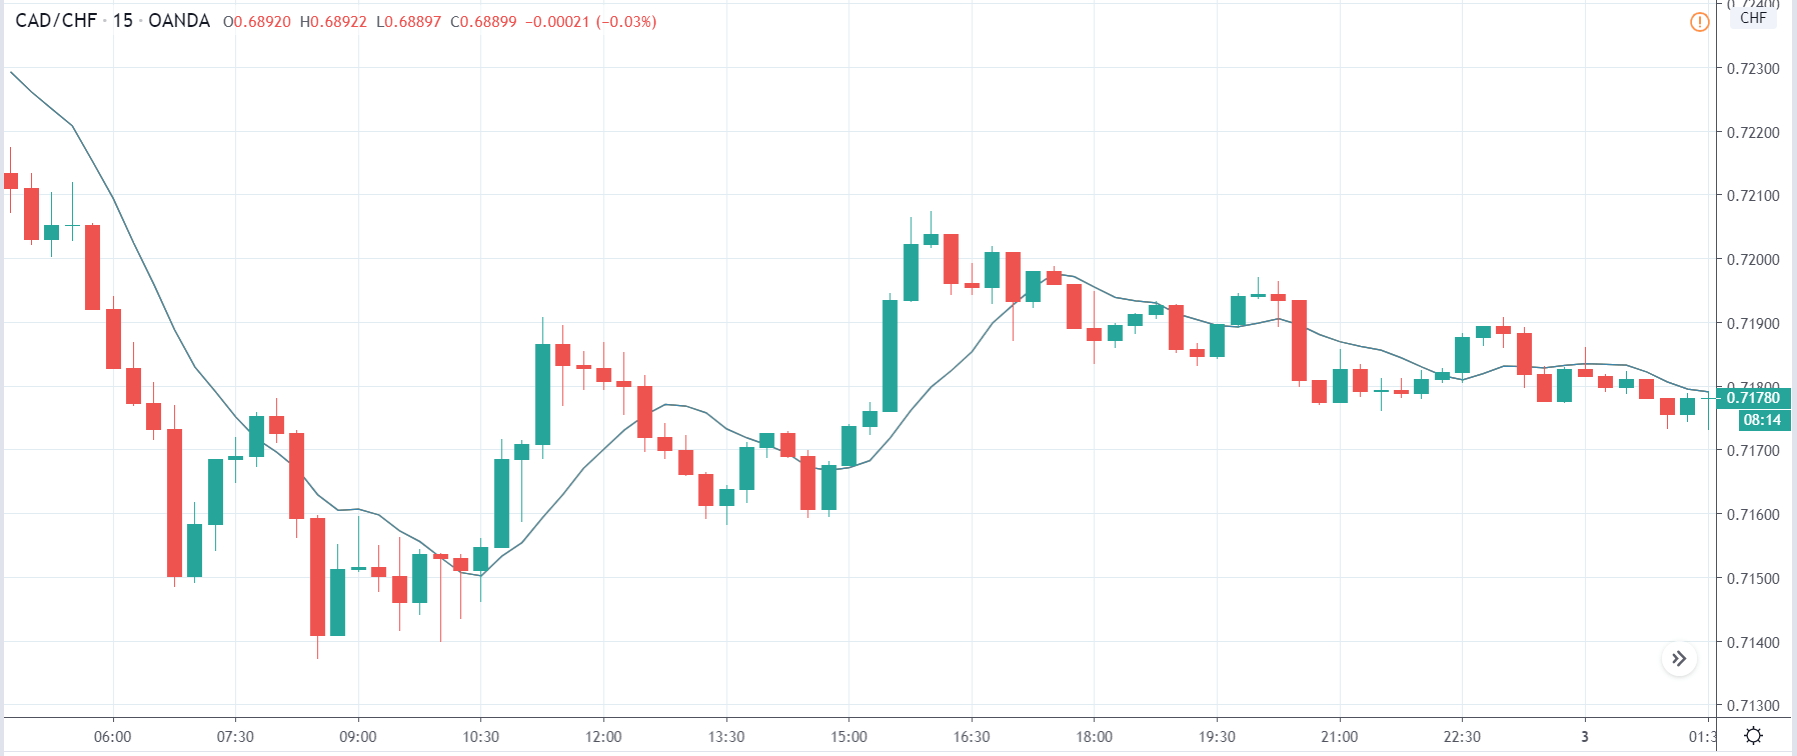
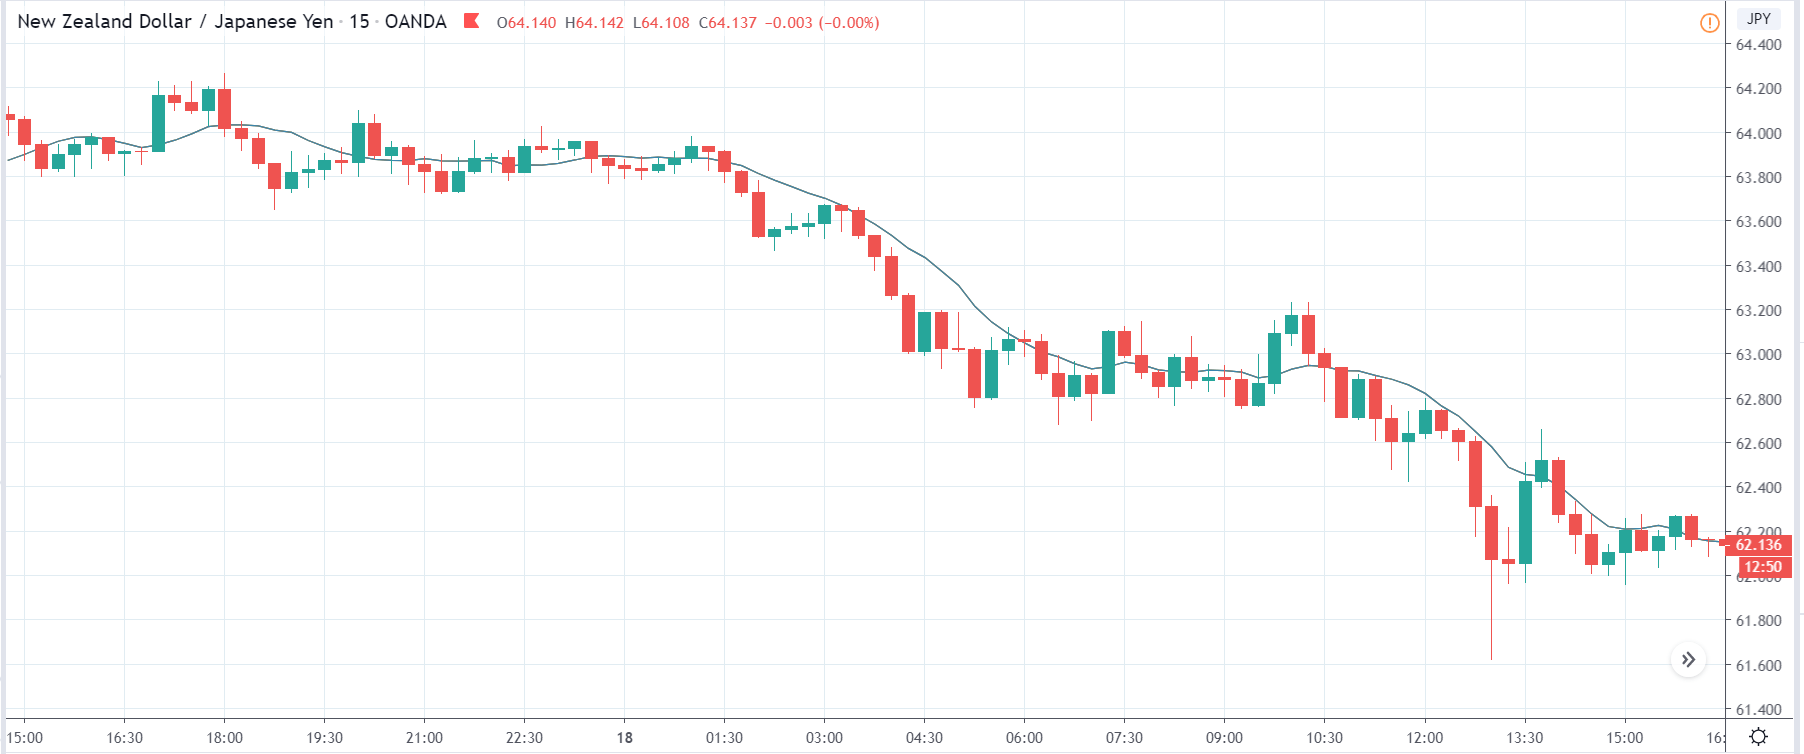
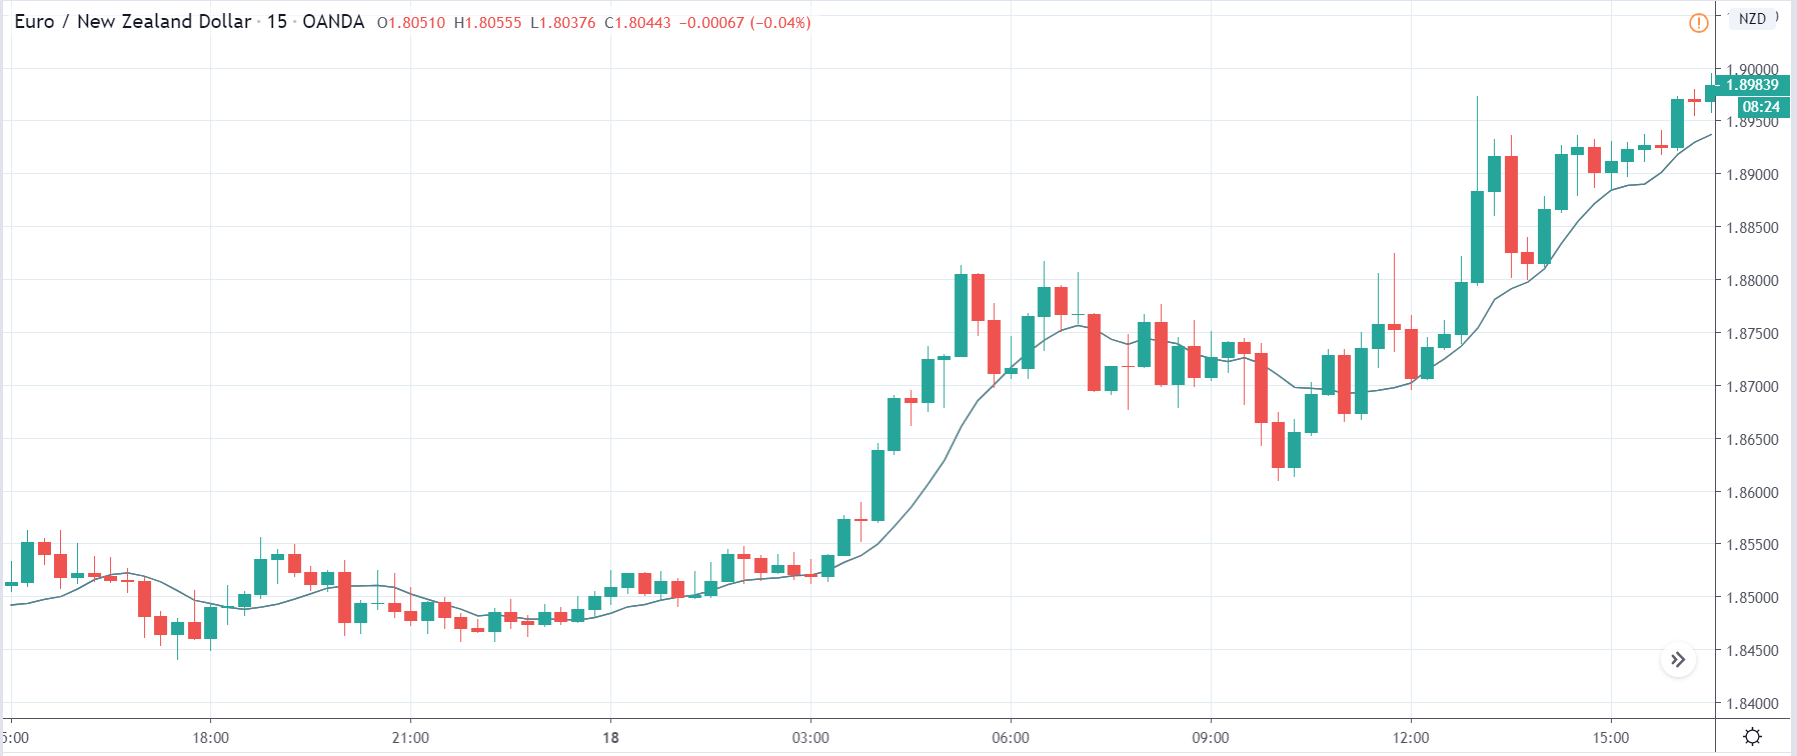
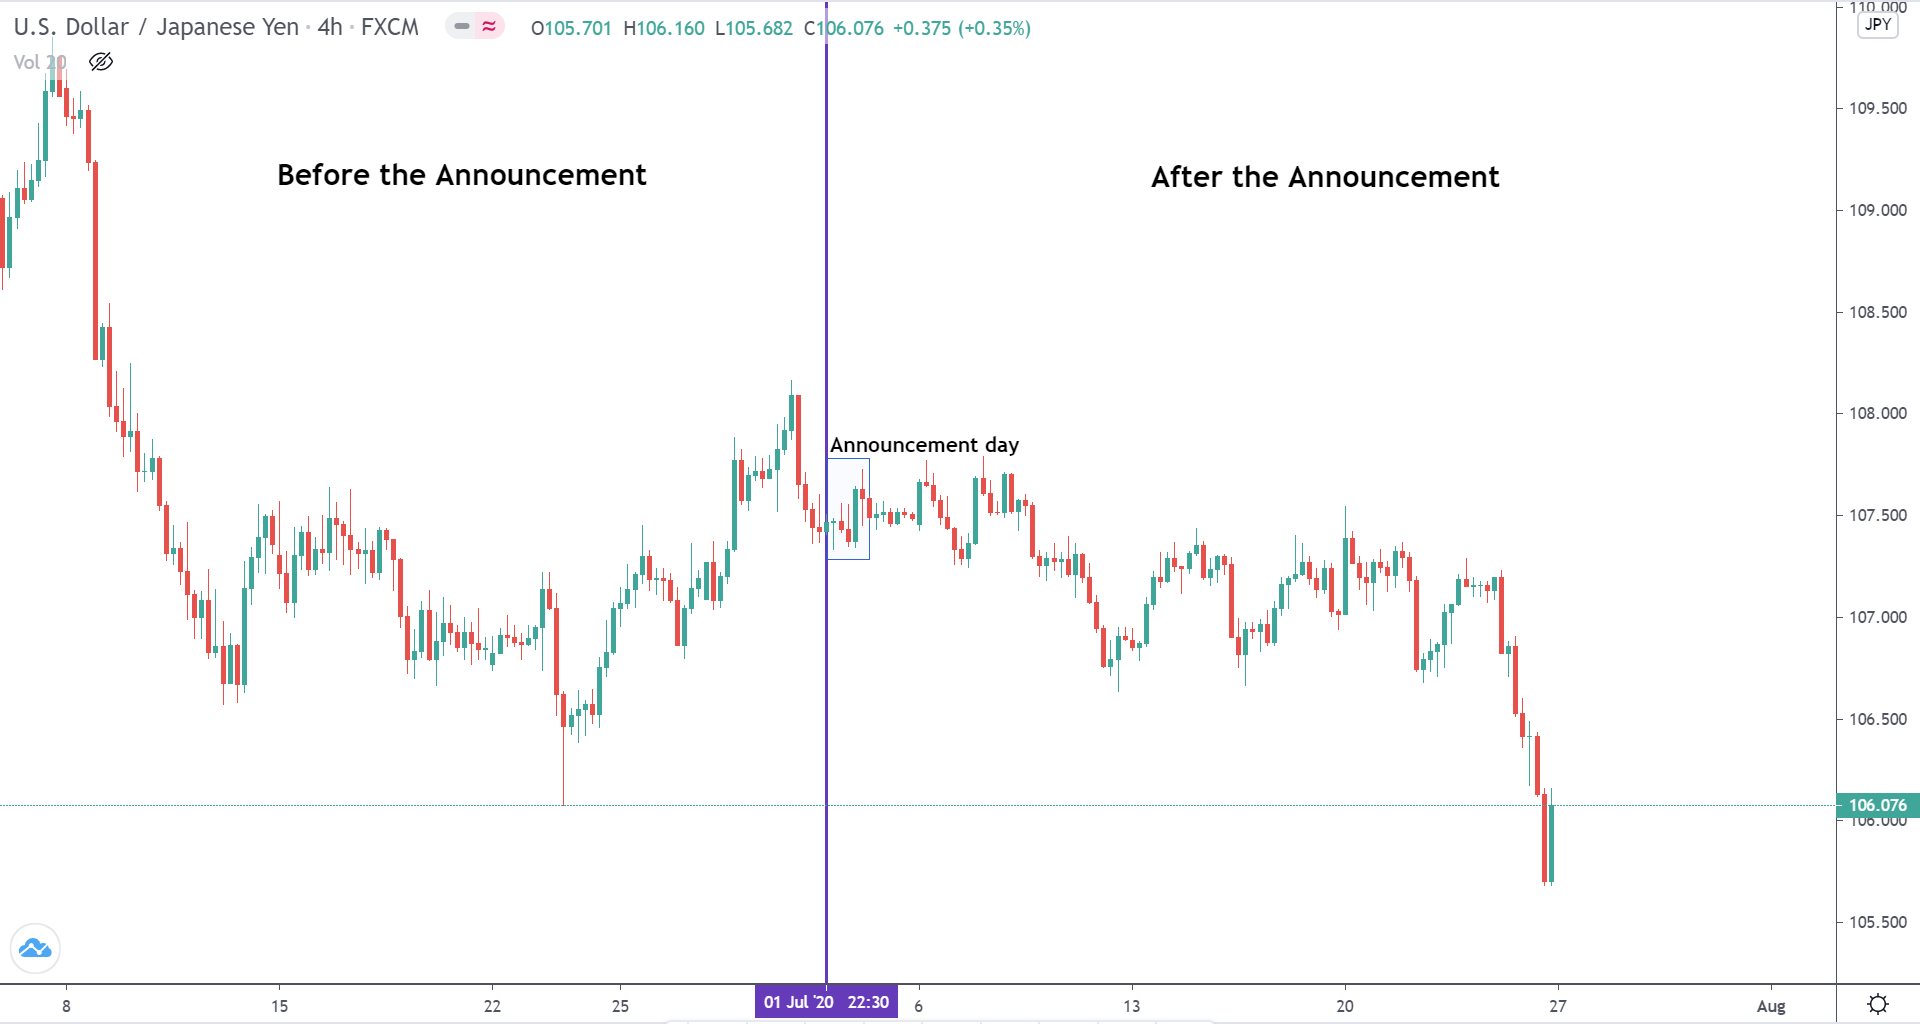
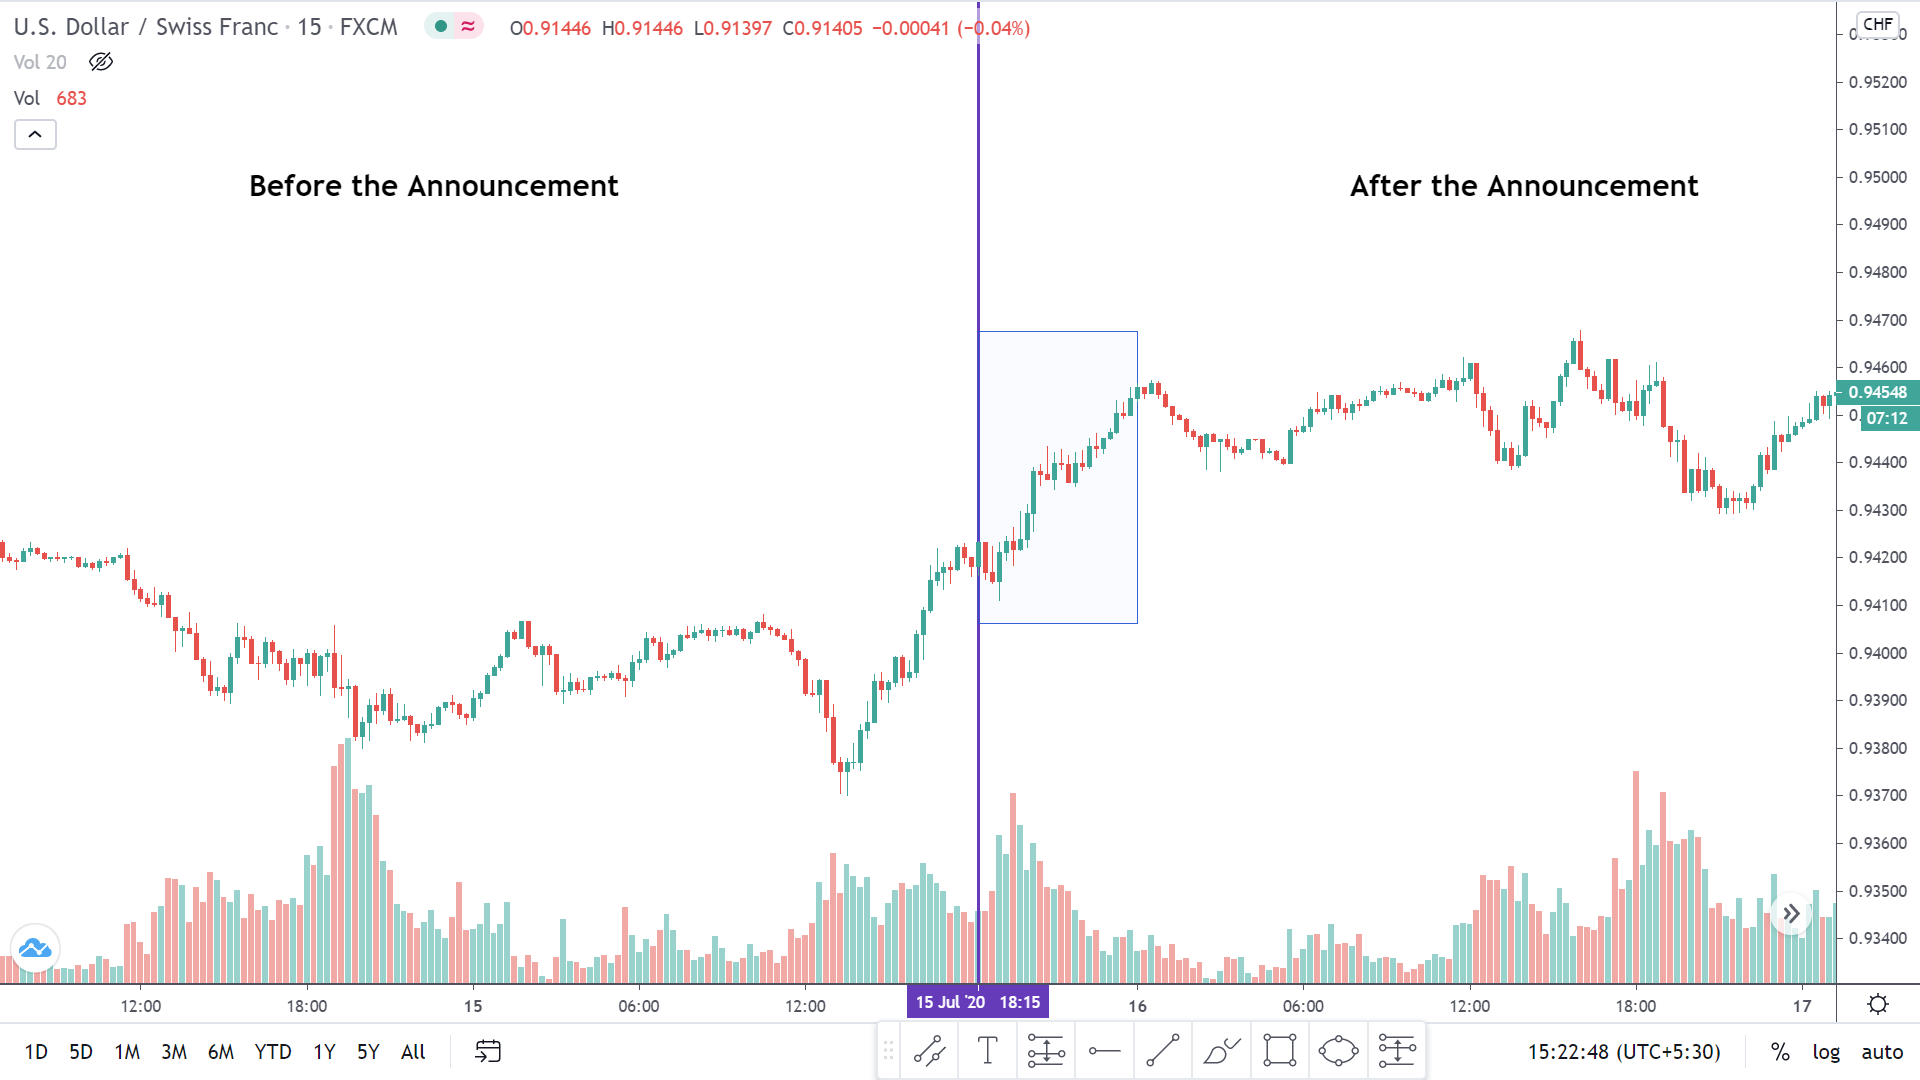
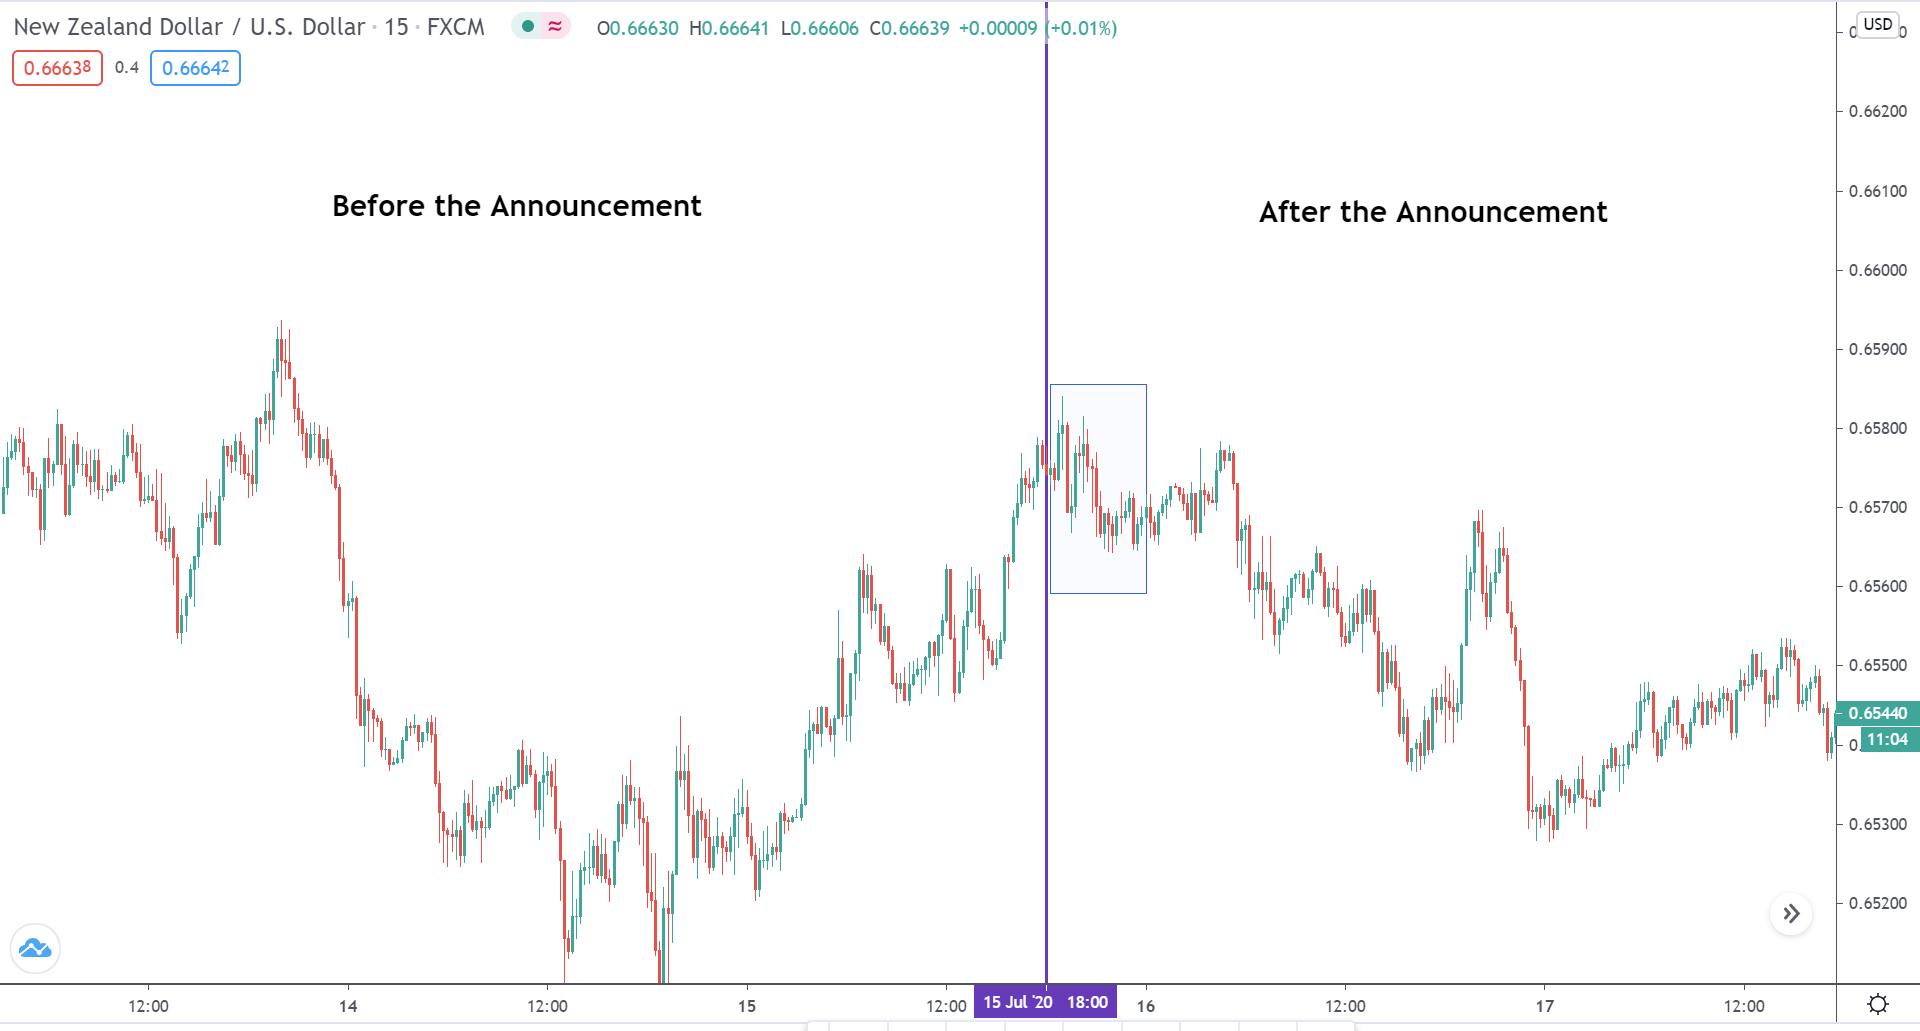
NZD/USD: Before the Monthly Industrial Production Data Release 
on August 14, 2020, Just Before 9.15 AM ET

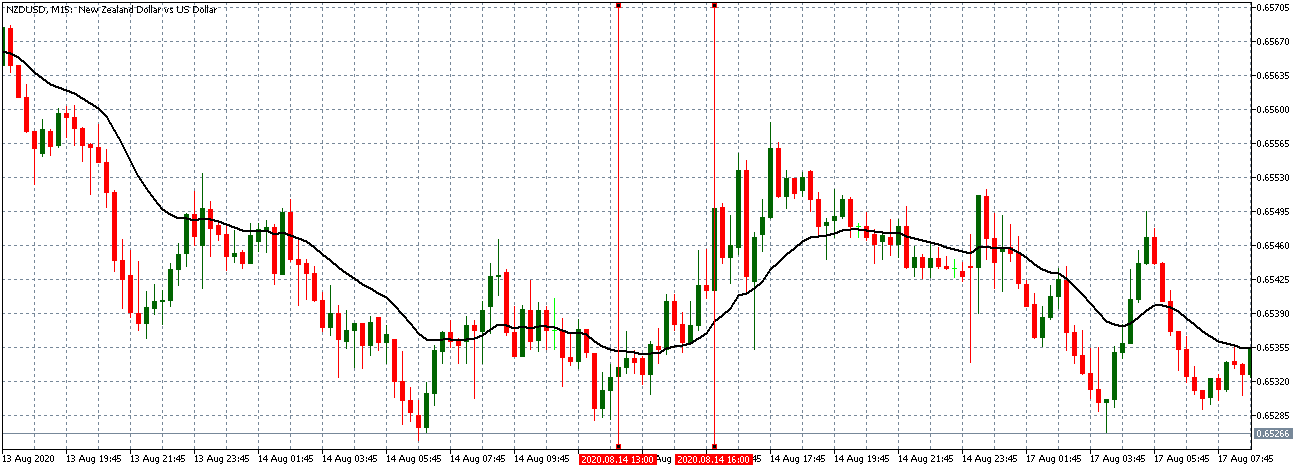
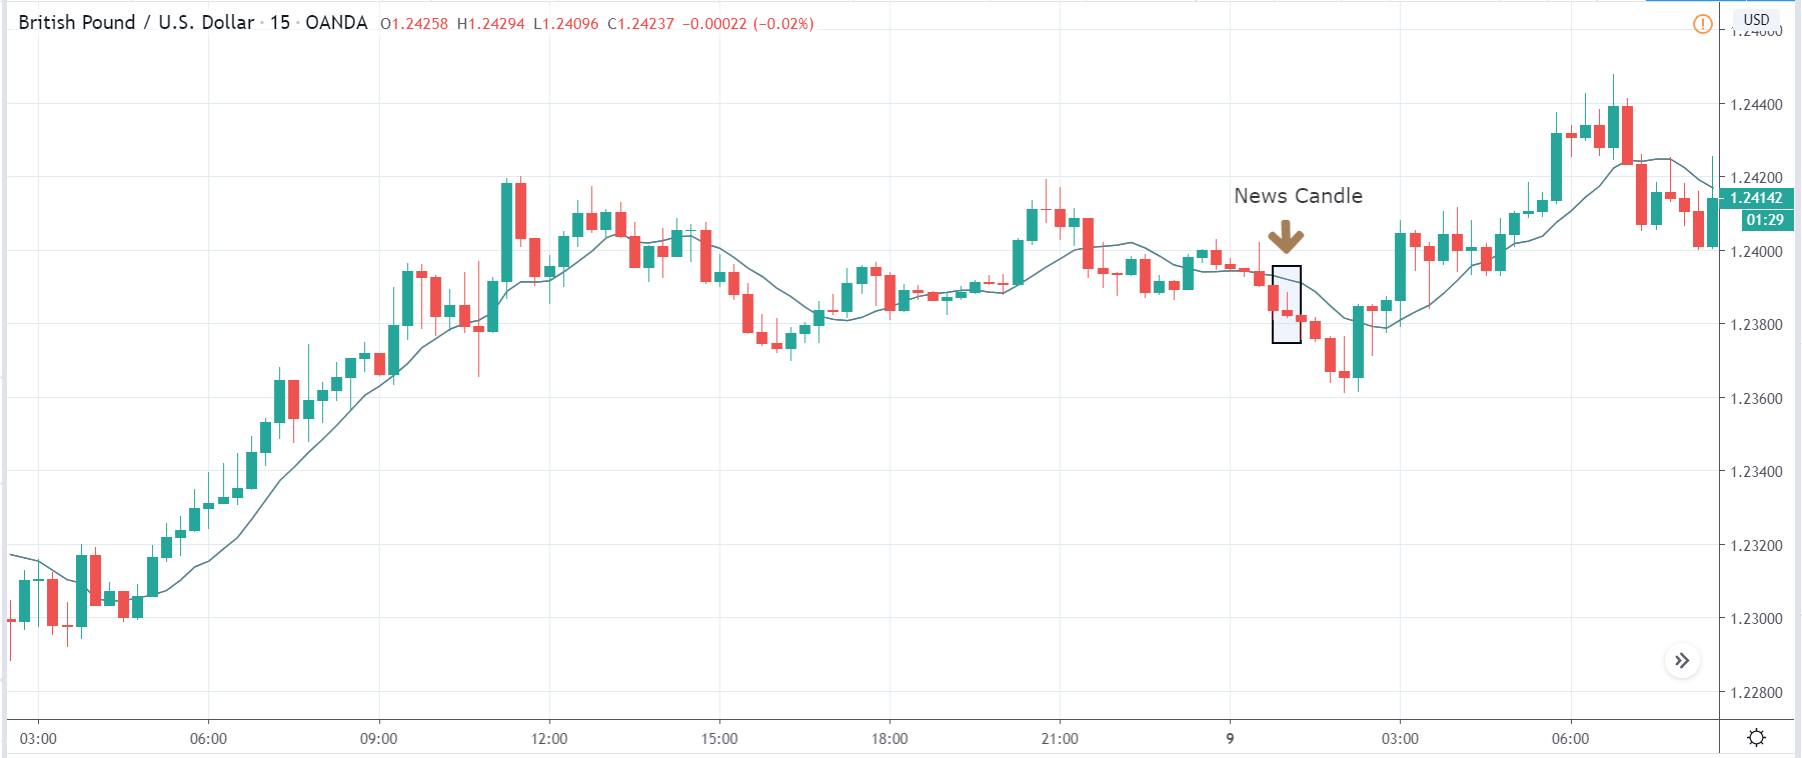
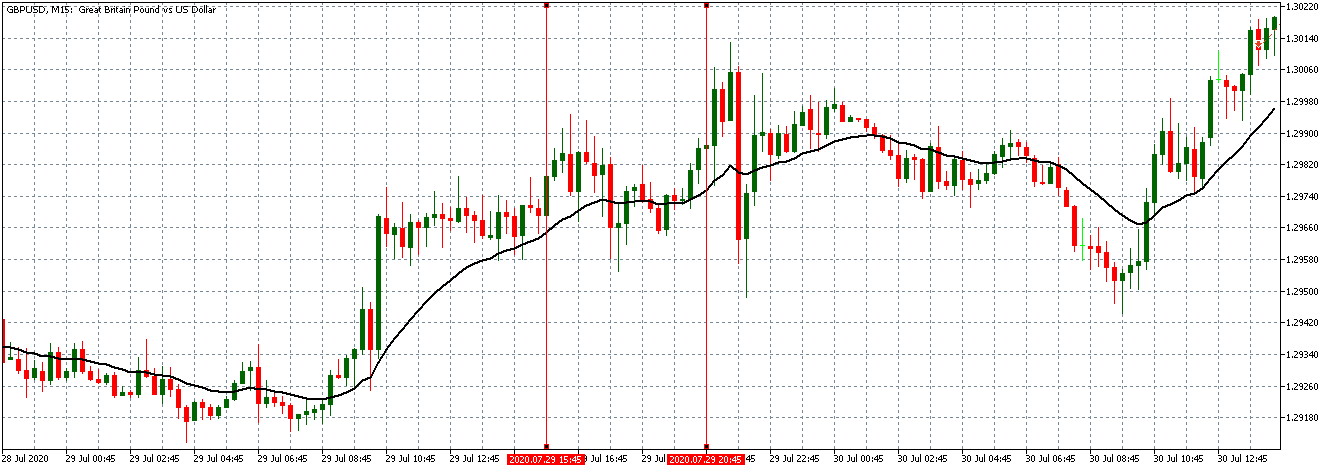
Similar to the trend observed with the EUR/USD pair, the NZD/USD was trading in an uptrend before the data release. The 20-period Moving Average can be seen to be steadily rising in the above 15-minute chart.

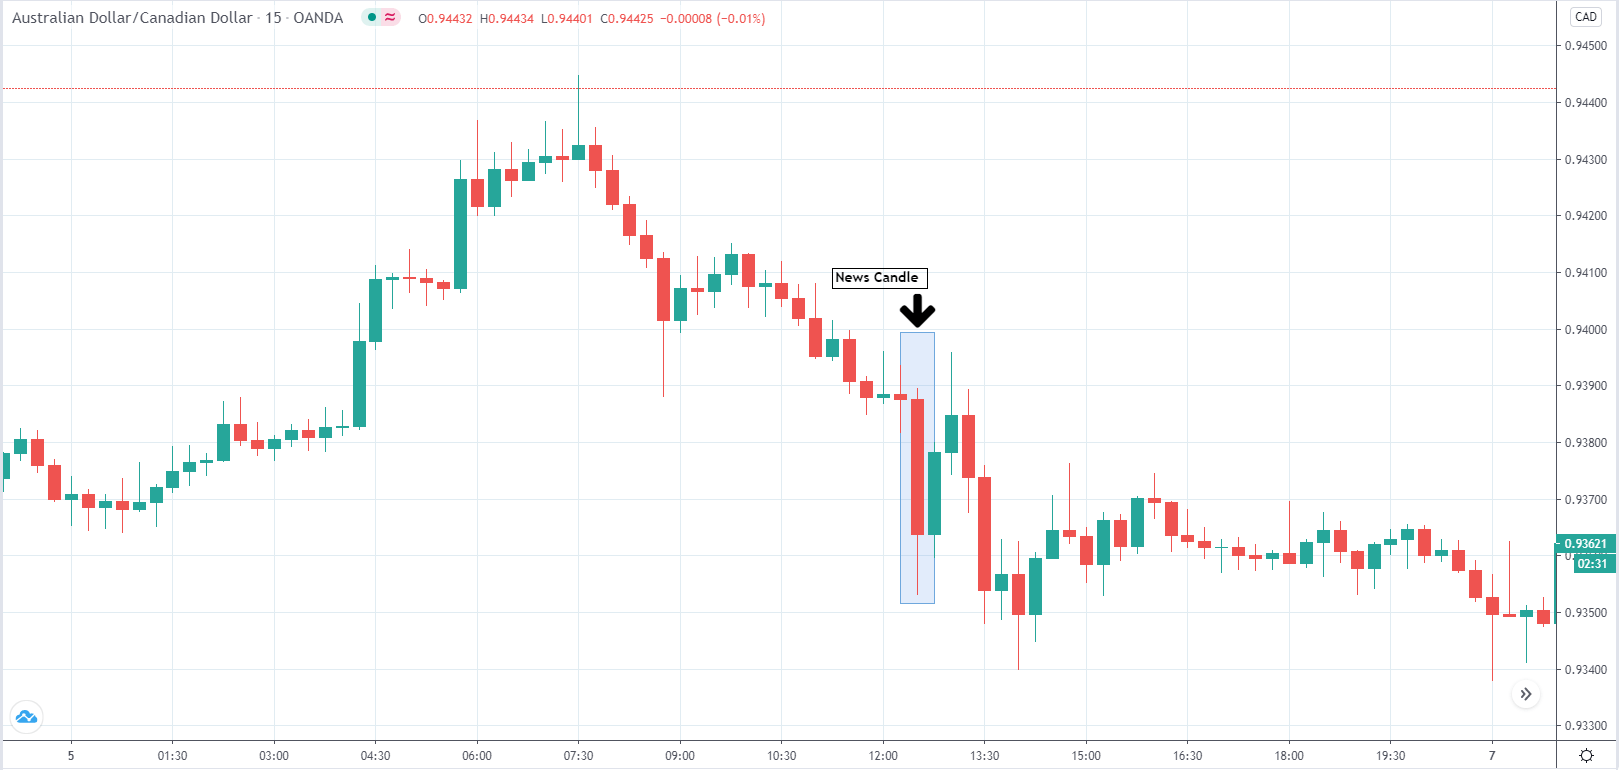
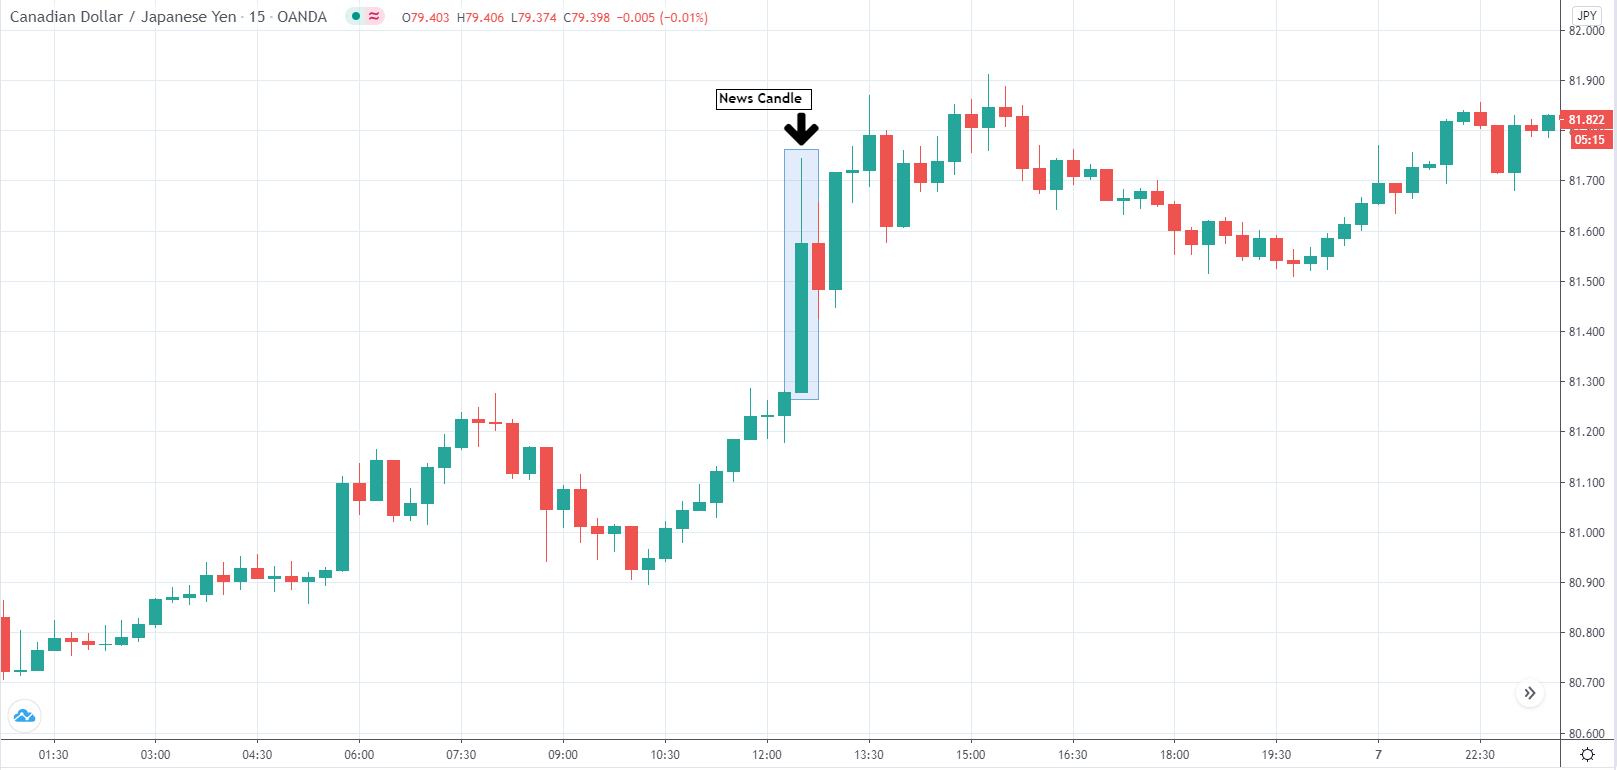
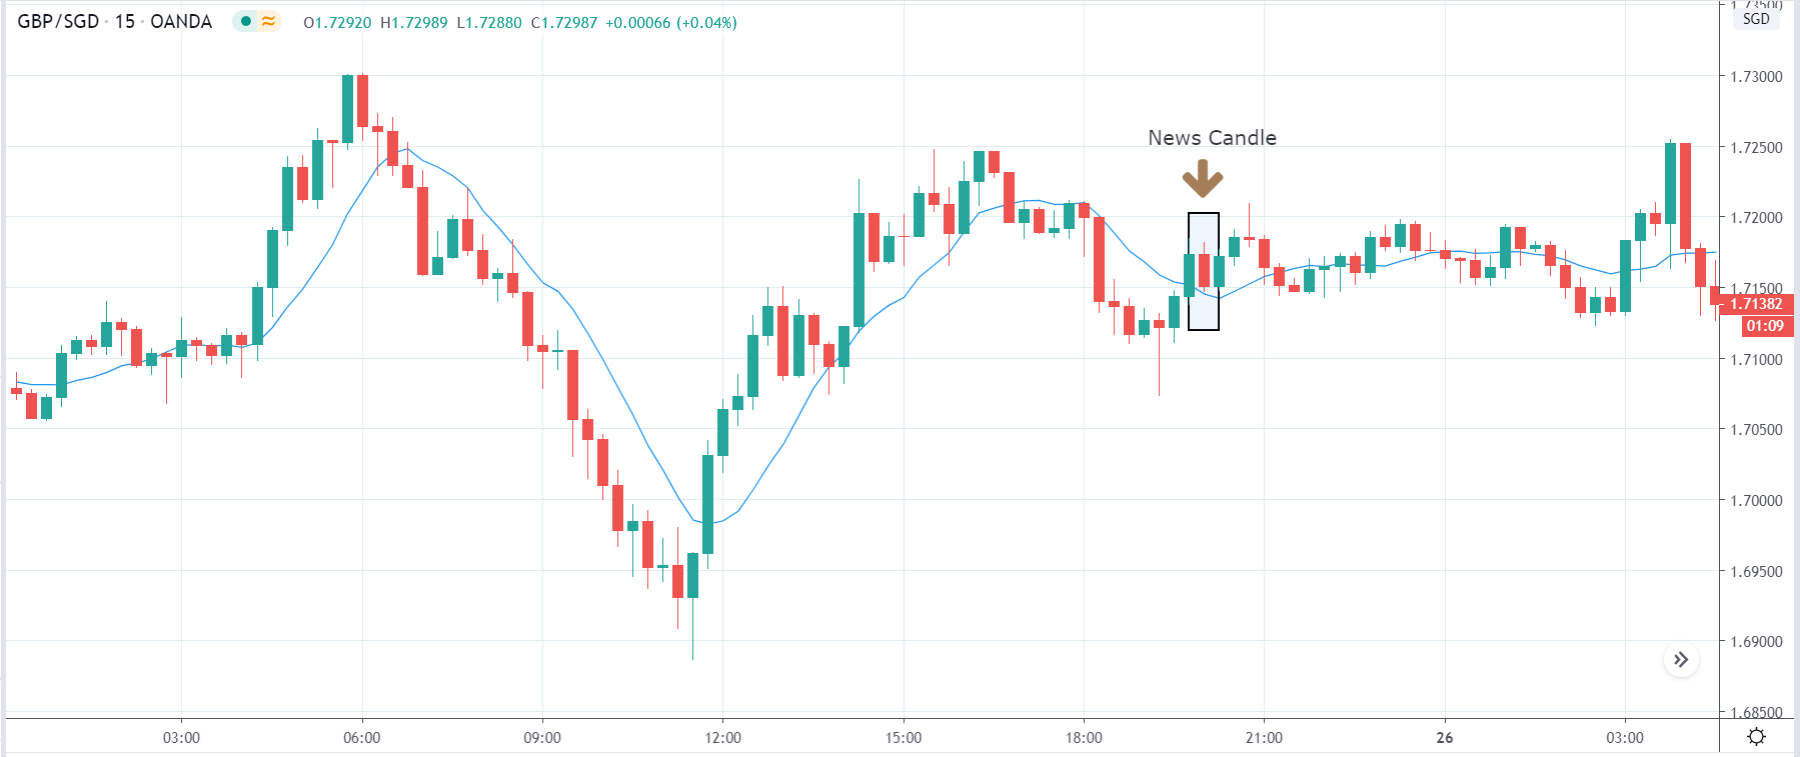
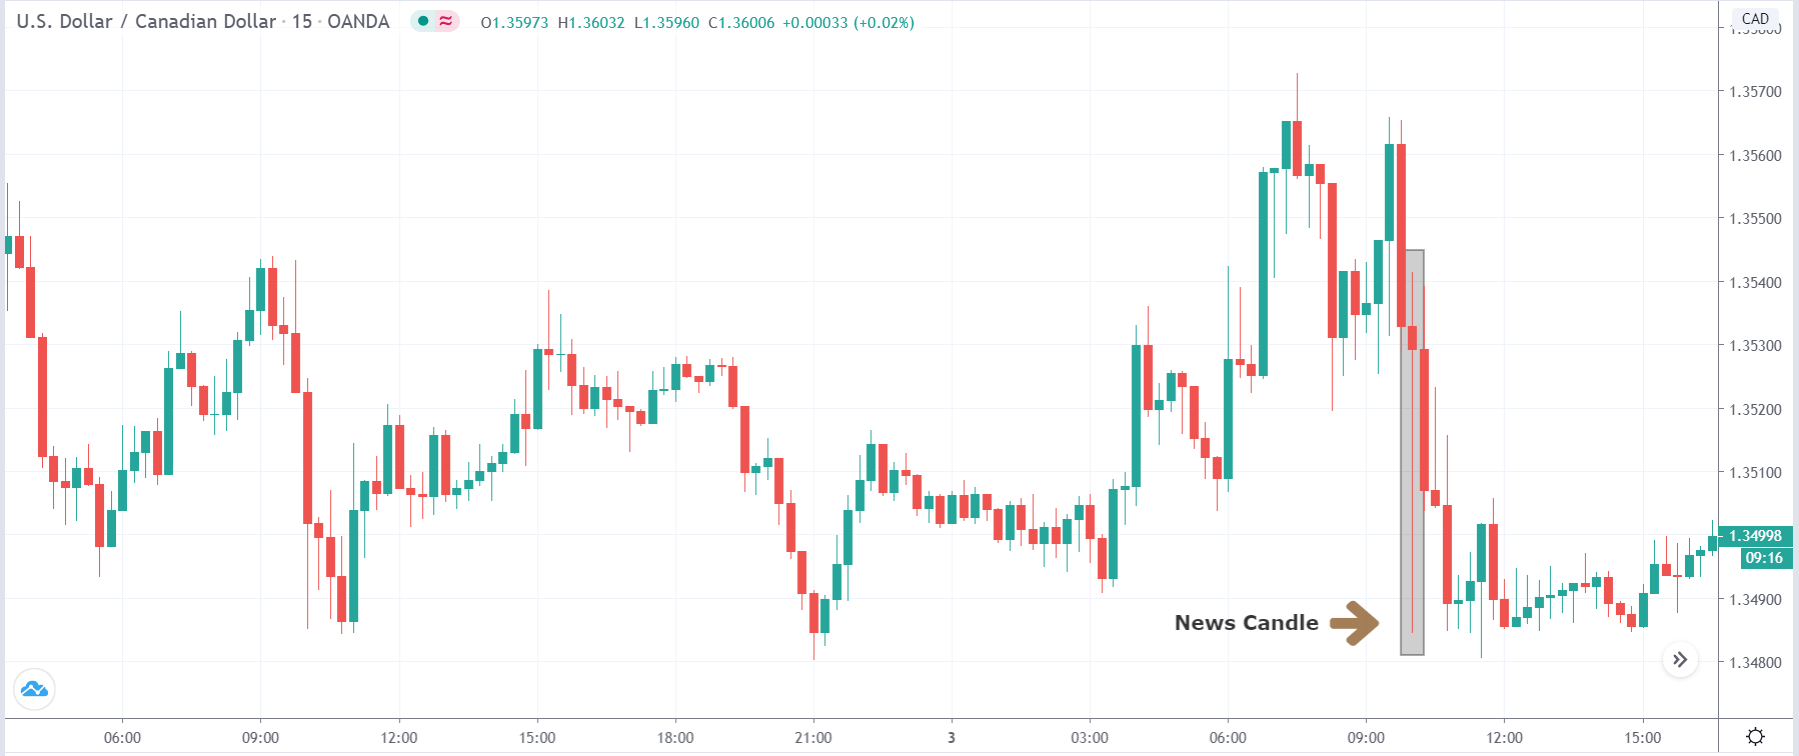
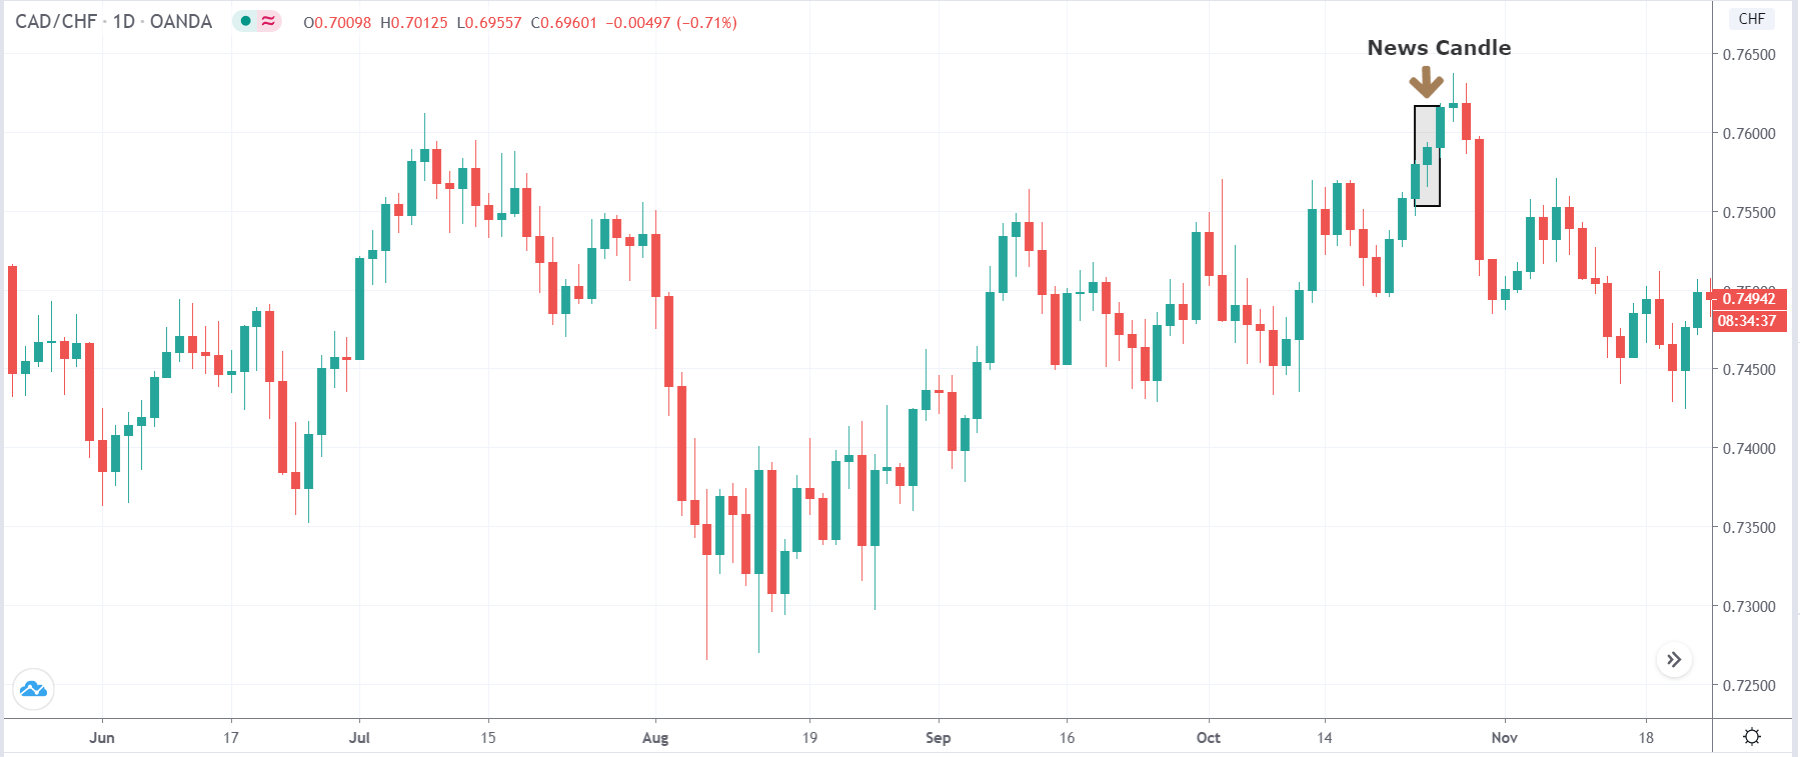
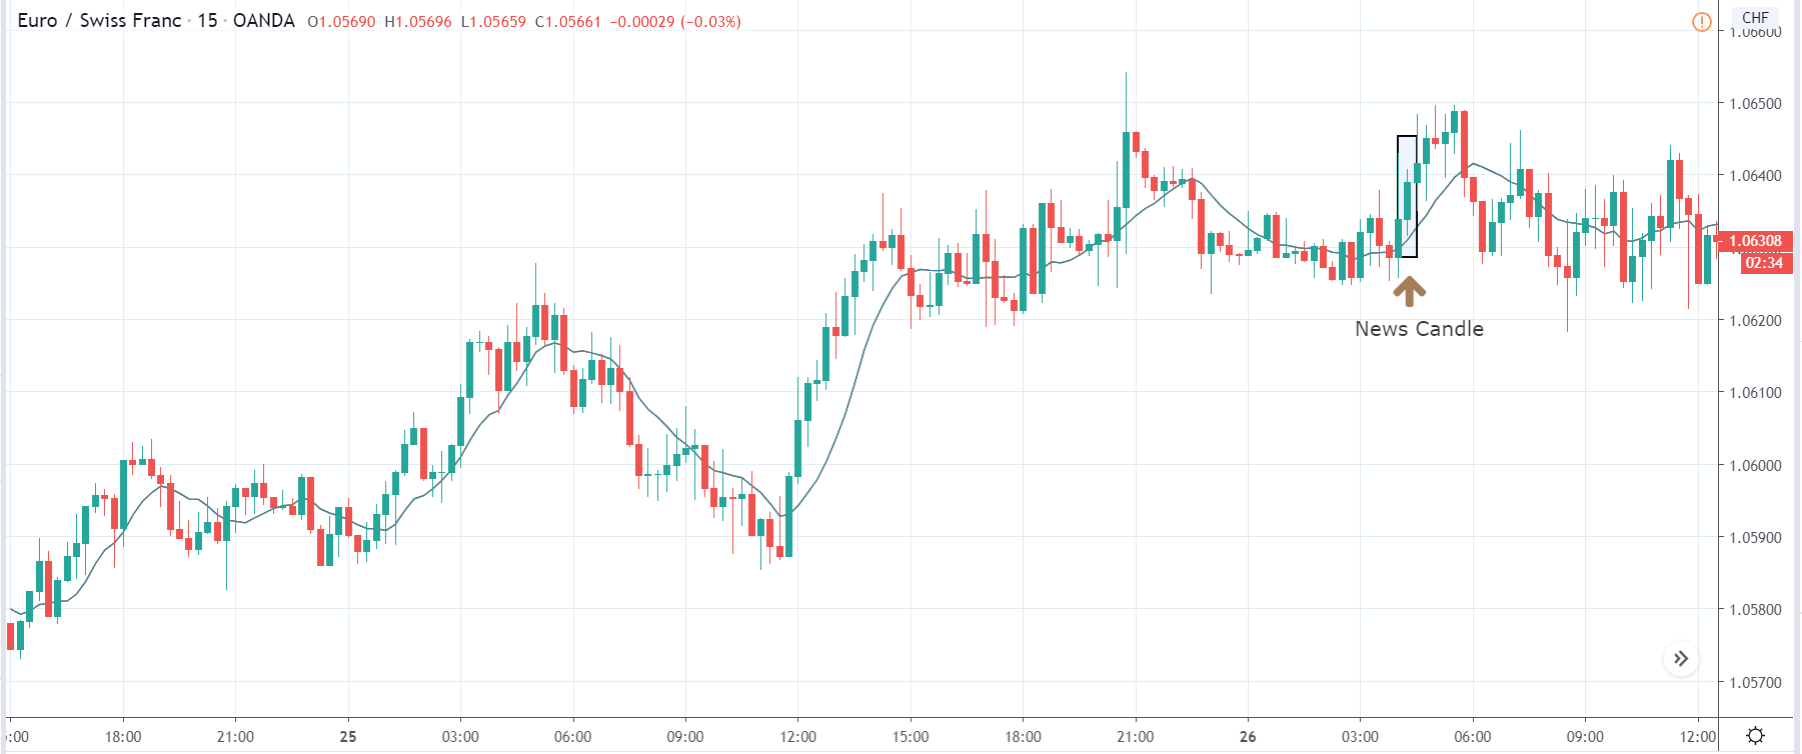
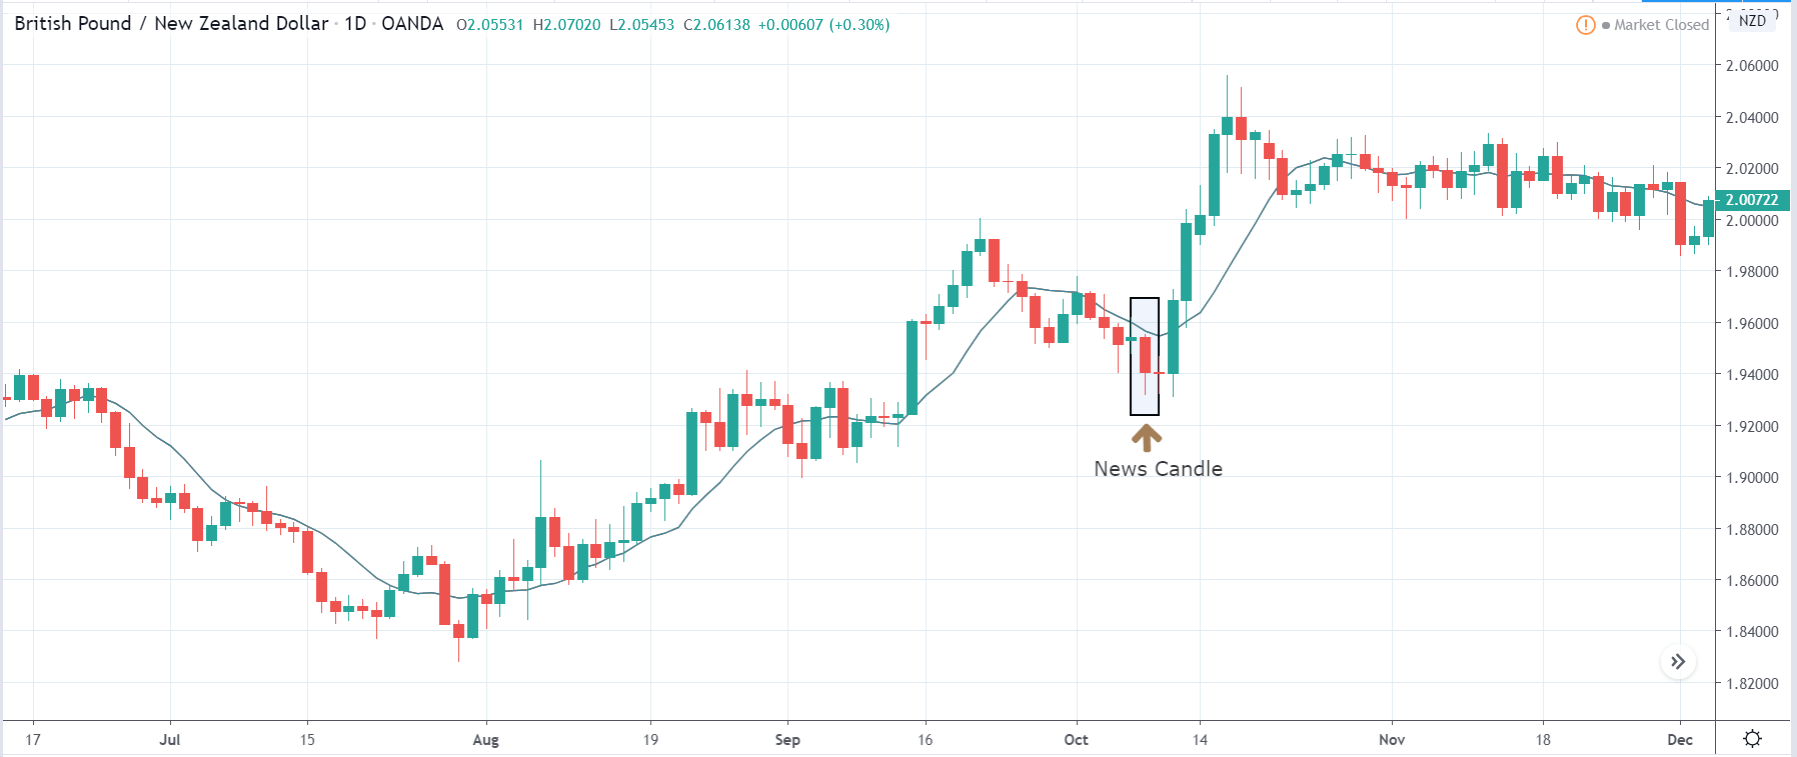
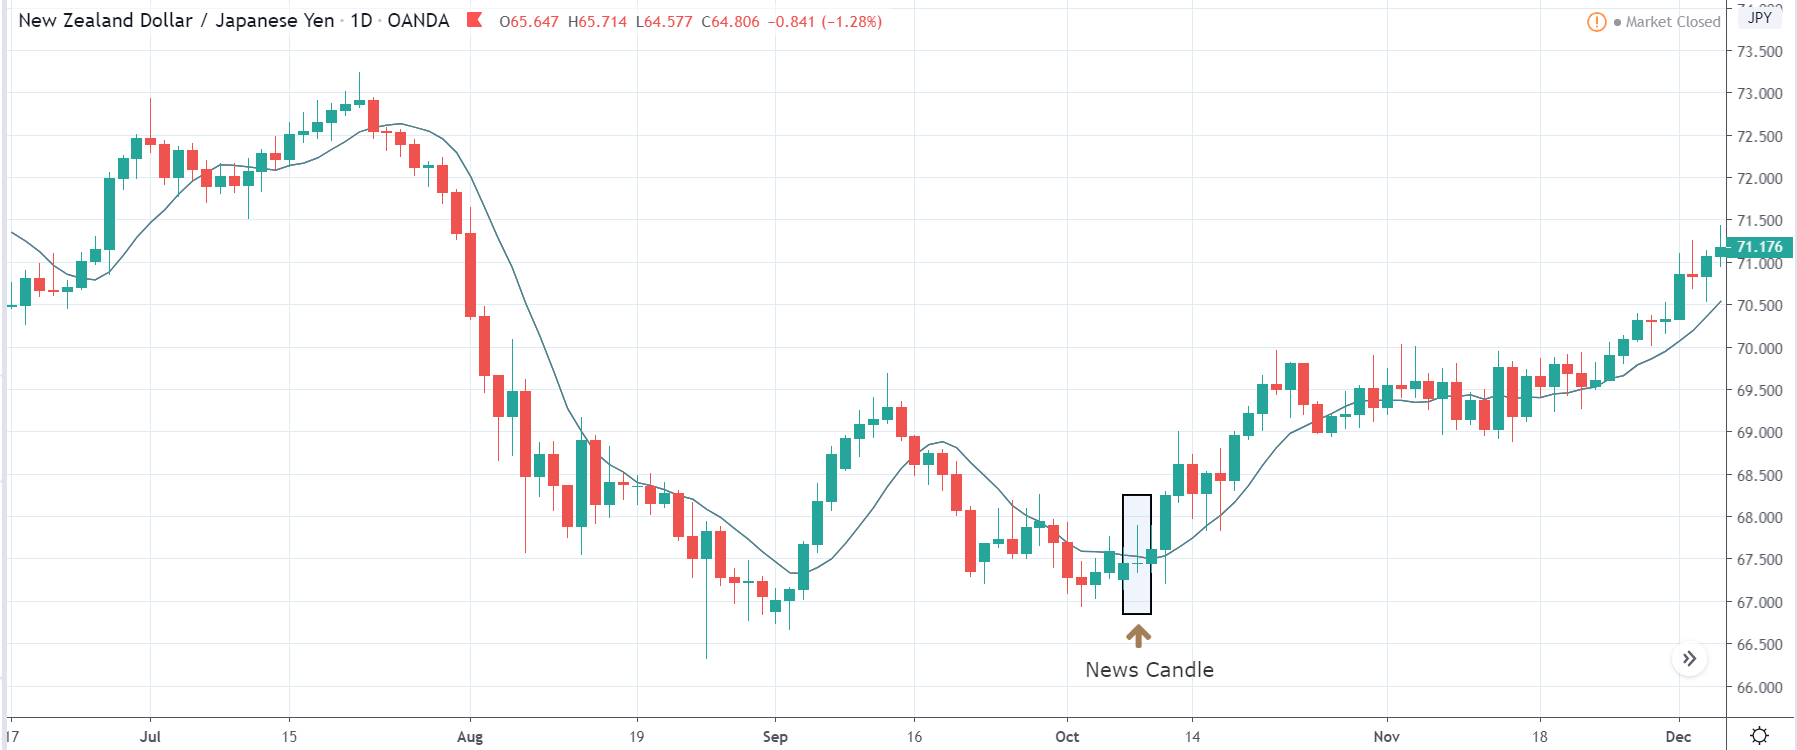
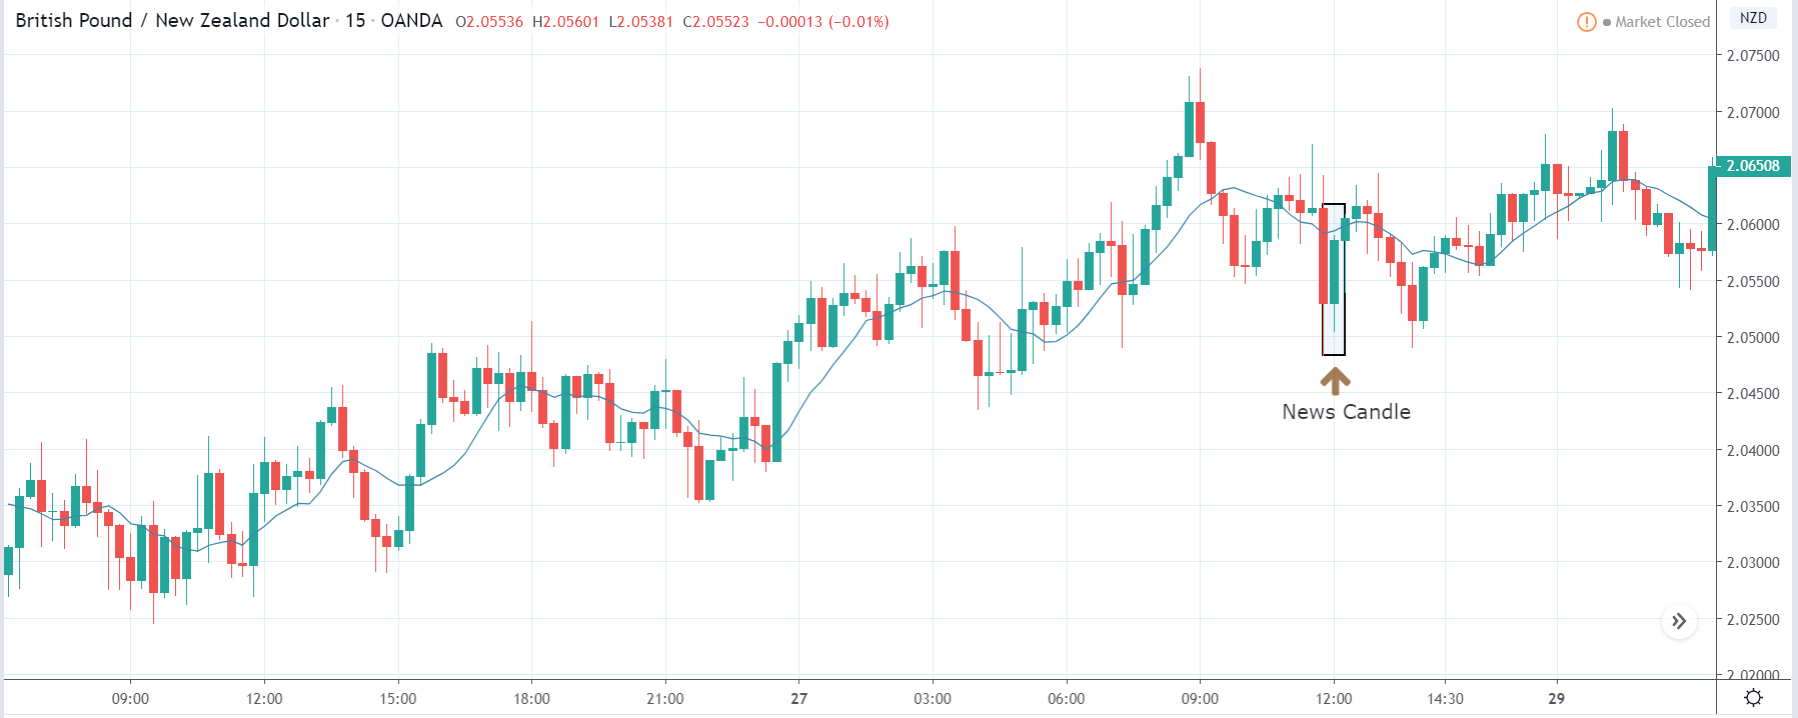
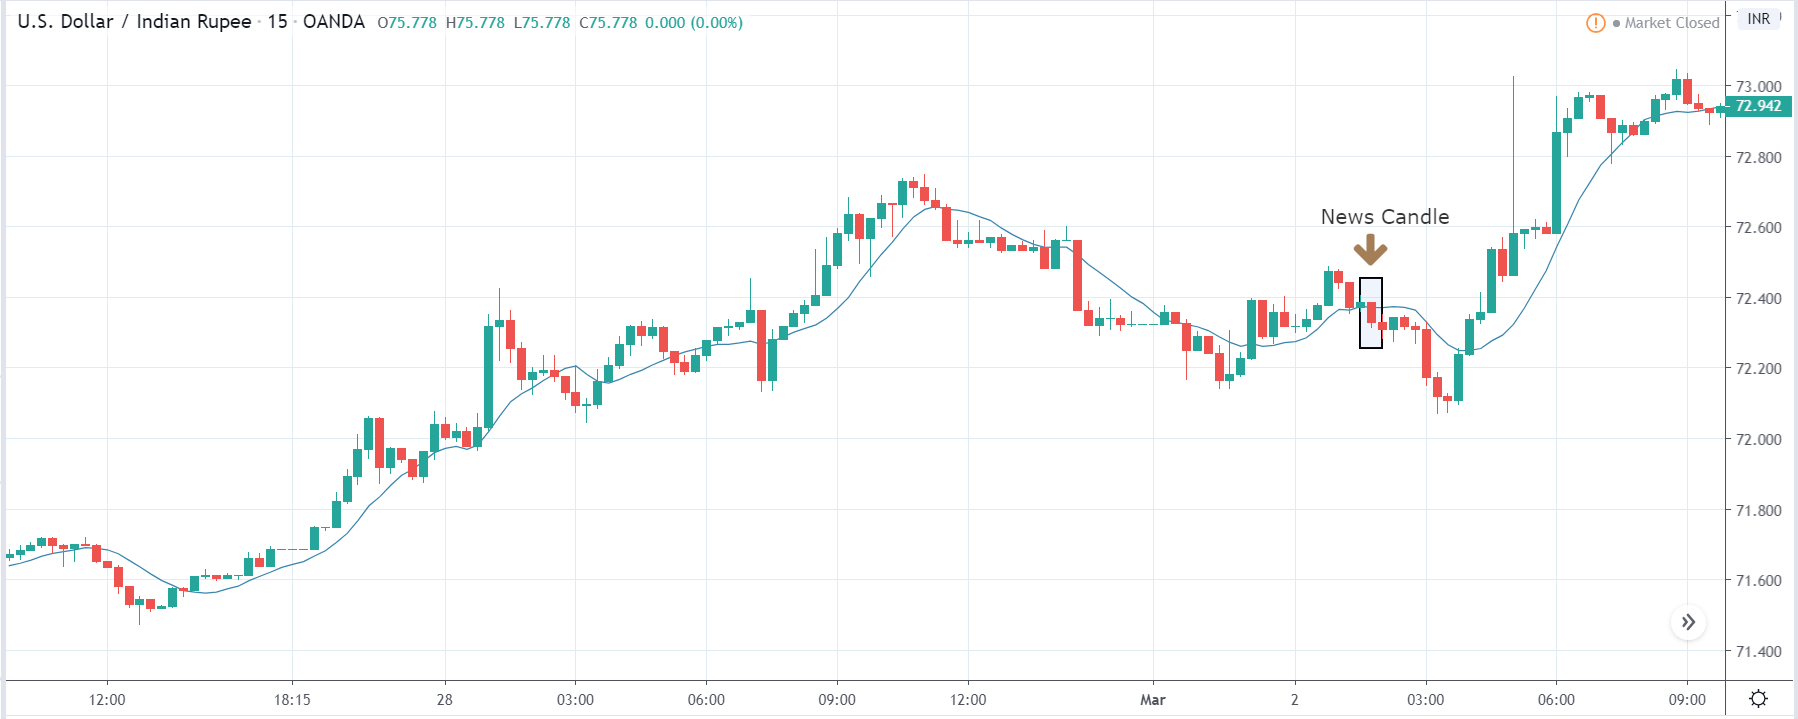
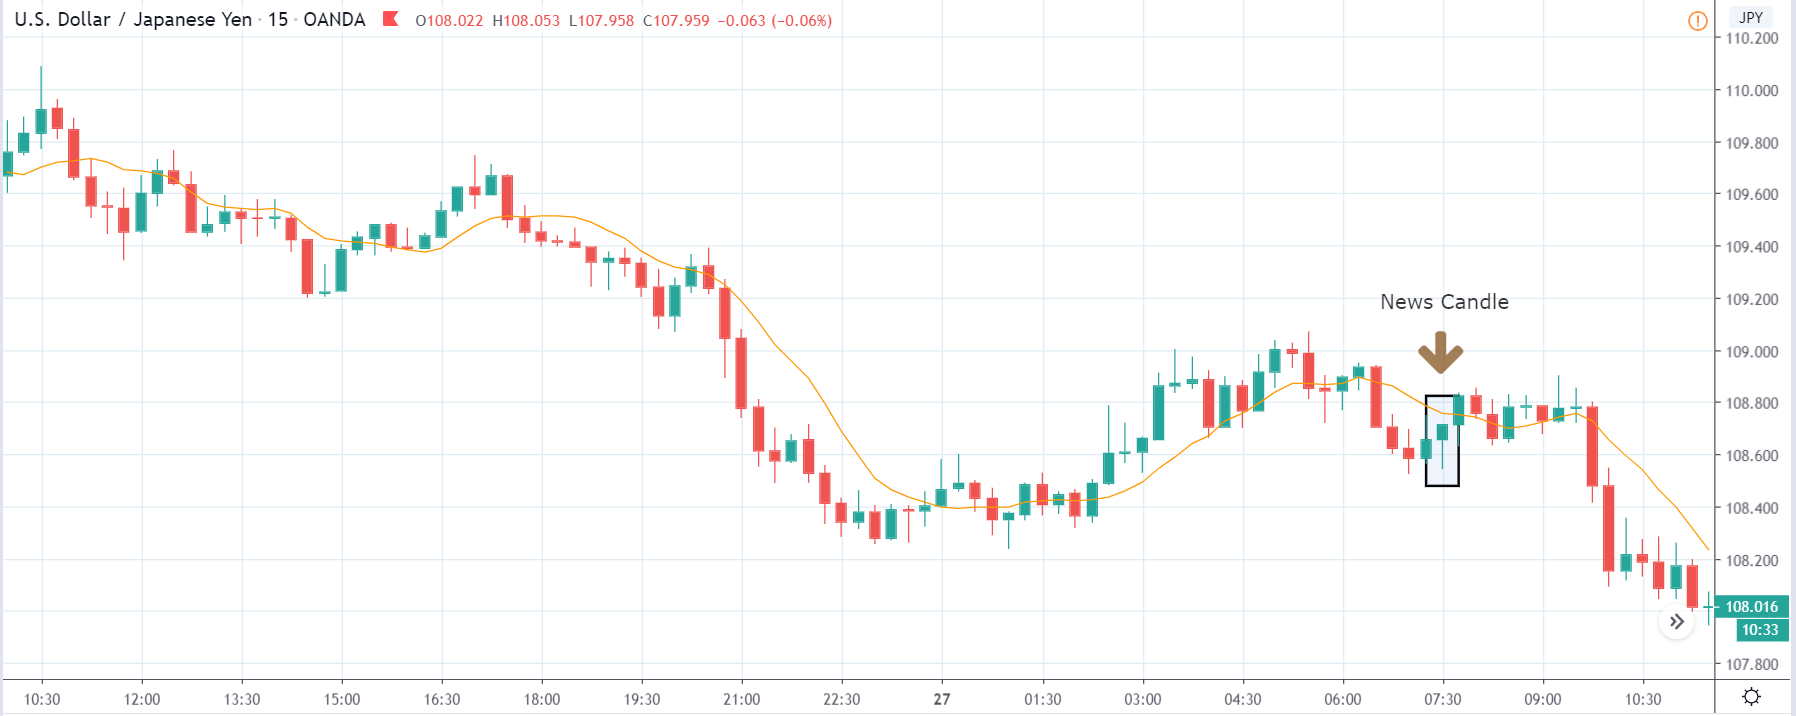
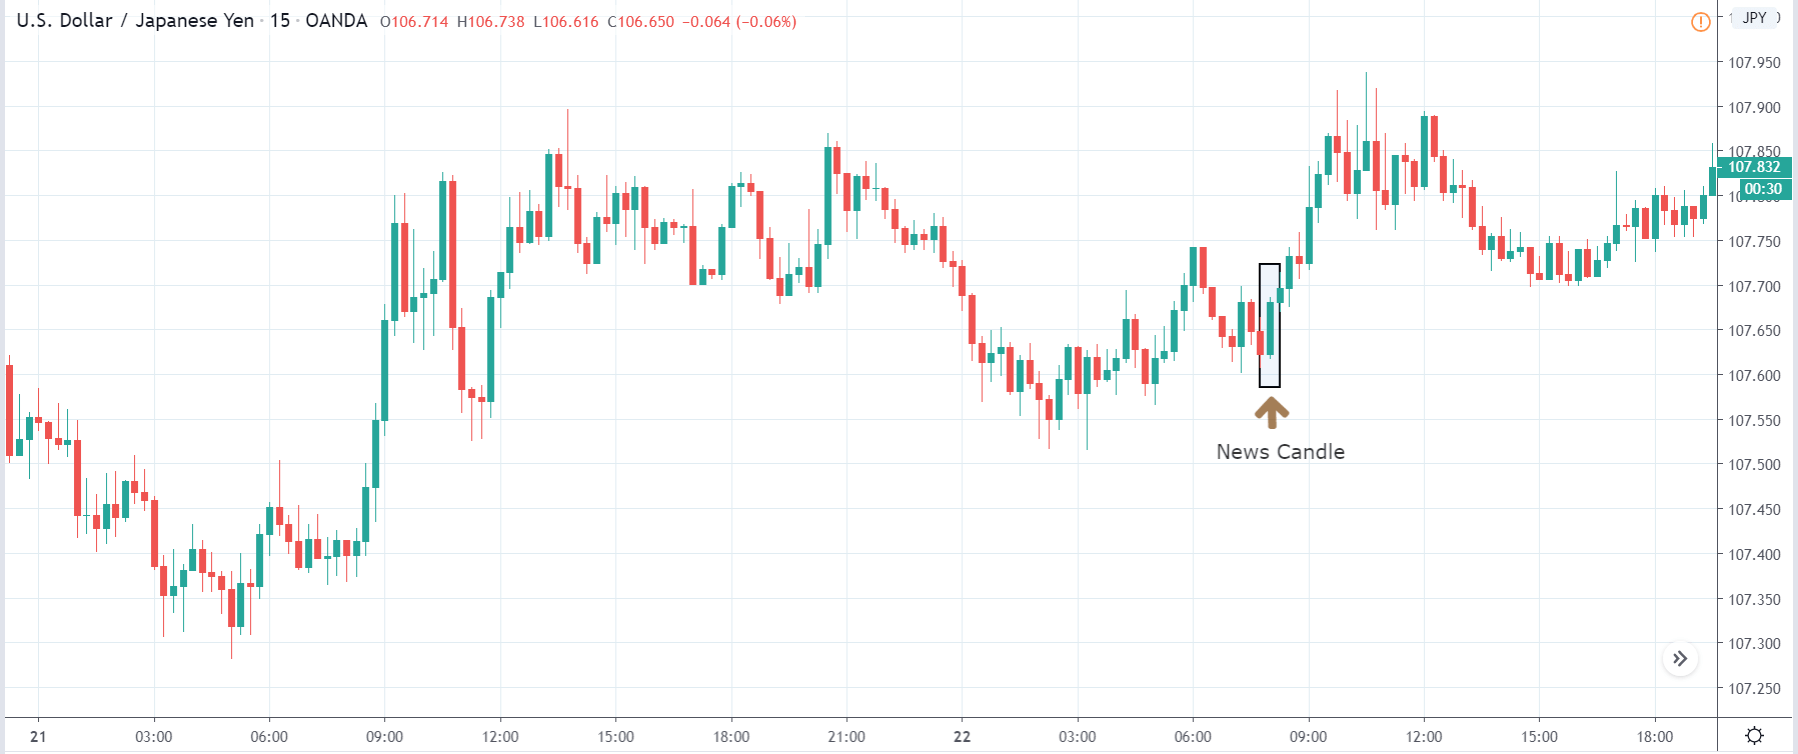
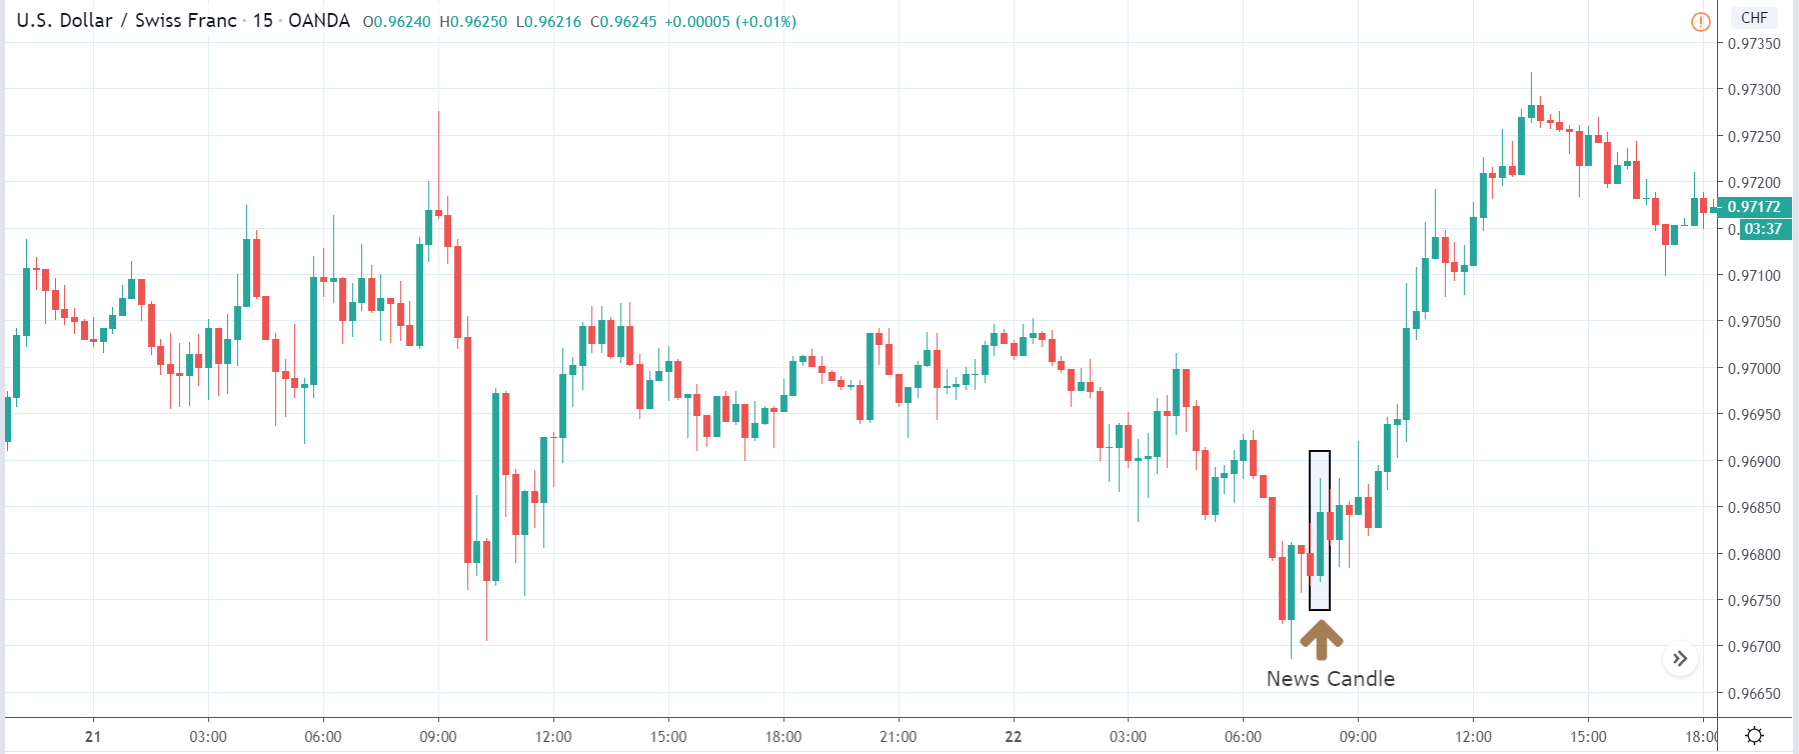
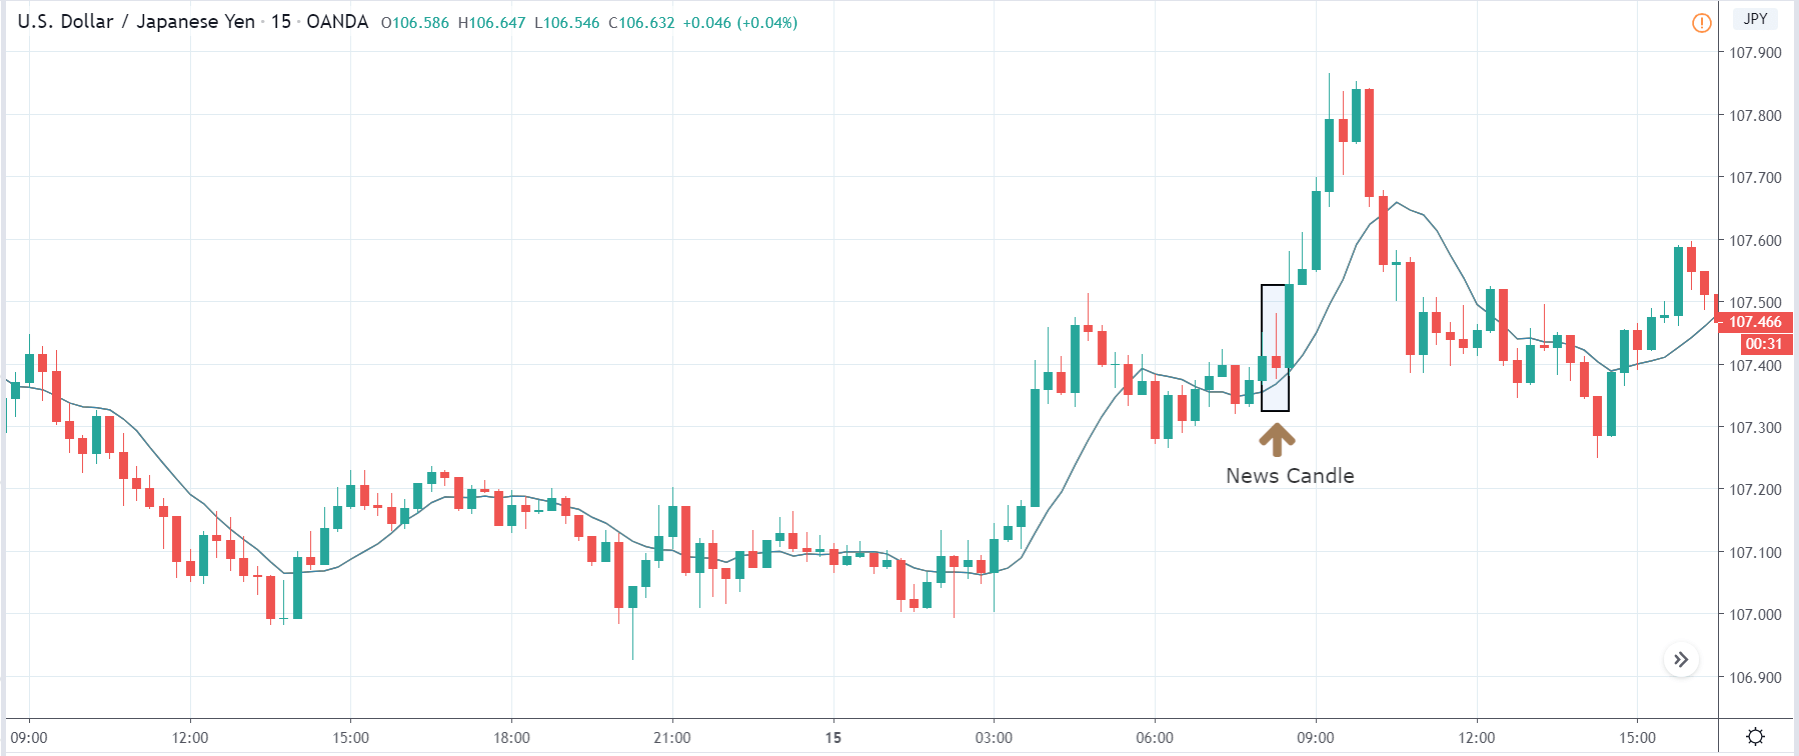
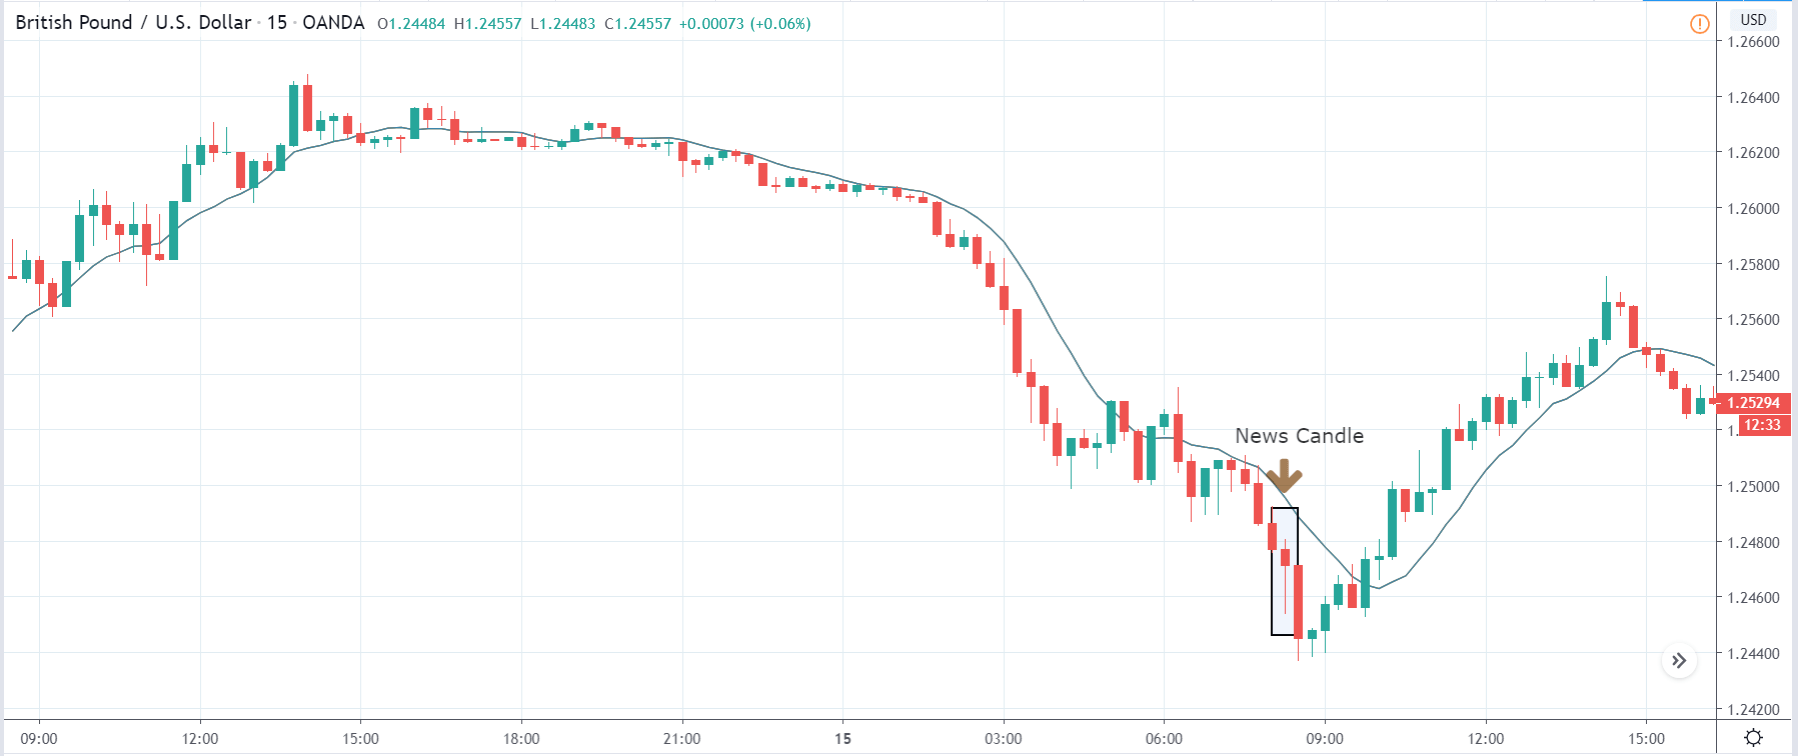
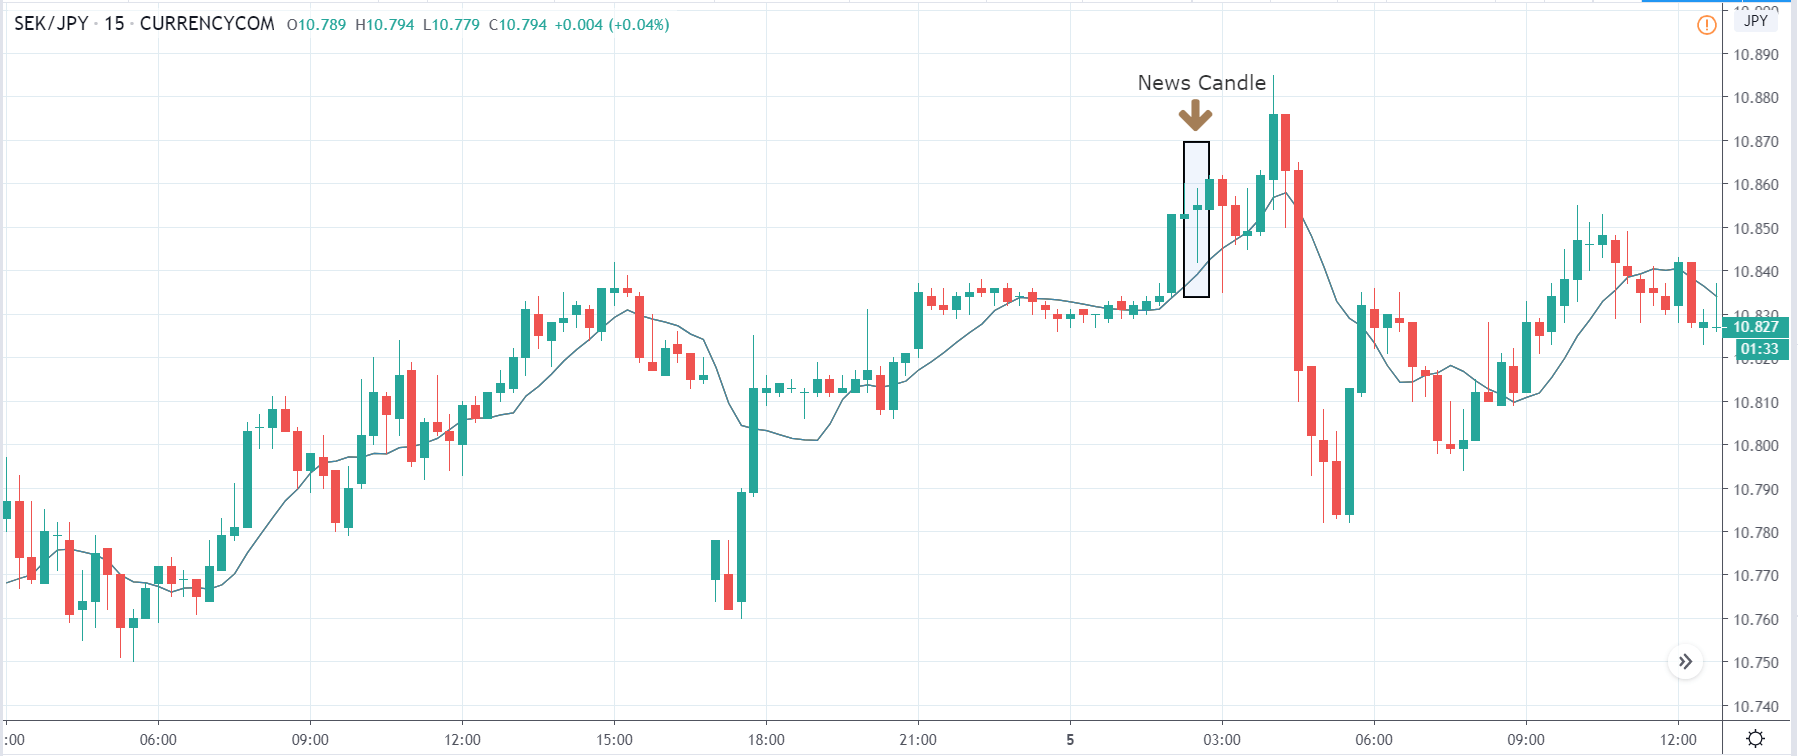
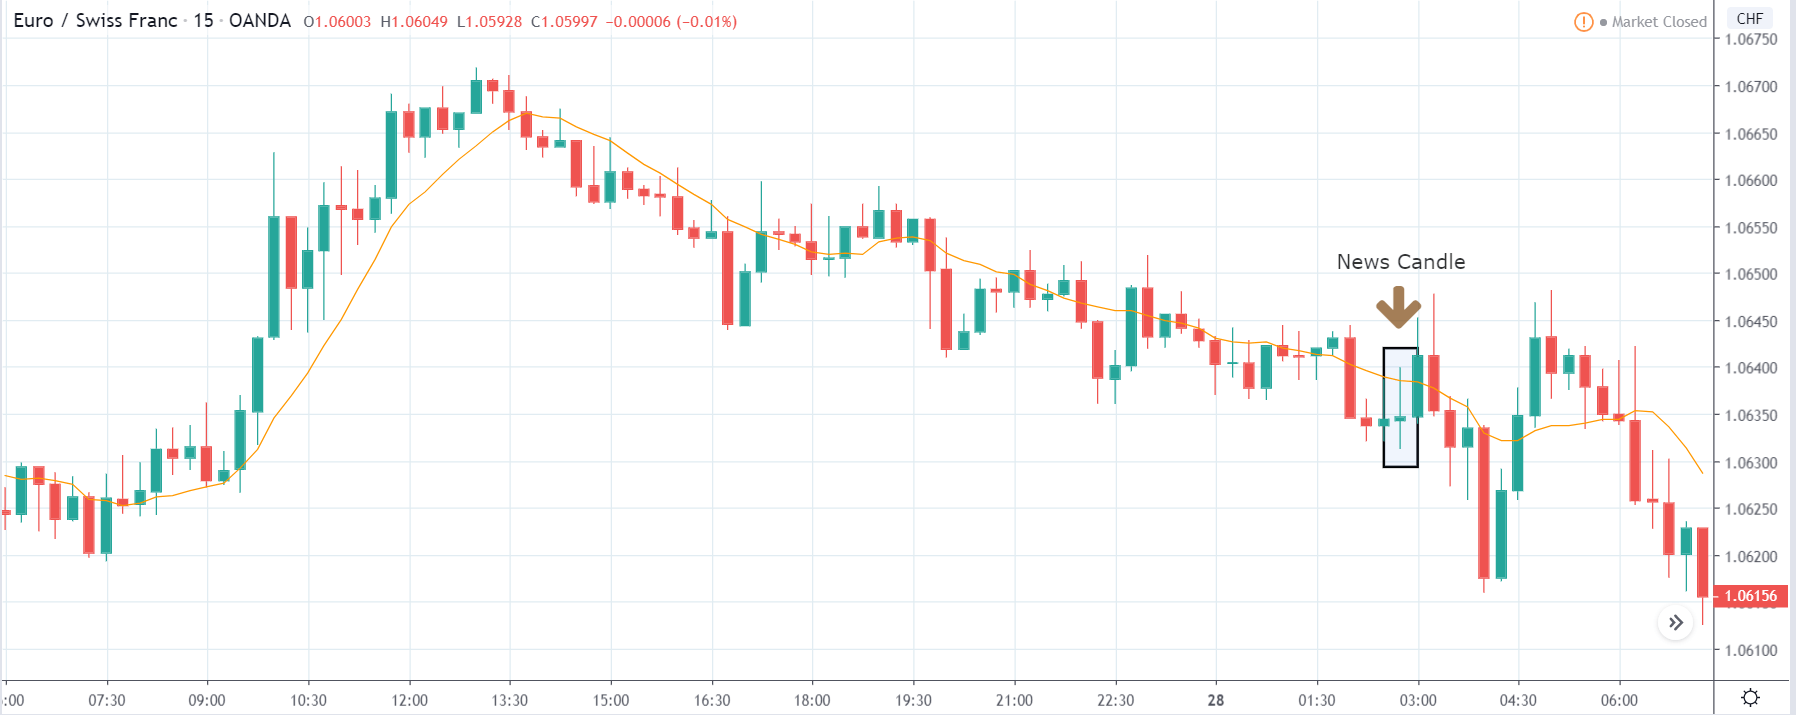
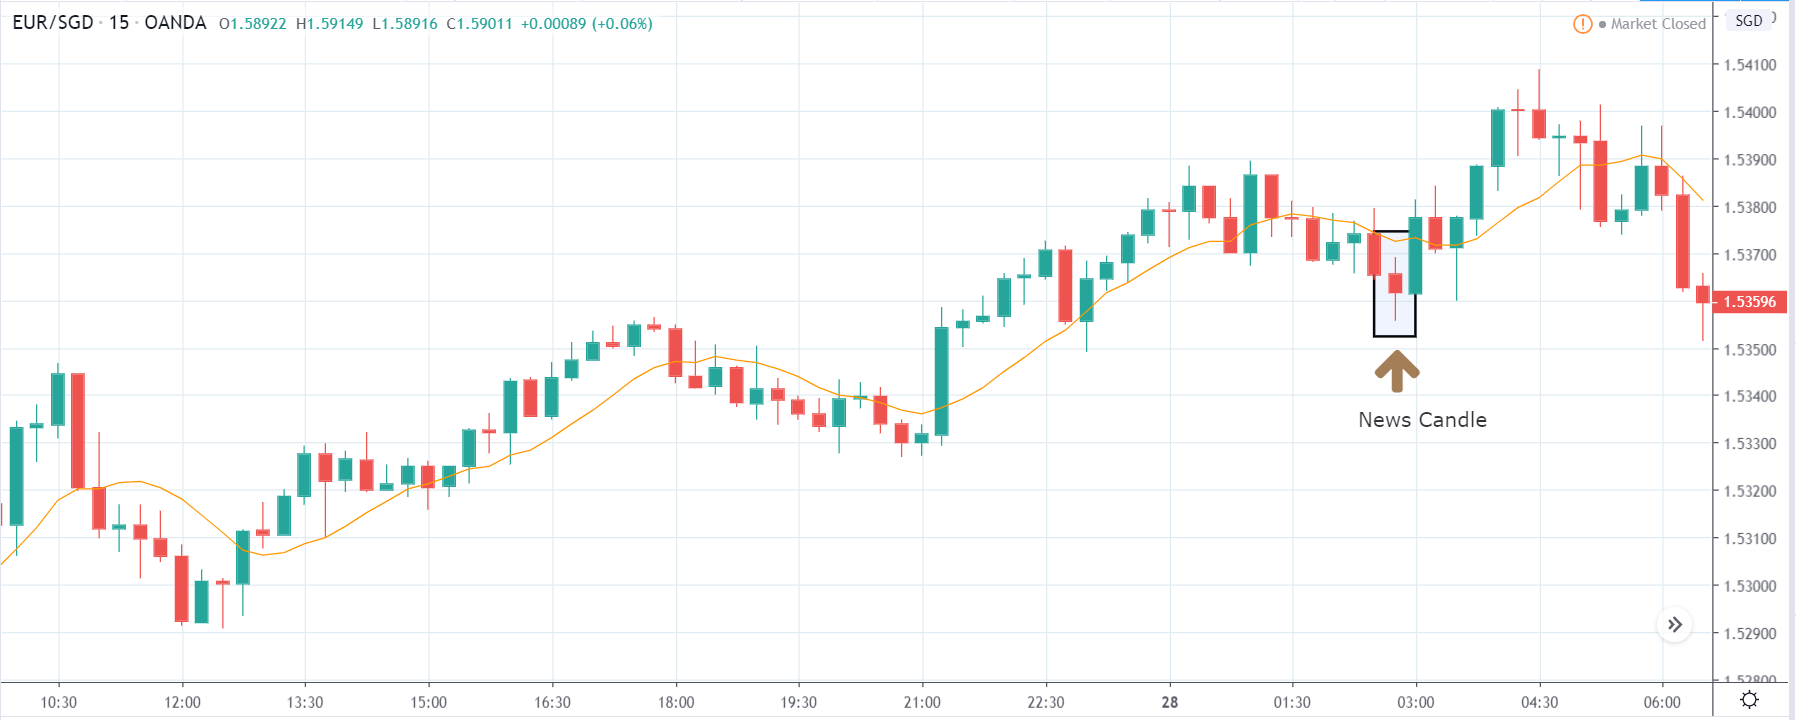
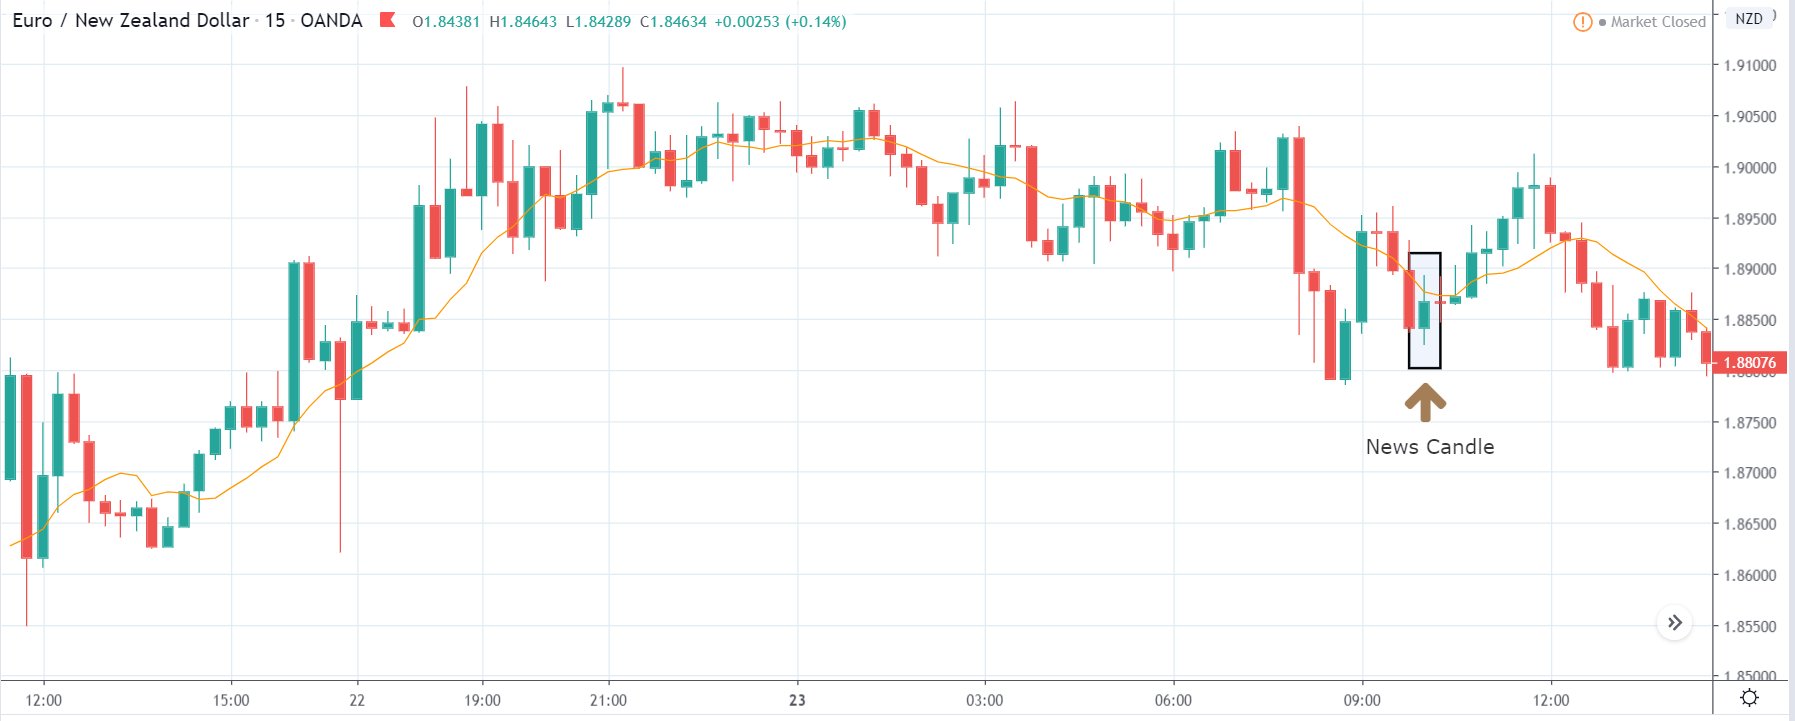
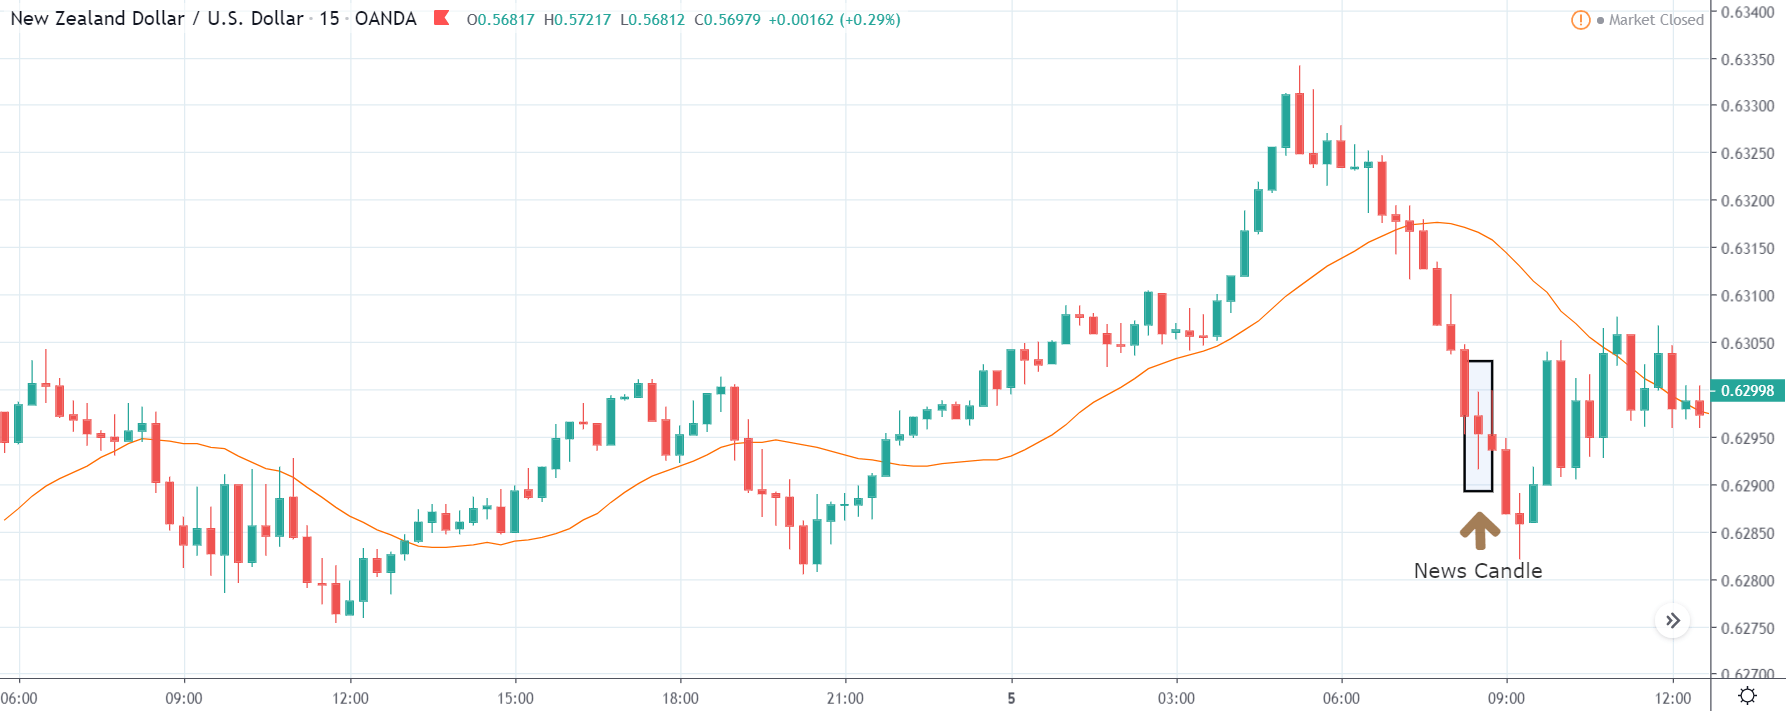
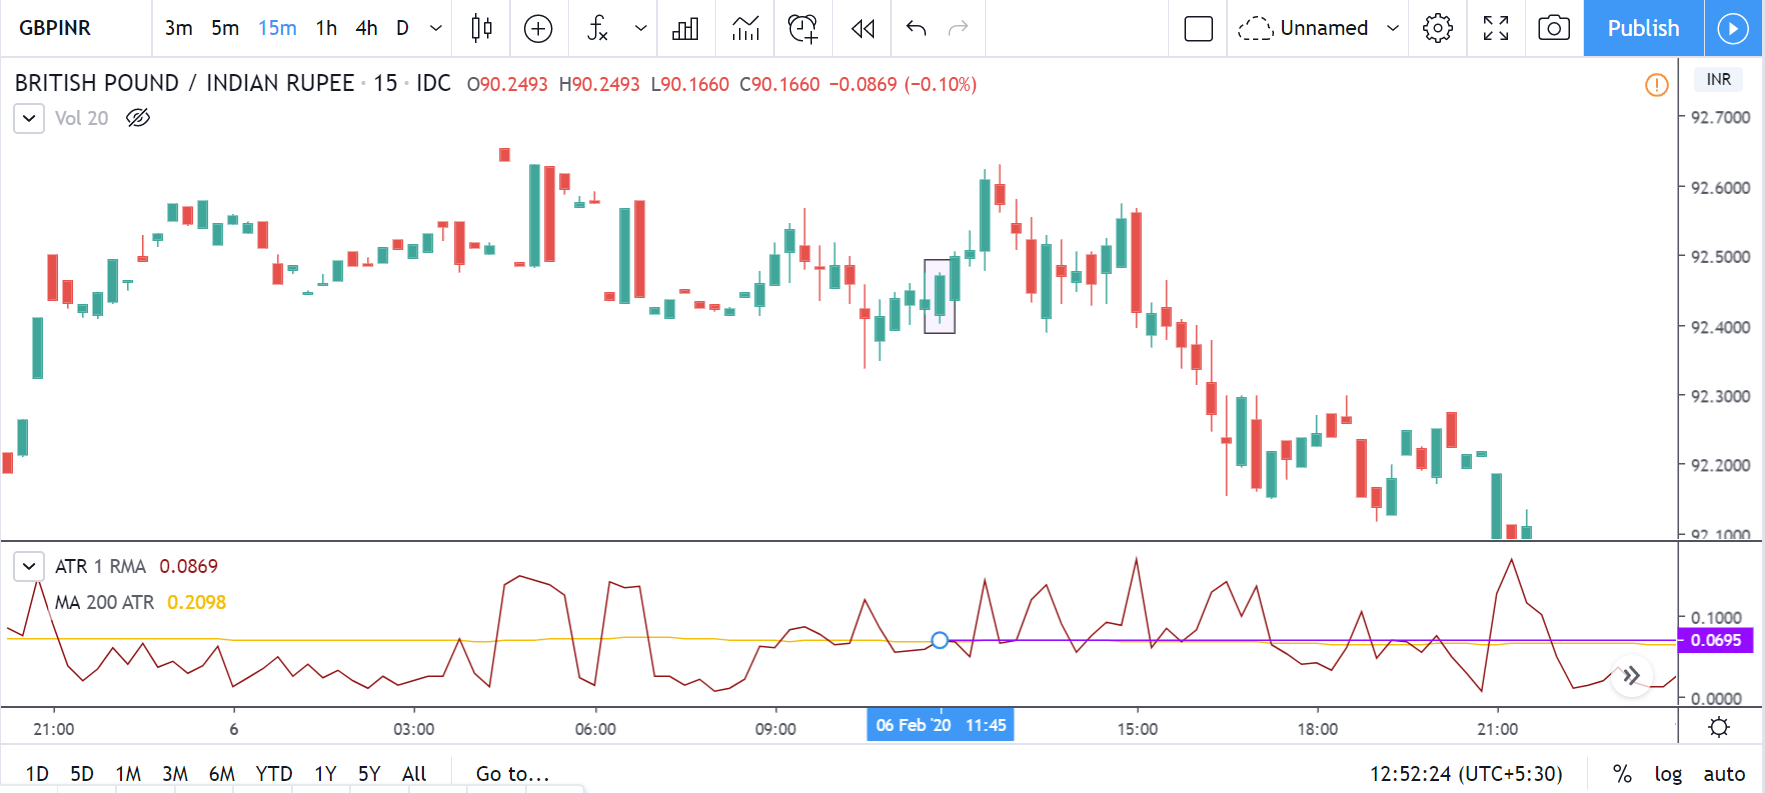
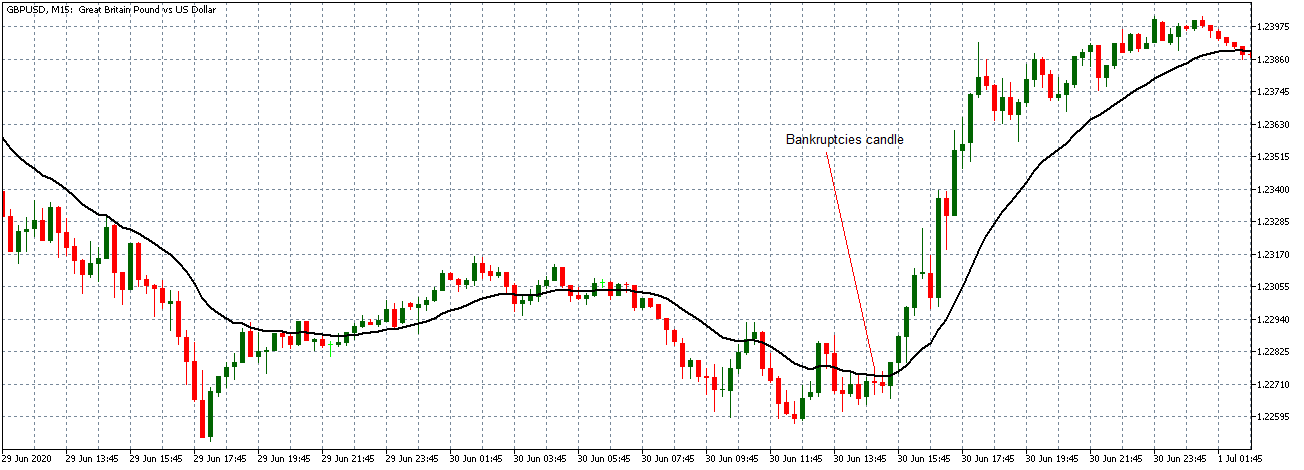
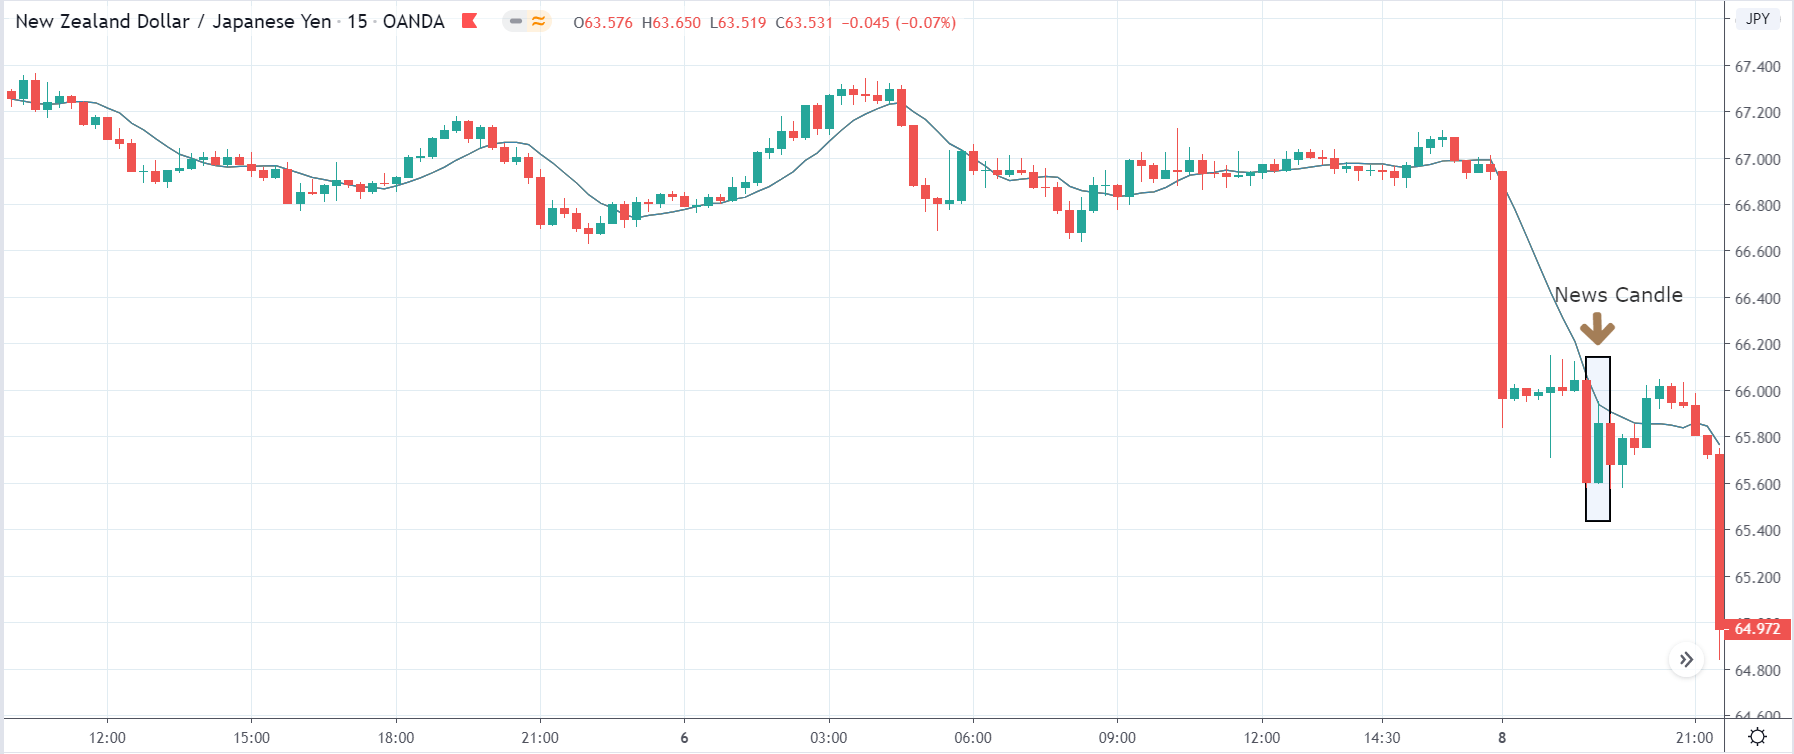
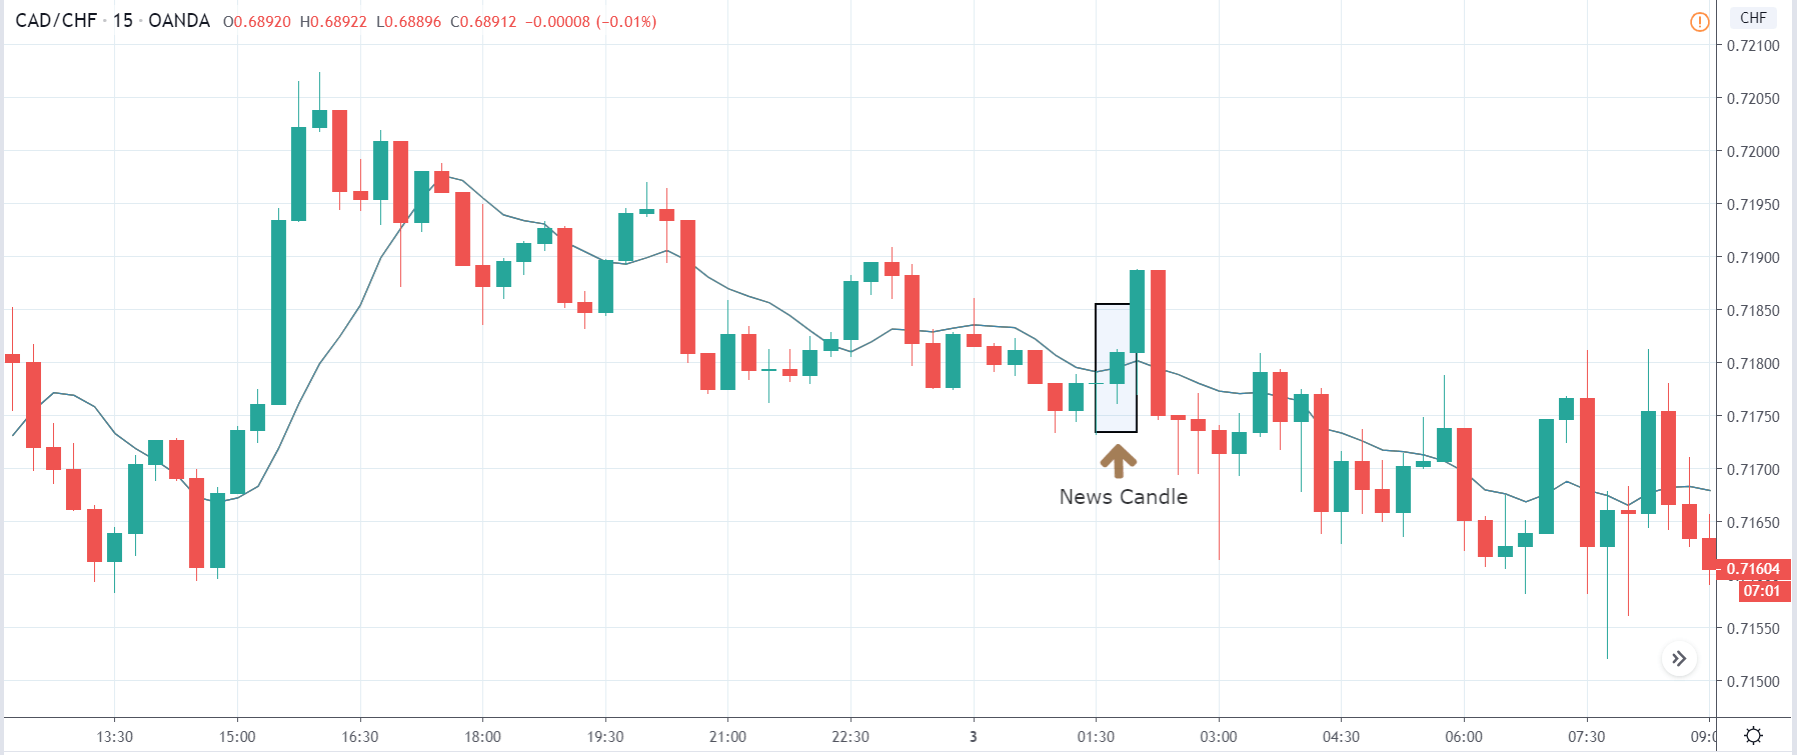
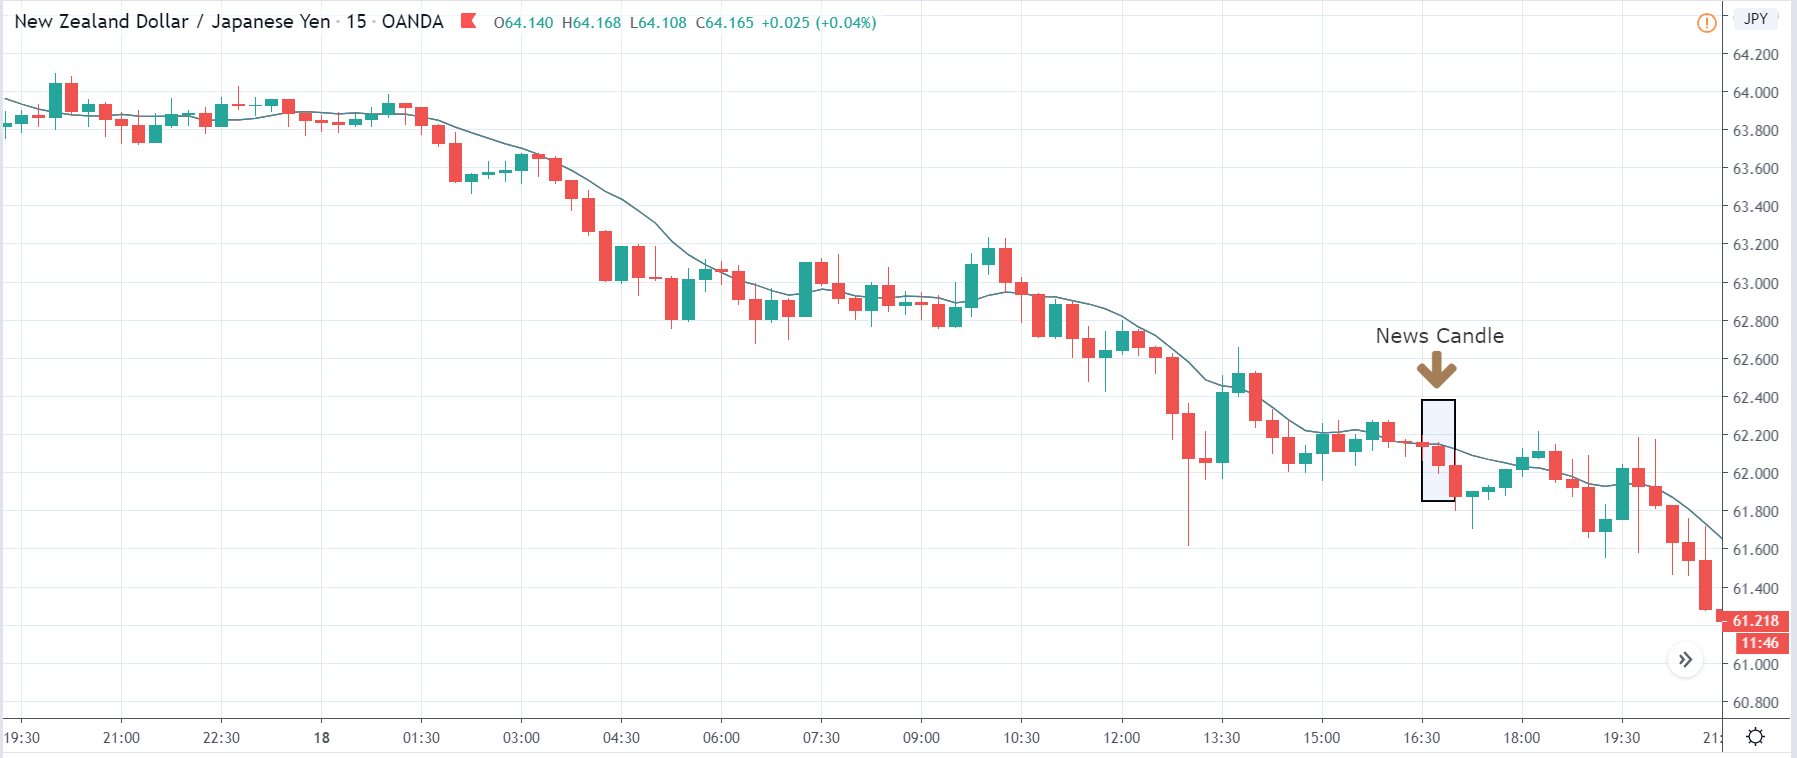
NZD/USD: After the Monthly Industrial Production Data Release 
on August 14, 2020, at 9.15 AM ET

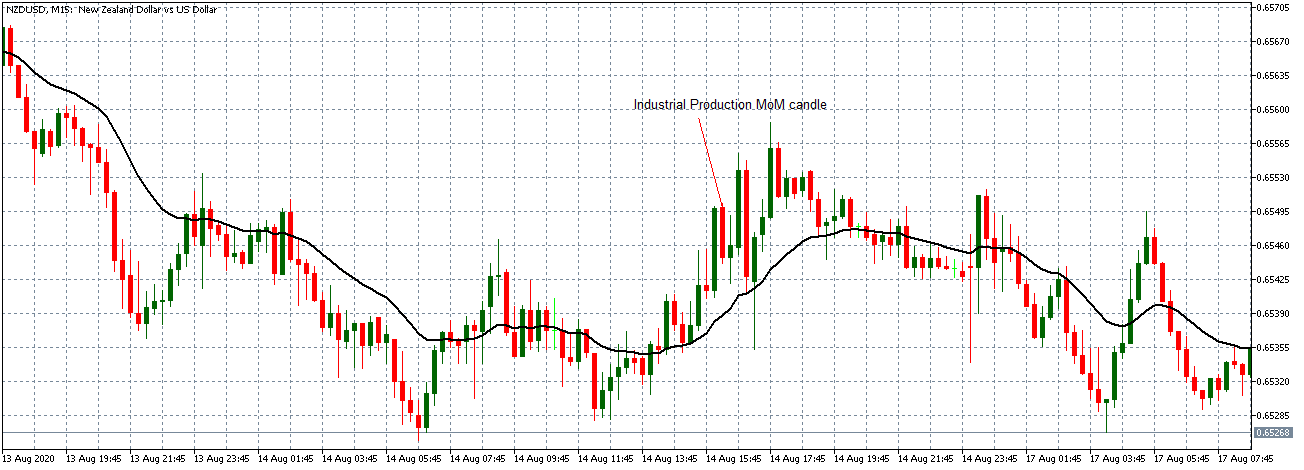
After the data release, the pair formed a 15-minute bearish candle. As observed with the EUR/USD pair, NZD/USD continued trading in the earlier observed uptrend with the 20-period Moving Average steeply rising.

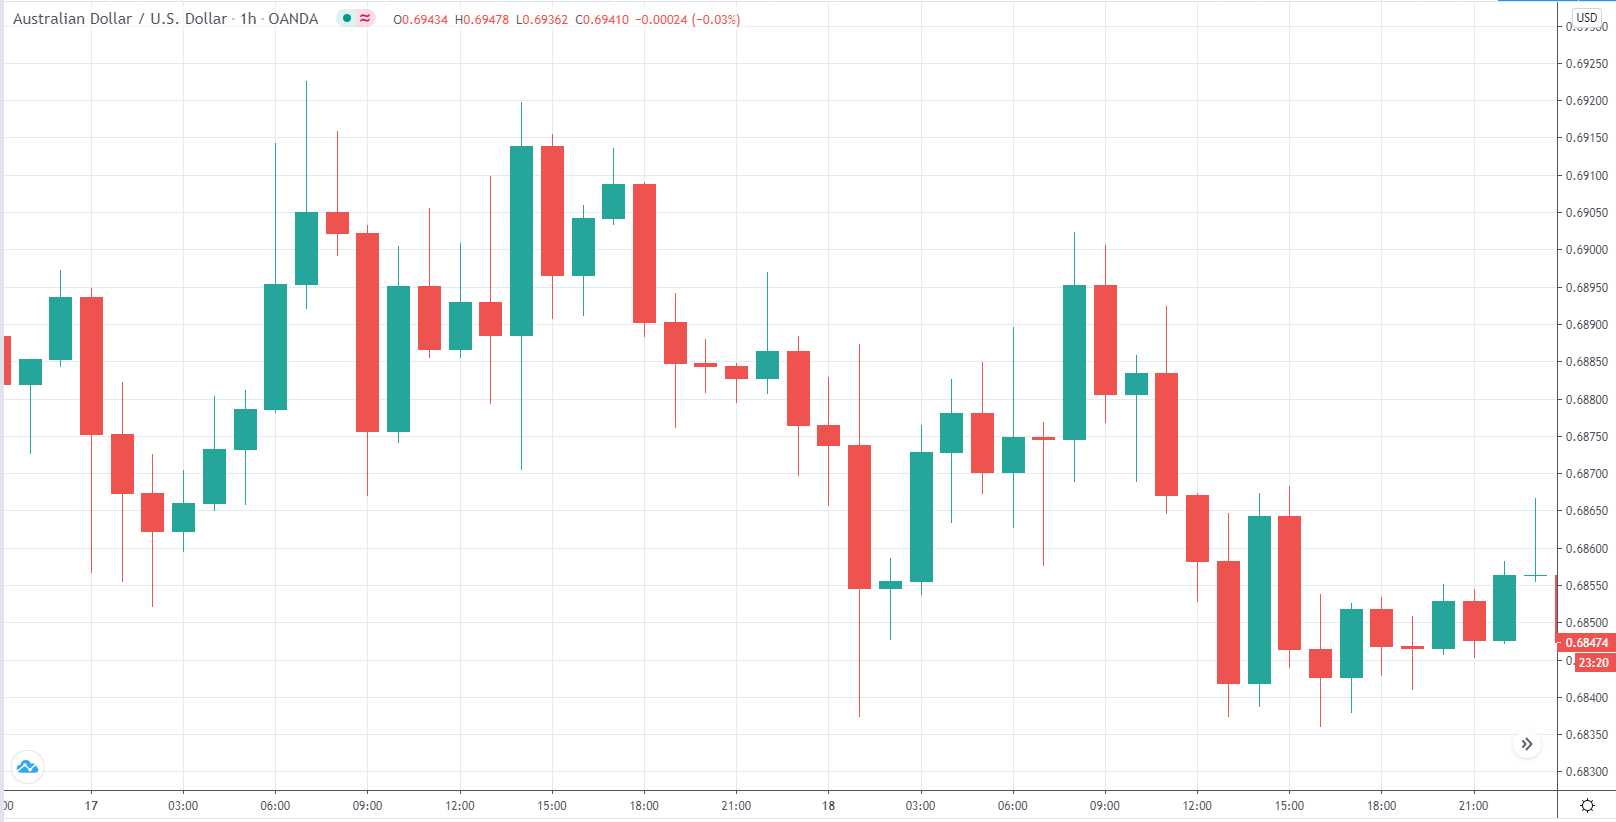
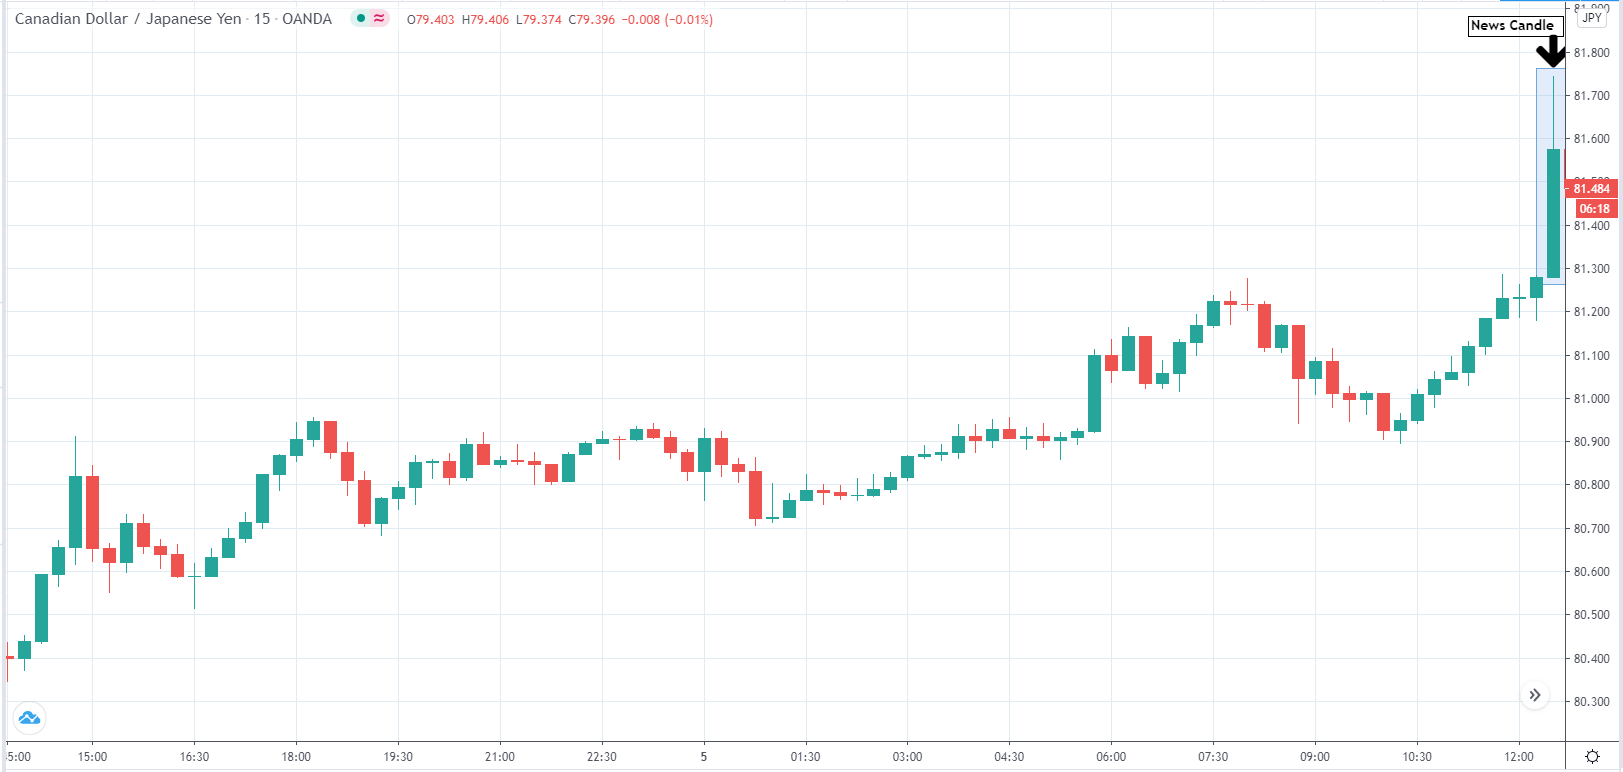
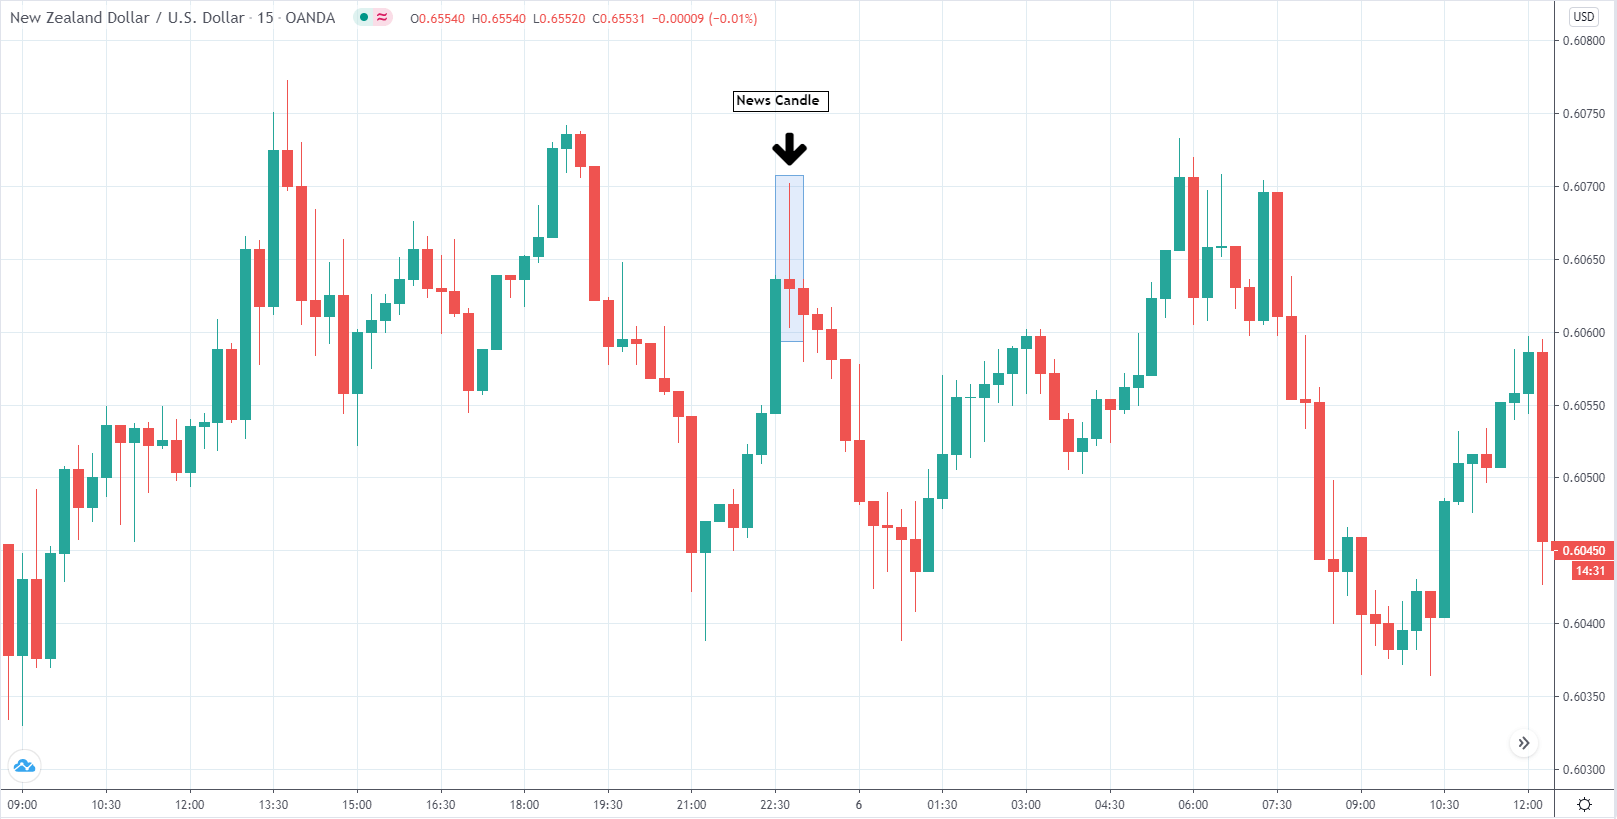
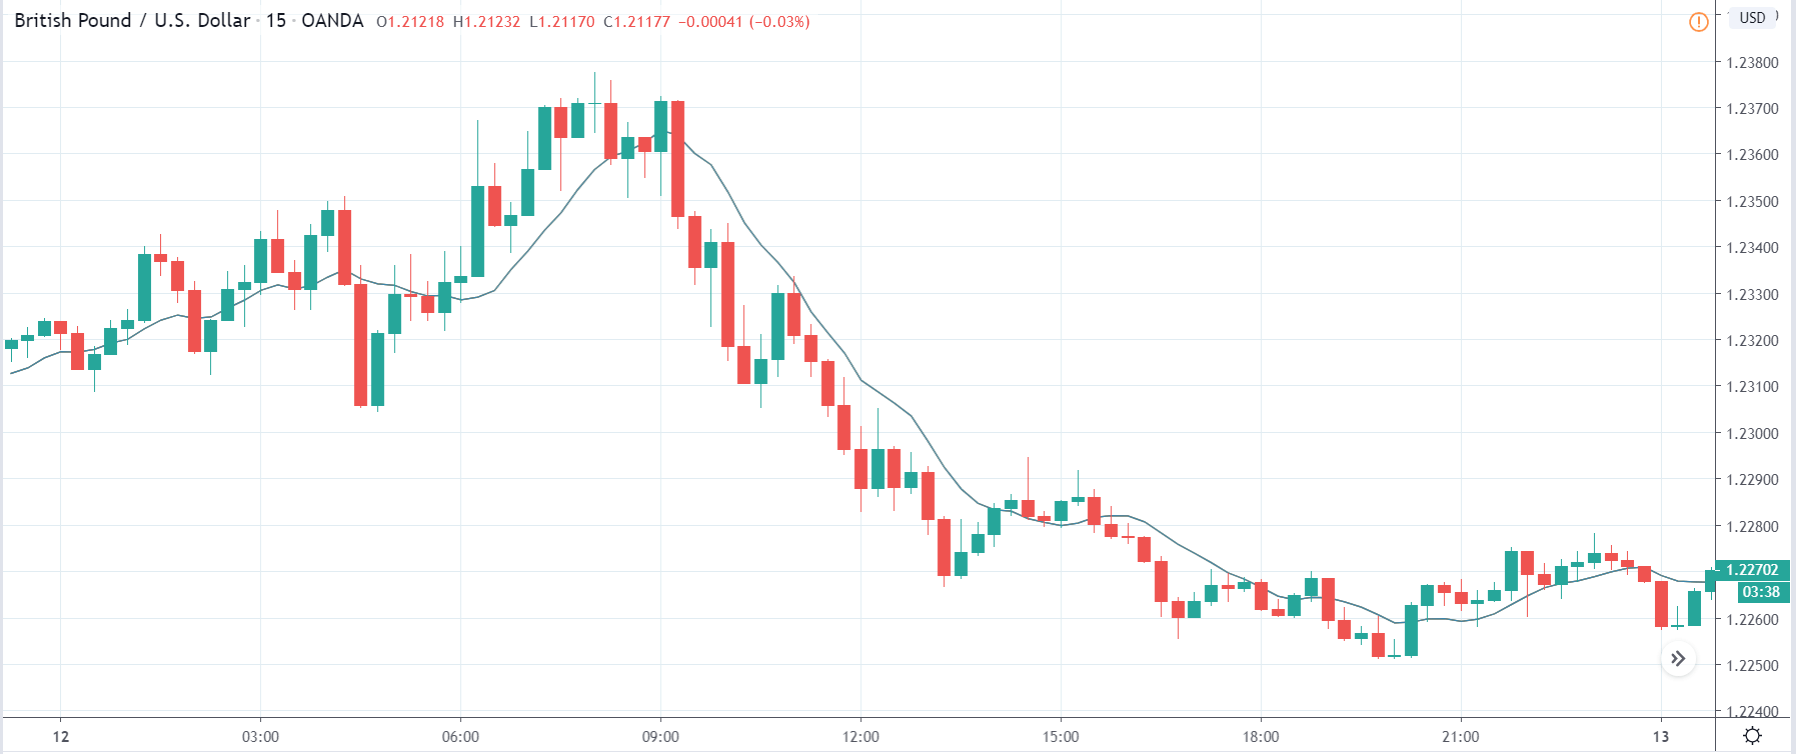
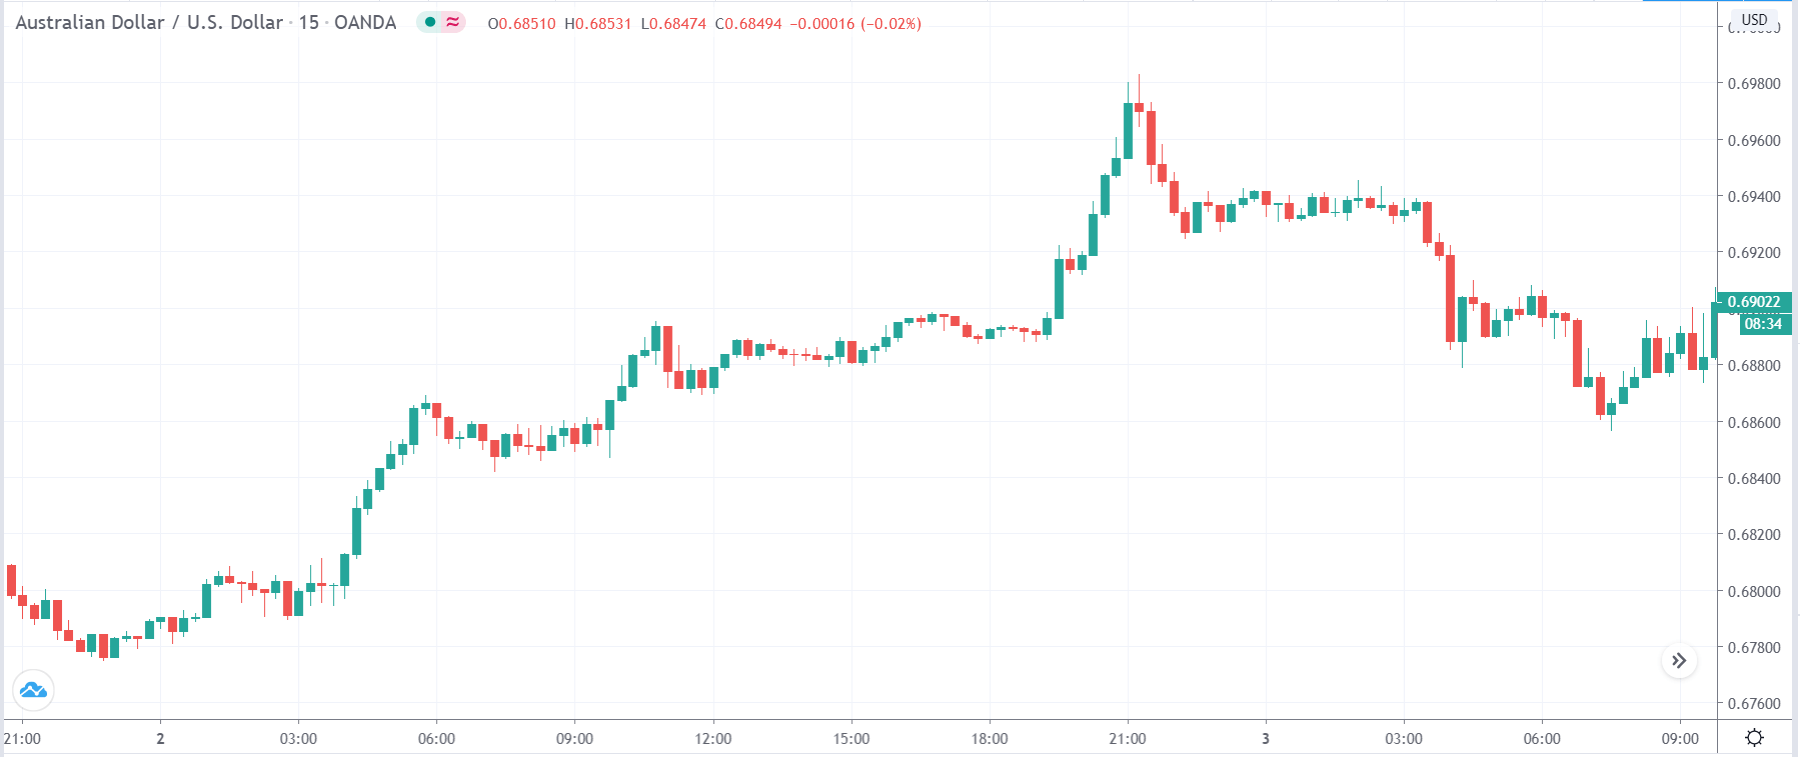
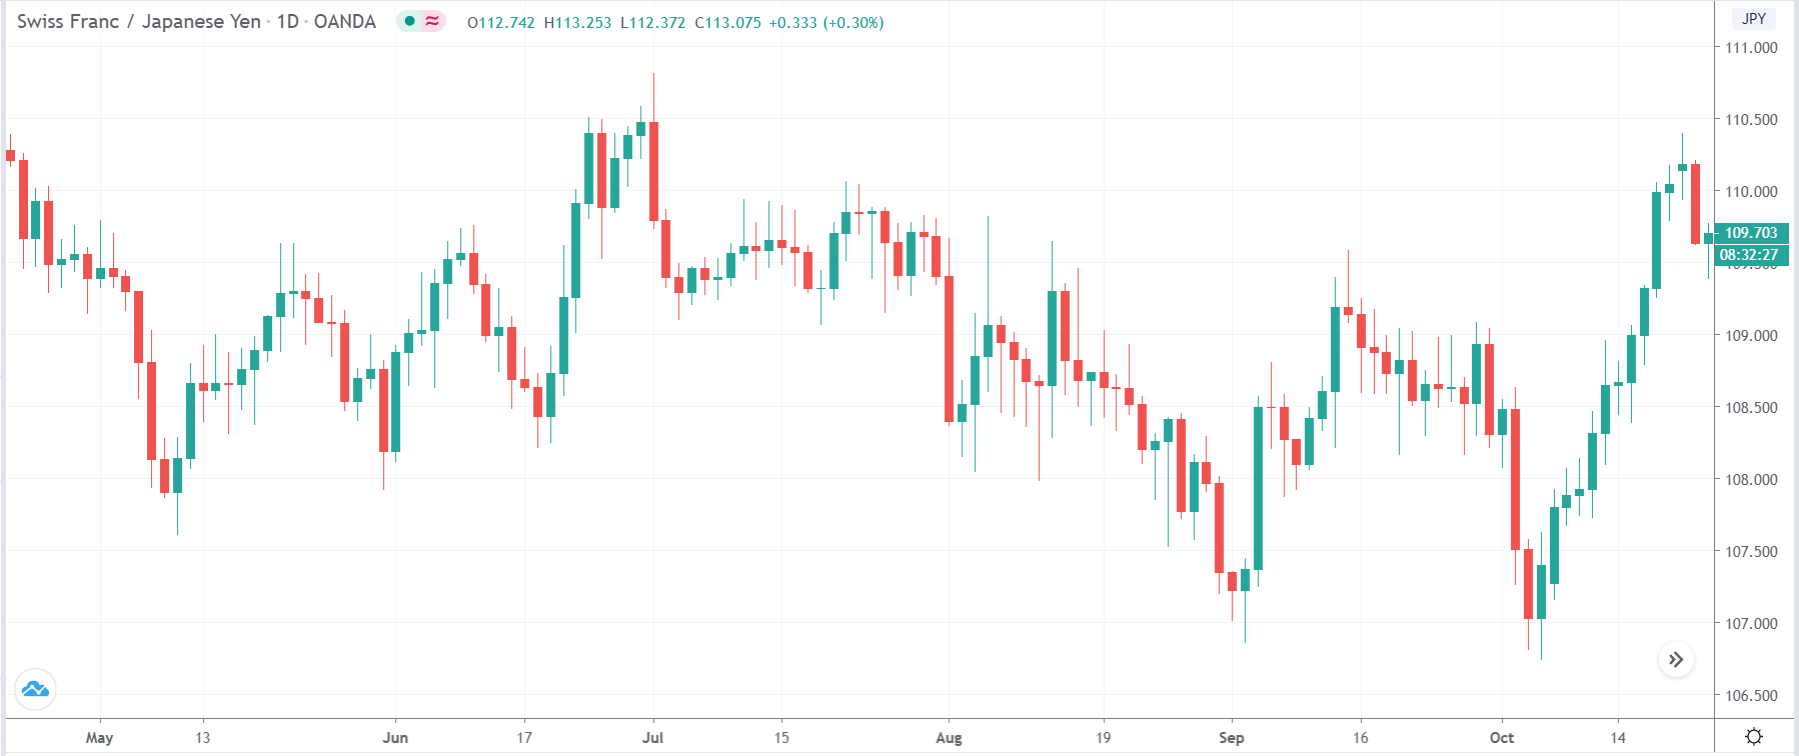
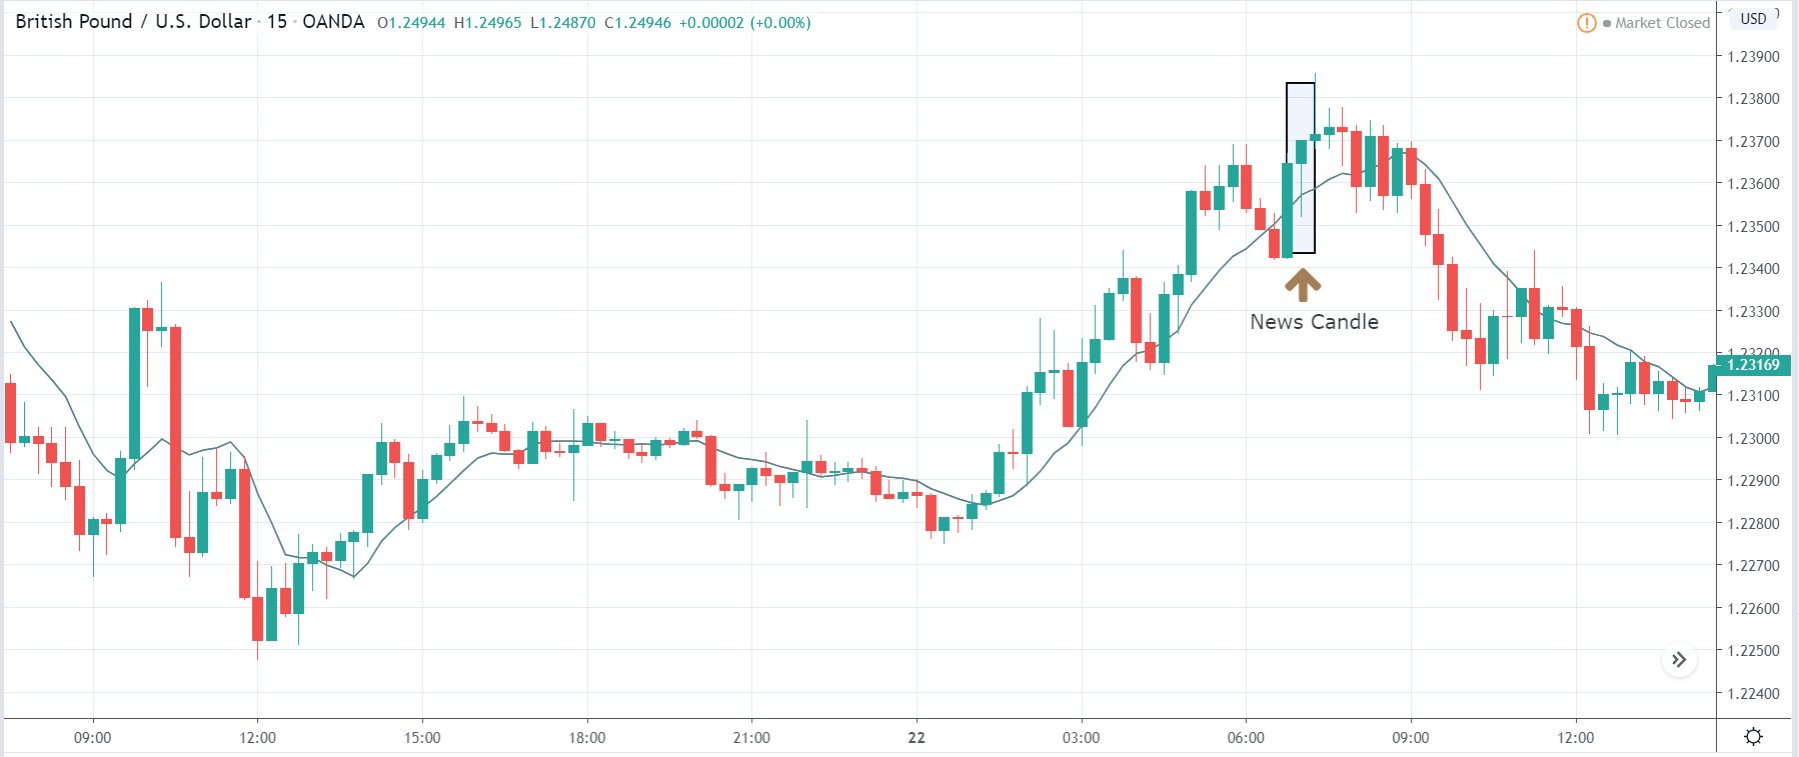
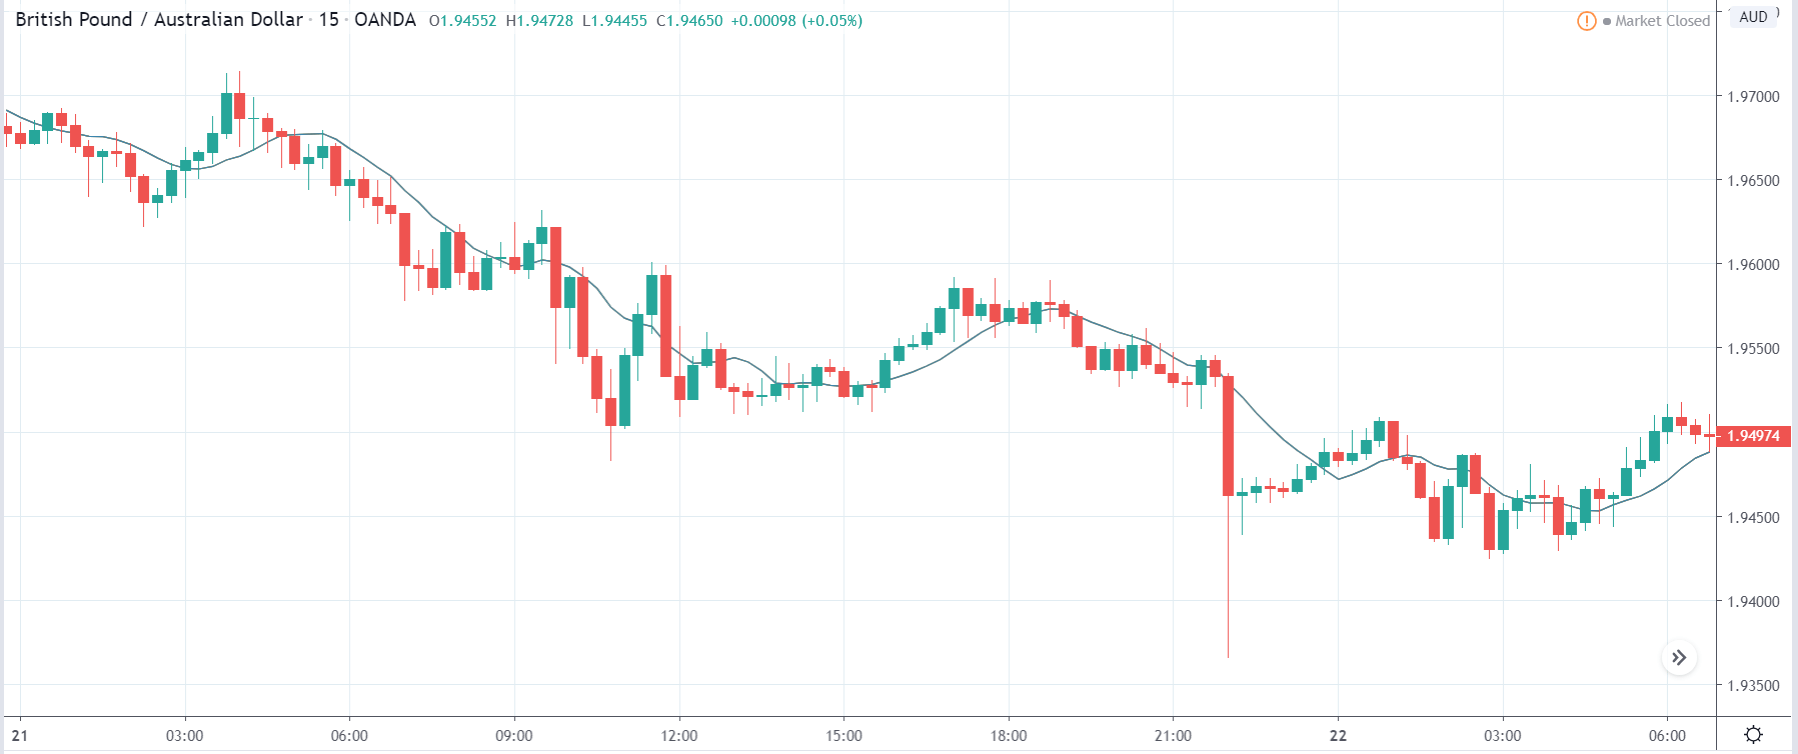
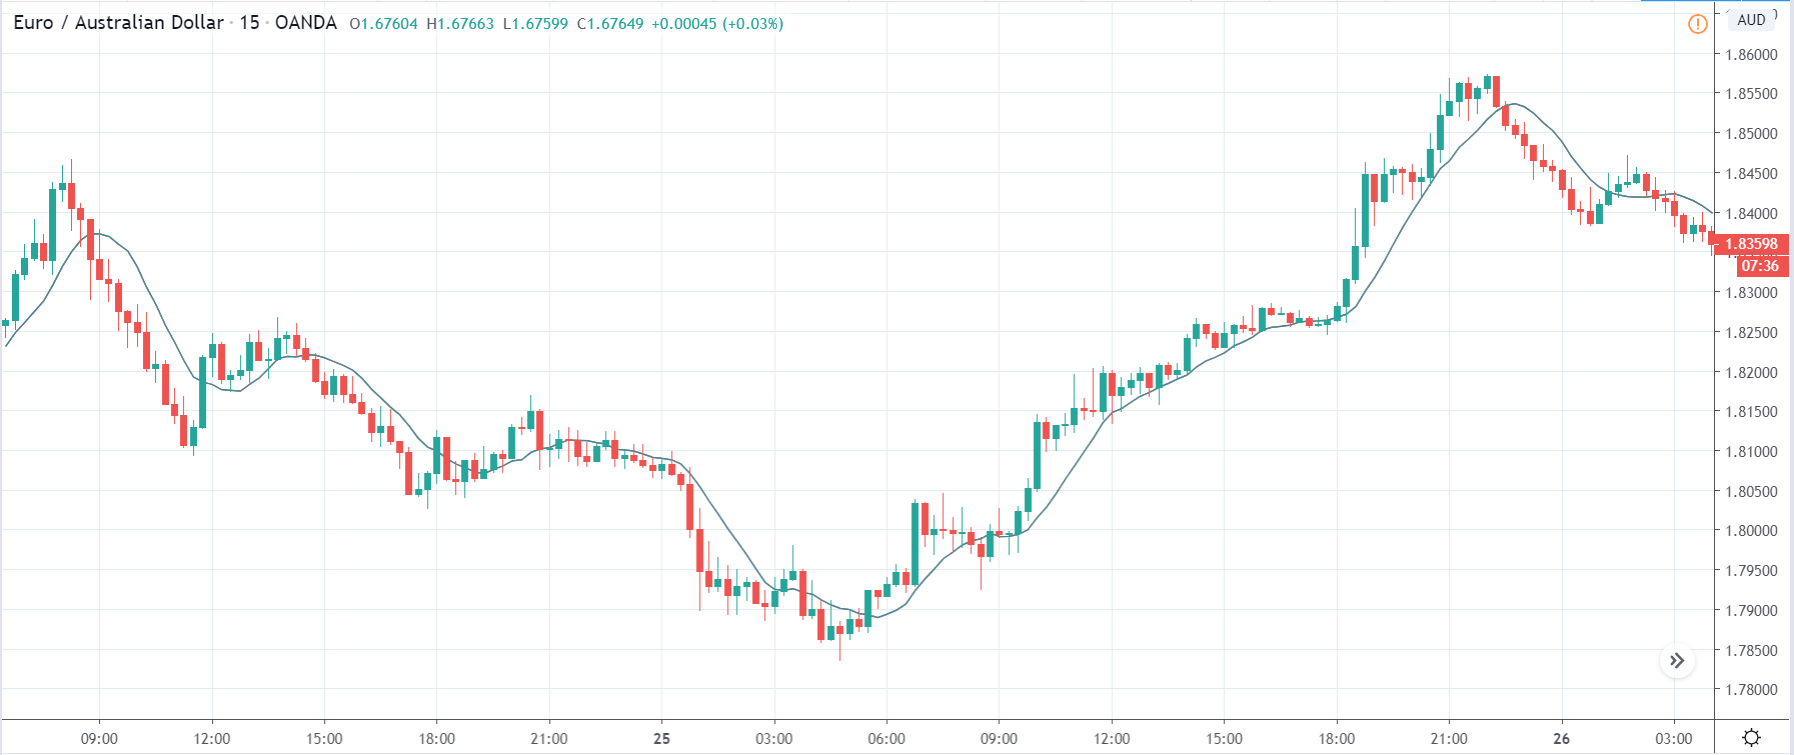
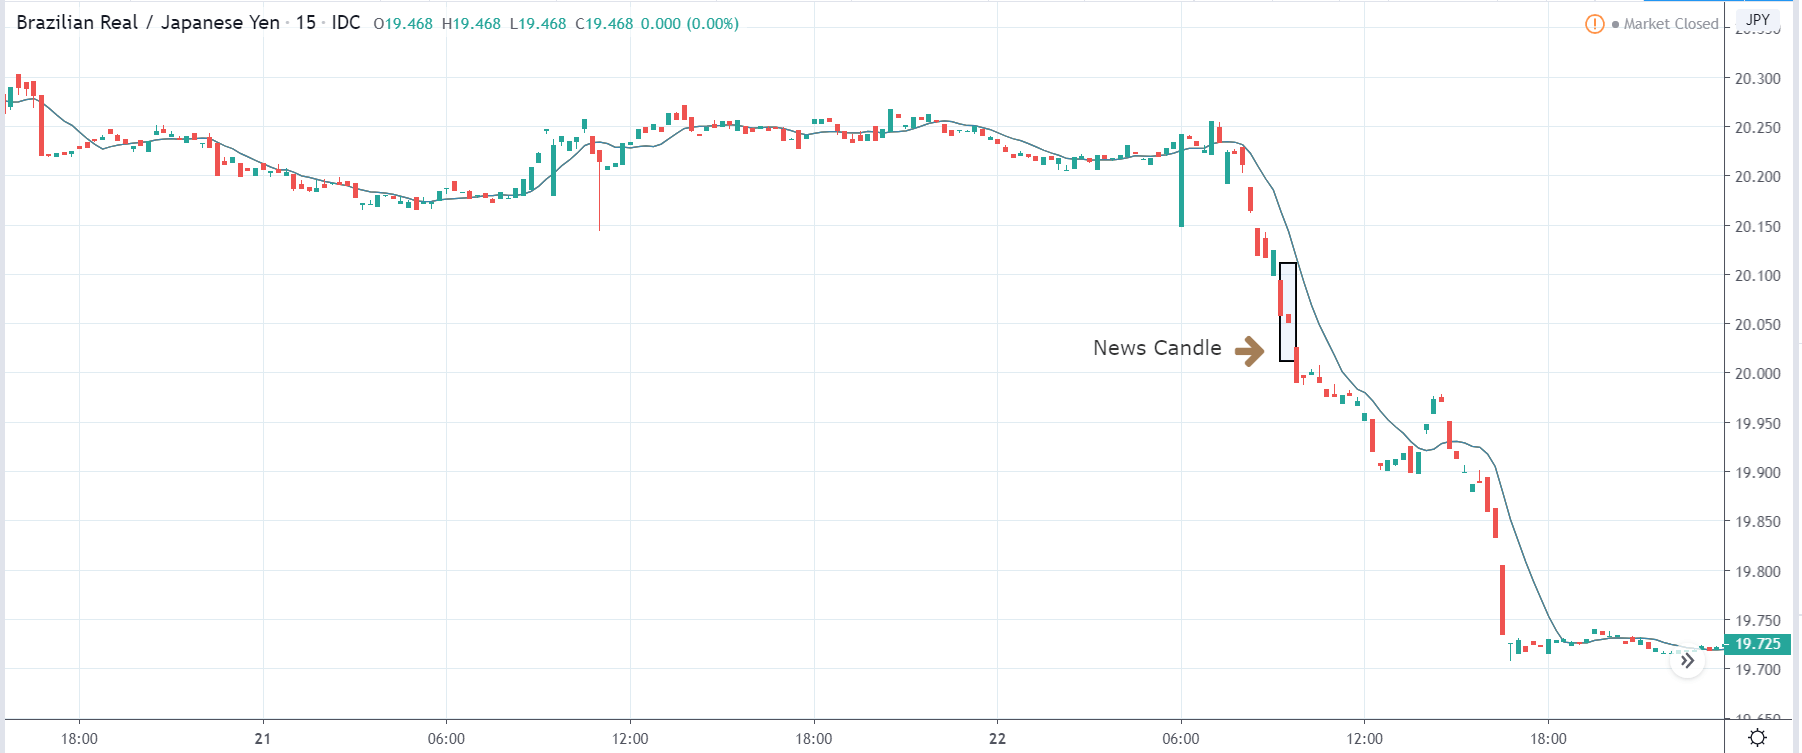
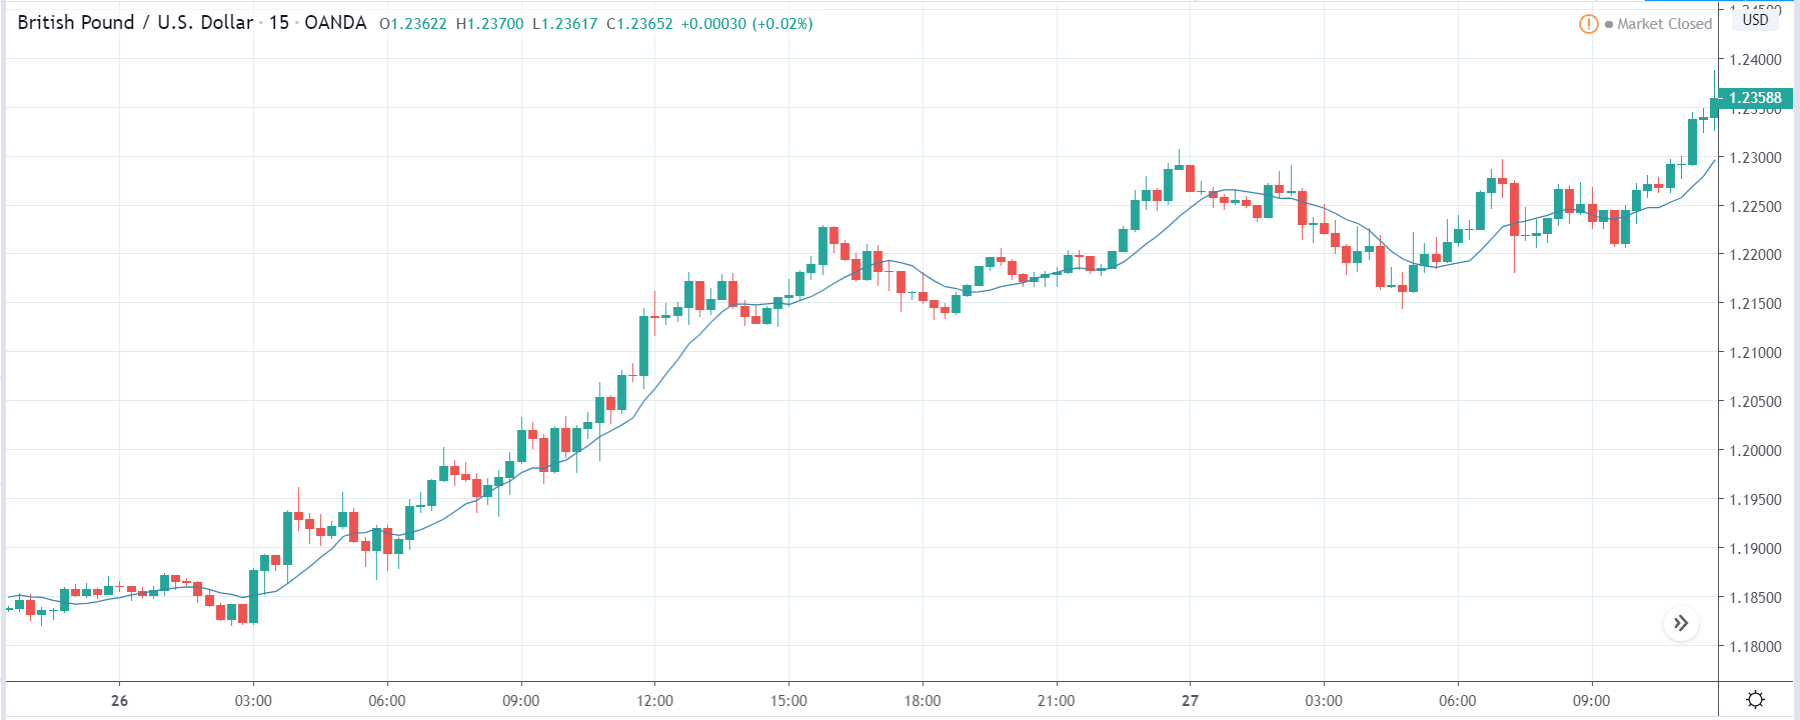
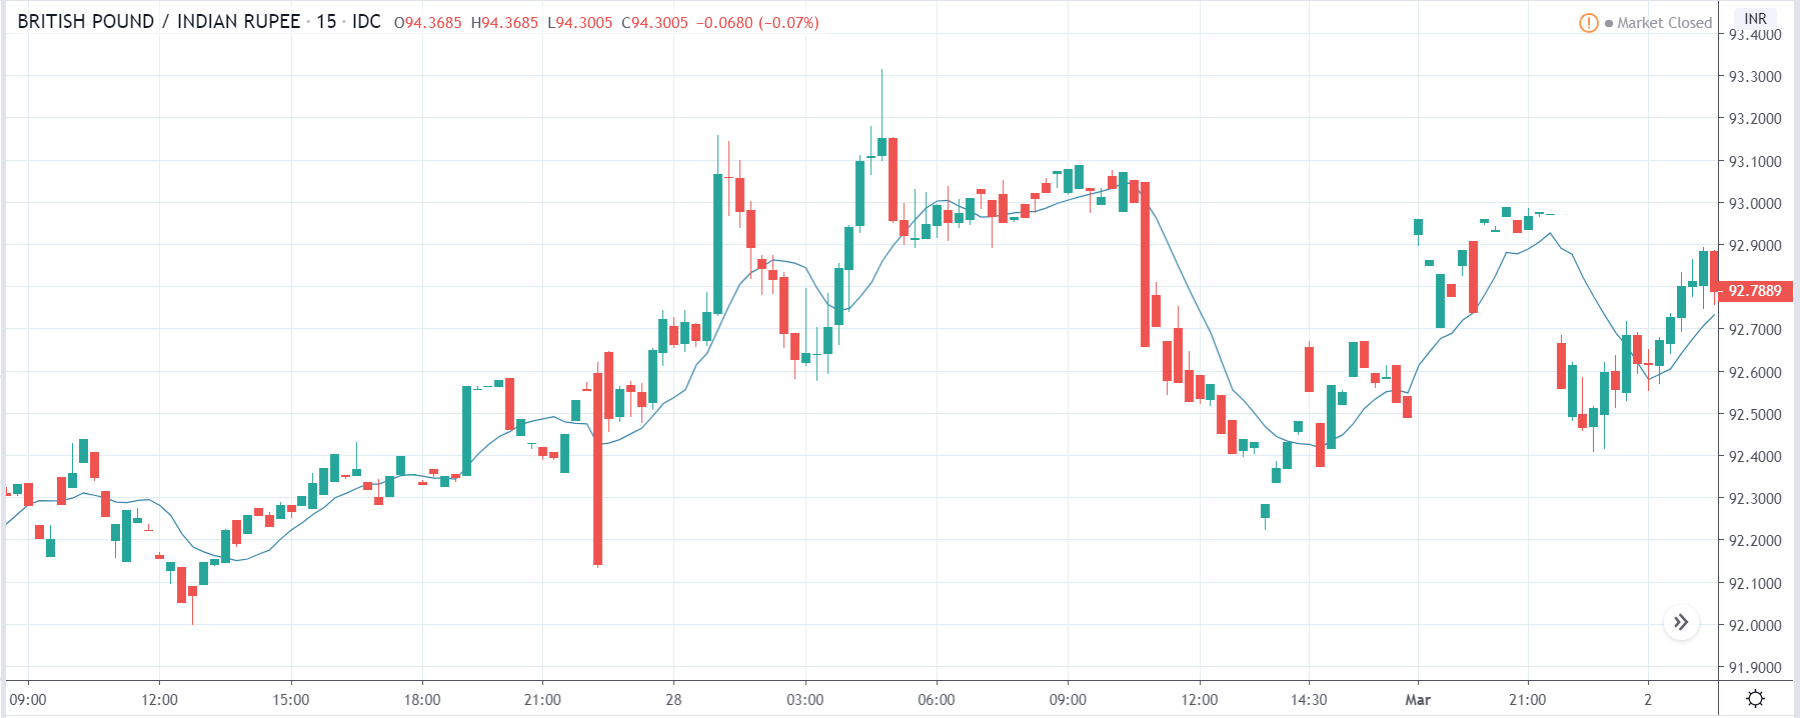
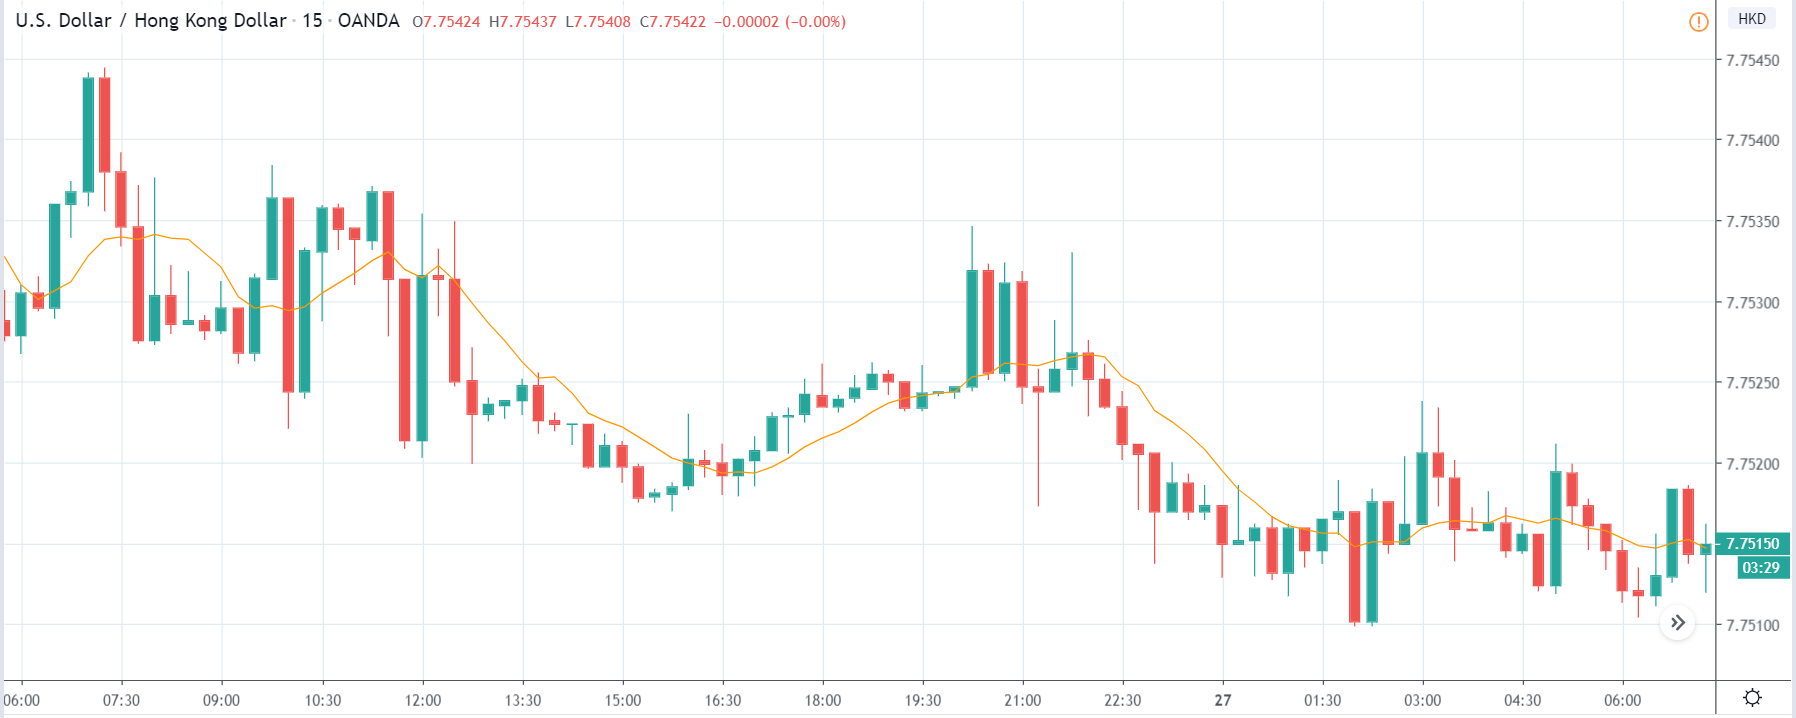
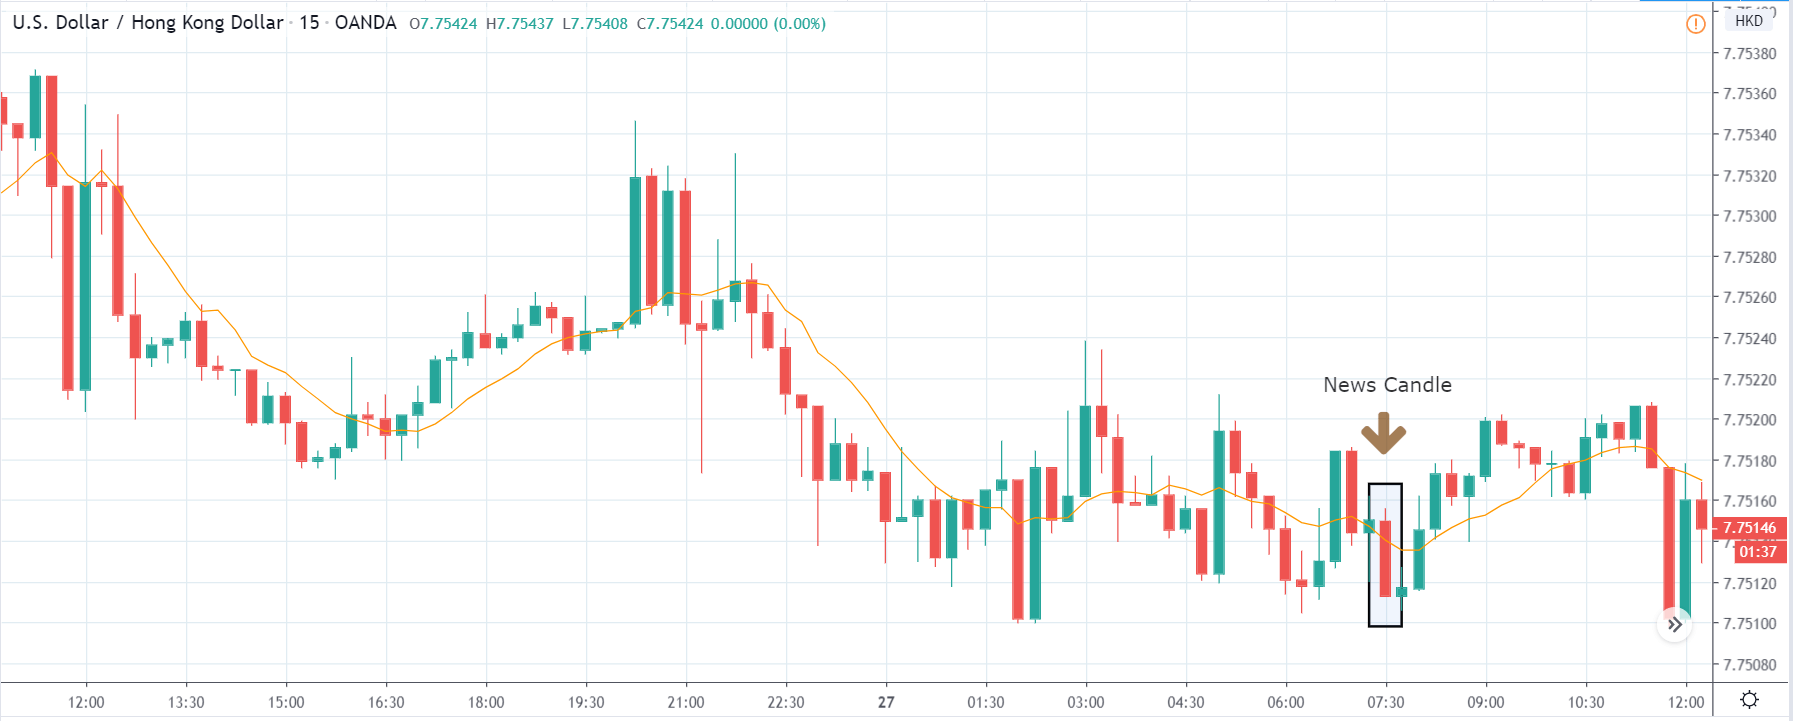
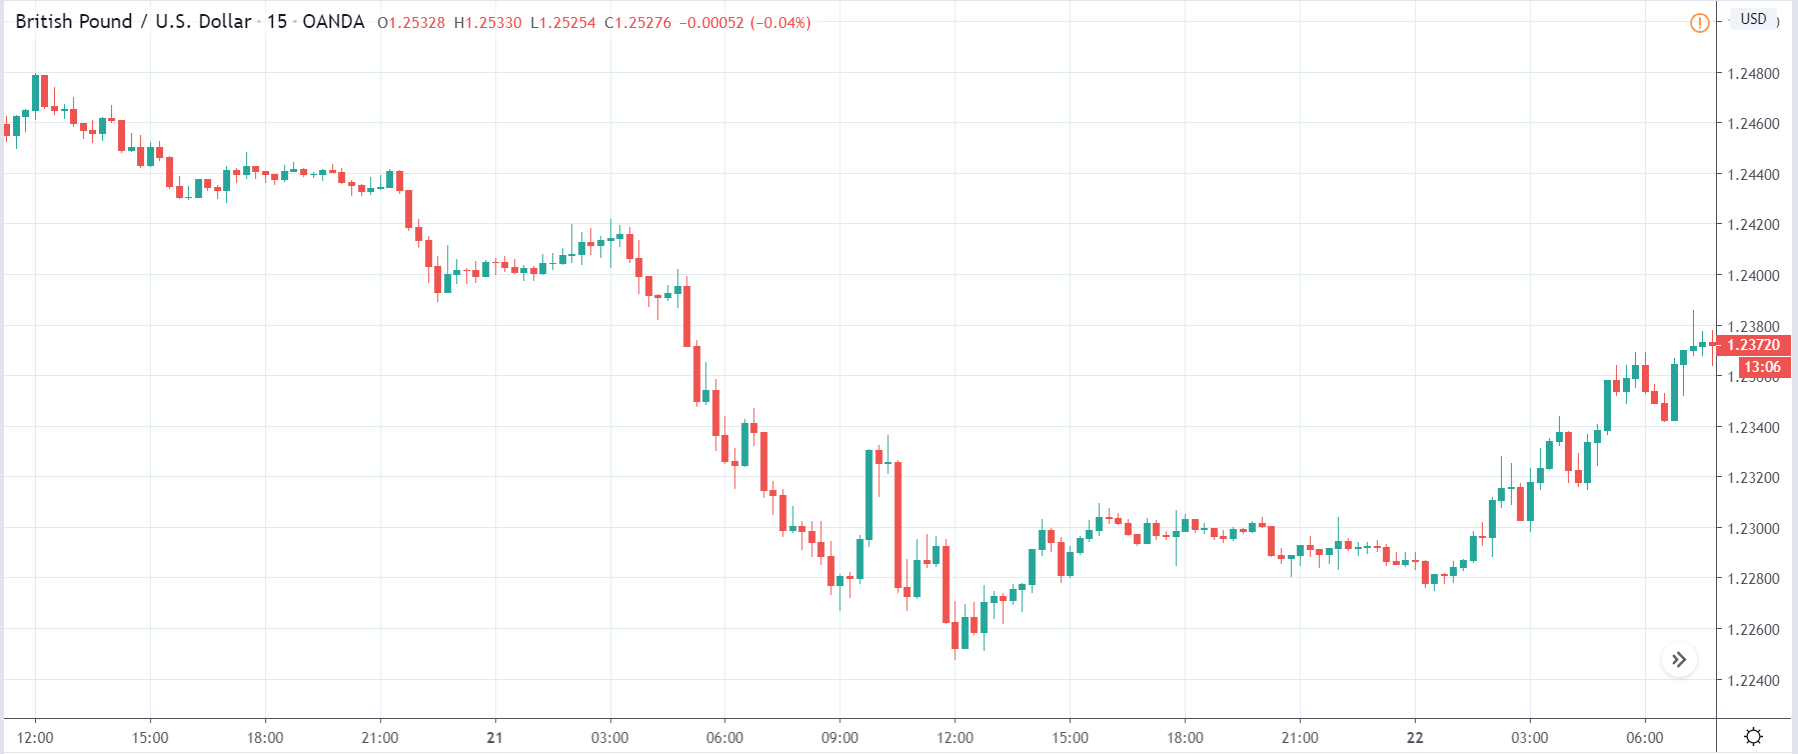
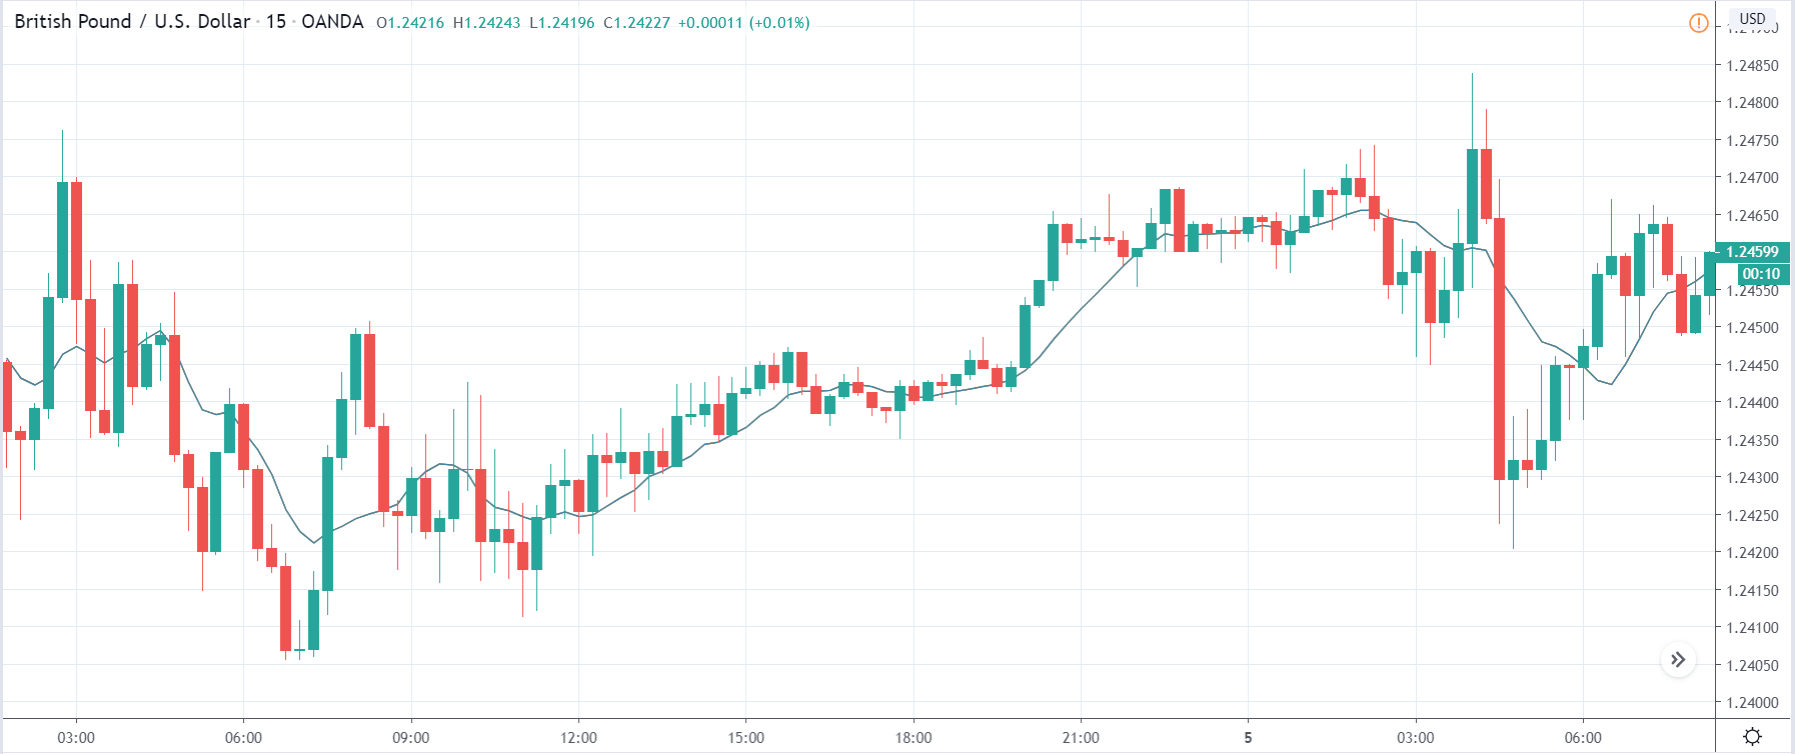
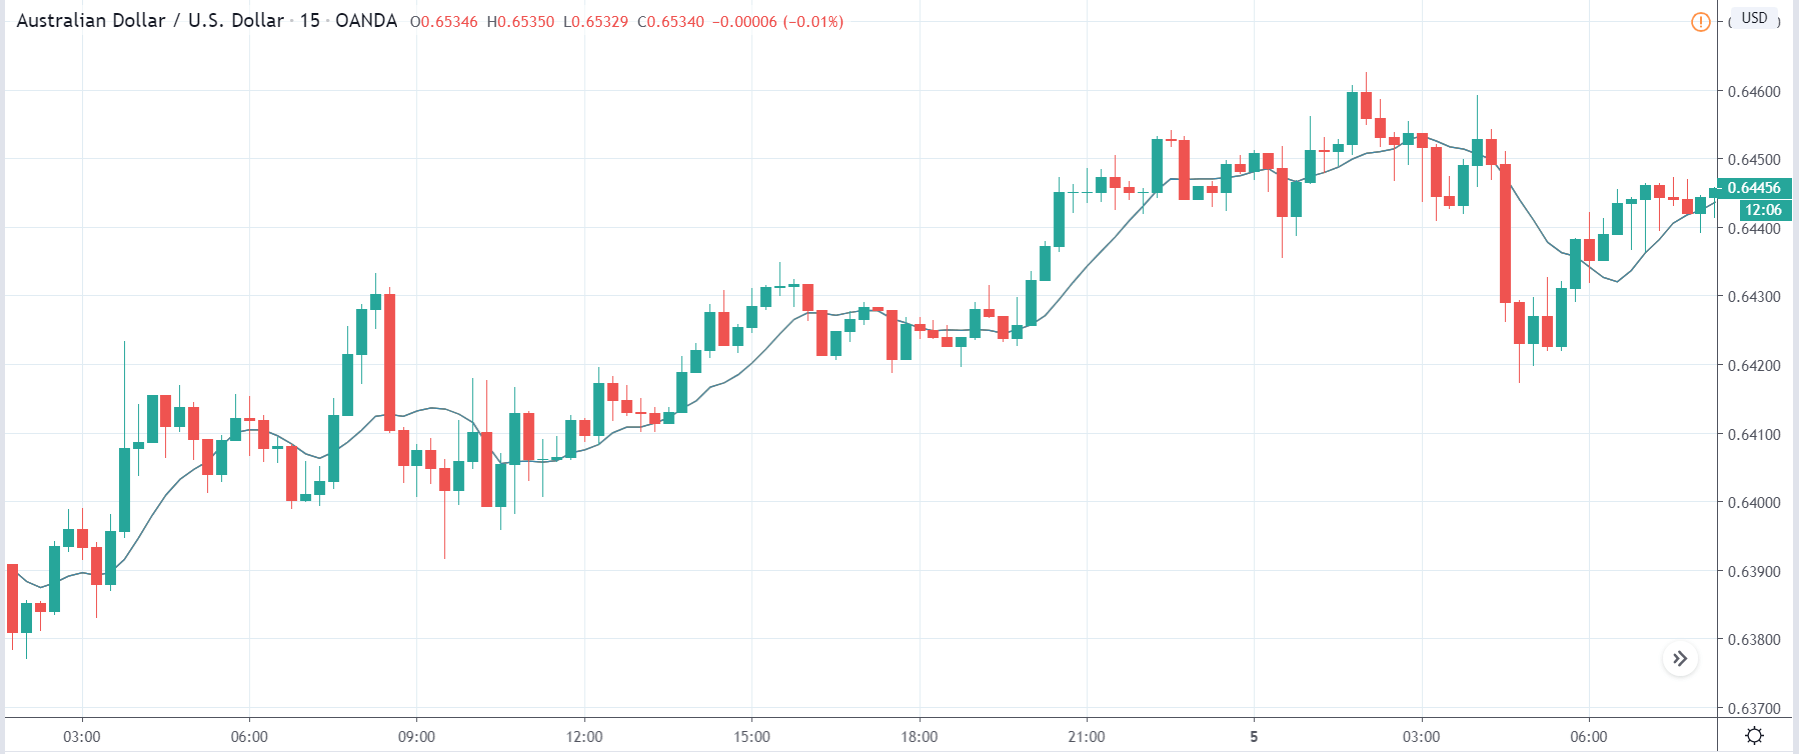
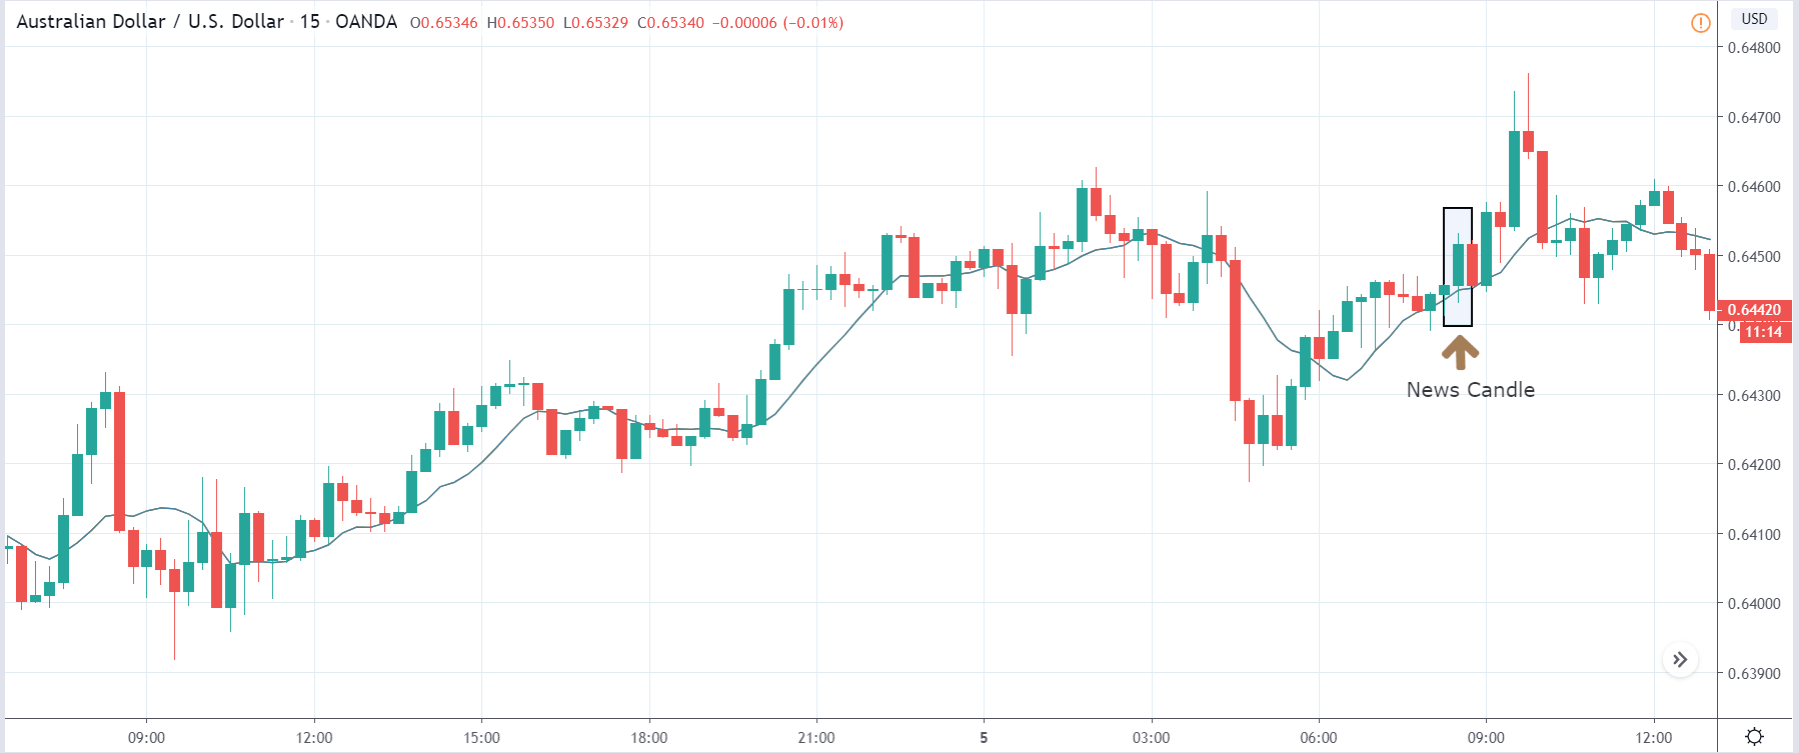
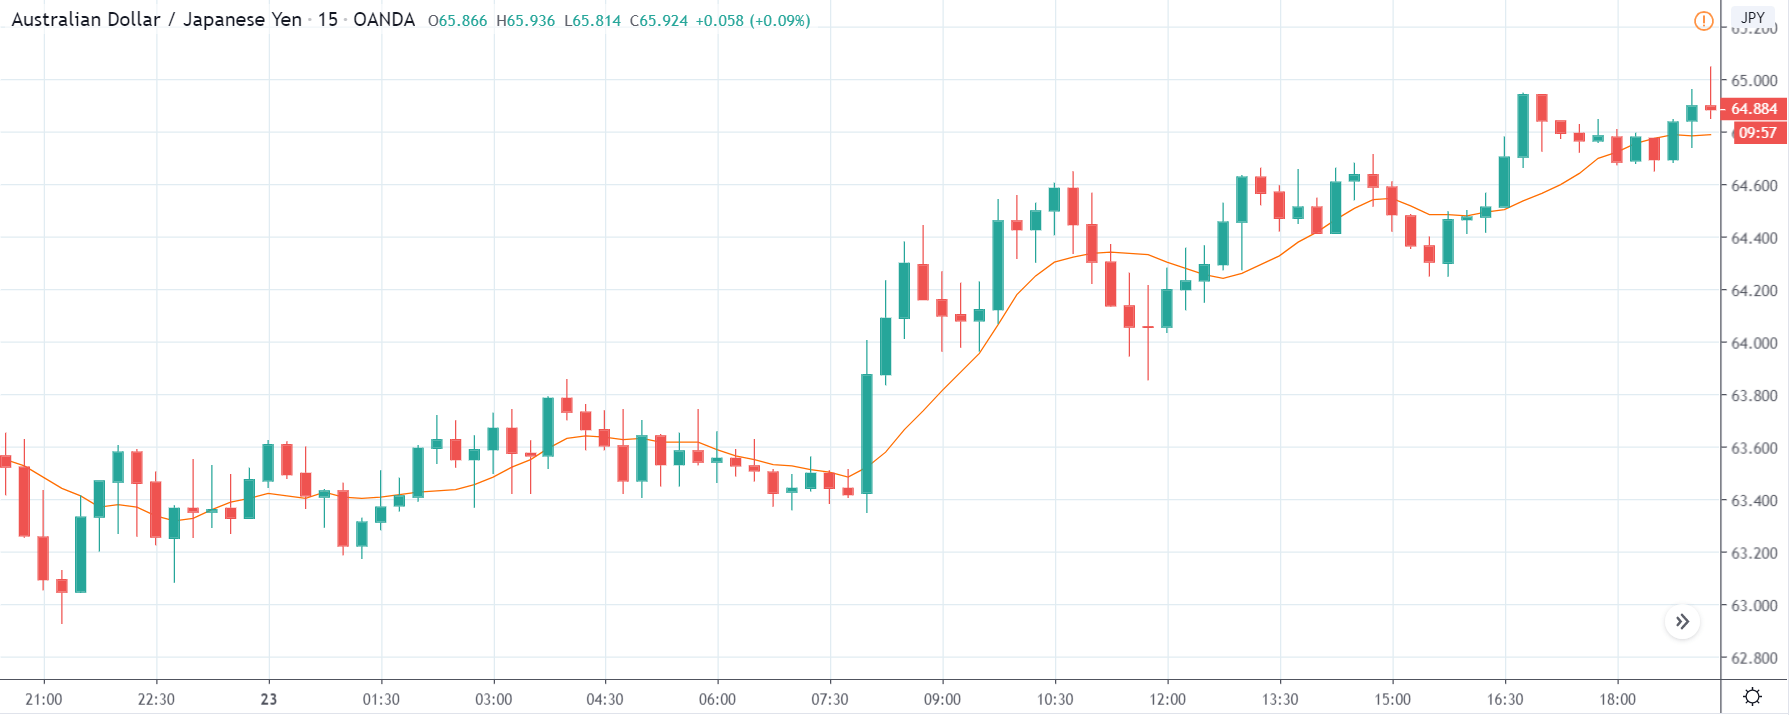
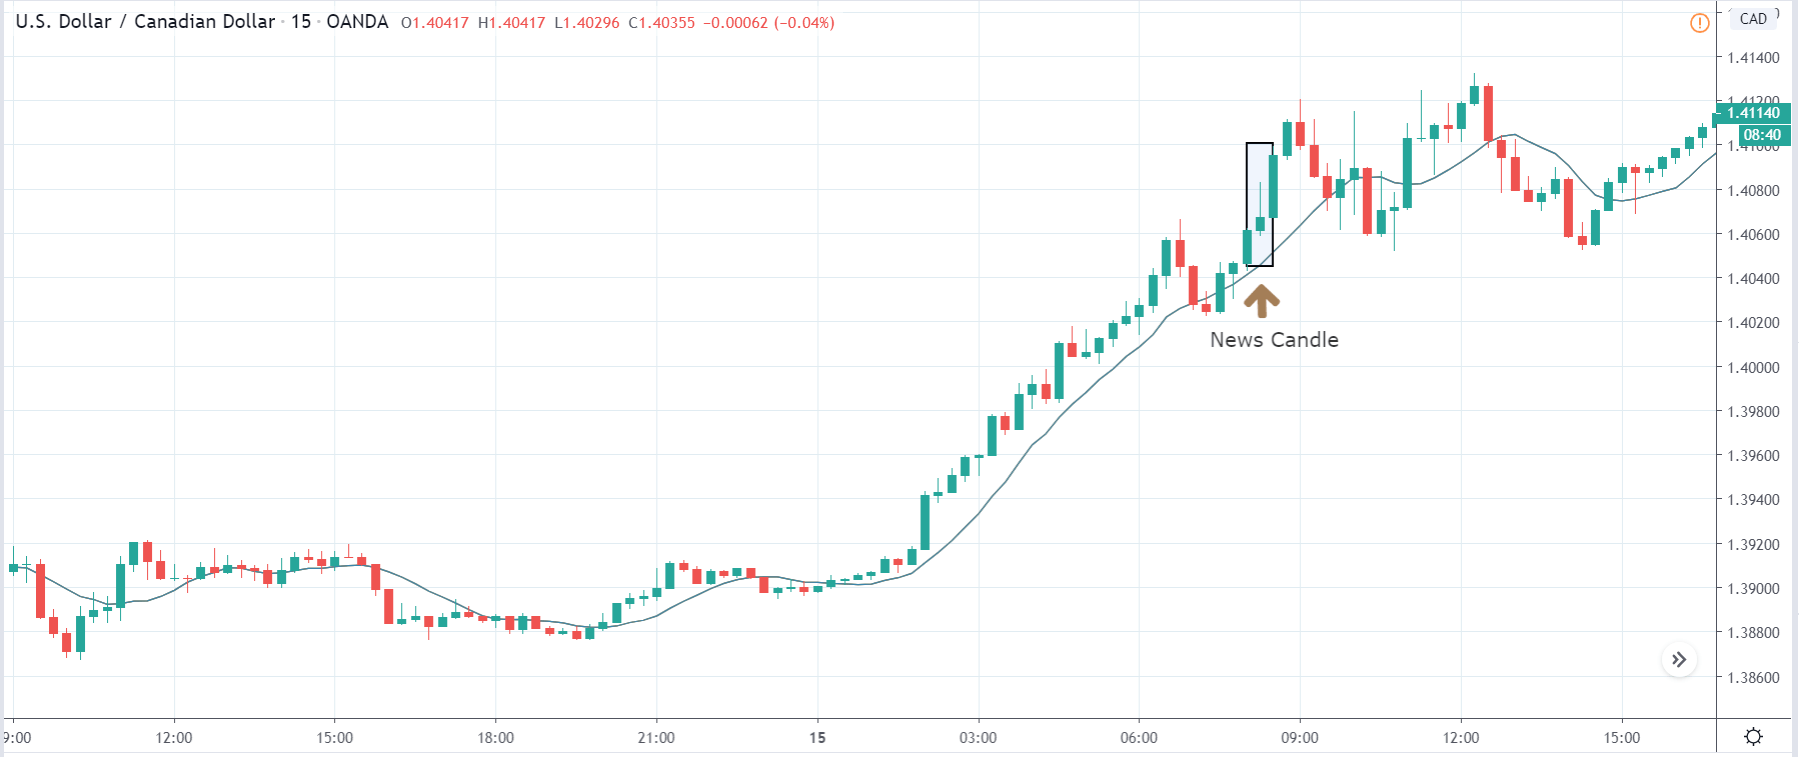
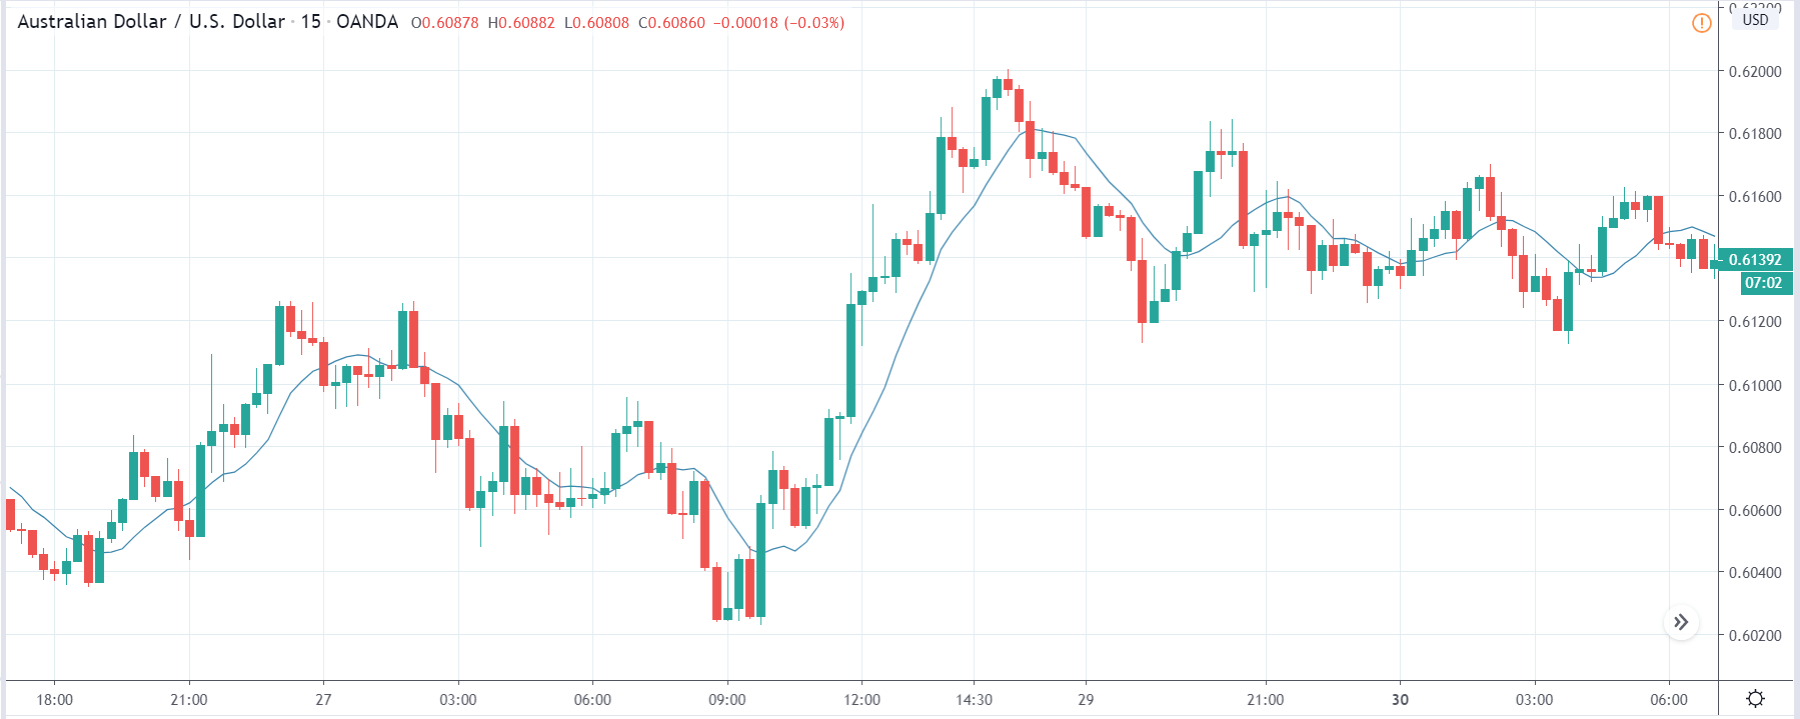
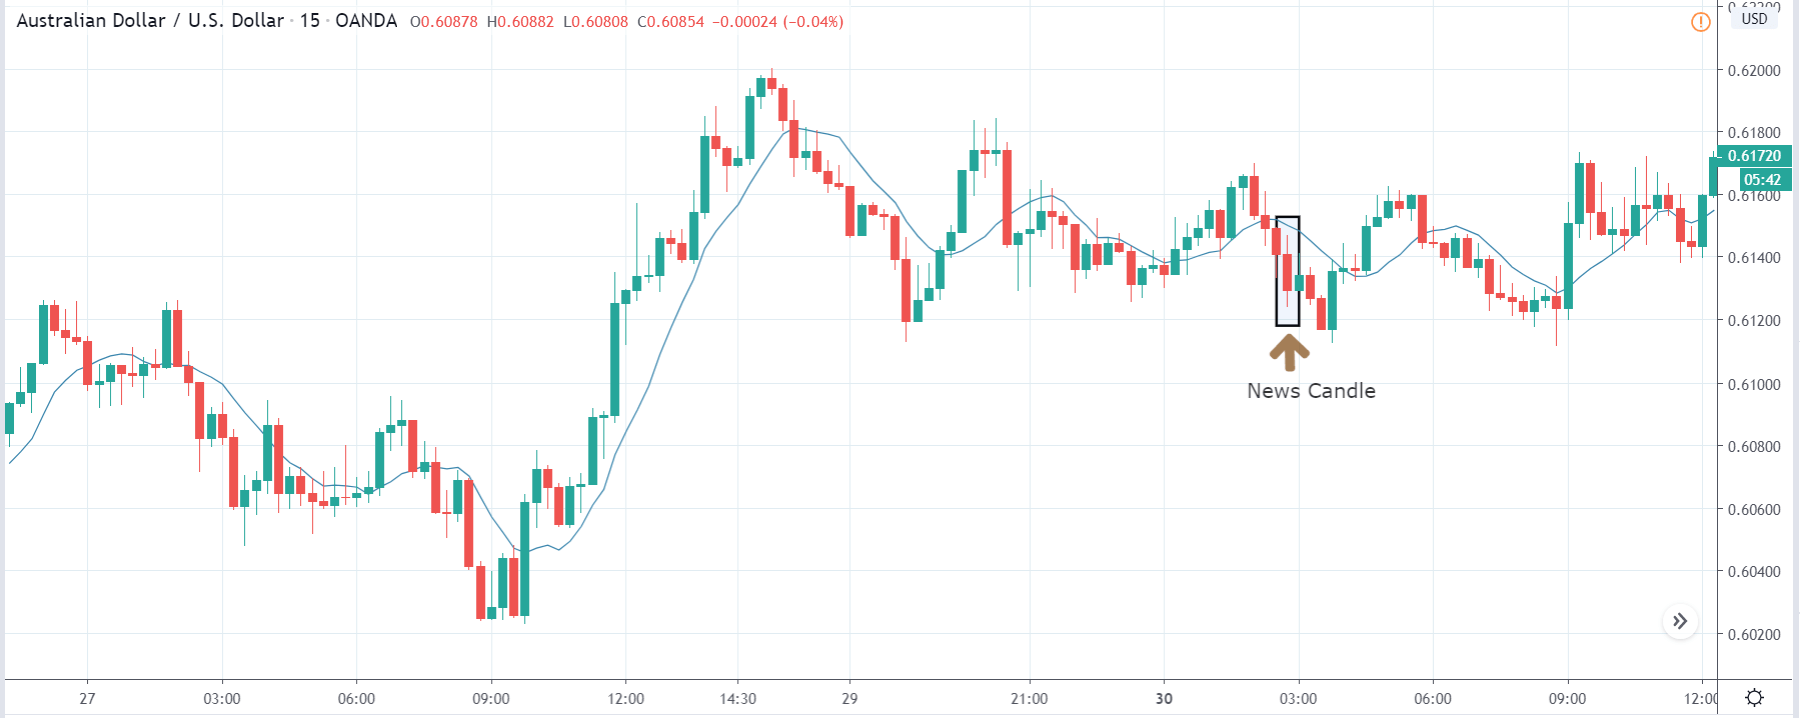
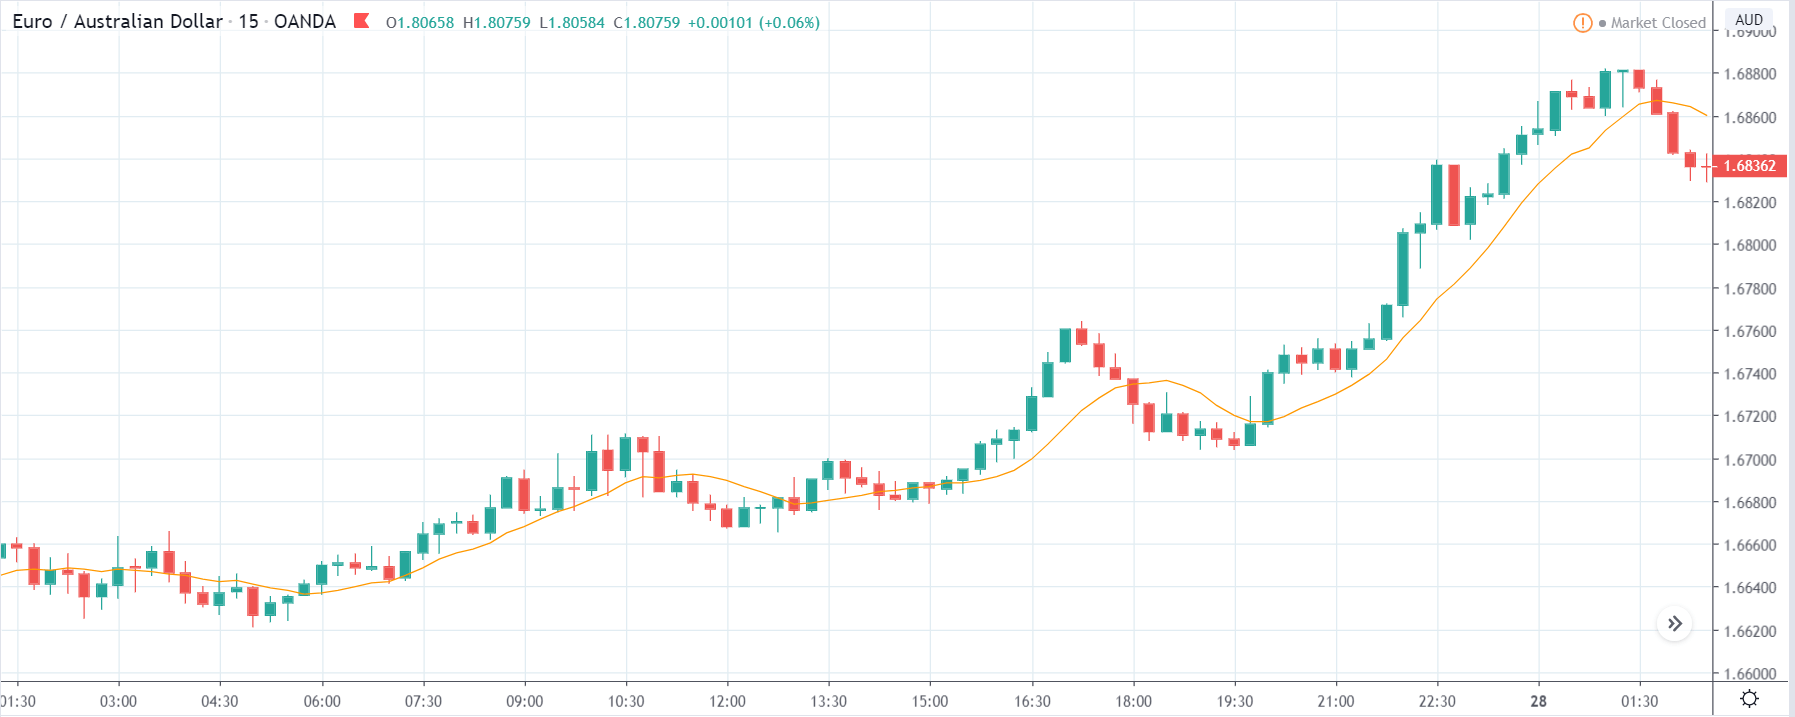
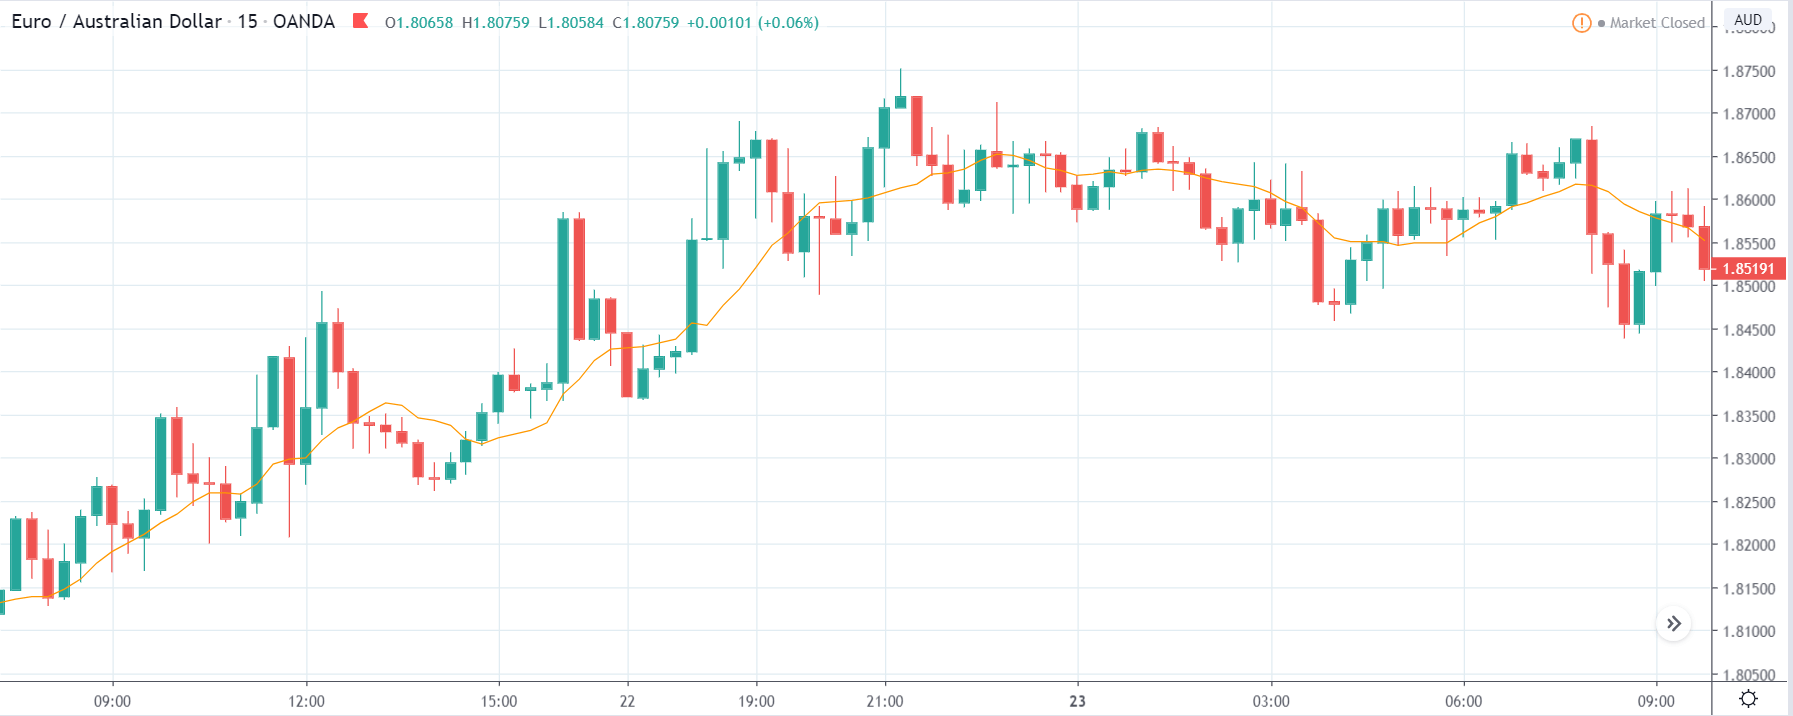
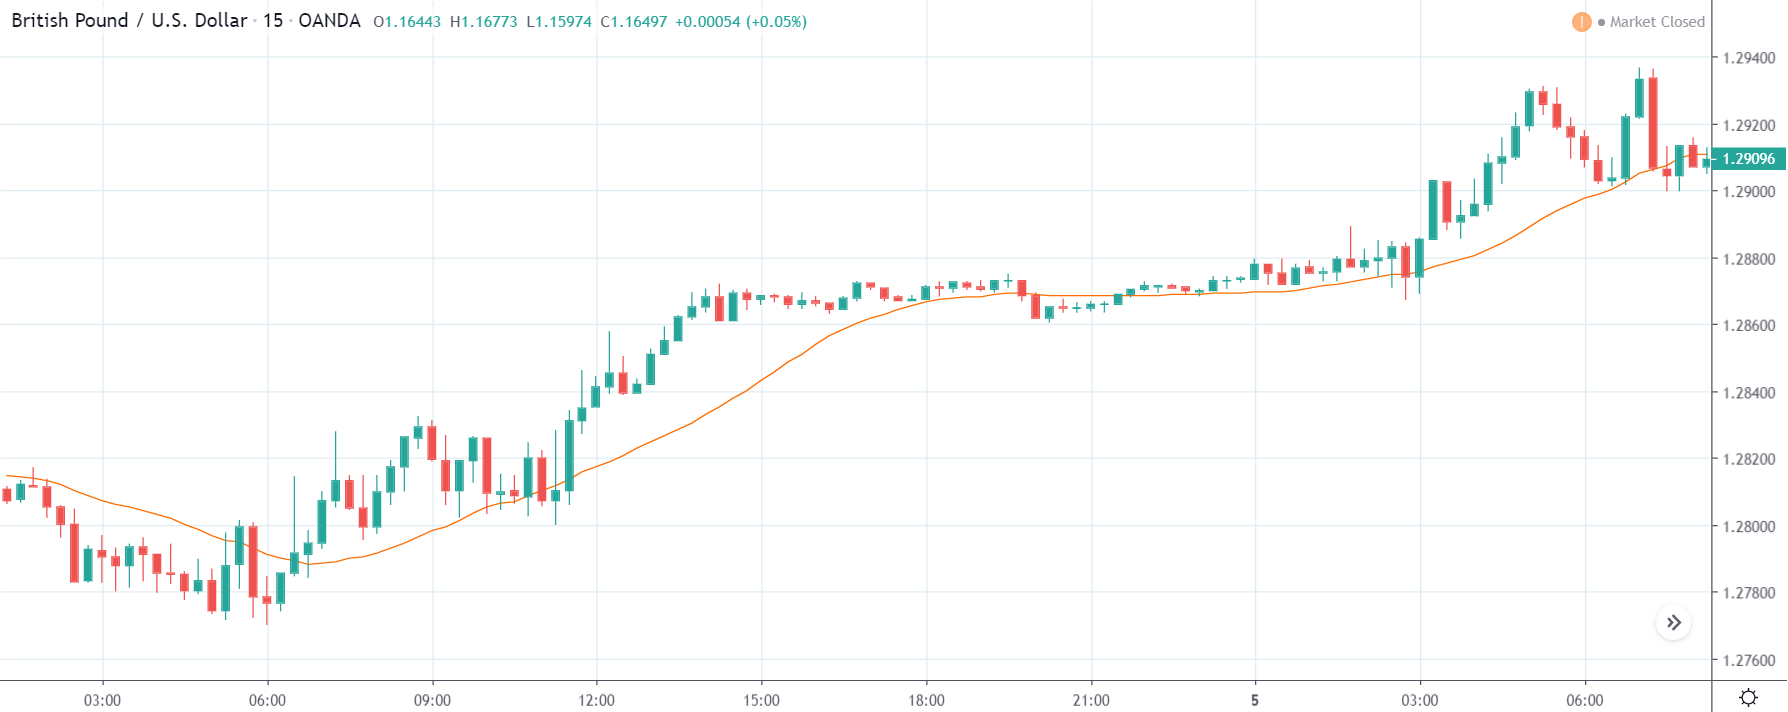
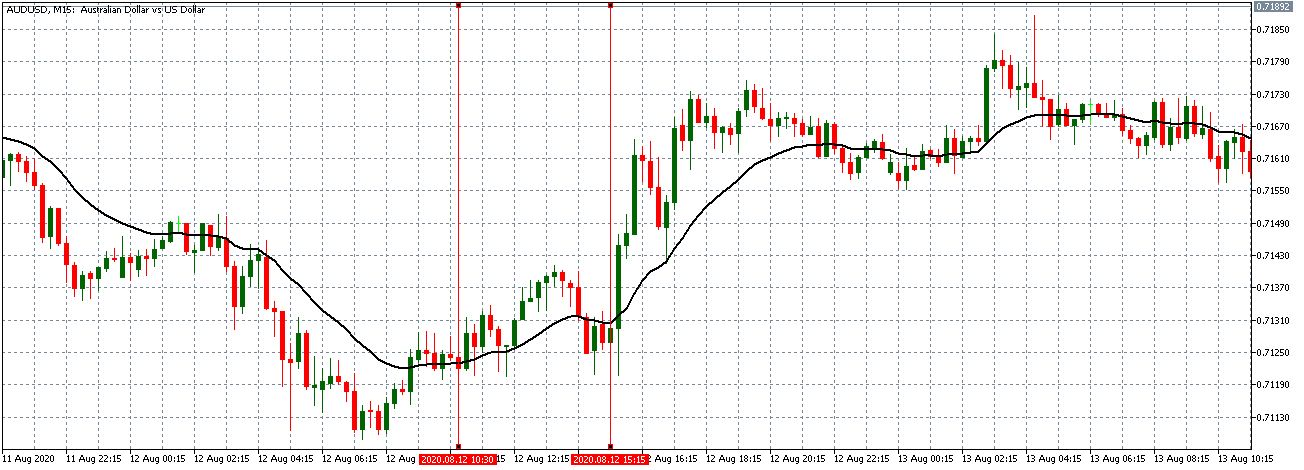
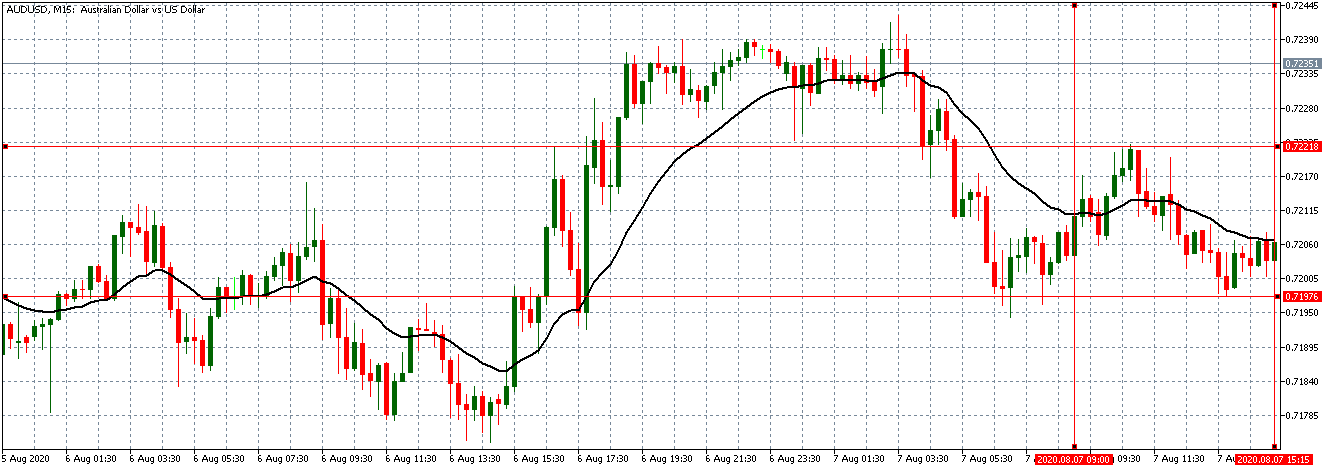
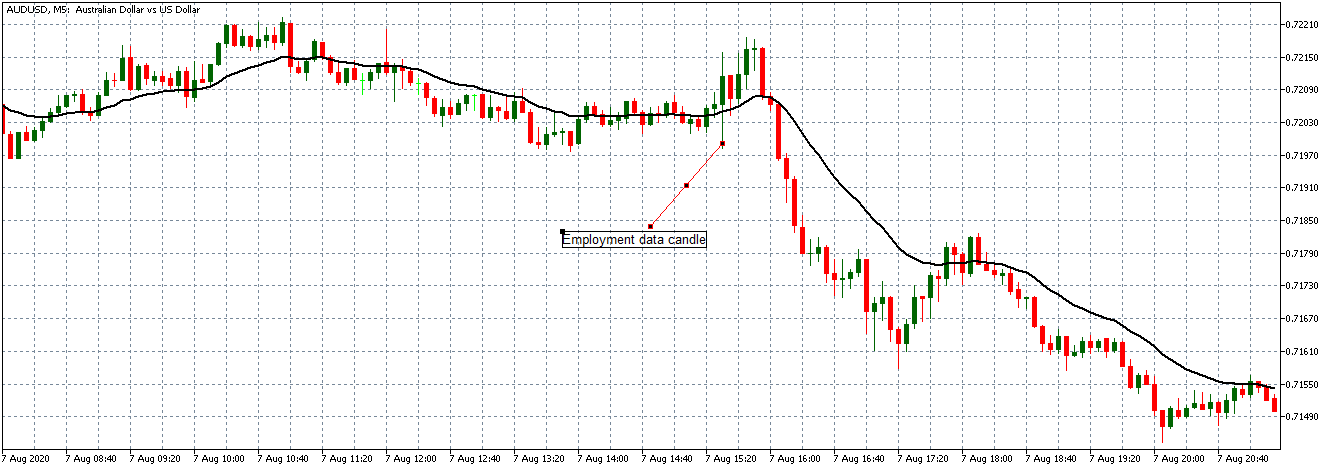
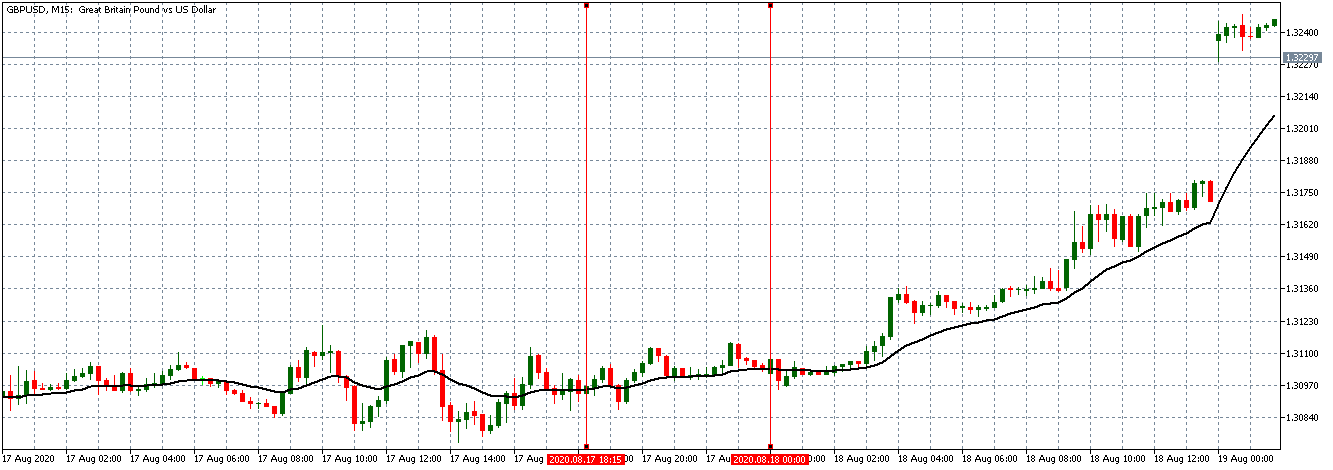
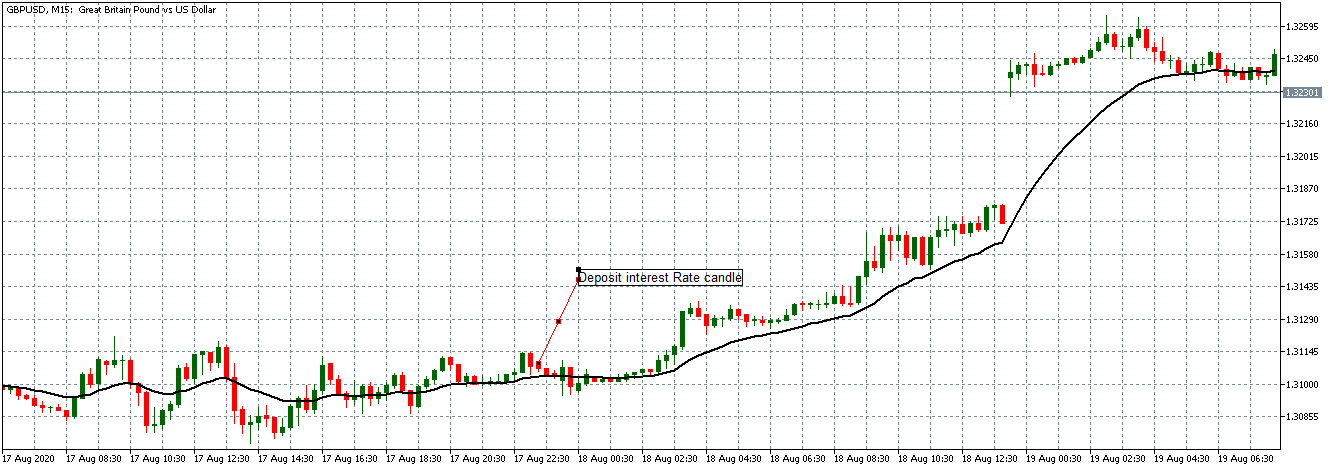
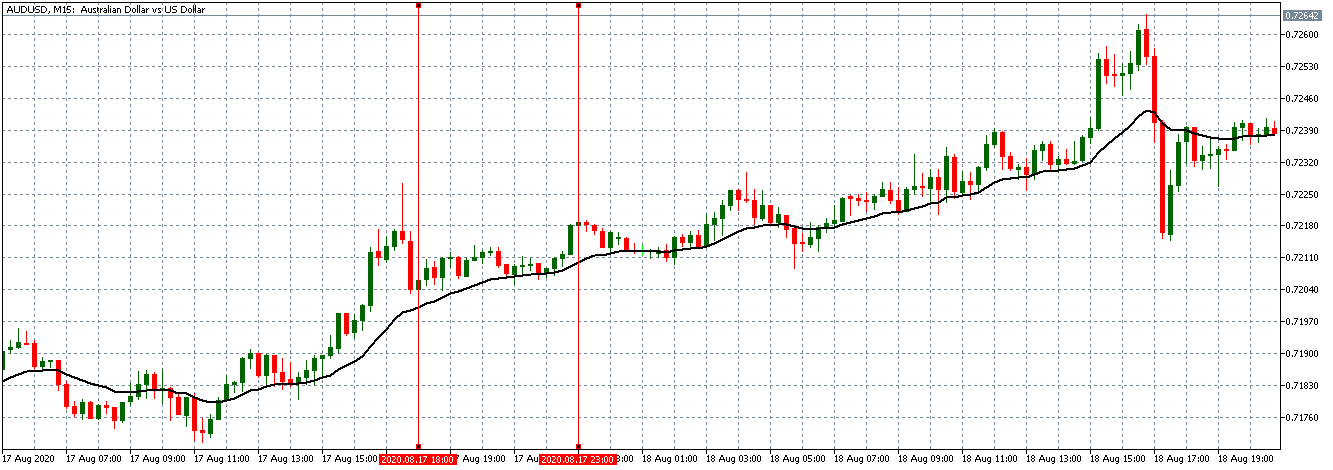
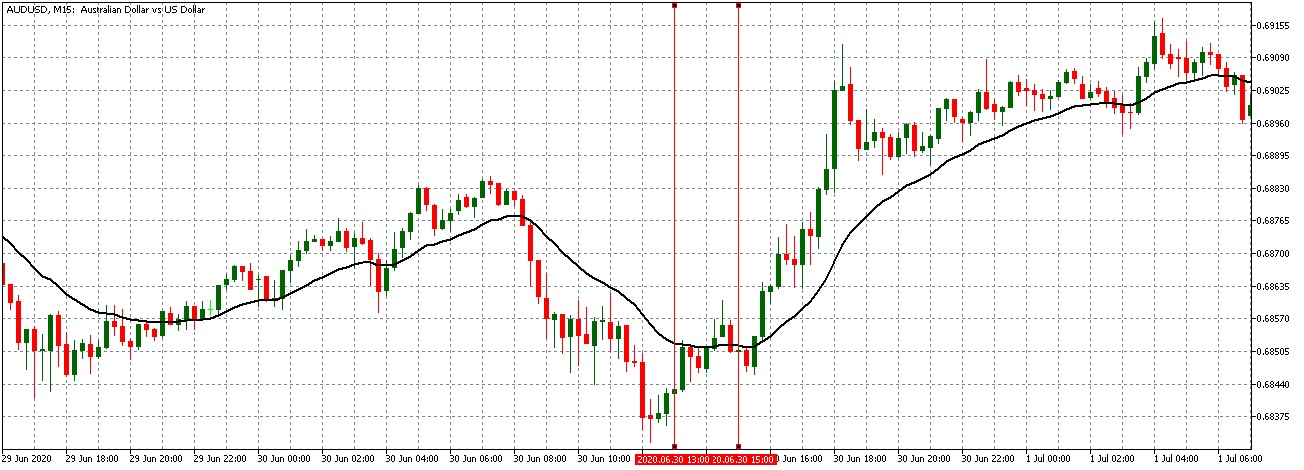
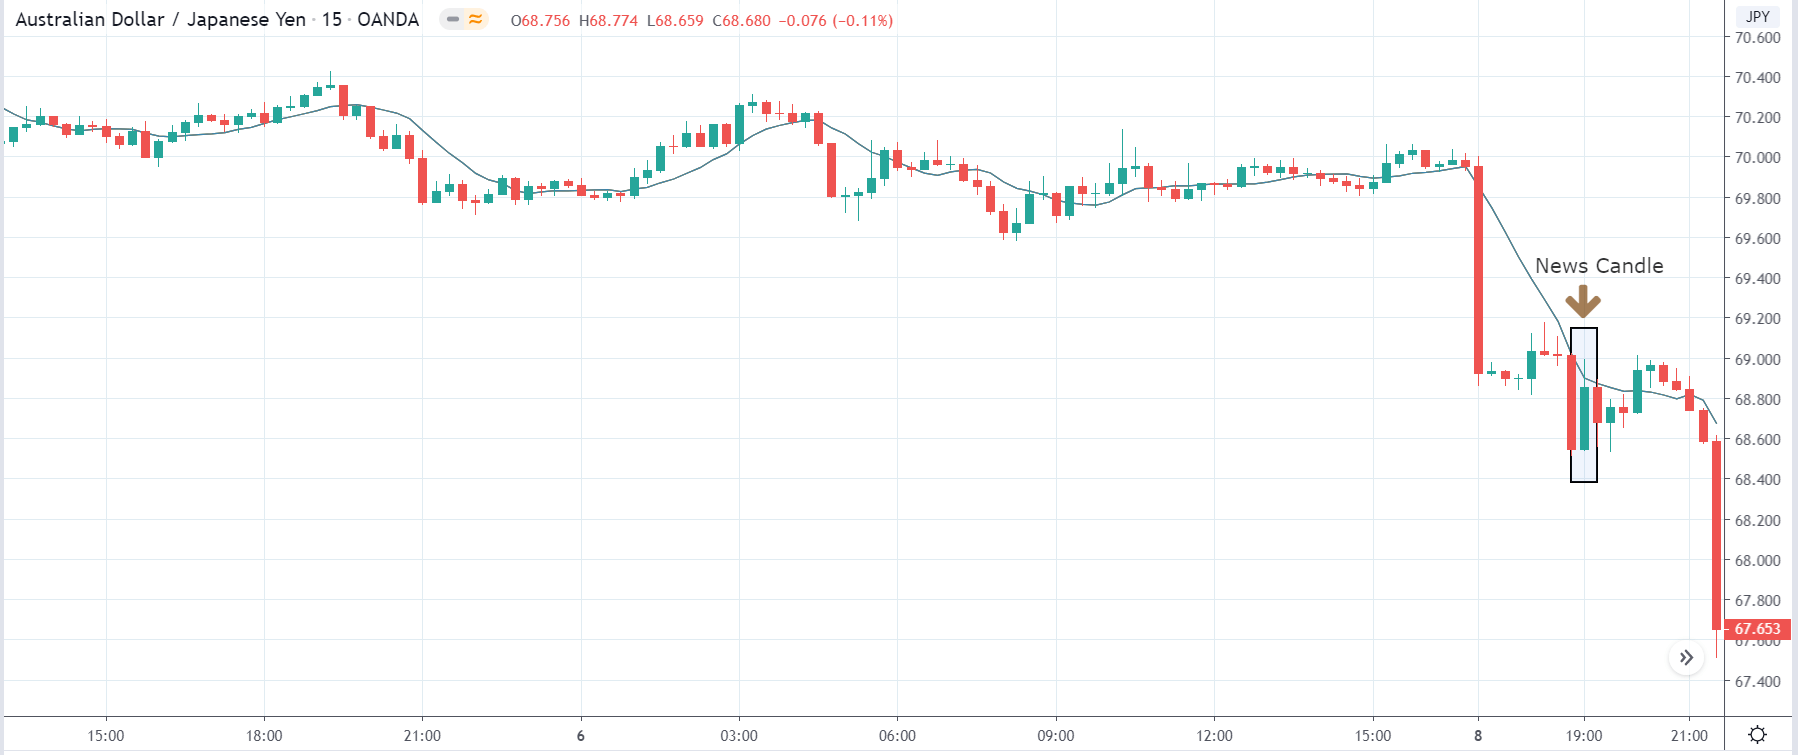
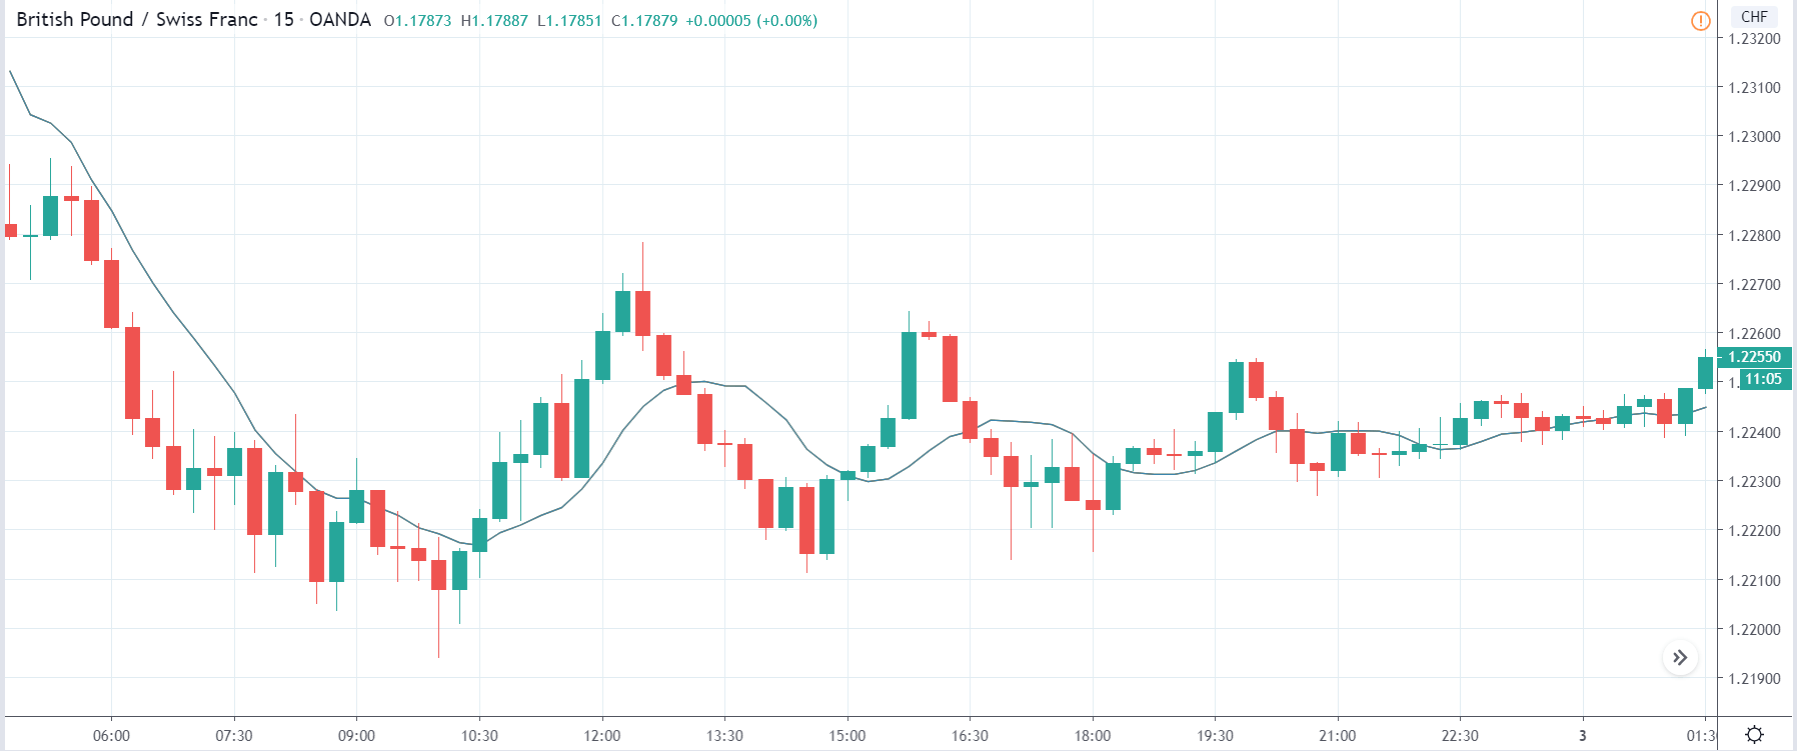
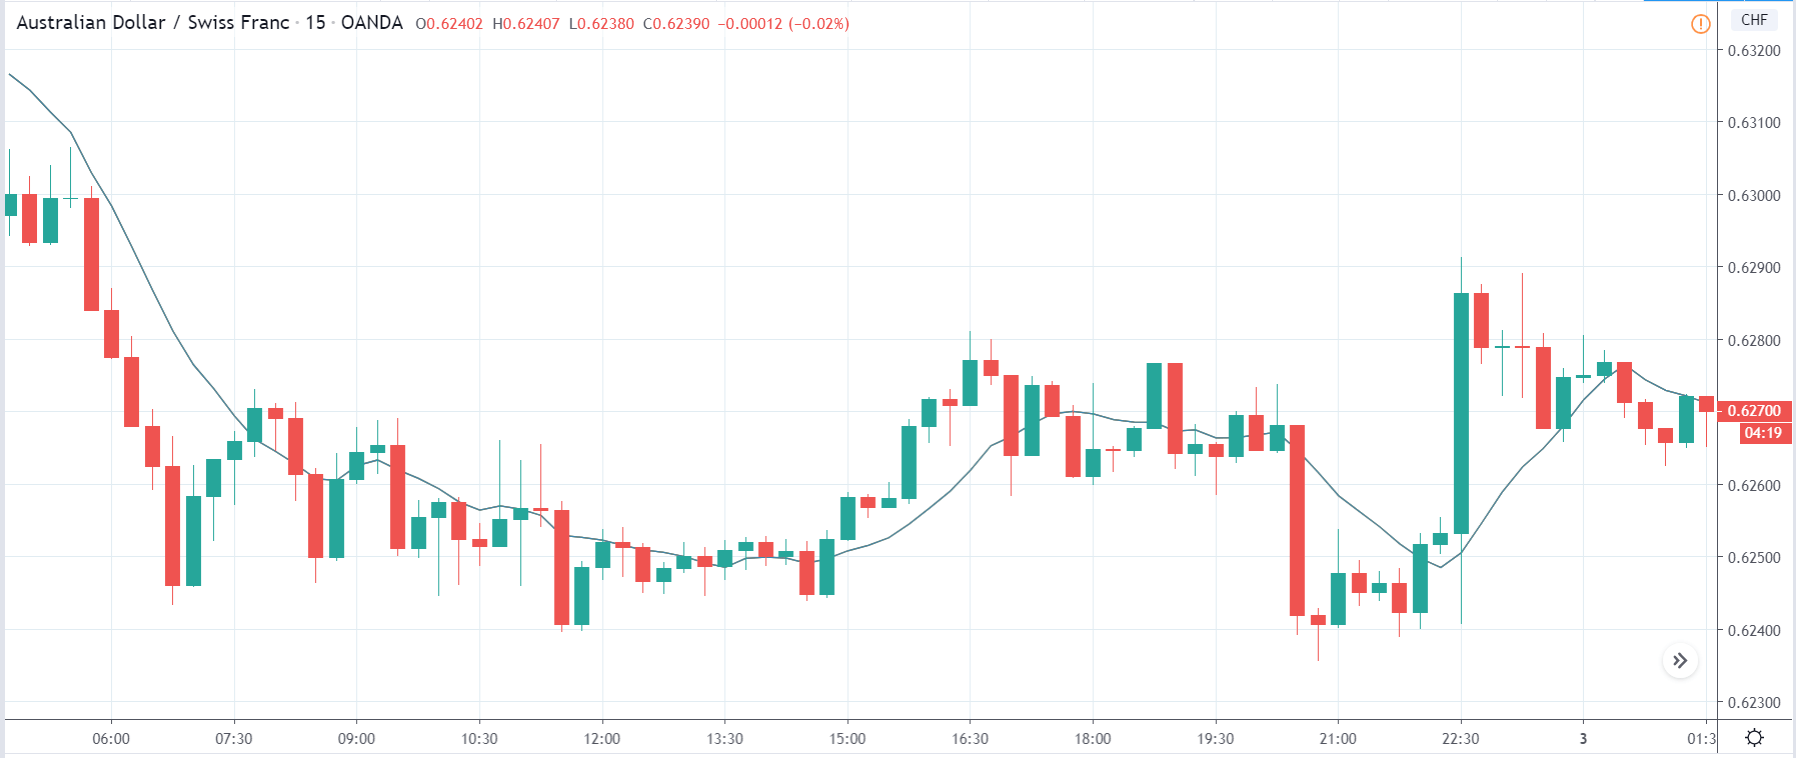
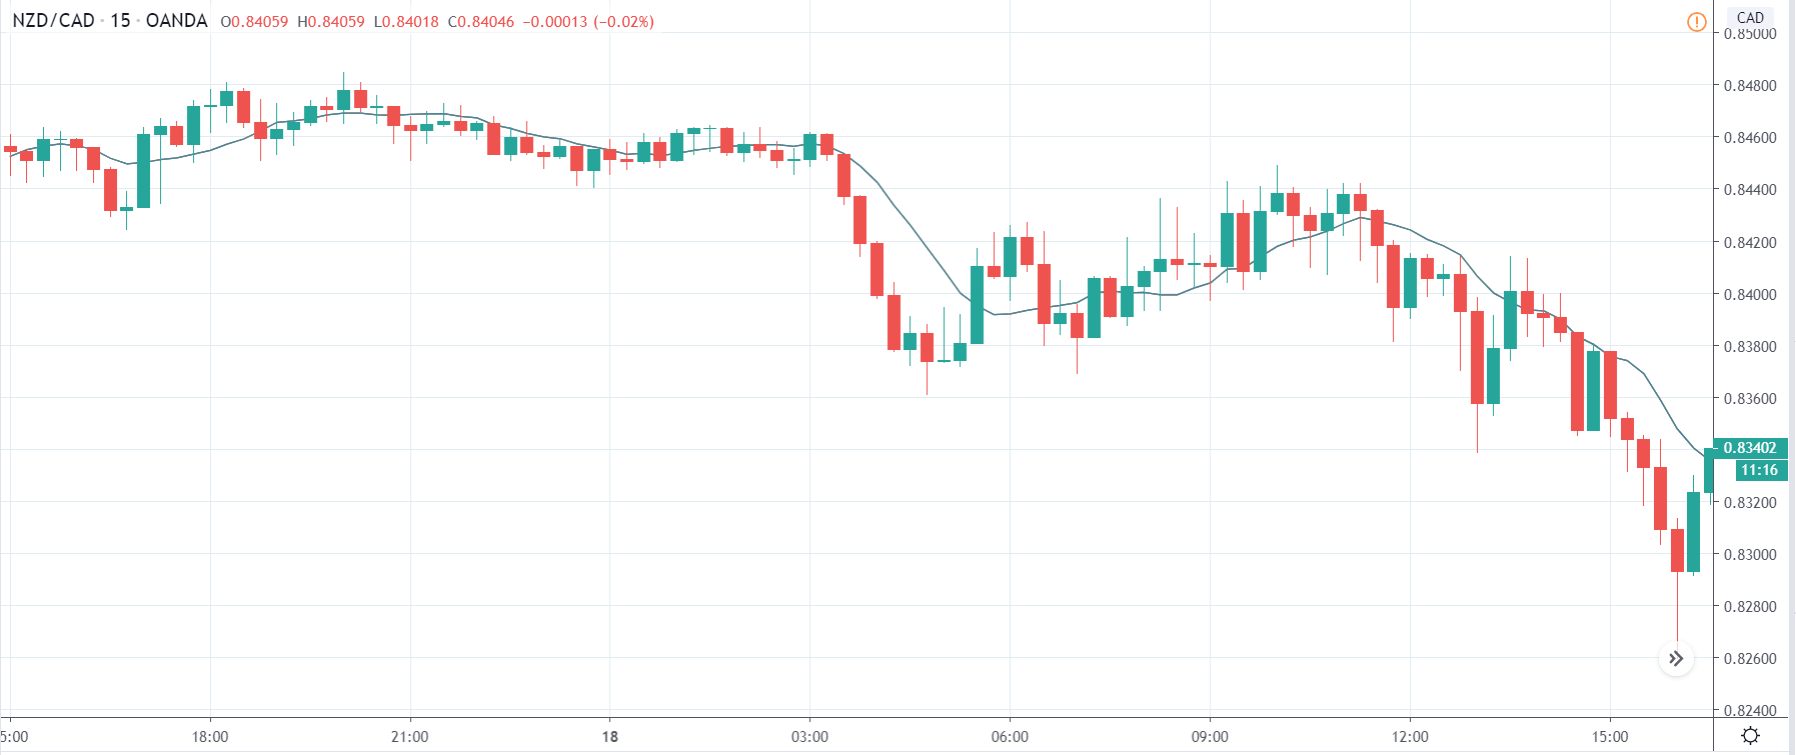
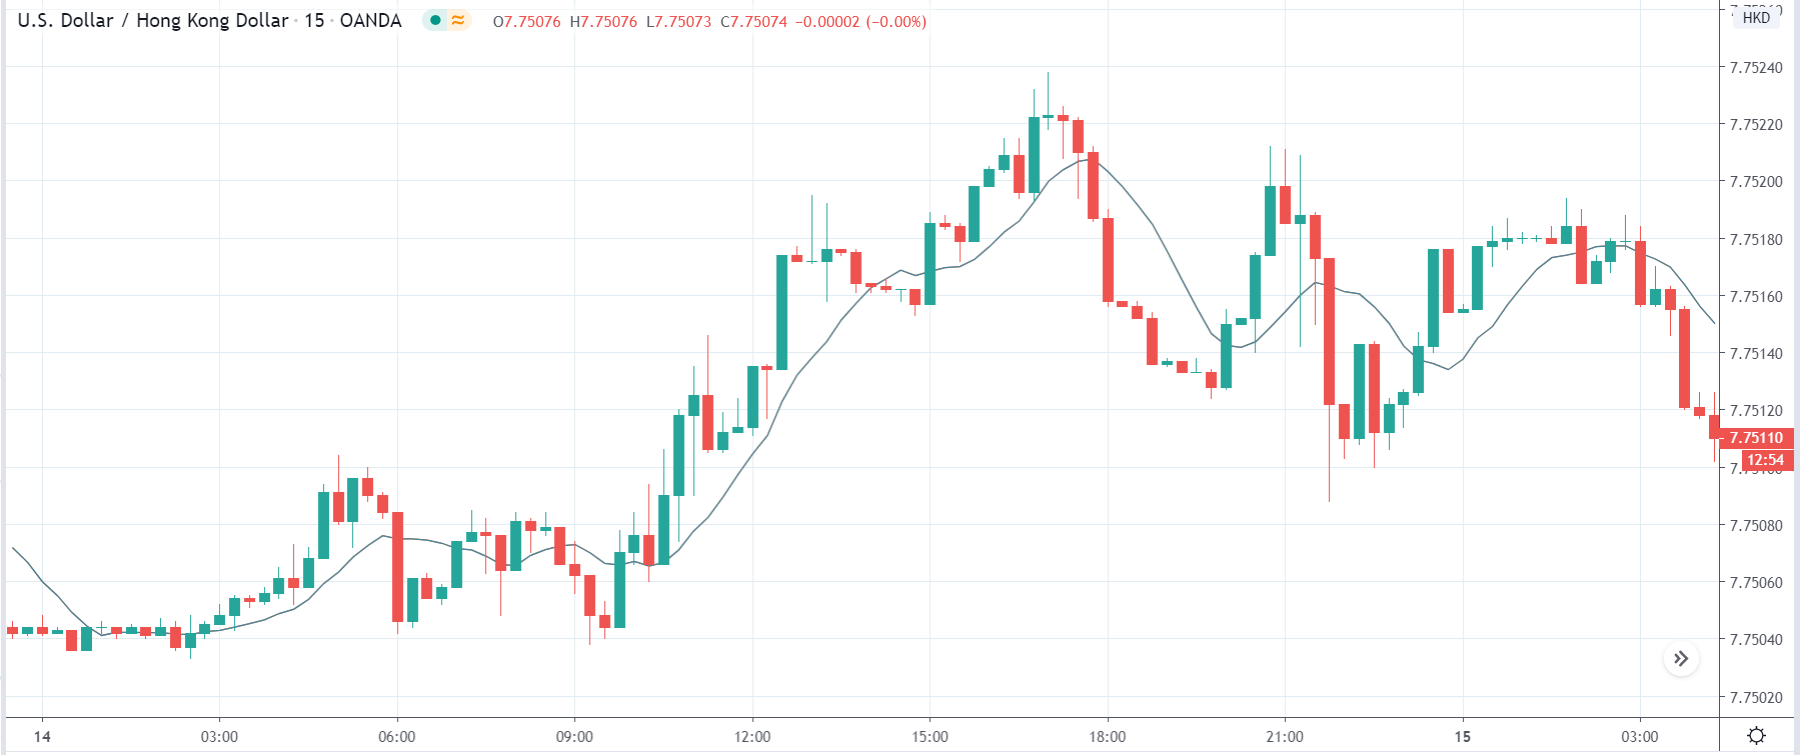
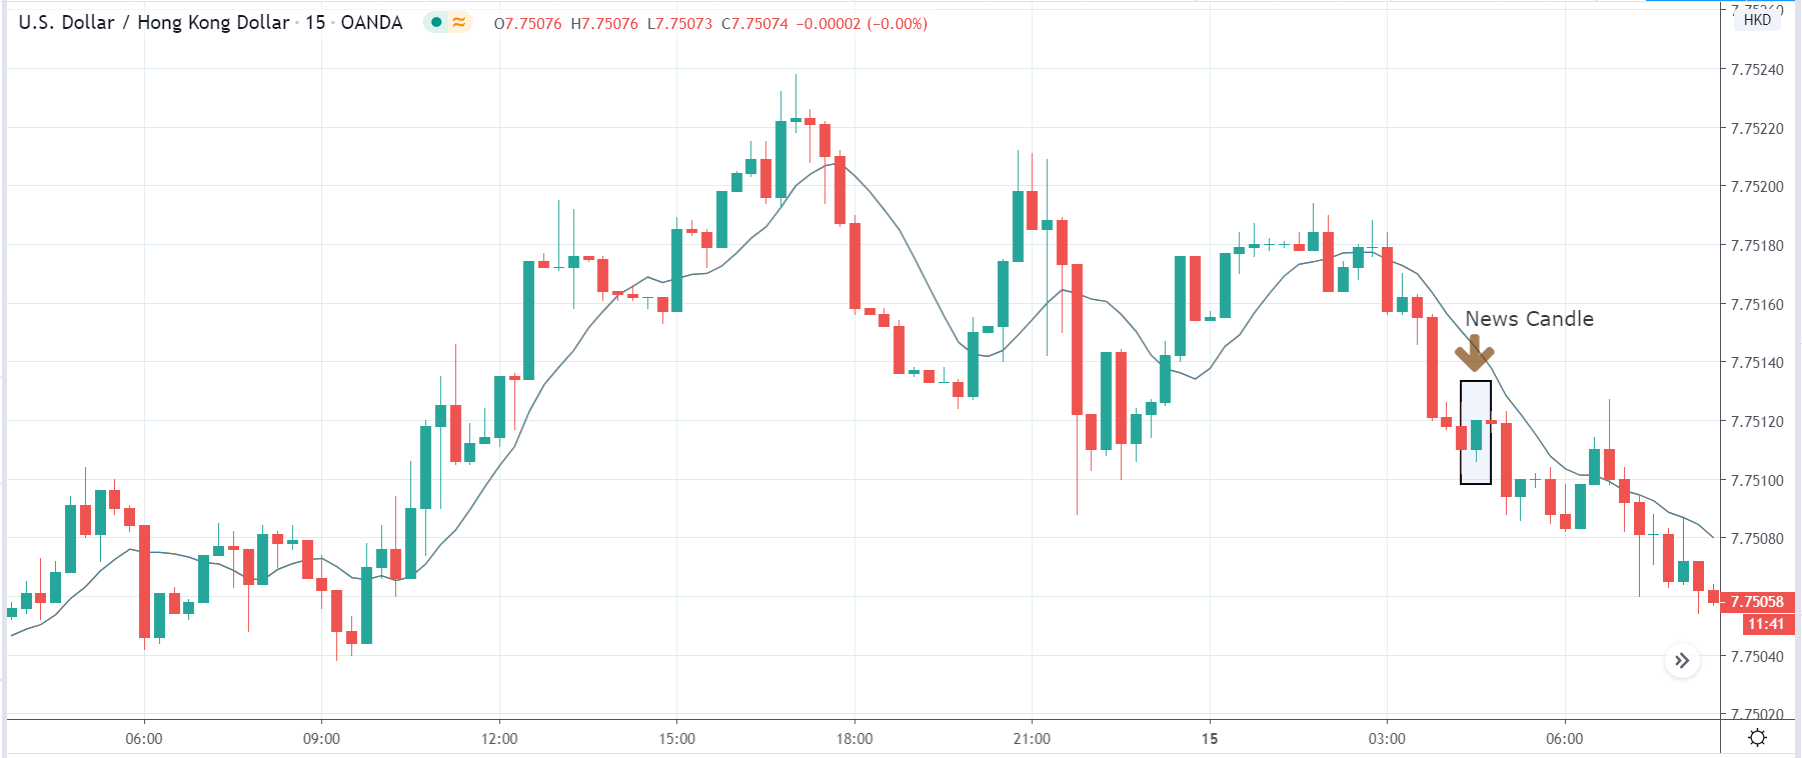
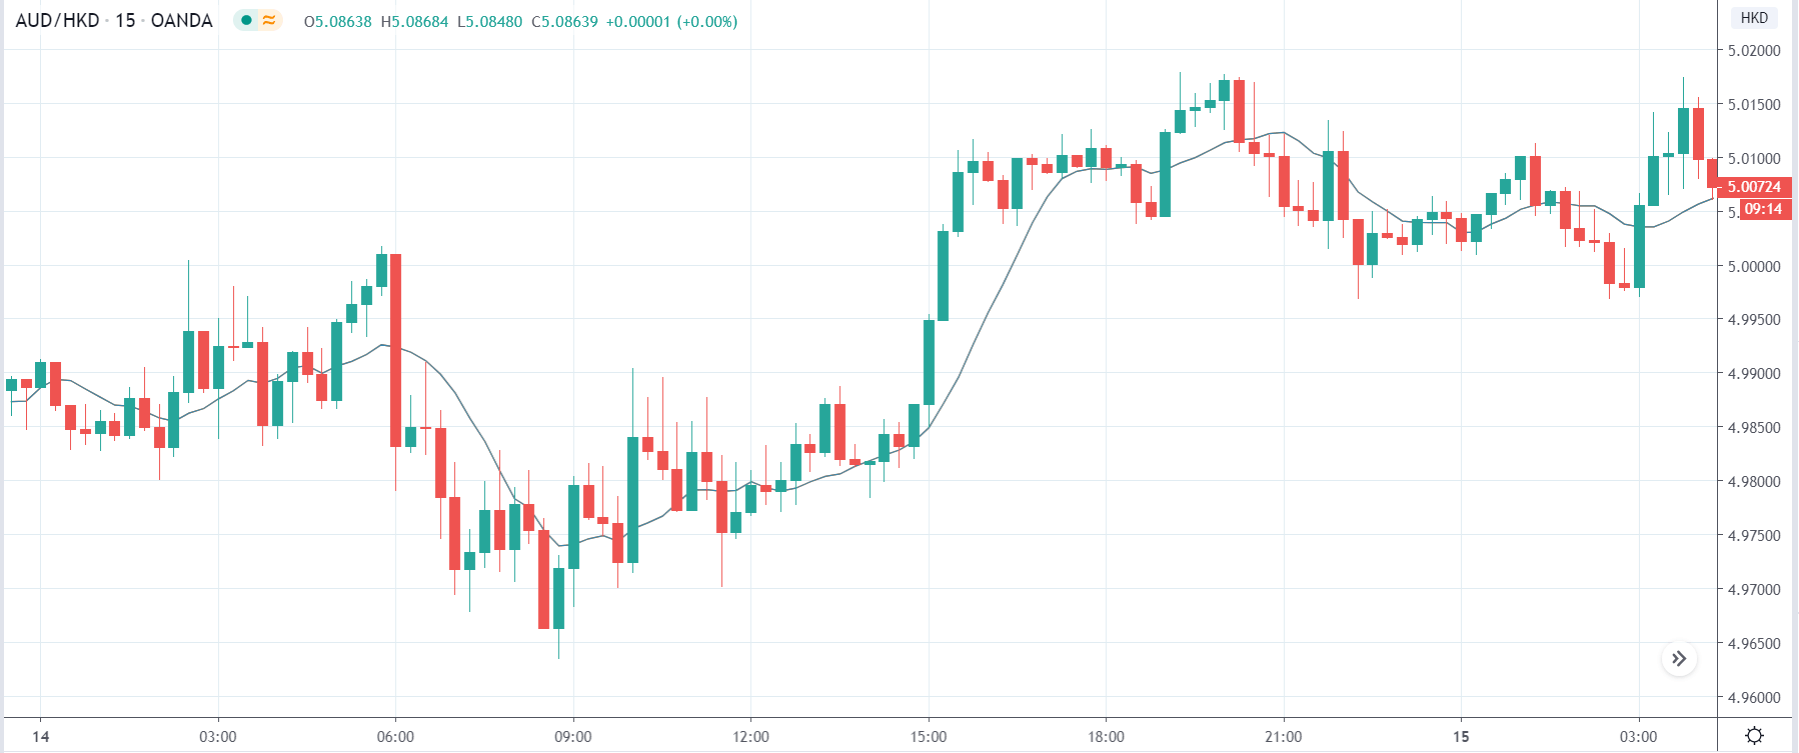
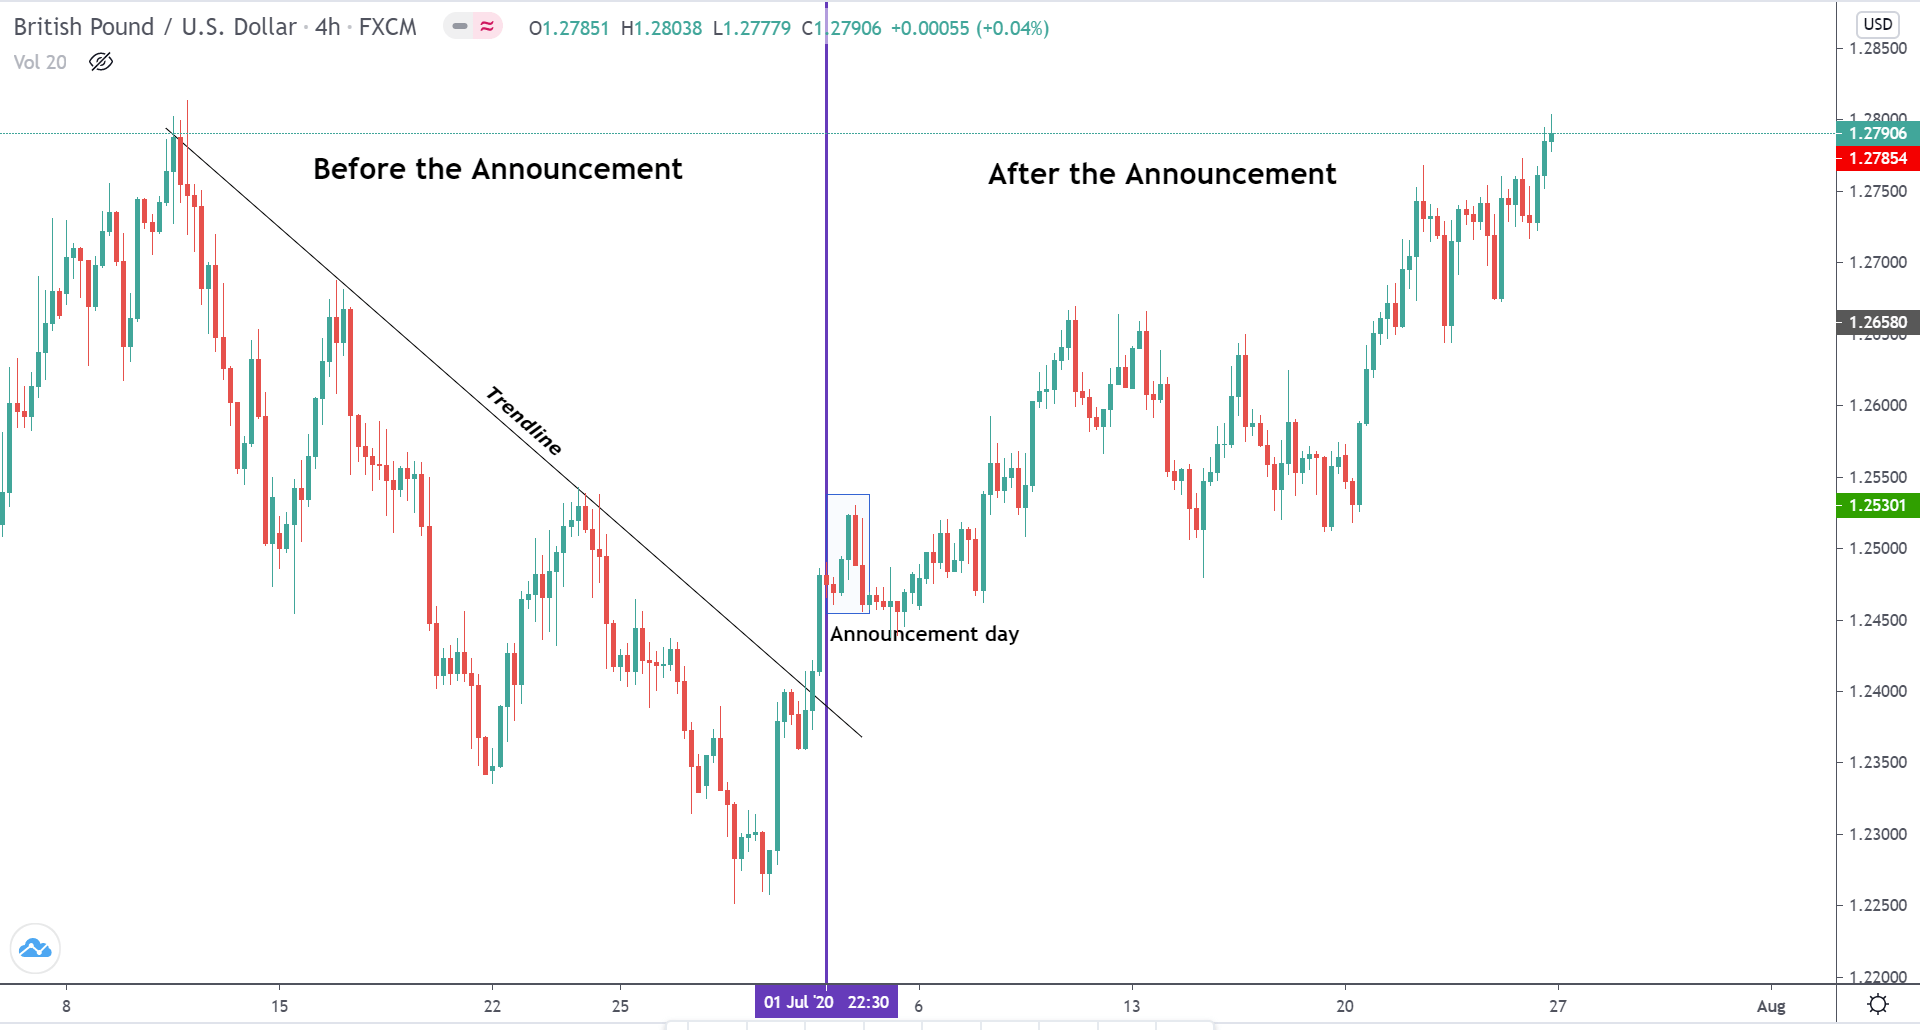
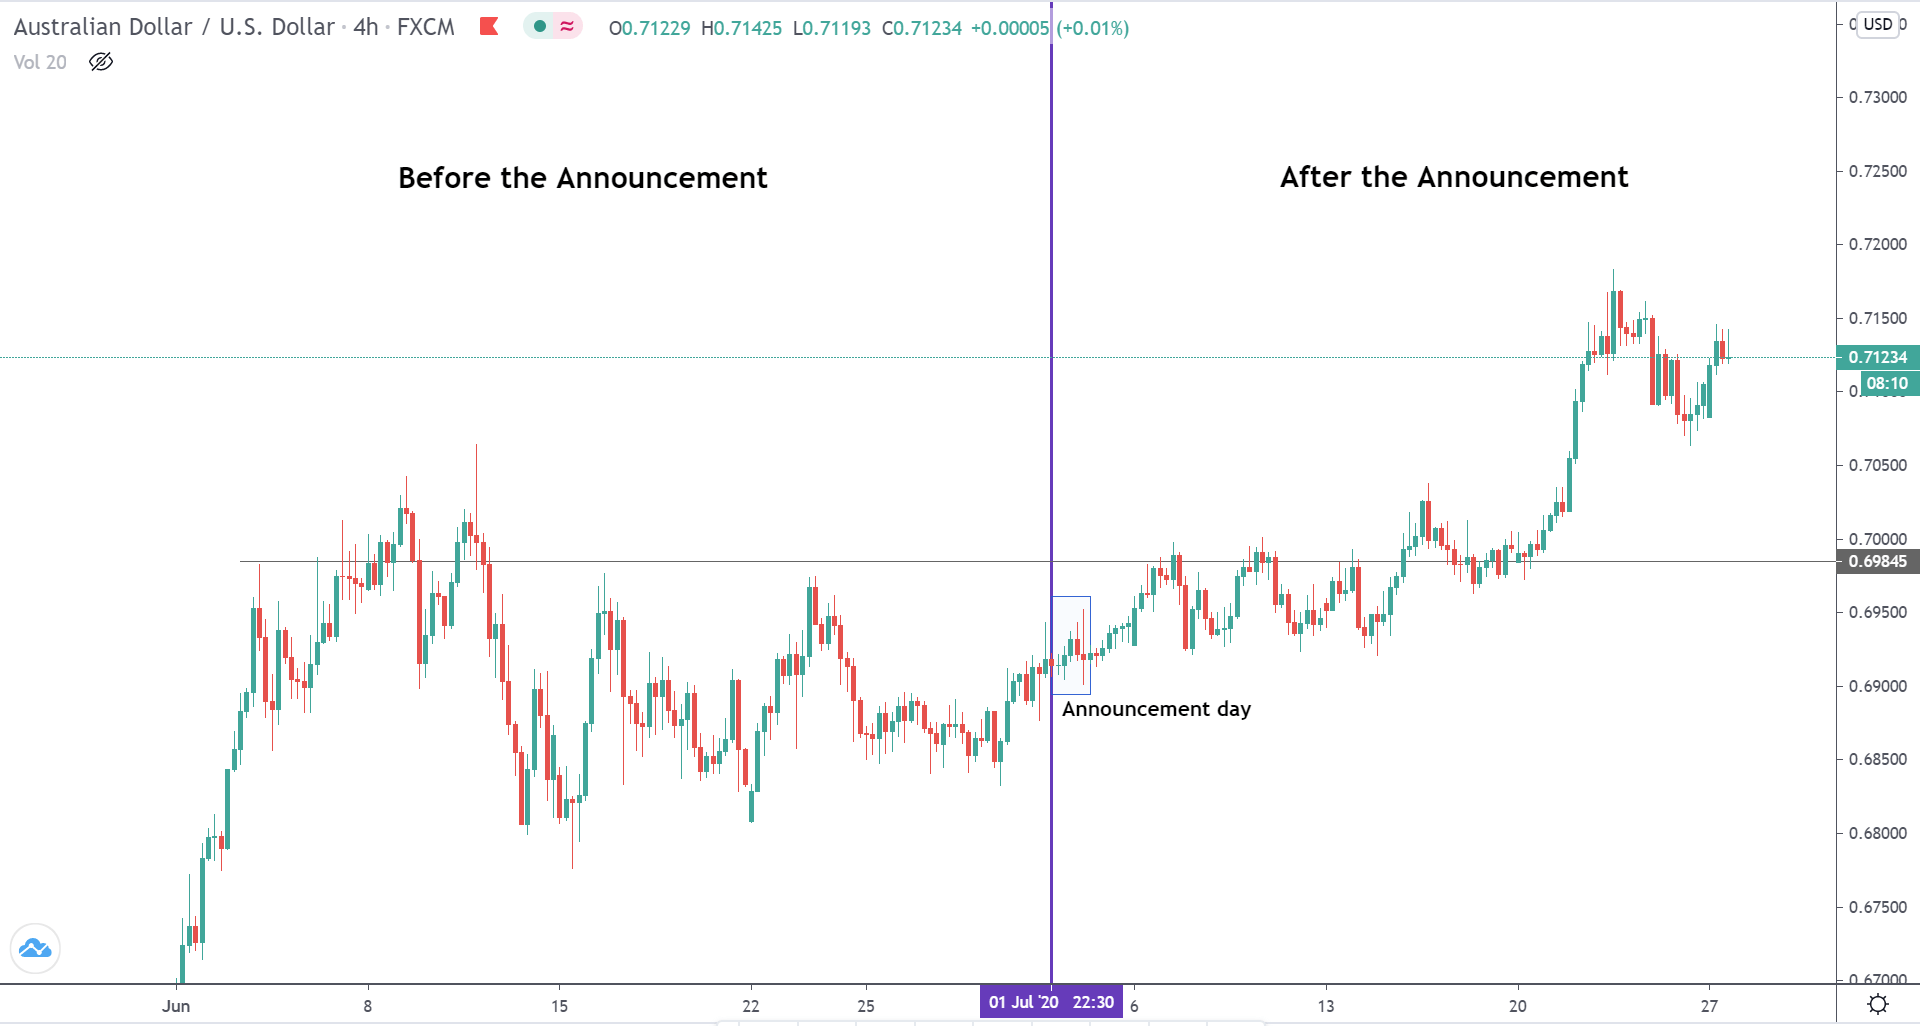
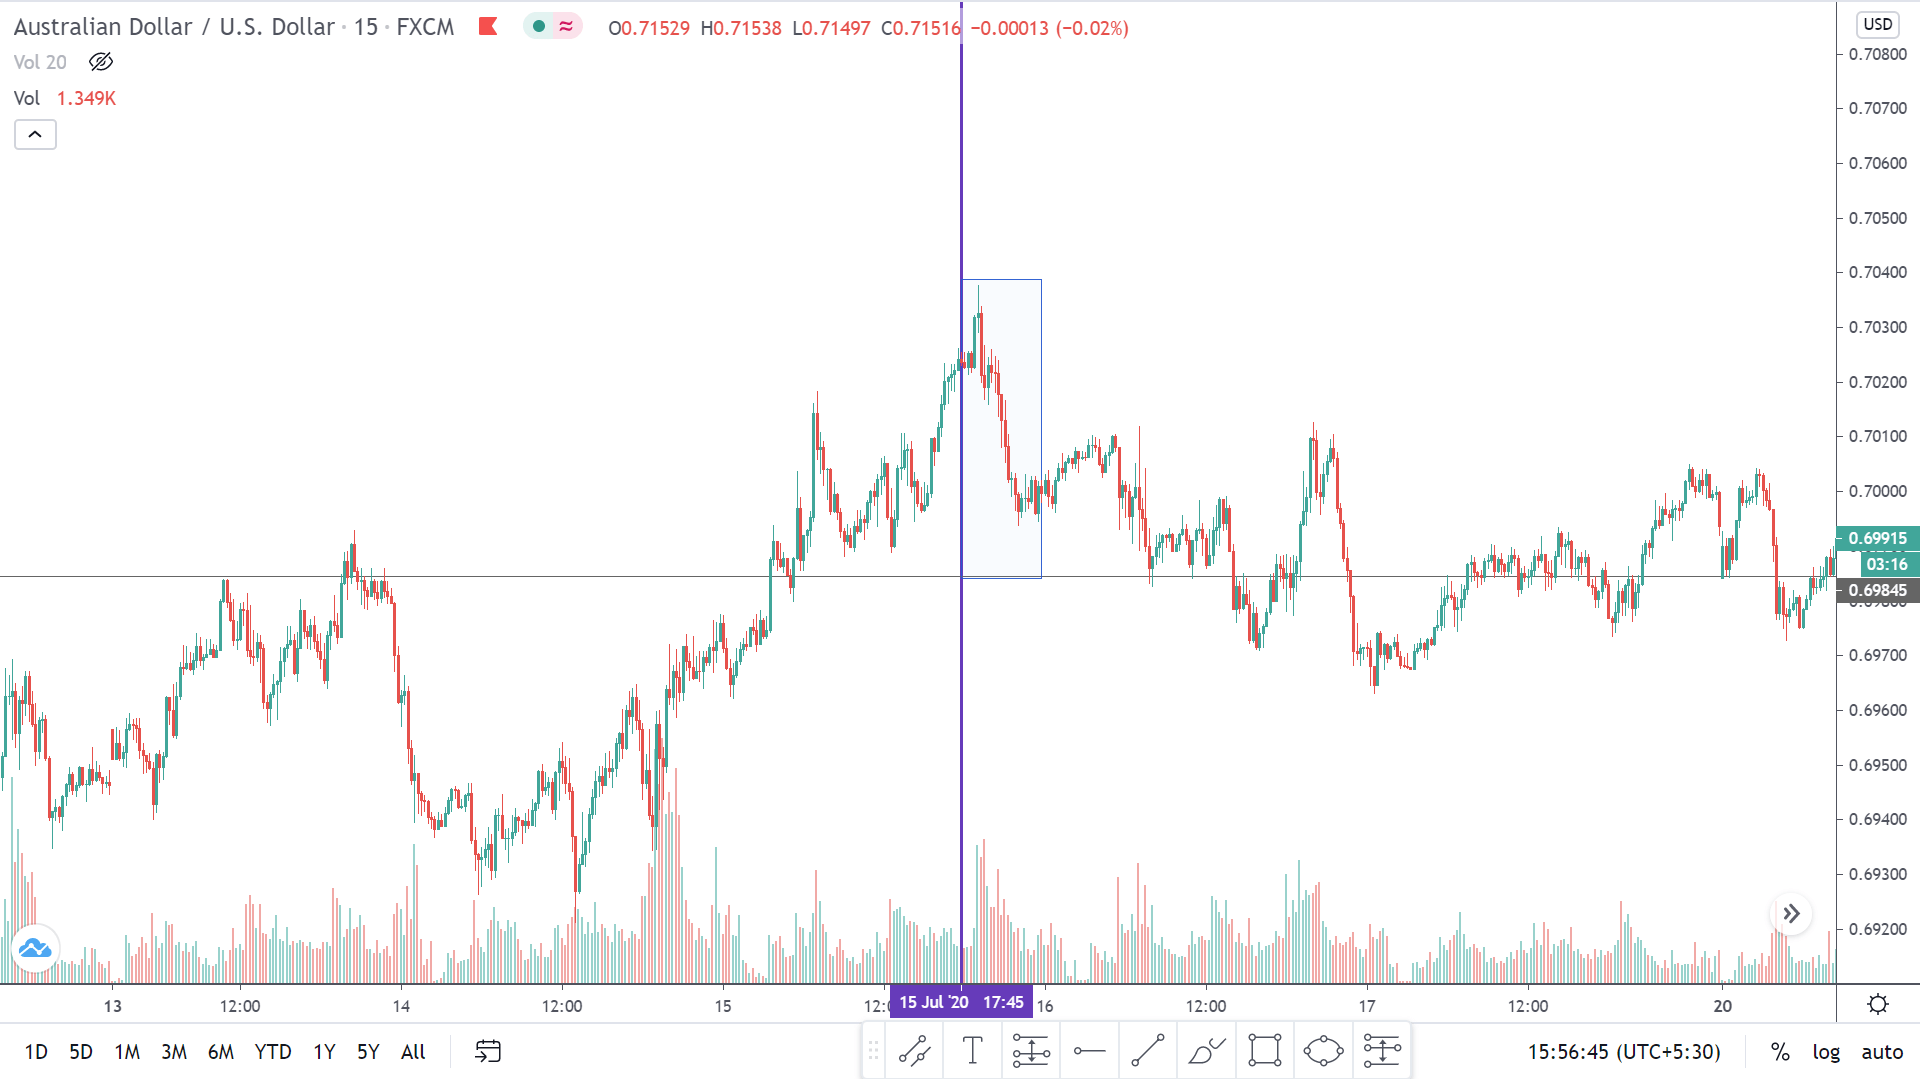
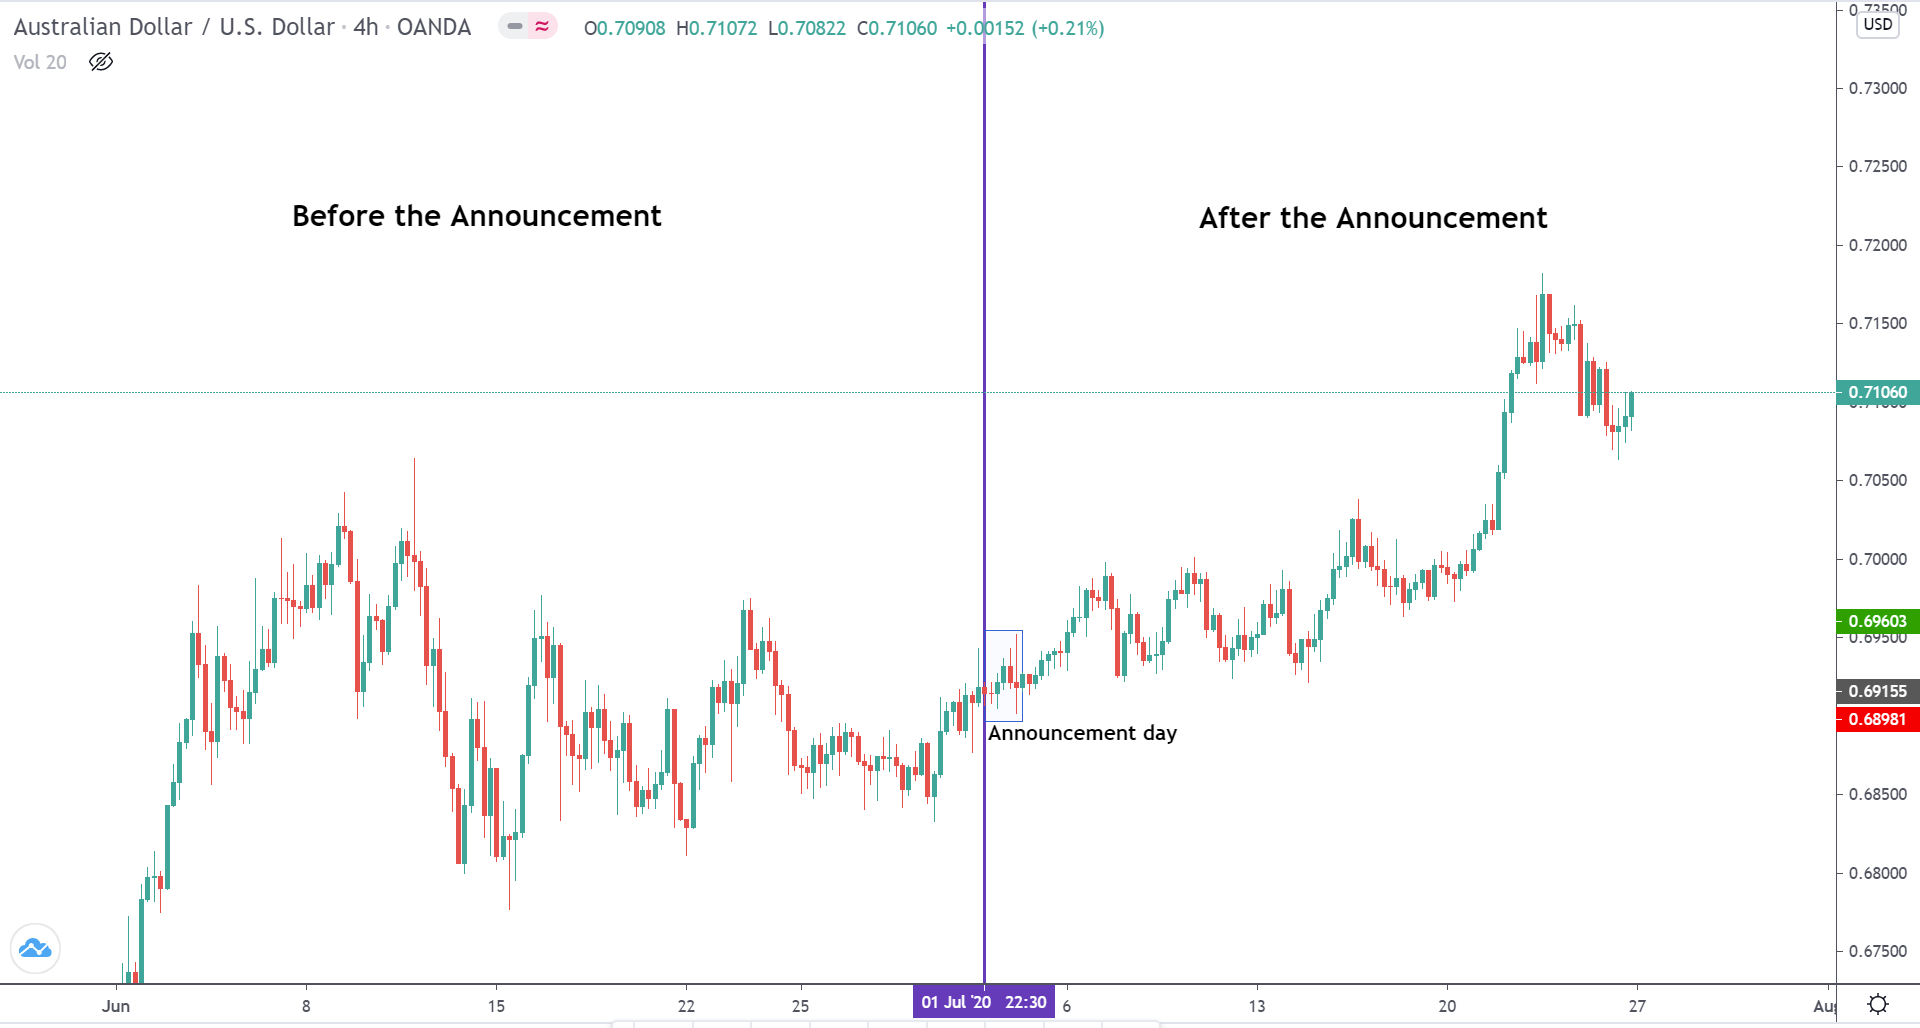
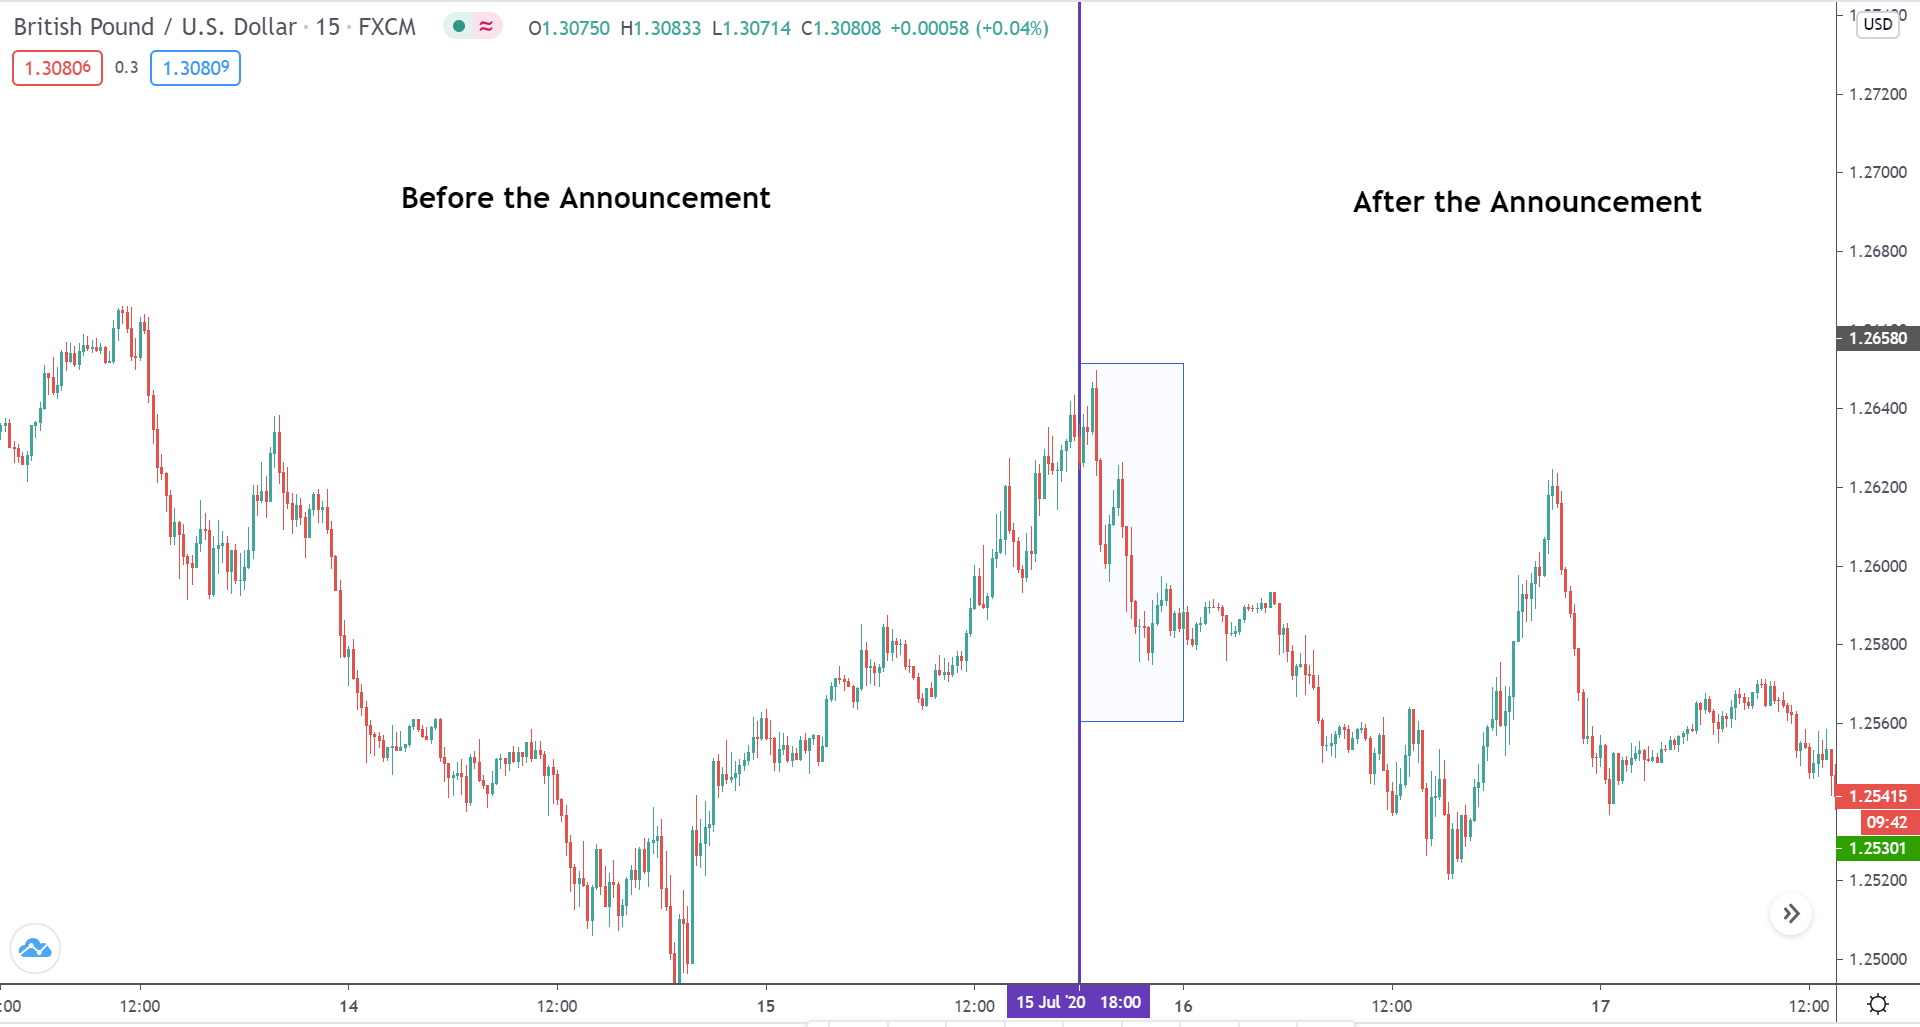
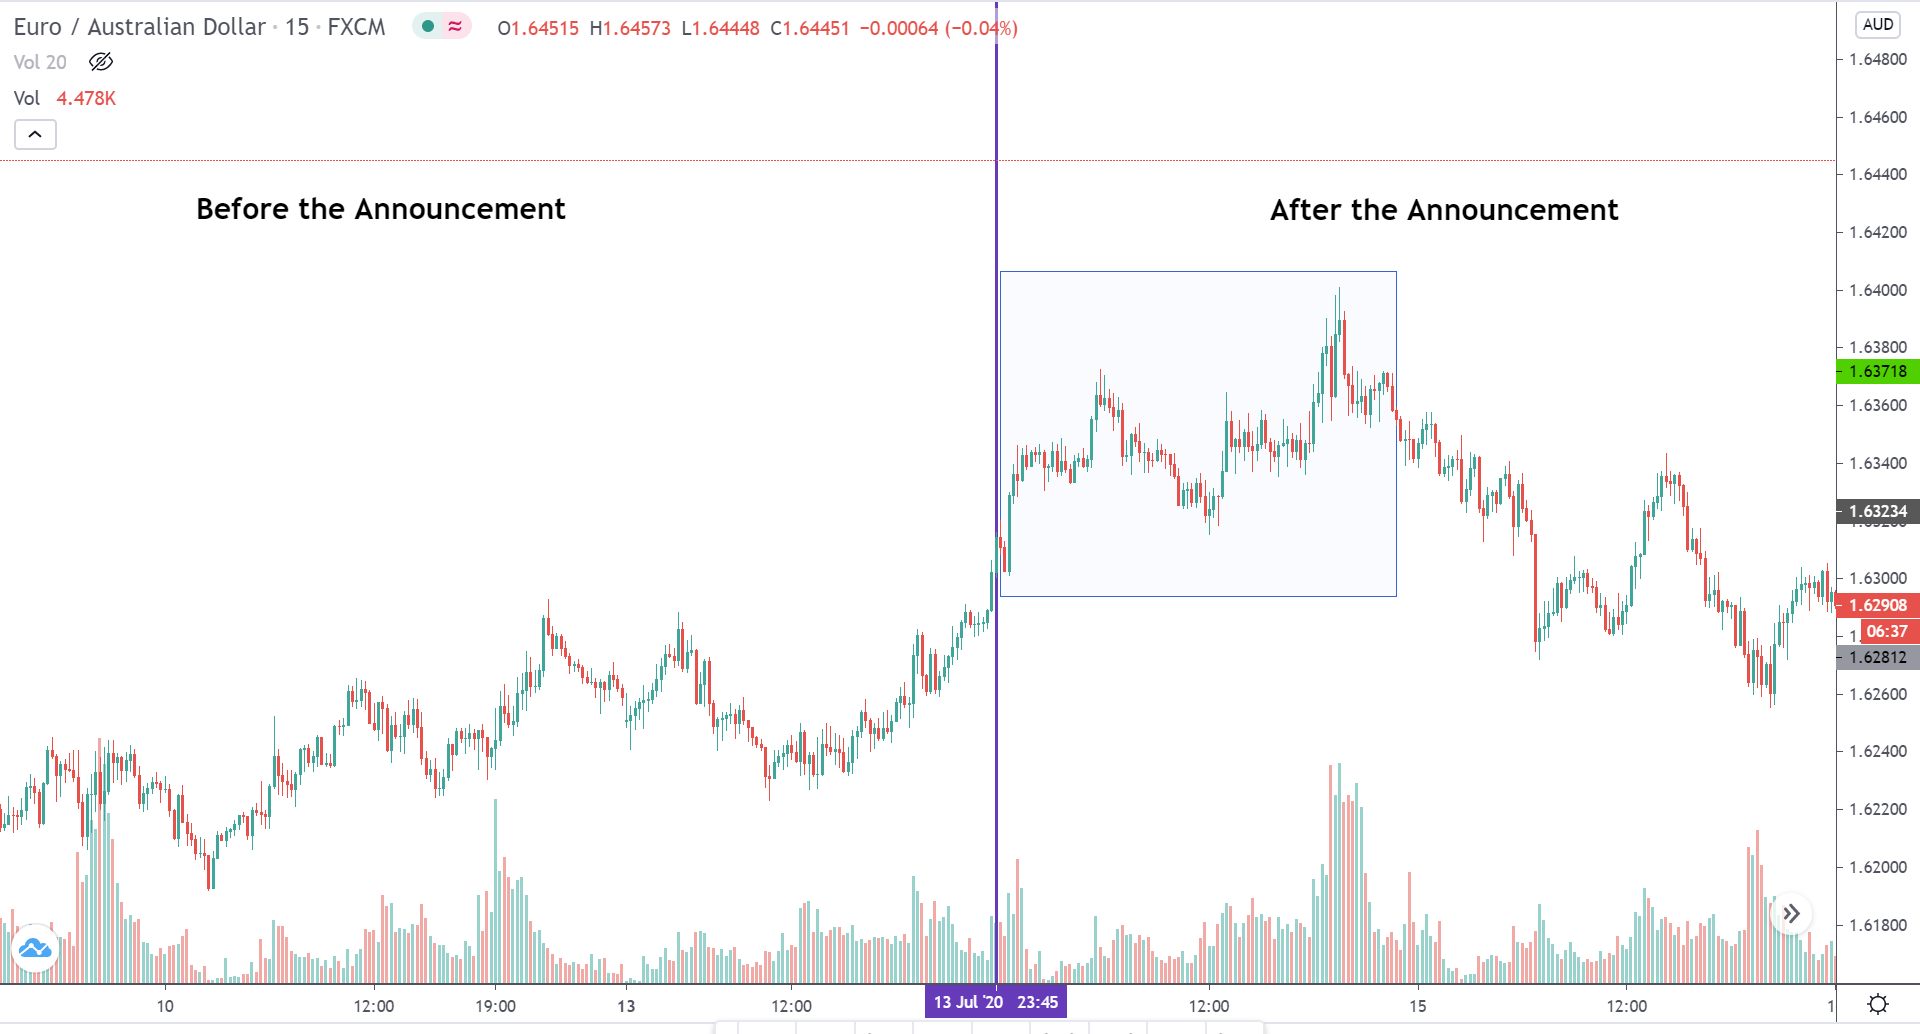
AUD/USD: Before the Monthly Industrial Production Data Release 
on August 14, 2020, Just Before 9.15 AM ET

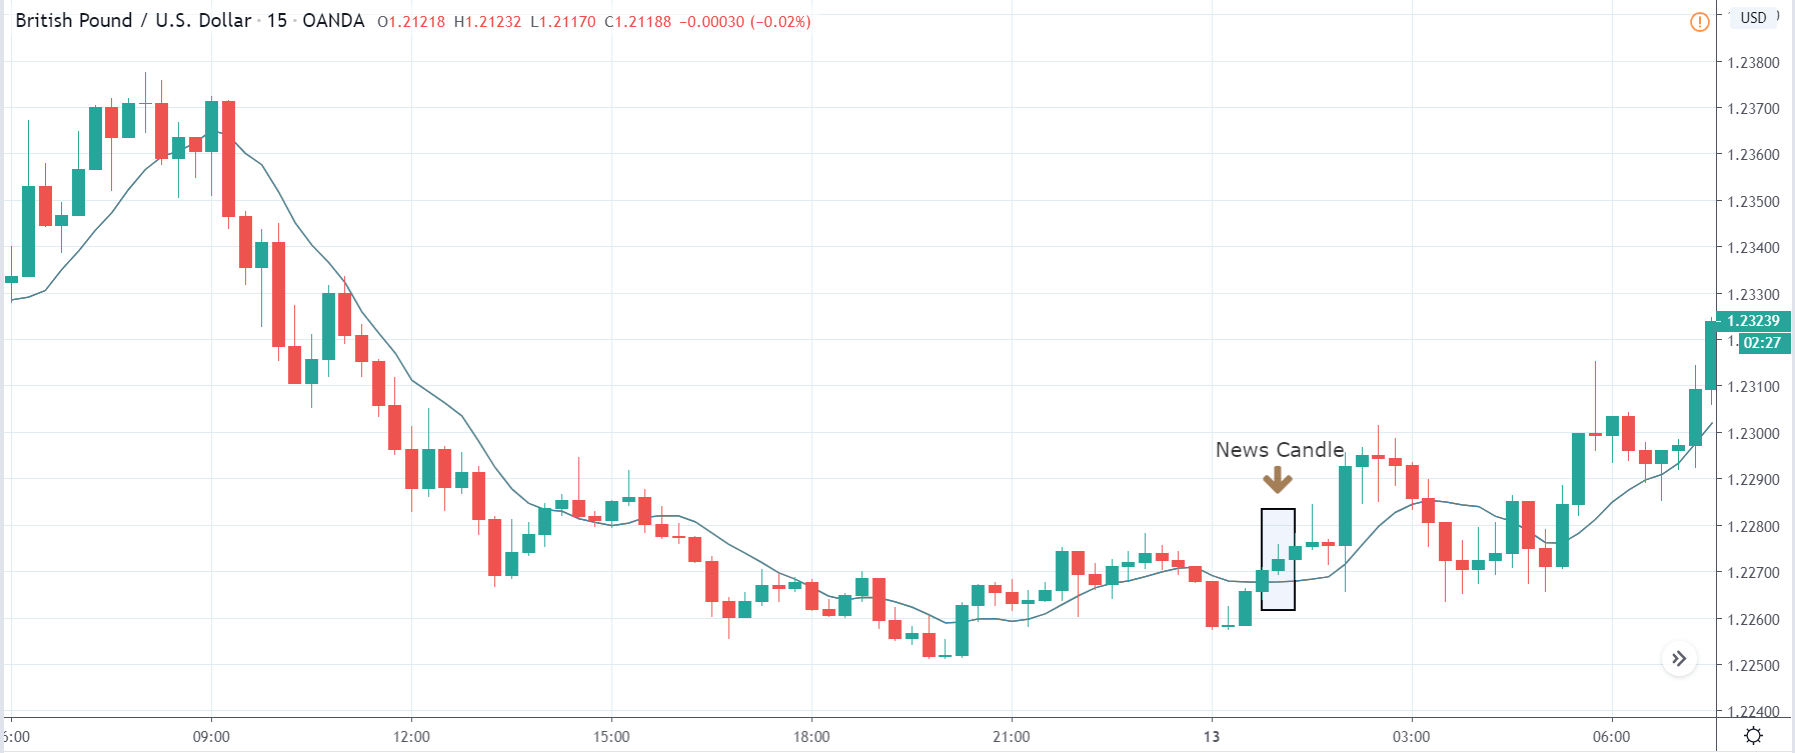
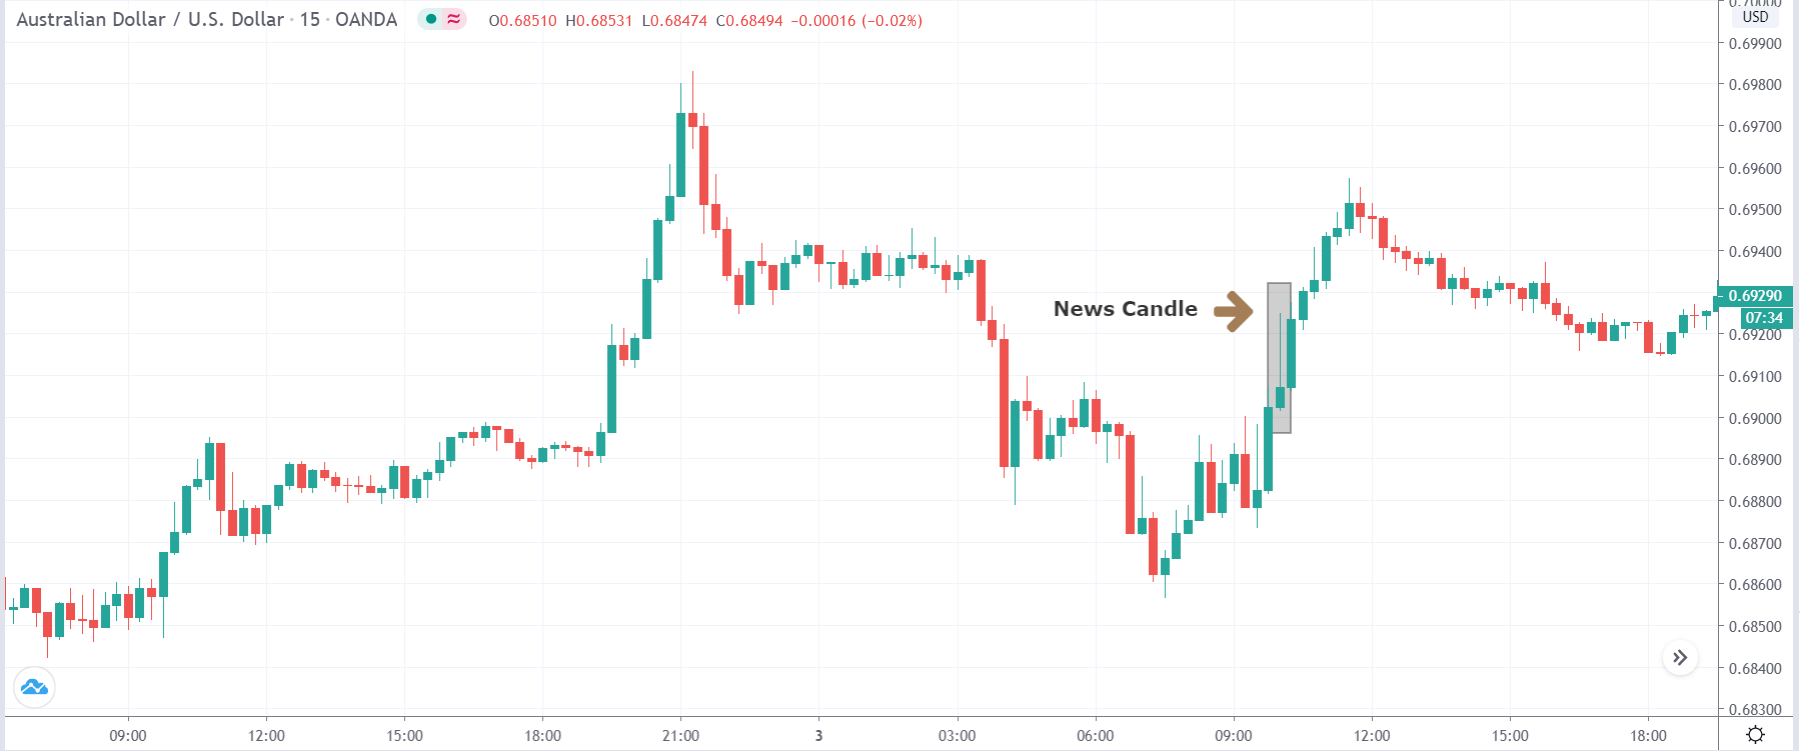
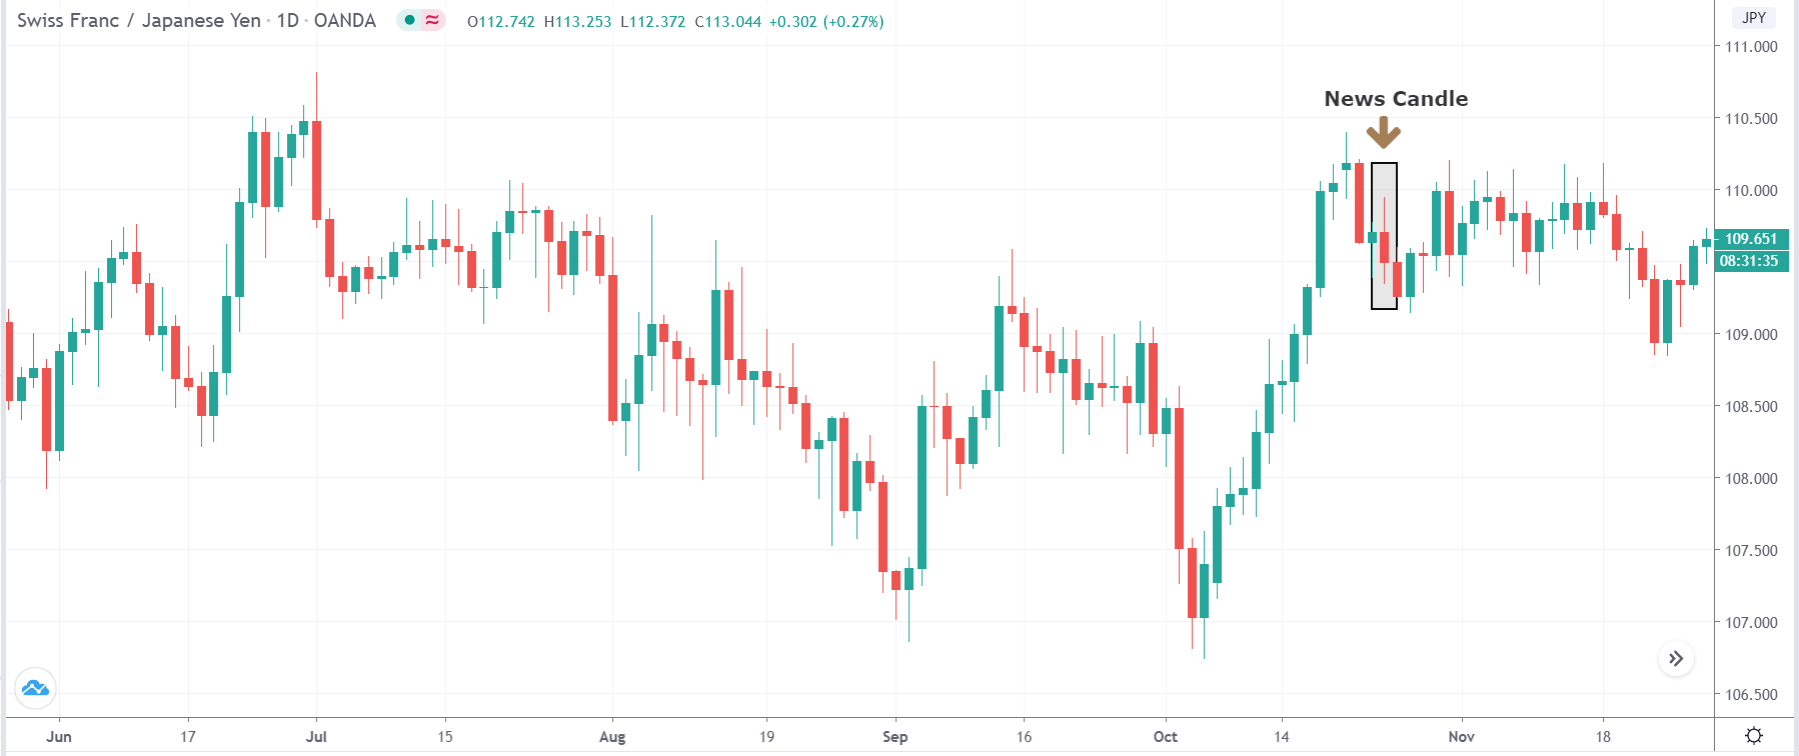
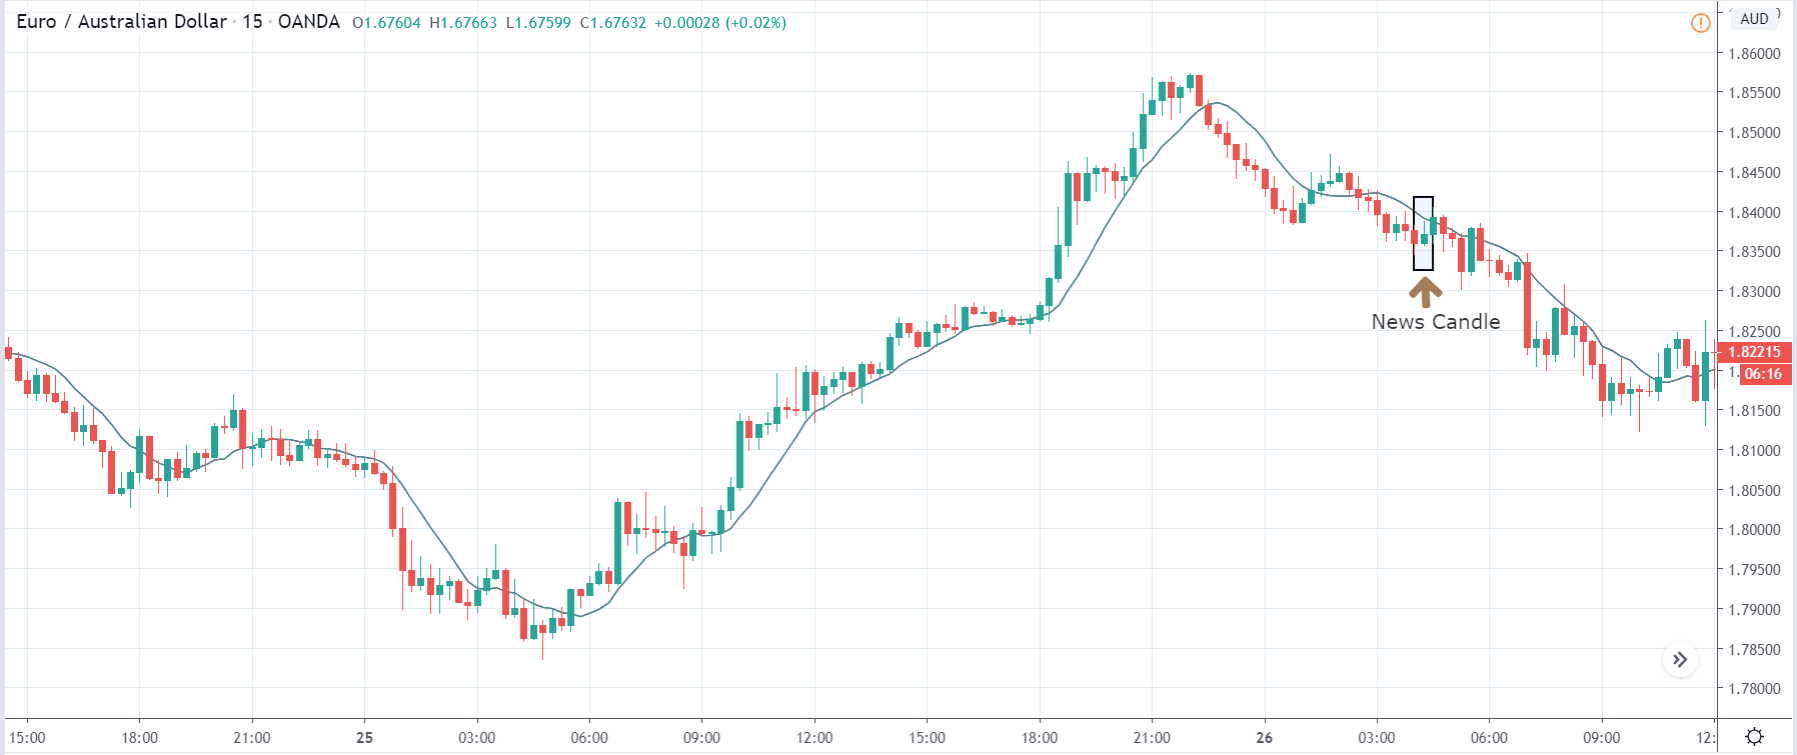
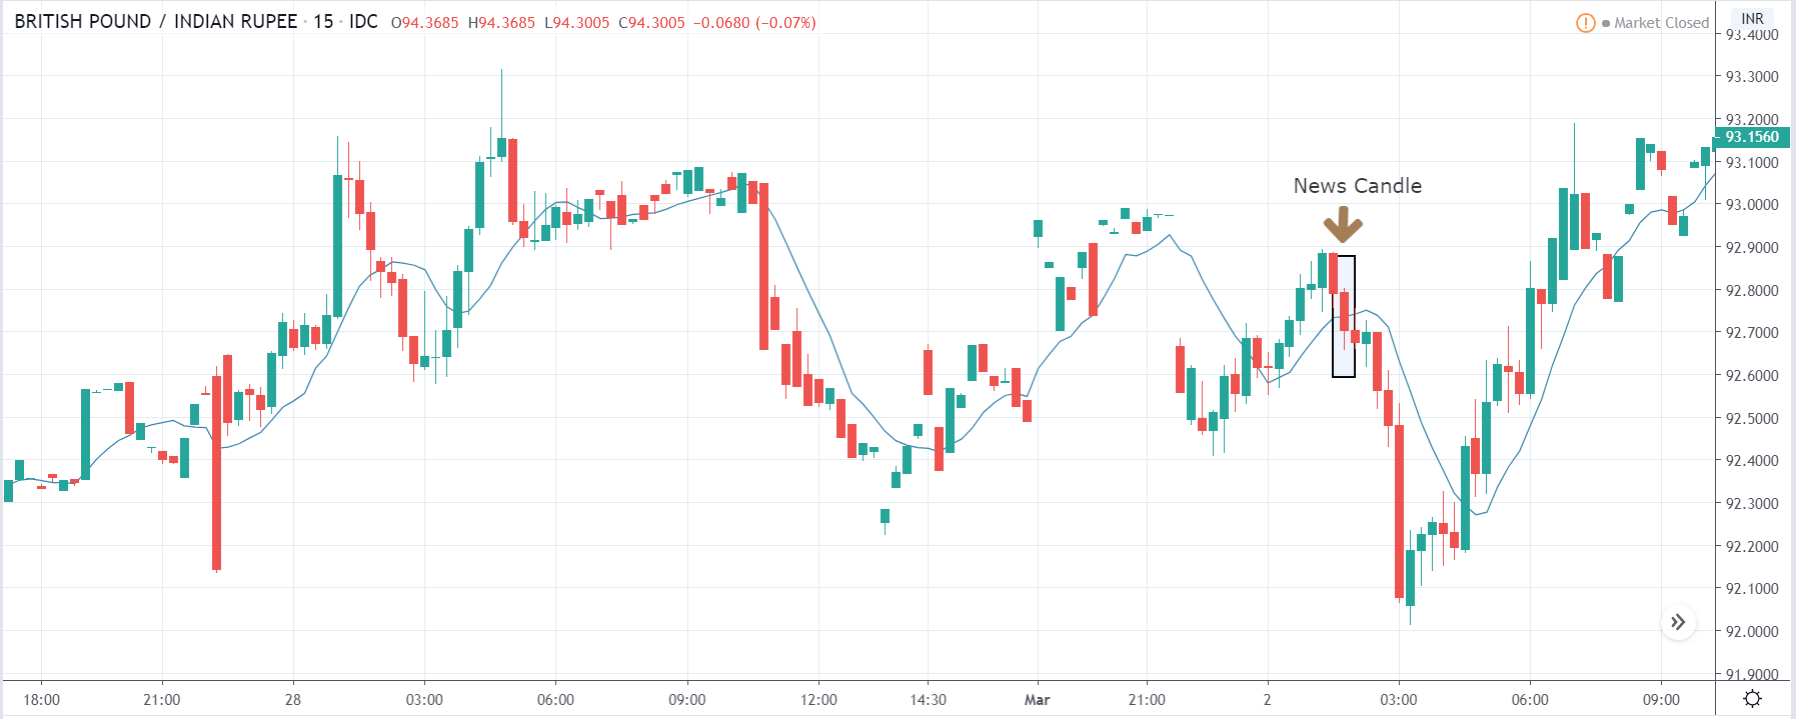
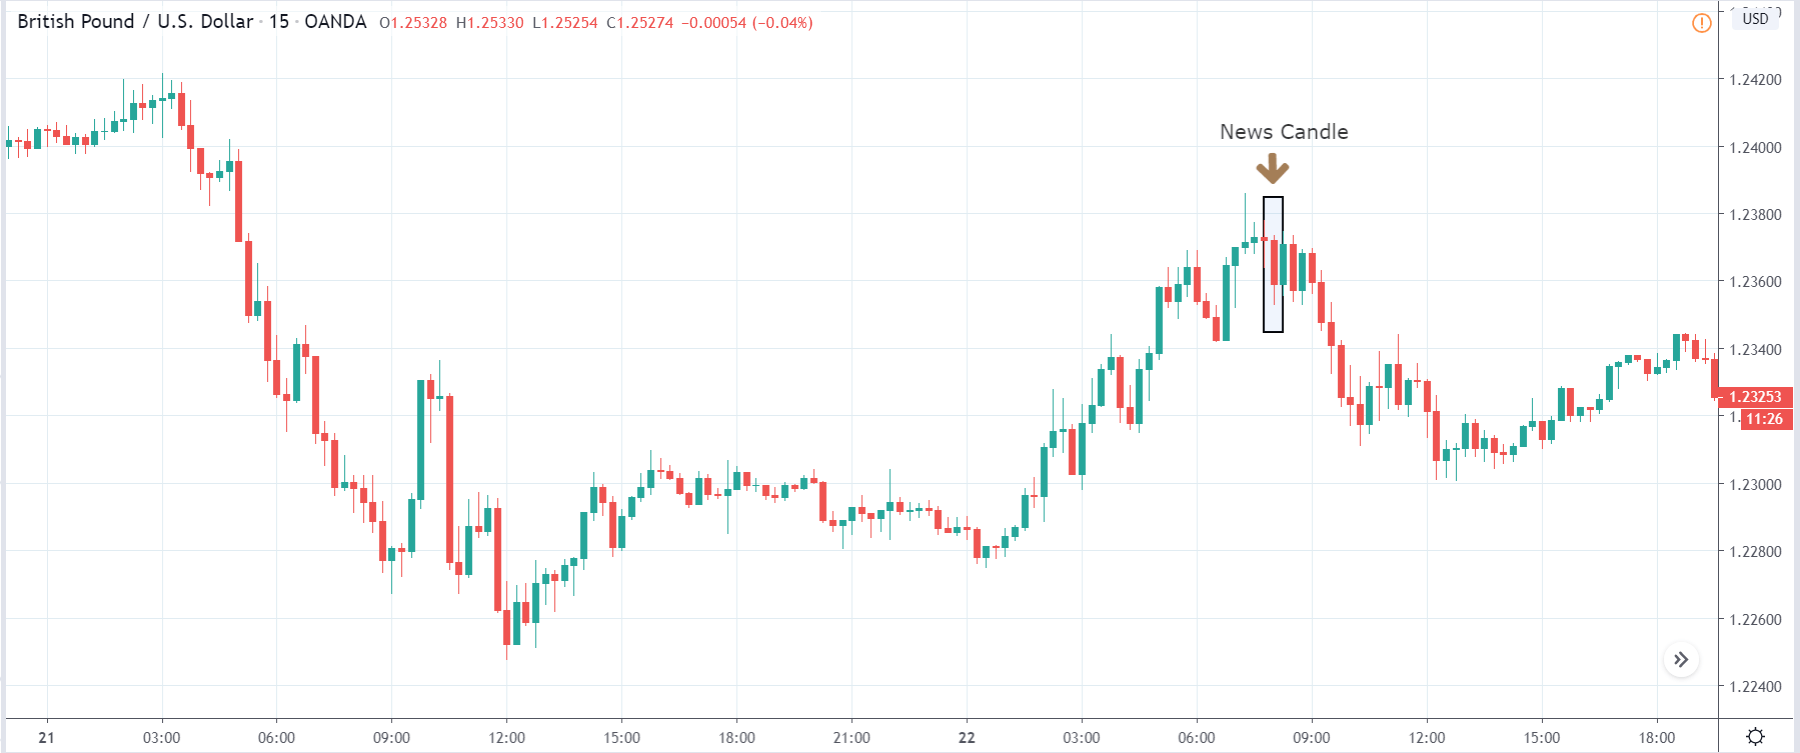
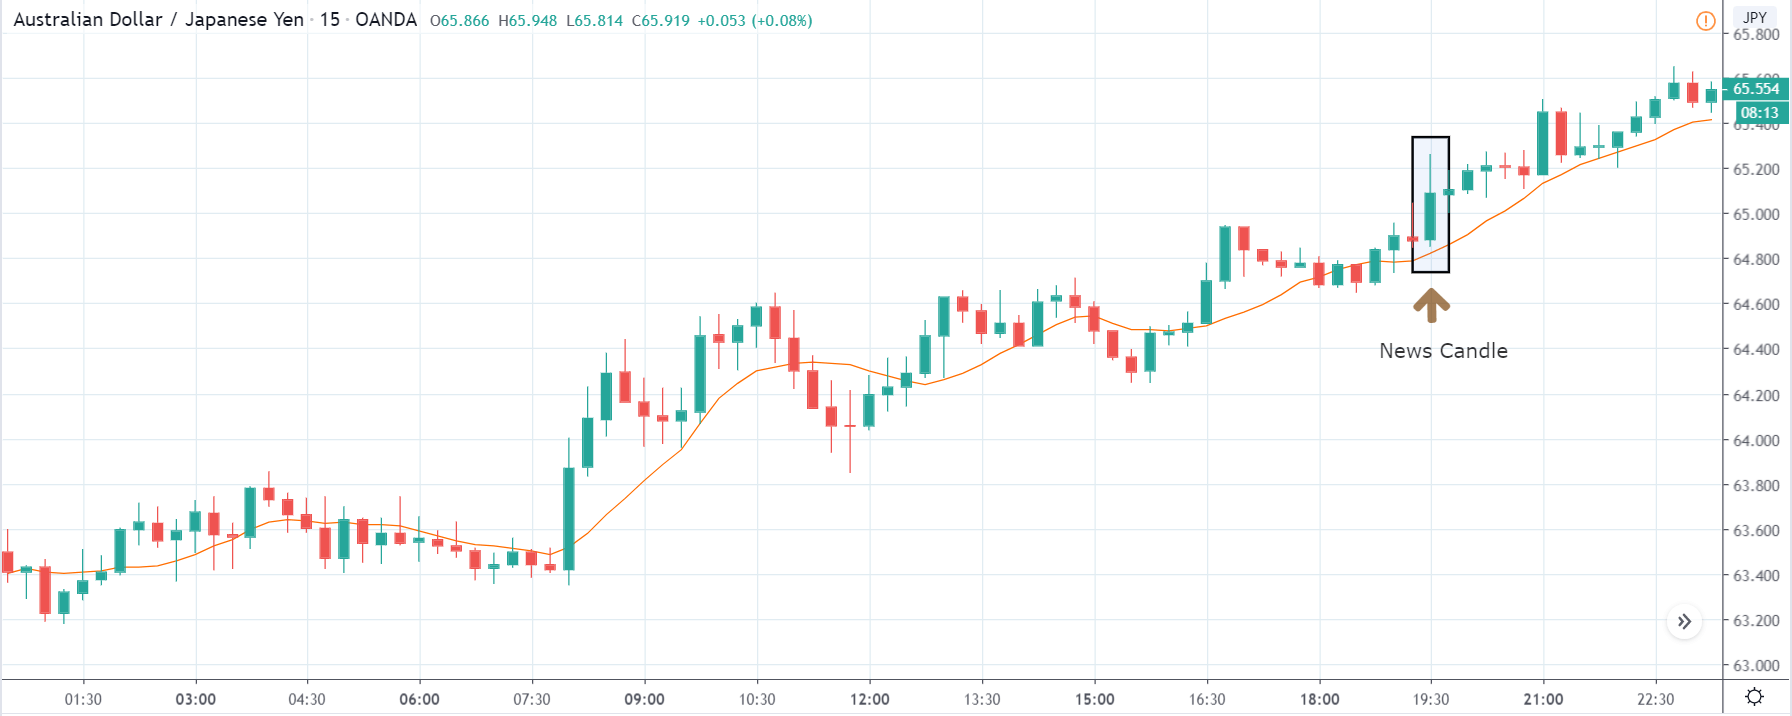
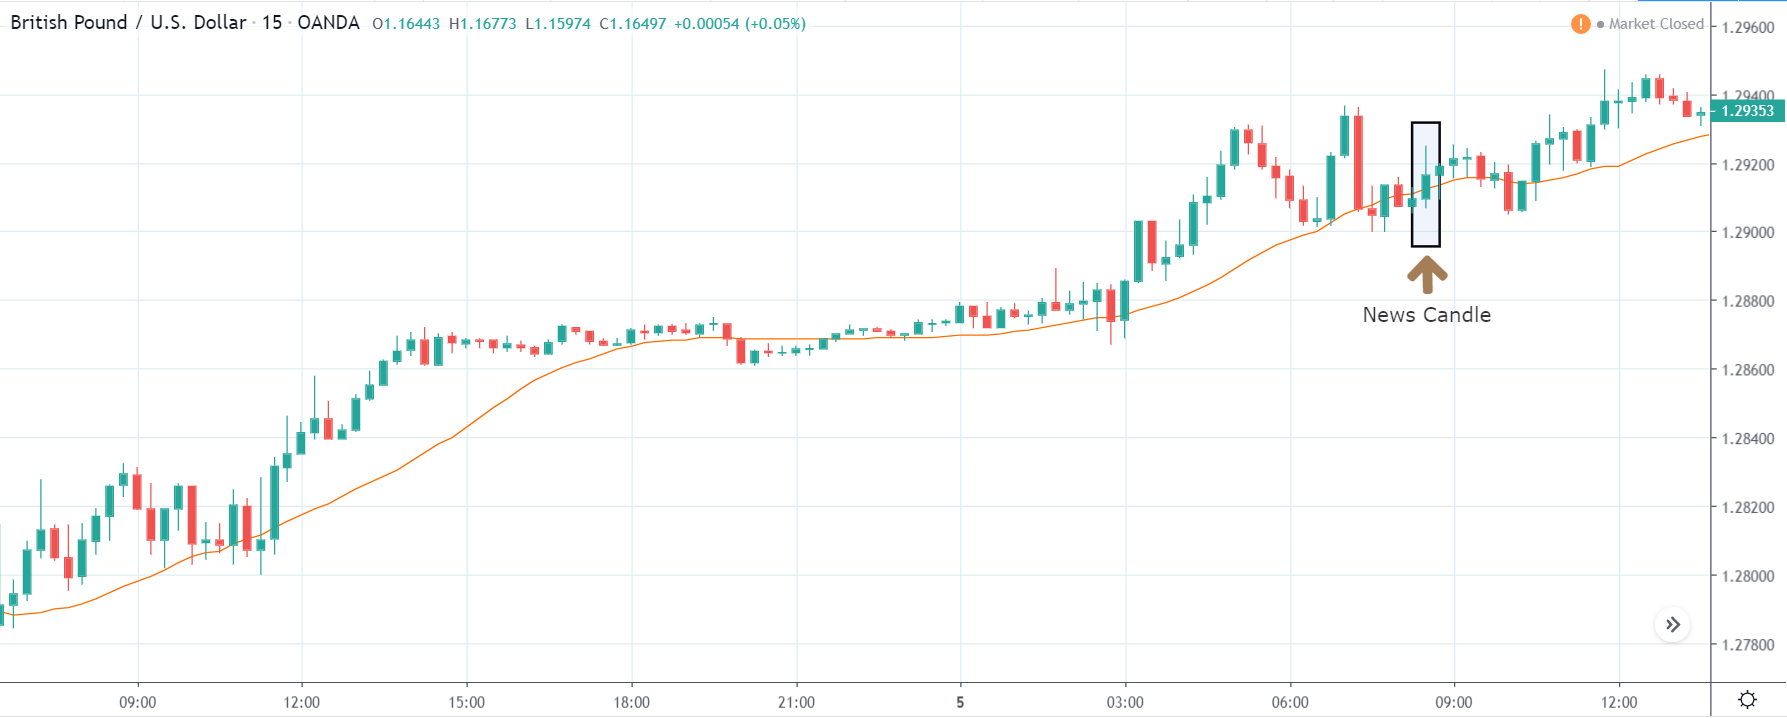
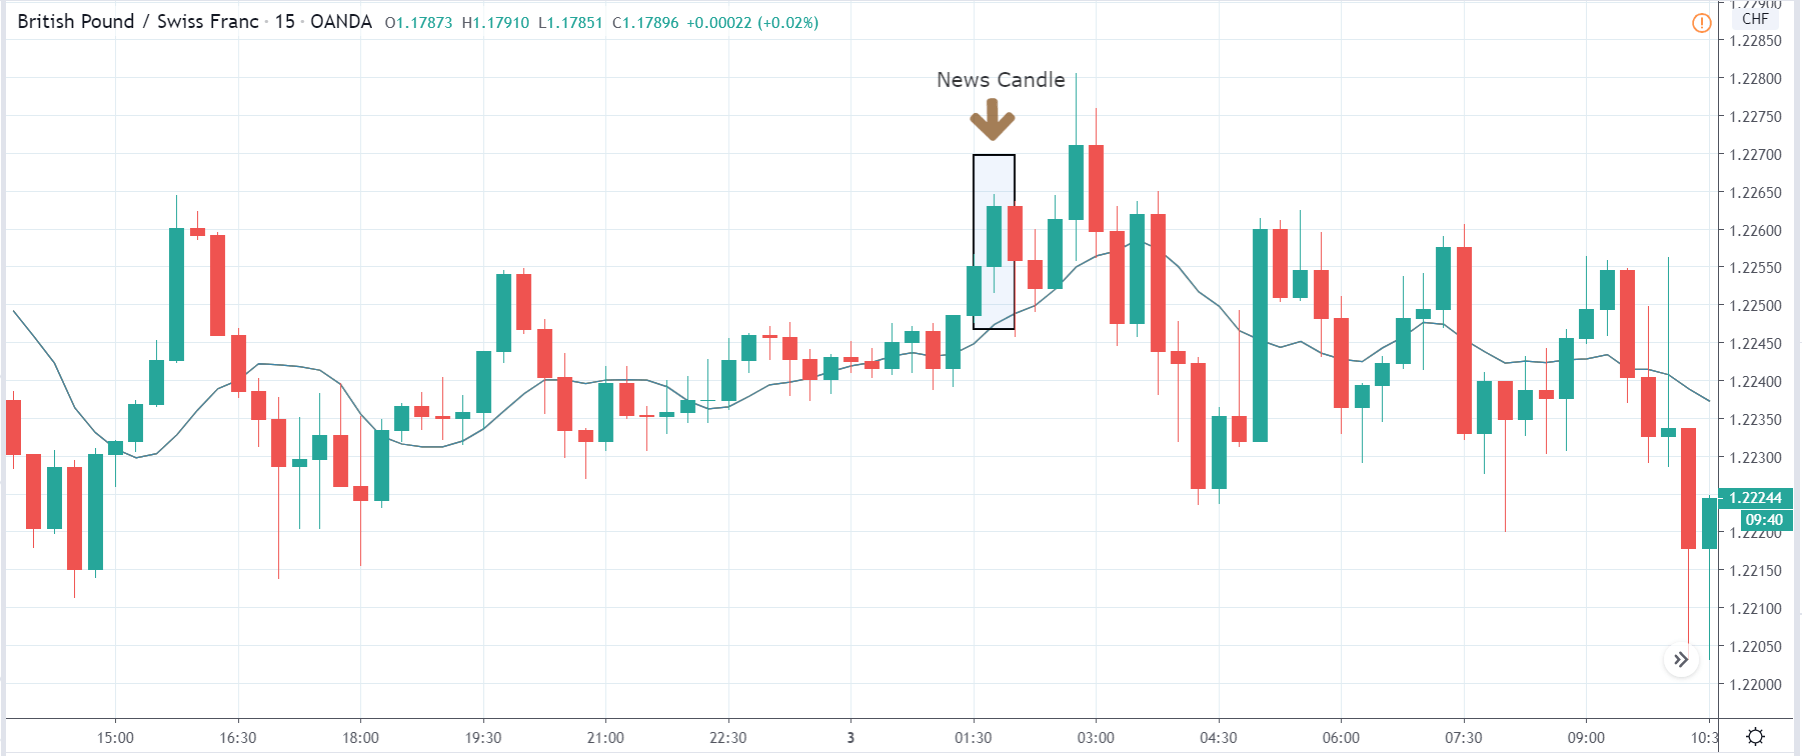
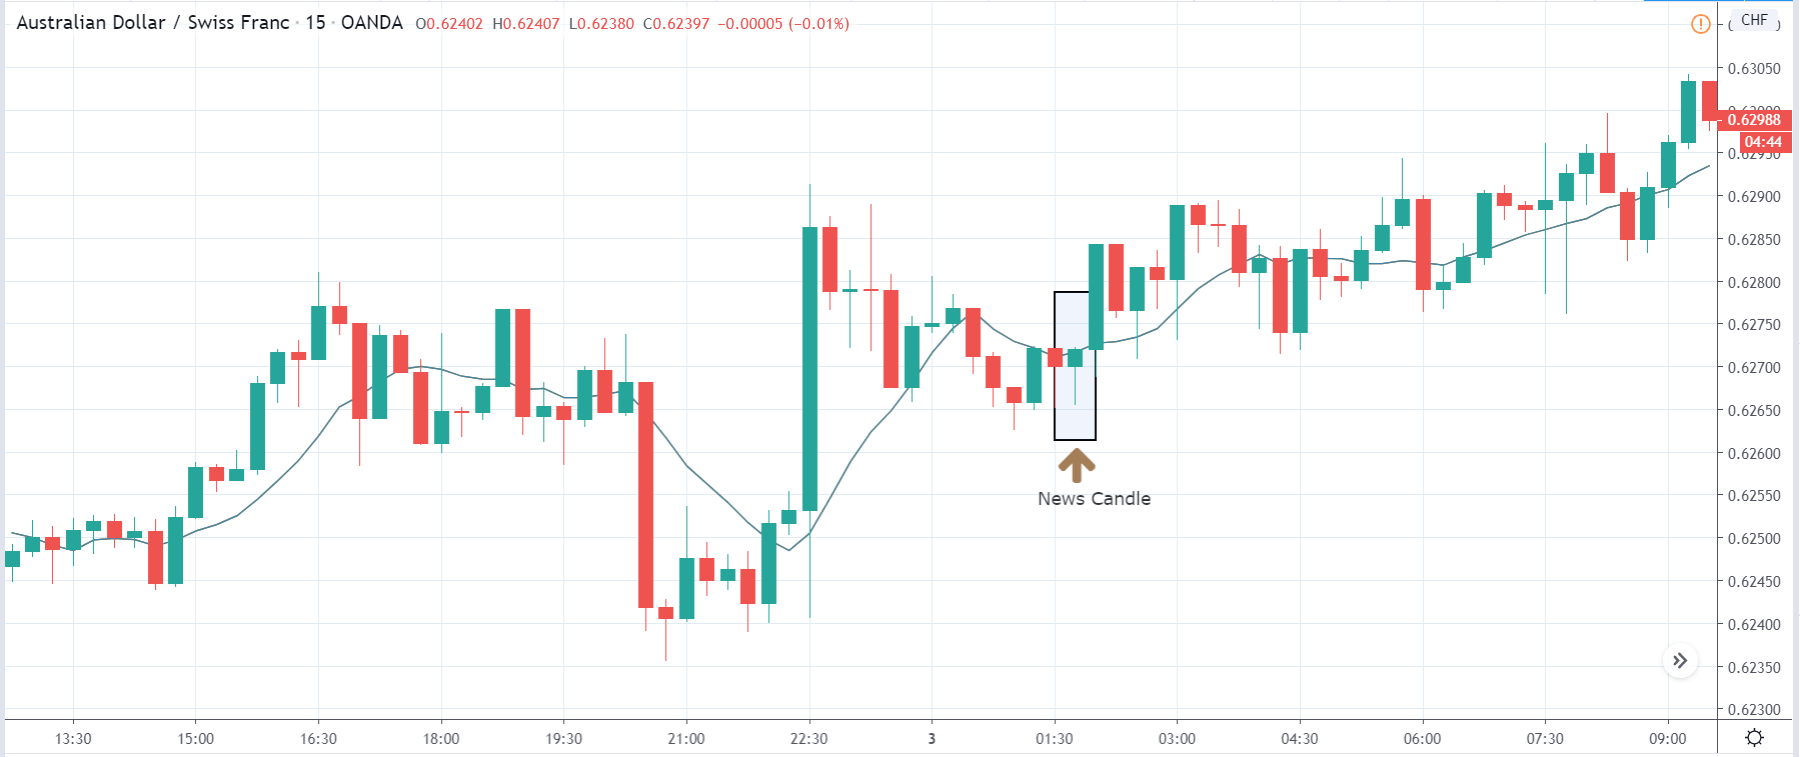
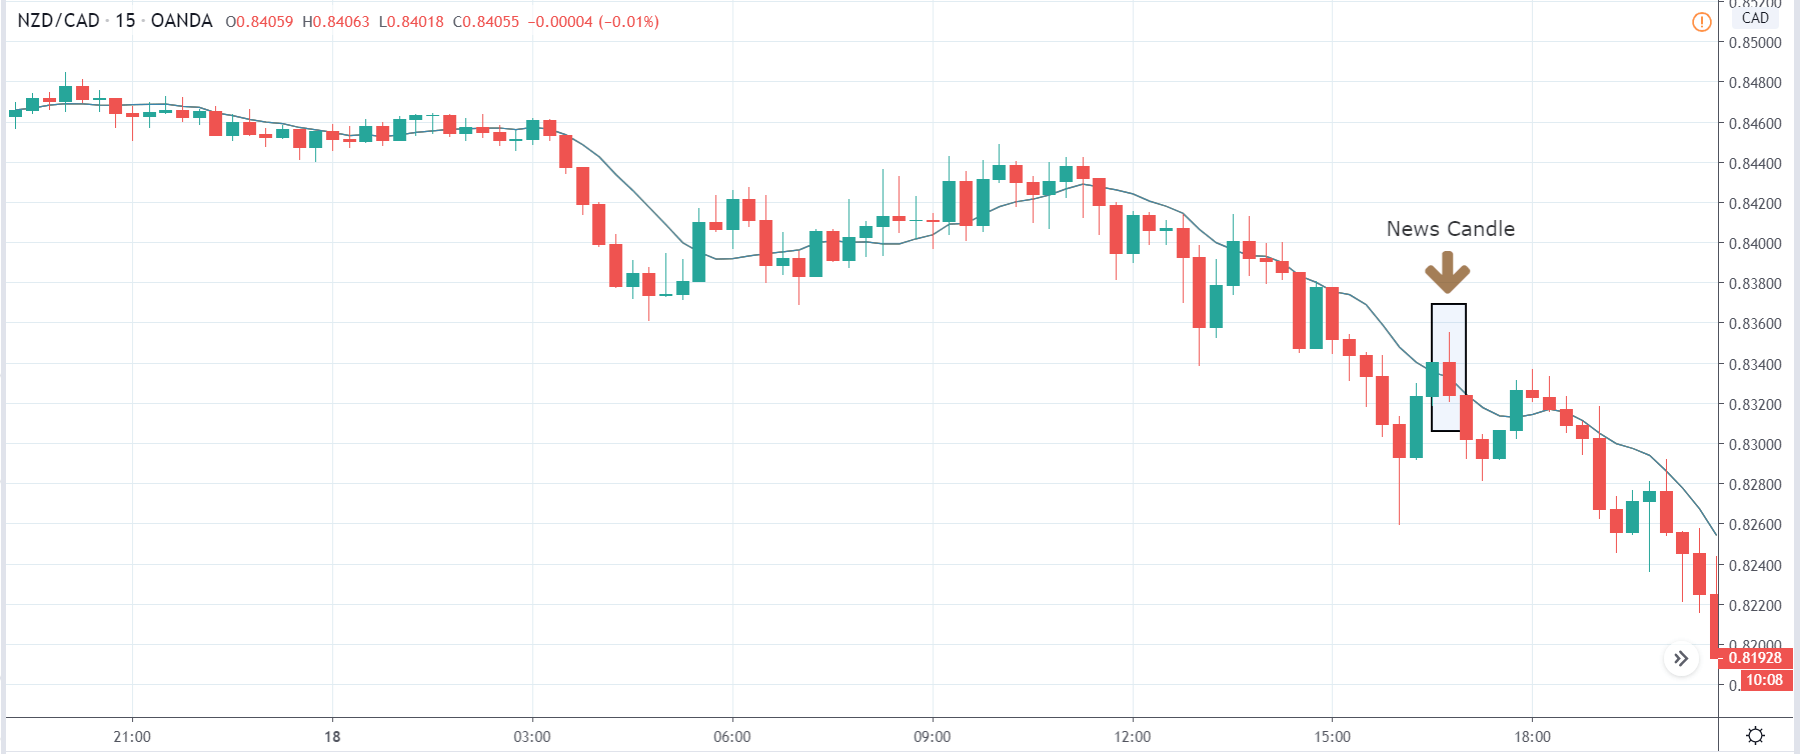
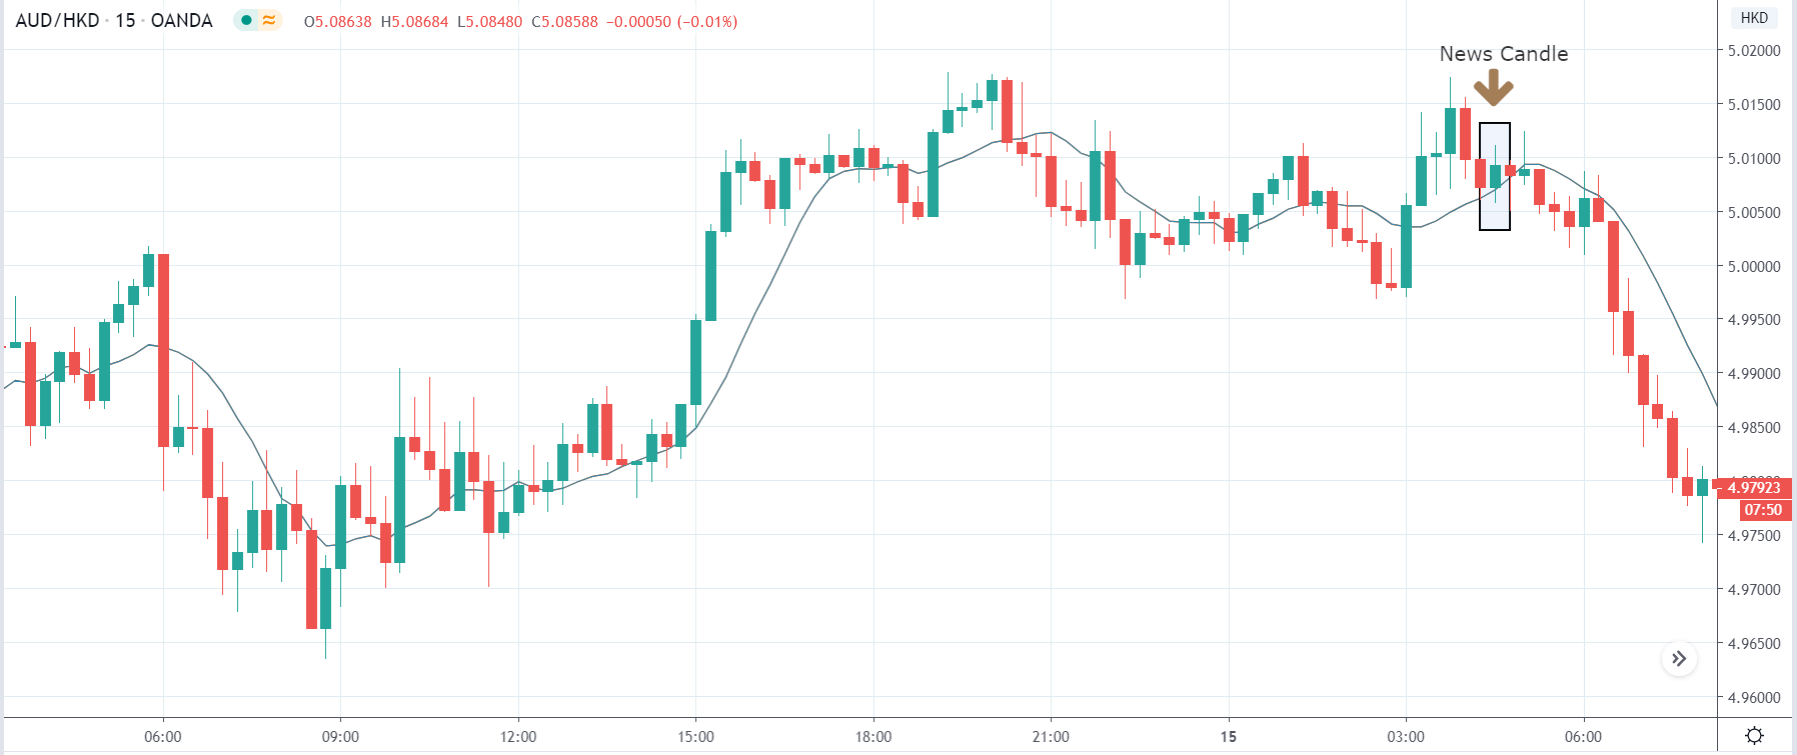
AUD/USD: After the Monthly Industrial Production Data Release 
on August 14, 2020, at 9.15 AM ET

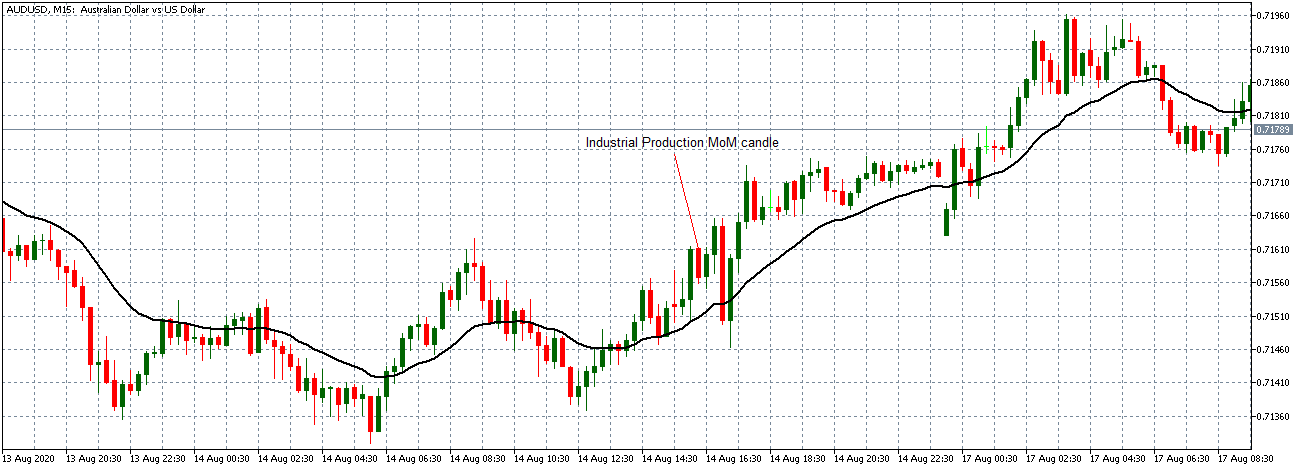
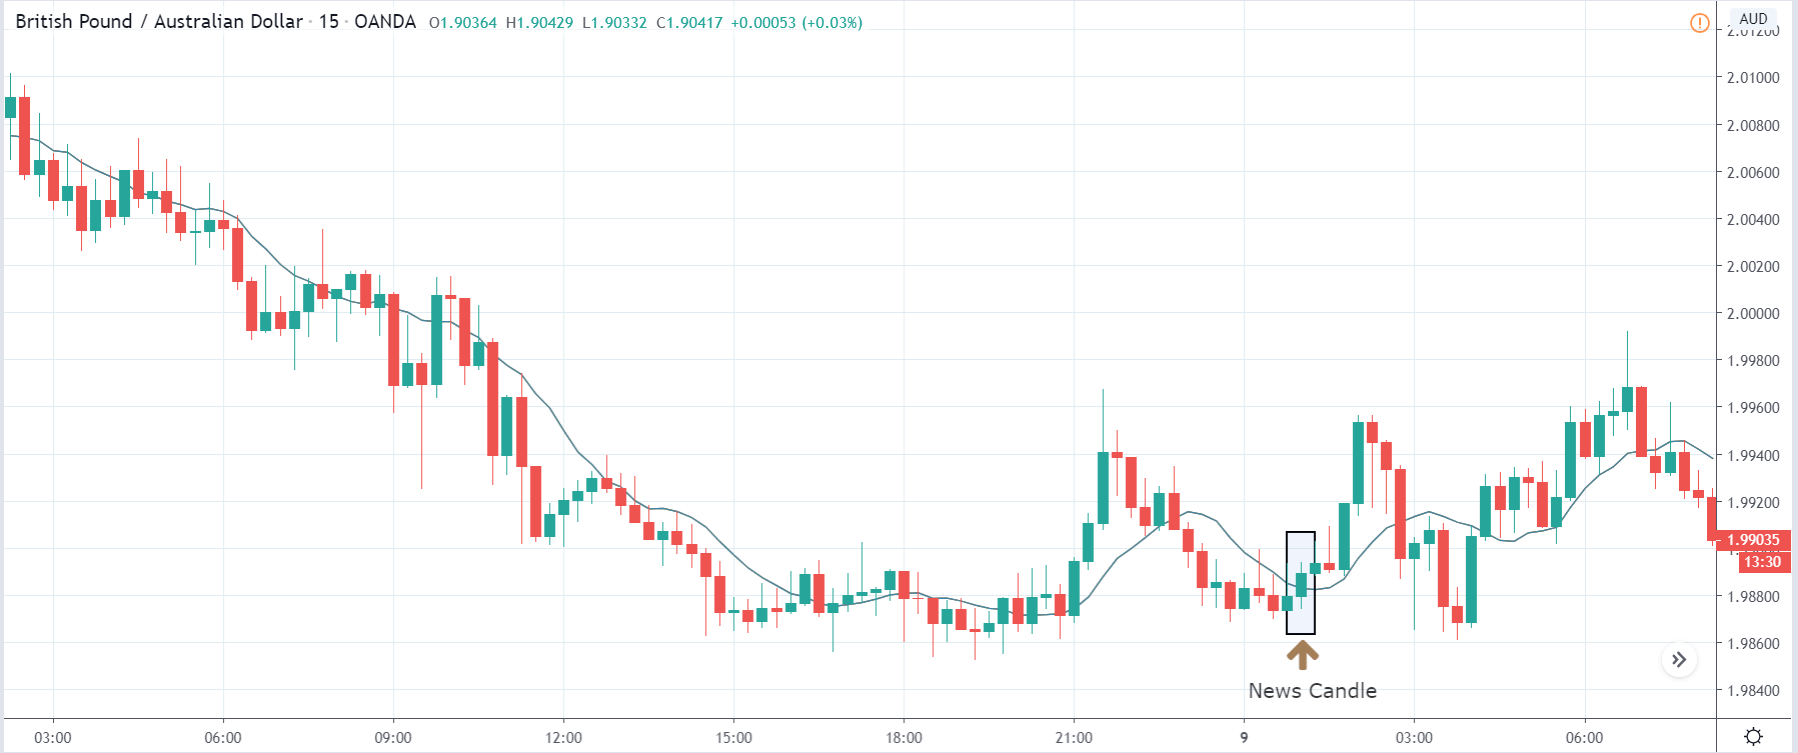
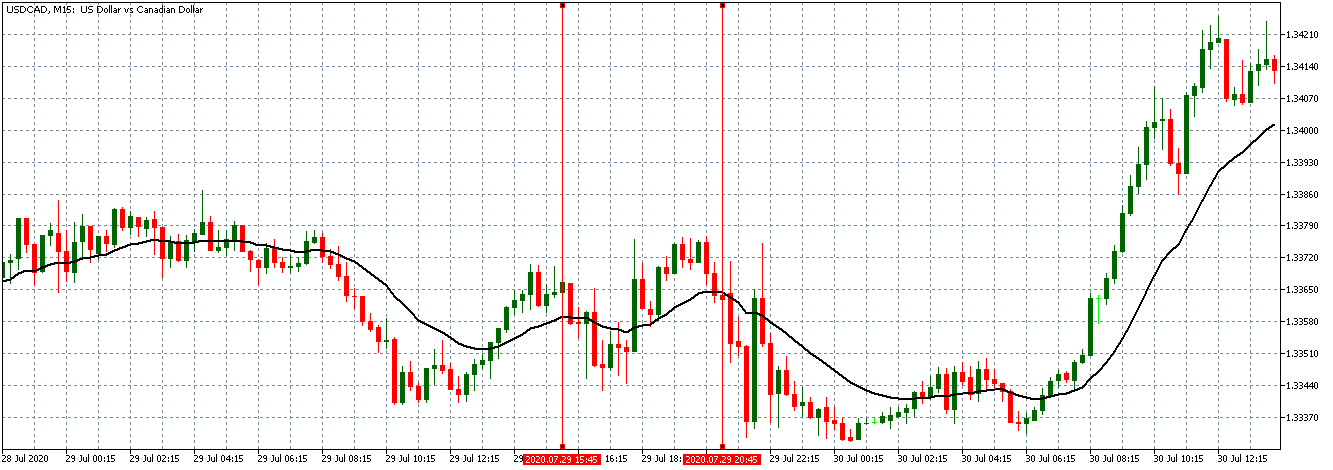
Before the data release, the AUD/USD pair was trading in a similar uptrend pattern as the EUR/USD and NZD/USD pairs. After the data release, the pair formed a 15-minute bearish candle and subsequently continued trading in the earlier observed uptrend similar to the other pairs.

Bottom Line

The monthly US industrial production data an important leading indicator of the economy’s health. From this analysis, however, while the data release affects the USD, it is not significant enough to cause a shift in the prevailing market trend.

Categories
Forex Fundamental Analysis

Fundamental Analysis for Beginners

Fundamental analysts believe that economic, social, and political events influence the forex market. Unlike technical analysis, which involves looking at past data on charts, fundamental analysis focuses on news headlines, economic data reports, and other qualifying factors to predict price movements in the market. This is mostly relevant to stocks but can be used with other instruments. Here are some things that fundamental analysts look at:

  • Economic calendars
  • News headlines
  • Unemployment records
  • Interest rates
  • Revenues, earnings, future growth, equity return on stocks
  • The Overall state of the economy
  • Supply & demand

As you can see, fundamental analysis is based on facts about a company or the economy. These different statistics can give one an idea of how the market is going to perform and whether to invest in a particular stock. The above examples can affect the economy for a country in different ways, for example, supply & demand can tell us whether the country has more imports or exports. Having more imports is not a good sign, as that means the country could go into debt. 

This data is usually used to determine a stock value so that one can determine if it is overvalued. Analysts that look at these factors often publish this data for their followers as this gives one an idea of whether the stock has a higher chance of rising in value or falling in price. Where technical analysts study past price data, fundamental analysis is more focused on how current or future events and economic data will influence prices. 

It’s important to know that fundamental analysis measures things in two different ways:

-Quantitative measurements can be measured or written in accurate numerical terms.

-Qualitative measurements are based more on characters, such as the size of a company or quantity.

Quantitative fundamentals are simply numbers and revolve around financial statements, revenue, profit, and other factors that can be expressed in accurate number readings. Qualitative measurements are more subjective. These could include brand-name recognition, the performance of a company’s executives, and other factors that cannot be measured as accurately. Most analysts take both types into consideration, rather than only focusing on one because both can tell us important information. 

When considering a company, fundamentalists consider their business model, competitive advantages, management principles, and important figures, and their policies. All of these factors can influence the company’s chances of success and the price of their stocks. 

If you’re interested in making decisions based on fundamentals, you’ll need to understand all of the driving factors that affect the economy and what influences decisions for companies. Be sure to do further research online to get into more detailed information about the things that fundamental analysts consider so that you can determine what you need to know before investing in an asset.

Categories
Forex Fundamental Analysis

Everything About Food Inflation & The Impact Of Its Release On The Forex Market

Introduction

Capitalist economies achieve economic growth using inflation as the primary fuel. Low and steady inflation rates are essential for achieving target GDP each year. Not all commodities inflate steadily and proportionally. Disproportional inflation amongst different sectors leads to over and underpricing of commodities. Food and Energy are the most basic of necessities in today’s modern society. Understanding how food inflation affects the population and the overall economy will help us better understand the inflation trends and their consequences.

What is Food Inflation?

Inflation is the typical increase in prices of commodities and a decrease in the purchasing power of money over time. Inflation is required to motivate people to work better to be able to afford it. If prices were stagnant, the necessity to grow or earn more would cease, thus halting the growth of a nation on the macro level. When that happens, people will remain in their current financial state and would not progress. Hence, inflation is the “necessary evil” or the required fuel for capitalist countries to achieve economic growth.

Food Inflation refers to the general increase in prices of food commodities. As prices inflate, our current income’s purchasing power erodes. Food and Energy are the necessities for us in this modern society. Although to some extent, Energy can be cut back on to get on with life, we cannot cut back on food.

Food is the fundamental right to every human being. Accessibility and affordability to food and water is a must for every individual regardless of their country. Food inflation monitors the affordability aspect of food within the nation; the consequences associated with it are more intricate than we might anticipate.

How can the Food Inflation numbers be used for analysis?

As people can procure fewer goods for a unit of currency over time, people can either cut back on expenses or earn more to compensate for inflation. Food expenses are mandatory expenditure part of income. High food inflation will take up a more substantial chunk out of the disposable income of individuals leaving less room for discretionary spending.

As the affordability of food decreases due to high food inflation, consumer spending is negatively affected. Consumer Spending is the primary component of GDP accounting for more than two-thirds of the nation’s GDP. In the same case, more people who are working on minimum wages find it more difficult to afford food and would be below the poverty line even when their wages are not.

Political implications would also be severe. The backlash from the public over Government’s inadequacy to control inflation would be severe and, at times, have led to strikes and bans in many countries over the years. The Government at such times faces severe criticism both from the public and the opposition parties and would likely lose the next elections.

Food inflation could also occur due to adverse weather conditions destroying crops, or mismanagement of supply and demand by the authorities, or even politically manipulating supply and demand for profit by local dealers. There have been incidents where supplies of grains were withheld to boost up the prices for better profits artificially.

In developing countries, there are incidents where Government-issued rations are also sold illegally for profit by some corrupt groups. Lack of proper support to farmers in terms of resources like electricity, water, seeds, loans could also impair them to produce a good yield. All such factors add to food inflation, whose burden falls upon the ordinary people.

It is necessary to understand that all other commodities excluding Food and Energy generally have at least some alternatives (or different brands) to choose from in case price inflates. For instance, people looking to buy clothes from a brand may switch to another brand to avoid paying the new inflated price. Food inflation effect cannot be avoided as quickly as was the previous case.

Government officials closely monitor the inflation levels and are politically committed to keeping inflation in check through fiscal and monetary levers at their dispense. Food and Energy prices are given special attention, and almost all the time, the response is quick and practical from the Government during times of disruption in the food supply.

During the COVID-19 pandemic, many countries’ governments released relief packages to make sure there is no food shortage. Despite the fact many people slipped through the cracks of these protection measures, nonetheless, Governments did everything they could to avoid starvation.

 Impact on Currency

Food inflation is part of overall consumer inflation. Consumer inflation is the primary macroeconomic indicator for currency traders to assess relative inflation amongst currency pairs. Hence, food inflation is overlooked by currency traders for the broader inflation measures like the Consumer Price Index (CPI) or Personal Consumption Expenditure (PCE).

Nonetheless, food inflation is beneficial for the government officials to keep it in check all the time and also for the economic analysts to report the same. Overall, food inflation is a low-impact coincident indicator in macroeconomic analysis for currency trading that is overlooked for broader inflation measuring statistics, as mentioned before.

Economic Reports

The Bureau of Labor Statistics publishes monthly inflation statistics as part of its Consumer Price Index report for the United States. This report has the food inflation statistics as the first criteria.

The St. Louis FRED also maintains the inflation statistics on its website and has many other tools to add to our analysis.

Sources of Food Inflation

Consumer Price Index from the US Bureau of Labor Statistics is available on its official website along with monthly updates.

We can find the same indexes along with many others with a comprehensive summary and statistics on the St. Louis FRED website.

We can find the global food inflation statistics of most countries on Trading Economics.

How Food Inflation Data Release Affects The Price Charts

In the US, the food inflation data is released simultaneously with the overall consumer price index (CPI) data. The data is released monthly about 16 days after the month ends. The most recent release was on August 12, 2020, at 8.30 AM ET and can be accessed at Investing.com here. A more in-depth review of the monthly report can be accessed at the US Bureau of Labor Statistics website.

It is worth noting that since the food inflation numbers are released together with the over CPI, it will be challenging to determine the effect it has on price action.

The screengrab below is of the monthly CPI from Investing.com. On the right, is a legend that indicates the level of impact the Fundamental Indicator has on the USD.

As can be seen, the CPI data is expected to have a medium impact on the USD upon its release.

The screengrab below shows the most recent changes in the monthly CPI data in the US. In July 2020, the monthly CPI increased by 0.6% better than analysts’ expectations of a 0.3% change. This positive change is therefore expected to make the USD stronger compared to other currencies.

Now, let’s see how this release made an impact on the Forex price charts.

EUR/USD: Before Monthly CPI Release on August 12, 2020, 
Just Before 8.30 AM ET


As can be seen from the above 15-minute chart, the EUR/USD pair was on a steady uptrend before the inflation news release. Bullish candles are forming above a steeply rising 20-period Moving Average, indicating the dollar was weakening before the release. Immediately before the news release, the uptrend can be seen to be weakening.

EUR/USD: After Monthly CPI Release on August 12, 
2020, 8.30 AM ET

After the news release, the pair formed a 15-minute bullish candle. Contrary to the expectations, the USD became weaker against the EUR since the pair continued to trade in the previously observed uptrend.

Now let’s see how this news release impacted other major currency pairs.

AUD/USD: Before Monthly CPI Release on August 12, 2020, Just Before 8.30 AM ET

The AUD/USD pair shows a similar trading pattern as the EUR/USD before the inflation news release. The pair is on an uptrend, which heads for a neutral trend immediately before the news release.

AUD/USD: After Monthly CPI Release on August 12, 2020, 
8.30 AM ET

As observed with the EUR/USD pair, the AUD/USD formed a bullish 15-minute candle after the news release. Afterward, the pair traded in a renewed uptrend with the 20-period Moving Average steeply rising.

NZD/USD: Before Monthly CPI Release on August 12, 2020, 
Just Before 8.30 AM ET

NZD/USD: After Monthly CPI Release on August 12, 2020, 
8.30 AM ET

Unlike the EUR/USD and the AUD/USD pairs, the NZD/USD traded within a subdued neutral trend with an observable downtrend immediately before the news release. However, after the news release, the pair formed a 15-minute bullish candle and traded in a steady uptrend, as seen with the other pairs.

Bottom Line

In theory, a positive CPI data should be followed by an appreciating USD. From the above analyses, however, the positive news release resulted in the weakening of the USD. This phenomenon can be choked to the effects of the coronavirus expectations, which have made fundamental indicators less reliable.

Categories
Forex Fundamental Analysis

Impact of ‘Employment Rate’ Economic Indicator On The Forex Market

Introduction

Employment is crucial for consumer spending, which makes more than two-thirds of the GDP for many countries. Understanding the employment rate and the cascading effect it has on the economy is paramount for fundamental analysis. The factors affecting the employment rate and business cycle patterns all inherently impact economic growth and currency valuation. Hence, understanding employment as an economic indicator will strengthen our analysis.

What is Employment Rate?

Employment Rate:  It is defined as the ratio of employed to the total available labour force. Here the labour force is defined as the sum of employed and unemployed persons. It is also considered as a measure of the extent to which the labour force is being used.

Unemployment is a state where an individual is actively searching for employment but cannot find work.

Unemployment Rate: It is defined as the percentage of unemployed people to the available labour force. It is the other half of the employment rate. Employment and unemployment rate combined should yield results as 100% as it equals the total available labour force.

How can the Employment Rate numbers be used for analysis?

Employment and unemployment can be considered as the two sides of the same coin. We can derive our fundamental conclusions from either direction. Employment Rate is essential for our analysis because it has a direct and cascading impact on consumer spending. In the US, consumer spending accounts for about 70% of the total GDP.

A high employment rate indicates that more people in the labour force have income that they can spend on purchasing goods and services. When consumer spending is on the rise, businesses flourish, leading to better wages, or even more employment. Overall, employment in one sector has an indirect positive effect on dependent sectors and a direct positive effect on the economy.

The Government is also politically committed to ensuring a low unemployment rate; otherwise, citizens will not favour them in the next elections. By providing proper support to local businesses, the Government can increase employment in the short run.

A high unemployment rate is very damaging to the economy. As more people are unemployed, there is a direct negative effect on consumer spending. In this scenario, also the cascading effect works and makes the situation worse. It also hurts the employed people.

Increased unemployment in the economy can bring down the employed morale, making them feel guilty for being employed while their colleagues are unemployed. It can also make employed people feel less secured and discourage their spending habits, and they may end up saving for a rainy day. Employed people may feel lucky enough to have a job that inhibits them from applying for better opportunities amid high unemployment.

Employment and Unemployment rates can also help investors to keep a pulse on the health of the economy. Overall it is essential to make sure the employment rate is always high and does not take a dip. Even when the unemployment rate rises linearly, it has an exponential impact on economic growth, and hence the central authorities try to avoid it at all times.

It is also essential to understand that employment rates are sensitive to business cycles in the short run. Hence, seasonally adjusted versions of the same are more useful for analysis. In the long run, the employment rates are significantly affected by government policies on higher education and income support. Policies that focus on the employment of women and disadvantaged groups also help increase the employment rate.

Both developing and underdeveloped countries’ governments have to focus on education policies and employment opportunities for their labour force if economic growth is the primary concern. Literacy and higher education in underdeveloped and developing nations have helped the economies grow stronger year-on-year.

Employment rates are coincident indicators and can also be used to predict or confirm oncoming recessionary or recovery periods, if any. The onset of a recession is accompanied by a massive unemployment rate or decreased employment rates. Hence, despite the propaganda of the media and Government, we can use employment data actually to confirm whether the economy is growing or stagnating. Accordingly, during recovery periods, employment rates start on a recovery trajectory back to its previous normal.

Impact on Currency

As an increase in employment rate points towards a growing economy, a high employment rate is good for the GDP and the currency. Hence, the employment rate is a proportional coincident indicator. An increase or decrease in employment rate is suggestive of improving or deteriorating the economy, respectively.

The forex market watches the unemployment rate more closely than the employment rate itself. Significant changes in the employment rate or the unemployment rate tend to have a considerable impact on market volatility. Still, generally employment rate in itself is a low impact indicator compared to the unemployment rate.

Employment change, initial jobless claims also precede unemployment rates, and the desired effects are already factored into the market before the employment rates are released. Hence, overall it is a low impact indicator.

Economic Reports

In the United States, the BLS surveys and tracks monthly employment and unemployment within the country. It classifies them based on geography, sex, race, industry, etc. The Employment Situation report is also published by the BLS, and it goes as far back as the 1940s. It is released by BLS on the first Friday at 8:30 AM Eastern Standard Time every month.

Sources of Employment Rate

The US BLS publishes monthly employment and unemployment reports on its official website. We can also find the same indexes and statistics of various categories on the St. Louis FRED. We can also find employment rate statistics published by the OECD countries here. Consolidated reports of employment rates of most countries can also be found in Trading Economics.

How Employment Rate News Release Affects The Price Charts

As we have already established, an increase or decrease in the employment rate can be used to gauge whether the economy is performing well or poorly. For forex traders, it is therefore imperative to understand how the news release of this macroeconomic indicator will impact the price action on various currency pairs.

In the US, employment reports are released monthly, usually on the first Friday after the month ends. The latest, expected, and all historical figures are published on the Forex Factory website. We can find the most recent release here. Below is a screengrab of the US unemployment rate from the Forex Factory website. On the right, we can see a legend that indicates the level of impact the Fundamental Indicator has on the corresponding currency.

As shown, the unemployment rate is a high impact indicator. The snapshot below shows the change in the US unemployment rate as released on August 7, 2020, at 1230GMT. For July 2020, the unemployment rate declined from 11.1% to 10.2%, beating the 10.5% decline forecasted by analysts.

Now, let’s see how this news release made an impact on the Forex price charts.

EUR/USD: Before Employment Data Release August 7, 2020, Just Before 1230GMT

The 30-minute EUR/USD chart above shows the market is on a downtrend from 0200 to 1200 GMT with the candles forming below the 20-period Moving Average. More so, the market was trading within a narrow price channel of between 1.1850 and 1.1810, indicating a calm market with traders waiting for the latest employment data to gauge the economic recovery.

EUR/USD: After Employment Data Release August 7, 2020, 1230GMT

As can be shown on the chart above, immediately after the news release, we can observe a sudden downward spike with a retraction. This spike indicates the market is having mixed reactions to the positive employment news hence the strong USD.

After the initial spike, the market can be seen to ‘absorb’ the positive news. The pair adopted a bearish outlook with the price breaking and staying below the earlier observed 1.1810 resistance level.

Since the pair had not shown any unexpected sudden swings before and after the new release, trading the news would have been profitable. For such a high impact economic indicator, it is advisable to open positions after the news release to avoid being caught on the losing end of the trend.

Now, let’s quickly see how this new release has impacted some of the other major Forex currency pairs.

GBP/USD: Before Employment Data Release August 7, 2020, Just Before 1230GMT

GBP/USD: After Employment Data Release August 7, 2020, 1230GMT

The GBP/USD pair showed a similar trend as the one observed with EUR/USD. The pair can be seen to have traded within a narrow price channel of 1.3122 and 1.3071 from 0700 to 1200 GMT. After the economic data release, the pair similarly had a sudden spike. It later adopted the same bullish stand as the EUR/USD pair, with price breaking and trading below the observed resistance level.

AUD/USD: Before Employment Data Release August 7, 2020, Just Before 1230GMT

GBP/USD: After Employment Data Release August 7, 2020, 1230GMT

Similar to the EUR/USD and the GBP/USD pairs, the AUD/USD traded within a price channel of 0.7221 and 0.7196 and no unexpected spikes before the news release. After the news release, a sudden spike can be observed with an accompanying retraction, and later the pair adopted a bullish stance breaking below the observed resistance level.

From the above analysis, the subdued market volatility before the release of the employment data and the subsequent volatility, it is evident that the employment rate is high impact indicator anticipated by forex traders.

Categories
Forex Fundamental Analysis

Everything About Deposit Interest Rate as a Macro Economic Indicator

Introduction

Deposit Interest Rates play a crucial role in controlling the flow of money within the economy and the international market. The interest rate differentials have always directed the flow of speculative money in and out of countries, thereby affecting the currency exchange rates. Hence, it is crucial to understand Deposit rates as an economic factor in the FOREX industry.

What is Deposit Interest Rate?

Deposit Interest Rate: It is the money financial institutions pay the depositing party. The deposit account holders put some money in the bank for which the bank pays out interest. Deposit accounts can be a savings account, Certificates of Deposit (CD), and self-directed deposit retirement accounts.

Banks give loans to its customers at a higher rate than the interest they pay out on their deposit accounts. It is this spread between the lending rate and deposit rate that banks make their profit and is called Net Interest Margin.

How can the Deposit Interest Rate numbers be used for analysis?

Potentially, banks are free to set their deposit rates at whatever rate they desire, but they have to keep competition and business into account. Deposits provide financial institutions with the necessary liquidity to maintain business and give out more loans. Banks need to give out loans to make a profit, but also needs to have depositors to provide the required liquidity. Within the country, when the deposit interest rates are low, people would be more interested in investing their money in stocks or other money markets where there is a possibility of a higher return on their capital.

Conversely, banks may increase their deposit rates to attract investors to deposit their capital providing banks with the necessary liquidity to fund their loans. Investors see bank deposits as a safe bet against the risky stock or money markets where they are subjected to a potential loss. Customers are also encouraged to save more and spend less when they get a higher return on their deposits. In the international markets, investors check and compare the lending and deposit rates of major banks in different countries. When the deposit rate of a bank in one country is higher than the lending rate of a bank in another country, there is a chance of making money.

Investors, traders, or some institutions may borrow money from a low-interest rate country and deposit in another country where the rates are high. This difference in the lending and deposit rates amongst banks of different countries is called Interest Rate Differential or ‘Carry.’ For example, let us assume when the deposit rate in Australia is 5%, and the lending rate in the United States is 3.5%. The difference of 1.5% return will move the speculative or “hot” money out of the United States and into Australia. When the Australian Dollars start to flow into the country, the global FOREX market is deprived of the AUD currency, and, hence, it is appreciated.

The below plot also shows the historical difference between the interest rates differential (AUS IR – USA IR) and the AUD USD exchange rate. As we can see, whenever the difference between the interest rates rises in favour of AUD, the exchange rate tends to follow. There is a good correlation between both in the long run. Whenever the direction changes in favour of the United States, so does the exchange rate.

Hence, the “carry” essentially directs the flow of “hot” money in and out of countries whenever there is an increase in interest rates differentials. The larger the difference and consistent the direction of the differential in the plot (positive or negative) more will be the inflow of money in that direction.

When the differential is near or close to zero, then the speculative money may be forced into other options to generate revenue. The interest rate differential may be prominent when paired against small and developing countries to that of developed countries in general. As most of the developed economies are struggling to maintain their growth and have been forced to keep interest rates low, it indeed is a little tricky to find currency pairs to generate a significant carry.

Impact on Currency

Deposit rates have a definite impact on the currency markets. It is one half of the money flow equation. When the lending rates and deposit rates are checked and compared, money flow starts in favour of the higher deposit rate country that appreciates the currency value and vice-versa.

Therefore, deposit rates alone do not determine currency value fluctuations. But in general, it is safe to say that higher deposit rates tend to appreciate currency’s value as the market is deprived of that currency. Conversely, low-interest rates on deposits discourage saving and thereby go into spending, which contributes to inflation and currency depreciation.

Economic Reports

The deposit interest rates of local banks can be found on the respective banks from which we would want to borrow money. But in general, the deposit rates and lending rates due to market forces are subject to be close to the country’s Central Bank’s target rate.

For the United States, it is the Fed Funds target rate, and the actual rate is called the effective Fed Funds rate. The Federal Reserve publishes Monday to Friday the daily Interest Rates in its H.15 report at 4:15 PM on its official website. Weekly, Monthly, Semi-annual and Annual rates of the same are also available.

Sources of Deposit Interest Rate

The United States Fed Rates are available here. The monthly effective Fed Funds rates are available in a more consolidated and illustrative way for our analysis in the St. Louis FRED website. Consolidated Deposit Interest Rates of different countries are available here.

How Deposit Interest Rate Affects Price Charts

For forex traders, monitoring other economic indicators is usually meant to help them predict what interest rates are going to be in the future. However, since the deposit interest rates largely depend on the federal funds rate, they rarely have any significant impact on the forex markets by itself. It is worth noting that the US FOMC only meets eight times in a year to determine the federal funds’ target rate. This explains the lack of impact by the deposit interest rate.

In the US, the Fed Funds target rate, on which deposit interest rates are based on, are published every weekday at 4.15 PM ET. Below is a screengrab of the Fed Funds target rate from August 11 to August 17, 2020.

As can be seen, the rate has remained the same at 0.1%. The screenshot below is from Forex Factory, showing that the latest FOMC decision recommended that the Fed Funds target rate remains between 0% and 0.25%.

Now that we’ve established the impact that the deposit interest rate has on the economy and the currency valuation let’s see how it impacts the price action of some select currency pairs.

EUR/USD: Before Effective Fed Funds Rate Release August 17, 
2020, Just Before 4.15 PM ET

The 15-minute EUR/USD chart above shows that the market between 10.15 AM and 4 PM ET on August 17, 2020, had no specific trend. The market has adopted an almost neutral stance with the candles forming just around the flattening 20-period Moving Average.

EUR/USD: After Effective Fed Funds Rate Release August 17, 
2020, 4.15 PM ET

As can be seen on the chart above, immediately after the daily update on the Effective Fed Funds rate, there is a slightly bullish 5-minute candle forms. The news, however, is not significant enough to the market to cause any spikes or change the prevailing market trend. As can be seen, the pair continued with its neutral trend and a flattening 20-period Moving Average.

Let’s see how this new release has impacted some of the other major Forex currency pairs.

GBP/USD: Before Effective Fed Funds Rate Release August 17,
2020, Just Before 4.15 PM ET

The neutral trend observed with the EUR/USD pair before the daily release of the Effective Fed Funds Rate can be seen on the GBP/USD chart above. The candles formed just around the flattening 20-period Moving Average.

GBP/USD: After Effective Fed Funds Rate Release August 17, 
2020, 4.15 PM ET

After the news release, a 15-minute bullish candle forms. However, the same neutral trends persist with the pair indicating that the news was not significant enough to move the markets and cause a change in the trend.

AUD/USD: Before Effective Fed Funds Rate Release August 17, 
2020, Just Before 4.15 PM ET

AUD/USD: After Effective Fed Funds Rate Release August 17,
2020, 4.15 PM ET

Unlike with the EUR/USD and the GBP/USD pairs, the AUD/USD pair had a clear uptrend before the daily release of the Effective Fed Funds Rate. This uptrend was not a steady one since the candles formed just above an almost flattening 20-period Moving Average. After the news release, a bullish 15-minute candle is formed. The news was, however, not significant enough to alter the prevailing market trend.

While the deposit interest rate is vital in determining the flow of money in an economy, it plays an almost insignificant role in moving the forex markets. Cheers.

Categories
Forex Fundamental Analysis

Impact of ‘Bankruptcies’ News Release On The Forex Assets

Introduction

A bankruptcy on paper and in reality differ in several meaningful ways. The short and long-term implications both have to be fully taken into the picture before forming an opinion or drawing any inference from the Bankruptcy statistics. Contrary to popular belief, it is not as bad as it sounds and is more frequent for businesses to file for bankruptcy as a means to reset their business to become profitable. Correctly understanding bankruptcy, its implications, and its statistics can help us make better trade decisions in the long run.

What is Bankruptcy?

Bankruptcy is the legal state of an individual or a company that has become insolvent. When an individual or a company is unable to repay its debt, it can file a petition for bankruptcy in the federal court. When individuals lose their income source or when a business takes on continued periods of losses are likely to file bankruptcy.

The bankruptcy process starts when a petition is filed by the debtor or the creditor, although it is more common for the debtors to file for bankruptcy. Successful processing of a bankruptcy petition can benefit the debtor to be discharged of their debts, thus giving them the freedom from the overburdening debts and restart.

When a bankruptcy petition is processed, the assets of the debtor are evaluated, and an appropriate portion may be allotted to repay the creditors. Whether all of the assets are sold off to repay debt or not depends on the types of bankruptcies filed. Many a time, creditors may need to reorganize the debt to allow the debtor to pay off the debt in smaller installments over three to five years.

How can the Bankruptcies numbers be used for analysis?

On paper, all this may seem favorable to the debtor offering immediate relief from the overwhelming debts.  The debtor may not be required to pay at all if the debtor does not have assets or income or at least greatly waive off their debt installments. Successful proceeding of a bankruptcy petition can partially or entirely waive off debts for a chance to save your home or business from going-under.

Such an exemption comes at a cost, though. As mentioned, on paper, it seems like a favorable option for the debtor in a tight spot, but in the long-run, it has far-reaching implications. If a debtor is filing bankruptcy, chances are, their credit score has already gone wrong due to failed payment dues in past months. When the bankruptcy is filed, it will stay on the record of that individual or company for ten years. In this process, the credit rating goes low, and a remark of bankruptcy on record prevents you from being eligible for future credits, loans, mortgages, or even credit cards.

When lending sources are all cut off, then it is challenging for both individuals and businesses to become profitable. Some may even end up borrowing from sources where interest rates are much higher than the standard rates, ending up in deeper trouble than before.

Filing bankruptcy is more frequent for businesses to reorganize their remaining assets and come up with a new strategy to be profitable. All the bankruptcy cases are handled in the federal courts by a bankruptcy judge. They are classified as per the bankruptcy code that details different chapters for different types of bankruptcy case scenarios.

From a macroeconomic perspective, bankruptcy filing gives both the debtors and creditors a fresh start by allowing debtors to be eligible for credit and creditors to recover some portion of the credit. Having such a system that can accommodate failures of individuals and companies is a sign of a fair and inclusive economy that embraces and tolerates both ups and downs of individuals and businesses.

From a purely business and growth perspective, increasing bankruptcy cases is just plain bad for the economy as it indicates businesses are shutting down, and people are losing jobs. Both of those scenarios do no good for the economic growth and contribute negatively to both growth and consumer & business sentiment within the nation. Filing of bankruptcy thrashes the equity market performance of corporations as investors lose confidence in the business.

Recessions, war-times, or times like global pandemic observe an increasing number of bankruptcy cases indicating that the economy is not faring well. Hence, from an economic standpoint, the “fewer the better” would be the goal for a prosperous economy.

Impact on Currency

Filing Bankruptcy is often the last resort for the debtor when all other options are closed. Hence, the bankruptcy statistics are backward-looking or a lagging indicator confirming an ongoing past trend which could have been deduced from the past poor performance. Bankruptcy statistics would then be useful for economic analysts for analysis but does not serve as a useful indicator either for the equity or the currency markets. Hence, bankruptcy figures could be overlooked for other leading macroeconomic indicators for the currency markets.

Economic Reports

The United States Courts provide historical data of the quarterly reports of bankruptcy filings in the country on its official website. The Organization for Economic Co-operation and Development (OECD) also maintains bankruptcy statistics for reporting members. Moody’s analytics also provide personal and corporate bankruptcy filings on their official website.

Sources of Bankruptcy Statistics

The US Courts maintain bankruptcy filings records on its website.

The OECD Bankruptcy statistics are also helpful for quick reference of the OECD member countries.

Global Bankruptcy statistics are available on Trading Economics.

Moody’s analytics also report personal bankruptcies.

How Bankruptcies’Data Release Affects The Price Charts

Estimating the exact impact of bankruptcies on an economy is hard to quantify. Since the bankruptcies data is released quarterly, its impact on the forex market tends to be negligible because the data is backward-looking. The most recent data was released on June 30, 2020, at 8.00 AM ET and can be accessed from the United States Courts website here. The historical bankruptcies’ data in the US can be accessed at the Trading Economics website.

The screengrab below is from the quarterly bankruptcies’ data from Trading Economics.

As can be seen, the total number of bankruptcies in the United States decreased to 22,482 companies in the second quarter of 2020 from 23,114 companies in the first quarter of 2020.

Now, let’s see how this release made an impact on the Forex price charts.

EUR/USD: Before the Quarterly Bankruptcies Data Release on August 2020, 
Just Before 8.00 AM ET

As can be seen in the above 15-minute EUR/USD chart, the pair was trading on a weak downtrend. This trend can be affirmed since the 20- period Moving Average is decreasing in the steepness of its decline with candles forming closer to it.

EUR/USD: After the Quarterly Bankruptcies Data Release on August 2020, 8.00 AM ET

After the release of the bankruptcies data, the pair formed a 15-minute “hammer” candle. This pattern indicates that the USD became weaker against the EUR. This trend is contrary to the expectations since the number of bankruptcies had declined from the previous quarter. The pair adopted a bullish stance with the candles crossing above a now rising 20-period Moving Average.

Now let’s see how this news release impacted other major currency pairs.

GBP/USD: Before the Quarterly Bankruptcies Data Release on August 2020, 
Just Before 8.00 AM ET

The GBP/USD pair showed a similar weakening downtrend trend as observed with the EUR/USD pair before the release of the bankruptcies data. The 15-minute candles can be seen, forming closer to the 20- period Moving Average, whose downward steepness is decreasing.

GBP/USD: After the Quarterly Bankruptcies Data Release on August 2020, 8.00 AM ET

After the news release, the pair formed a 15-minute bearish “Doji star” candle. Similar to the EUR/USD pair, GBP/USD  adopted a bullish stance with the candles crossing above a now rising 20-period Moving Average.

AUD/USD: Before the Quarterly Bankruptcies Data Release on August 2020, 
Just Before 8.00 AM ET

AUD/USD: After the Quarterly Bankruptcies Data Release on August 2020, 8.00 AM ET

Unlike the downtrends observed with the EUR/USD and the GBP/USD pairs, the AUD/USD traded within a subdued neutral trend before the bankruptcies data release. The 15-minute candles were forming around an already flattened 20-period MA. After the data release, the pair formed a 15-minute bullish “Doji star” candle. It later traded in the same bullish pattern as observed in the other pairs.

Bottom Line

In the current age of the coronavirus pandemic, data on bankruptcies provide a vital indicator of the economic conditions. However, in the forex market, these data do not carry much significance, as shown by the above analyses.

Categories
Forex Fundamental Analysis

What Is ‘Interbank Rate’ and What Impact Does It Have On The Forex Market?

Introduction

The Interbank rate is an essential tool used by the central authorities to control the money flow within the economy. Changes in the interbank rate can add or withdraw money from the system overall, which can stimulate growth or slow down the economy, respectively. The Interbank rate drives interest rates for bank loans, which are the significant sources of capital for businesses and the general public. The understanding of the Interbank rate is crucial for our analysis.

What is the Interbank Rate?

The interbank rate is the percentage rate at which the United States banks lend each other money. A country’s Central bank dictates the banking practices for the banks within the nation. For the United States, it is the Federal Reserve which decides the interest rates and the banking practices. The central banks, in general, demand 10% of their total deposits be held as reserves to maintain liquidity and meet withdrawal needs.

Based on the interbank rate, banks having excess cash can lend money to the banks, which are falling short of capital to meet their immediate requirements or to maintain their minimum reserves.

What is the Interbank Rate – Second Definition?

The interbank rate also refers to the rate at which banks exchange currencies in the global forex market. The forex market consists of an interbank market, which is a significant part of the forex market system overall. This interbank market consists of big players. Most of those are banks, large financial institutions, investment banks, and mutual funds corporations and do not include retail forex institutions or traders.

The interbank rate numbers are what you see when you search in Google the currency exchange rate for a particular pair, but this is not the rate at which you can trade a pair. This rate is only available for the interbank market participants who are usually big financial corporations trading in millions and billions. The price you see is a jacked-up price of the interbank rate in your platform. Your rate is the sum of interbank rate and the spread which your platform charges for trade as profit.

The minimum transaction in the interbank market is in millions; hence the retail traders will not be able to afford the interbank rate. The interbank market participants trade currencies to manage their exchange rate and control interest rate risk.

Although, you can neither control nor trade at the interbank rate, important for traders to be aware of the interbank rate to avoid getting scammed by Forex brokers who main charge way above the interbank rate. The decentralized system of Forex allows for self-regulation, and hence the interbank rates hand the actual exchange rates available to traders are competitive and self-correcting. However, novice traders who are not aware of this might lose money by paying an excessive spread to brokers.

Economic Reports

Federal Reserve determines the interbank rate, and the average of all the interbank rates in all the lending transactions between the banks in the United States is called the Fed Funds Rate.

The interbank credit system is applicable for a short period, usually ranging from overnight to a maximum of a week. Hence, the interbank rate is also called the Fed Funds Rate.

The Federal Reserve announces the Fed Funds Rate based on a variety of factors like inflation, GDP growth, recession, monetary policy, etc. On the 1st of every month, the Fed Funds Rate is released.

How can the Interbank Rate be Used for Analysis?

The Fed Funds Rate drives money in and out of the economy. The Fed Funds Rate drives the interest rate on bank loans that is available to the public and businesses.

A higher Fed Funds Rate would mean that loans are now expensive than before. To take a loan now would mean paying more interest rate. Hence the general public is discouraged from taking loans indirectly. On the other hand, now it would be more profitable to save as they receive a higher interest rate on their deposits. Both these factors can change the general public sentiment on money spending. A high-interest rate environment withdraws money from the economy, thereby slowing down economic activity as people are less willing to spend.

Conversely, a low interbank rate encourages banks to give loans at a cheaper rate, and hence more businesses and people will be able to afford loans; this will ultimately lead to the injection of money into the system overall. When more money is available to a company or an individual, the natural tendency is to increase spending, businesses may use for expansion plans. All of this will stimulate economic growth and result in printing higher levels of GDP.

Impact on Currency

Traders and investors can use the Fed Funds Rate as part of their analysis. Since Central authorities use the fed funds rate to manage the economy and money supply, a historical correlation of interest rates with GDP growth rates can help us to determine the direction of the economy and the value of its currency.  It is a proportional indicator meaning higher interbank rates relate to currency appreciating phenomenon and vice versa.

Higher Interbank rates result in banks paying out higher interest rates for deposits, which can also attract foreign investors to purchase domestic currency to make a deposit and earn better returns on their investment.  Therefore, an increase in capital flowing into the economy and decreased local currency circulation in the rest of the world, thereby increasing its demand and worth.

A low interbank rate results in increased money flow into the system, which can be inflationary, thereby depreciating the purchasing power of its currency. Conversely, a higher interbank rate results in decreased money circulation in the system, which will be deflationary for the economy, and the reduced demand for goods and services will increase the purchasing power of the currency as people would tend to save than spend.

Even though the interbank rate changes do not immediately get reflected in the macroeconomic numbers like GDP and currency value, it is a slow indicator in that sense that it takes a particular time (weeks to few months) to show its effect in actuality. It is also important to know that the authorities use the interbank rate as a response or corrective measure to the current economic situation.

It is more of a gate check for inflation or deflation. It is more of an effect to a cause and not a cause in itself. It is a passive indicator in comparison to other indicators. It reflects more the past and current economic activities than upcoming financial situations. The initial temporary volatility in the currency after the news release is typical, but the long term effect reflects after a certain number of weeks only.

Sources of Interbank Rates

We can find out the Fed Funds Rate from the official website of the Federal Reserve System of the United States: Federal Reserve SystemSelected Interest Rates. We can also find a historical graphical representation of the effective fed fund rate changes in the St. Louis FRED website. For reference – Fed Fund Rate

Impact of Interbank Rate News Announcement   

The ultimate goal of any fundamental analysis is usually to determine if there will be a hike or a cut in the interest rates. As mentioned earlier, the interbank rate can also be referred to as the Federal funds rate. In the US, the Federal Reserve releases the interbank rate is determined by the FOMC which meets eight times in a year to set this rate

Below is a screengrab of the Federal Funds Rate from Forex Factory. On the right, we can see a legend that indicates the level of impact the Fundamental Indicator has on the corresponding currency.

The snapshot below shows the latest release of the Federal Funds Rate on July 29, 2020, at 1.00 PM ET. In the latest release, the FOMC recommended that the rate remains within the target of 0% and 0.25%. This range was within the analysts’ expectations.

It is worth noting that this year, the Federal Reserve has conducted two emergency rate cuts to combat the Coronavirus inflicted economic shocks. The first emergency rate cut was on March 3, 2020, at 10.00 AM ET, as shown by the screenshot below. The Federal funds rate was reduced to a target range of 1.00% to 1.25% from the previous range of 1.50% to 1.75%.

At another unscheduled emergency meeting on March 15, 2020, at 4.00 PM ET, the FOMC cut the federal funds rate by 1.00% to a target range of 0.00% to 0.25%.

Now, let’s see how this news release made an impact on the Forex price charts.

EUR/USD: Before Interbank Rate release on July 29, 2020, Just Before 1.00 PM ET

As shown on the above 15-minute chart of the EUR/USD, the pair was on a progressing uptrend between 7.45 AM and 12.45 PM ET. This uptrend as evidenced by the subsequent bullish candles forming above the 20-period Moving Average.

EUR/USD: After Interbank Rate release on July 29, 2020, 1.00 PM ET

After the FOMC release of the Federal funds rate, there is a renewed volatility in the market. The initial market reaction was negative for USD since the FOMC kept the rate unchanged. The rate release did not result in a shift in the trend since most traders anticipate it and price in their expectations in the market.

Let’s quickly see how this new release has impacted some of the other major Forex currency pairs.

GBP/USD: Before Interbank Rate release on July 29, 2020, Just Before 1.00 PM ET

GBP/USD: After Interbank Rate release on July 29, 2020, 1.00 PM ET

The GBP/USD pair shows similar trends, as observed with the EUR/USD. There is a steady uptrend hours before the interbank rate release. Market volatility is present after the news release but not significant enough to alter the prevailing trend.

USD/CAD: Before Interbank Rate release on July 29, 2020, Just Before 1.00 PM ET

USD/CAD: After Interbank Rate release on July 29, 2020, 1.00 PM ET

For the USD/CAD pair, a weak uptrend is observed, with candles forming just around the 20-period Moving Average. After the interbank rate release, the pair shows the same weakness for the USD as observed with the EUR/USD and the GBP/USD.

Bottom Line

The interbank rate is a high-impact fundamental indicator in the forex market. The FOMC Statement, however, dampens its impact since it is focused on the future. It is therefore advisable for traders to avoid opening significant positions before this news release. Furthermore, reading the FOMC statement will help to gauge whether the Fed is hawkish or dovish about the future.

Categories
Forex Daily Topic Forex Fundamental Analysis

Understanding The Impact of ‘Sales Tax Rate’ News Release On The Forex Market

Introduction

The sales tax rate usually comes as an afterthought to many. But for forex traders, understanding how the rarely-talked about sales tax rate could prove useful in the long-run. This article defines what sales tax rate is and further shows how they impact a country’s economic development and, by extension, its currency.

Understanding the Sales Tax Rate

A sales tax rate is the percentage of the total cost of the goods or services being sold. Sales tax is a consumption tax that is imposed by governments or local authorities on the sale of goods and services. The sales tax rate is calculated as a percentage then added on the cost. These taxes are usually collected at the retail point of sale on behalf of the imposing authority.

As structured, any business that is offering goods or services is liable for the payment of the sales tax in a given jurisdiction. Depending on the laws, this occurs is they have a physical location within the jurisdiction, an official employee, or an affiliate.

How Sales Tax Work?

The sales tax is collected at the end of the supply chain, only after resale to the consumer has occurred. Since consumers are the ones paying the tax, businesses receive a resale certificate to show that the sales tax is not yet due. The purpose of this certificate to the resellers is to ensure that no sales tax is paid on purchases of items to be resold.

The administration for the sales tax is triggered by whether or not a particular business has a presence within the tax jurisdiction. To be eligible to collect sales tax from its customers, the business has to apply for a sales tax permit from the relevant authorities.

Depending on the jurisdiction, the goods and services that are eligible for a sales tax vary. Groceries and medications are exempt from sales tax, as are goods and services purchased by nonprofit organizations.

Sales Tax Rate as an Economic Indicator

The sales tax rate can serve as a leading indicator for the shifts in demand and supply within the economy. Higher sales tax rates reduce the purchasing power and, with it, the aggregate demand and aggregate supply. The lowered demand and supply within the economy result in reduced economic activities, which could have an unintended ripple effect throughout the economy. With lowered demand and supply, unemployment as a result of job cuts in the affected sectors is another unintended consequence of a higher sales tax rate.

On the other hand, lowering sales tax increases the purchasing power of consumers, which in turn increases the aggregate demand and aggregate supply. These increases lead to job creation in various sectors and boost a flourishing economy. With a lower sales tax rate, the GDP growth within the country is guaranteed to bring about a strengthening currency as a result of improved economic conditions.

How the Sales Tax Rate Affects the Economy

In general, the sales tax rate has a negative correlation with the GDP. This negative relationship is shown in the scatterplot graph below of the US state sales tax rate against the GDP.

Source: Georgia Tech Library

At its core, sales tax is a revenue stream for the government. Thus, it can be said that a higher sales tax rate increases government revenues. The increase in government revenues increases government expenditure, hence higher GDP. In this scenario, a conflict arises. This conflicts because sales tax is an extra cost passed on to the consumer.

Thus, in general, the sales tax rate reduces the purchasing power of the consumers.  The reduced purchasing power leads to lesser sales taxes collected by the government, hence lower GDP. As a result of the diminished purchasing power, the consumers will spend less, resulting in a reduction in the aggregate demand within the economy. This reduction in demand leads to a reduction in the economic output hence lower GDP.

On the other hand, a lower sales tax rate returns some of the purchasing power to the consumers. They will spend more of their disposable income hence increasing the aggregate demand and supply within the economy. The increase in demand and supply increase the economic output. Furthermore, spending more implies that the government is bound to collect more revenue in the form of the applicable sales tax. An increase in revenue will increase the government expenditure within the economy, thus increasing the GDP.

How Sales Tax Rate Impacts Currency

The strength of any currency is usually seen as a direct reflection of its economic performance. As already discussed, the sales tax rate is considered to be leading indicators of aggregate demand and aggregate supply within an economy, and by extension, the unemployment levels. An increase in the sales tax rate will result in a drop in the aggregate demand and aggregate supply. This drop leads to increased unemployment levels and consequently reduced GDP. Long term currency traders can take their cue from an increased sales tax rate as an impending loss of strength in the country’s currency.

This loss in the currency’s strength can be brought by the expectations that, in the long run, central banks and the government will employ the use of expansionary fiscal and monetary policies to stimulate a stagnating economy. These policies harm the currency.

On the other hand, lowering the sales tax rate signifies that in the long run, the economy will be stimulated to grow. This growth is brought about by increased demand and supply. For forex traders, a country that is lowering the sales tax rate or entirely removing the sales tax can expect its currency to strengthen. The currency strength is because the traders can anticipate that in the long run, the government and the central banks may be forced to employ deflationary monetary and fiscal policies to avoid an overheating economy. These contractionary policies are good for the country’s currency.

Therefore, it can be expected that an increase in sales tax corresponds to a weakened currency against other pairs while a decrease in the sales tax rate corresponds to the strengthening of the currency.

How Sales Tax Rate News Release Affects The Forex Price Charts

The sales tax rate is not an indicator forex traders consider when placing their trades because it is a low-impact leading indicator. However, it is useful for forex traders to know just how much the impact of this low-level indicator is on the price charts.

In the US, the national government does now impose the sales tax. However, the various local governments set their own local sales tax rates. The detailed list of the US states and the sales tax rate applicable in each state can be found on the Sales Tax Institute website. The data on annual GDP growth can be accessed from the World Bank website. A forecast of the sales tax rate through to 2020 can be found on the Trading Economics website.

Below is a screengrab of the Sales Tax Institute showing the most recent changes sales tax rate in Washington.

In the latest release, Washington state lowered the sales tax rate applicable from 8.0 % to 6.5% in an attempt to alleviate the strain on consumers as a result of the Coronavirus pandemic.

Now, let’s see how this news release made an impact on the Forex price charts.

EUR/USD: Before Washington Sales tax rate release July 1, 2020

As can be seen in the chart above, we have plotted a 20-period Moving Average on a one-hour EUR/USD chart. From the chart, the pair is one a steady uptrend, represented by the candlesticks forming above the Moving Average. Before the news release at 1730GMT, the pair can be seen to be on a recovering uptrend. This uptrend can also be observed in the AUD/USD pair, as shown by the chart below.

AUD/USD: Before Washington Sales tax rate release July 1, 2020

For the NZ/USD, the pair is on a steady downtrend for hours preceding the news release. This trend is shown in the chart below.

NZD/USD: Before Washington Sales tax rate release July 1, 2020

For long-term forex traders, the pattern offers an excellent opportunity to go long on the EUR/USD and AUD/USD pairs while short on NZD/USD, since the prevailing market trends would favor them. Let us now see how the price action responded to the release of the sales tax rate in Washington State.

EUR/USD: After the sales tax rate release July 1, 2020

Lowering the sales tax rate should have a strengthening effect on the USD. However, as shown in the chart above, the news release of the sales tax rate had no impact on the EUR/USD since the uptrend continued with the same magnitude as before. The same trend can be observed on the AUD/USD and NZD/USD pairs since the previous trends were no reversed. This trend is shown in the charts below.

NZD/USD: After the sales tax rate release July 1, 2020

AUD/USD: After the sales tax rate release July 1, 2020

It is evident from the after-news charts that the release of the sales tax rate does not have any impact on the price action. Although it is has a significant impact on the GDP, it is a low-level economic indicator in the forex market. Cheers!

Categories
Forex Fundamental Analysis

GDP from Construction – Exploring The Fundamental Forex Driver

Introduction

Construction is the very first phase of an expected economic growth, which is more evident in the developing economies compared to the developed economies. New buildings, infrastructures, renovations are an indication of an expanding economy. GDP from construction is an important economic indicator to assess financial health and future economic expansion trends.

Construction

It is a part of the Secondary (Industry) Sector of an economy.  Construction refers to building and infrastructure works in all areas. The Construction Sector includes all physical making of infrastructures like bridges, transportation systems (roads, railways), dams, irrigation systems, naval ports, airports, pipelines, apartments, buildings, houses, commercial buildings, corporate structures, etc.

How can the GDP from Construction numbers be used for analysis?

The Construction Industry’s Economic Output is a significant economic indicator that is closely watched by both the private and public sectors. It is especially crucial for developing economies like China, as it is their main contributor to GDP. The GDP from Construction figures assist Central Authorities in policy reforms & economic-decisions.

Growth is essentially a process of invention of new things and discarding the old inefficient ones. Construction, in this sense, is nothing but that. It involves the erection of new buildings, renovations, expansions of the infrastructures that are currently existing. Increased GDP from Construction involves more people getting employed, better wages in the sector, and the extra demand for raw materials, etc. Hence we can say that the act of construction itself has a ripple effect on the economy.

Secondly, the GDP from the construction of corporate infrastructures or commercial structures implies that the constructed structures will be used for further economic activities. For example, a company doubling its company size is planning to double its staff and correspondingly the business that it generates. Hence, GDP from Construction figures improvement is indicative of an improvement in many other sectors.

All these improvements correlated with GDP overall also stimulate consumer confidence and encourages consumer spending, which further stimulates the economy and boosts growth. The Secondary Sector is composed of Industrial Output and Construction Output. For most countries, Industrial Output will be the dominant contributor to the GDP from the Secondary Sector.

We analyze GDP from Construction to understand the associated implications that more economic growth will be followed. For example, the construction of new power plants, or manufacturing industries, would show higher GDP from Construction this year. But the subsequent years, we will see higher GDP due to the newly added Industrial Outputs.

Hence, GDP from Construction figures can be used to assess future economic growth. Everything that is constructed is most likely to bring revenue through its usage in the future. Hence, GDP from Construction improvements can be a leading indicator for further improvements in GDP down the line.

The global Construction Industry makes up 13% of the World GDP, which is more than the Agriculture sector, which is about 7% of the World GDP. It means, overall, the global economy is improving at a rapid pace, with the Industrialization of many economies. It is forecasted to grow to 15% in 2020. China, India, and Japan are flourishing in this era with rapid Industrialization and achieving high GDP Growth Rates ranging from 5-20% in recent years.

GDP from construction can be used by investors to know which countries are transitioning from Developing Economies to Developed Economies. As GDP from Construction increases, it would be followed by GDP growth through increased Industrialization. Further down the line, the economies would transition to the services Sector as their main contributor to GDP.

Impact on Currency

The GDP from Construction is not a high impact indicator when compared to measures like GDP and GDP Growth Rates. GDP from construction does not portray the entire picture of the economy. However, it can be an essential tool for the Central Authorities to keep track of Construction Sector performance and its relative implications over the economy.

What construction is occurring can also serve as an indication of the economy type going to be built over the coming years. But, for the international currency markets, it does not serve as a useful indicator. It is a proportional and lagging indicator. Higher GDP from Construction is great for the economy and its corresponding currency, and vice-versa.

Sources of GDP from Construction

For the US, the corresponding reports are available here – GDP -BEA, GDP by Industry – BEA, and Construction – GDP. World Bank also maintains the Construction and Industrial Sector as a percentage of GDP on its official website, which can be found here – Industrial Sector (including construction) – World % of GDP. GDP from construction can also be found here – GDP Construction – World – Trading Economics.

GDP from Construction Announcement – Impact due to news release

The construction sector is one of the fastest-growing sectors today that has a great impact on the economy of any nation. Construction is one crucial sector that contributes to the economic growth of a country. The government and other regulatory authorities have always shown interest in this segment by investing significantly in various parts of the sector. Naturally, it will contribute to the GDP of a country and influence the reading released quarterly and monthly. When talking about the fundamental analysis of a currency or stock, investors make investment decisions based on the GDP and not on contributions made by individual sectors.

Now let’s analyze the impact of GDP on different pairs and witness the change in volatility due to the news release. For this purpose, we have gathered the latest GDP data of Japan, where the below image shows the fourth quarter’s GDP data released in March.

AUD/JPYBefore the announcement

We will first look at the AUD/JPY currency pair to observe the impact of GDP announcement on the Japanese Yen. In the above picture, we see the market has crashed lower due to some other news release, and currently, the price is at its lowest point. This means there is a great amount of selling pressure in the market, or sellers are dominant. In such a market situation, it is advised not to carry any position in the market before the news release.

AUD/JPY | After the announcement

After the news announcement, the price sharply moves higher and closes as a long bullish candle. This means traders sold Japanese Yen soon after the news release as it was below expectations and lower than the previous quarter. The volatility did increase to the upside for a while, but it did not sustain as the Japanese Yen was showing a lot of strength. One should trade after the market shows signs of trend continuation or reversal and not just based on the GDP data.

GBP/JPY | Before the announcement

GBP/JPY | After the announcement

The above images represent the GBP/JPY currency pair, where we see that the market has strongly moved lower as indicated by two big bearish candles before the news announcement. This means the Japanese Yen has gotten strong recently due to some other fundamental reason, and we cannot ascertain if this will continue or not. As volatility is very high, one should not take a position in the currency before the news release.

After the news announcement, volatility spikes to the upside, and the ‘news candle’ closes with a great amount of bullishness. Even though the price moves higher by a lot, it did not go above the moving average. The market has reacted adversely to the news announcement as the GDP was lower than last time and also below what was forecasted. If the price does cross moving average, this means the downtrend is still intact.

NZD/JPY | Before the announcement

NZD/JPY | After the announcement

The above pictures are that of the NZD/JPY currency pair, where we see a major crash in the market before the news announcement, which is visible in the first image. This pair also shows similar characteristics as in the above currency pairs, where the Japanese Yen has strengthened greatly. Ideally, we should be looking to sell the currency pair after a suitable price retracement.

After the news announcement, the market goes higher so much that it almost retraces the previous bearish candle, resulting in some weakness in the Japanese Yen. As the GDP data was weak, it brought disappointment in the market where traders sold the Japanese Yen and bought the base currency. Cheers!

Categories
Forex Fundamental Analysis

What Is ‘GDP from Mining’ and What Should You Know About This Economic Indicator?

Introduction

The tracking of GDP from Mining can give us many economic conclusions. GDP from Mining’s importance comes from the fact that the final output of Mining Production is the primary input for many industries. Therefore, it is the core part of the business activity related to many industries.

Fluctuations in the GDP from Mining data will eventually translate to all the industries that are dependent on Mined resources for their production process. This effect can be many-fold, and hence it is a vital economic indicator for investors, economists, and government authorities.

Mining Production

It refers to the entire process of searching for, extraction, beneficiation (purification), and processing of naturally occurring minerals from the Earth. Minerals that are typically mined can be Coal, metals like Copper, Iron, Zinc, or industrial minerals like limestone, potash, and other crushed rocks.

Coal is considered as one of the primary sources of energy across the world. Metals like Iron, Bauxite, and Copper have a wide range of usage in various industries. Limestone and other rocks are being used in cement industries, which contribute a lot to the construction and related industries.

How can the GDP from Mining numbers be used for analysis?

The developing economies are primarily achieving their growth through exports of essential commodities like Food, Minerals, etc. For example, Australia primarily exports Iron Ore and Coal, due to which the economic growth and currency value are tightly linked to the Mining of these natural resources. When the GDP from Mining starts to recede, currency devaluation and slowing economic growth are inevitable.

Developed economies are more resilient to changes in GDP from Mining, as their growth is tied to multiple sectors and are not heavily dependent on any individual sector. The availability of modern technology and skilled labor contribute to the GDP from Mining figures positively. Mining is a labor-intensive task. Hence, it is obvious that Mining lies at the heart of all industrial activities. A decrease in GDP from Mining can adversely affect all the dependent industries, and correspondingly the effects will pass onto unemployment, layoffs, wages, economic slowdown, etc.

Impact on Currency

The GDP from Mining is a low impact indicator, as the Mining Production reports are published monthly by the Federal Reserve in the United States that are leading indicators. It is a proportional and lagging indicator. Hence, changes in GDP from Mining would have already been priced into the market through monthly Mining Production reports.

Also, GDP from Mining numbers does not give us a complete picture of the economy. However, it can be an important tool for the Central Authorities to keep track of the performance of the Mining Sector and its implications for the economy. As established, the Mining Sector is a significant contributor, due to many industries dependent on its output.

Hence, changes in this sector widely affect the overall economic health, and all the dependent industries therein. In general, Higher GDP from Mining is good for the economy and its currency, and vice-versa.

Sources of GDP from Mining

For the US, the BEA reports are available here – GDP -BEAGDP by Industry – BEA. For the world data below, two are useful references – Mineral Rents  – World % of GDPGDP from Mining – Trading Economics. The monthly Mining Production statistics can be found on the official website of the Federal Reserve for the United States, which can be found here – G7 Industrial Production and Capacity Utilization

GDP from Mining Announcement – Impact due to news release

Mining is an extremely important economic activity in any country. The benefits of Mining have been widely promoted by the industry and institutions such as the World Bank. In several low and middle-income countries rich in non-fuel resources, Mining makes significant contributions to the national economic development as measured by the Mining Contribution Index (MCI-Wr).

The contribution of Mining and Minerals to GDP reached a maximum at the peak of the mining boom in 2011. Now, the figures indicate a decline in the Mining’s contribution but are still considerably higher than before. This is one of the reasons why it not a major determinant of economic growth. Thus, investors do not give importance to the mining data when it comes to investing in an economy.

In today’s lesson, we will try to examine the impact of GDP on various currency pairs and see the volatility change due to the news release. The below snapshot shows the previous, predicted, and actual GDP data of Switzerland released in the month of March. As this is the quarter on quarter GDP data, we can expect moderate to high volatility in the currency during the announcement.

GBP/CHF | Before the announcement

Let’s review the GBP/CHF currency pair to observe the impact of the news release. We see that the market has made a ‘descending triangle‘ candlestick pattern before the news announcement, which essentially is a trend continuation pattern. Depending on the impact of the news release, we will take a suitable position in the currency pair.

GBP/CHF | After the announcement:

After the news announcement, we see a sudden surge in the price indicating bullishness in the currency. The bullish ‘news candle’ suggests a negative reaction to the GDP data as it was on expected lines with no major increase or decrease. The market appears to have broken above the ‘descending triangle’ pattern, which is why we should need to wait for clear signs from the market with respect to the direction it is heading.  

CAD/CHF | Before the announcement

CAD/CHF | After the announcement

The above images represent the CAD/CHF currency pair, where we see that the market seems to be in a downward channel before the news announcement with the price at the bottom of the channel. Since the impact of GDP is high, there is a high chance that the news release could result in a break down if the data comes out to be weak for the economy. Therefore we need to wait for confirmation from the market before we can take a trade.

After the news release, the price moves higher and volatility increases on the upside. Since the GDP data was pretty much equal to the forecasted number, it did not result in bullishness in the currency, and it ultimately weakened the currency for a while. One who takes a ‘buy’ trade should take profits at the top of the channel and not wait for too long. 

AUD/CHF | Before the announcement

AUD/CHF | After the announcement

The above charts belong to the AUD/CHF currency pair, where we see that before the news announcement, the market is moving within a ‘range.’ This means the price is not moving in any single direction, which can make trading a bit challenging in such an environment. The news release can effectively move the market in any direction, which is why we need to wait for the announcement to happen in order to get clarity.

After the news release, the price moves lower, but this gets immediately bought, and the ‘news candle’ closes with a wick on the bottom. We witness buying pressure in the market soon after the news release. we to be cautious before taking a ‘long’ position since the price is at the top of the ‘range.’ All the best!

Categories
Forex Fundamental Analysis

Understanding ‘GDP from Services’ As A Macro Economic Indicator

Introduction

The different proportion of contribution to GDP from the three sectors (primary, secondary, tertiary) can tell us a lot about the economic development stage a country is at the moment. GDP from Services can help us gauge the transition of countries from developing to developed status efficiently. Hence, it is useful for Central Authorities and business people to understand the growth of the Service Sector.

What is GDP from Services? 

Service Sector

It refers to the production of intangible goods, services to be exact, that are not goods. Services are intangible, non-quantifiable, and formless. The result of service may or may not produce a physical good. For example, a construction service would give the client a building, whereas a lawnmowing service would not. It is the largest sector in the global economy and bears high significance in advanced economies.

How can the GDP from Services numbers be used for analysis?

The three different sectors of an economy are associated with different activities. The primary sector is mainly associated with dealing with agriculture, farming. It answers the basic needs. The secondary sector deals with industrialization, where livelihood, employment are answered through the production of goods.

The tertiary sector comes into picture when the basic needs like food, employment, security are taken care of. The tertiary sector consists mainly of services. Countries that have Service Sector as their main contributor to GDP are generally considered the more advanced economies. Indeed, the underdeveloped nations will primarily struggle for food and water, where Agriculture would be the primary need to feed the population.

The industrialization growth will be associated with low-cost wage labors working in factories for mass production to compete in the global market. Whereas, the service sector will be associated with high-cost services generally to provide “good-to-have” commodities.

For example, a vegetable is cheaper than an industrial product. Likewise, an industry product would be cheaper than a service sector like antivirus software. The cost of a 1kg of potato is about 2.50 US dollars, whereas 1kg of potato chips from a company like lays would cost 10 US dollars, whereas a Netflix subscription (service) would cost around 10-15 dollars a month.

It is a general trend where a software employee (service sector) gets paid more than a factory worker (industrial sector). A factory worker generally gets paid more than a farmer (agricultural sector). It is easily observed the wealth generated from the Service Sector far outpaces that of the Industrial Sector and essentially the Agricultural Sector.

In general, countries start to grow from underdeveloped to developing nations through industrialization. China and Japan would be good examples of industrialization-led growth. Once a country has firmly established its primary and secondary sectors, it can reach the status of a developed economy through the service sector only. India and China would be good examples of developing economies, increasing their service sector to generate higher wealth.

Hence, GDP from Service is essential to assess the status of a country transitioning from an emerging or developing economy status to a developed economy. As the contribution of Service Sector to GDP increases, it implies that more percentage of people are engaged in higher revenue-generating activities, and have crossed the stages of addressing basic survival needs.

It is also essential to understand that GDP from Service can increase only when the country is firmly established and stable in the primary and secondary sectors. Because when primary and secondary needs are not answered, people will first engage in meeting primary needs and not providing services.

The developed economies have substantial contributions to GDP from Service Sector. For example, the United States and the United Kingdom, have about 80% of their GDP contributed from the Service Sector. Developing economies like India and China have over 50% of their GDP from Service Sector. Underdeveloped nations like Uganda have only 24% of the Service Sector.

Impact on Currency

Leading indicators like Services PMI or NMI already forecast the GDP from Service, which would mean the increases from GDP from Services is already priced into the market. It is a proportional and lagging indicator.

Also, GDP from Services does not paint the full picture of the economy. Still, it can be an essential tool for the Central Authorities to keep track of Service Sector performance and its relative implications to the economy. As established, the Service Sector is a significant contributor to the GDP in developing and developed economies.

Hence, Service Sector GDP improvements bring more prosperity to a nation than an equivalent improvement in Agriculture or Industrial GDP. Service Sector GDP increase brings wealth to a nation and improves the standard of living of its people better than any other sector. A country can become a developed nation only when its Service Sector GDP increases to 70-80% of its GDP.

In general, Higher GDP from Services is good for the economy and its currency, and vice-versa.

Sources of GDP from Services

For the United States, the BEA reports are available here – GDP -BEAGDP by Industry – BEA. World Bank also maintains the Service Sector’s contribution as a percentage of GDP on its official website – Service Sector – World % of GDPGDP from Services – Trading Economics.

GDP from Services Announcement – Impact due to the news release

In the previous section of the article, we saw the contribution made by the service sector to the GDP, and it’s importance in the growth of the economy. But when it comes to fundamental analysis of a currency, the service sector’s contribution alone is not of great importance to investors as it represents only a small portion of the whole GDP.

Therefore, traders and investors look at a broader figure, which is essentially the GDP itself, and take a currency position based on the GDP of a country. So an increase or decrease in the contribution of ‘Services’ to GDP does not have any impact on the currency.

Now, let’s analyze the impact of GDP on different currency pairs and observe the change in volatility due to the news release. The below image shows the latest quarter on quarter GDP data of New Zealand released in March.

NZD/JPY - Before the announcement

We will start with the NZD/JPY currency pair to examine the impact of GDP on the New Zealand dollar. The above chart shows the state of the market before the news announcement, where we see that the price was in a downtrend with the least number of retracements. Depending on the impact of the news release, we will position ourselves accordingly in the market. However, we should be looking to take a ‘short’ trade since the major trend of the market is down.

NZD/JPY - After the announcement

After the news announcement, the market moves lower by a little where the price closes, forming a bearish ‘news candle.’ The GDP data in the fourth quarter was lower than last time, which drove the price below the moving average. However, it did not cause a major crash in the market where the volatility slightly increased to the downside soon after the news release. One should wait for a price retracement before a ‘short’ trade.

NZD/CAD - Before the announcement

NZD/CAD - After the announcement:

The above images represent the NZD/CAD currency pair where we see in the first image the price violently moved lower, and few minutes before the news release, it has reversed from the ‘lows.’ Until the reversal is confirmed, we should be looking to sell the currency pair since the down move is very strong. Since a major news event is due, one should wait for its release and take a position based on the change in volatility.

After the news announcement, volatility expands on the downside, and the ‘news candle’ closes, forming a trend continuation pattern. The market reacted negatively to the GDP data since there was a decrease in the GDP by 0.3% in the fourth quarter. This can be taken as an opportunity for joining the downtrend where one can take a ‘short’ position with a stop loss above the ‘news candle.’

EUR/NZD - Before the announcement

EUR/NZD - After the announcement

The above images are that of the EUR/NZD currency pair, where the market is in an uptrend, and the price is currently at its highest point. The chart signifies weakness in the New Zealand dollar before the news announcement with no signs of strength. Technically, we will be looking to buy the currency pair after a pullback to a key technical level.

After the news announcement, the price moves higher and volatility expands on the upside, thereby further weakening the New Zealand dollar since it is on the right-hand side of the pair. At this point, one should be cautious by not taking a ‘long’ position as it would imply chasing the market. Cheers!

Categories
Forex Fundamental Analysis

Exploring The ‘GDP From Utilities’ Forex Fundamental Indicator & Its Impact On The Market

Introduction

The Utility sector is the safe-haven sector for investors during economic slowdowns. The volatility of the Utility Sector is very low compared to any other market, be it currency, stocks, or any other financial market. Understanding the nuances involved with the GDP from the Utility Sector can help us identify money flow patterns during slowdowns and growth periods.

What is GDP from Utilities?

Utility Sector

As per the Bureau of Economic Analysis Department of Commerce: The Utility Sector comprises of industries that provide the following utilities: electricity, natural gas, water, and steam supply, sewage removal. Hence, the Utilities Sector deals with the most necessary commodities for the functioning of modern-day society. It deals with the most indispensable resources.

Functioning of societies without electric power is impossible.

One research even shows if electricity was not available for two weeks, 50% of survey members stated they could not survive. Water, Sewage systems, natural gas are all pillars for conducting our social life. Hence, these basic amenities produce profits; they are part of public service and hence are heavily regulated.

Within the sector itself, specific activities associated with utilities also vary. Electric power includes generation, transmission, and distribution. So some companies may only focus themselves on the sub-categories within the Utility sector.

Water supply includes treatment and distribution. Steam supply includes provision and distribution. Sewage removal consists of the collection, treatment, waste disposal through sewer systems, and sewage treatment facilities.

How can the GDP from Utility numbers be used for analysis?

Utilities generally give its investors stable and consistent dividends. It is relatively less volatile compared to other equity markets. During times of recession, the non-essential goods and services sectors take the worst hit while Utility Sector the least. As utilities are a necessity, their performance is consistent in the long run.

Typically investors buy utilities as long-term holdings for their dividend income and portfolio stability. During recessions, where the Central Authorities cut interest rates to stimulate the economy, investors flock to Utility stocks as a more secure alternative. When economic growth is restored, investors may find better alternatives than utility sectors.

Since this sector is heavily regulated, raising rates to increase revenue for the companies. The infrastructure required to run utility services are expensive and require high capital to maintain and upgrade over time. Hence, Utility providing companies have debts in their balance sheets, taken for maintenance and continuity. Hence, these industries are susceptible to interest rate fluctuations, as interests on their debts vary accordingly.

Consumers also have an impact on the Utility sector. Since many states let consumers choose their utility provider, the competition forces companies to keep competitive prices, that overall decreases their profits. Long-term power purchase agreements or water supply contracts can also incur dent on profits for companies when utility generation costs increase over time.

It is also crucial to know the growth of the Utility Sector is also a function of population and industrialization. Developing economies observe a rise in new factories, and industries would require higher utility services. The contrast in the sector’s economic size would be apparent while contrasting underdeveloped and developed economies.

Capitalization of utility services can lead to monopoly or resource control to private industries to their advantage for profits. Overall, we also must consider that utility services are to be accessible to all classes of people. Hence, regulation by the government is essential to keep it affordable for the lower sections of society.

The regulation also ensures that sustainable development is kept as a priority over profits. As the generation of electricity from fossil fuels like coal, and water supply from underground water, both of which are exhaustible. Therefore, revenue-wise, Utility Sector is not a significant contributor. In the United States, it contributed about 1.6% of value to GDP for the year 2018 and 2019.

Impact on Currency

The GDP from Utilities is a low impact indicator compared to the Broader measures like GDP Growth Rates and Real GDP. GDP from Utilities does not paint the full picture of the economy but tells us the direct contribution of the Utility Sector to the overall GDP. It is useful for long-term investors as a safe-haven during economic slowdowns.

Still, for the International Currency Markets, it does not serve as a useful indicator. It is a proportional and lagging indicator. Higher GDP from Utilities will impact the economy and its currency positively. Contrarily, low GDP from utilities will have a negative impact.

Sources of GDP from Utilities

GDP from Utilities Announcement – Impact due to news release

The Utility sector is an important part of any country as it consists of essential products that are consumed by people daily. Water, gas, electricity are some of the products of the Utility sector. Naturally, they play a vital role in economic and social development. Governments are responsible for ensuring access to service under an accountable regulatory framework.

Utilities are one of the key stakeholders in the economic development team. This industry is also important because all business requires these essential services to operate. Therefore, its contribution to the GDP is increasing year by year. When it comes to fundamental analysis of the currency, investors consider the nominal GDP as an indicator of the economy’s growth.

In today’s example, we will examine the impact of GDP on the value of a currency and see the change in volatility because of its news release. The below image shows the first-quarter GDP data of Hong Kong, where we see a big drop in the value from the previous quarter. Let us find out the reaction of the market to this data.

USD/HKD | Before the announcement

Let us first examine the USD/HKD currency pair to analyze the impact of GDP on the Hong Kong dollar. In the above price chart, it is clear that the market is moving within a ‘range’ where the overall trend is up. Before the news announcement, the price is at the bottom of the ‘range,’ which means there is a high chance of buyers getting active from this point. Aggressive traders can ‘long’ positions as the market is expecting weak GDP data for the first quarter.

USD/HKD | After the announcement

After the news announcement, the price rises by a few pips, and the market moves higher by little. As the GDP data was very bad, the rose higher, which resulted in the weakening of the currency. But this did not bring the kind of weakness and bearishness expected, as the GDP had dropped by more than 5%. This means the new release had the least impact on the currency pair.

EUR/HKD | Before the announcement

EUR/HKD | After the announcement

The above images represent the EUR/HKD currency pair, where we see that before the news announcement, the price has broken out of the small ‘range’ that was formed few hours before the news release. Until the breakout is confirmed, one should not consider buying the currency pair as the news announcement could lower the price and make this a false breakout.

After the news announcement, the market moves lower and volatility increases to the downside, resulting in the Hong Kong dollar’s strengthening. We witness an opposite reaction from the market in this currency pair, where the currency gains strength after the news release. This means the market has already priced in weak GDP data and reacted positively to the GDP data. We recommend using technical indicators to confirm the breakout and then take ‘long’ positions.

AUD/HKD | Before the announcement

AUD/HKD | After the announcement

The above images are that of AUD/HKD dollar, where we see that before the market is moving within a ‘range’ before the news announcement where the price is currently in the middle of the ‘range.’ Another thing we notice is that the overall trend of the market is up, which means we need to be cautious before taking a ‘sell’ trade in the currency pair.

After the news announcement, we see that the price marginally moves higher and closes with a slight amount of bullishness. This means the GDP did not impact the currency pair adversely and minimal effect on the pair. One could take a ‘short’ trade after price moves below the moving average.

Categories
Forex Fundamental Analysis

What Does ‘Exports by Category’ Data Indicate About A Nation’s Economy?

Introduction

Export is an essential component of a country’s balance of trade. International trade is the heart of the FOREX market that constitutes the fundamental moves in currency pairs. The imbalance in various country’s balance of trade is offset by equal and opposite volatility in currencies. Hence, understanding the macroeconomic dynamics of trade relations, compositions, and how they are tied to currency values can deepen our fundamental analysis.

What are Exports by Category?

Export: It is the sale of domestically produced goods or services to the foreign market. If goods manufactured within the nation are sold to customers outside the country’s borders, it is referred to as an export. On the other hand, imports are the purchase of foreign goods or services by a country. Generally, a country exports a particular commodity because it either efficiently manufactures or is more capable than the importing country.

A country like Canada, which has abundant oil reserves, can export to countries like China, which has a massive demand for its industrial economy. Similarly, China may export electronics to other countries like the United States, as they have a competitive edge in that domain. Exports bring domestic currency into the country in exchange for produced goods and services. Imports bring in goods and services into the country and send out the domestic currency. Hence, countries must maintain a “balance” in its international trade to keep currencies in an equilibrium.

How can the Exports by Category numbers be used for analysis?

If a country’s exports exceed its imports, it is said to have a trade surplus or a positive balance of trade. On the contrary, if a country’s imports exceed its exports, it is said to have a trade deficit or negative balance of trade. Imports signify consumption, and exports signify production. In a perfect world, the trade balance would be zero, meaning a country would produce equal to what it consumes. In reality, the balances are skewed and change from time to time.

When a country exports, it accumulates wealth. Many developing economies like China have increasingly depended on exports for their economic growth. By investing heavily in optimizing its industries and resources, many developing economies could export goods at a lower price to developed economies. A trade surplus (exports exceeding imports) is generally seen as beneficial to the economy. Prolonged periods of trade surplus, drains the international market of that country’s currency, thereby increasing its valuation against other currencies.

When a currency valuation appreciates imports become cheaper as more goods can be procured per unit of currency. In general, a trade surplus is seen as beneficial, but it may not always be the case. For instance, a country might increase its imports of construction materials to develop its cities and state infrastructure. During this time, it may have a trade deficit, but later once the work is done, its exports may improve beyond its previous highs and pay off for the years it maintained a deficit.

Countries export and import in millions and billions of dollars. When a country exports goods, it does so in large quantities, and the corresponding transaction would also be significant. Such transactions amongst countries with different currencies need to be exchanged. Such exchanges in the international FOREX market occurring for fundamental reasons sets off the equilibrium.

By the natural market forces through demand and supply, currencies will come to a new equilibrium. The movement in currency values through such fundamental moves is accompanied by speculative transactions from investors and traders worldwide. Approximately 20% of all FOREX transactions occur for pure fundamental reasons while remaining occurs for speculative purposes.

Understanding the portfolio of exports a country has can help us get a fundamental idea about the underlying goods and service exports that influence currency moves. For instance, Australia depends heavily on Iron Ore exports (approximately 20%). The Iron exported is sold mainly to China and Japan. If business activity in China reduced because of some reason, a decrease in demand would reduce exports for Australia, followed by a corresponding drop in AUD currency value.

The below image depicts how AUD value against USD follows Iron Ore prices. Hence, countries that depend on fewer exports experience higher volatility than countries with a more diverse portfolio of export and imports.

Impact on Currency

The ‘Exports by Category’ is not an economic indicator but is an essential statistic to understand the country’s trade relations. The composition of exports of a country does not vary significantly every month as exports and imports are based on trade agreements and business contracts that generally last years at a stretch. Exports by Category can be used to identify which goods and services are potential influencers for currency volatility. Hence, overall it is an essential requisite for fundamental analysis but not an economic indicator.

Economic Reports

For the United States, the Census Bureau tracks all the import and export statistics on its official website. The international trades categorized based on trade partners and Categories of goods and services are also available.

Sources of Exports by Category

The Census Bureau’s International Trade Data, the Export & Import by Trade Partner, Foreign Trade has all the necessary details. Consolidated reports of Exports by Category for most countries is available on Trading Economics.

Exports by Category News Release – Impact on the Currency Market

We know that Exports is an important fundamental driver of an economy, that can significantly impact a nation’s currency. Digging deep into Exports, we can widen the heading into Exports by Category and Exports by country. In other words, the result of the two is reflected in the Exports data.

Exports by Category, not being an economic indicator, barely has any impact on the currency of an economy. Moreover, the data is based on trade contracts, due to which the numbers do not change often. Nonetheless, let us combine the Export by Category and Exports data to study the volatility change in the currency market.

Exports Report – USD

Exports by Category – United States

According to the reports, the US’s exports dropped by USD 6.6 billion from the previous month, reading USD 144.5 billion in May 2020. Looking at the Exports by Category data, all the top five categories saw a decline in Exports.

EURUSD – Before the Announcement

Below is the price chart of EURUSD on the 4H timeframe. Before the release of the Exports by Category (Exports), we see that the market is consolidating, and there is no clear trend as such. However, the market is slightly leaving lower highs and lower lows, indicating EUR weakness and USD strength.

EURUSD – After the Announcement

On the day of the news release, it is seen that the price showed bullishness in the beginning. However, it got rejected by the sellers by the end of the day.

In the following days, we can see that the market broke out from the consolidation and began to trend north, implying USD weakness and EUR strength. There certainly would be several factors to it, but one of the accountable factors can be the disappointing numbers projected by the Exports.

USDJPY – Before the Announcement

Prior to the release, we can see clearly that the USDJPY market was crashing down. However, it saw bullishness in the last week of June.

USDJPY – After the Announcement

The USDJPY price saw feeble volatility on the day the news was released. In hindsight, the market dropped and continued the predominant downtrend. This indicates that the USDJPY has negatively affected post the Exports by Category numbers.

GBPUSD – Before the Announcement

Before the report on Exports by Category, the GBPUSD market was in an evident downtrend, as represented by the trendline.

GBPUSD – After the Announcement

A day before the numbers were reported, the price aggressively broke above the trendline, indicating a reversal.

When the news released, the price tried going higher but was pushed right back down by the sellers. However, subsequently, the market did change direction and began to trend north.

Thus, it can be concluded that the market did not have an immediate effect on the prices but did have an expected outcome in the short-term. Cheers!

Categories
Forex Fundamental Analysis

‘Imports by Country’ – How Crucial Is It To Know About This Fundamental Forex Driver?

Introduction

Currency values are critical for international trade and vice-versa. The exchange rates are directly influenced by changes in import and export composition, quantity, and prices. The volatility of a currency is directly associated with the country’s import and export relations with other countries. Understanding how international trade affects currencies in the forex market is paramount for fundamental analysis.

What are Imports by Country?

A country’s trade balance (net exports and imports) is critical for currency valuation. The Balance of Trade refers to the required balance to exist between the total monetary value of a nation’s exports and imports. It is key to currency valuation. When a country exports, domestic currency comes into the country in exchange for the sale of products. When a country imports, the currency goes out in exchange for purchasing goods outside the country. Hence, a balance of exports and imports to maintain a healthy economy.

It is often necessary to understand a nation’s export and import composition to grasp its ties with other countries. Countries’ dependency on goods and services from other nations induces leverage and power for the exporting countries. For example, the United States imports 20% of all its goods from China. If China were to cut-off all its exports to the United States, that would dramatically impact the United States economy and its currency. Hence, the categorization of imports based on country and goods gives us an idea of the underlying relationships between currencies.

United States Imports by Country 

Source: Trading Economics
How can the Imports by Country numbers be used for analysis?

Today’s global world is one that is tightly interconnected and has complex links amongst countries. Understanding trade composition helps us in identifying where to look for volatility. For instance, the United States only imports about 2% of its products from India. If, for some reason, the import prices changed from India in either direction or completely stopped, it would not impact the trade balance significantly.

Hence, categorization based on countries helps us understand the dependencies a particular country has. Heavy dependence on a limited set of countries, especially for primary resources like energy and food, is not suitable for the economy. During times of a natural disaster in the exporting country will affect the dependent countries also.

A country that solely depends on its trade relations with fewer countries is likely to see more volatility in currency valuation. The more diverse the portfolio of a country in terms of its international trade partners, the more robust the currency is. Hence, currencies like the AUD, CAD are more volatile currencies because their exports are heavily dependent on fewer markets, unlike the EUR and USD.

Imports and Exports by country and category of products are equally essential to understand a nation’s currency volatility. For instance, Australia’s heavy dependency on coal and iron ore exports to china and japan induces volatility in AUD currency in correlation with coal and iron ore prices.

The Imports by country is not an economic indicator but is a prerequisite for understanding macroeconomic analysis of currency pairs. Currency valuations are primarily affected by trade relations a country has. It is not frequent for a country to change its import composition by country often, but it has a significant impact on the currency when it does.

Imports form only one half of the equation. Overall to understand the macroeconomic dynamics, both exports and imports have to be taken into account. Also, currency value change has a direct effect on imports and exports. When the Domestic currency appreciates imports are cheaper and profit margin increases for importing companies but hurts exporters as they receive fewer dollars than before. When the domestic currency depreciates, imports get hurt while exporters benefit. Some countries competitively peg their currency lower during export and higher during import. This phenomenon is sometimes referred to as “currency wars.”

Changes in import and export composition as a result of trade agreements or tariffs imposed has a more direct impact on companies that constitute the import and export goods and services. Hence, stock prices of companies are more sensitive to import and export data.

Impact on Currency

Imports categorized based on countries is for segregation and analysis purposes only. It is not an economic indicator in itself. Still, it is essential to understand the existing trade partners of a country to know which currencies are being exchanged for what goods. Imports and Exports both make up the balance of trade, which helps to analyze currency valuation.

Hence, Imports categorized by country are although useful, changes in the composition are necessary for a macroeconomic picture but does not induce volatility in itself. Any change in composition would have already been announced in news reports that would be priced into the market. It is useful at the starting point for establishing currency analysis, but it is neither an economic indicator nor induces any volatility in currencies.

Economic Reports

For the United States, The Census Bureau tracks and consolidates import and export composition on its official website. It releases monthly data ranking countries with which it had exports and imports. It details all the goods and services that are exported or imported from the partner countries.

Sources of Imports by Country

Census Bureau’s Trade highlights reports are available here. We can find a consolidated listing of “Imports by country” of most countries on Trading Economics.

Imports by Country News Release – Impact on Price Charts

Imports by Country is an important piece in analyzing the “Trade” and “Imports” fundamental indicators. It alone is not an economic indicator but is one of the components that make up a fundamental indicator. Precisely, the balance of trade is the economic driver that references the data obtained from Imports and Exports. Extending further, the data from Imports is acquired from factors like Imports by Country and Imports by Category.

Imports by Country alone does not pump up the volatility of the market. Also, the report is released during the release of the Imports data.

Imports Report – Untied States

United States Imports by Country

The USA is the second-largest importer in the world. The imports of the USA are China, the European Union, Euro Area, Canada, Mexico. For the May data, the overall imports dropped from $200.9 billion to $199.1 billion. Imports from China and Canada increased the previous month, but the rest saw a slight decline.

NZDUSD – Before the Announcement

In the below chart of NZDUSD, on the 4H time frame, we can see that the market is in an uptrend. It made a high to 0.65815. Since then, the price has been retracing.

NZDUSD – After the Announcement

On the day of the report announcement, the NZD showed strength, while USD showed weakness. However, the volatility and volume remained average. In the following days, the bullishness remained intact. In fact, after consolidating for a while at the resistance, the price made a new high. Thus, we can conclude that the Imports by Country indirectly did affect the USD price.

AUDUSD – Before the Announcement

From the price chart of AUDUSD, we can see that the price action is similar to that of NZDUSD. Before the announcement of the news, the market was in a strong uptrend.  After making a high to 0.69845, the prices have been pulling back down.

AUDUSD – After the Announcement

During the announcement of the news, the market volatility was unchanged. However, in the subsequent sessions, the market reacted negatively on USD, and the price touched the recent high and even made a higher high. The market perhaps did react as expected to the new, but in the later weeks.

USDCHF – Before the Announcement

Before the announcement of the news, the market was in a pullback phase of a downtrend.

USDCHF – After the Announcement

On the announcement day, the volatility of the market was feeble. The price pushed to the downside but with low volume that is typically seen during the announcement of major news events.

In the following trading days, the predominant downtrend continued where the price made a new low from 0.93828. This down move could be due to several factors; however, there could be a slight effect on the Imports by Country report. Cheers!

Categories
Forex Fundamental Analysis

Does The ‘Import Prices’ News Announcements Impact The Forex Price Charts?

Introduction

Import and exports make up a country’s trade balance that primarily drives currency value and economic growth. The two-way feedback between imports and exchange rates is critical to understand and how the trade balance affects currency value. Understanding changes in import prices can help us deepen our understanding of macroeconomic fundamentals of every country.

What is Import Prices?

Import prices are the cost at which foreign goods are purchased in the international market. Import prices are measured through import price indexes. Import price indexes measure the change in prices paid for goods imported to the domestic country. The import price index figures for a reference period relate to the prices of goods that have come into the country during the period.

Import prices are essential to a country’s trade balance. A country’s trade balance is the difference between its total exports and imports and is an economy’s major composition.

How can the Import Prices numbers be used for analysis?

The international market always tends to stay in an equilibrium of currencies. When a country’s currency is flooded into the forex market, its relative value falls against other currencies. On the contrary, when a particular currency leaves the international market and goes into the country, the deficit increases its value against other currencies. Hence, excess reduces value, and scarcity increases value.

In this sense, when a country imports goods and services, it does so by paying out or sending out its domestic currency into the international market. When a country exports a good or service, it sends out the product in return for dollars coming into the country. Hence, overall the total worth of exports and imports should be balanced to maintain the currency’s current value.

When a country imports more than it exports, it faces a trade deficit, and as a result, its currency value falls relative to other currencies. When imports exceed exports, it means the country is a net consumer of goods and services in the global economy. It is negatively contributing to global economic growth. When a country exports more than it imports, it faces a trade surplus, and as a result, its currency rises relative to others. When a country is a net exporter or provider, it is contributing positively to global economic growth.

In general, countries prefer to maintain a trade surplus, but may intentionally maintain a trade deficit by importing, to increase their exports and overall economic growth in the future. Countries in today’s modern world have increasingly become dependent on international trade for both imports and exports.

Countries that do not have a competitive edge in specific sectors prefer to import goods and services from other corners of the world where they may be more efficiently produced and are cheaper. Businesses rely on importing raw materials or intermediate goods for producing finished goods and services, or even consumption.

A strong currency will favor imports as more goods can be procured for a unit of currency. Prolonged deficits (imports exceeding exports) devaluate the currency, which is not suitable for the economy. Hence, countries’ central authorities closely monitor the import and export price changes to draw out policies or reforms if needed to ensure a trade balance. In a crude sense, a country’s exports are its income, and imports are its expense. Increasing imports and declining exports ultimately drive a country into a debt trap.

Import prices are useful for negotiating future trade contracts, tracing global price trends for certain goods and services, predicting future prices, and domestic inflation. It is also used to deflate trade statistics published by the government. Import price also helps the central authorities to decide which and how much of a fiscal or monetary lever is to be used to manage exchange rates.

Import prices are especially valued in the bond markets because of its direct impact. As importing prices become too high, it deteriorates the importing company’s profit margin, ultimately decreasing corresponding bond prices. Hence, bond prices decrease when import prices substantially increase. On the other hand, when import prices decrease, the profit margin for companies increases, and correspondingly the bond prices also rise, seeing the increased margin.

Impact on Currency

The currency markets are always focused on macroeconomic indicators and do not focus on indicators that focus on specific parts of the economy. However, import prices affect trade balance, bond markets, and even stock markets. The overall net import and export figures and trade balance reports constitute more precedence than the individual import prices report for the currency markets. Hence, it is a low-impact indicator in the currency markets and can be overlooked for other macroeconomic indicators.

On an absolute basis, significant increases in import prices for prolonged periods, deteriorate currency, and economic growth. In practice, multiple forces act for and against such figures, and import prices alone are insufficient to determine currency’s future direction.

Economic Reports

In the United States, the Bureau of Labor Statistics publishes monthly import prices as part of its “Import/Export Indexes (MXP).” It is released every month around the second week for the previous month on its official website.

Sources of Import Prices

The Bureau of Labor Statistics Import/Export Indexes (MXP) is primarily used. It is also categorized into subtables by End-Use, NAICS (North American Industry Classification System), Harmonized System, and Origin. Consolidated Import prices for most countries is available on Trading Economics. The World Bank also maintains international trade data in terms of import value and export value indexes.

Import Prices – Effect on Price Charts

Import Prices is an important element in understanding the trade balance of an economy. However, it alone cannot affect the economic condition of a nation. It is combined with the Export Prices, and the difference between the two is what makes it vital.

Coming to the currency market, the Import Prices report mildly affects the volatility of a currency. If immediate volatility on the time of release is not observed, it could be reflected in the short term.

Import Prices Report

The below report represents the Import Prices of the US for the month of June. According to the data released on July 15, the Import Prices increased by 1.4% month-on-month, after a decline of 0.8% the previous month. Also, it beat the forecasted value of positive 1.0%.

Historical Impact Prices Report

Impact Level

The US Import Prices released by the US Department of Labor has a moderate impact on the currency market (USD).

USDJPY – Before the Announcement

Below is the price chart of USDJPY on the 15mins time frame. Before the report was released, the market was in a strong downtrend representing USD weakness.

USDJPY – Before the Announcement

When the news was released during the open if the New York session, the trading volume considerably increased, and the price continued to move south. However, later in the session, the prices reversed in favor of USD. This indicates that the market did have an impact on the report.

USDCHF – Before the Announcement

Before the news announcement, the volatility of the market was feeble. The price which was inclined down initially, but had begun to move switch direction during the release of the news.

USDCHF – After the Announcement

When the Import Prices news report was announced, the volatility was moderate in the beginning but reduced later in the day. The price which was showing bullishness prior to the news continued with the same sentiment. Thus, traders can follow their strategy without any hesitation as the news barely induce high volatility.

AUDUSD – Before the Announcement

Before the announcement of the report, the market was in an evident uptrend making higher highs.

AUDUSD – After the Announcement

Right when the report was announced and the North American session began, the market reversed direction from an uptrend to a downtrend. However, the price failed to make a higher high. The volatility increased significantly, which can be seen from the volume indicator.

The Import Prices is an essential indicator in as it is a factor of calculation for fundamental drivers. As we saw, even though this indicator did not really bring in volatility in the market, it indirectly does significantly affect the currency prices when combined with other drivers. Cheers!

Categories
Forex Fundamental Analysis

Imports by Category – Comprehending This Forex Fundamental Driver!

Introduction

Understanding the portfolio of an economy’s exports and imports can help us track down the fundamental moves in currencies. Tracking imports and exports can help speculators ride the fundamental wave of currency value change in their favor. Imports and Exports are critical components of a nation’s trade balance. The deeper our understanding of these dynamics, the better will be our understanding of macroeconomic trends.

What are Imports by Category?

Imports: They are the goods or services purchased that were produced outside the domestic country. Imports are purchased goods or services from foreign markets. Imports are required for many reasons and inherently constitute a nation’s trade balance. In importing, foreign goods or services come into the country while domestic currency goes out into the international market. A country in general imports when it is more efficiently produced or is cheaper in other countries. It may also import when the nation is unable to produce or meet the required demand.

A country will have numerous corporations that would have requirements for foreign goods or services, and hence the country’s valuation of imports would be in millions and billions. Hence, while importing millions and billions of domestic currency goes into foreign markets where currencies are exchanged for various reasons. Suppose a country wants to import goods or services from another country. It generally pays it in the exporting country’s currency. Hence, during export, currency comes into the country, and products go out, and during imports, the currency goes out, and products come in.

How can the Imports by Category numbers be used for analysis?

When a country’s imports exceed its exports, it is said to have a negative trade balance or trade deficit. Based on the geographical location, technological and business setups, different nations will have a competitive edge in different sectors. For instance, countries like Venezuela, Canada, or Middle Eastern countries are naturally sitting on abundant oil reserves. Hence, it will export oil to countries that do not have such reserves.

Companies may often require raw materials that are more cheaply available from other countries. For instance, companies in the United States might import electronic goods from China, which is cheaper. Hence, such companies may put up bulk order imports and trade takes place. Hence, what a country needs it may import and what it produces it can export.

The international market is decentralized and operates through free-market forces that keep economies in natural equilibrium. Currency exchanges can take place for genuine business transactions or speculative purposes also. When exchanges occur for purely business reasons, we call them fundamental moves in the currency pairs. These fundamental moves give currency their volatility along with speculation from investors.

Understanding a country’s Imports by the Category of products can help us track the fundamental moves. When significant transactions related to import or export takes place, it induces volatility into the currencies. During a considerable import, the international market is flooded with importing the country’s currency, and due to supply exceeding demand, the currency value falls.

On the other hand, when a country exports a massive volume of goods, the corresponding transaction would withdraw a large sum of that country’s currency out of the international market. When demand exceeds the supply, the currency value appreciates. Scarcity appreciates value and oversupply reduces value. Hence, a country must maintain a “balance” in its trades, i.e., the monetary value of all its imports and exports should ideally cancel off. In reality, it is not so, and this imbalance in different country’s trade balance gives currencies the volatility which traders are always looking to capture.

Understanding the economy’s portfolio of imports can help policymakers also in identifying exceeding dependencies in other countries. Too much reliance on foreign countries for goods or services is not suitable for the economy. The more a country is dependent on other countries, especially for basic needs like energy and food, the less it has control over its economic growth and currency valuation.

Countries that depend on fewer categories of imports and exports have more concentrated risk in terms of currency volatility. Countries like AUD and NZD show more volatility in general than currencies like USD and EUR because of the diverse portfolio of exports and imports of the latter currencies.

Impact on Currency

Imports by Category of goods or services is not an economic indicator, but it is necessary to facilitate an understanding of international trade balance amongst currencies. It directly does not impact any currency volatility but is a requisite to base trade analysis amongst currency pairs. Changes in imports by Category does not frequently change as most trade agreements are made for multiple years on end. Any changes in trade composition in terms of Category will be priced through leading economic indicators and news releases.

Economic Reports

In the United States, the Census Bureau tracks the import and export data categorized by trade partners and products. The lists are ranked based on trade volume, deficits, and surpluses, etc. Monthly and year-to-date data are two types listed for all its trade partners.

Sources of Imports by Category

We can find the Census Bureau data on its Top Trading Partners. We can find the percentage of statistics consolidated for most countries for imports by Category on Trading Economics.

Imports by Category News Release – Effect on the Price Charts

Both Exports and Imports are fundamental indicators that vaguely impact the forex market. The Imports report is calculated by considering the Imports by Category and Imports by Country. Reliable results are obtained when they are combined. Thus, to analyze the impact of Imports by Category, we shall be taking into account the Imports number as well.

Level of Impact

The Imports by Category report released by the Australian Bureau of Statistic has minimum to negligible impact on the value of the Australian dollar.

Imports data – AUD

The Imports report published on July 02, 2020, stood negative 6%, beating the previous number -10%. Even though the numbers are not up to the mark, they have recovered to a great extent from the previous month’s readings.

From the below chart ranging from 2016 to 2020, the Australian Imports hit a new low to -10% for the May report. However, it shot up 4% higher the following month.

Imports – Australia

Below is the Imports by Category for the top five categories in imports. We can see that four out of five categories saw a drop from the previous report.

AUDUSD – Before the Announcement

Focusing on the left side of the chart, we can see that the market is in an uptrend and is currently consolidating.

AUDUSD – After the Announcement

On the day of the report release, the impact in the volatility of the currency was insignificant. However, later through the month, the Australian dollar got stronger and continued its uptrend. This indicates that, despite the disappointing number overall, the AUD saw strength as the number beat the previous month report by a significant margin.

AUDCAD – Before the Announcement

Before the news released, the market was in a range for an entire month.

AUDCAD – After the Announcement

On the day of the announcement, the market tried to inch above the top of the range but failed. However, in the subsequent trading sessions, volatility picked up, and the price made a higher high. Hence, we can, to an extent, conclude that the AUD had a positive impact on the Imports by Category numbers.

AUDJPY – Before the Announcement

In the below chart of AUD/JPY on the 4H time frame, we can see that the market is in a strong uptrend. It made a high to around 77.000. The prices were in a pullback phase, the whole month of June.

AUDJPY – After the Announcement

On the day of the report announcement, the market barely had any impact in terms of volatility. That said, in the following weeks, the price rallied up to the previous high of 77.000, indicating AUD strength.

Therefore, we can conclude that the Australian dollar had a feeble effect during the news release day but did have a positive impact on the report in the subsequent trading sessions. Cheers!

Categories
Forex Fundamental Analysis

What Should You Know About ‘Export Prices’ & Its Relative Impact On The Forex Market

Introduction

Exports and Imports are vital components of a country’s Trade Balance that directly affects currency value. Careful balancing of export and import prices is necessary for maintaining currency value. Understanding how export prices affect the overall trades, domestic businesses, and ultimately currency value can help us build a more accurate fundamental analysis.

What are Export Prices?

Export prices are the selling price on the products and services to be sold in the international market. It is the price of goods and services that are domestically produced and sold to foreign countries. Hence, it is the prices fixed on goods and services which is intended for sale by the exporter in the overseas market.

In the United States, the Export prices are measured as part of the “U.S. Import and Export Price Index.” Export price and Import price both together form a sort of “net” price that helps us understand whether we are exporting more and gaining, or importing more and losing.

How can the Export Prices numbers be used for analysis?

In today’s modern world, many nations have opened themselves up for international trade. It is quite common for foreign brands to compete with local brands in many countries. Globalization has led to rapid growth for the global economy. Exports and Imports are two essential elements of a country’s trade balance. Imbalance in trade creates a deficit or surplus that directly affects the country’s currency.

Increased exports and reduced imports mean more goods and services go out of the country, and currency comes in. When currency comes in, the foreign demand for currency increases, and thereby currency value goes up. If exports bring more currency into the country than imports send out, the country experiences a trade surplus, which is good for the economy and currency.

Increased import over export indicates more dollars are spent and go out in importing products and services than dollars coming in for the goods sent out. When the international market is flooded with a currency due to increased imports, its currency value falls against other currencies. In such a situation, a country is said to have a trade deficit. Export prices can rise for the following reasons:

Increased production cost

As the manufacturing or cost of the raw materials increases, it eats away the company’s profit margin. To avoid this, companies may translate these increased production costs to the end consumer by pricing their goods higher.

As companies not only have to compete with fellow local businesses, they need to compete with companies from other countries. An increase in prices through production cost inflation may put the country at a disadvantage and lose sales in the international market. Hence, even though export prices increased, the sales volume will decrease negating the effect. It generally does not work in favor of the country and its currency.

Increased demand

As demand for a particular good or service increases, the company may raise its prices to compensate for the limited supply. Price increase as a result of increased demand is always beneficial for the company, country, and currency. Export and import prices are used for many purposes, and some of which are:

  • Based on changes in export and import prices, we can predict future prices and domestic inflation.
  • We can evaluate currency values and exchange rates based on overall exports and imports for a given pair of countries.
  • It can be used as a reference for setting up other trade agreements and price levels.
  • It can also be used for identifying global price trends for any specific product or service.
  • They can be used to deflate or devaluate trade statistics.

Export prices are specifically more critical for developing economies, as through exports, they primarily achieve their growth. Export-led growth has benefitted developing economies to create wealth and developed countries to get goods at much lower prices in the international market.

Change in currency value also affects export and import prices. Weak domestic currency brings in more currency during exports while making it harder to import as they become relatively more expensive. A strong currency hurts exporters while it favors imports as more goods can be purchased per unit of currency.

Hence, we observe countries undergo “trade wars.” Trade war means countries intentionally devalue their currencies during exports and peg it higher during imports in their favor. Such tactics are regularly used by China, and seeing these other countries also do the same. Competitively devaluating or valuating domestic currency higher to make trades favorable to their countries is referred to as a Trade war. Hence, any increase in export price should solely happen through an increase in demand, as that is the only way the economy benefits in the long run.

Impact on Currency

Export prices alone do not provide us with a complete picture of a country’s trade balance. The overall export minus import price is what determines the overall currency value. Hence, for currency markets, the export prices alone do not provide the necessary insight. Therefore, it is a low impact indicator. But on an absolute basis, an increase in export prices is good for the economy and the currency and vice-versa.

Economic Reports

In the United States, the Bureau of Labor Statistics (BLS) publishes monthly export prices as part of its “Import/Export Price Indexes” at 8:30 AM around the middle of the month. It is reported in percentage changes compared to the previous month and is also reported by categorizing based on end-use.

Sources of Export Prices

We can find the Export Price as part of the Import/Export Price Indexes and end-use versions. We can find consolidated statistics on export prices for most countries on Trading Economics.

Export Prices – Impact Due To News Release

Export prices is an important fundamental indicator in analyzing other economic drivers. When it is combined with the Import Prices, the trade balance is obtained, which plays a vital role in the foreign exchange market. The trade balance is also a fundamental indicator that heavily impacts the currency of a country. Thus, traders always keep an eye on the release of the trade balance report.

Coming to Export Prices, it alone does not induce much volatility relative to that of the trade balance. However, since the trade balance is dependent on the Export Prices and Import Prices, traders do keep a watch on these data releases to get insights on the overall output of the trade balance.

Export Prices Report

Before is the latest report on Export Prices, which came out to be 1.4%. The Export Prices were expected to rise by 0.8%, but the actual number beat the forecast.

USDCAD – Before the Announcement

Before the announcement of the Export Prices data for the month of June, we can see that the market was in a fresh downtrend making news lows every step of the way.

USDCAD – After the Announcement

The news was published during the open of the New York session. It is seen that, right on the announcement of the data, the USD prices collapsed against the Canadian dollar. With the release of the report and the open of the New New York market, the market volatility was boosted.

In this case, we see that the market followed the direction of the overall trend. Thus, traders can take advantage of the volatility due to news and market open and trade based on their analysis. However, they should ensure that the report is within the normal range and not an outlier. During abnormal values, a trader may better off stay away from the related currency, and its pairs.

NZDUSD – Before the Announcement

A day before the release of the Export Prices report, the market was in an uptrend, signifying NZD strength and USD weakness.

NZDUSD – After the Announcement

Once the news was out, the volatility of the market remained the same, despite the open of the US market. This clearly implies that NZDUSD was stayed non-impacted with the Export Prices report. However, in the subsequent day, the market reversed its direction from an uptrend to a downtrend.

GBPUSD – Before the Announcement

On the day of the announcement of the data, the market was in a strong bullish movement. And the time of release, the price was trading right at the supply area.

GBPUSD – After the Announcement

Once the board released the report, the price aggressively turned around and shot south. The reason for the down move can be accounted for the supply region, while the increased volatility could be due to the news and the open of the North American markets. Cheers!

Categories
Forex Fundamental Analysis

Everything About ‘Harmonized Consumer Prices’ Macro Economic Indicator

Introduction

Harmonized Index of Consumer Prices (HICP) is the go-to indicator for monitoring inflation statistics in the European Union (EU). Inflation reports are vital for the currency markets, as inflation directly erodes currency value. Hence, domestically and internationally, inflation statistics play equally critical roles in currency valuations. Understanding HICP is mandatory for building fundamental analysis related to the European Union countries.

What are Harmonized Consumer Prices?

Harmonized Index of Consumer Prices (HICP)

It is a list of the final price paid by European end-consumer for a basket of commonly used goods and services. Like the United States has the Consumer Price Index (CPI) as a means of regularly measuring inflation levels month over month, the European Union (EU) has HICP. The average change in the price of the selected goods and services gives us a clear idea about the inflation rates in the EU.

The HICP differs from United States CPI because it takes inflation data from each member nation of the European Central Bank (ECB). It is also a weighted index, meaning that goods are given a specific weightage based on demand, or how essential and frequently used by the consumers. The consumer goods basket is derived from data of both rural and urban areas of each member nation.

How can the Harmonized CP numbers be used for analysis?

The Harmonized Index of Consumer Prices (HICP) is measured and given by each of the European Union (EU) member states. European Union is a political and economic union of 27 states located primarily in Europe. It is given out to measure inflation and help the European Central Bank (ECB) to form monetary policies accordingly if required. Every member country’s HICP measures the shifts over time in the prices of the basket of selected goods and services purchased, used, or paid for by households of that nation.

The “commonly used goods and services” include coffee, meat, tobacco, fruits, household appliances, electricity, clothing, pharmaceuticals, cars, and other commonly used products. It is also worth mentioning that the index excludes owner-occupied housing costs.

The HICP is also used for the Monetary Union Index of Consumer Prices (MUICP), an aggregate measure of consumer inflation for all countries of the eurozone. The eurozone represents all countries of the European Union that have incorporated the Eurodollar as their national currency. The primary aim of HICP is to maintain price stability. It defines the stable inflation rate in the euro area as below two percent annually.

Amongst HICP and MUICP, the HICP is a broader measure of inflation, but for trading, traders would prefer MUICP as it tells about the inflation concerning the European Dollar (EUR). The MUICP is calculated by selecting HICP from the eurozone countries only. All the member nations use the same methodology to calculate their respective HICP, enabling them to compare with each other and easily calculate the MUICP directly.

The selected goods and services are updated annually to account for the changes in consumer spending patterns. Each country’s weightage represents its consumption expenditure share in the entire euro area.

Inflation is the fuel that drives the economy. It is a double-edged sword, too much inflation erodes currency value, and citizens become poorer, and too low causes deflation, which slows the economy making money “costly.” A low and steady inflation rate is the only solution to keep the economy growing for capitalist economies.

When inflation rates fall below the long-term averages, the central authorities may use fiscal (government actions, ex: tax cuts) or monetary levers (central bank actions, ex: lower interest rates) to counter deflation and induce inflation. When the inflation rate is above the long-term rate, it is called hyperinflation, and central authorities may intervene and tighten the belt to deflate the economy. They can raise interest rates, increase taxes to deflate the economy to normal levels.

Inflation statistics like the HICP are coincident indicators as they tell us about the current price inflation. They are affected by leading indicators and policymaker’s responses. The HICP is closely watched by economists, central authorities, consumers, and even traders. In the currency markets, relative inflation can help us predict which currency’s value is eroding relatively faster. Inflation also affects the GDP of the country, which is a primary macroeconomic indicator for currency trading.

Impact on Currency

Currency markets emphasize on leading indicators over coincident indicators to always stay a step ahead of market trends. Coincident indicators confirm the trends rather than predict. Due to this, the impact of the HICP indicator in the market is low. For currency traders, MUICP and currency-specific aggregates are more useful than aggregate metrics like HICP to check inflation. Hence, overall, HICP is a low impact coincident indicator that can be overlooked for more country-specific inflation statistics.

Economic Reports

HICP data is published by Eurostat every month. It is the statistical office of the European Union. A brief estimate for the euro is published at the end of the month, followed by the detailed version containing indices of all member states approximately two weeks later. On the Eurostat page, we can find monthly, annual data, a detailed listing of country weights, item weights, prices, etc.

Sources of Harmonized Consumer Prices

We can know more about HICP in detail from the European Central Bank’s official website and the official data on the Eurostat page. We can find the consolidated monthly reports of HICP on Trading Economics.

Harmonized Consumer Prices – Effect on Price Charts

The Harmonized Index of Consumer Prices (HICP) is a coincident indicator. In essence, this indicator does not predict the future price action of currency but is coincident with it. Typically, metrics such as MUICP and other price reports induce volatility in the market. But HICP alone does not increase the volatility of the market.

Impact

The data is exclusive to the European Union and is released by the Federal Statistical Office. The impact of HICP on the currency market is negligible.

Harmonized Consumer Prices Report June

Below is the report of HICP for the month of June released in July. As per the data, the HICP increased from 108.47 to 108.58.

EURUSD – Before the Announcement

Before the announcement of the report, the market was in an uptrend making higher highs and higher lows.

EURUSD – After the Announcement

On the day of the announcement of the report, the prices retraced in the first half of the day and shot north aggressively and made a new higher high during the New York session. On the volumes side, there was feeble volatility in the Asian and European sessions, while it increased with the open of the US markets. That said, the increase in the volatility was not abnormal, which is typically seen during the release of major economic reports.

EURAUD – Before the Announcement

Before the report was released, the market was moving in an inclined channel showing EUR strength.

EURAUD – After the Announcement

After the report came out, the price break through the channeling market and began to trend. By the end of the day, the EURAUD price was up 0.65% from the previous day. This bullishness could perhaps be from the incident HICP report. However, the subsequent day, the market lost all its gains.

EURNZD – Before the Announcement

Prior to the announcement of the report, the market which was consolidating had begun to show mild bullishness.

EURNZD – After the Announcement

On the day the news was announced, the price continued to rise higher and higher for the entire day. In fact, EURNZD outperformed both EURUSD and EURAUD. There would be several factors that could’ve inflated the price, but a moderate effect could be through the positive HICP news. On the volatility side, there was no aggressive rise in volatility. However, the volume significantly increased during the North American session.

Thus, traders can analyze the technical factors of the market and open positions without any hesitation from the HICP report. That said, conservative traders may wait for the reports to be released, and then enter if the report is in favor of their speculated direction.

Categories
Forex Fundamental Analysis

Minimum Wages – Understanding This Macro Economic Indicator

Introduction

Minimum Wages are essential for protecting citizens and ensuring that everyone gets a fair share of the fruits of the progress made. Minimum Wages act as the foundation for everyone at the entry-level to compete equally to the top. Minimum Wages are used by a majority of the countries across the world. Understanding Minimum Wages and its importance can help us better understand improvement in people’s living standards over time alongside the country’s economic growth.

What are Minimum Wages?

The International Labor Organization (ILO) defines Minimum Wages as “the minimum amount of remuneration that an employer is required to pay wage earners for the work performed during a given period, which cannot be reduced by collective agreement or an individual contract.” It is the least money paid out for work as a wage over a given period. It cannot be lowered by mutual understanding nor through a legal agreement. Hence, it is the lowest remuneration that an employer can give their employees.

The Minimum Wage can be set by a statute, wage board or council, competent authority decision, industrial or labor courts, tribunals, or law enforced collective arguments. Most countries had introduced the Minimum Wages by the end of the twentieth century.

Minimum Wages initially started off to stop exploiting workers in sweatshops (places with unacceptable working conditions, potentially illegal and dangerous). Owners at such places generally had dominion over that workplace and people working. But later on, it became a means to help uplift the lower-income families. Minimum Wages were first incorporated by New Zealand in 1894, followed by many other countries gradually.

How can the Minimum Wage numbers be used for analysis?

Minimum Wages acted as the price floor beneath which a worker may not sell their labor. The purpose of Minimum Wages is to set a barrier to exploiting the labor force through unduly low wages for their work. It will ensure a just and equitable way of distributing the returns on the progress made collectively. It will also ensure people receive the money required to sustain a living and act as legal protection for people who need it.

Minimum Wages are also used as part of a policy to eradicate poverty. It also helps curb inequality amongst employees based on age, sex, or race for the work of equal value done. Minimum Wages also acts as a floor for wage negotiations and collective agreements. Any negotiation always has a legal and reasonable base, only above which all negotiations can take place and shall not fall below it.

The effect of increasing the Minimum Wage had a negligible impact on the employment rate in general. Still, cost-cutting in other sectors and the profitability of the company become vulnerable. Minimum Wage level adjustments are deemed to be made from time to time, meaning whenever the board feels it is needed based on the cost-of-living indices. Most countries adjust their Minimum Wages yearly, some do on a six-month basis, and some do it on a two-year basis.

Inflation and Cost-of-Living fluctuations erode the purchasing and protection power of the Minimum Wage. At such times, unscheduled interventions become essential to keep protecting the labor force.

Fixing Minimum Wage too low defeats the very purpose for which they were set and too high creates a significant impact on employment, worsening the situation. Careful and objective decisions have to be made to set and adjust Minimum Wages periodically as per economic conditions.

Setting too low could constrain consumer spending, which is terrible for the economy as it fuels the GDP. Setting too high could trigger inflation on subsequent levels, hurting exports, decreasing profit margins, and reducing employment.

The ILO deems the following three economic factors to take into account to set Minimum Wages: economic development requirements, productivity levels, and desirability of achieving and maintaining high levels of employment. All the factors are correlated and have to be set to optimize all three economic factors.

The ratio of Minimum to Average Wage is also used to understand wage inequality among laborers within an organization. In developed economies, Minimum Wages generally range 35 to 60 percent of the Median Wage. In developing economies, the percentage is even higher, indicating higher-level workers are relatively underpaid. Minimum Wage at aggregated levels classified based on regions can also help central authorities to identify lagging states or regions, where the standard of living can be improved and economic backwardness eradicated.

Images Credit: International Labour Organization

Impact on Currency

Minimum Wages changes are often annual and do not have an impact on currency markets as it pertains to a particular section of working-class people. Minimum Wage is a low impact lagging indicator and does not deem any importance in the currency markets.

It is useful for central authorities and vulnerable workgroups to raise their living standards and maintain economic equality. When everyone is treated justly in terms of wages, economic growth is not crippled by exploitation and discrimination.

Economic Reports

In the United States, the Department of Labor enforces the Fair Labor Standards Act (FLSA) and sets the Minimum Wage and overtime pay standards. It is enforced by the Department’s Wage and Hour Division. Annual revisions to the same are made and announced, if any.

Sources of Minimum Wages

  • Minimum Wage details set by the Department of Labor is available here.
  • The OECD also maintains the same as Real Minimum Wages.
  • Consolidated reports of Minimum Wages of most countries can be found on Trading Economics.
  • We can find guidelines on setting the Minimum Wage and various nuances associated with it on ILO.

Minimum Wages Announcement – Impact due to news release

The Minimum Wage is an employees’ base rate of pay for ordinary hours worked. It is dependent on the industrial policies that apply to their employment. Employees cannot be paid less than their Minimum Wage, even if they agree to receive it.

Every year, the work commission reviews the minimum wages received by employees in the national workplace system and then submits it to the government’s labor ministry. Looking at the suggestions mentioned, the government increases the minimum wages for workers of the nation. Minimum wages have little impact on the value of a currency as it does not considerably affect the industrial output and the economy.

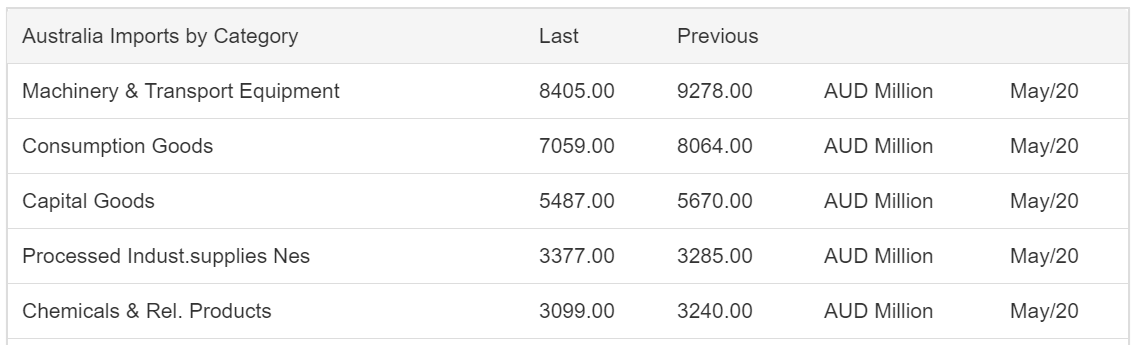
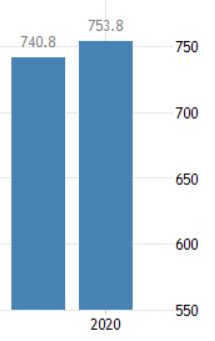
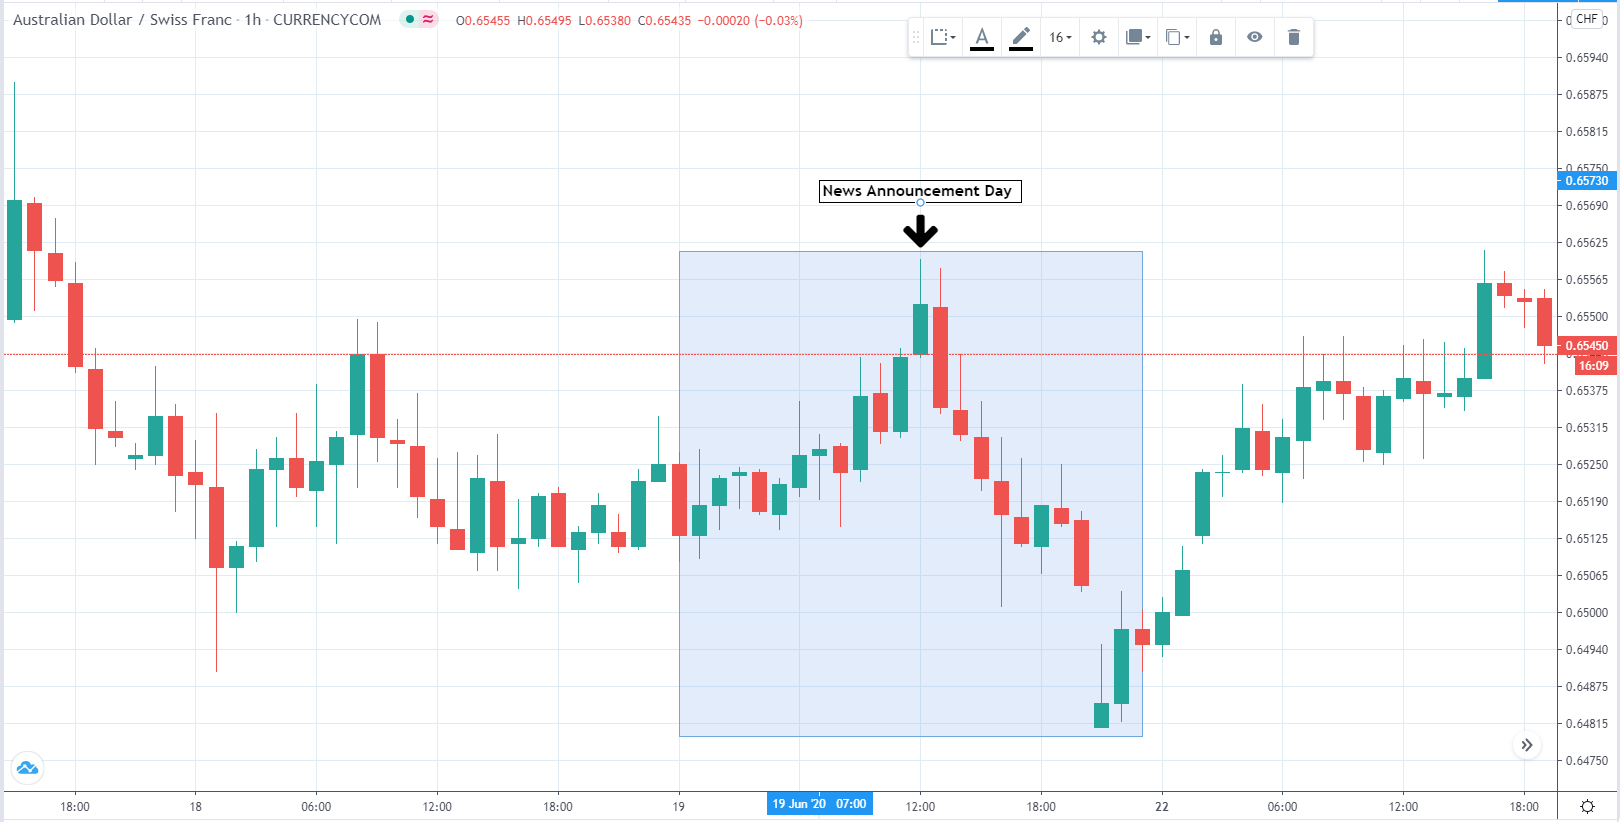
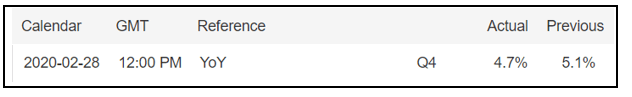
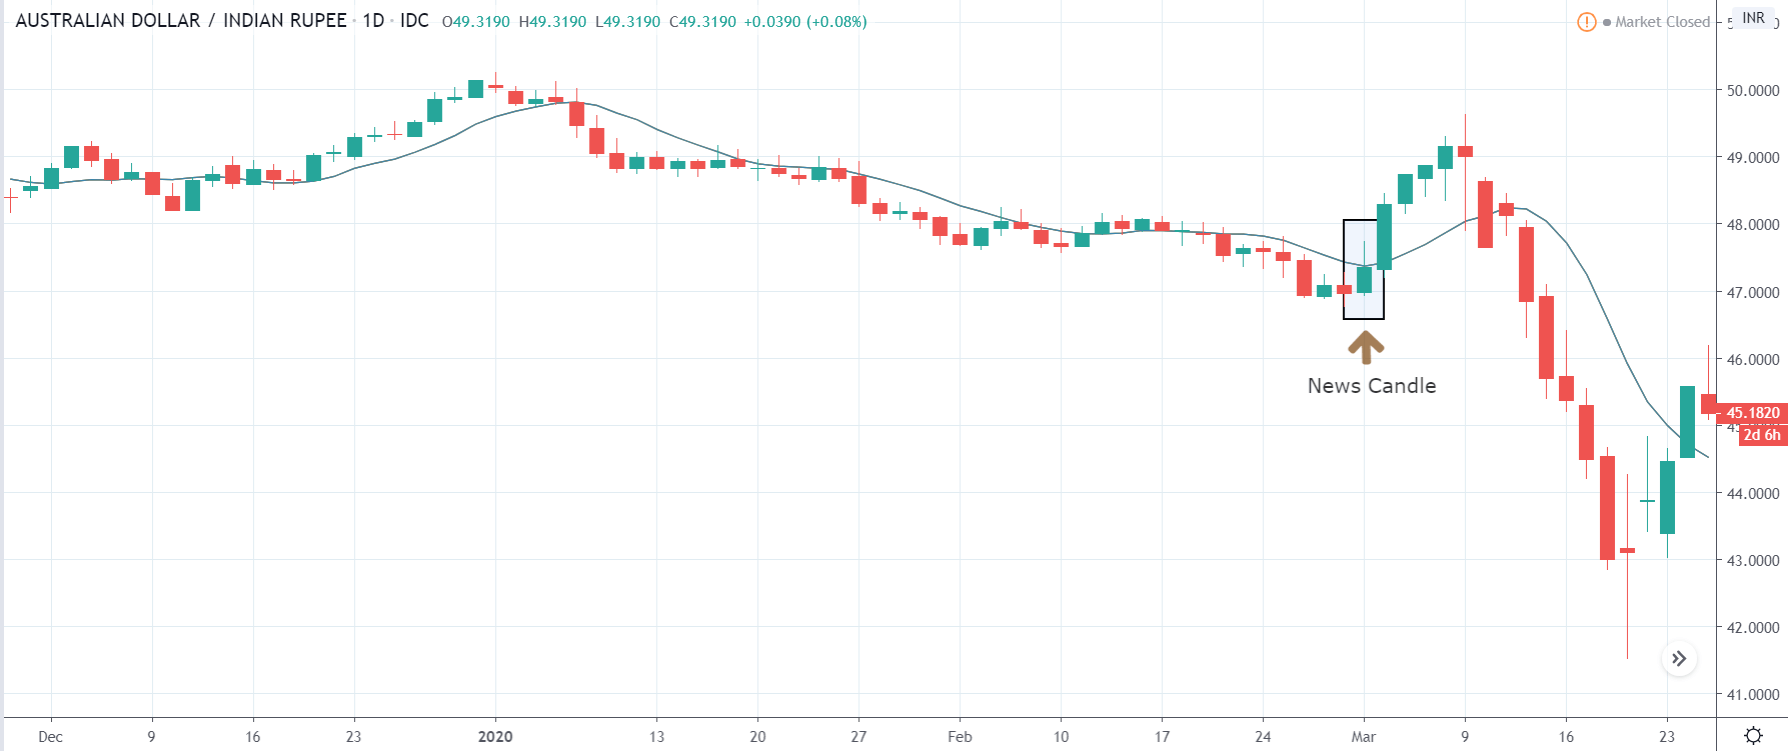
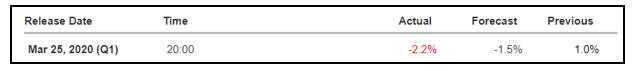
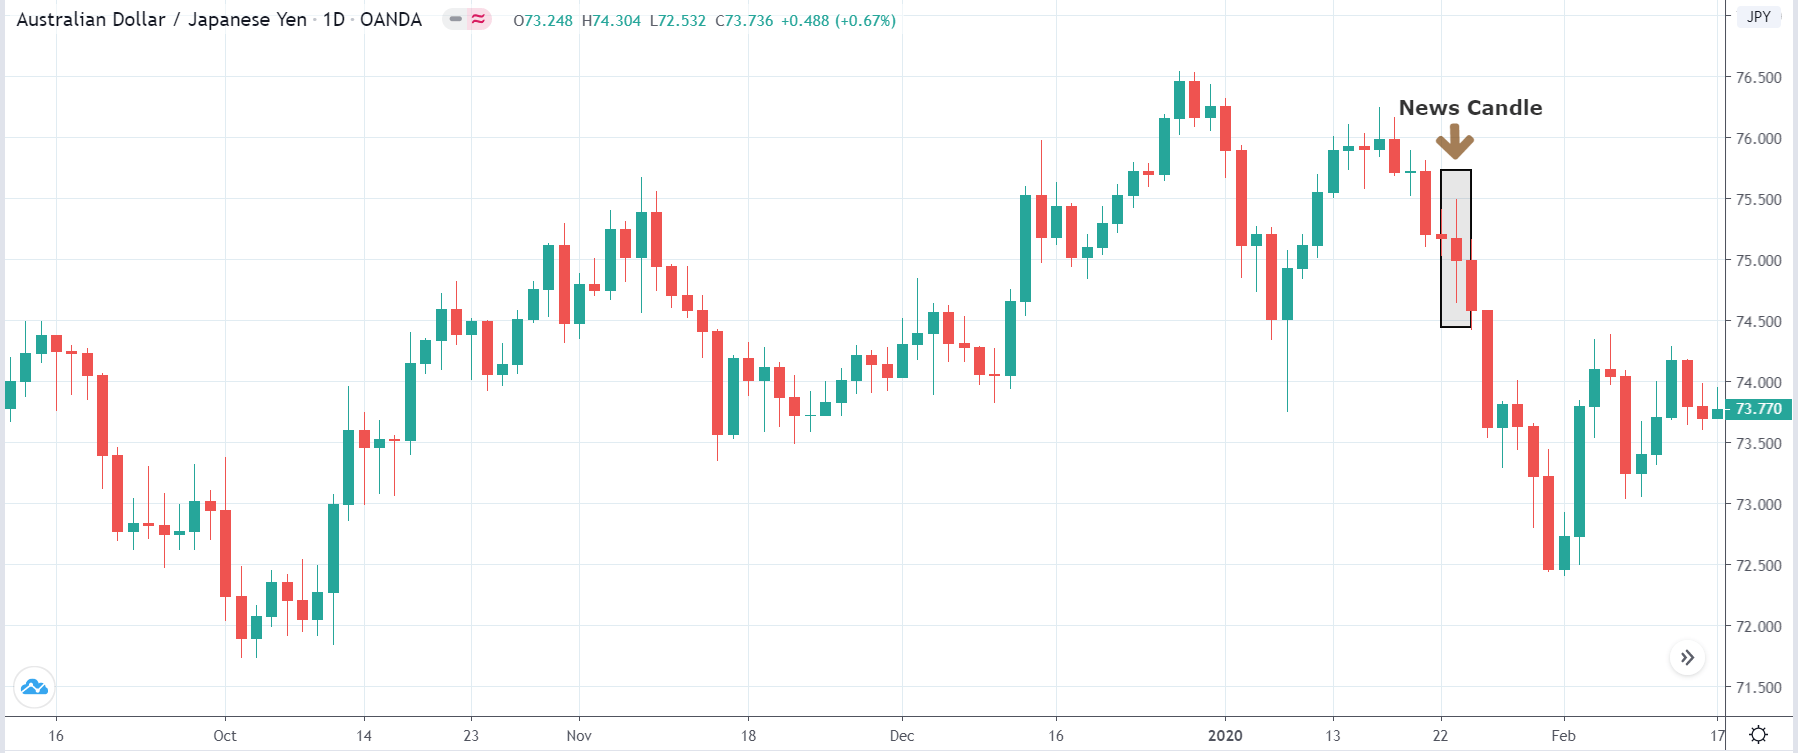
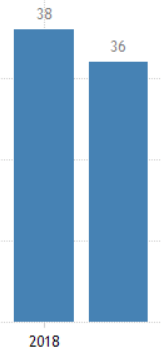
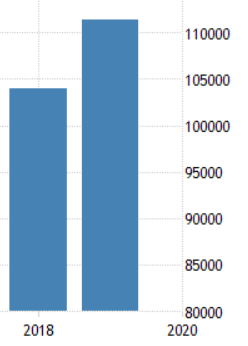
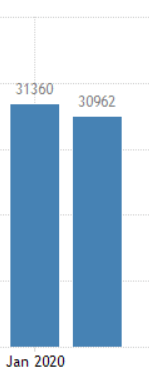
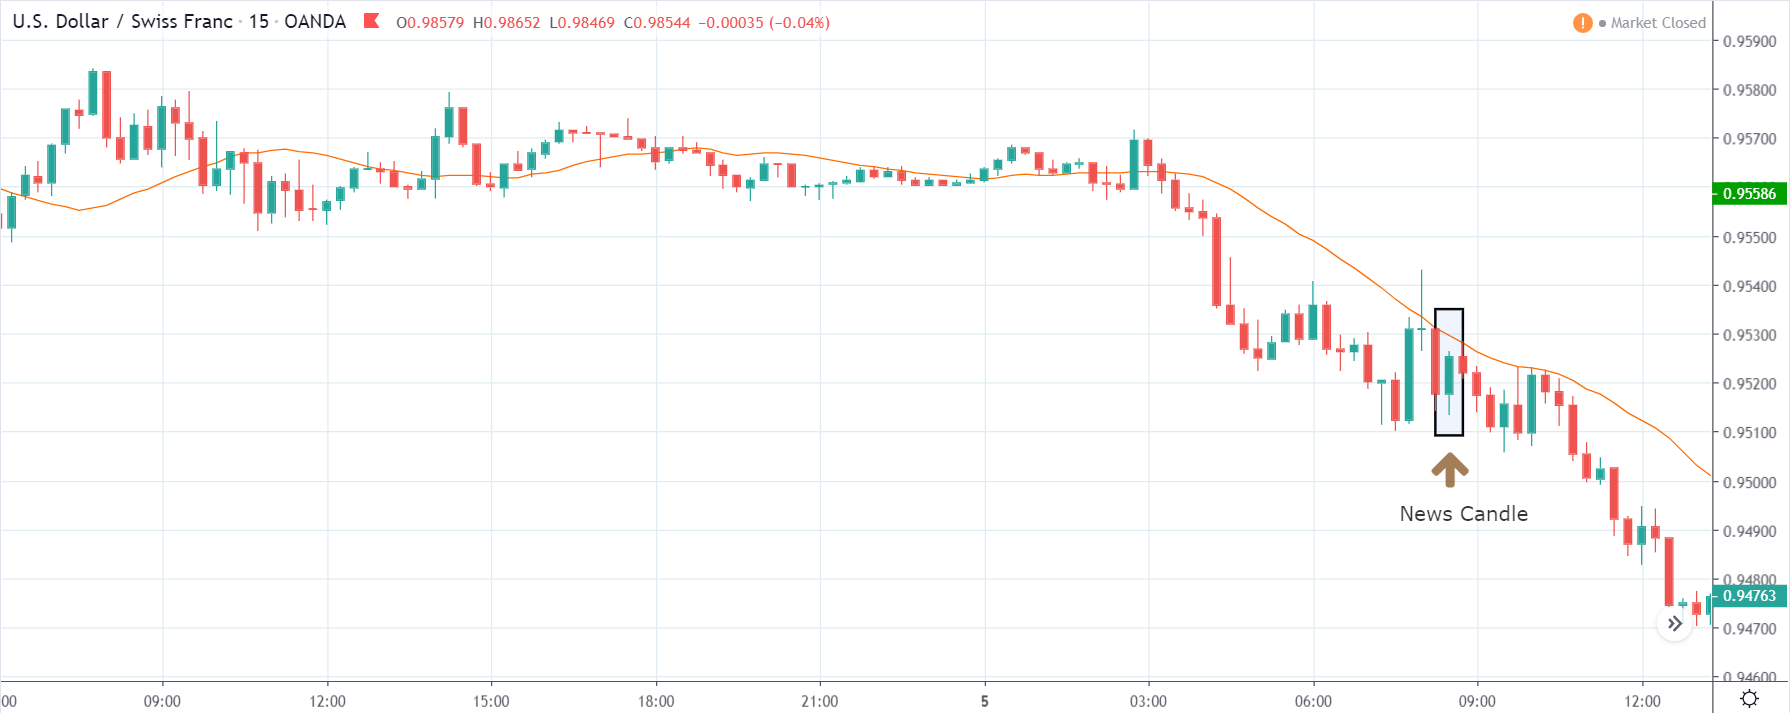
The below image shows that the weekly wages were increased for Australian employees in 2020. Although the difference is not huge, it still is a positive step taken for the daily wage workers. Looking at the data, we should not expect significant volatility in the currency pairs during the announcement.

AUD/EUR | Before the announcement

In the above image of the AUD/EUR 1-hour timeframe chart, we try to establish potential trading opportunities. The pair has been ranging for the past three days before June 19th, 2020.

AUD/EUR | After the announcement

The above image highlights the news announcement day. It may seem there was a small uptrend that was built was erased in the second half of the day. An increase in the minimum wages in favor of AUD did not break the trend established a few days earlier. The pair continues its range post the announcement day also.

AUD/USD | Before the announcement

The above image highlights the AUD/USD pair a few days before the news announcement day. No trend has been established as of now.

AUD/USD | After the announcement

The above image highlights the news announcement day, and we see a similar pattern to the AUD/EUR. We see it is in the typical volatility range of the AUD/USD. The news announcement did not help AUD break the previous and post ranging trend here also.

AUD/CHF | Before the announcement

The above image is AUD/CHF pair, and here also, no potential trading opportunities are building up until June 19th, 2020.

AUD/CHF | After the announcement

The above image highlights the news announcement, and we see that the news did not move the currency in favor of AUD. The AUD/CHF continued to stay in the same range as before the news release day.

Overall, in all the three scenarios, we see the minimum wage economic indicator despite coming in favor of AUD; the market impact was negligible. The market is aware that it is a low impact indicator and affects only a specific section of the labor force.

Hence, changes in minimum wages of a country do not translate to its currency volatility, as already confirmed through our fundamental analysis. Moreover, it is a yearly statistic, and the corresponding effects of increased minimum wages will be captured through monthly indicators better.

Categories
Forex Daily Topic Forex Fundamental Analysis

Understanding ‘Full-Time Employment’ Fundamental Forex Driver

Introduction

Full-Time Employment statistical figures are a good measure for long term economic growth. Understanding the difference between part-time and  Full-Time employment and its economic impact can help us better understand the long-term trends in economic growth.

What is a Full-Time Employment?

Employment

It is the state of having paid work. A person is considered employed if they do any work for pay or profit. People who are eligible for employment are between the age of 15 and 64 and are called the working-age population.

Full-Time Employment

As such, there is no fixed law defining and differentiating full and part-time employment. Conventionally 40 hours a week has been considered as Full-Time employment, but lately, deviations from this have been observed.

For instance, the United States Bureau of Labor Statistics (BLS) describes 35 hours or more per week as Full-Time employment. Conversely, 1 to 34 hours of work per week is considered part-time employment. The Affordable Care Act (ACA) explains Full-Time employees as those who are working for 30 or more hours a week.

How can the Full-Time Employment numbers be used for analysis?

Distinguishing between the part and Full-Time employment has benefits. Full-Time employment generally has the following benefits over part-time or contract-based employment:

Paid leaves: Full-Time employees are eligible to take leaves or vacation for which there would be no loss of pay. It is generally not applicable to part-time employees. Most part-time employees have a per hour payment. They are paid for the number of hours worked.

Healthcare plans: When an employee spends most of his life working for an organization, it is the company’s responsibility to take care of his health and well being. Full-Time employees enjoy the benefits of healthcare insurance for themselves and their family members as well. Health insurances secure employees against heavy financial losses during health emergencies. Part-time employees don’t generally have those benefits.

Pension plans: Full-Time employees are also given the benefits of retirement plans through pension funds or any other retirement scheme. It financially secures the employee in his/her old age, which is essential. Part-time employees generally do not have any such benefits and usually have to save for retirement themselves.

Job Security: During times of economic slowdown or even worse a recession, companies generally lay off their part-time and contract workforce first. Full-Time employees are their prime assets and generally are managers or professionals in the organization. Hence, Full-Time employees are generally less vulnerable to business and economic cycles.

Part-time employees could also be seasonal and find it hard to get work during off-seasons and are more vulnerable to business cycles.

It is easy to infer that the standard of living of Full-Time employees is generally better than that of their counterparts. As employees feel more financially secure in a Full-Time job, their spending habits would reflect the same. Credit eligibility also is more for Full-Time employees over part-time ones. Hence, in the long run, much of the consumer spending would likely be coming from Full-Time employees.

No one seeks part-time employment voluntarily, and no one wants to sit idle during certain quarters of a year. When companies are making long term progress in their profits rather than short-term gains during particular business cycles, a growth in Full-Time employment could be observed. When businesses are fully established in their sector and are marginally well-off, they opt to hire and retain Full-Time employees more. Otherwise, companies would rely on seasonal hiring and firing strategy only to keep the business running.

Policymakers giving the necessary support and means in terms of infrastructure, financial support, ease of doing business could help organizations to grow faster and offer better employment benefits. As more people from the labor force go into the full-time employment category, fewer people are working as part-time employees overall. When the majority of the labor force is full-time employed, we can expect a robust economy and steady economic growth that is immune to both domestic and international business and economic cycles.

Impact on Currency

Full-Time employment and its other half part-time employment only come into picture when we are trying to assess long-term economic growth and improvements in the citizens’ living standards. Hence, Full-Time employment statistics are more useful to policymakers who are committed to bringing wellbeing to their citizens through meaningful policies.

The currency markets are more concerned with the overall picture and the current business cycle’s impact on the currencies. Hence, Full-Time employment statistics, which are only part of the total labor force, do not move the markets like other employment indicators.

Full-Time employment is a low impact coincident indicator that is more useful for measuring long-term improvements in the quality of people’s lives for investors and policymakers only.

Economic Reports

In the United States, the Bureau of Labor Statistics (BLS) publishes monthly, quarterly, semi-annually, and yearly Employment Situation Reports on its website. The labor force statistics from the Current Population Survey details the nominal values of the full and part-time workers classifying them based on age, sex, race, and ethnicity. Full-Time employment reports are available monthly, quarterly, and annually.

Sources of Full-Time Employment

The United States Bureau of Labor Statistics Current Population Survey details Full and Part-time employment statistics in detail. The United States Bureau of Labor Statistics publishes monthly employment and unemployment reports that are very useful for market analysis. We can also find the same indexes and many others with a comprehensive summary and statistics of various categories on the St. Louis FRED that are relevant for our study. Consolidated reports of Full-Time employment for most countries can be found in Trading Economics.

Full-Time Employment Announcement – Impact due to news release

Full-time employment refers to the number of people working a specified number of hours or more per week at their main job or only job. The number of hours is fixed by the government, who later classify employees in different categories.

Traders and investors worldwide watch the indicator value closely as it tells about a country’s employment situation. For example, in Canada, if a person works 30 hours or more per week, he is considered a full-time Employee. One should expect high volatility in the currency during and after the news release.

The below image shows the employment change in Canada during May. We see that full-time employment increased in Canada by 219.40, which should be positive for the currency. Let us witness the impact of this news release on the Canadian dollar by considering various currency pairs.

CAD/USD | Before the announcement

Let us start with the CAD/USD currency pair to observe the impact of full-time employment change on the Canadian dollar. The above snapshot shows the 15 minutes time-frame chart of the currency pair. The currency has been maintaining a range before the news announcement, and it is only three hours before the release, there seems to be a positive momentum building up for CAD/USD.

CAD/USD | After the announcement

After the news announcement, the price initially moves higher, but this is immediately sold, and the market erases most of the gains. The wick on top of the news candle indicates a strong buy sentiment that is carried over, and momentum continues to build up over the next days. As we can see, despite strong sell at the end-of-the-day positive momentum still built up and the market reached a new high than before the news announcement.

AUD/CAD | Before the announcement

The above image is a snapshot of the AUD/CAD pair on a 15-minute time frame before CAD full employment data release at 12:30 GMT. As we can see before the news announcement, positive momentum was building up, and a downward trend started just hours before the news candle.

AUD/CAD | After the announcement

After the news announcement that came in favor of CAD, AUD/CAD falling momentum increases, and investors lose further confidence in AUD, and a strong sell is seen. That momentum is carried over to the next two days, and the AUD continues to fall against CAD.

CAD/JPY Before the announcement

The above image is a 15-minute time-frame snapshot of CAD/JPY. Before the news announcement, there is no clear uptrend or downtrend.

CAD/JPY After the announcement

It is only after positive news for CAD through full-time employment report the uptrend is further amplified and continues throughout the next few days.

The full-time employment data was able to move currency in favor of CAD against significant currencies after the news announcement confirming the importance of the economic indicator.

Categories
Forex Fundamental Analysis

The Impact Of ‘Labor Costs’ Fundamental Driver’s News Release On The Price Charts

Introduction

Labor Cost is a critical element affecting business profitability and sustainability. Labor costs have a direct feedback effect on inflation rates. Understanding its effect on the labor force, economic growth, and inflation helps understand how market forces act.

What are Labor Costs?

It is defined as the total cost of labor used in a business. It is the sum of all wages paid out to the employees of business by the employer. Labor costs include payroll taxes and employee benefits also. Hence, from a business standpoint, it is part of business expenditure dealing with human resources. It can also be defined as the wages cost paid to workers during an accounting period, including taxes and benefits.

Most often, countries measure Unit Labor Cost, which is the labor compensation for a unit of business value produced. It is also a measure of international competitiveness amongst different labor markets throughout the world. Many companies in the United States have shifted their production plants to countries like Mexico, China, and India, where labor cost is relatively lower than the United States.

Labor costs are broadly categorized into the following two categories:

Direct cost: It is the cost of labor that can be traced to produce. It is the labor cost of employees that produce a product. It is a tangible measure. For example, if forty employees are working on assembling and packing an automobile engine, then the labor cost can be traced to the engine’s sale prices.

Indirect cost: It is the labor cost that cannot be traced to any tangible business produce. For instance, building security does not contribute to business output but ensures the safety of the place. It is generally associated with support labor that maintains business activity.

Businesses price in the labor costs, material charges, and overheads, if any, into the final sales price of the product or service they produce. The final product must factor in all the costs incurred; otherwise, it can hurt the company’s profit margin.

While it is easier to evaluate direct costs, indirect costs are a little trickier to evaluate due to their intangible nature. Undervaluation or overvaluation of costs drives the actual price of products away from correct prices. Undervaluation can force employees to quit for better opportunities. Overvaluation can hurt business profit or translate those prices into the end product. When overvalued products hit markets, they lose out to competition and hurt business. Hence, correctly modeling labor costs is vital for business sustenance.

Labor costs are sometimes also classified as fixed and variable costs. Variable costs change based on the amount of work done or business production. For instance, workers working on the production line can see reduced or increased work during business cycles. In such instances, workers are paid for the hours worked, or the output produced. Fixed costs do not vary over the entire business cycle. For instance, a contract with a maintenance company for a year would be fixed for repairs throughout the year.

How can the Labor Costs numbers be used for analysis?

Labor costs are affected by the following factors:

Labor Availability: The supply and demand for labor will drive labor costs. Lack of availability of the required skilled laborers for a particular business can drive up the labor costs due to demand outweighing supply. Conversely, when the market is saturated, labor costs go down due to market forces.

Workplace Location: The cost of living varies across different regions. Businesses having multiple branches can offer different pay for the same work in different areas due to differences in living costs. Wages are generally high in metropolitan cities and lower in semiurban areas.

Task Complexity: The more complex the work, the more a business pays out for it. The task difficulty drives up the labor cost.

Efficiency and Productivity: Efficiency can improve productivity for the same hours of work and workforce. It can increase business profits that can translate into higher labor wages also.

Worker Unions: Hiring a union member ensures that the wages are above a particular minimum pay set by the union. Unions have control over demand and supply of workers, thereby having the power to negotiate labor wages.

Legislation: With many countries adopting minimum wages, and having dedicated acts and laws to protect labor exploitation, labor costs have a price floor below which it cannot drop.

Employer’s idealogy: Some business owners place more emphasis on its employees and view them as the heart of the business. Such people pay higher wages compared to other businesses that emphasize more on profit.

Labor costs are directly proportional to inflation. As prices rise, the cost of living increases and laborers demand higher wages. When labor costs increase, the profit margin of the company decreases. To avoid a reduction in profits, companies may employ cost-cutting mechanisms or lay-offs to accommodate the new wage hike. A significant increase in labor costs can increase unemployment.

On the flip side, the increased labor cost may translate to the product’s end sale price, giving a feedback loop to price inflation. It continues until market equilibrium is achieved through the open demand and supply market forces.

Impact on Currency

Significant and quick increases in the labor market induce inflation, which is depreciating for the currency. Labor cost in itself does not directly affect the country’s currency worth. It is part of a more extensive system. Labor costs are seen from the business point of view and are associated more with inflation.

Overall, labor costs are low impact lagging indicators that do not have a significant effect on currency market volatility. It is deemed more useful for businesses and policymakers to balance laborer’s well-being and business sustainability.

Economic Reports

In the United States, the Bureau of Labor Statistics releases quarterly “Labor Productivity and Costs” that details the Unit Labor Cost also. The report is released in the following mid of the month for the previous quarter.

Sources of Labor Costs

The BLS Labor Productivity and Costs report contains the Unit Labor Cost reports.

The OECD also maintains data of the Unit Labor Cost data of its member countries.

Consolidated Labor Costs data is also available on Trading Economics for most countries.

Labor Costs Announcement – Impact due to news release

In the previous section of the article, we understood the labor costs economic indicator, which essentially measures the change in the price companies pays for labor, excluding overtime. It is a leading indicator of consumer inflation. High labor costs make workers better off, but they reduce companies’ profits and net cash flow.

Policies that increase labor costs can significantly affect employment and working standards, which has an indirect impact on the overall economy. Since labor costs are a company-specific factor, its impact is primarily felt on the company’s stock price and the stock market.  Hence, currency traders do not give much importance to the official labor costs news release.

In today’s article, we will be analyzing the latest labor costs data of New Zealand that was released in May. In the below image, we can see that labor costs were slightly lower than last time and almost equal to market expectations. Let us find out the market’s reaction to this data.

NZD/USD | Before the announcement

The above image shows the NZD/USD 15-minute timeframe chart right until 22:30 GMT. The news release is at 22:45 GMT. Before the news release, the market has no clear pattern and maintains a range with no clear uptrends or downtrends.

NZD/USD | After the announcement

After the news announcement at 22:45 GMT of labor costs Index quarterly reports, which came a little lower than the forecast, no new trends developed. The pair kept its ranging trend before, during, and after the news release.

NZD/CAD | Before the announcement

The above image is the NZD/CAD 15-minute timeframe chart, and we can see here also there is no clear trend building up throughout the day. The currency pair has been in a ranging trend throughout the timeline.

NZD/CAD | After the announcement

After the news announcement, there seems to be no significant volatility in either direction. The news did not create enough volatility to bring about any trend.

NZD/EUR | Before the announcement

The above chart is the NZD/EUR 15-minute time frame chart, and there have been here also no trends building up before the news announcement. There are no potential trade signals here until now.

NZD/EUR | After the announcement

After the news announcement, there seems to be no volatility around the candle. The pair did not build any momentum after the announcement also.

In conclusion, even though the news announcement came slightly less favorable to the NZD currency, we did not see any downtrends for NZD currency against any other currency. The market ignored the news, and there was no impact significant enough to move the currency in either direction. All of this again firmly establishes our fundamental conclusion that the labor costs economic indicator is a low impact indicator in the currency markets and can be overlooked for the fundamental analysis of currencies.

Categories
Forex Basic Strategies

What Is ‘Gawk the Talk Strategy’ & How To Trade It Effectively?

Introduction

Trading the news is one of the best ways to make a profit within a short span of time. This is because volatility is highest during these announcements, and traders look to capitalize on these news releases by analyzing the data and the price movement.

The strategy we will be discussing is amazingly suitable for traders who love the volatility associated with news announcements. One of the biggest advantages of trading the news is accessibility. Today, we can access the news outcome as soon as they are released without any delay.

Many free websites report economic events every day. The one which is widely used by investors and traders is a site called forexfactory.com. This site is user-friendly, and the economic calendar allows us to view the upcoming news at a glance.

The news that has red-coded flags linked to them have the greatest impact on the currency pairs. We will prefer to trade the news events with the highest impact as opposed to the orange or yellow ones because the possibility of large movement is high. Today’s strategy is also based on such news releases.

As the actual and forecasted figures are extremely important for this strategy, we will be watching these numbers very carefully. That is the reason why this strategy is named as ‘Gawk The Talk.’

The top news announcements that cause the greatest moves in the forex market are Interest Rates, Gross Domestic Product (GDP), Employment Change, Trade Balance, Consumer Price Index, Purchasing Manufacturing Index (PMI), and Retail Sales.

Time Frame

Gawk the Talk strategy works well with the 15 minutes and 1-hour candlestick charts. This means each candle on the chart represents 15 minutes or 60 minutes of price movement.

Indicators

No indicators need to be used in this strategy.

Currency Pairs         

The strategy is suitable for trading all currency pairs; however, it is healthier to trade in currency pairs such as the EUR/USD, USD/JPY, GBP/USD, USD/CHF, USD/CAD, AUD/USD, and NZD/USD.

Strategy Concept

The idea of the strategy is simple, where we long on the affected currency when the actual figures are greater than forecasted figures by a minimum factor of 15%. To lower the risk, we focus on news events that are related to the U.S. economy. Which means we will be primarily trading the U.S. dollar either as the base currency or counter currency.

We will use the 15 minutes time frame chart to determine our entries since the news is usually released in 15-minutes intervals. Some common times of news releases include 8 A.M., 9:15 A.M., 10:30 P.M., and 11:45 P.M.

For example, if the Reserve Bank of Australia raises the interest rates, we will go long in AUD/USD. And if the interest rates are lowered, we take a short trade in the pair. For news announcements that affect the United States, it is best to trade in the two most liquid pairs: EUR/USD and USD/JPY. Remember, we go long in the pair if the news outcome is positive for the base currency and ‘short’ in pairs wherever the currency is a counter currency.

Trade Setup

To illustrate the strategy, we will use the Unemployment rate news announcement, which was released on the 2nd of July 2020. As mentioned earlier, we will be dealing with currency pairs involving the U.S. dollar only. Hence, depending on the news data, we will take a suitable position in the EUR/USD pair.

Step 1:

The first t step is to go to the forex factory website and look for news releases that have the highest impact on the currency. The easiest way to find such events is to look for the red-colored flags on the left-hand side of the event. We will not consider any other news results other than red ones.

In this example, we will be analyzing the Unemployment rate data of the United States.

Step 2:

An important point most traders miss out while trading using this strategy is that they trade just based on the numbers. They forget to look at the charts from a technical angle. In this step, we mark the key technical levels on the chart based on the current state of the price.

As we can see in the below image, just before the news announcement, the price is at the resistance area. This means a ‘short’ trade is considered to be less risky than a ‘long’ trade at this point.

Step 3:

This step is the crux of the strategy. In this step, we take an appropriate position in the currency based on the news’s outcome. If the actual numbers are higher than the forecasted numbers, we will go long in that currency. Likewise, if the actual numbers are lesser than the forecasted numbers, we will go ‘short’ in that currency. The difference between actual and forecasted figures should be a minimum of 15% before we can take enter the market.

In our example, we see that the Unemployment rate was better than what was predicted by economists. This means the data is positive for the U.S. dollar, and thus we can expect bullishness in the currency. Therefore, we take a ‘short’ position in EUR/USD soon after the market falls from the resistance.

Step 4:

Stop loss for the strategy is placed just above the news candle, which is technically the right spot for placing the stop loss. The take-profit is also placed at a key technical level, which could be a hurdle for the trade. The risk to reward ratio of trades placed using this strategy is a minimum of 1.5. However, one should book partial profits at the halfway mark in order to lock in some profits.

In this case, the price moved about 60% of our take-profit, where would take some profits off. However, more often than not, the price does hit the take-profit levels.

Strategy Roundup

The strategy we discussed today is mostly for the aggressive traders and people with large risk appetite. In this strategy, we are essentially taking advantage of the volatility and the fundamental factors that affect the currencies. The trade management rules of the strategy ensure that we don’t make huge losses even if the trade does not work completely in our favor. Cheers.

Categories
Forex Fundamental Analysis

What Does The ‘GDP Growth Rate’ Forex Driver Say About A Nation’s Economy?

Introduction

GDP Growth Rate is the most critical fundamental macroeconomic indicator for measuring economic prosperity. It is the number one macroeconomic indicator, and all other leading, coincident, and lagging indicators are all trying to predict what GDP Growth Rate would be. Our fundamental analysis revolves around predicting the growth rate before the GDP Growth Rate reveals it. It is the de facto measure of economic growth for all countries worldwide.

The importance of this economic indicator cannot be understated. GDP Growth Rate figures move the markets like no other, be it the currency or the stock markets. Hence, understanding the significance of this macroeconomic indicator is paramount for traders and investors.

What is the GDP Growth Rate?

Gross Domestic Product

It is a measure of the total economic output of a country. It is the total monetary value of all the goods and services produced within the country regardless of citizenship (resident or foreign national). The commonly used term “size of the economy” refers to this economic indicator. The US is the world’s largest economy, and it means it has the highest nominal GDP or highest economic output.

GDP Growth Rate

GDP Growth Rate is the measure of the rate of economic growth. In other words, it tells the pace at which an economy is growing. Generally, developing or emerging economies like China, India, or Japan will have a higher GDP growth rate than the mature or developed economies like the United States, United Kingdom, etc.

Mathematically, it is the percentage change of Gross Domestic Product with regards to the previous quarter. Although the GDP Growth Rate is reported quarterly, it is annualized for better analysis and comparison. It means that the quarterly GDP is scaled to a year to compare the Growth Rate with the previous year and understand whether the economy is growing faster or slower compared to the previous year. 

The other reason is that the GDP Growth Rate changes according to the business cycle and is usually very high during the last quarter, accounting for holiday shopping from consumers driving up the GDP. Hence, annualizing with seasonal adjustment makes it more accurate for analysis. The Real GDP Growth Rate accounts for inflation and is the most-watched GDP statistic.

The GDP Growth Rate is affected by the four components of the GDP:

A | Consumer Spending: It is also called Personal Consumption. It represents spending associated with the end-consumers or the general population. The Personal Consumption Expenditure reports, Retail Sales, are all different economic indicators representing Consumer Spending. It makes up about 69% of the total GDP in the United States.

B | Business Investment: Economic Output of the Business Sector makes up 18% of the total GDP in the United States. Business Surveys like Purchasing Manager’s Index, Industrial Production, etc. help assess the Business Sector’s contribution to economic output.

C | Government Spending: It involves all the expenditures incurred by the Government to maintain and stimulate economic growth and run its operations. In the United States, significant proportions of Government Spending go to Social Security, Medicare benefits, and Defense Spending. It accounts for 17% of the total economic output for the United States.

D | Net Exports: It is the difference between the total exports and imports. Revenue is generated from exports and depleted from imports. Developing economies will mostly have positive Net Exports as it is an integral part of their revenue generation. The United States has -5% Net Exports of the total GDP, meaning it is a net importer.

How can the GDP Growth Rate numbers be used for analysis?

When the economy is growing or expanding, the GDP Growth Rate is favorable. When the GDP Growth Rate is increasingly positive, businesses, jobs, and personal income all grow followingly. Developing economies grow faster than mature economies (as the developed economies are already more saturated compared to developing ones). It is generally standard for matured economies to peak out at 3-4% GDP Growth Rate and developing economies can have anywhere between 5-20%.

When the economy is slowing or contracting, businesses will halt new investments and plans to avoid deflation. New hiring is also postponed; people will save more than spend to prepare for the oncoming deflationary conditions. The economy comes to a slowdown. The Government intervenes through fiscal and monetary levers to stimulate economic growth and bring it back to normal conditions and maintain the growth rate. Overall, the GDP growth rate tells us the economy’s health.

Impact on Currency

The GDP is a lagging macroeconomic indicator that has high-impact on the market volatility. Investors’ decisions are based on the GDP growth rate. It is a proportional indicator. High GDP Growth Rates are suitable for the economy overall and vice-versa.

Though it is a lagging indicator, it has many implications for the economy. It is the most extensive measure of economic activity and the primary gauge of the economy’s health. GDP Growth Rate comparisons amongst different economies are vital for currency markets, and hence, it has a very high impact on the currency market.

Economic Reports

For the United States, the Bureau of Economic Analysis releases quarterly GDP Growth Rate figures on its official website every quarter. The release schedule is already mentioned on the website and is generally released one month after the quarter ends. 

Major international organizations like the World Bank, International Monetary Fund, OECD, etc. actively maintain track of most countries on their official website: 

Sources of GDP Growth Rate

For the United States, the BEA reports are available here.

The St. Louis FRED keeps track of all the GDP and its related components in one place on its official website. You can find that information in the sources mentioned below.  

GDP & GNP – FRED 

GDP Growth Rate – World Bank

GDP Growth Rate – IMF

Impact of the “GDP Growth Rate” news release on the Forex market

In the previous section of the article, we explained the GDP Growth Rate fundamental indicator and saw how it could be used for gauging the strength of an economy. The GDP Growth Rate indicates how quickly or slowly the economy is growing or shrinking.

It is driven by four components of GDP, the largest being personal consumption expenditures. But economists prefer using real GDP when measuring growth because it is inflation-adjusted. When the economy is improving, the GDP Growth Rate is favorable. If it is contracting, businesses hold off investing in new technologies. If GDP Growth Rate turns, then the country’s economy is in a recession.

In the following section, we will analyze India’s GDP Growth data and observe the change in volatility due to the news announcement. The below image shows the fourth quarter GDP Growth data of India, where there has been a fall in the value compared to the previous quarter. The most critical and highest contributor to the growth of the Indian economy is services. Let us find out the reaction of the market to this data.  

USD/INR | Before the announcement:

We shall start with the USD/INR currency pair to study the impact of GDP Growth Rate on the Indian Rupee. The above image shows the ‘Daily’ time-frame chart of the currency before the news announcement, where we see that the market is moving within a ‘range’ and currently the price seems to have broken out of the ‘range.’ The volatility is high on the upside, indicating that the Indian Rupee is weakening. Depending on the GDP Growth Rate data, we will take a suitable position.  

USD/INR | After the announcement:

After the news announcement, we see a sudden rise in the volatility to the upside. The price moves higher initially, but selling pressure from the top makes the ‘news candle’ to close with a wick on the top. This was a result of the harmful GDP Growth data where there was a reduction in the Growth Rate from last quarter.   

INR/JPY | Before the announcement:

INR/JPY | After the announcement:

The above images represent the INR/JPY currency pair, where it is clear from the first image that the price was moving in a ‘range’ before the announcement, and presently it has broken the ‘support’ with a lot of strength. This is the first sign of weakness in the Indian Rupee that could probably extend. If the price remains below the moving average, a ‘sell’ trade can be initiated.

After the news announcement, the price crashes lower but immediately gets reversed, and the ‘news candle’ closes with a wick on the bottom. The initial reaction was a result of the weak GDP Growth Rate, which lead to the further weakening of the currency. Volatility increased to the downside due to the news announcement, which was on expected lines.

AUD/INR | Before the announcement:

AUD/INR | After the announcement:

The above images are that of AUD/INR currency, where we see before the news announcement, the market is in a downtrend, and currently, the price is at its lowest point. Technically, we should be looking to sell the currency pair after a price retracement to the nearest’ resistance’ level or an appropriate Fibonacci ratio. Therefore, depending on the volatility change due to the news release, we will take a pair.

After the news announcement, the volatility emerges to the upside, and we see a sudden rise in the price that also goes above the moving average. This was a result of the weak GDP Growth Rate that made traders to ‘long’ in the currency pair by selling Indian Rupees. The news release hurts the currency where the weakness persists for a while, but later, the downtrend continues.

We hope you understood the concept of “GDP Growth Rate” and its impact on the Forex price charts after its news release. All the best. Cheers!

Categories
Forex Fundamental Analysis

What Is ‘GDP From Public Administration’ Forex Fundamental Driver All About?

Introduction

Public Administration is a critical aspect that drives overall economic growth. GDP from Public Administration can give us insights into the strength of the current central authorities’ efficiency in governance. Public Administration is the levers to the economic engine, and it can put brakes or accelerate the economy to sink into a recession or propel to economic growth. Hence, understanding Public Administration and its contribution to GDP will help us better understand its role in society’s functioning as a whole.

What is GDP from Public Administration?

Gross Domestic Product

GDP is the measure of a country’s total economic output. It is the total monetary value of all the goods and services produced within the country regardless of citizenship (resident or foreign national).

It is the market value of all the finished goods and services within a nation’s geographical borders for a given period. The period is generally a quarter (3 months) or a year.

The commonly used term “size of the economy” refers to this economic indicator. The USA is the world’s largest economy, and it means it has the highest nominal GDP or highest economic output.

Public Administration

It is the implementation of government policies. Public Administration is a part of every economy. Policies can be either monetary policy or fiscal policy.

Public Administration is concerned with the operations of government that run the nation. It is centered around the structuring of the Government policies and programs and government officials’ conduct to implement the same.

Public Administration’s definition and goals are vast subjects. In our analysis, we will only focus on the economic impact of Public Administration. 

How can the GDP from Public Administration numbers be used for analysis?

An analogy to understand the importance of Public Administration would be if an economy or nation is viewed as a car or engine. Public Administration would be the brake, gear, and acceleration levers. Levers determines whether the car moves forward or backward, and also the pace of movement.

Similarly, Public Administration determines what direction the economy’s growth is going towards and at what rate. Monetary policy is associated with the Central Bank of a nation. Fiscal Policies are associated with the Central Government. 

Officials working as per the Public Administration policies are called Civil Servants, together the Governing body and its policy determine how effectively the opportunities are maximized to satisfy the public demands and lead to overall economic wellbeing.

Policy reforms and effective Administration can reduce economic disparity amongst different classes of people, increase employment, wages, and business prosperity. Government Spending, Tax programs, Outlays, allowances, funding programs are all part of the Government policy. Public Administration determines how effectively such policies are implemented.

Public Administration provides the foundation for economic activity through laws and as a catalyst to economic wellbeing through its services. 

Without firm laws and regulations and active civil servants, the nation is in jeopardy. Weak governance and policy can sink the nation where corruption, political instability, riots, public protests, etc. can creep in. 

Services like transportation, maintaining law and order, road construction, police, jails, tax exemptions, medicare, social security, etc. directly may or may not generate revenue for the government but indirectly helps other sectors to boost overall economic prosperity.

When a nation’s government fails to stimulate the economy, there is a probability that it will continue for its elected period. Hence, International Investors can glean such clues from GDP from Public Administration figures. They can understand the behavioral nuances of the government and its probable impact in the upcoming quarters.

The government impacts the people and the business. On an absolute basis, the government has complete control over the nation for the elected period. It can bring about any policy reforms they see fit. It can help businesses or impede businesses. It can control money flow through the economy, and how much people pay taxes.

It is also essential to perceive that the GDP from Public Administration is only part of the government’s revenue. It assists in the functioning of other sectors through its public services that are not accounted for in the GDP. 

Hence, GDP from Public Administration itself does not tell us the real contribution of Public Administration in growth. The functions of a government span across various sectors and vary from region to region based on the economic region’s requirements.

Impact on Currency

The GDP from Public Administration is a low impact indicator, as the broader measures like Real GDP and GDP Growth Rates are more important for the Currency Markets. 

GDP from Public Administration does not paint the full picture of the economy, but it tells us the effectiveness of the current government and its policies. Still, for the International Currency Markets, it does not serve as a useful indicator.

It is a proportional and lagging indicator. Higher GDP from Public Administration is good for the economy and its currency, and vice-versa.

Economic Reports

For the United States, the Bureau of Economic Analysis releases quarterly GDP figures on its official website every quarter. The release schedule is already mentioned on the website and is generally released one month after the quarter ends.

In the full report, we can extract the GDP from Public Administration figures. We can also go through GDP by Industry to get the Public Administration performance in the report. Below is a sample of the same:

World Bank actively maintains track of GDP by Sector figures of most countries on their official website. Public Sector 

Sources of GDP from Public Administration

For the United States, the BEA reports are available here.

We can use the GDP by Industry to see the government’s contribution to GDP here. 

Different metrics like Public Debt, Expenditure, etc. are all categorically available here.

We can also find GDP from Public Administration for different countries here.

Impact of the ‘GDP From Public Administration’ news release on the price charts 

In the previous section of the article, we understood the importance of Public Administration in an economy and how it impacts economic growth. It plays an essential role in overseeing and shaping new impact market strategies. It is the responsibility of public administrators, whether policymakers or non-profit executives, to make use of the opportunity to ensure that the economy flourishes.

Profound policies are needed to facilitate private-sector investment in socially beneficial concerns. All this is in the hands of public administrators and the government. Therefore, the department has a fair amount of contribution to the GDP and the economy. When it comes to investing based on this information, investors do not make investment decisions based on the contribution from different sectors. They look at the final GDP and take a position in the currency.

In today’s lesson, we will analyze the impact of GDP on different currency pairs and see the volatility created after the news release. The below image shows the first-quarter GDP data of Singapore, where we see a significant drop in the GDP value compared to the previous quarter. Let us find out the reaction of the market to this data. 

USD/SGD  | Before the announcement


Let us start with the USD/SGD currency pair, where the above image shows the state of the chart before the news announcement. We see that the market is moving in a small ‘range,’ and just before the release, the price is at the top of the ‘range.’ This means we can expect selling pressure from this point that can take the price lower. However, it is better to take a position based on the volatility caused by the news announcement. 

USD/SGD  | After the announcement:

After the news announcement, we see that the price moves lower, and the market falls considerably. The market reacted oppositely to what was expected as it resulted in the strengthening of the Singapore dollar even though the GDP data was negative. The volatility increased to the downside, and eventually, the market turns into a downtrend.    

SGD/JPY | Before the announcement

SGD/JPY | After the announcement:

The above images are that of the SGD/JPY currency pair, where we see that the price is precisely at the ‘support’ before the news announcement. There is a high chance that the buyers might come back in the market and go ‘long’ in the currency pair. Since economists forecast a lower GDP for this quarter, it is advised not to take a ‘short’ position before the news release.

After the news announcement, the price initially moves higher, but this gets immediately sold into, and the candle closes with a large wick on the top. We witness a fair amount of volatility in the currency, and finally, it gets extended to the downside. One can take a ‘short’ position in the currency after noticing trend continuation patterns in the market and after confirmation from technical indicators.     

GBP/SGD | Before the announcement

GBP/SGD | After the announcement:

The above images represent the GBP/SGD currency pair, where we see that before the news announcement, the market has reversed to the upside, and currently, the price has reacted strongly from the ‘demand’ area. This indicates a high amount of bullishness in the currency pair and weakness in the Singapore dollar since it is on the left-hand side of the currency pair.

After the news announcement, the market falls lower, and the volatility slightly increases to the downside. The Singapore dollar gets more influential after the news release, despite reporting weak GDP data. Thus, we can conclude that there is some confusion in the market and hence it moves in both the directions. Traders should technically analyze and take positions accordingly. 

That’s about ‘GDP From Public Administration’ and its impact on the Forex market after its news release. In case of any questions, let us know in the comments below. Good luck!  

Categories
Forex Fundamental Analysis

‘GDP From Manufacturing’ – Understanding The Macro Economic Indicator & Its Impact

Introduction

GDP from Manufacturing is significant for many developing economies. It is their primary driver for economic growth to improve the standard of living and generate wealth. Manufacturing Sector has supported a large share of jobs in the economy. 

Manufacturing Sector has helped many economies to come out of underdeveloped status to developing nation status. Hence, understanding GDP from Manufacturing has varying significance in different countries is suitable for macroeconomic view in the international markets.

What is the GDP from Manufacturing?

Gross Domestic Product

GDP is a basic measure of a country’s total economic output. It is the total monetary value of all the goods and services produced within the country regardless of citizenship (resident or foreign national).

It is the market value of all the finished goods and services within a nation’s geographical borders for a given period. The period is generally a quarter (3 months) or a year. The commonly used term “size of the economy” refers to this economic indicator. The USA has the world’s largest economy, and it means it has the highest nominal GDP or highest economic output.

Manufacturing

It is producing goods for use or sale labor, processing equipment, or machinery. It is a process that could be physical, chemical, or mechanical. The manufacturing sector mainly uses raw materials to make finished goods for consumption by end customers or intermediate goods for other manufacturing industries. For example, a car Manufacturing company could import raw iron ore metal, and process it to produce metal car body parts.

In the lifecycle of a finished good, the Manufacturing comes in as the second stage in the supply chain right after the source of raw materials. The manufacturing sector includes plants, factories, mills, and generally use power-driven machinery in their process. The manufacturing sector can also include small businesses, or home startups like bakeries, candy stores, or custom tailors, etc.

How can the GDP from Manufacturing numbers be used for analysis?

Manufacturing is an essential component of GDP. In the United States, it contributed 11.6% of total GDP. Manufactured products make up half of the total United States exports. In the United States alone, the Manufacturing Sector has 12.85 million jobs, about 8.5% of the total workforce. The importance of the Manufacturing Sector is evident from the rapidly developing economies like China, Japan, and India. 

The industrialization has been the main propellent for economic growth in these countries that put them back on the map. With export-led growth, China has primarily used Manufacturing Sectors to achieve growth rates of 10% and above to catch up with the advanced economies like the United Kingdom, and the United States. Manufacturing Sector is a labor-intensive sector, and it requires skilled labor. Despite the advent of modern technologies, equipment, and automated machinery, it still requires skilled laborers to fill the gaps.

Developing economies do not have a competitive edge over the developed economies in the services sector. But they do have the advantage in the Manufacturing and Industrial Sectors due to the availability of cheap labor. The low costs associated with a low standard of living and maintenance attracts business to establish their production centers in such countries. For example, an autoworker in Detroit makes 58 dollars an hour compared to 8 dollars in Mexico.

With an improved standard of living in developed economies like the United States, the cost of labor is high in comparison. It is the primary reason for the decline in the Manufacturing Sector growth in the developed economies for over two decades, paired with rapid growth in developing economies during the same period. 

With many developed economies transitioning more into the services sector, the Manufacturing Sector has lost its fair share in developed economies while developing ones like China have significantly increased their Manufacturing Industry production levels. 

About Thirty percent of the GDP of China comes from the Manufacturing Sector alone. Hence, we can understand that the Manufacturing Sector is the primary source of growth for many developing countries. The above plot shows the increase in Manufacturing Production in China. It is steady and steep growth. The vertical axis is plotted in CNY HML (Chinese Yuan Hundred Millions).

As the countries develop, they start to get involved in the Service sector by investing the wealth generated from the Manufacturing Sector to come on par with developed economies and establish a total equilibrium. But there is a long way to go before all developing economies become developed.

Impact on Currency

The GDP from Manufacturing in itself is not a high impact indicator, as the broader measures like Real GDP and GDP Growth Rates are more important for the Currency Markets. GDP from Manufacturing does not paint the full picture of the economy. It can be an essential tool for the Central Authorities to keep track of Manufacturing Sector performance and its implications to the economy.

As established, the Manufacturing Sector is a significant contributor to economic growth for developing economies. Hence, changes in this sector widely affect the overall economic health, and all the dependent industries therein. It is a proportional and lagging indicator. Higher GDP from Manufacturing is good for the economy and its currency, and vice-versa.

Economic Reports

For the United States, the Bureau of Economic Analysis releases quarterly GDP figures on its official website every quarter. The release schedule is already mentioned on the website and is generally released one month after the quarter ends.

In the full report, we can extract the GDP from Manufacturing figures. We can also go through GDP by Industry to get the Manufacturing Industry performance in the report. The World Bank actively maintains track of GDP by Sector figures of most countries on its official website.

Sources of GDP from Manufacturing

For the United States, the BEA reports are available below: 

World Bank also maintains the Manufacturing Sector’s contribution as a percentage of GDP on its official website, as given below for reference. ‘GDP From Manufacturing’ of various economies can be found here.

Impact of the ‘GDP from Manufacturing’ news release on the price charts

The manufacturing sector is crucial for the development of a country. The growth of machinery output and technological improvements are the main drivers of economic growth. The service sector, too, is dependent on most of the manufactured goods. Manufacturing also revives the economy by creating tens of millions of new jobs, eradicating recession.

Therefore, the manufacturing sector contributes a significant part of the GDP of a country. When we drill down to the fundamental analysis of the currency, investors do not look at the manufacturing sector’s contribution alone but consider the distinct GDP as the leading indicator of economic growth.

For example, we will be analyzing the influence of GDP on various currency pairs and see the impact it makes on the value of a currency. The below image displays the previous and latest GDP in the United Kingdom released in May, where we see a significant drop in the GDP compared to the previous month. Let us find out if the market reacts positively or negatively to the news release.  

GBP/USD | Before the announcement:

We shall start our analysis with the GBP/USD currency pair, where the above image shows the properties of the pair before the news announcement. We can see in the above image that the market is in a downtrend, and recently the price has been moving within a ‘range.’ Since the GDP announcement is a high impact event, we should wait for the news release to clarify the direction of the market.  

GBP/USD | After the announcement:

After the news announcement, we witness a slight amount of volatility in the currency pair where the price initially goes up, and later it closes with a wick on the top. We do not observe the kind of impact that was expected due to the news release may be because the market had already priced in a negative outlook. Since the impact was less, we should look to trade the currency pair based on technical indicators and chart patterns.     

GBP/CAD | Before the announcement:

GBP/CAD | After the announcement:

The above images represent the GBP/CAD currency pair, where we see in the first image that the market seems to be resuming the downtrend after a price retracement to the resistance. Given that the impact of GDP announcement is high, we will look to take a ‘short’ only after confirmation from the market. There is a probability that the market may turn to the upside from this point if the news comes out to be positive for the British Pound.

After the news announcement, we see that the price rises above the moving average, and it closes with some bullishness. Even though the GDP data was fragile, traders bought British Pound and strengthened the currency. One of the reasons could be that the market has factored in the negative expectations, which led to a positive reaction after the news release. One should analyze the pair technically before taking a position in the currency.  

EUR/GBP | Before the announcement:

EUR/GBP | After the announcement:

The above images are of the NZD/GBP currency pair, where we see that the market is in a steady uptrend before the news announcement, signifying the enormous amount of weakness in the British Pound. Ideally, we will be looking to buy the currency pair after a suitable price retracement to the ‘support’ or ‘demand’ area. By the way, we should also not forget that the news release can reverse the trend.

After the news announcement, we see that the market reacts negatively to the news release but positive for the British Pound since it is on the right-hand side of the currency. The volatility slightly increases to the downside, which is evident from bearish ‘news candle.’

That’s about ‘GDP from Manufacturing’ and its influence on the Forex market after its news release. If you have any questions, please let us know in the comments below. Good luck!

Categories
Forex Daily Topic Forex Fundamental Analysis

What Does ‘Gross Fixed Capital Formation’ Economic Indicator Tell About A Nation’s Economy?

Introduction 

Gross Fixed Capital Formation can help us as a leading indicator of economic growth. GFCF figures increase when growth is forecasted, be it for companies, governments, or organizations, etc. Understanding this macroeconomic indicator can help us understand the level of economic activity going on the global scale and forecast the changes in the rate of growth for different economies, as indicated by the Gross Fixed Capital Formation figures.

What is Gross Fixed Capital Formation?

Gross Fixed Capital Formation (GFCF) is a measure of gross net investment into fixed capital goods by companies, governments, and households within the economy for a specific period. It is also called investment in short, or business investment generally.

Capital Goods: These are tangible assets that are used by companies to produce consumer goods and services. In simpler words, it refers to the physical goods required by a company to run its business. For example, a transportation company will have trucks as its capital assets that enable them to run its business and generate revenue. An IT company would have computers that would be its capital assets or goods that help it run its business. Any tangible (or physically quantifiable) good required in assisting the company production is termed as Capital Goods. Hence, Capital Goods can be tools, equipment, raw materials, transportation assets, power supply, etc.

Hence, GFCF is a measure of how much a company invests in acquiring capital assets to maintain or enhance its production capacity and efficiency. Capital Formation is a necessary component for any business or government operation. 

It is called “Gross” because it does not take into account the adjustments to consumption associated with the fixed capital, i.e., depreciation of the fixed capital assets that occur over time due to normal wear and tear. 

GFCF is not a gauge of total investment. It only measures net addition to fixed assets, and all financial assets are excluded along with inventory stocks and other operating costs. Among all these exclusions, the essential exclusion is that of real-estate (land sales and purchases). Real estate transactions only mean that land has been only transferred in ownership from one organization to another and is only included when a new land that did not exist before was created and added into the economy.

How can the Gross Fixed Capital Formation numbers be used for analysis?

As the capital goods wear out over time and a decrease in value, companies that cannot afford new capital goods will observe a reduction in production output. Also, a company that plans on expansion would be required to acquire new capital assets to increase its production capacity.

The difference in the Capital Formation figures for different countries reflects the economic development rate and the catch-up process amongst the compared economies. Higher investment rates into capital goods in less developed economies will lead to improved living standards in the long term on account of accelerated economic growth and improved equipment for the workforce with modern technology. 

GFCF is, in a way, a measure of how much of the revenue is invested back into its growth. The higher the investment into its growth, the more accelerated growth the economy undergoes in the long-run. Of course, when a portion of the revenue goes back into the business itself, it leaves lesser revenue for the shareholders or the business owners in the short run, but it pays off in the long run.

Changes in GFCF is indicative of fluctuations in business activity, business confidence, growth pattern. During economic uncertainty or a recession, business investment is reduced, as decreased revenue is consumed for immediate needs and maintenance operations. On the other side, during times of consistent economic growth and stable market, there is a general increase in GFCF as it is more likely to yield favorable returns in the future. It is less risky to invest in a stable market environment.

The below snapshot of the GFCF for the United States establishes our analysis point above:

Impact on Currency

GFCF is a proportional macroeconomic indicator. It is very suitable for macroeconomic analysis and is more suited to the regional or international level analysis of market conditions. While the increase in the GFCF figures is good for the economy in the long run, it is an especially useful indicator for long term traders and investors. It is not a very reliable measure for short-term currency market volatility assessment.

It is a quarterly report, and hence, other monthly indicators would be more appropriate for traders looking to stay ahead of the fundamental trends. But this GFCF is a leading indicator for companies, or economic growth both and can act as a double-check for our fundamental analysis.

Hence, in the currency markets, the GFCF figures bear low impact due to the frequency of release, and its long-term trend indicative nature makes it a less favorable indicator for day and swing traders.

Economic Reports

The GFCF figures are macroeconomic indicators and are generally available on the official websites of international organizations like the OECD (Organization for Economic Co-operation and Development), World Bank, or IMF (International Monetary Fund). The reports are released quarterly and annually for most countries, as data becomes available from different countries’ respective reporting institutions.

Sources of Gross Fixed Capital Formation

For the United States, the St. Louis FRED maintains the OECD data of GFCF here

You can find the GFCF data for all the OECD countries on its official website here.

You can find the GFCF list for various economies in the sources mentioned below. 

GFCF – Trading Economics

GFCF – World Bank

GFCF – United Nations

GFCF – IMF

Impact of the” Gross Fixed Capital Formation” news release on the Forex market

In the above section of the article, we defined the Gross Fixed Capital Formation economic indicator, which estimates the value of acquisitions of new or existing fixed assets by the business sector, governments, and households. When this value is subtracted from the fixed assets, we get the Gross Fixed Capital. Investors around the world consider this indicator to be an essential determinant of the GDP of a country. This value is directly reflected in the GDP as it measures the total assets owned by the government and individuals. 

In today’s article, we will be analyzing the impact of Capital Formation on the value of a currency and watch the change in volatility due to the news announcement. For that purpose, we have collected the previous and latest Capital Formation data of Japan as it is shown in the below image. A higher than expected number is considered to be bullish for the currency while a lower than expected number is considered bearish. Let us find out the reaction of the market to this data.

USD/JPY | Before the announcement:

The first pair we will be reviewing is the USD/JPY currency pair, where the above image shows the characteristics of the price before the news announcement. It is very clear from the chart that the market is in a strong downtrend with no retracement. This means the Japanese Yen is stable, and we might not see price retracement until strength comes back in the U.S. dollar.    

USD/JPY | After the announcement:

After the news announcement, volatility increases to the upside, and the price shows signs of bullishness. Since the Japanese Yen is on the left-hand side in this pair, and increasing price signifies the weakening of the currency. The market reacted negatively to the news release due to the weak numbers. However, we see that weakness does not sustain, and the volatility increases to the downside after a couple of candles.

GBP/JPY | Before the announcement:

GBP/JPY | After the announcement:

The above images are that of the GBP/JPY currency pair, where we see in the first image that the market is in a strong downtrend indicating that the Japanese Yen is stable. As there is a lot of bearishness in the market concerning the British Pound, an ideal trade plan would be to take a ‘short’ trade as the price pulls back to a ‘resistance’ or ‘supply’ area. Until then, we cannot position ourselves in the currency pair. After the news announcement, the price initially moves higher, owing to weak Capital Formations data where there was a reduction in the total assets compared to the previous quarter. Due to the selling pressure witnessed from the top, the weakness in Japanese Yen does sustain, and the ‘news candle’ closes with a wick on the upper side. The market fails to retrace even after the news release, and the price continues to move lower.       

CAD/JPY | Before the announcement:

CAD/JPY | After the announcement:

The above images represent the CAD/JPY currency pair, where the characteristics of the chart appear to be similar to that of the above-discussed pairs. The price is violently moving lower before the news announcement with almost no retracement of any kind. We will be looking to sell the currency pair only if we geta price retracement due to the news release or any other release.

After the news announcement, we see the volatility increases to the upside for some time, and the ‘news candle’ closes with some bullishness. The market goes up as a consequence of the below than expected Capital Formation data where there was a reduction in the Capital Formation during the fourth quarter. Cheers!

Categories
Forex Fundamental Analysis

Knowing The Significance Of ‘Gross National Product’ Macro Economic Indicator

Introduction

The two most important metrics of economic growth are the Gross Domestic Product (GDP) and Gross National Product (GNP). Up until 1991 the United States primarily measured its economic growth in terms of the Gross National Product and switched to Gross Domestic Product to make it easy for comparison with other countries, since many other countries were measured through the same.

But in practice, it is always necessary to assess a country’s growth in both the GDP and GNP terms to better understand the overall economic output. Hence, GNP also forms an excellent fundamental indicator of economic growth, almost as important as the GDP.

What is the Gross National Product?

Gross National Product, also called GNP, is the total monetary value of all goods and services produced by the country’s residents and businesses, irrespective of the production location. It means a business earning revenue in a foreign land is included in the domestic country’s GNP. 

Gross National Product defines the economic output based on citizenship, or that country’s native people. Hence, a citizen having an extra income source in any monetary form overseas is factored into the GNP. GNP is higher for countries that have many of their businesses established in a foreign land. Accordingly, any output generated by foreign residents within the country is excluded out from the GNP.

Gross Domestic Product (GDP) v/s Gross National Product (GNP)

It is essential to understand the difference between GDP and GNP during our analysis. GDP and GNP both measure economic output for a given period but differ in how they define the economy’s scope.

Gross Domestic Product is the total value of all goods and services produced by the nation. Here, GDP limits its assessment to the nation’s geographical borders and does not take into account the overseas economic activities of its nationals.

GNP does not restrict itself to the geography of the nation but limits itself in terms of citizenship. GDP does not reflect determinant in nationality. As long as the finished goods and services are within the country’s borders, it is included. On the other hand, GNP will not include any of the domestic borders’ revenue if it is from a foreigner.

The formula for GNP is given as:

GNP = Consumption + Investment + Government + Net Exports + Net Income

In the above equation,

  • Net Exports stands for the difference between the revenue generated from Exports and revenue going out for imports.
  • Net Income stands for the income of domestic residents from overseas or foreign investments minus net income of foreign residents from domestic investments.

The GNP is very indicative of the financial well-being of a country’s nationals and its country-based multinational corporations. From a relative perspective, it does not tell us much about the country’s health, as the GDP does. GNP is a more realistic measure of a country’s Income than its production.

To clarify the role of each metric better, consider the below examples:

Microsoft is the United States-based multinational company. It has a branch in India. The revenue generated from the Microsoft-India branch will be included in the GNP of the United States, but not in India’s GNP. On the other hand, Microsoft-India’s revenue is not included in the GDP of the United States but is included in India’s GDP.

How can the Gross National Product numbers be used for analysis?

It is essential to understand that GNP does not reflect the domestic (geographical basis) conditions well. If a natural disaster were to occur within the United States, then the GNP would not be as affected as the GDP, as the foreign revenue by its residents would not depend on the domestic situations. Hence, GDP is a more accurate measure of economic activity. On the other hand, its citizens’ financial well-being is more accurately measured through GNP than GDP.

GDP is a measure of economic health, while GNP is a measure of a nation’s Real Income. Both are different but related. A country like China, where many companies from other countries have their business has higher GDP than GNP, on the other hand, the United States, which has many of its firms’ production houses outside its land, has higher GNP than its GDP. Significant differences between the GDP and GNP values can be accounted to the openness of the countries to International Trade and Global Markets.

Impact on Currency

The Gross National Product is itself susceptible to the currency and exchange rate. When the currency falls, the Gross National Product increases due to the strengthening of other countries’ currencies where the domestic firms are doing business. The health of the economy is not gauged by the GNP accurately. Currency movements are not as driven by the GNP as they are by the GDP. Hence, it is more critical as a financial indicator than as an economic indicator in our analysis.

It is a lagging and proportional indicator, and hence the impact of the GNP is not as pronounced as the GDP, as all other countries use GDP as their primary measure of economic health. Investors, economists, policymakers, and traders all use GDP primarily over GNP to assess the economy’s current health and direction. Hence, it is a low impact indicator of our fundamental currency analysis.

Economic Reports

For the U.S., the Bureau of Economic Analysis releases quarterly reports of the Gross Domestic Product, which contains the GNP information. The St. Louis FRED consolidates the same data and maintains it on its website.

Sources of Gross National Product

The St. Louis FRED website holds the GNP data that is very easy to access and analyze, and the link is here.

GNP data for various countries can be obtained here

Impact of the “Gross National Product” news release on the Forex market

In the above section of the article, we defined the Gross National Product (GNP) and described the analysis method. We will extend our discussion and understand the impact of the Gross National Product news announcement on the value of a currency. The GNP gives an estimate of the total value of all the final products and services rolled out in a given period utilizing production owned by a country’s residents.

The GNP includes personal consumption expenditures, domestic investment, government expenditure, net exports, and Income from foreign investments. A small distinction between the GNP and GDP is that GDP measures the value of goods and services produced within the country’s borders. In contrast, GNP calculates the value of goods and services produced by the country’s citizens only both domestically and abroad. However, GNP is also one of the most commonly used indicators for measuring the country’s economy.    

In today’s example, we will analyze the impact of the United Kingdom’s GNP on the value of the Great British Pound. The below image shows the GNP in the U.K. during the fourth quarter, which was higher than the third quarter. Let us find out the impact.  

GBP/USD | Before the announcement:

We will begin our discussion with the GBP/USD currency pair to observe the change in volatility after the news announcement. The earlier image shows the state of the chart before the news announcement, where we understand the market is in a strong downtrend, and recently the price seems to be moving upwards. This could be a possible price retracement that could lead to the continuation of the trend and an opportunity. 

GBP/USD | After the announcement:

After the news announcement, the market gets very bullish, and we see a sharp rise in the price. The positive reaction from the market is a result of the upbeat GNP data, which was better than expectations. This brought cheer among the market participants who took the price higher by strengthening the British Pound. We should not take any ‘short’ position until we notice trend continuation patterns in the market.

GBP/CAD| Before the announcement:

GBP/CAD| After the announcement:

The above images represent the GBP/CAD currency pair, where in the first image, we see that the market appears to be moving within a ‘range’ with the price currently at the bottom of the ‘range.’ Before the news announcement, the currency pair is very volatile, suggesting that there is a lot of trading action in this pair. In such high volatile environment, we recommend waiting for the news release and then taking a suitable position in the pair.

After the news announcement, the price suddenly moves higher and volatility expands on the upside. The bullishness in the British Pound is a consequence of the optimistic GNP data, which showed a growth in the economy during the fourth quarter. Since the price is at the bottom of the ‘range,’ one can take ‘long’ in this currency pair with a target until the ‘resistance.’

EUR/GBP | Before the announcement:

EUR/GBP | After the announcement:

The above images are that of the EUR/GBP currency pair, where we see that the market is in a strong uptrend before the news announcement, signifying the enormous amount of strength in the British Pound, since the currency is on the left-hand side of the pair. Depending on the outcome of the news and change in volatility, we will analyze the currency pair accordingly.

After the news announcement, market crashes, so much that the price goes below the moving average. The ‘news candle’ closes, forming a reversal candlestick pattern that could lead to the beginning of a downtrend. The volatility increases to the downside as the GNP data was reasonably good.

We hope you understood what ‘Gross National Product’ is and its impact on the Forex price charts. Cheers!

Categories
Forex Daily Topic Forex Fundamental Analysis

The Impact Of ‘Factory Orders’ News Release On The Forex Price Charts

What are Factory Orders?

Factory orders are the dollar value of all orders received by factories. The U.S. Department of Commerce reports the number of new orders every month. Factory orders are divided into four parts: new orders, unfilled orders, shipments, and inventories. It includes information about durable goods and non-durable goods. Factory orders data is often not very surprising because the report of durable goods orders comes out one or two weeks earlier.

Dividing Factory Orders        

The factory orders data is divided into four sections:

  • New orders, which indicate whether orders are increasing or decreasing
  • Unfilled orders, indicating a backlog in production
  • Shipments, which indicate produced and sold goods
  • Inventories, which indicate the strength of future production

The figures are mentioned in billions of dollars and also as a percent from the previous month and previous year. Factory orders data is often dull, mostly because the durable goods orders come out a couple of weeks earlier, and people have an idea of factory orders for the current month. However, the official factory orders data gives more detailed information on orders estimate and fulfillment.

The factory orders report includes information about both durable and non-durable goods. Durable goods have a life span of at least three years and often refer to items not purchased frequently, such as machines, garden equipment, motor vehicles, and electronics. In contrast, non-durable goods include fast-moving consumer goods such as food, clothes, footwear, medication, and cleaning items.

Investors get an insight into the growing trend of the economy with the help of factory orders report, which largely influences their investment decisions. Factory orders give an early indication of the growth in the economy, and its impact is felt on the equity market.

Analyzing the data

When it comes to the fundamental analysis of a currency pair, it is important to understand how factory orders are analyzed to make proper investment decisions. Factory orders are analyzed by comparing the previous and current readings, where, if we notice a consistent drop in the ‘orders,’ it could signal a slump in the overall demand.

These factory orders are not just used for analyzing one country but also for comparing the economic growth of any two countries. Investors shift their funds to countries where there is a growth in the factory orders, and demand is high. One needs to remember to compare countries with the same economic status. For example, factory orders of a developed country should not be compared with that of a developing nation.

The economic reports

Factory orders are released monthly by the Censuses Bureau of the U.S. Department of Commerce. The full name is “Full report on Manufacturers’ Shipments, Inventories and Orders” but is commonly referred to as Factory Orders. This report usually follows the Durable Goods Reports, which provides data on new orders received from more than 4,000 manufacturers of durable goods.

The factory orders report is more comprehensive than the durable goods report, where it examines the trend within industries. For example, the durable goods report may account for a broad category, such as industrial equipment. In contrast, the factory orders report will provide details about the hardware, software, semiconductors, and raw materials. This lack of information in a durable goods report is attributed to its release speed.

Impact on currency

Factory orders are an important economic indicator. When factory orders increase, the economy usually expands as consumers demand more goods and services. High demand, in turn, requires retailers and suppliers to order more things from factories. This is interpreted as positive for the economy by foreign investors who then invest in the country through the stock market or currency.

An increase in factory orders could also mean that inflation is just around the corner. When factory orders decrease, the economy is usually contracted, which means there is less demand for goods and services, so retailers will not place a lot of orders. When this is reflected in reports, investors tend to have a negative on the economy and think twice before investing in such economies.

Sources of information on Factory Orders 

The factory Orders data is closely watched by investors around the world, which is why the report is immediately available on most of the open-source economic websites and some of the broker’s websites. The official source of information is the U.S. Census Bureau, where it provides statistical information of all the information related to factory orders.

Links to ‘Factory Orders’ information sources

GBP (Sterling) – https://tradingeconomics.com/united-kingdom/factory-orders

USD – https://tradingeconomics.com/united-states/factory-orders

EUR – https://tradingeconomics.com/germany/factory-orders

Factory orders are a key economic indicator for investors and others monitoring the health of economies. It provides information on how busy factories may be in the future. Orders placed in the current month may provide work in factories for many months to come as they will have to work to fill the orders. Businesses and consumers generally place orders when they are confident about the economy.

An increase in factory orders signifies that the economy is trending upwards. It tells investors what to expect from the manufacturing sector, a major component of the economy. The factory orders data often tend to be volatile with revision in the methodology now and then. Hence, investors typically use several months of averages instead of relying too heavily on a single month’s data.

Impact of the ‘Factory Orders’ news release on the Forex market

In the previous section of the article, we understood the factory orders economic indicator and saw how important it is for foreign investors. As defined earlier, it is a report which shows the value of new factory orders for both durable goods and non-durable goods. The survey is usually released a week after durable goods orders report. The report tends to be predictable, with only non-durable goods appearing as the new component compared to the previous report. Thus, investors would have priced in most of the information even before the official release. Still, it causes some volatility in the currency pair during the news announcement.

In today’s lesson, we will analyze the impact of the factory orders news announcement on various currency pairs and witness the change in volatility due to the news release. The below image shows the latest factory orders data of the United States, where it can be seen that the orders were better than expectations but were lower than last time. A higher than expected reading is considered to be bullish for the currency, while a lower than expected reading is considered negative. But, let us find out how the market reacts to this data.

EUR/USD | Before the announcement

Let us start with the EUR/USD currency pair to observe the impact of factory orders on the U.S. dollar. The above image shows the 15 minutes time-frame chart of the currency pair where the market is in a strong uptrend before the news announcement. Recently the price has formed a ‘range,’ and the price is at the top of the ‘range’ at this moment. Technically, this is an ideal place for going ‘short’ in the market, but since a news announcement is due, it is advised not to take any portion before the announcement.

EUR/USD | After the announcement

After the news announcement, the price initially moves higher, but this is immediately sold, and the market erases all the gains. The ‘news candle’ finally closes at the price where it had opened. Therefore, the factory orders data brought about a great amount of volatility in the currency pair, which is evident from the wick on top of the ‘news candle.’ One should wait for the volatility to settle down before taking a position in the market.

USD/CAD | Before the announcement

USD/CAD | After the announcement

The above images represent the USD/CAD currency pair, where we see that the market is extremely volatile before the news announcement, and there is no clear direction of the market. As a point of a tip, it is not advisable to trade in currency pairs where the volatility is more than normal as there are a lot of risks associated with trading in trading such pairs.

After the news announcement, the currency pair gets exceedingly volatile where essentially the price drops greatly, but buyers pressure from the bottom takes the price back to its opening level. Therefore, the factory orders data had a major impact on the pair where the price continued to move lower a few minutes after the news release.

AUD/USD | Before the announcement

AUD/USD | After the announcement

The above images are that of the AUD/USD currency pair, where the price is retracing the overall uptrend of the market. In such market situations, we should be looking for trend continuation candlestick patterns to confirm that the market will continue moving up.

After the news announcement, the price sharply moves higher and leaves a wick on top of the ‘news candle.’ Since volatility is high on both sides of the market during the announcement, we cannot ascertain if the factory orders data was positive or negative for the currency. As the market continues to move higher after the close of the ‘news candle,’ one should look for going ‘long’ in the market a few hours after the news announcement.

This ends our discussion on the ‘Factory Orders’ Fundamental driver. It is crucial to know its impact on the Forex price charts before trading this market. Cheers!

Categories
Forex Fundamental Analysis

Why Understanding ‘Corruption Index’ Is Crucial In Determining Economy’s Health?

Introduction To Corruption Index

The corruption index is a score that is given to the government of a country, which indicates the degree of corruption in the country. The value is assigned from 0 to 100, with 0 indicating high levels of corruption and 100 indicating low levels. The score is given by Transparency International, an organization that tries to stop bribery and other forms of corruption activities in the country. Transparency international started ranking in 1995, and today it scores more than 176 countries and territories.

The Corruption Index focusses on the public sector and evaluates the degree of corruption among public officials and politicians. In highly corrupt countries, the judiciary’s quality and independence are usually low, and official statistics try to underestimate the level of corruption to hide the bitter truth. The international agencies are a valuable alternative source of information to report the extent of illegal practices being done by civil servants and politicians in a given country.

Impact of corruption on the economy  

Most economists view corruption as a key obstacle to economic growth. It is seen as one of the reasons for low income and plays a critical role in generating poverty traps. It prevents economic and legal systems from functioning properly. Other effects are a misallocation of talent or human development, reduction in the incentive to accumulate “capital.”

Corruption hampers development by allowing agents to interfere in the usual functioning of the government. Economists believe that corruption is like a competitive auction; those who want a service, use the power of money to get it, and the result is an inefficient allocation of resources. The resources get used by people who do not deserve or are not meant to use it.

Contrary to this idea, some people argue that corruption ‘greases’ the wheels of development and that foster growth. The main idea is that corruption facilitates beneficial trades that otherwise would not have taken place. In this way, it promotes productivity by allowing individuals in the private sector to correct or avoid government failures of various sorts.

Limitations of Corruption Index

The index has been criticized lately based on its methodology used for ranking countries. Political scientists find some flaws in the way the corruption index is calculated. These flaws include:

  • Corruption data is too complex to be captured by a single source. For example, the type of corruption in rural Michigan will be different from that in the city administration of Chicago, yet the index measures them in the same way.
  • It is seen that the corruption index is influenced by perception about it. It means it is not measured by considering its real value, where the index may be reinforcing existing stereotypes and clichés.
  • The index only measures public sector corruption and ignores the private sector. This means the well-publicized scandals such as the Libor scandal, or the VW emissions scandal were not included in the corrupt segment.

 Analyzing the data

Corruption index is an important economic indicator that most economists and money managers look at before making investments. In recent times, it is making a huge impact on the economic development of a country. Thus, we need to understand how the data is analyzed. By comparing the two countries’ rankings, one can determine which of the two economies is stronger and enjoying investor confidence.

While analyzing the data, it important to keep in mind that economies of the same stature should be compared. We cannot compare the ranking of a developed country with that of a developing country. This is because corruption has a much greater impact on the growth rates of developing countries.

Impact on currency

Public corruption in emerging countries, especially, contributes to currency crises and put a major dent in the development of the country. Corruption acts repel stable forms of foreign investment and leave countries dependent on foreign bank loans to finance growth. Foreign investors refuse to put their money in developing countries where, for example, local bureaucrats accept bribes, and the government has been known to fall prey to businesspersons and builders.

A corrupt government may be undesirable for foreign direct investment (FDI), but it may not be equally disadvantageous when it comes to obtaining loans from international creditors. This is because governments of most countries offer considerably more insurance and protections to lenders than to direct investors. The result is a country with high debts and no foreign investment. Such an imbalance leaves an economy much more vulnerable to currency crises.

Sources of information on Corruption Index

The Corruption Index is published annually by Transparency International since 1995, which ranks countries by their perceived levels of corruption in the public sector. Transparency International is the official agency that keeps track of the corruption activities and wrongdoing of the government, which is reflected in the rankings. However, other economic websites measure corruption based on their parameters and factors. They also provide a statistical comparison of different countries with a clear graphical representation.

GBP (Sterling) – https://tradingeconomics.com/united-kingdom/corruption-index

AUD – https://tradingeconomics.com/australia/corruption-index

USD – https://tradingeconomics.com/united-states/corruption-index

CAD – https://tradingeconomics.com/canada/corruption-index

NZD – https://tradingeconomics.com/new-zealand/corruption-index

JPY – https://tradingeconomics.com/japan/corruption-index

The corruption index is gaining a lot of attention and importance around the world. Corruption decreases the amount of wealth in a country and lowers the standard of living. The economic impact of corruption is measured in two ways, first, the direct impact on the GDP growth rate and, secondly, an indirect impact on human development and capital inflow. The new methodology used by Transparency International uses four basic steps, including the selection of data, rescaling source data, aggregating the rescaled data, and a statistical measure indicating the level of certainty. The data collection and calculations are done by two in-house researchers and academicians.

Impact of Corruption Index’s news release on the Forex market 

The Corruption Perception Index (CPI) scores countries on how corrupt a country’s public sector is perceived to be by experts and business executives. It is a composite index, which is a combination of 13 surveys and assessments. The data is collected and compiled by a variety of reputed institutions.

The CPI is the widely used indicator of corruption all over the world. The corruption index is closely watched by investors who take investment decisions based on the ranking. However, it has a long-term impact on the currency, and the effect may not be seen immediately after the official news release.

In this section of the article, we will observe the impact of the CPI announcement on different currency pairs and witness the change in volatility due to the news release. For that purpose, we have collected the CPI ranking of Japan, where the below image shows Japan’s corruption score and rank in 2019. A score above 50 indicates low corruption levels and that the country’s government is clean.

USD/JPY | Before the announcement

Let us start our analysis with the USD/JPY currency pair and analyze the reaction of the market. The above image shows the daily time frame chart of the forex pair before the news announcement, where we see that the market is moving in a ‘range’ with the price at the top of the range. We will look to take a ‘short’ trade once we get confirmation from the market.

USD/JPY | After the announcement

After the news announcement, volatility increases to the downside, and the price falls drastically. The market reacted positively to the news data, where we see that the Japanese Yen gains strength after the news release. As the corruption index score was positive, traders strengthened the currency, as indicated by the large bearish ‘news candle.

GBP/JPY | Before the announcement

GBP/JPY | After the announcement

The above images represent the GBP/JPY currency pair, where we see that before the announcement, the market is in a strong uptrend, and recently the market has shown signs of reversal. We should be looking to sell the currency pair if the market is not able to move higher. However, we should wait for the news release to get a clear idea of the direction of the market.

After the news announcement, the market reacts similarly as in the previous currency pair, where the price moves lower and volatility expands to the downside. As the CPI data came out to be positive, traders sold British Pound and bought Japanese Yen, thereby strengthening the currency. At this moment, one can take risk-free ‘short’ trade with a stop loss above the ‘news candle.’

AUD/JPY | Before the announcement

AUD/JPY | After the announcement

Lastly, we will find out the impact on the AUD/JPY currency pair. The first image shows the characteristic of the chart before the news announcement, where it appears that the price is moving in a channel. One needs to be cautious before taking a ‘short’ trade as the price is at the bottom of the channel.

After the news announcement, the market gets a little volatile where we see that the price moves in both directions and finally closes near the opening. The overall reaction was bullish for the currency due to the healthy CPI data. The ‘news candle’ is not enough to confirm that the market is going lower as it has lower wick on the bottom, indicating buying pressure.

We hope you understood what ‘Corruption Index’ is and the impact on the Forex market after its news announcement. Cheers!

Categories
Forex Fundamental Analysis

Ease of Doing Business – Comprehending This Macro-Economic Indicator

What is the ‘Ease of Doing Business Index?’

The ease of doing business index was created jointly by two leading economists, namely Simeon Djankov and Gerhard Pohl from the Central and Eastern sector of the World Bank Group. It is an aggregate number that includes different parameters that define the ease of doing business in a country. The ease of doing business (EODB) measures the country’s position in offering the best regulatory practices. Though the World Bank started publishing the reports in 2003, the ranking only started only in 2006.

The EODB study captures the experience of small and medium-sized companies in a country with their regulators and the relationship with their customers, by measuring time, costs, and red tape they deal with. The goal of the World Bank is to provide an objective basis for understanding and to improve the regulatory environment for businesses worldwide.

Methodology

The survey consists of a questionnaire made by a team of experts with the assistance of academic advisors. The questionnaire consists of feedback on business cases that cover topics such as business location, size, and nature of its operations. This survey’s motive is to collect information that is affecting their business and not to measure conditions such as the nation’s proximity to large markets, quality of infrastructure, interest rates, and inflation.

The next step of the data-gathering process involves over 12,500 expert contributors such as lawyers and accountants from 190 countries in the survey to interact with the Doing Business team in conference calls, written reviews, and visits by the global team. Respondents fill out the surveys and provide information relevant to laws, regulations, and different fees charged.

A nation’s ranking is decided after assessing the following factors:

  • Starting a business – idea, time, procedure, and capital required to open a new business
  • Construction permits – permissions, land, and cost to build a warehouse
  • Electricity access – procedure, time and cost needed to obtain an electricity connection from the electricity board
  • Property registration- procedure, time, and cost required to register the warehouse with the local government body
  • Getting credit and loan – the process involved in getting credit from banks, and depth of credit information index
  • Investor protection – the extent of disclosure, liability, and ease of shareholder suits
  • Payment of taxes – tax filing process, preparation of tax filing and number of taxes paid
  • Cross border trading – number of documents required, and cost for import and export
  • Enforcing contracts – procedure, time, and cost to impose debt contract
  • Insolvency process – time, cost and recovery rate under a bankruptcy proceeding

Based on the score obtained in the above sub-indices, a country is assigned a rank in the ease of doing business index. The ease of doing business report is a complete assessment of competitiveness or the business environment. Still, rather it should be considered as a proxy of the regulatory framework faced by the private sector before starting a new business.

The Economic Reports

The ease of doing business reports is an annual report published by a team led by Djankov in 2003. The report is then elaborated by the World Bank Group that basically measures the costs firm is incurring for business operations. The World Bank report is, in fact, an important knowledgeable product in the field of private sector development. It has also motivated the design of various regulatory reforms in developing countries. The study presents a detailed study of costs, time, and procedures that a private firm is subject to before opening the company. This then creates rankings for a country.

Impact on Currency

The Doing Business report is used by policymakers, politicians and development experts, journalists, and, most importantly, the fund managers to understand the easiness of starting a business in the country. More companies mean more jobs, and more jobs mean faster development. Growth in the economy is directly related to the companies’ performance and the opening of new businesses. Therefore, when regulations are eased for starting a business, it contributes to the GDP of the country longer and increases the value of the currency in the international market.

Sources of information on Ease of Doing Business 

The ease of doing business report is one of the most sought reports in the finance industry, so many financial institutions and economic websites give mention ranking of a country after collecting the data from official sources. However, the data published by the World Bank is the most reliable and factual.

Sources

GBP (Sterling) – https://tradingeconomics.com/united-kingdom/ease-of-doing-business

AUD – https://tradingeconomics.com/australia/ease-of-doing-business

USD – https://tradingeconomics.com/united-states/ease-of-doing-business

CAD – https://tradingeconomics.com/canada/ease-of-doing-business

CHF – https://tradingeconomics.com/switzerland/ease-of-doing-business

JPY – https://tradingeconomics.com/japan/ease-of-doing-business

NZD – https://tradingeconomics.com/new-zealand/ease-of-doing-business

Ease of Doing Business report is one of the most discussed issues around the world. The report that is issued by the World Bank gets a lot of attention from the government around the world. For country authorities, it sheds light on regulatory aspects of their business climate. For business representatives, it helps initiate debates and dialogue about reform.

The private sector creates pressure on the respective government to ensure required reforms to indirectly improve the country’s rank in the EODB index. Investors take the decision of investment in a country based on the ranking of that country in the ease of doing business report. From the World Bank’s point of view, it demonstrates an unconditional ability to provide knowledge and resource information. This exercise by the World Bank generates information that is useful and relevant.

Impact due to news release

In the previous section of the article, we understood the definition of ‘Ease of Doing Business’ and the methodology used for ranking a country. Now we will extend our discussion in identifying the impact of the news announcement on the value of a currency. Many case studies tell correlation exists between ease of doing business and FDI flows.

One study finds that judicial independence and labor market flexibility are significantly associated with FDI flows. The number of procedures required to start a business and strength of the arbitration regime both have a significant and robust effect on FDI. Due to these reasons, foreign investors always invest in an economy where business activities can be carried out without any obstructions.

In today’s lesson, we will analyze the impact of ‘Ease of Doing Business’ on different currencies and analyze the change in volatility due to its news release. The below image is a graphical representation of Switzerland’s rank in 2018 and 2019. We see that the country had shown improvement in it’s ranking by two places. Let us find out the reaction of the market to this announcement.

USD/CHF | Before the announcement

Let us start with the USD/CHF currency pair to analyze the impact of the ‘Ease of Doing Business’ announcement. The above image is the daily time frame chart of the currency pair, where we can see that the pair is moving within a ‘range.’ Presently, the price is at a resistance area, which means sellers can push the price lower anytime soon. Therefore, we should be cautious before taking a ‘buy’ trade in this pair.

USD/CHF | After the announcement

After the news announcement, a slight amount of volatility is witnessed, which takes the price higher that results in the formation of a bullish ‘news candle.’ Since the Swiss Franc is on the left-hand side of the pair, a bullish candle indicates bearishness for the currency, and that is becoming weak. We can say that the news announcement a slight negative on the currency.

CAD/CHF | Before the announcement

CAD/CHF | After the announcement

The above images represent the CAD/CHF currency pair, where it appears that the market is moving in a channel before the news announcement. We should be looking to sell the currency pair as the price is at the top of the channel. However, the news announcement shall give us a clear direction of the market. We will not be taking any position before the news release as the news release has a moderate to high impact on the currency pair.

After the news announcement, the price moves a little higher and closes with some amount of bullishness. As the ‘ease of doing business’ was not so encouraging for the economy, traders went ‘short’ in Swiss Franc right after the news release. However, the effect does not last long, and the market collapses a couple of days later.

CHF/JPY | Before the announcement

CHF/JPY | After the announcement

The above images are that of the CHF/JPY currency pair, where we see a strong move to the upside before the news announcement, and currently, the price is at the resistance turned support area. There is a high chance of buyers becoming active at this point; hence, sell trades should be avoided.

After the news announcement, we witness some volatility in the market that takes the price lower but not by a lot. The impact was not great on this currency pair as the country slipped below by two places in the ‘ease of doing business’ ranking. When the impact of news settles down, one should start analyzing the pair technically and take the position accordingly.

That’s about the ‘Ease of Doing Business’ as an economic indicator and its relative impact on the Foreign Exchange market. Cheers!

Categories
Forex Daily Topic Forex Fundamental Analysis

The Importance Of ‘Steel Production’ & Its Impact On The Forex Market

Introduction

Steel is a commodity of paramount importance in today’s international economy. Steel is a staple for the modern economy, and its wide range of usage from the tiniest needles to the largest bridges and tallest buildings makes it an essential commodity for economic prosperity.

Steel is no less critical than Food and Energy for today’s modern world. The far-reaching utility and demand thereof of Steel makes it a good economic indicator for us to understand its impact on exporting and importing economies.

What is Steel Production?

Iron and alloying elements like carbon, chromium, manganese, nickel, and vanadium are added to produce different types of Steel.  Steel industry began in the late 1850s before which it was an expensive commodity that was exclusively used for armors and cutleries primarily.

After the invention of the Bessemer and open-hearth process, Steel Production became easier. By the 1860-70s, the steel industry started to grow rapidly and continues to do so even today. Steel is the most sought after commodity for its durability and strength. It is used for building heavy machinery in the world, like in cars and engines. The natural abundance of Iron and Carbon makes it an affordable commodity for large scale production and supply.

Today Steel is mainly produced through techniques called basic oxygen steelmaking and Direct Reduced Iron (DRI) in an electric arc furnace. Steel’s unique magnetic properties make it an accessible material to recover from the waste for recycling. Steel retains its properties even after undergoing many recycling processes. Hence, it is reusable and economical.

How can the Steel Production numbers be used for analysis?

On a standalone basis, the steel industry directly contributes about 3.8% to the total global GDP as per 2017 research. The indirect impacts meaning the industries that depend on steel production, contribute 10.7% to the global GDP.

The importance of Steel Production apart from its utility is that the supply chain of Steel is very long. The number of dependent industries way more than any other industry. As per 2017’s research by Oxford Economics for every two jobs added in the steel sector, 13 additional jobs are supported through its worldwide supply chain. About 40 million people work in this supply chain of Steel. Indirectly it supported 259 million jobs worldwide and was worth 8.2 trillion dollars in 2017.

Steel is a critical input in the work of many other industrial sectors that produce items essential for the economy to function like hand tools, complex factory machines, Lorries, trains, railway tracks, and aircraft. It is apart from the countless items from day-to-day life like cutlery, tables, cars, bikes, etc. Hence, the economic activity goes beyond the steel-producing locations to multiple sectors across countries. Some of the primary industries that use Steel are Construction, Electronic, Transportation, Automotive, Mechanical Equipment, Energy Production and Distribution, Food and Water, Tools, and Machinery industries.

As the demand for Steel continues to rise, the exporting countries would be at a more significant advantage in terms of economic growth, as evident by below ongoing historical trend.

(Source – worldsteel.org)

Below are the rankings of major economies ranked in terms of exports and imports

(Source – worldsteel.org)

Hence, countries that are net exporters of Steel would be at a higher economic advantage in terms of its own consumption needs and revenue generation through exports. As economies continue to improve the standard of living of their population, the demand for Steel will continue to increase.

Developing economies like China and India have tapped into this market and increased their Steel production over the last decade to achieve export-led-growth. As evident from the above statistics, the developed economies like the United States and the European Union continue to be a net importer while developing economies China and Japan are the leading exporters of the same.

Significant changes in the Steel Production figures will, therefore, have adverse effects on the exporting and importing economy. Hence, Steel Production directly influences economic performance and, therefore, the currency value of that economy.

Impact on Currency 

Steel production is a proportional indicator. An increase in production is beneficial for the economy and thereby for the currency. Steel is a global commodity produced worldwide. Hence, Steel Production figures are useful in identifying the long term megatrends and newly developing Steel industries that will have long term impact.

The short-term fluctuations within the Steel Industry itself would be recorded through other more extensive indicators like Industrial Production (IP) Index in the United States. It is a low impact indicator and is more useful for making long-term sector-wise investment strategies.

Economic Reports

The World Steel Association represents about 85% of the total steel producers across the world. It aims to find global solutions to the environmental challenge to identify trends and bring together regional and national steel producers.

It publishes monthly and annual reports on steel production figures comparing economies in terms of exports, imports, contributions to global GDP on its official website. The monthly reports are usually published in the last week of a month for the previous month.

Sources of Steel Production

The WSA monthly press releases are available here. Statistical figures of global economies are available here and here. The worldwide statistical figures are also available here. The economic impact of Steel is also reported by the American Iron and Steel Institute here.

Impact of the ‘Steel Production’ news release on the Forex market

We saw how Steel Production plays a vital role in an economy with both economic and social impact. Steel is one of the essential materials for the construction of buildings and the manufacturing of many other materials. It creates opportunities in the innovation sector and in research & development projects around the world. Given such a wide range of applications, it is apparent that it has a fair amount of impact on the economy and on the currency. An in-depth analysis revealed that in 2017, the steel industry sold 2.5 trillion worth of products and created U.S. $500 billion value. The steel industry also supports and facilitates 96 million jobs globally.

In this article, we will be analyzing the impact of U.K. Steel Production on the British Pound and witness the change in volatility during the official news announcement. The below image shows the latest Steel Production data in the U.K. produced in the month of April. A higher than expected reading is taken to be bullish for the currency. Contrarily, a lower than expected reading is considered to be negative.

GBP/USD | Before the announcement:

We shall start with the GBP/USD currency pair for examining the impact on the British Pound. In the above price chart, it is clear that the overall trend of the market is down, but recently the price has pulled back quite deep. This is an indication that the downtrend may be coming to an end, and this could turn into a reversal. We will take a suitable position in the market based on the news release.

GBP/USD | After the announcement:

After the news announcement, volatility increases on the downside in the beginning, but later, the price reverses and closes in the green. The buyers push the price higher owing to positive Steel Production data, and the price forms a ‘hammer’ candlestick pattern. The Steel Production news release produced moderate volatility in the currency pair and, lastly, strengthened the British Pound. We need to be careful before taking a ‘buy’ trade as the major trend is down, and the impact of this news is not long-lasting.

GBP/AUD | Before the announcement:

GBP/AUD | After the announcement:

The above images represent the GBP/AUD currency pair. Before the news announcement, the market is in a strong downtrend, and recently the price has pulled back is very gradual in nature. The price action suggests that the market might continue its downtrend and so we will be looking to sell the currency pair after noticing some trend continuation patterns.

After the news announcement, the price reacts mildly to the news data where it nor sharply moves higher nor crashes below. The Steel Production has a slightly positive impact on the pair and lately the volatility to the upside. One should not forget that traders do not give much importance to this data, so one cannot expect the market to continue moving higher. As long as we don’t see trend reversal patterns in the market, an uptrend is far away.

GBP/CHF | Before the announcement:

GBP/CHF | After the announcement:

The above images are that of the GBP/CHF currency pair, where we see that the market is in a downtrend, and lately, the price is has retraced to the ‘resistance’ area. With this, the market has also shown some trend continuation patterns indicating that the downtrend will continue at any moment. If the news release does not change the structure of the chart, this can be an ideal chart pattern for taking a ‘short’ trade.

After the news announcement, the price initially falls lower, but buyers immediately take the price higher, and the candle closes with a wick on the bottom. Although the volatility is low after the announcement, the market is moving on both the directions and produces a neutral effect on the currency pair.

That’s about ‘Steel Production’ and its impact on the Forex market after its news release. If you have any questions, please let us know in the comments below. Good luck!

Categories
Forex Fundamental Analysis

How Does The ‘Private Sector Credit’ Data Impacts The Foreign Exchange Market?

Introduction

Changes in Private Sector Credit and the nominal values can be used to assess the recent economic stability and oncoming trend. It is an indicator of economic health and can be used as a broad metric to know the overall economy’s liquidity and rate of economic growth. Hence, Private Sector Credit can be utilized as an economic indicator for our fundamental analysis to double-check our current assessments and forecasts.

What is the Private Sector Credit?

As the name suggests, Private Sector Credit refers to the financial resources provided to the Private Industry in the form of loans, securities, or other forms of capital by the financial institutions like Commercial banks, finance companies, or other financial institutions, etc.

How can the Private Sector Credit numbers be used for analysis?

Private Sector Credit is affected by the following factors:

Interest Rates – Higher interest rates from financial institutions can discourage private business firms from taking credit. As the credit becomes “expensive,” it drives out the small businesses’ chances of obtaining credit. Only the top-tier institutions may be able to borrow the credit. The Interest Rates that are prevalent in the market is influenced by the Central Bank’s interest rates. In the United States, it is called the Fed Funds Rate. Hence, Central Authorities also play a key role in loan affordability for the private sector.

A loose monetary policy, where Central Banks inject money into the market through open market operations (purchasing bonds, securities), increases the liquidity of the banking sector, which slowly passes on to other sectors of the economy. It decreases the overall Bank Lending Rates and encourages people and businesses to avail credit. It is generally called a dovish approach.

In a tight monetary policy, Central Banks withdraw money from the economy by selling bonds, securities to decrease liquidity. It results in Banks increasing their short-term interest rates. It encourages people to deposit and save more than borrow and spend. It is generally called a hawkish approach.

Credit Rating – Every individual and corporation has a credit rating that tells the worthiness of the candidate for credit. It measures the risk associated with defaulting on the credit. A high credit rating indicates the risk of default is very less, and banks would be willing to lend more, and even in some cases, at a lower rate. A bad credit rating, in most cases, prevents banks from lending, while some institutions may prefer to lend less, or at a higher interest rate than the market rate for the risk associated.

The Credit Rating is backward-looking; it looks at the candidate’s credit history. The good performance of the business is possible in a healthy economy and vice-versa. Hence, past economic health also influences current credit scores. Economic health, business performance, and credit ratings are interlinked, in a feedback loop, one affects the other.

Property Prices – Since Credits are mostly backed by collateral in the form of assets like real estate, or houses, an increase in the property prices creates a wealth effect. It gives a positive sentiment for the financial institutions to lend resources to the private sector, be it consumers or business firms.

Government Backing – When businesses are backed by Government support, lending is also easy. It is more observable in developing economies, where Governments actively support private businesses to boost employment rates, wage growth, and overall economic growth. The government in developing economies may assist in land acquisition for business set up or disburse loans at cheaper rates to the corporate firms.

Increase in Private Sector Credit indicates the financial institutions are confident about the past and current economic conditions and predict that the economic stability shall continue for the near future, at least. When the confidence of financial institutions is deteriorated by inflation fluctuations, unstable markets, banks increase deposit rate interests, to promote saving, thereby increasing their liquidity, and refrain from lending to a significant extent.

Tight lending environments are symptoms of a weak economic growth rate. An increase in the real GDP growth rate has been observed to be followed by increased Private Sector Credit. In turn, this increased credit helps businesses to increase employee staff, improve productivity. It overall increases economic activity and further assists in the GDP growth rate. Hence, both feed-off each other. Slowdowns also feed-off each other, and it accelerates the stagnation or economic downturn. In such cases, the Government or Central Bank intervention is crucial to keep the economy going.

Impact on Currency

In the context of currency markets, Private Sector Credit figures would be a backward-looking indicator (lagging or coincident indicator) as credit is issued if past business performance and current economic conditions are favorable. Hence, Private Sector Credit is a coincident indicator reflective of the current economic conditions.

The Private Sector Credit is not market sensitive, changes in the figures build up over time, and hence, it is a low impact indicator for predicting short-term currency moves within a 1-2 month time horizon. It is useful for assessing a long-term economic trend, though.

Economic Reports

The World Bank maintains the Domestic Credit to Private Sectors in the form of an online database on its official website. Statistics are added once individual countries’ statistics are reported.

For the United States, a weekly report of the Assets and Liabilities of Commercial Banks in the United States is released by the Federal Reserve, from which we can derive the Private Sector Credit information. The report is released every Friday at 4:15 PM.

Sources of Private Sector Credit

For the United States, Private Sector Credit data is maintained by the St. Louis FRED, and that information can be found here. World Bank Private Sector data is available here.

We can find Private Sector Credit statistics for many countries in nominal terms and as percentages of GDP here.

Impact of the ‘Private Sector Credit’ news release on the price charts

Now that we have a clear understanding of the Private Sector Credit economic indicator, we will now watch the impact of the news announcement on various currency pairs and analyze the data. Private loans measure the change in the total value of new loans issued to consumers and businesses in the private sector. To an extent, the allowances will determine the growth of the private sector.

Thus, the higher the government and banks lend to companies, the greater will be the development. The investor considers this data to be an important parameter when making large investment decisions in a currency or in the stock market. However, when it comes to short term movement of the currency, traders don’t pay a lot of attention to the data.

In today’s example, we will be analyzing the Private Sector Credit in the Eurozone and examine the change in volatility in major Euro pairs due to the announcement. A higher than expected reading should be positive for the currency while a lower than expected reading should be negative for the currency.

EUR/USD | Before the announcement:

We shall begin with the EUR/USD currency pair and examine the impact on this pair. In the above image, we see that the pair is in an uptrend, and just before the news announcement, the price has is at its highest point. Depending on the reaction of the market to the Private Sector Credit news, we will be able to take a position in the market.

EUR/USD | After the announcement:

After the news announcement, we witness a lukewarm reaction from the market, and there is hardly any change in volatility. This is because the Private Sector Credit was nearly the same as before with an increase in a mere 0.1%. This cannot be considered as a major boost to the private sector as the government and banks did not increase lending of loans by a vast percentage. As the impact was least, one can trade the pair on the ‘long’ side by joining the uptrend.

EUR/AUD | Before the announcement:

EUR/AUD | After the announcement:

The above images represent the EUR/NZD currency pair, where we see that before the news announcement, the market has displayed reversal patterns, and there is a possibility that the market might turn into a downtrend. If the news announcement does not increase the volatility to the upside and price does not cross above the moving average, one can some ‘short’ positions expecting a further downward move.

After the news announcement, the price moves higher by a tad bit, and the ‘news candle’ displays little volatility. As the price remains below the moving average and impact was not great, one can take a risk-free ‘short’ trade in the market with a stop-loss above the recent ‘high.’

EUR/CHF | Before the announcement:

EUR/CHF | After the announcement:

Finally, we will discuss the impact on the EUR/CHF currency pair. Here, we see that the overall trend of the market is up and recently the price has started moving in a ‘range.’ Before the news announcement, the price is at the bottom of the range, and thus a buying pressure can come back into the market at any moment. As the impact of Private Sector Credit is less, aggressive traders can ‘long’ position in the market as the price is at the lower end of the range.

After the news release, volatility expands on the upside, and the price closes with a huge amount of bullishness. The Private Sector Credit data proved to be very positive for this pair, which resulted in a sharp rise in the price to the higher side. After the close of ‘news candle,’ traders can go ‘long’ with stop loss below the support and a ‘take-profit’ at the resistance of the range. We cannot have a much higher ‘take-profit’ as the impact will not last long.

That’s about ‘Private Sector Credit’ and its impact on the Forex market after its news release. If you have any questions, please let us know in the comments below. Good luck!

Categories
Forex Daily Topic Forex Fundamental Analysis

Importance Of ‘Construction Output’ As An Economic Indicator

Introduction

Construction activity is the beginning phase of an expected economic growth, which is more vividly evident in the developing economies than developed economies. New infrastructures, buildings, renovations are all part of an expanding economy. Construction is an important economic indicator to assess economic health.

What is Construction Output?

Construction Output is the measure of building and civil engineering work in monetary terms. It is the amount of construction work done measured as the money charged to the customers. It refers to the construction work performed by an enterprise whose principal activity is classified as Construction. Since a measure of the amount of work is proportional to fees charged for the activity, it is measured in the domestic currency of the region where the construction activity was undertaken.

Overall, Construction Output is a measure of the amount charged to customers for construction activity by construction companies in a specific period ( monthly, quarterly, annually). The UK Construction Output is based on a sample survey of 8,000 businesses employing over 100 people or having an annual turn over greater than 60 million sterling pounds. The Construction Output excludes the Value Added Tax (VAT) and payments to subcontractors.

The Construction Output data reporting based on sectors, new or existing renovations, seasonal adjustments, volume, value-based, etc. precisely as illustrated for reference below:

(Picture Credits – Ons.gov)

The Construction Output data is also reported in the index format, where the base index period is 2016, for which the score is 100, and subsequent reports would be scored in comparison to this index period. Typically, it is widely discussed in terms of percentage changes concerning the previous month.

How can the Construction Output numbers be used for analysis?

The Construction Output is a significant economic indicator in the United Kingdom, that is closely watched by both private and public sectors, especially by the Bank of England and HM Treasury. The Construction Output figures assist them in policy reforms and economic-decisions. Growth is a process of emergence of new and better things and discarding old inefficient ones. Construction, in this sense, is just that. Construction involves the erection of new buildings, infrastructures, renovations, expansions of existing infrastructures.

Increased Construction Output implies more people employed, better wages in the construction sector, more demand for raw materials for the Construction, etc. The very act of Construction has a ripple effect on the economy.

Secondly, the Construction of corporate infrastructures or commercial structures implies that these buildings will be used for further economic activities. For example, a company doubling its company size is planning to double its staff and correspondingly the business that it generates. Hence, Construction Output figures improvement is indicative of an improvement in many other sectors.

All these improvements correlated with Construction Output also stimulate consumer confidence and encourages consumer spending, which further stimulates the economy and boosts growth. The importance of Construction Output is also evident from the fact that it is taken into account for the compilation of the GDP monthly estimate.

New Orders in the Construction Industry

It is a quarterly report produced by the administrative data provided by the Barbour ABI. Construction Output data reflects immediate short term health of the economy as it accounts for the construction work that has already taken place. Whereas, the New Orders report from the ONS provides more a forward-looking estimate of the potential construction activity in Great Britain.

New Orders are also crucial in gaining insight into the upcoming economic trends. Hence, it is advisable to use the New Orders report in conjunction with Construction Output report data to assess current and ongoing economic trends more precisely. It is a quarterly report. It is also presented as an index report for which the base index period is 2016, i.e., the New Orders score for 2016 is 100, and all subsequent reports are reported in comparison to this index value.

Impact on Currency

The Construction Output is a coincident indicator in the short-run. Still, it can also be used to gauge upcoming economic trends based on the type of Construction Activities are being undertaken. Also, if we take the New Orders report, both together can act as a leading economic indicator.

Construction Output reflects the current economic conditions by showing the value of the Construction Activity that has already taken place every month.  It is a proportional economic indicator, meaning an increase in Construction Output figures is good for the economy and correspondingly for the currency and vice-versa.

Economic Reports

The Construction Output reports are published approximately six weeks after the reference month by the Office for National Statistics (ONS) on its official website.

Monthly Construction Output reports go back to 2010 for the United Kingdom. A derived data set going back to 1997 can be obtained from monthly GDP data sets. The Construction Output reports are available in seasonally adjusted and unadjusted formats, and at current prices and chained volume measures (excludes effects of inflation).

For the United States, the Bureau of Economic Analysis releases GDP by Industry quarterly and annual estimates, which serves as a close or relatable statistic for the Construction Output of the United Kingdom. As such, there is no Construction Output dedicated nationwide statistics in the United States. Hence, GDP by Sector analysis helps us to analyze the Construction Industry’s performance in the United States.

Sources of Construction Output

We can find the latest Construction Output statistics for the United Kingdom can be found below.

For the United States – Gross Output of Private Industries: Construction

Construction Output reports for various countries are available here.

Impact of the ‘Construction Output’ news release on the price charts

By now, we believe that you have understood the significance of Construction Output in an economy, which essentially includes construction work done by enterprises that are used for measuring the growth of the construction sector. It gives an insight into the supply on the housing and construction market. The Construction industry is one of the first to go into recession when the economy declines but also to recover as conditions improve. The Construction Sector has a marginal influence on the GDP of an economy. Thus, investors do not give a lot of importance to the data when it comes to the fundamental analysis of a currency.

In today’s illustration, we will explore the impact of the Construction Output news announcement on different currency pairs and compare the change in volatility. The below image shows the previous, forecasted, and latest data of the United Kingdom, where we see a reduction in total output in the month of March. Let us look at how the market reacted to this data.

GBP/USD | Before the announcement:

The first pair we will look into is the GBP/USD currency pair, where the above image shows the characteristics of the pair before the news announcement. The market is in a strong uptrend and has started moving in a range with the price at the bottom of the range at the moment. Thus, we can expect buyers to show up any time from this point. As economists are expecting healthier Construction Output data, traders can take a ‘long’ position with a strict stop loss below the ‘support.’

GBP/USD | After the announcement:

After the news announcement, the market drops slightly owing to weak Construction Output data, and the volatility is seen to increase on the downside. But since the impact of this news release is less, the effect will not last long on the currency pair, and we cannot expect the market to break key technical levels. This is why the price reacts strongly from the ‘support’ and bounces off. Traders need to analyze the pair technically and trade accordingly.

GBP/AUD | Before the announcement:

GBP/AUD | After the announcement:

The above images represent the GBP/AUD currency pair, where we see that before the news is announced, the market was in a strong downtrend indicating a great amount of weakness in the British Pound. Currently, we can say that the price in the ‘demand’ area and thus we can expect bullish pressure to come back in the market at any moment. It is not recommended to buy the currency pair as the downtrend is dominant, and there are no signs of reversal.

After the news announcement, the price quickly moves up and closes as a bullish candle. In this pair, the Construction Output data get an opposite reaction from the market where the volatility increases to the upside soon after the announcement. Traders can take a ‘short’ position in the market after a suitable price retracement to a key technical level.

EUR/GBP | Before the announcement:

EUR/GBP | After the announcement:

The above charts belong to the EUR/GBP currency pair, where we see that the market is in an overall downtrend before the announcement, and currently, the price is in a retracement mode. Since the British Pound is on the right-hand side of the pair, a down-trending market means the currency is extremely strong. Looking at the price action, we can say that the downtrend will continue and now we need to find the right place to enter the market.

After the news announcement, the price initially goes lower, but the currency gets immediately bought into, and volatility increases to the upside. This was a result of poor Construction Output data were traders bought the currency pair by selling British Pound. As the impact is least, the up move does not sustain, and the downtrend continues.

That’s about ‘Construction Output’ and the impact on its news release on the Forex price charts. Shoot your questions in the comments below, and we would be happy to answer them. Cheers!

Categories
Forex Fundamental Analysis

The Importance Of ‘Government Revenue’ As An Economic Indicator

Introduction

Government Revenue is one half of the Government Budget that will shape the economic growth for the fiscal year. It is closely watched statistic by traders and investors to analyze the policy maker’s behavioral trends, actions, and corresponding economic consequences for the current fiscal year.

What is Government Revenue?

Government revenue is the money received from tax receipts and other non-tax sources by a government that allows the Government to maintain the economy, finance its functions, and undertake government expenditures. The Federal Government receives income through a variety of sources which are as follows:

Taxes

Taxes are the most important source of Government revenue, with various forms of tax income coming to the Government. The personal individual income tax makes a significant part of the tax revenue of the Government. Other forms of tax like business or corporate tax, consumption tax, value-added land tax, tax on city maintenance and constructions, enterprise income tax, resource tax, etc. are other forms in which the Government collects taxes. Taxes are a compulsory payment from the consumers and businesses of the economy without any quid pro quo (i.e., getting nothing in return for tax payments from the Government).

Rates or Rental Incomes

These refer to local taxations. The rates are usually proportional to the rentable value of a business or domestic properties. It can take the form of Government-owned lands and buildings leased out for businesses or organizations.

Fees

These are the income the Government receives for its services. These could include services like public schools, insurance, etc.

License Fees

These are the payments received for authorizing permission or privilege. For example, issuing a building permit, or driving license, etc.

Public Sector Surplus

Revenue generated through sales of goods and services like water connection, electricity, postal services, etc.

Fines and Penalties

This is not intended to generate revenue but to make the public adhere to the law. Examples would include parking tickets or speeding tickets.

Gifts

These are the donations received from non-government members of the country and form a small portion of the Government’s revenue. These are usually received to help the Government during wars or emergencies.

Borrowing

This is the least preferred way to raise capital. The Government can borrow from investors in the form of bonds to finance its operations, and this method, although prevalent, is not preferable.

Below is a snapshot of the Federal Government’s Revenue from various sources:

(Picture Source – Fiscal Treasury)

How can the Government Revenues numbers be used for analysis?

The amount the Government receives in revenues determines how much it can spend. The revenue generated is directly correlated to the GDP. The GDP is directly influenced by how much the Government spends on the economy to spur growth. Both are linked in a feedback loop. By effectively drafting out the Federal Policy for a fiscal year, the Government can increase or decrease their tax revenues.

When the Government increases tax revenues, it may receive more than its fiscal expenditures, but that would burden the consumers and business. When taxes are increased, it leaves less money for people to spend, and people prefer to save than invest. It slows down the economy, and correspondingly a deflationary environment begins to start, and the economy risks going into a stagnation or worse a recession. During these times, the GDP will fall, and correspondingly the next fiscal year’s revenue would decline.

When the Government cuts back on taxes levied, the revenue decreases for the Government, but consumers and businesses would have more disposable income on their hand, which would encourage spending and thus stimulating the economy. It would keep the GDP growth positive and maintain a reasonable inflation rate. Consequently, this leaves little room for Government expenditures. When the expenditure is low, the stimulus is low, which results in a slowdown in the economic activity in the next business cycle.

Hence, Government Revenue and Government Expenditure both are two levers that have to be carefully adjusted to achieve an optimal balance for the healthy functioning of the economy. Too much spending with little revenue results in deficits that piles up debt burden in the long run. Too much revenue with little spending slows down the economy.

In recent times, most of the developed economies’ Governments have been failing to maintain steady growth without low tax and increased spending that has resulted in substantial deficits for the Government. Hence, monitoring Government revenue and its corresponding expenditures in the fiscal policy has become essential for traders and investors in the recent times, as the deficits increase Sovereign Credit Risk (defaulting on debt), or threaten the economy into a recession.

Impact on Currency

In an ideal situation, where a Government has zero debt and has a balanced budget (taxes and spending equal) would contribute to a steady and stable economy. An increase in tax revenues would indicate high GDP prints indicating a growing economy.

But in the real world, most of the Governments are debt-ridden, and an increase in tax revenues means the burden on the citizens and businesses,  which deflates the economy as it takes money out of the economy the currency appreciates and vice versa. Hence, Government revenue is a proportional indicator where decreased revenue deflates the economy and currency appreciate in the short-run (for the fiscal year) and vice versa.

More importantly, Government Revenue is half of the equation, what the Government spends on is the second half. It is, therefore, beneficial to keep both figures in consideration to assess economic growth in the near term.

Economic Reports

For the United States, the Treasury Department releases monthly and annual reports on its official website. The treasury statements detailing the Fiscal Policy containing Government revenue and expenditures are released at 2:00 PM on the 8th business day every month. The World Bank also maintains the annual Government Revenue and Spending data on its official website, which is easily accessible.

Sources of Government Revenues

United States Monthly Fiscal Policy statements can be found below.

Monthly Treasury Statement – United StatesGovernment Revenue as a percent of GDP

We can find Government Revenues for the OECD countries below.

Government Revenues – OECDWorld Bank – Government Revenue data

We can find the monthly Government Revenue statistics of world countries here –

Trading Economics – Government Revenues

Impact of the ‘Government Revenues’ news release on the price charts

After getting a clear understanding of the Government Revenue economic indicator, we will now extend our discussion and find the impact it makes on various currency pairs. The revenue of a government is used for multiple reasons, that directly or indirectly facilitates the growth of the country. Revenue is basically the amount of money that is brought into the Government’s kitty through various activities.

These revenues are received from taxation, fees, fines, inter-government grants or transfers, security sales, resource rights, as well as any other sales that are made. However, investors believe that the data does not have a major impact on the currency and is not of great value when it comes to fundamental analysis.

Today, we will be analyzing the impact of Government Revenue data of Brazil on the Brazilian Real. We can see in the snapshot below that the Brazilian Government received less revenue in the month of March compared to its previous month. A higher than expected reading should be taken as positive for the currency while a lower than expected reading is taken as negative. Let us find out the reaction of the market.

Note: The Brazilian Real is an illiquid currency, and hence there will be lesser price movement on charts.

USD/BRL | Before the announcement:

We shall start with the USD/BRL currency pair to examine the change in volatility due to the announcement. The above image shows the characteristics of the chart before the news announcement, where we see that the market is in a strong uptrend with gap ups every subsequent day. This means the Brazilian Real is extremely weak, and there is no price retracement until now. Technically, we will be looking to buy this currency pair after the price retraces to a key ‘support’ or ‘demand’ level.

USD/BRL | After the announcement:

After the news announcement, the market moves higher and volatility expands on the upside. The Brazilian Real weakened further as a result of weak Government Revenues data where there was a reduction in net revenues for the current month. Traders bought U.S. dollars after the news release, which took the price much higher. The bullish ‘news candle’ is an indication of the continuation of the trend, but still, we need to wait for a retracement to enter the market.

EUR/BRL | Before the announcement:

EUR/BRL | After the announcement:

The above images represent the EUR/BRL currency pair that shows the state of the chart before and after the announcement. In the first image, it is clear that the market is again in a strong uptrend, and the price has recently broken out of the ‘range.’ Since the market is violently moving up, we should wait for the price to pull back near a ‘support’ area so that we can join the trend. We should never be chasing the market.

After the news announcement, the market reacts positively to the news data, and the price closes as a bullish candle. The increase in the volatility to the upside is a consequence of the poor Government Revenue data, where the Government collected lesser revenue in that month. The news release has a fair amount of impact on the pair that essentially weakened the currency further.

BRL/JPY | Before the announcement:

BRL/JPY | After the announcement:

The above images are that of the BRL/JPY currency pair, where we see that the market is a strong downtrend before the news announcement and is currently at its lowest point. Since the Brazilian Real is on the left-hand side of the pair, a down-trending market signifies a great amount of weakness in the currency. We need to wait for the price retracement to a ‘resistance’ area so we can take a ‘short’ trade.

After the news announcement, the volatility expands on the downside, and the market moves further down. The ‘news candle’ closes with signs of bearishness, and later too, the price continues to move lower. This was the impact of the news on this pair. We should wait for the price to retrace to join the downtrend.

That’s about ‘Government Revenues’ and its impact on the Forex market after its news release. If you have any questions, please let us know in the comments below. Good luck!

Categories
Forex Daily Topic Forex Fundamental Analysis

The Importance of ‘Fiscal Expenditure’ as a Macro Economic Indicator

Introduction

Fiscal Expenditure is one half of the Fiscal Policy that will shape the economic growth for the fiscal year. It is a closely watched statistic by traders and investors to analyze the policy maker’s behavioral trends, actions, and corresponding economic consequences for the current fiscal year.

What is Fiscal Expenditure?

Fiscal Policy

It is a strategy or scheme followed by the Government to manage its tax revenues and allocate those funds appropriately as Government spending to manage economic conditions for a fiscal year. Fiscal Policy is the action plan of a Government that decides how the inflow of the Government from tax revenue is channeled into different Government Spending programs. Fiscal Policy is analogous to Monetary Policy.

Monetary Policy is an economic lever used by the Central Bank of a nation using Money Supply and Interest Rates to influence the economy. Whereas, Fiscal Policy is an economic lever used by the Central Government of a nation using Taxation Policies and Public Spending to influence and manage the economy.

The revenue received through taxes is called Federal Receipts, and Government Spending is called Federal Outlays. The difference between the two is called the Federal Deficit or Surplus. When the spending exceeds the revenue, the Government is said to be running a deficit, and when the revenue exceeds the spending, it is said to be running a surplus.

It is preferable to balance out the spending and receipts for optimal growth. Excess revenue by holding down spending slows down the economy, and excess spending accumulates debt.

Fiscal Expenditure

It is a one-half component of the Fiscal Policy, and it refers to the outlays part of the Fiscal Policy. The proportion of revenues allocated to different sectors within the economy determines the amount of stimulus and support from the Government, helping them become profitable quickly. Fiscal Expenditure is public spending by the Government.

How can the Fiscal Expenditure numbers be used for analysis?

Apart from the mandatory spending like Medicare, Social Security, etc. the remainder of the revenue and the additional debt taken by the Government to invest in public spending to keep the economy vibrant determines the growth rate and GDP print for the year.

The Central Authorities can manipulate the taxation rules to increase its revenue, which generally puts the burden on the citizens. The second lever is the Fiscal Expenditure, where the Central Authorities may decide based on the economic situation to borrow money to finance its Public Spending programs.

When the Government Spending is increased, through forms like, for example, building a bridge. Such a project would increase employment, increase spending as more people are employed, pumping more money into the economy, and thereby making the economy stimulated. The Government can also implement tax cuts, as that leaves more money in the consumer’s hands and encourages spending and hence, stimulating the economy.

Tax Cuts and Fiscal Expenditure are both levers that the Government has to influence the economy. But these are no hard-and-fast guarantees of economic stimulation. The effectiveness of the Fiscal Expenditure lever depends on what the current economy is going through. It is useful for a stagnant economy that has slowed down. Spending acts as a fuel to the fire and rekindles the business environment in the economy, thus keeping the GDP print back on track. As shown below, during recent times, the Government has tried to increase its spending by creating deficits through increased Fiscal Expenditure.

On the other hand, Fiscal Expenditure can be reduced, coupled with increased tax cuts to curb inflation and faster than the normal growth rate. It is a cool down measure used by the Government when the economy is hyper-inflating, which leads to too much money in the economy, and goods and services prices inflate quickly beyond their value. The Government’s Debt also plays a vital role in Fiscal Expenditure. After the mandatory payments, the interest payments for the Debt and Debt itself are what takes a portion of the pie (Government revenue).

The higher the amount dedicated to service interest and debt payments, the lesser the spending for the economy. It leads to a slowdown in the economy, and deflationary conditions start to appear in the economy. When the interest rates are either low or kept low (by suppressing interest rates lower through Central Banks), it leaves a more significant room for spending on public welfare that gains favor amongst the citizens but piles up debt for the future.

In this way, the Government is stuck between a rock and a hard place. A slowing economy and piling debt. It is the case with most developed economies where their spending outstrips their revenue and thereby run large deficits running huge debts that have to be serviced in the future. As the Government keeps stimulating the economy by spending beyond its means, the Government and the country is slowly being cornered into a debt trap that can be avoided through only a massive surge in GDP prints.

The only way to manage debt is to increase revenue through GDP that has proven to be difficult in recent times for most mature economies. Hence, Fiscal Policy and mainly its components revenue and Fiscal Expenditure are being closely watched by investors today to predict economic growth and assess the risk of default by the Governments.

Impact on Currency

Fiscal Expenditure is an inverse leading indicator meaning that the currency appreciates when Fiscal Expenditure depreciates in the short-term. When money is infused into the economy in the form of Fiscal Expenditure, it stimulates the economy, prevents deflation (inflationary conditions), leading to currency depreciation in the short-term.

While the Government chooses to avoid deflation and keep the economy going by paying the price in terms of currency depreciation as people and economy take precedence over the currency.

Economic Reports

For the United States, the Treasury Department releases monthly and annual reports on its official website. The treasury statements detailing the Fiscal Policy containing receipts and outlays are released at 2:00 PM on the 8th business day every month.

Sources of Fiscal Expenditure

United States Monthly Fiscal Policy statements can be found in the below-mentioned sources – Monthly Treasury Statement – United StatesFederal Surplus or Deficit – St. Louis FRED

The monthly Fiscal Expenditure statistics of countries across the globe can be found here.

Impact of the ‘Fiscal Expenditure’ news release on the price charts

After getting a clear understanding of the Fiscal Expenditure fundamental indicator, we will now extend our discussion and discover the impact of the news release on different currency pairs.  Fiscal Expenditure refers to the sum of government expenses, including spending on goods, investment, and transfer payments like social security and unemployment benefits. This indicator is very useful in measuring the steps taken by the Government for the welfare of the country. Investors consider this data to be an important determinant of the growth of the economy.

In today’s lesson, we will be looking at the Fiscal Expenditure of New Zealand that was published on 8th October 2019 and analyze the impact on the New Zealand dollar. The below image shows an increase in government expenditure for the previous fiscal year. A higher than expected number is considered to be positive for the currency while a lower than expected data is considered as negative. Let us find out the reaction of the market to this data.

NZD/USD | Before the announcement:

We will start will the NZD/USD currency pair for examining the change in volatility due to the announcement. In the above chart, it is clear that the market is in a strong downtrend, and recently the price seems to have a retraced near the ‘resistance’ area. Technically, we will be looking to sell the currency pair after the appearance of suitable trend continuation patterns. However, it is possible that the news announcement can cause a reversal of the trend.

NZD/USD | After the announcement:

After the news announcement, the market initially reacts positively to the news data and shows some bullishness, but later the sellers take the price a little lower and close the ‘news candle’ with a wick on the top. The volatility is seen in both the directions of the market, but the price manages to close in ‘green.’ We still cannot say if the positive news outcome will cause as reversal as the price has not indicated any reversal patterns in the market. This is how technical analysis should be combined with fundamental analysis.

GBP/NZD | Before the announcement:

GBP/NZD | After the announcement:

The above images represent the GBP/NZD currency pair, where we see that before the news announcement, the market is in an uptrend, and recently, the price has pulled back to the ‘support’ area. There is a high chance that the price will bounce on the upside from here and continue the trend. Technically, this is an ideal place for joining the trend by going ‘long’ in the market, but depending on the news data, we will decide if we can do so.

After the news announcement, the price falls lower, and volatility increases to the downside, which is the consequence of positive Fiscal Expenditure data. Since the Fiscal Expenditure was increased in that month, traders sold the currency and bought New Zealand dollars, thereby strengthening the quote currency. Now that the price is exactly at the ‘demand’ area, one needs to be very careful before taking a ‘short’ trade.

NZD/JPY | Before the announcement:

NZD/JPY | After the announcement:

Lastly, we discuss the NZD/JPY currency pair and observe the change in volatility due to the announcement. From the first image, it is clear that the market is in a strong downtrend, and presently the price is at its lowest point. Since, at this point, buyers took the price higher last time, we can expect the buyers to activate again. Thus, aggressive traders can take a few ‘long’ positions with strict stop loss.

After the news announcement, the price goes higher in the beginning but immediately comes lower and closes near the opening price. We witness a fair amount of volatility on both sides of the market, and finally, the ‘news candle’ closes, forming a ‘Doji’ pattern. Since the news release did not have any major impact on the currency pair, one can go ‘long’ under such situations.

That’s about ‘Fiscal Expenditure’ and its impact on the Forex market after its news release. If you have any questions, please let us know in the comments below. Good luck!

Categories
Forex Fundamental Analysis

Do You Know That The ‘Car Production’ Data’s News Release Impacts The Forex Price Charts?

Introduction

Car Production figures are used by economists and investors as a measure of wealth per capita. Among all the Industrial Production figures, which covers different sectors, Automotive industry production figures’ implications are different from industries producing essential goods like (Food, daily needs goods). An increase in vehicle production is indicative of an increase in per capita income, and other economic conditions. Hence, individual analysis of Car Production figures can help investors, and economists to analyze economic health, and standard of living in the country.

What is Car Production?

Car Production is the total Auto output of Automative Industries in a given economic region for a specific period. The number of motor vehicles manufactured is assessed and categorized based on the type of vehicle. A typical automotive industry would generally have multiple classes of vehicle manufacturing ranging from 2-wheeler bikes to 18-wheeler trucks. Car Production statistic is the production of Cars (called Auto in the statistics) and excludes Trucks and two-wheeler bikes.

In this statistic, Car Production has a separate and special significance. Consumers make up 66% of the private sector, and businesses make up 34% in the United States. Owning a car is more important to people than owning a house. In today’s mobile world, with different modes of transportation available, the car is still an essential expense for the average public. 85% of the Americans own a car, which indicates its significance in day-to-day life. We cannot deny the importance of having a car for commuting as per our convenience.

How can the Car Production numbers be used for analysis?

In the developing economies like India, the number of households that own a car is just 11% as per a survey in 2016, which is a 200% increase from its previous survey in 2011, where it was only about 5%.

Hence, Car Production can be used to draw multiple conclusions, which are as follows:

Standard of living: As the standard of living increases, more and more people can afford luxury goods. While owning a car might not seem like a luxury, but for the developing economies, it does. Also, the range of cars today that are available for purchase, it mirrors the wealthiness of the economy.

Dependent Industries: A car production typically involves several parts that are obtained from other industries, like the car body requires steel, tires require rubber, etc. Hence, Steel Production figures are influenced by the demand from Car Production figures. One-fifth of American Steel Production and three-fifths of rubber manufactured goes to the Automotive Industry. Machine tools, petroleum refining technology industries, paint, plate-glass industries are all stimulated through the Automotive industry.

Indirect Dependent Industries: Increased Car Production signals more cars or vehicles are going to be on the road, or need to be delivered, which brings business for freight operators, and road construction firms. As traffic increases, Fiscal policymakers intervene and fund road projects to build a better network of highways to solve this issue.

Investors can look at Car Production figures and analyze the stimulus it brings on industries dependent directly or indirectly. For example, a general trend in the local production of Cars increase can signal that a construction company like L &T could obtain a contract for road betterment, or a tire company like MRF could see a spike in their business due to increased demand. The cause-effect analysis can help investors make the right stock decisions.

Car is a convenience and not essential like Food. But it has gained the status of an essential item in developed economies. While the developing economies are also getting there, economists can see the changes in Car Production figures. By doing this, they can understand the change in spending patterns of consumers from saving to purchasing Cars. If these numbers increase, it is an indication of an increase in consumer sentiment, business sentiment, employment, wage growth, an increase in disposable income, or improvement in the standard of living.

In the United States, the Car Production figures are part of the Industrial Production reports. The Industrial Production figures tell the overall macroeconomic picture, about how business production and capacity utilization is increasing but does not tell us what sectors growth are increasing or decreasing and its corresponding implications. Car Production figures, in this sense, paints a better picture.

For example, an increase in Coal production could only imply an increase in exports, which is good for the economy, but an increase in Car Production figures indicate more and more people are coming into the middle-class from lower sections and can afford cars. It implies that the overall standard-of-living is increasing.

Also, the automotive industry is a vital element in many industrialized economies like the United Kingdom, France, Germany, Japan, etc. where healthy amounts of Car Production is essential to maintain International Trade balances.

With more and more emerging economies like China, India, Japan, etc. improving their economic conditions aggressively through export-led growth in the international markets, the overall number of people above the poverty rate is increasing, which would ultimately translate into increasing Car Production and Steel Production figures in the upcoming times. The below plot justifies our conclusions above.

Impact on Currency

Car Production statistic is a proportional indicator; meaning increase or decrease in the statistic is followed by currency appreciation or depreciation, respectively. Although, it is essential to note that Car Production is a lagging indicator as the corresponding increase would have already been implicated through leading and coincident indicators like Consumer, business surveys, or improvement in the Disposable Income figures.

Hence, it is a low impact indicator. It is more useful in the long-term understanding of trends and can help investors with stock-portfolio decisions in the stock market having their stake in the dependent industries, which could be affected by the Car Production figures. It can overall act as a double-check for our fundamental analysis but not as a metric to predict future economic growth.

Economic Reports

The “Industrial Production and Capacity Utilization – G17” reports are published at 9:15 AM every around the middle of the month by the Federal Reserve in the United States on its official website. The reports are in the formats of estimates and revised estimates. Under this section, the report titled “Table 3 Motor Vehicle Assemblies” contains the Autos figures, which we are interested in our analysis.

The International Organization for Motor Vehicle Manufacturers also provides an aggregate summary of vehicles produced on its website.

Sources of Car Production

The monthly Car Production statistics are available on the official website of the Federal Reserve for the United States. The St. Louis FRED website provides a comprehensive list of Industry Production, and Capacity Utilization reports on its website with multiple graphical plots, which are available here. We can also find global Car Production figures for various countries in statistical formats here and here.

Impact of the ‘Car Production’ news release on the price charts

In the previous section of the article, we understood the Car Production economic indicator and saw how investors use it for analyzing the economic state of a country. Car Production numbers are a critical component of industrial growth, which highlights the state of the automation sector of the country. The auto industry contributes 3-3.5% to the overall Gross Domestic Product (GDP) and employs a large number of people across different divisions in the industry. Cars manufacturing is a major contributor to this sector, and thus investors give a reasonable amount of importance to this data.

In today’s example, we will be analyzing the impact of Car Production on British Pound, and the below image shows the percentage fall in total production as compared to the previous year. We see that Car Production dropped by 0.8%, which was slightly better than the previous reading. This may be mainly due to slower demand in the local and foreign markets. Let us look at the market’s reaction to this data.

GBP/USD | Before the announcement:

We will begin our evaluation by analyzing the GBP/INR currency pair. The above image shows the behavior of the pair before the announcement is made. We see that the market is resiliently going up with minimum retracement. This means the British Pound is very strong, or the U.S. dollar is really weak. At this point, we cannot take any position in the market as technically; this would mean chasing the market.

GBP/USD | After the announcement:

After the news announcement, the price rallies further, and volatility expands on the upside. The Car Production data was taken well by the market players who took the price higher and closed the ‘news candle’ with a decent amount of bullishness. As a result, the uptrend gets extended further due to the positive news data. In order to trade the pair, one needs to wait for the price to retrace to the nearest’ support’ and then analyze accordingly.

GBP/NZD | Before the announcement:

GBP/NZD | After the announcement:

The above images are that of GBP/NZD currency pair, where in the first image, we see that the market is in an uptrend, and recently the price has retraced to a ‘support’ area. Technically, this is an ideal place for going ‘long’ in the market with a small stop-loss loss. The volatility, before the announcement, appears to be on the higher side, so conservative traders need to be cautious while trading the currency pair.

After the news announcement, volatility surges, and the price significantly moves higher within no time. This reflects the positiveness in the Car Production data, which was better than last time. After this sharp reversal, traders can take ‘long’ positions with a stop loss below the ‘news candle.’

EUR/GBP | Before the announcement:

EUR/GBP | After the announcement:

Lastly, we shall analyze the impact on the EUR/GBP currency pair and see the change in volatility. Here, before the news announcement, the market is in a strong downtrend with almost no ‘pullback,’ indicating a remarkable amount of strength in the British Pound. Since we only see nothing but red candles, selling at any point would mean chasing the market. From a risk aversion perspective, we should always trade the retracement of a trend and not when the trend itself.

After the news announcement, the market falls further and reacts similarly to the above currency pairs. The positive Car Production data increased the volatility to the downside by further strengthening the British Pound. We will be able to take a sell trade only after the price retraces to the nearest’ resistance’ or ‘supply’ area.

That’s about ‘Car Production’ and its impact on the Forex market after its news release. If you have any questions, please let us know in the comments below. Good luck!

Categories
Forex Fundamental Analysis

Everything About ‘Cement Production’ & Its Importance as an Economic Indicator

Introduction

Cement is a commodity that is likely to never run out of demand any time soon. As buildings get kept on renovated in the developed economies, and significant infrastructures like apartments, independent single-family houses, and corporate company buildings continue to be constructed in the developing economies, Cement is required. Increasing Cement Production figures are suitable for the economy, and if the increase is due to international demand, then it is good for the global economy.

Few commodities like Crude Oil, Iron, Steel, and Cement are very required in the modern economy, and countries that are ahead in the production of these goods have experienced substantial growth. Concrete stands behind water in second place as the most widely consumed resource on the planet. Hence, understanding of Cement Production and its impact on economies can help us understand the macroeconomic picture for better fundamental analysis.

What is Cement Production?

The Cement that we generally refer to is the Portland Cement. Cement is the primary ingredient of concrete used in construction. Cement combines with water, sand, and rock to harden to form a concrete structure that has high strength and durability.

Cement is manufactured through a tightly regulated chemical combination of Calcium, Aluminum, Silicon, Iron, and other ingredients. Cement is made using limestone, shells, and chalk or marl combined with shale, clay, slate, blast furnace slag, silica sand, and iron ore. These together, when heated at high temperatures, form a rock-like substance that is ground into the fine powder that we generally refer to as Cement.

How can the Cement Production numbers be used for analysis?

Cement is an essential ingredient in today’s urban infrastructure. It is used in the construction of homes, buildings, apartments, etc. Hence, every physical structure that we can set our eyes on around us is probably made out of Cement. It is for this very reason Cement stands second after water as the planet’s most consumed resource.

Hence, the demand is virtually inexhaustible, not for the near future, at least. As the emerging economies continue to develop at a pace higher than that of the mature economies, there will be a large section of the global population coming into the middle-class, where invariably demand for housing, expansion of businesses are set to increase.

In the world of Cement Production,  China is miles ahead of any other country, exporting 2,500 million metric tons of Cement in 2014. China has the largest cement industry. China uses this Cement for its construction as well as exporting to other countries. Cheaply available Cement has mostly helped China in its infrastructure improvement.

In the second place, far lies India with about 280 million metric tons output in 2014. Even further lies the United States, with about only 83 million metric tons in 2014.

(Source)

(Source)

Although the United States remains the largest economy in the world, that is going to change, as China and India continue to grow at a pace higher than the USA. The growth rate of India is the highest, while China is close to the United States in GDP terms.

As of 2019, the USA GDP is 21.5 trillion dollars, while China stands second with 14.2 trillion dollars. But it is important to note that China’s growth rate is higher than that of the USA, and if this continues, China will beat the United States. Most emerging economies are achieving their economic growth through exports, and dominating such essential commodities, like Cement, gives the economy an upper hand.

The availability of Cement at low prices helps the erection of commercial infrastructure easy that promotes the ease-of-doing-business factor in the country. As many companies like Apple develop their products in the United States but manufacture them in China, this promotes growth. The availability of infrastructure helps boost the economy to a great extent.

An increase in Cement Production helps developing economies to tap into the global market demand to compete against China for a more significant portion of the world market. For example, Indonesia is improving its share in the global market by providing Cement for as low as just 20 dollars compared to the 34 dollars price tag of China.

Hence, developing economies that can produce Cement commercially can boost their economy through international trade exports. Once a system is established that is efficient, upscaling it to unprecedented levels can boost the economy significantly.

(Source)

Note: Cement Production, although important, comes at the cost of air pollution. Cement Industry is one of the primary sources of Carbon Dioxide (Greenhouse gas) in the atmosphere, which is responsible for global warming. It is also responsible for soil erosion that destroys the top layer of land, which is necessary for agriculture.

An alternative called Green Cement is to replace Cement. It has better functionality, uses fewer resources, and is less damaging for the environment. With environmental issues being a significant concern, a potential shift may occur in the market towards green Cement as the go-to product for construction. Countries that will come up with an efficient way of mass-producing this green Cement at affordable prices can beat the current Cement industries. The only challenges are pricing and lack of availability in large quantities.

Impact on Currency

Cement Production is an economic indicator in our analysis solely based on its importance and demand. It is a proportional indicator, meaning an increase or decrease in its numbers can grow or contract the economy, thereby appreciating or depreciating domestic currency, respectively.

It is a micro-economic indicator, as it does not cover the entire economy’s production and can be closely monitored for countries whose dependency on Cement Production is high, which is more useful for regional level assessment.

In the currency markets, Cement Production values are not macroeconomic indicators and are only useful in microeconomic analysis within the country to predict construction-related growth, as an increase in labor force employment, wage growth, which are generally seasonal.

Economic Reports

The National Bureau of Statistical of China publishes monthly data of its Cement Production on its official website.

We can find global Cement Production data on globalcement.com given in the sources.

Sources of Cement Production

Cement Production – National Bureau of Statistical of China

Global Cement Production – globalcement.com

Cement Production statistics for various countries can be found here

Updates on Cement Industry, in general, can be obtained here

Impact of the ‘Cement Production’ news release on the price charts 

In the previous section of the article, we understood the Cement Production fundamental indicator and saw how it could be used for analyzing a currency. We shall extend this part of the discussion and see the impact it makes on a currency pair when the data is released. We would like to mention that Cement Production is not an important economic indicator when it comes to the fundamental analysis of a currency. Investors don’t consider it to a significant driver of the currency, but it surely impacts the construction segment, as building construction is largely dependent on Cement production and supply. This, in turn, affects the economy.

In today’s example, we will examine the impact of Cement Production on the Indian Rupee and look at the change in volatility to the news release. A higher production rate than before is considered to be positive for the currency, while a lower than the previous production is considered to be negative. The below image shows the graphical representation of Cement Production in India for the last two months. We see that there has been a reduction in total production for the month of February. Let us find out the market reaction.

USD/INR | Before the announcement:

We will first analyze the impact on the USD/INR currency pair. The above image shows the state of the chart before the news announcement, where we see that the overall trend is up, and recently there has been a price retracement to a ‘demand’ area. The buyers have already reacted from the demand area, and the price is on the verge of continuing the uptrend. Since the Cement Production indicator does not a major impact on the currency, traders can take ‘long’ positions and trade with the trend.

USD/INR | After the announcement:

After the news announcement, the price falls and goes below the moving average line. The ‘news candle’ closes with bearishness, indicating the Cement Production data was not lower by a large margin for that month as compared to the previous month. There is little change in volatility due to the news release, which explains the importance of the indicator among traders. Thus, traders should analyze the chart technically and trade based on that.

GBP/INR | Before the announcement:

GBP/INR | After the announcement:

The above images represent the GBP/INR currency pair, where, in the first image, we see that the market is moving within a range and currently is near the top of the range. At this point, one can expect sellers to activate and sell the currency. Since the ‘news announcement’ is a less impactful event, traders can take a ‘short’ position with a stop-loss above ‘resistance.’

After the news announcement, the market reacts positively to the data, and traders take the price lower. The impact of Cement Production was similar to the above pair as we see that traders bought Indian Rupee and strengthened the currency. Thus, it is clear that the market reacted technically (price fall from ‘resistance’) and not much to the news data.

EUR/INR | Before the announcement:

EUR/INR | Before the announcement:

The above images are that of EUR/INR currency pair where we see that before the news announcement, the market is in a strong uptrend, and recently the price has retraced to a ‘support’ area. This is a desirable market condition for going ‘long’ in the market after price action confirmation from the market. As the news data does not have a major impact on the currency, traders should not be worried about high volatility, which is typically observed after news announcements.

After the news announcement, the market moves lower by the bare minimum, and there is hardly any volatility witnessed. The Cement Production data did not create any major impact on the currency pair, where the market remains around the same price even after the news release. Once the market continues to move higher, one can join the trend by taking a ‘buy’ position.

That’s about ‘Cement Production’ and its impact on the Forex market after its news release. If you have any questions, please let us know in the comments below. Good luck!

Categories
Forex Fundamental Analysis

‘Disposable Personal Income’ – Understanding The Macro Economic Indicator

Introduction

Disposable Personal Income, also called DPI, is an economic indicator that can help investors understand the spending and saving patterns of the general population. It is from this data other forms of expenditures and savings are derived. Hence, understanding the changes in the relative disposable income numbers from time to time can help us understand the economic conditions better as part of our fundamental analysis.

What is Disposable Personal Income?

Disposable Personal Income, also called After-Tax Income, is what’s left of an individual’s income after all federal tax write-offs. Consequently, It is the amount people can spend, save, or invest. For example, An employee making 100,000 dollars a year, paying 25% of his income as tax would have to pay 25,000 dollars as tax payment, which leaves him with 75,000 dollars for that year. This 75,000 dollars would be his DPI, or more aptly the After-Tax Income.

Hence, the calculation of DPI is simple; it is just the difference between personal income and income taxes.

Note: The federal government may use the disposable income for further mandatory deductions like defaulted student loans, delinquent child support, or payment of back taxes. Hence, in the broader sense, the DPI would be the amount that is left after tax and other mandatory payments.

DPI is often confused with Discretionary Income, which is the amount that is left when the living expenses are deducted from the DPI. Living expenses are all the necessary expenditures incurred to conduct one’s lifestyle and would typically include rent, water bill, electricity bill, transportation costs, and groceries, etc.

For Example, A video gamer’s discretionary income would go to typically spending on purchasing new games, whereas a music-loving person would spend his discretionary income attending concerts perhaps. During times of recession or high deflationary conditions, the discretionary income takes the hit as it is miscellaneous spending and does not precede importance over taxes and necessary expenditures. Businesses that sell discretionary goods and services take the worst hit and hence are closely watched by investors for signs of recession and recovery.

Economic Reports

The U.S. Department of Commerce: Bureau of Economic Analysis (BEA) releases the DPI numbers every month in the last week for the previous month titled “Personal Income and Outlays” release. The month-on-month numbers are expressed in percentage changes with respect to last month’s figures.

The BEA also releases the other derived metrics from the DPI, like the REAL DPI, which takes inflation into account, and hence it is the inflation-adjusted version of DPI, PCE (Personal Consumption  Expenditure) and REAL PCE reports.

How can the Disposable Personal Income numbers be used for analysis?

The DPI data set goes back to as far as 1929. With such a long-range, the confidence in the numbers is high amongst economists with regards to its reliability. When compared against GDP growth, there is a good correlation between both.

As we can see below, the graphs have a similar trend, the first one is the Real GDP, and the second graph corresponds to the DPI, which are taken from the St. Louis FRED website for reference and illustration here. The shaded region indicates periods of recessions.

We can also see that during recessions, the GDP and DPI flat out from their usual trend and trend sideways or downwards (during more extended recessionary periods).

As DPI shows what the amount left with the individual after deductions are, the numbers can be used to derive other metrics. Economic indicators like Discretionary income, savings rates, Marginal Propensity to Consume (MPC), and Marginal Propensity to Save (MPS).

All these indicators are useful in speculating the direction of money flow, whether it ends up in banks in the form of savings or other people’s hands as part of the expenditure.

A healthy and growing economy would be reflected in the DPI numbers as the people make up the economy. It is important to remember that DPI is a reflection of the present financial situations of employees and hence only shows what the current economic status of the nation is. It is a coincident indicator in this sense and is dependent on macroeconomic factors like the government’s policies, Quantitative Easing, inflation, etc. which direct the money flow. Hence, it is the effect in the cause-and-effect equation. It reflects the results of an action rather than the act itself.

Impact on Currency

A steady increase in the DPI is always good for the economy and, therefore, the currency.  It is a proportional indicator. Low numbers are depreciating, and high numbers are appreciating for the currency.

A strong economy or most developed nation’s populations are expected to have higher DPI numbers relative to other economies, thereby enjoying a higher standard of living as they can spend on goods and services, beyond meeting their necessities.

An oncoming recessionary period would result in stagnant or dip in DPI numbers as people tend to save more when they are uncertain of their financial future.

Sources of Disposable Personal Income Reports

The monthly DPI numbers releases can be found on the official website of the Bureau of Economic Analysis as given below for reference:

Personal Income and Outlays

We can find historical and graphical analysis of the same numbers in the St. Louis FRED website as given below for reference:

Disposable Personal Income – Seasonally Adjusted Quarterly

For a more detailed analysis of the same, you can browse through the below relevant categories:

Personal Income – FRED

You can also find out the pure DPI numbers (not percentages) of other countries here:

DPI Trading Economics

Impact of the ‘Disposable Personal Income’ news release on the price charts

By now, we have understood the definition and significance of the Disposable Personal Income economic indicator. In this section, let’s analyze the impact of this economic indicator on currency and observe the change in volatility.

Personal Income, Disposable Personal Income, and Personal Consumption are announced together, and data of each of them is released along with the Personal Income. This is why we have collected the date and time of the announcement of Personal Income. As we can see below (yellow mark), traders do not give a lot of importance to the Personal Income data, and therefore one should expect moderate to less volatility during the announcement.

For illustrating the impact, we have used the latest Disposable Personal Income data of the United States. It is published by the Bureau of Economic Analysis of the U.S. The release said that Personal Income was increased by $106.8 billion in February, and the Disposable Personal Income (DPI) was increased by $88.7 billion which was 0.5% higher from the previous month. Let us look at the impact of this data on currency pairs.

EUR/USD | Before the announcement:

The above image shows the state of the chart before the DPI data is announced, and we can see that the market is in a downtrend, and recently it has given a retracement. Technically, this is the ideal condition for going ‘short’ in the market, but as the volatility is high, it is better to wait for the actual data rather than trading based on the market expectations. Taking a ‘buy’ in this pair can be risky even if the DPI data is positive for the U.S. economy as the down move is quite strong, and the reversal will not last (DPI is not a high impact event).

EUR/USD | After the announcement:

The DPI announcement induced a fair amount of volatility in the pair, and the ‘news candle’ leaves a long wick on the top indicating high selling pressure. From the reaction, we can conclude that the DPI for the month of February was very positive for the U.S. economy, which made traders buy more U.S. dollars. This sudden increase in volatility to the downside is a confirmation sign that the market will go much lower. Thus, as the price goes below the 20-period moving average, one can take a ‘short’ trade with a stop-loss just above the news candle.

USD/JPY | Before the announcement:

USD/JPY | After the announcement:

Next, we discuss the USD/JPY currency pair, where the behavior of the chart is different from the EUR/USD pair. Even though the chart is in a downtrend, the U.S. dollar is on the left-hand side. Hence, a downtrend indicates weakness in the currency. Just before the announcement, price is at the lowest point from where the market had retraced earlier. This means, irrespective of the news announcement, we can expect some buying strength from here. We cannot position ourselves on any side of the market at this point as technically, there is no supporting reason.

After the DPI data is announced, the market moves higher as a result of good DPI numbers, and the price makes a ‘bullish hammer’ candlestick pattern. But the data was not very upbeat to increase the volatility too much on the upside. As the market does not give clear signs of reversal, we cannot go ‘long’ in the market based on the data.

USD/HKD | Before the announcement:

USD/HKD | After the announcement:

The above images represent the USD/HKD currency pair where the price appears to be moving in a range, and predominantly the trend is down. Just before the announcement, the price is in the middle of the range, and we cannot predict at this point as to where the price will go. We need to wait to see the shift in volatility due to the news release and then have a view on the market.

After the DPI numbers are out, price falls to the bottom of the range, and we see a strong bearish candle. The DPI data proved to be positive for the currency in the above two pairs, but here the market reacted negatively. This could be due to the strength in the Hong Kong dollar or extreme weakness in the U.S. dollar. As the impact of DPI on currency is less, one can ‘buy’ USD/HKD near the ‘support’ with a target near to the ‘resistance.’

That’s about ‘Disposable Personal Income’ and its impact on the Forex market after its news release. If you have any queries, let us know in the comments below. Cheers!

Categories
Forex Fundamental Analysis

Importance Of ‘Housing Index’ In Gauging The Strength Of An Economy

Introduction

Housing Index is a broad and long term metric for investors and traders to judge the Housing Market in a country or specific region. There is a good correlation between the Housing Market, Stock Market, and economic growth. Housing Markets generally reflect the health and strength of the economy. Hence, the Housing Index serves as a pulse check or double-check for traders to affirm their economic assessments.

What is the Housing Index?

It is a measure of changes in the price movement of single-family houses. It generally measures the changes in residential housing prices as a percentage change from an index period (base period). The Housing Price Index for the base period is 100, and subsequent reports measure the change relative to this period.

For example, an HPI of 110 indicates a 10% appreciation in the single-family housing prices in a region. Hence, it is a direct measuring tool for housing price trends and serves as an indirect measurement tool for housing affordability, mortgage default rates, and prepayments, etc.  It is often expressed as change with regards to the previous month in percentage also.

Although different agencies are measuring the Housing trends, the most prevalent is the Housing Price Index by the Federal Housing Finance Agency in the United States. The FHFA HPI is a weighted, repeat sales index. It means it takes Houses that have also been refinanced into account. This data is obtained from reviewing the repeat mortgage transactions on single-family properties that have been securitized by Fannie Mae or Freddie Mac.

The HPI covers the entire 50 states, and also publishes for the nine Census Bureau Divisions, for Metropolitan Statistical Areas (MSA) and Divisions for more specific and detailed analysis.

How can the Housing Index numbers be used for analysis?

Housing Index is a widely used economic indicator by traders and investors. It gives a head check to the economic health of a country or region.

Generally, people buy houses through mortgages. When the Housing Price rises, it indicates that the market or citizens can pay for much higher rates. It indicates that the liquidity of the economy is good.

Secondly, people buy homes using mortgages most of the time, and it indicates the ease of obtaining a loan from banks at cheaper interest rates. It indicates that the bank has enough reserves to dish out mortgage loans at such low rates. It ultimately means the economy has an actively circulating wealth in the system.

Rising Housing Prices are accompanied by wage growth, employment in the construction industry, especially. It also stimulates confidence for the owners of Houses to know that they have a high-value asset with them that generally translates to increased consumer spending. Overall the total demand increases, boosting the economy and resulting in a higher GDP print.

When the Housing Prices fall, it indicates that consumers are less willing to purchase Houses as they are less confident about their future financial security. It can also indicate that banks are also lending at higher interest rates that are not affordable by middle and lower-middle-class families. The Housing Sector slowing down is a reflection of the economy in this sense. Slowdown accompanied by Mortgage defaults can be warning signs for investors, and traders about an oncoming slowdown or recession.

The below graph confirms our analysis as the housing prices fall during recession periods. As it can be seen that the Housing Index is not market sensitive and does not fluctuate to temporary shocks and instead, it has a trend that builds up over a time frame of certain months or years. Hence, it is a better tool for long term trends than a short-term trend.

Impact on Currency

The Housing Price Index is a coincident and lagging indicator in the short run, as it is a consequence of what has already happened in the economy. When the citizens feel confident about their financial security sufficiently, then only would they take a step to purchase a house. Hence, the Housing Price Index is a confirmation of a trend that would have been predicted by the leading economic indicators.

But for investors and traders who are looking for long term trends, the Housing Price Index acts as an efficient tool to assess current market prices and use it to predict the trend.

Potential shifts in the Housing Price Index can move the stock markets. The currency market movement depends on the strength of the economy.

When compared with indicators like Building Permits and Housing Starts, it relates to as a coincident indicator. In the long run, it can be used as a leading indicator to spot the trend that has already begun.

It is a proportional indicator, meaning when the Housing Price Index rises, it has a ripple effect through jobs, wages, and other industries related, and hence increased economic activity translates to higher GDP prints and appreciating currency.

Economic Reports

The Housing Price Index (HPI) is released by the Federal Housing Finance Agency (FHFA). It gets data from Fannie Mae and Freddie Mac, which are Government Sponsored Enterprises (GSE).

It releases monthly and quarterly reports for HPI on its official website. The dates for the subsequent year are already announced and are typically released at 9:00 AM on the specified date.

Many other agencies provide Housing Indices, one such popular one is the S&P’s Case-Shiller Index, which uses a slightly different approach in measuring the Housing Prices.

Sources of Housing Index

The Housing Price Index from FHFA is available here

All the current and previous reports are available here

We can find the different Housing Indices on the St. Louis FRED website here

We can find Housing statistics for various countries in the statistical form here

Impact of the ‘Housing Index’ news release on the Forex Market 

In the previous section, we discussed the House Price Index (HPI) economic indicator, which essentially is a measure of the single-family house prices movement, with mortgages backed by government-sponsored enterprises. This report helps to analyze the strength of the country’s housing market and the economy as a whole. The house price index contributes only a small portion of the GDP of the country. Thus investors do not give much importance to the news release.

In today’s example, we will be exploring the impact of the announcement of the U.S. House Price Index on different currency pairs and witness the change in volatility. A higher than expected number is considered to be positive for the currency, while a lower than expected reading is taken negatively. This report is published by the Federal Housing Finance Agency. The above image shows an increase in the value of the House Price Index from the previous month, which should be positive for the currency. Let us see how the market reacts to this data.

USD/JPY | Before the announcement:

Let’s begin with the USD/JPY currency pair and try to analyze the impact on the pair. As we can see in the above chart, the price is an overall uptrend and recently has retraced to a ‘demand’ area. Looking at the price, we can say that the price might move higher and continue the uptrend, but we need to wait and see if the news announcement causes major changes to the dynamics of the chart.

USD/JPY | After the announcement:

After the news announcement, the price sharply moves higher, and we see a bullish ‘news candle,’ indicating that the House Price Index data was positive for the economy. The volatility, which was quite less before the news release, suddenly increases to the upside after the release. This was a result of the increase in the House Price Index by 0.2% for the current month, which made traders go ‘long’ in the U.S. dollar. This is a confirmation sign that the market will further move up.

USD/CHF | Before the announcement:

USD/CHF | After the announcement:

The above images represent the USD/CHF currency pair where we that before the news announcement, the market is in a downtrend, and currently the price is at the lowest point. This means the U.S. dollar is showing weakness in this pair, or Swiss Franc is strong. When the price is strongly moving lower, it is not recommended to have any ‘buy’ positions as it could be very risky. Thus, it is better to wait for the news release and gain some clarity about the data. Based on the data, we can take a position in the market. After the news announcement, there is a sharp rise in the price and a spike in volatility to the upside. This again came from the fact that the House Price Index news data was better than last time, which brought cheer in the market and made investors buy more U.S. dollars. The bullish ‘news candle’ is a sign of trend reversal that could be extended further.

GBP/USD | Before the announcement:

GBP/USD | After the announcement:

The above images are that of the GBP/USD currency pair, where we see that the overall trend of the market is down, and recently the price has pulled back from its ‘lows.’ Here, since the U.S. dollar is on the right-hand side of the pair, a down-trending implies strength in the U.S. dollar. We will be looking to trade this pair after we see some trend continuation patterns in the market, indicating that the downtrend will continue. After the news announcement, the price falls by a good amount, and the volatility increases to the downside. The bearish ‘news candle’ signifies that the House Price Index news was positive for the economy that took the price lower and increased the selling pressure.

That’s about the ‘Housing Index’ and its impact on the Forex market after its news release. If you have any questions, please let us know in the comments below. Good luck!

Categories
Forex Fundamental Analysis

The Significance of ‘Imports’ Data In Determining A Nation’s Economy

Introduction

Imports are one of the components of International Trade. The Import and Export figures determine whether a country is running a Trade Surplus or Deficit. What and how much a country is importing in contrast to its exports mainly drives economic growth. It is crucial to understand Import’s role in a country’s International Trade Balance and Balance of Payments and its pros and cons.

What is Imports?

The foreign goods and services sold to domestic consumers are called Imports. Goods and Services manufactured in a foreign country consumed by the domestic population all come under Imports. When a country is importing more compared to its exports, it is said to have a trade deficit. A trade deficit is generally bad for the economy as it means it is consuming more than it is earning.

An import is noted as a debit in the Balance of Payments in the Current Account Balance Reports. When a country imports money flows out of the country. An export brings money into the economy. Hence, Import is analogous to an individual’s monthly expenses, and exports are analogous to his income. It is not ideal for us to spend more than we earn for long periods as it could pile up a massive debt from which we may not be able to recover. A country running a trade deficit is no different.

A country needs to borrow capital to finance its excess import or net import (imports minus exports). It is always preferable for mature economies to be a net exporter than a net importer.

A trade deficit is not a bad thing always as countries might be importing raw materials for future projects and constructions whose output is not yet recorded. The United States has continued to be a net importer and has been running a trade deficit since 1975. Hence, what a country is importing and for what purposes is vital to understand its implications on the economy.

How can the Imports numbers be used for analysis?

A country imports generally the goods that they either cannot produce domestically or as cheap as other countries. Countries that naturally do not have the natural resources may import their raw materials from nations that are abundant in it. For example, China imports Iron Ore, which Australia exports for its manufacturing industries.

Countries may also import goods for which labor cost is expensive in the home country compared to other countries. For example, NAFTA agreement shifted Car and Automotive parts manufacturing to Mexico from the United States and Canada due to cheap labor availability.

Countries also often import goods and services in which they do not have a competitive edge in the global market. For example, even though Apple is an American Company, its production of phones is done in China as the production cost is low due to well-established infrastructure for electronic and chip manufacturing industries.

Imports are to be offset by corresponding levels of exports ideally, otherwise end up having a trade deficit which can be harmful in the long run. As the country keeps borrowing, the piling debt slowly starts crippling the economy as much of the revenue goes into servicing interest payments and debt repayments in the long run.

The heavy dependence of an economy on imports from a particular foreign nation or small group of nations can be dangerous as the economy’s function becomes dependent on the trades. It would be more crippling if the Imports are necessities like food or energy. For example, the USA faced an oil shortage and went into recession when OPEC cut its oil supply to the USA.

Imports are subject to trade tariffs and trade agreements. Imported goods and services compete with local produce, and the selling price of the corresponding goods differs based on the import tariffs implemented by the Government.

On the one hand, importing goods at a lower price rather than producing domestically at a higher price seems reasonable to some as it gives consumers goods and services at a lower rate avoiding inflation effects. On the other hand, imports affect the local manufacturing sectors in the same category. Foreign Competition can wipe out local businesses, which can, in turn, slow down the economy.

In the long run, exports stimulate growth while imports impede growth. Hence, Import is a double-edged sword that needs to be handled carefully in conjunction with exports to strike a correct-balance in the Balance of Trade.

Impact on Currency

When a country imports the country pays for it, and hence currency flows out of the country. When a country’s imports outweigh its exports (net importer), the domestic currency is in oversupply in the global market, and hence currency value depreciates.

A sudden surge in imports over exports is followed by currency depreciation and vice-versa. The global FOREX market is self-regulating and adjusts to such shocks, and the Government can intervene to peg their currency higher to reduce the cost of imports. Japan and China are good at winning this type of Currency War games in the global markets where they peg their currency high during imports and low during exports to maximize benefits in their favor.

Economic Reports

Imports form part of a country’s Balance of Trade, which is reported under the Current Account Balance part of the International Balance of Payments Report of the country. The Balance of Payments report is released quarterly and annually for most countries. The Balance of Trade reports are published every month, which consists of Exports and Imports figures.

For the United States, the Bureau of Economic Analysis publishes the monthly Balance of Trade reports on their official website in the first week of every month for the previous month.

Sources of Import Reports

Data related to U.S. Imports can be found here. The World Bank also publishes the World Trade reports of many countries categorized by different sectors in their World Integrated Trade Solution’s official website. We can also get the statistical data of Imports and Exports of various countries from the International Monetary Fund’s official website.

Visual representation of a country’s imports can be accessed here. Below is the illustration of the same. 

Impact of the ‘Imports’ news release on the price charts 

Until now, we have learned all about imports and the different ways it can affect the economy and the currency. Imports offer many benefits to the consumer of the importing nation, such as greater choices, a wide range of quality, and access to lower-cost goods and services. Imports create healthy competition in the domestic market, forcing local producers to improve their quality or by reducing costs. Therefore, if imports are kept at a reasonable level, they can be beneficial to companies, consumers, and the economy. We need to change the method in which the value o trade is measured.

In today’s illustration, we will be analyzing the impact of Imports on different currency pairs and see the change in volatility before and after the news announcement. The below image shows the latest Imports data of the United States, where it says that there has been a reduction in the net Imports from the previous month. Let us find out how the market reacts to this data.

USD/JPY | Before the announcement:

The first pair we will be discussing is the USD/JPY currency pair and where the above image shows the state of the chart before the announcement. We see that the market does not appear to be moving in any single direction, which means there is volatility on both sides, and there is confusion prevailing in the market. Traders need to watch the impact of the news announcement and then take a suitable position.

USD/JPY | After the announcement:

After the news announcement, the price sharply falls lower, and volatility expands on the downside. As there was a reduction in the value of Imports, the market reacted negatively to this data by causing weakness in the U.S. dollar. The long bearish ‘news candle’ is an indication of the continuation of the downward move, and so, one can take a ‘short’ position in the currency after the news release with a stop loss above the recent ‘high.’

GBP/USD | Before the announcement:

GBP/USD | After the announcement:

The above images represent the GBP/USD currency pair, where we see that, in the first image, the market again is not trending in any direction, and currently the price is at the ‘supply’ area. Therefore, we can expect sellers to come back into the market and stimulate selling pressure. Since the impact of Imports data is moderate to high, it is advised to wait for the news release to see what changes it will cause in the price. After the news announcement, there is a sudden surge in the price where the ‘news candle’ closes with a fair amount of bullishness. Since the U.S. dollar is on the right hand of the pair, a rise in the price indicates weakness in the currency. As the Imports were lower, traders increased the volatility to the upside by selling a lot of U.S. dollars. From a ‘trade’ point of view, we will go ‘long’ in the market only after the price breaks the ‘supply’ area and moves higher.

AUD/USD | Before the announcement:

AUD/USD | After the announcement:

The above images are that of the AUD/USD currency pair, where we see that the market is in an uptrend, and at present, it looks like the price on the verge of continuing the trend after a price retracement. The price is currently at the previous ‘high,’ so we can sellers become active at this point. Thus, we should not take any position before the news release. After the news announcement, the price goes higher and closes as a bullish candle. As the Imports are relatively weak, traders sold U.S. dollars and increased the volatility to the upside. This could be a confirmation sign of the continuation of the trend. Aggressive traders can take ‘long’ positions with a stop loss below the recent ‘low.’

That’s about ‘Imports’ and its impact on the Forex market after its news release. If you have any questions, please let us know in the comments below. Good luck!

Categories
Forex Fundamental Analysis

Understanding ‘Manufacturing PMI’ & Its Impact On The Forex Market

Introduction

The Manufacturing Purchasing Manager’s Index is an excellent leading or advanced macroeconomic indicator, which is used widely to predict economic expansion or contractions. It has a variety of applications for investors, economists, traders alike. It is a significant indicator to predict GDP, employment, and inflation in the upcoming periods. Hence, understanding of Manufacturing PMI can be hugely beneficial for a trader’s fundamental analysis.

What is Manufacturing PMI?

The Manufacturing Purchasing Manager’s Index is a survey of about 400 largest manufacturers in the United States of America. The word Manufacturing here implies that the study is associated with the industries that produce physical goods. Non-physical goods come into the category of Services Purchasing Manager’s Index, which is different.

Purchasing Managers in a company are the employees associated with procuring the raw materials, goods, and services that are required for running the company. For example, A car manufacturing company’s Purchasing Manager would typically be in charge of procuring nuts and bolts at the lowest or best prices from the market. The Purchasing Manager’s in this sense have a good idea of what the company requires and during what periods these requirements are set to increase or decrease.

How is the Manufacturing PMI calculated?

The Manufacturing PMI hence is a compilation of the survey answers given by the Purchasing Managers of the largest 300 manufacturing giants in the USA. The questions typically involve asked in the survey are related to month-over-month changes in the New orders, Production, Employment, Deliveries, and Inventories with equal weightage, as shown in the table below:

All the five categories, as seen when putting together, form the PMI. These five components are enough to ascertain a growth or contraction in the business activity of that company.

The Manufacturing PMI rating lies within the range of 0-100, where a score of above 50 indicates an expansion in the economic activity in the manufacturing sector, below 50 indicates contraction and 50 indicates no change in comparison to the previous month.

Economic Reports

In the United States, the Institute for Supply Management widely known in short as ISM releases the Manufacturing Purchasing Manager’s Index every month.

The ISM, established in 1915, is a large non-profit organization in its field. The members of the ISM Business Survey Committee (BSC) receive the questionnaire each month, asking them to identify the monthly changes for each index.

The ISM releases its Manufacturing PMI on the first business day of every month. The data for the Manufacturing sector goes back to 1947.

There are other companies that also publish PMI numbers, and IHS Markit Group is one such company that puts out numbers for the companies outside of the United States. Still, within the United States, the Insitute for Supply Management’s PMI is the most popular.

How can the Manufacturing PMI be Used for Analysis?

The data of ISM Manufacturing Reports on Business or the PMI goes back to 1947 due to which the data is robust and has high levels of confidence in ascertaining economic figures like GDP, inflation and employment, etc.

The Manufacturing sector of the United States makes up 20% of the total GDP, and hence the Manufacturing PMI is a significant economic indicator in that regard. The Manufacturing sector primarily drives the economic activities within the nation as it involves physical goods; hence it affects other dependent industries like transportation, labor force, etc.

The historical correlation between the real GDP and the ISM Manufacturing Data is about 85%, which is pretty good. The main advantage of studying Manufacturing PMI is that it is a leading or advanced economic indicator. It predicts the real GDP with a 12-month time lag, meaning it predicts a year ahead of time the real GDP due to which this index is widely sought after by investors.

A score of 80 and above has been correlated with a 3% average real GDP growth historically. A score of 70-80 correlates with 0-2% GDP growth rate and 55-70 correlates with -3% to 0% real GDP rate. Hence, above 50 indicates the overall economy is growing, and below 50 indicates contraction and possible recession.

Based on the Manufacturing PMI of different sectors, Suppliers can adjust their prices with the market. For example, if a cereal producing company’s Manufacturing PMI indicates expansion, then the crop suppliers can change their prices to a higher level to match the increase in demand and vice versa.

Below is a snapshot of Manufacturing PMI plotted against the real GDP growth rate historically, and we can clearly see the healthy correlation that exists between both. This shows the importance of this leading indicator’s importance in fundamental analysis of traders.

Impact on Currency

Since the United States is the largest economy, the US GDP drives the global GDP. In this sense, monitoring Manufacturing PMI gives us a good clue of the direction of the US economy and the relative direction of other economies. From this perspective, we can ascertain the currency direction also.

The further the score is away from 50 and closer towards 100, the better it is for the economy and resultantly for the currency. Higher scores translate to oncoming currency appreciation periods, while low scores would signal an oncoming recession and currency depreciation period.

A score of 85 and above is a strong signal for improving economic conditions and inflation in the economy.

Sources of Manufacturing PMI Reports

We can monitor the reports on the official website of the ISM. We can also go through the PMI of other countries from the IHS Markit official website.

Impact of the ‘Manufacturing PMI’ news release on the price charts

The Manufacturing Purchasing Manager’s Index (PMI) measures the activity of the purchasing managers in the manufacturing sector. The indicator is particularly important for the manufacturing industry, which measures the growth of that sector; this eventually contributes to the growth of the economy. Therefore, the index has a direct and indirect effect on the economy. When speaking about the impact on the currency, the indicator does not cause a drastic change in volatility, but we do witness some positions being build up in the currency during the announcement.

In this section, we will be analyzing the latest Japanese Manufacturing PMI which was released in the month of March. The below image shows the previous and actual PMI data, where we see an increase in PMI from before. A higher than before PMI reading is considered to be bullish for the currency, while a lower PMI than before is taken to be negative. Let us view the reaction of the market in this case.

AUD/JPY | Before the announcement:

We start our analysis with the AUD/JPY currency pair, and as we can see in the above chart, the market is in an uptrend pointing towards weakness in the Japanese Yen. One of the reasons is that the market is expecting a subdued PMI data this time which is making the pair go higher. The only way to trade this pair is if the PMI data of Japan comes out to be very positive, which could result in a reversal and strength in the Japanese Yen. However, if the data proves to be negative, we cannot join the trend until we get a retracement.

AUD/JPY | After the announcement:

After the PMI numbers are announced, we see a sudden surge in volatility on the upside as the data was negative for the Japanese economy. As the numbers were disappointing, traders sold the Japanese Yen and took the price higher. A strong bullish candle shows the impact of PMI data on the currency pair. From a trading point of view, one cannot enter the market for a ‘buy’ soon after the news release. By doing this, he would be chasing the market, which is against the principles of risk management.

NZD/JPY | Before the announcement:

NZD/JPY | After the announcement:

The above images represent the NZD/JPY currency pair, which again is in a strong uptrend, but the up move is not as aggressive as in the case of the AUD/JPY currency pair. Just before the news announcement, the price appears to be at the ‘resistance’ area, which means if the PMI data comes out to be negative for the economy, we can see a breakout on the upside or if the data is positive, it could result in a short-term reversal.

After the PMI data is released, volatility expands on the higher side, and later the candle closes with a wick. This wick is a result of selling witnessed at ‘resistance.’ Therefore, the Manufacturing PMI data has a similar effect on the currency pair. We can trade the above pair after the price retraces to the resistance turned support area and then going ‘long’ with a strict stop loss.

USD/JPY | Before the announcement:

USD/JPY | After the announcement:

In the USD/JPY currency pair, the characteristics of the chart seem to be different from the above-discussed pairs. Here, the Japanese Yen is showing signs of strength before the news announcement. Thus, a positive PMI data should take the currency lower while negative data might result in an up move. The volatility is seen on both sides of the market. Thus, it is advised to wait for the actual data before taking any action. It is also not advisable to trade in the ‘options’ segment as it is a less impactful event and volatility after the announcement will be ‘low.’

After the announcement is made, the market goes up just by a little, signifying the least amount of volatility. The Manufacturing PMI, even though it was negative for the Japanese economy, it failed to take the price higher as in other pairs, as the impact of it very less. Thus, the small rise in price could be used as an opportunity to join the downtrend.

That’s about ‘Manufacturing PMI’ and its impact on the Forex market after its news release. If you have any questions, please let us know in the comments below. Good luck!

Categories
Forex Fundamental Analysis

What Should You Know About The ‘Manufacturing Production’ Of A Country?

Introduction

Manufacturing Production statistics are a direct measure of current economic activity. It is instrumental for investors to get a correct estimate of current industrial activity. The Manufacturing Production Index also provides the capacity at which the industries are operating at which is useful for Government officials and business owners for planning and optimizing the performance of these industries. For economists, it helps to cut through media propaganda easily as the numbers reveal the real present situations of these industries and help analyze economic performance better.

What is Manufacturing Production?

Manufacturing Production, also called Industrial Production (IP) Index, measures the real or genuine output of the mining, manufacturing, and electric and gas utility industries. Hence, it covers some of the most important industrial sectors that play a significant role in economic growth and society’s sustenance.

Manufacturing Production Index is a measure of current industrial output. The Index’s reference period is 2012, which means that for the year 2012, the IP Index score is 100. All the scores that are published thereafter are in reference to this period. Hence, it is in a way it is a report card for the industrial sector’s final production output. The report also includes capacity utilization statistics that tell us at what percent of maximum capacity are different industrial sectors are operating at.

In the United States, the Manufacturing Production figures are taken from production data of all industries included in the North American Industry Classification System (NAICS) and industries like logging, newspaper, periodical, book, and directory publishing that have been traditionally considered to be Manufacturing.

The individual indices of Industrial Production (IP) are constructed through two sources:

  • Output measured in physical units.
  • The output is inferred from the data on inputs to the production process.

The IP index measures the output of individual industries taking their weightage derived from the proportional contribution of that industry to the combined output of all industries.

How can the Manufacturing Production numbers be used for analysis? 

If we are to be very strict with our analysis, then Manufacturing Production figures are coincident or current indicators when compared against New Orders Figures of the Institute of Supply Management’s Purchasing Manager’s Index.  It is more indicative of the current trend rather than a future trend. A decrease in New Orders is more indicative of future Production while Industrial Production (IP) Index is more current.

Although, since it is a monthly report, some use it as a leading indicator to oncoming economic turns as generally, these indices are indicative of ripple effects through employment, wages, and business activity.

Hence, it is more appropriate to take IP numbers as current economic indicators and use it to verify the fundamental trends that have been predicted by other leading indicators. We can use IP figures to identify whether our predicted trends have started to play out or not.

The data set for the IP index goes back to 1920, and hence it is a very reliable measure of economic activity, as shown above.

Below is the zoomed-in period of IP index, where we can see during the recession the IP index accurately depicts the economic conditions for that period. Through this, we can understand that the IP index is a double check for us to understand the current economic situation correctly. It is a one-for-one measure of economic activity.

Impact on Currency 

The Manufacturing Production Index has a mild impact on the currency market as the ongoing trend in the economy would have been already depicted by other macroeconomic leading indicators.

On the other hand, it does influence investor’s confidence in the different manufacturing sectors that can affect the stock market and correspondingly, resulting in a mild impact on the currency too.

It is essential to keep in mind that the mild impact is because the United States is a mature and developed economy and has a diverse portfolio of exports and imports. It may not be the same case for all countries where individual developing or commodity-dependent economies may heavily depend on the performance of their manufacturing sector. It all comes down to what percentage of GDP does the Industrial Production Index industries make up. The higher the percentage, the higher the impact.

For the United States, the Manufacturing Sector makes up 20% of GDP while the Services Sector drives 80%. The Manufacturing Production Index is a proportional and coincident indicator. Higher production figures lead to increased economic activity and lead to currency appreciation and vice-versa.

Sources of Manufacturing Production

The monthly Manufacturing Production statistics are available on the Federal Reserve’s official website here. The St. Louis website offers a comprehensive list of Manufacturing Production reports, and they can be found here. We can also find global Manufacturing Production figures for various countries in statistical formats here.

Impact of the ‘Manufacturing Production’ news release on the price charts

After getting an understanding of the Industrial Production economic indicator, we will now find out the impact of the news announcement on different pairs and witness the change in volatility due to the release. The development of Industrial Production and machinery output are the main drivers of economic growth.

Economists believe that country’s development and enhanced standards of living are positively correlated with the nation’s industrial activity. The GDP is directly proportional to growth in the economy’s manufacturing sector. Although it is an important determinant of the economy, when it comes to the movement of the currency, traders do not make drastic changes to their positions in the currency based on the data.

The below image shows the latest Industrial Production data of the U.S., where we see that there has been a decrease in production by a whopping 6.2% as compared to the previous month. A higher than expected value is considered as positive for the currency, while a lower than expected is considered negative. Let us look at the reaction of the market to this data.

USD/JPY | Before the announcement:

We will first look at the USD/JPY currency pair and analyze the impact of the Industrial Production data on this pair. In the above image, we see that the market was in a downtrend, and very recently, the price has shown a sign of reversal to the upside. The price action suggests that the market might move higher from here before going down. Since the economists have predicted a lower Industrial Production data, it is advised not to take any ‘short’ positions.

USD/JPY | After the announcement:

After the news announcement, the price initially moves higher due to increased volatility but later loses all the gains and closes in the red. Even though the Industrial Production data was very bad for the economy, the price did not react that bad as expected. We see a neutral response from the market where the ‘news candle’ closes near its opening price. Therefore, we can say that the impact of the news outcome was not great on the currency pair, and the volatility was average.

GBP/USD | Before the announcement: 

GBP/USD | After the announcement:

The above images represent the GBP/USD currency pair, where we see that the market is violently going down before the news announcement. Currently, the price is its lowest point, and there has been no price retracement of any kind. As per the technical analysis, we cannot take any position at this moment, as this would mean chasing the market and, this carries a huge risk.

After the news announcement, we see that that the price goes lower in the beginning, but later buying pressure takes the price higher, and the candle closes with a wick on the bottom. Overall, the volatility increases to the downside after the news release but does not sustain for long. The price continues to move higher one candle after the ‘news candle,’ which implies that Industrial Production does not have a long-lasting effect on the currency.

USD/CAD | Before the announcement:

USD/CAD | After the announcement:

The above images are that of the USD/CAD currency pair where we see that before the news announcement, the market is in a strong uptrend, and here too, there is no price retracement of any sort. This shows that the U.S. dollar is extremely strong. At this point, we cannot take any position in the market as this is against the rules of risk management.

After the news announcement, volatility increases to the upside resulting in further strengthening of the U.S dollar. Despite the fact that the Industrial Production data was really weak, the market does not react negatively to the news data, but rather we see an increase in the price. This might be due to the fact that the news data is of least importance to traders.

That’s about ‘Manufacturing Production’ and its impact on the Forex market after its news release. If you have any questions, please let us know in the comments below. Good luck

Categories
Forex Fundamental Analysis

How Important Is ‘Mining Production’ For a Nation’s Economy?

Introduction

Mining Production is a key economic indicator as the final output of Mining Production is the primary input for many industries. Therefore, it is the core part of many industries’ business activity.

Fluctuations in the Mining Production figures are bound to translate to all the dependent industries that use the Mined resources as input in their production process. The knock-on effect can be many-fold, and hence it is a vital economic indicator for investors, economists, and government authorities.

What is Mining Production?

Mining Production refers to the entire process of searching for, extraction, beneficiation (purification), and processing of naturally occurring minerals from the Earth. Mining is the process of extracting useful minerals by excavating into the Earth as these minerals cannot be produced on the surface. Minerals are essential for running society to a large extent.

Minerals typically drilled can be Coal, metals like Copper, Iron, Zinc, or industrial minerals like limestone, potash, and other crushed rocks. Coal remains one of the most significant sources of energy throughout the world. Metals like Iron, Copper have a wide range of usage in industries, from small chips in computers to construction of giant buildings. Limestone, Sand, and other rocks have used in cement industries, which all contribute to the construction and housing industries.

In the United States, the Mining Production figures are released as part of the “Industrial Production and Capacity Utilization – G. 17” report by the Federal Reserve. This report is also called the Industrial Production Index (IP Index) or Factory Output.

The Mining Production numbers are expressed in index and percentage change formats. The base year for the reference index period is 2012, for which the score is 100. Every month the Mining Production numbers are published according to this index. For example, an index figure of 130 indicates that Mining Production has increased in contrast to 2012 statistics. The percentage change compares the figures to the previous month. It is a seasonally adjusted statistic. The figure below illustrates the Mining figures dating back to 1920.

How can the Mining Production numbers be used for analysis?

Hence, it is apparent that Mining lies at the heart of all industrial activities. A decrease in Mining production can adversely affect all the dependent industries, and correspondingly the effects will pass onto unemployment, layoffs, wages, economic slowdown, etc.

Since the end products of the Mining Industry act as the starting input for many industries, it serves as a leading indicator for the economy. It lies at the very start of the economic activity chain, and the ripple effect through fluctuations in Mining Production figures will effect dependent industries with 1-6 months’ time lag depending upon the nature of dependent business.

Investors, government authorities, and economists extensively use the IP Index report for their purposes. Mining is the extraction of minerals that are essential for the economy; the government monitors and provides the necessary support to improve Mining Production. In 2006, the mining industry alone produced shipments worth 78.65 billion dollars, and that is excluding oil and gas. Coal accounts for 50% of electric power generated in the United States.

Mining Production is susceptible to some of the following:

Resource Availability – Since minerals are non-renewable resources, which means they are exhaustible. Once a region is depleted of the particular resource, search for new mining areas, relocation, and Mining again is expensive to process.

Weather – Bad weather conditions can interrupt Mining Production as it typically involves explosions and heavy drilling equipment. Heavy rains can close down mines and access roads. Lightning can put the massive equipment operations, explosion handling personnel at risk. Strong winds disrupt blasting. High temperatures can affect Mining workers.

Technology – The amount of latest and advanced mining technologies that are available at the disposal of the country determines the Mining Production cost and total output.

Terrain – The type of terrain that needs to be mined can also affect Mining costs and Production levels. Mining Industries are the leading employers at the place of their operation. Mining supports more than 500,000 jobs directly and an additional 1.8 million jobs indirectly through its dependent industries. Hence, wages, employment, economic activity, revenue generation, exports, energy consumption are all affected by Mining Production.

Impact on Currency 

The Mining Production figure is a proportional and leading economic indicator. An increase in Mining production figures translates to stimulated business activity in the dependent industries, higher employment, wages, and improvement in economic activity. It will also generate higher revenue for the nation through exports of Mining Produced goods like Coal, Iron, etc. All this has a positive effect on the currency, and the currency appreciates. The reverse also holds.

Economic Reports 

The Mining Production report is a part of the IP report that is published by the Fed every month. This report is published in the form of estimates with subsequently revised estimates. The first version/estimate is released on the 15th day of every month, and this shows the Mining data of the previous month. This is the major report as it factors in about 75% of the data. The next four estimates account for 85%, 94%, 95% & 96% respectively as the source data becomes available after each passing month.

Sources of Mining Production 

The monthly Mining Production statistics are available on the official website of the Federal Reserve for the United States. The St. Louis FRED provides a comprehensive list of Industry Production, and Capacity Utilization reports on its website with multiple graphical plots. You can find this information here and here. We can also find global Manufacturing Production figures for various countries in statistical formats here.

Impact of the ‘Mining Production’ news release on the price charts

In the previous section of the article, we learned the Mining Production economic indicator and understood it’s significance in an economy. The mining industry is critical to a nation’s economic well-being. It influences the country on a regional and individual level, with significant dependence on the resources under development as well as government policies. The mining industry is today is opening up new opportunities for foreign investments and technical assistance. Mining also impacts employment opportunities and income generation.  Governments and mining companies are working together to achieve these goals.

In today’s example, we will analyze the impact of Mining Production South African Rand and witness the change in volatility because of the news announcement. The below image shows that the Mining Production in South Africa increased 7.5% year-on-year in January 2020, following a 0.1% gain in the previous month and beating market expectations by a huge percentage. Let us see find out how the market reacts to this data after the news release.

USD/ZAR | Before the announcement:

The first pair that will be discussed is the USD/ZAR currency pair. Here, we see that the market is in a strong uptrend before the news announcement, as shown in the above image. As the impact of Mining production is less on the value of a currency, we will wait for the price to retrace near a ‘support’ area and then take a ‘buy’ trade. Until then, we have to watch if the price crashes below or shows signs of reversal.

USD/ZAR | After the announcement:

After the news announcement, the market hardly reacts to the Mining Production data keeping the volatility at the bare minimum. Later we see that volatility increases to the downside, which causes the strengthening of South African Rand. The market shows positively to the news release after the close of the ‘news candle.’ As the Mining Production data was bullish, traders are seen going ‘short’ in the currency pair and strengthening the South African Rand, immediately after the ‘news candle.

ZAR/JPY | Before the announcement:

ZAR/JPY | After the announcement:

The above images represent the ZAR/JPY currency pair, where the first image shows the characteristics of the chart before the news announcement. We see that the market is a strong downtrend, and since the South African Rand is on the left-hand side of the pair, it signifies extreme weakness in the currency. Presently, the price seems to have formed a ‘range,’ and right now is at the bottom of the ‘range.’

Thus, we can expect buyers to get active at any moment. We cannot take any position in the market at this moment. After the news announcement, volatility remains at the same level as before, and the price does not respond to the news data as expected. The ‘news candle’ forms a ‘Doji’ candlestick pattern where the price closes almost at the opening price. Since the Mining Production data does not have a major impact on the currency, traders should analyze the currency pair from a technical perspective and take suitable positions.

EUR/ZAR | Before the announcement:

EUR/ZAR | After the announcement:

The above images are that of EUR/ZAR currency pair, where we see that the market is in an uptrend, and recently the price is within a ‘range.’ Here as well, the South African Rand is showing weakness with no signs of strength at all. Technically, we will be looking to buy the currency pair once the price ‘pullbacks’ to a key ‘support’ or ‘demand’ area.

After the news announcement, the price stays at the same level as before and closes, forming a ‘Doji’ pattern. A bullish reaction to the Mining Production data can be witnessed after the close of the ‘news candle,’ which showed an increase in volatility to the downside and thereby strengthening of the South African Rand.

That’s about ‘Mining Production’ and its impact on the Forex market after its news release. If you have any questions, please let us know in the comments below. Good luck!

Categories
Forex Fundamental Analysis

‘New Orders’ – Everything About This Economic Indicator & Its Impact

Introduction

New Orders are essential for economists, government officials, and investors alike. It is a direct indication of oncoming expansion or contraction in the economy. For investors, decisions regarding investment in different sectors are critical, and New Orders figures are perfect tools to gauge an increase or decrease in economic activities. Hence, understanding this economic indicator can help us predict economic prospects better in our Fundamental Analysis.

What is the “New Orders” number?

The New Orders is not in itself a separate report. Still, it is published as part of an overall report that details the performance of Manufacturing Industries in terms of the previous month’s and current business activity and prospective plans.

The New Orders form the part of the report titled: “Manufacturer’s Shipments, Inventories, and Orders,” which is generally referred to as Factory Orders, published by the United States Census Bureau. It is also called the M3 Survey, which constitutes the New Orders Report that we are interested in. The overall report measures the performance of the industrial sectors by factoring in the total Shipments, New Orders, Order Backlogs, Total Inventory, etc. Hence, M3 Survey is a broad measure of economic conditions in the domestic manufacturing sector.

New Orders are reported in the dollar value of goods and services that have been ordered in advance. In the manufacturing sector, generally, orders are made months ahead of supply so that production can be planned and delivered accordingly. Hence, a New Order is conveying an objective to buy for immediate or future delivery from clients. New Orders report of M3 Survey includes all the manufacturing companies in the United States with more than 500 million dollars of annual shipments and specific selected smaller firms overall.

Also, Orders data for industries that have almost immediate deliveries are not recorded. Only the Orders which are supported by legal binding documents like a letter of intent, or signed contracts detailing booking of orders are included. The New Orders report all the New Orders received, excluding the canceled Orders for the previous month.

Special Consideration:

The word “New Orders” is also a component of the Performance of Manufacturing Index (PMI) and Performance of Services Index (PSI), which are also used to gauge business activity through similar survey-based index development. The New Orders in these statistics are also similar to the one we are discussing in this section and differ slightly in methodology, participants of surveys, surveyors, seasonal adjustments, and specific calculations that are different for Service Industries. These New Orders are different from the ones reported by the Census Bureau. Hence, care must be taken not to confuse with similar terminologies in both surveys.

How can the New Orders numbers be used for analysis? 

In the life cycle of production and consumption of goods and services, New Order is the earliest indicator in the manufacturing sector. In this sense, it is an advanced or leading indicator of an increase in economic activity.

The M3 survey is extensively used by government officials to develop economic, fiscal, and monetary policies. The New Orders serve as a warning sign for the officials to support the manufacturing sector as any significant downturns can lead to economic contractions and even employee layoffs. Politicians are motivated to keep employment rates high to ensure their chances of winning during elections.

As illustrated in the plot of the New Orders graph, the shaded areas indicate a recession period where we can observe a significant decline in the New Orders figures well before the actual recession, which confirms the importance of this economic indicator. It is also important to note that the year to year fluctuations are due to seasonally unadjusted figures.

Impact on Currency

Since New Orders are leading indicators of economic growth, the corresponding impact on the currency may be visible only after a certain period, which can vary from 1 month to 6 months. It is also important to note that the percentage change in New Orders from the previous month is not amplified by inflation and is only due to an increase in New Orders.

It is also essential to understand that the New Orders are seasonal for many industries, and it is vital to take the Seasonally Adjusted figures for a more accurate indication of economic growth.

An increase in New Orders indicates an increase in economic activity, which is good for the country and correspondingly to its currency. Hence, the New Orders figure is a proportional indicator, and a decrease in New Orders for previous months indicates a slowdown or contraction of economic activity.

The influence of investment markets on the economy is significant, and hence investors closely monitor for economic signals through New Orders. A positive change in New Orders translates to a positive change in equity markets too.

Economic Reports

The United States Census Bureau publishes the monthly M3 Survey reports on its official website. The Bureau releases two press releases every month.

The first one is “Advance Report on Durable Goods Manufacturers’ Shipments, Inventories, and Orders,” which is available about 18 working days after every month.

The second one is “Manufacturers’ Shipments, Inventories, and Orders,” which includes durable and non-durable manufacturing and is available about 23 working days after every month.

Sources of New Orders Reports

Census Bureau’s Factory Orders report is available here. For reference, you can find the latest advance report of the Census Bureau here. We can find the New Orders for different economies with statistical representation here. The graphical plot of New Orders is available on the St. Louis FRED official website.

Impact of the ‘New Orders’ news announcement on Forex

Till now, we have discussed the New Orders fundamental indicator and understood it’s significance in an economy. New Orders measures the value of orders received in a given period of time. They are legally binding contracts between a consumer and a producer for delivering goods and services. New Orders help in predicting future industrial output and production requirements. Investors feel that the data does not necessarily gauge the growth in the manufacturing and so they do not give a lot of importance to the data during the fundamental analysis of a currency.

Today, let’s analyze the impact of New Orders on different currency pairs and observe the change in volatility due to the news announcement. The below image shows the New Orders data of Sweden, where we see there has been a huge reduction in the percentage of New Orders compared to the previous month. A higher than expected reading is considered as bullish for the currency while a lower than expected reading is considered as negative. Let us see how the market reacts to this data.

USD/SEK | Before the announcement:

The first pair we will be discussing is the USD/SEK currency pair, where the above image shows the position of the price before the news announcement. It is clear from the chart that the market is in a strong downtrend, and the price is presently at its lowest point. Technically, we will be looking for a price retracement to a ‘resistance’ or ‘supply’ area so we can join the trend. At this moment, we cannot take any position.

USD/SEK | After the announcement:

After the news announcement, the market moves higher initially, but due to the selling pressure from the top, the candle closes almost near its opening price. As the New Orders data was extremely weak for the economy, traders go ‘long’ in the currency and sell Swedish Krona in the beginning. But since the trend is down, sellers push the price lower, and the ‘news candle’ leaves a wick on the top. We still cannot take any position after the news release.

EUR/SEK | Before the announcement:

EUR/SEK | After the announcement:

The above images represent the EUR/SEK currency pair, where the characteristics of the chart are similar to that of the above-discussed pair. The market here too is in a strong downtrend signifying the great amount of strength in the Swedish Krona, as the currency is on the right-hand side of the pair. We can see in the first image that the currency pair is not very volatile, which means there will be additional costs (Spreads & Slippage) when trading this currency pair.

Hence, we should trade this pair if the news announcement ignites volatility in the market. After the news announcement, the price hardly reacts to the news data where it stays at the same point as it was just one candle before. Therefore, the news release does not have any impact on this currency pair, and there is no alteration to the volatility.

SEK/JPY | Before the announcement:

SEK/JPY | After the announcement:

Lastly, we will look at SEK/JPY currency pair and see if there is any change in volatility due to the news announcement in this pair. Before the news announcement, the market is in a strong uptrend indicating strength in the Swedish Krona. In order to join the uptrend, we should wait for the price to pull back at a’ support’ area, as the price is at the highest point, and then take position accordingly.

After the news announcement, the price initially falls lower owing to poor New Orders data, but it bounces exactly from the moving average and closes with a wick on the bottom. Hence, we can say that the news release has some impact on this pair, causing a fair amount of volatility after the announcement.

That’s about ‘New Orders’ and its impact on the Forex market after its news release. If you have any questions, please let us know in the comments below. Good luck!

Categories
Forex Fundamental Analysis

Does The News Release Of ‘Gasoline Prices’ Impact The Forex Market?

Introduction

Despite the advent of alternate and renewable sources of energy, Oil remains the largest consumed non-renewable energy resource on the planet. Even after the Greenhouse effect debates, pollution, etc. we are still using Oil in a big way.

Although a shift has begun, a complete switch out of Oil will definitely take some decades and a lot of technological innovations. Gasoline Price is very closely tied to Consumer Expenditure, and many industrial activities, volatility in Gasoline Prices, affects the economy directly. Hence, understanding of Gasoline Price changes, its causes and consequences are essential for us in assessing macroeconomic indicators like Inflation, Personal Consumption Expenditures, or Consumer Prices Index, etc.

What is Gasoline Price? And Why is it important?

Gasoline is a carbon-based fuel that is extracted from Crude Oil through a process of distillation and refinement. Crude Oil is dark, heavy, and a sticky liquid that is naturally formed inside Earth. It is extracted, boiled to varying degrees, to distill away impurities to obtain purer forms like Diesel, Petrol (or Gasoline), or Fuel Oils, etc. Gasoline is lighter and is more in demand in the market.

As shown below, Oil is still the largest consumed energy source in the world, accounting for about 34% of all energy sources consumed. Gasoline is one of the first products that is obtained from Crude Oil. The general population and many industries depend on Gasoline heavily to conduct their lifestyle. Today almost, every household has a car or bike that requires Gasoline.

Changing Gasoline prices have a direct effect on the general public and dependent industries like Transportation sectors. Increasing Gasoline prices are always followed by a bitter reaction from the public as it increases their daily expenditures, how industries ship goods.

Gasoline prices are dependent on the following critical factors

(Source: gaspricesexplained.com)

Crude Oil Prices: The raw material used for Gasoline production primarily drives the Crude Oil Price as per the United States Energy Information Administration. Crude Oil is available on almost all the continents, except Australia, where it is quite less relatively. Countries like Saudi Arabia, Venezuela have the most abundant reserves of Crude Oil and are essential players in the global Oil market.

The process of extraction is also dependent on terrain where Crude Oil is found. For example, in Canada, the sandpits of Alberta make it challenging to extract Crude Oil that makes it relatively expensive.

Refining: The number of impurities present in the extracted Crude Oil also categorizes the Oil into “sweet or sour Oil.” Sweeter/Lighter Crude Oil contains lesser impurities and hence is easier to refine. The heavy or sour Oil is more abundant and relatively less in demand. The sweet is the more preferred Oil and is the standard when we see Crude Oil pricing. Refining costs vary seasonally as different parts of the world have to follow different mandates on pollution levels, refining technologies available in the regions. Other ingredients like ethanol that are mixed into Gasoline are also minor factors.

Taxes: Taxes add to the Gasoline prices. The Governing body of the country imposes the excise taxes that add to the final consumer price. As of now, on average, all taxes, i.e., federal and local state taxes, included average to 17% of the total Gasoline price.

(Picture Credits: gaspricesexplained.com)

Transportation: Most of the Gasoline is shipped from refineries by pipeline to terminals near consumer regions. It is delivered through tanker trucks to individual gas stations. The price of all this transportation cost and profits are included in the final price. The taxes and transportation costs remain largely constant relative to the Crude Oil price volatility.

Organization of the Petroleum Exporting Countries (OPEC): It is an organization of 12-oil major producing countries that make up 46% of the world’s oil production. They regulate the price of fuel to sustain this non-renewable resource for an extended period.

Speculation: Energy traders speculate Oil prices frequently that drive up or down the Oil prices based on their projected views about the future Oil prices. The volatility is increased due to speculation and tends to create an asset bubble.

How can the Gasoline Price numbers be used for analysis?

There is a positive correlation between Gasoline and Crude Oil prices in general. The dependency on Gasoline, a high growth rate of the emerging countries, increasing world population, etc. all have increased the demand for Gasoline overtime. For now, there is no significant alternative to compete with Gasoline. Other options like Natural Gas, Electric vehicles are in their budding state and would take some years before they can become worthy alternatives.

Gasoline is a daily consumption, a non-durable commodity that is required by every country. There is no country as of now that is entirely Gasoline-independent. Every country uses Gasoline for one or the other purposes as it has 84% fuel efficiency when burnt (meaning 84% of it is converted into energy).

As attempts to significantly switch to alternate sources of energy are being made, there is still some time left before we see renewable alternatives to Gasoline.

Impact on Currency

An increase in Gasoline Prices is reflected in the Personal Consumption Expenditures reports. As fewer people are able to afford highly-priced Gasoline, Industries dependent on Gasoline mainly observe a cut in their profits that slows down their business. To avoid this, they may increase prices of their end product to compensate for this increase, which again inflates the economy further. The rising costs of Gasoline are terrible for the economy and the currency. It leads to price rises lead to currency depreciation.

Lowered Gasoline prices, stimulate consumption, and increases expenditure in other sectors by public and dependent industries. Changes in Gasoline prices due to Crude Oil price changes take about 4-6 weeks to translate. Gasoline prices are lagging indicators for the Energy traders and have a low impact on the Energy trading community. On the other hand, prolonged increases in Gasoline prices has long term depreciating impact on the currency and the economy.

Economic Reports

Gasoline prices are available daily on the internet on many websites. For the United States, The United States Energy Information and Administration releases the weekly Petroleum status report on its official website.

The OPEC’s Monthly Oil Market Report details the significant causes affecting the world Oil Market that is published on the 12-16th of every month on their website.

Sources of Gasoline Prices

Global Oil market prices & News can be found in the below-mentioned sources.

Oil PricesOPEC – Oil Prices and reserves dataOPEC MOMRGlobal Gasoline Prices – Trading Economics | EIA – Weekly

Impact of the ‘Gasoline Prices’ news release on the price charts 

Gasoline Prices have a major role to play went it comes to the development of the nation. Everyone knows that higher Gas Prices will make each of to pay more at petrol bunks, leaving less to spend on other goods and services. It not only has an effect on the public on an individual level, but higher gas prices also have an effect on the broader economy. Economists and analysts also believe that there is a direct correlation between consumer confidence, spending habits, and gas prices. As gas prices decrease, a large percentage of institutional traders feel that the economy is ‘getting better.’ By this, we can say that the announcement of Gasoline Prices have a major impact on the currency pairs and can cause moderate to high volatility in the pair.

In today’s article, we will be analyzing the impact of Gasoline prices of North America on the U.S. dollar. The Gasoline Prices are published on a Weekly, Monthly, and Annual basis by the U.S. Energy Information Administration. They also provide a statistical analysis of the report. The above image shows the weekly retail Gasoline Prices.

AUD/USD | Before The Announcement

We start our analysis with the AUD/USD currency pair, and the above image shows the state of the chart before the Gasoline Prices are announced. The market essentially is moving in a ‘range’ where the price is repeatedly reacting from ‘resistance’ equals ‘support’ area. Also, the overall trend remains to be up. In such a market scenario, it is prudent to wait for the news announcement and then trade based on the change in volatility in the market. As the Gasoline Price economic indicator is a highly impactful event, there can be extreme movements in the market on either side. However, technically, the bias is on the ‘buy’ side.

AUD/USD | After The Announcement

After the weekly Gasoline Prices are released, price drops sharply, and volatility increases on the downside, owing to a decrease in the Gasoline Prices compared to the previous week. As the U.S. dollar is on the right-hand side of the pair, to buy the U.S. dollar, we need to sell the currency pair. This is why we see a fall in the price after the data is announced, which was positive for the U.S. economy. Even though the market reacted to the news release on expected lines, we should not forget that the price is exactly at the bottom of the range. It is not surprising to see buying strength from here, and therefore we should wait for key levels to be broken to trade based on the News.

EUR/USD | Before The Announcement

EUR/USD | After The Announcement

The above images represent the EUR/USD currency pair. Looking at the first image, we can say that the market is in a downtrend that began recently. Since the selling pressure is above average in the pair, a news announcement that is positive for the U.S. economy is favorable for taking a ‘short’ trade in the pair. On the other hand, we can look to ‘buy’ the pair only if the news release is extremely bad for the U.S. economy.

After the announcement is made, the market falls, and what we see is a firm bearish candle. A decrease in Gasoline Prices is considered to be positive for the economy and, thus, the currency, which is why traders sell Euro and buy U.S. dollars. One can sell the currency pair after a retracement of the price to the moving average.

USD/CAD | Before The Announcement

USD/CAD | After The Announcement

Lastly, we discuss the USD/CAD currency pair where before the news announcement, we see that the market is in a very strong uptrend and currently at a place from where the market had reversed earlier. The continuous bullish green candles suggest a great amount of strength in the U.S. dollar. Thus, a negative Gasoline Price indicator data that is bad enough to cause a reversal in the trend is an appropriate situation for going ‘short’ in the pair. Technically, the chart is more supportive of going ‘long’ in the pair.

After the data is released, we see that the price breaks out above the resistance area and closes as a ‘bullish’ candle. Here too, the market reacted similarly to the above pairs based on the robust Gasoline Prices. One should be ‘buying’ this pair only after the price retraces to the moving average and bounces off from the line. In this way, we will be trading along with the trend, and the stop loss will be below the ‘news candle.’

That’s about ‘Gasoline Prices’ and its news release impact on the Forex market. If you have any questions, let us know in the comments below. Good luck!

Categories
Forex Fundamental Analysis

Importance of ‘Consumer Spending’ as an Economic Indicator

Introduction

Consumer Spending is a significant contributor to the annual GDP of an economy. It is released ahead of GDP numbers and hence is widely used by traders and investors alike to make investment decisions. Consumer Spending is what drives the economy mostly. Imagine if consumers stopped spending on anything apart from the basic needs, it would result in the closure of many businesses and services. Hence, understanding the importance and impact of this advanced indicator is crucial for our Fundamental Analysis.

What is Consumer Spending? 

Consumer Spending refers to the amount spent to meet their daily needs and personal expenses. In other words, it refers to the money paid for goods and services by the general public. The products and services can include all that we, as an individual, consume to live our lives. The groceries, the movies, the drinks, the internet, phones, etc. all these are part of our lives that the Consumer Spending measures.

The money we SPEND on CONSUMPTION of goods and services by CONSUMERS is Consumer Spending. A nation in its core is its people, and what those people spend on is what runs the market. What you and I spend on is what will drive the market. Consumer Spending makes up 66% of the total Gross Domestic Product in the United States, and business and government spending contribute to the rest.

Consumer Spending depends on the macro scale on the below vital factors:

Mortgages and Debt: In the United States, almost all the citizens have debt in one form or another, be it student loan, education loan, house mortgage, or healthcare insurances. The more the debt, the lesser the consumer has left for his spending, thereby tightening his pocket on extra expenditures.

Disposable Income: It refers to the remaining part of an individual’s income left after deductions of all federal taxes. It is the difference between the average salary and tax deductions—higher the charges lesser the money available for spending.

Per Capita Income: It tells us the income per individual within the country. Only when the overall income per person is sufficiently large enough to exceed meeting the basic requirements only then will people have a budget for spending. Rising Per Capita Income indicates that the standard of living is improving, which automatically enhances consumer spending.

Income Disparity: The imbalance in the wages of different sections of society is bad for the economy. A sufficiently rich person’s increase in income will not lead to higher spending as he or she will tend to invest or save to accumulate more wealth. Only when the wages of the lower sections of the society increase will the spending increase as they are the ones cutting back on expenditures due to lack of money. Reformation can be brought about in the country if the government focuses more on benefiting the lower sections more than other parts of the society.

Consumer Sentiment: It is the people of the nation who know better than traders and investors about the economic prospects as they are the ones working on the ground and going about their daily routine facing all kinds of situations. Whatever analysts, investors, and traders assess a nation’s economy, it cannot beat the first-hand experience of the people themselves. The Consumer Sentiment tells what the general people feel about the prospects of their jobs, growth, and security.

If a consumer feels his income will increase steadily and is secure, he will tend to spend more now. Conversely, if the consumer is not sure of his job status and not confident about his future employment status, then he or she will tend to save more to meet their needs during times of unemployment. Thereby decreasing spending now and saving more for later.

How is the Consumer Spending Report obtained?

The Bureau of Economic Analysis releases monthly reports on the percentage of changes in the average Consumer Spending titled “Personal Consumer Expenditures.” BEA releases this report at a national level on a quarterly and annual basis. The Bureau of Labor Statistics also releases a report titled Consumer Expenditure Survey in August every year with little variations. They calculate using the statistics form the United States Census Bureau to arrive at this survey report.

Is Consumer Spending important?

It is one of the most significant indicators to predict GDP. It is an advanced indicator meaning it predicts future economic conditions rather than reflecting current or past industrial activities. Since it is a significant driver for the Gross Domestic Product, it is one of the top economic indicators amongst all. Consumer Spending tells us about the strength of the economy and the standard of living of the country’s citizens.  It almost drives 70% of the GDP figure; hence there is no doubt that it is a must for Fundamental Analysis.

Below is a plot of the percentage change in Consumer Spending vs. Real GDP from the St. Louis FRED website to demonstrate this indicator’s importance in comparison to the rest.

(Chart Source)

How can Consumer Spending be Used for Analysis?

What the consumers are willing to spend on can make or break the markets. By analyzing the spending trends and recognizing what sector of goods and services consumers purchase can tell us which market is going to flourish and stagnate. Consumer Spending represents the demand side of the supply-demand market, where supply is the providers or manufacturers of the goods.

When Consumers increase spending, this increases demand, which leads to business growth, increased employment, improved wages to meet the demand. This increase will again lead to increased spending by the newly employed and adjusted salaries, and all this becomes a positive feedbacking loop and continues till it saturates. When demand outpaces supply, we will have inflation, which is terrible for the economy as the increasing prices will make consumers increase spending now than later it will again result in price inflations. The primary job of the Federal Reserve is to prevent this vicious cycle of price inflation.

On the other end, low consumer spending reduces demand for goods and services, which stagnates business and hence the economy contracts and results in lower levels of GDP, which is also not good.

Traders can use the Consumer Spending Surveys, Indices to relatively compare economic situations of nations and also with previous periods to assess currency valuation or devaluation direction in the coming months. Investors can make investment decisions based on which sectors are experiencing increased demand looking at the spending patterns. Consumer Spending can also direct us in Stock Market evaluations of different companies.

Sources of Consumer Spending Reports

We can obtain the Consumer Spending monthly releases from the BEA, and that data can be found here. For illustration, you can refer to this link to see what the U.S. population spends more on. You can also check the University of Michigan’s Consumer Sentiment Index here.  As discussed, it is a primary driver of Consumer Spending.

Impact of the ‘Consumer Spending’ news release on the price chart 

In this section of the article, we will analyze the impact of the Consumer Spending economic indicator on the value of a currency. As we understood in the previous that the Consumer Spending measures the change in the inflation-adjusted value of goods expenditures by consumers, now we shall see how important the data is for traders and investors. Consumer Spending is one of the major economic activities in a country. However, looking at the below image, it seems like traders do not give a lot of importance to the data (Yellow box indicates less important) and may not make significant changes to their positions in the currency. In any case, let us see how the market reacts to the data release.

Below is the image showing the latest Consumer Spending data of France, which will have an effect on the EURO. The National Institute of Statistics and Economic Studies collects and disseminates information on the French economy and society. A higher than expected reading is considered to be positive for the economy, and a lower than expected reading is taken to be negative.

EUR/AUD | Before The Announcement

We start our analysis with the EUR/AUD currency pair, and as we can see in the image above, the chart is a strong uptrend, and the market has retraced recently. One of the reasons behind the violent up move is that the market participants are expecting a better Consumer Spending data for the month of February. Since the market has retraced quite a bit, aggressive traders can go ‘long’ in the market before the news announcement due to optimism in the market.

EUR/AUD | After The Announcement

After the Consumer Spending data is released, the market falls, but it leaves a wick on the bottom, and the price forms a ‘Doji’ candlestick pattern, which essentially indicates indecision in the market. As the data was far below what was predicted, we should wait for more confirmation from the market to notice the change in volatility. We see that that the volatility expands on the upside and goes above the moving average. This is an indication that the news outcome is digested by the market and will continue its trend. Thus, we can enter for a ‘buy’ after the price potently moves higher with a stop loss below the ‘low’ of news candle.

EUR/CHF | Before The Announcement

EUR/CHF | After The Announcement

Next, we discuss the EUR/CHF currency pair where before the news announcement, the market is in a strong downtrend, exactly opposite to the above currency pair. As the volatility is high on the downside, we should not expect a positive Consumer Spending data to cause a reversal of the trend. Whereas, a ‘bad news’ may take the currency much lower. We cannot take any position at this point, not even a ‘buy’ as we are in a strong downtrend, and there are no signs of reversal.

After the numbers are released, it is evident from the ‘news candle’ that there is an increase in volatility on both sides, and finally, the price closes near its opening price. The long wick on top of the ‘news candle’ is an indication that selling pressure is high due to poor Consumer Spending data. Therefore, at this point, one can go ‘short’ in the pair with a stop loss above the recent ‘high.’

EUR/SGD | Before The Announcement

EUR/SGD | After The Announcement

The above images represent the EUR/SGD currency pair, where the characteristics of the chart appear to be similar to that of the EUR/AUD pair. One major difference is that the uptrend is not as resilient as in the case of EUR/AUD. Before the news announcement, the market is at the key area of resistance equals support. This is the place where most traders go ‘long’ in the market and join the uptrend. But since the volatility is high, it is recommended to wait for the news release and then act accordingly.

After the news announcement, some selling pressure is witnessed as a result of weak Consumer Spending data, and the candle closes in red. But later, the ‘news candle’ is immediately is taken over by a bullish candle. This means, due to the bad news, the market initially reacted as per expectations, but this was not sufficient enough to cause a reversal in the market. As the impact of the news was less, we can trade with the trend, by going ‘long.’

This completes our discussion on Consumer Spending and the impact of its news announcements on the Forex price charts. If you have any queries, please let us know in the comments below. Cheers.

Categories
Forex Fundamental Analysis

‘Consumer Confidence’ & The Impact Of Its News Release On The Forex Price Charts

Introduction

Changes in Consumer Confidence drives macroeconomic indicators like Consumer Spending, which is a significant driver for Gross Domestic Product. Understanding what Consumer Confidence Surveys mean and imply are essential for predicting current and upcoming economic conditions. When understood properly, Consumer Sentiment can give us a hint regarding the direction of economic activity as an advanced or leading indicator.

What is Consumer Confidence?

The Consumer Confidence Statistics reflects the outlook of consumers on the future economic conditions and their financial status. The uniqueness of this indicator lies in the fact that this is a very subjective indicator and may be biased to some extent as it depends largely on the people’s opinion. Two people having the same current job and financial status may give a different outlook on it, but since the scope of the survey is broad, it irons out such exceptions and inconsistencies.

Consumer Confidence reflects how positive or negative people are feeling towards their future in the context of financial security, income, and employment. It is essentially a measure of the Consumer Sentiment in economic and monetary terms.

The numbers shown by Consumer Confidence surveys are not some monetary numbers derived from calculations, but instead, they are opinions rated on a scale in a numeric form similar to how we give a rating to movies on corresponding websites with stars or a ranking from 0-10.

How is Consumer Confidence scaled and assessed?

There are two major survey reports which show Consumer Confidence:

Consumer Confidence Index

It is released monthly by the Conference Board and reflects the general public’s expectations about their economic prospects for the next six months. The Conference Board expertise in these types of surveys (watching Consumer Spending and Buying habits) and take into account a plethora of data and survey information into account (about 5000 households) for their indices. Hence, it is considered a very reliable indicator by many.

Consumer Confidence Index is composed of the Present Situation Index, intended to be a coincident or current economic indicator, and the Expectations Index, expected to indicate future financial health.

Consumer Sentiment Index

The University of Michigan releases a preliminary report on the second Friday and a final report on the fourth Friday of every month. Their Consumer Research center conducts a telephonic survey asking 500 consumers a series of questions on personal finances and their opinions on business conditions. Two components, namely, Expectations Index and Current Conditions Index, make up the questions of Consumer Sentiment Survey.

Is Consumer Confidence necessary for our analysis?

The idea behind Consumer Confidence Surveys is that when consumers are confident of their economic prospects, they will spend more on personal expenses beyond the basic needs. For instance, when you assuredly receive 100$ daily, and the necessary daily requirements are taken care of with 50$. Naturally, we will spend the remaining 50$ for personal enjoyment as the next 50$ take care of tomorrow’s primary needs. In another case, if we were to receive the same 100$ on alternate days, then that money goes only for basic requirements, which cuts off the personal enjoyment expenditure.

Consumer Confidence drives Consumer Spending, which is more than a two-third component of GDP. Consumer Spending is the maker of GDP, and Consumer Confidence is a prime component of Consumer Spending.

How can Consumer Confidence be Used for Analysis?

The University of Michigan’s Consumer Sentiment Index historical data goes back to 1978, which is pretty decent for an economic indicator. Historically it has shown an excellent 85% correlation with the GDP growth rate, and this is a remarkable percentage to rely on these survey indices as leading indicators for the economy’s direction.

A low Consumer Confidence Index is a danger sign showing what is the probable economic crisis ahead in extreme cases. Weak confidence indicates there is a threat to the economy, and a contraction is on its way. Central Authorities may also use this to take corrective measures to change this. On the contrary, A healthy Consumer Confidence Index signals an economic expansion on its way, which stimulates growth and improves the standard of living of the citizens. Consumer Confidence can also be used by businesses to identify recessionary periods and take appropriate steps to minimize their risk and adapt accordingly.

Traders and Investors will always benefit the most from the leading or advanced indicators in comparison to coincident or lagging indicators. With such strong confidence leading indicators, we can significantly reduce our risk on financial investments and come out of trades before the danger signals manifest in the economy or go into the market and ride the economic growth ahead of others.

Sources of Consumer Confidence Indices

The Conference Board, which is a not-for-profit organization, has excellent data analysis for Consumer Confidence Indices. We can go through their surveying methodologies, historical records, samples on their official website. A sample issue of Consumer Confidence Survey pdf file can be found here.

The Michigan Consumer Sentiment Index numbers and corresponding data can be found here. The same is available on the St. Louis FRED website, where we can perform graphical analysis and plot against GDP rates for better understanding.

Impact of the Consumer Confidence news release on the price charts 

After understanding the Consumer Confidence economic indicator, we will now extend our discussion and analyze the impact of the same on the currency. It is a leading indicator that measures the overall economic activity. The reading is compiled after carrying out a survey of about 5000 consumers, which asks them to evaluate future economic prospects. When respondents give high ratings, it shows consumer optimism. Consumer Confidence data does not have a major effect on the monetary policy and the decision of policy-makers. Hence it does not cause severe volatility in the currency pair.

For illustrating the impact, we have considered the Consumer Confidence data of Europe, which is published by the European Commission. The below figure shows the previous, forecasted, and actual Consumer Confidence data in the Euro Zone, which was collected for the month of March. It shows that there was a decrease in the value from the previous month but higher than what was expected. A higher than expected reading is believed to be positive for the currency while a lower than expected reading is considered to be negative.

EUR/AUD | Before The Announcement

We begin our analysis with EUR/AUD, where the above chart shows the state of the currency pair before the news announcement. We see that the market is moving in a range and currently is at the bottom of the range. Since the impact of the news release is less, we need to rely more on technical analysis and trade based on technical indicators, rather than on the outcome of the news. Technically we are at the bottom of the range, so positive Consumer Confidence data is the ideal case for going ‘long’ in the currency pair.   

EUR/AUD | After The Announcement

After the Consumer Confidence data is released, volatility in the market increases on both sides, and the candle closes, forming a ‘Doji’ pattern. The reason behind this indecision is that the Consumer Confidence numbers were better than before but lesser than the forecasted numbers. Some traders took this to be positive, while some felt the numbers were not too great. From the trading point of view, since the market does not break the ‘support’ area, one can enter for a ‘buy’ with a ‘take-profit’ near the ‘resistance’ area.

EUR/JPY | Before The Announcement


EUR/JPY | After The Announcement

The above images represent the EUR/JPY currency pair, and the characteristics of this pair appear to be very different from that of the above-discussed pair. Before the announcement, the market is in a strong uptrend and currently at a point from where the market had reversed earlier. As the market is at a critical point, it is better to wait for the Consumer Confidence data and then trade based on the change in volatility.

After the news release, the price initially goes up but later gets sold into and closes in red. We need to note here that even though the market reaction was bearish, the price did not break the moving average. Instead, volatility increases on the upside and results in a continuation of the trend. One can trade the above pair after price retracement to an appropriate Fibonacci level and then taking a ‘buy.’

EUR/NZD | Before The Announcement 

EUR/NZD | After The Announcement

Now we shall discuss the impact of Consumer Confidence data on EUR/NZD currency pair. The behavior of the chart is similar to that of the EUR/AUD pair where here also the price is moving within a range, and recently the price has broken below the range. Since the selling pressure has increased, it can be risky to go ‘long’ in the market, even if the data proves to be positive for the economy.

After the news release, the market moves higher as a consequence of positive Consumer Confidence data, and the price closes, forming a bullish candle. As mentioned earlier, going ‘long’ can be risky due to the increased selling pressure, and thus conservative traders should not take such trades. Another reason why the up move might not be sustainable is that the impact of Consumer Confidence data on currency is not as much.

That’s about Consumer Confidence and its impact on the Forex Market. Let us know if you have any questions in the comments below. Cheers.

Categories
Forex Fundamental Analysis

What Should You Know About ‘Income Tax’ As A Fundamental Indicator?

What is the Income Tax?

An Income Tax is a percentage of our income that the government takes in the form of taxes. Income Tax is paid by individuals and entities depending on the level of earning and gains during a financial year. In most of the countries, a single income tax does not usually apply to the entire income, but rather various rates apply to different portions of the “taxable income.” The different tax rates and the income levels at which they apply vary widely.

Types of Income which attracts Tax 

Income Tax is a direct tax that is levied on the income and other types of earnings of an individual in a financial year. Below are some types of incomes and taxation rules.

Income from Salary: This includes basic salary, taxable allowances, and profit in lieu of salary, pension received by the person who himself has retired from the service. They all fall under the category of taxable income.

Income from business/profession: This includes presumptive incomes from business and professions that individuals do in their capacity and maybe their part-time work. This is also added to the taxable income after adjustment of the allowed deductions.

Income from properties: A taxable person may also own one or more house properties. These properties can be self-occupied or rented out or even vacant. The rules of Income Tax state that rent from house properties is to be treated for the purpose of calculation of taxable income. An income tax assessee can, however, claim certain deductions for house maintenance in certain areas.

Capital Gains: They are the gains that one makes from selling capital assets like Gold, house properties, stocks, mutual funds, securities, etc. Although capital gains are a part income tax, they are not added to taxable income, as they are taxed at different rates.

Economics and Income Tax

Tax plays a major role in maintaining a balance between people, businesses, and governments,  which broadly represents the economic activity of a country. Here are two ways in which changes to Income Tax affects the economic activity and well being of people.

Tax Incentives

By granting incentives, taxes can affect both supply and demand in an economy. Reducing marginal tax rates on wages can motivate workers to work more. Expanding the income tax credit can bring more low-skilled workers into the labor force. Reducing Tax rates can also encourage to employed persons to invest in stocks and bonds, which improves the capital flow of companies.

Budget Deficit

Large Tax cuts can slow economic growth by increasing budget deficits. When the economy is operating at its potential, a sudden reduction in tax rates may provoke the government to borrow capital from foreign investors and institutions. They will also divert some funds allocated to private investment, reducing productive capacity relative to what it could have been. Either way, deficits increase and thus reduce well-being.

The Economic Reports

The Income-tax rates are announced every year by the Finance Ministry during a press release, which puts out all the slabs and tax brackets based on the income level. This is usually the Central Government tax rate, but there is also a yearly announcement made by all the states, which impose income taxes in the same way the federal government does. In some countries, a single tax rate is applicable to everyone, regardless of the income level. This is called a “flat tax.”

Analyzing The Data

Investors, when analyzing a currency Fundamentally, give extreme importance to the Capital Gains tax of that country. Income Tax is not a major concern for investors when taking a position in the market. But a major deviation from the standard Income Tax rates catches the attention of investors. However, if the Federal government has been maintaining a fixed rate over the years without any major changes, there is no reason to worry, as they fell, the economy is stable. However, an increase in Capital Gains tax is not taken well by the institutional investors, which changes their stance on the economy and the currency, mostly to negative.      

Impact on the currency

A study conducted by economists examined the impact of taxes on the real exchange rates through their effects on economic activity. Their report says that an increase in the capital interest tax rate leads to depreciation in the currency, while an increase in the wage or consumption tax leads to a real domestic currency appreciation. This hypothesis is supported by the data estimations of annual data from 10 OECD countries over 17 years.

A marginal increase in Income Tax is considered to be good for the economy as it increases the revenue of government organizations, but a substantial increase in tax rate can have a reverse effect on the economy, and this will be unbearable for salaried persons.

Source of information on Income Tax rates

Income Tax rates are available on the official website of the finance department of the country, where one can also find the rates for previous years as well (of more than 30 years). Using this information, a trader can analyze the trend in the Income Tax rates over the years. Here is a list of major countries of the world with their Income Tax rates.

Links to Income Tax information sources

GBP (Sterling)USDEURCHFCADNZDJPY

Income Taxes is a compulsory contribution to state revenue, levied by the government on workers’ income and business profits. This gives the ability to the government to provide basic safety and community systems for the public. This ensures freedom and basic living standards that citizens expect. Therefore, it is the duty of citizens to timely file Income Tax returns and be a responsible civilian.  

Impact of the Income Tax news release on the price chart 

After having a clear understanding of the Income Tax and its role in the economy, we will now extend our discussion and study the impact of the same on the value of a currency. Investors and traders mainly consider the Capital Gains tax rates, which is also a form of Income Tax. Any major changes to the Capital Gains tax cause extreme volatility in the currency pair and a change in the outlook for that currency. Thus, the income tax alone is not explicitly taken into account by traders.

In the upcoming sections, we will analyze the change in volatility in the currency pair due to the announcement of Income Tax rates. The above image shows the Federal Tax rates of Canada for 2020, where we can see the percentage of income that will be levied as Income Tax on individuals of the country. This is also known as ‘Tax Bracket.’ The maximum Income Tax rate stood at 33%, and this rate has been maintained from the past four years. This data is published by the Canada Revenue Agency, where one can find other tax rates as well.

GBP/CAD | Before The Announcement

We start our discussion with the GBP/CAD currency pair, where the above image shows the behavior of the chart before the news announcement. Price action suggests that the price seems to be retracing the big uptrend and is at a key ‘support’ level. If the Income Tax rate announcement comes out to be negative for the Canadian economy and not per expectations, one can take a ‘buy’ trade in the above pair. Whereas positive data might not result in a trend reversal as the overall trend is up.

GBP/CAD | After The Announcement

After the announcement, we see that the price moves higher, and it closes with a fair amount of bullishness. The increase in volatility to the upside is a sign of continuation of the trend, and this shows that the data was not very positive for the Canadian dollar. The bullish ‘news candle’ indicates a weakness in the currency where traders find the data to be negative for the economy. As the market moves higher, once can go ‘long’ in the market with a stop loss below the ‘news candle’ and ‘take profit’ at the recent ‘high.’

EUR/CAD | Before The Announcement


EUR/CAD | After The Announcement

The above images represent the EUR/CAD currency pair. In the first image, we see that the price is moving within a range, and just before the announcement of Income-tax rates, the price is at the bottom of the range. Since the price is at an optimal place for going ‘long’ in the market, aggressive traders can buy the currency pair with a strict stop loss of a few pips below the ‘support’ area.

We are essentially advantage of the increased volatility and movement in the pair. After the Income Tax rates are published, the market moves higher similar to the GBP/CAD pair, but later, the market gets sold into, and the candle closes with a large wick on the top. We can say that the news data was neutral to negative for the economy. Thus, there some confusion among traders can be seen. As the ‘news candle’ is not a bullish candle, it is wise to wait for the price to cross above the moving average and then a ‘buy’ trade.

CAD/JPY | Before The Announcement

CAD/JPY | After The Announcement

Lastly, we discuss the CAD/JPY currency pair, where the characteristics of the chart appear to be different from the above two pairs. Since the Canadian dollar is on the left-hand side, an uptrend in the first image signifies a great amount of strength in the currency. As the market is continuously moving higher before the announcement, we need a lot of confirmation from the market in order to go ‘short’ in the market. I

f the news data is positive for the economy, the move gets accelerated to on the upside and, in that case, once can join the trend after a retracement. After the news announcement, the market crashes, and volatility increases to the downside, thereby indicating a possible reversal. The bearish ‘news candle’ shows that the Income Tax rates were not very positive for the economy, and thus traders sold Canadian dollars. One should take ‘short’ trade only after the price goes below the moving average.

That’s about Income Tax and the impact of its new release on the Forex Market. Let us know if you have any questions in the comments below. Cheers.

Categories
Forex Fundamental Analysis

‘Productivity’ as a Fundamental Indicator & Its Impact On The Forex Price Charts

Introduction

Productivity is an important fundamental indicator that talks about the levels of the industrial output of a country. It is one of the leading indicators in the Forex market, which has a long-term impact on the currency’s value. The industrial output is linked to the theory of demand and supply, which means the availability of raw material and policies set by the monetary policy committee directly affects the overall output. Let us understand this concept in depth by looking at the definition of Productivity first.

What is Productivity?

Productivity is defined as the ratio of total output volume to the total input volume. The ratio is mentioned in the form of an average, which expresses the total output of a category of goods divided by the total input, say raw materials or labor. In simple words, Productivity measures how efficiently the inputs such as labor and capital are being used in a country to produce a given level of output.

Productivity determines economic growth and competitiveness and hence is the basic source of information for many international organizations for measuring and assessing a country’s performance. Analysts use ‘Productivity’ data to also determine capacity utilization, which in turn allows one to assess the position of the economy in the business cycle and to forecast economic growth.

Measuring Productivity

Before we see how Productivity is analyzed, we need to consider various methods of measuring the output and input components of Productivity and the limitation of using each of these estimates.

Output

When we are talking about output, the number of units produced of each category of commodity or service should be counted in successive time periods and aggregated for the company, industry, and the whole economy. This output should be measured in comparison to some other indicator of equal importance, usually cost or price per unit in a period. The changes in the price of the goods produced are observed for two or more periods that are said to influence the aggregate output volumes. Price deflation is usually employed to get the estimation of the real gross product by sector and industry. The obtained estimates will be used as numerators in the productivity ratios.

The limitation of using the above methods is that quantities and prices for many outputs of finance and service industries are deficient.

Input

Labor input is easy to measure, as it only involves counting the heads of persons engaged in production. But in fact, the number of hours worked is preferable to just the number of people. This dimension, too, is related to the compensation received per hour of work, also known as wage. The official estimates, however, do not differentiate among various categories of labor where they measure labor inputs by occupation, industry, and other categories.

The drawback of using this method for estimating the labor input is that it is difficult to find the relation between the number of hours worked and hours paid for during paid holidays and leaves.

Determinants of Productivity

Technology determines the maximum level of output that can be reached and the quality of output that is required. In this age of technological advancement, innovations and automates systems play a major role in carrying out the production activity. Technological changes are happening very fast in some industries while it is gradual in others.

The Skills of the workers matter a lot when determining Productivity on an individual level. For example, if an unskilled worker tries to carry out a task, he might make more mistakes and will not be able to optimize the time to work, whereas a skilled worker will need less time to do the same job.

Some other methods of attaining high Productivity are through adequate levels of earnings, high job security, quality education and training, good and safe working conditions, and an appropriate work-life balance.

The Economic Reports

The economic reports of Productivity are published every month for most of the countries. There is also the collective data that combines the monthly statistics of a country which is published on a yearly basis. The productivity data is maintained and provided by two big OECD (Organisation for Economic Cooperation and Development) databases, which are ISDB (International Sectoral DataBase) and STAN (Structural Analysis DataBase). At these sources, we can find the data from 1970 for countries like the United States, Japan, and other European countries.

Analyzing The Data

From a trading perspective, Productivity plays a vital role in the fundamental analysis of a currency pair. The productivity data shows the production capacity of a country. Using this data, various agencies decide which goods need to be imported and exported from the country. By comparing the data of two countries, one can determine which economy is stronger and has the potential to grow.

One thing to keep in mind when analyzing the data is to compare similar economies as different countries will have a different level of development. When looking at developed countries, it is fair to expect the productivity ratios to be in triple digits, and for developing economies, it could be in two digits.

Impact on the currency

The impact due to Productivity on the currency is split into two different categories, i.e., the ‘traded’ and the ‘non-traded’ sector of the economy. The ‘traded’ sector is made up of industries that manufacture goods for import to foreign countries and hence have a presence in the foreign exchange market. The ‘non-traded’ sector is comprised of industries that produce goods for the domestic market only.

So, as the prices of goods of the ‘traded’ increase, the currency of that country is set to appreciate and thereby increasing the inflow of funds into the country. In the case of ‘non-traded’ sector goods, an increase in the price of such goods is not good for the economy as this would make the products costlier and people will have to spend more to purchase them. This would negatively impact the currency, and institutions will not be willing to invest in such countries.

Sources of information on Productivity

Productivity data is available on the most prominent economic websites that provide a detailed analysis with a comparison chart of previous data. Using this information, a trader can analyze and predict the future data of the economy. Here is a list of major countries of the world with their productivity stats.

GBPAUDUSDEURCHFCAD | NZDJPY  

Higher Productivity has an impact on the profit of a company and the wages of the employees. High profits due to high Productivity generate cash flow, increase loan provision from banks, and, most importantly, attract investment from foreign investors. Due to this, companies can afford to pay more wages to their employees without losing market share.

Impact Of Productivity News Release On The Price Charts 

Productivity is one of the most important economic indicators that measure the annualized change in the labor efficiency of the manufacturing sector. As Productivity plays a major role in an economy, it is necessary to analyze the impact of the same on the currency. The below image shows that Productivity is not a crucial factor for forex traders, which means the Productivity data might not have a long-lasting effect on the currency. However, one should not forget the data that affects the manufacturing sector and hence indirectly impacts the GDP. Therefore, we should not underestimate the figures.  

To explain the impact, we have considered the NonFarm Productivity of the US, which is released by the Bureau of Labor Statistics of the US Department of Labor. A ‘higher than expected’ reading should take the currency higher and is said to be positive for the economy, while a lower than expected reading is considered to be negative for the economy and should take the currency lower. The latest figures show that there has been a 1.4% rise in Productivity levels from the previous quarter. Let us find out the impact on the US dollar.

NZD/USD | Before the announcement | 5th March 2020

The above chart is of the NZD/USD currency pair before the Productivity numbers are announced. What we essentially see is a strong down move that has resulted in a reversal of the uptrend. The volatility is high even before the news release. The reason behind this move is much greater expectations of Productivity than before, which is making traders buy US dollars. Now, if the Productivity numbers were to be lower than before, we can expect a reversal of the downtrend, but it might not be sustainable as it is not a high impactful event.

NZD/USD | After the announcement | 5th March 2020

After the Productivity data is announced, volatility further increases on the downside, and the market moves much lower. What we need to observe is that even though the market goes lower, it fails to make a ‘lower low.’ This is because the productivity data is not of much importance to traders, and hence the impact will not last long. Therefore, the market respects the news for just a couple of candles and later takes support at the lowest point and goes higher. From a trading point of view, the only way to trade Productivity news release in this pair is by going ‘short’ after the news outcome and exit at the nearest opposing point.

GBP/USD | Before the announcement | 5th March 2020

GBP/USD | After the announcement | 5th March 2020

The above images represent the GBP/USD currency pair, where the characteristics of the chart are totally opposite to that of the NZD/USD chart. Here, the uptrend seems to be dominating, which is also confirmed by the moving average indicator. The forecasted productivity data is not having any impact on the pair before the news announcement, which means the data is relatively weak against British Pound. After the announcement is made, we see the market moves up as the data was no better than the forecasted data. The ‘news candle’ leaves a wick on the top since the data was mildly positive for the US dollar but has no significance. Therefore, the volatility increases on the upside with a minor impact, and the market continues its uptrend. In this pair, we don’t really see a point of ‘entry’ as we don’t have technical factors supporting the trade and hence should be avoided.

USD/CHF | Before the announcement | 5th March 2020

USD/CHF | After the announcement | 5th March 2020

The above chart of USD/CHF is similar to that of GBP/USD pair, but since the US dollar is on the left-hand side, the chart is in a downtrend. Here too, the US dollar is showing a great amount of weakness before the news announcement, which means even a positive Productivity data is less likely to result in a reversal of the trend. After the news announcement, we see that the price suddenly shoots up, and the price closes as a bullish candle. As the impact of Productivity data is less, the sudden rise in volatility shouldn’t last, and hence this could provide an opportunity for joining the trend. When volatility increases on the downside, we can take ‘short’ positions in the market with a stop loss above the ‘news candle.’ This is how we need to analyze such news outcomes.

That’s about Productivity and its impact on the Forex market. If you have any doubts, please let us know in the comments below. Cheers.

Categories
Forex Fundamental Analysis

The Impact Of ‘Cash Reserve Ratio’ On A Country’s Currency

Introduction to Cash Reserve Ratio

The cash reserve ratio (CRR), also called the reserve ratio, is the minimum amount of deposits of the clients that are to be held by the commercial banks as cash or deposits with the central bank of the country. It is expressed in terms of a percentage. However, the rest can be used for investment and lending purposes. This is primarily done for two reasons; one, to maintain liquidity in the banks, and two, to not let the banks go bankrupt when they need to pay their depositors when demanded.

The amount deposited by the commercial bank into the central bank is unlike depositing into debt and equity funds. That is, the central banks will not pay any interest to the commercial banks for it.

How is the Cash Reserve Ratio Calculated?

The Reserve Requirement times the Bank Deposits yields the Cash Reserve Ratio.

Cash Reserve Ratio = Reserve Requirement Bank Deposits

Where,

Reserve Requirement is a percentage value determined the central banks by considering factors such as supply and demand, inflation rate, spending rate, trade deficits, etc.

Bank Deposits is the Net Demand and Time Liabilities (NDTL), which is the deposits made by the customers into commercial banks.

To understand this clearly, let’s take an example. Let’s say a depositor deposits the US $5000 into his bank account. This amount is referred to as Net demand and Time Liability (Bank Deposits). Also, consider the reserve ratio (reserve requirement) to be 6%. Now, the bank will have to hold 6% of the depositor’s amount (the US $5000) as reserves; that is, US $300 is given to the central bank as cash reserves. The leftover amount (US $4700) can be used for investment as well as for lending loans. If we were to assume that the lost out of $4700, then the bank will have will still $300 safe with the central bank.

The Measure and Impacts of Cash Reserve Ratio 

The Cash Reserve Ratio is an important tool in the monetary policy. As its primary use, the reserve ratio is used to control the money supply of an economy. It also regulates inflation rates and keeps in the liquidity flowing in the markets.

The Reserve Ratio typically measures the change in the interest rates and inflation in an economy. Now, let’s vary the CRR and check on the changes in the inflation rates, interest rates, and the money supply.

Case 1: Decrease in the Cash Reserve Ratio

The CRR is the part of deposits of the customers that are held by the central banks. Now, if there is a decrease in the CRR, the amount held by the central banks is lesser, which implies that the commercial banks will have more amount in their hands. In such scenarios, the banks typically reduce the interest rates on loans they provide. Also, the decrease in the reserve ratio increases the money supply in an economy, and this, in turn, increases the inflation rate.

Case 2: Increase in the Cash Reserve Ratio

The implication when the CRR increases is the opposite of the above case. An increase in the CRR means that the amount held by the central banks is higher, which reduces the amount held by the commercial banks. Now since they have less money in hand, they compensate it by increasing the interest rates on the loans they provide. The money supply, in this case, decrease, which drops the inflation rates as well.

Impact of Reserve Ratio on the Currency

The Reserve Ratio does have an impact on the currency, but indirectly. It does help in determining the demand for the currency. In the previous section, we saw that an increase or decrease in CRR affects inflation and interest rates. As a matter of fact, an increase in the interest rate increases the demand for the currency, given all other factors are kept in favor of the currency. Also, the increase in the interest rates attracts more foreign investors, which creates more demand for the currency. On the other hand, the decline in the interest rates, in general, brings down the demand for that currency. Foreign investors, too, don’t have their eyes here anymore.

Note that, Reserve Ratio or the interest rate for that matter alone does not determine the demand for that currency. There are several other considerations that must be made along with this—for instance, the relationship between interest rates and inflation. Higher interest rates with a decent and feeble increase in inflation can prove a positive effect on the currency.

Cash Reserve Ratio: The Stats

There are portals over the internet where one can find the historical data as well as the forecast data. One can also analyze them by the different types of graphical representations they provide.

India | Brazil | China | Russia

How often is the data released?

The frequency of release of the reports is the same for most of the countries. In countries such as China, Malaysia, Russia, Brazil, etc. the data released every month, while it is released daily in India.

Effect of Cash Reserve Ratio on the Price Charts

Now that we’ve fairly got an idea about the reserve ratio, let’s see how the prices are affected after these reports are out. Precisely, we will see how the volatility of the market has changed as well as the effect in volume.

For our example, we will be taking the Indian Rupee into account to analyze the charts. The frequency of release of data of Reserve Ratio in India is daily. The reports are published by the Reserve Bank of India.

Note that the Cash Reserve Raito data has a feeble impact on the currencies. Since the CRR is indirectly impacted on the currency, the level of impact is pretty low compared to other fundamental indicators such as interest rates, GDP, inflation, etc.

Consider the below announcement made by the Reserve Bank of India. We can that the announcement was made on February 6th at 6:15 AM GMT, and the value reported was 4%, which was the same as the previous month as well as forecasted value.

Now, since the actual values are the same as the previous and the forecasted value, we cannot expect any high volatility or a shoot up in volume as such. However, let’s analyze a few charts and see its impact.

USD/INR | Before the Announcement – (February 6, 2020)

Below is a chart of USD/INR on the 15min timeframe just before the news was released.

USD/INR | After the Announcement – (February 6, 2020)

Consider the chart of USD/INR on the 15min timeframe after the release of the news. The news candle is represented as well. We can see that the news favored the US dollar but not the Indian Rupee. However, the movement wasn’t as gigantic as such. The volatility was above the average, and the volume was quite low. From this, we can conclude that the reports didn’t have any massive impact on the USD/INR.

EUR/INR | Before the Announcement – (February 6, 2020)

EUR/INR | After the Announcement – (February 6, 2020)

Below is the chart of EUR/INR in the 15min timeframe. The news candle has been marked in the box, as shown. We can clearly infer that the news candle barely made a drastic move in the market. Nonetheless, the volatility was above the average mark. So, news traders cannot expect any high volatility during the release of the news. And traders who stay away from the markets during the news can now trade fearlessly as the news doesn’t have a major impact on the currency.

GBP/INR | Before the Announcement – (February 6, 2020)

GBP/INR | After the Announcement – (February 6, 2020)

Below is the chart GBP/INR on the 15min timeframe after the release of the news. The news candle is illustrated in the box, as shown. Similar to the USD/INR and the EUR/INR, this pair, too, has not shown any rise in the volatility as such. In fact, the volatility of this pair is at the average line. So, with this, we can conclude that the Cash Reserve Ratio barely has an impact on the currency.

Conclusion

The Cash Reserve Ratio is the amount of money that is deposited by the commercial banks into the central banks. This is primarily done to maintain the volatility in the banks. The reserve ratio is an important monetary policy tool. Moreover, it determines and maintains the interest rates, inflation, as well as the money supply of an economy. A rise or fall in the CRR brings a change in the previously mentioned indicators. Hence, this is a vital and very helpful fundamental indicator for both economists and investors. But comparatively, it is less helpful for the day traders, as the impact is feeble.