Introduction
Gross Fixed Capital Formation can help us as a leading indicator of economic growth. GFCF figures increase when growth is forecasted, be it for companies, governments, or organizations, etc. Understanding this macroeconomic indicator can help us understand the level of economic activity going on the global scale and forecast the changes in the rate of growth for different economies, as indicated by the Gross Fixed Capital Formation figures.

What is Gross Fixed Capital Formation?
Gross Fixed Capital Formation (GFCF) is a measure of gross net investment into fixed capital goods by companies, governments, and households within the economy for a specific period. It is also called investment in short, or business investment generally.
Capital Goods: These are tangible assets that are used by companies to produce consumer goods and services. In simpler words, it refers to the physical goods required by a company to run its business. For example, a transportation company will have trucks as its capital assets that enable them to run its business and generate revenue. An IT company would have computers that would be its capital assets or goods that help it run its business. Any tangible (or physically quantifiable) good required in assisting the company production is termed as Capital Goods. Hence, Capital Goods can be tools, equipment, raw materials, transportation assets, power supply, etc.
Hence, GFCF is a measure of how much a company invests in acquiring capital assets to maintain or enhance its production capacity and efficiency. Capital Formation is a necessary component for any business or government operation.
It is called “Gross” because it does not take into account the adjustments to consumption associated with the fixed capital, i.e., depreciation of the fixed capital assets that occur over time due to normal wear and tear.
GFCF is not a gauge of total investment. It only measures net addition to fixed assets, and all financial assets are excluded along with inventory stocks and other operating costs. Among all these exclusions, the essential exclusion is that of real-estate (land sales and purchases). Real estate transactions only mean that land has been only transferred in ownership from one organization to another and is only included when a new land that did not exist before was created and added into the economy.
How can the Gross Fixed Capital Formation numbers be used for analysis?
As the capital goods wear out over time and a decrease in value, companies that cannot afford new capital goods will observe a reduction in production output. Also, a company that plans on expansion would be required to acquire new capital assets to increase its production capacity.
The difference in the Capital Formation figures for different countries reflects the economic development rate and the catch-up process amongst the compared economies. Higher investment rates into capital goods in less developed economies will lead to improved living standards in the long term on account of accelerated economic growth and improved equipment for the workforce with modern technology.
GFCF is, in a way, a measure of how much of the revenue is invested back into its growth. The higher the investment into its growth, the more accelerated growth the economy undergoes in the long-run. Of course, when a portion of the revenue goes back into the business itself, it leaves lesser revenue for the shareholders or the business owners in the short run, but it pays off in the long run.
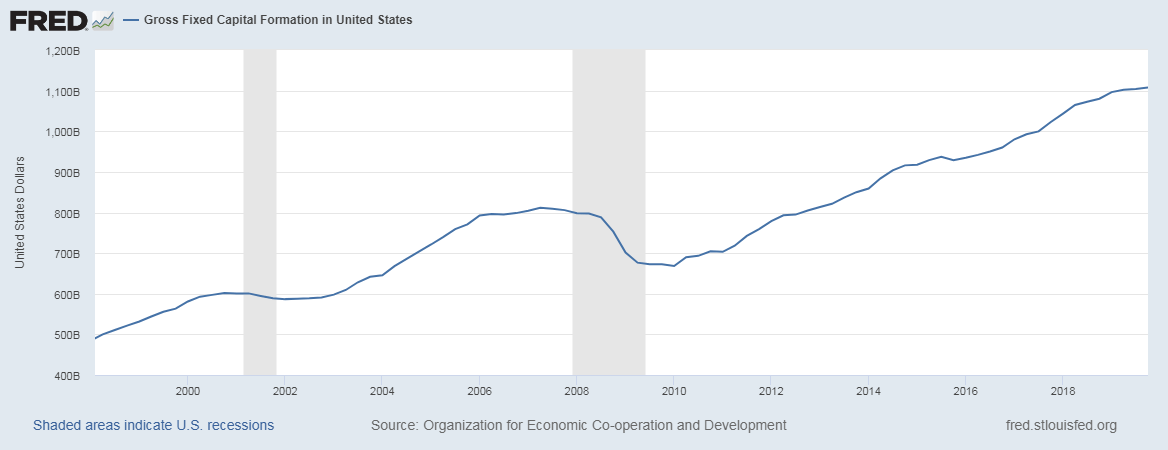
Changes in GFCF is indicative of fluctuations in business activity, business confidence, growth pattern. During economic uncertainty or a recession, business investment is reduced, as decreased revenue is consumed for immediate needs and maintenance operations. On the other side, during times of consistent economic growth and stable market, there is a general increase in GFCF as it is more likely to yield favorable returns in the future. It is less risky to invest in a stable market environment.
The below snapshot of the GFCF for the United States establishes our analysis point above:
Impact on Currency
GFCF is a proportional macroeconomic indicator. It is very suitable for macroeconomic analysis and is more suited to the regional or international level analysis of market conditions. While the increase in the GFCF figures is good for the economy in the long run, it is an especially useful indicator for long term traders and investors. It is not a very reliable measure for short-term currency market volatility assessment.
It is a quarterly report, and hence, other monthly indicators would be more appropriate for traders looking to stay ahead of the fundamental trends. But this GFCF is a leading indicator for companies, or economic growth both and can act as a double-check for our fundamental analysis.
Hence, in the currency markets, the GFCF figures bear low impact due to the frequency of release, and its long-term trend indicative nature makes it a less favorable indicator for day and swing traders.
Economic Reports
The GFCF figures are macroeconomic indicators and are generally available on the official websites of international organizations like the OECD (Organization for Economic Co-operation and Development), World Bank, or IMF (International Monetary Fund). The reports are released quarterly and annually for most countries, as data becomes available from different countries’ respective reporting institutions.
Sources of Gross Fixed Capital Formation
For the United States, the St. Louis FRED maintains the OECD data of GFCF here.
You can find the GFCF data for all the OECD countries on its official website here.
You can find the GFCF list for various economies in the sources mentioned below.
Impact of the” Gross Fixed Capital Formation” news release on the Forex market
In the above section of the article, we defined the Gross Fixed Capital Formation economic indicator, which estimates the value of acquisitions of new or existing fixed assets by the business sector, governments, and households. When this value is subtracted from the fixed assets, we get the Gross Fixed Capital. Investors around the world consider this indicator to be an essential determinant of the GDP of a country. This value is directly reflected in the GDP as it measures the total assets owned by the government and individuals.
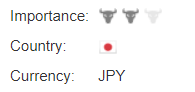
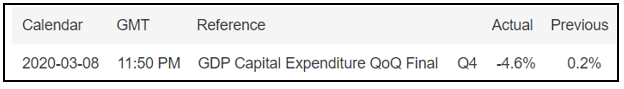
In today’s article, we will be analyzing the impact of Capital Formation on the value of a currency and watch the change in volatility due to the news announcement. For that purpose, we have collected the previous and latest Capital Formation data of Japan as it is shown in the below image. A higher than expected number is considered to be bullish for the currency while a lower than expected number is considered bearish. Let us find out the reaction of the market to this data.
USD/JPY | Before the announcement:
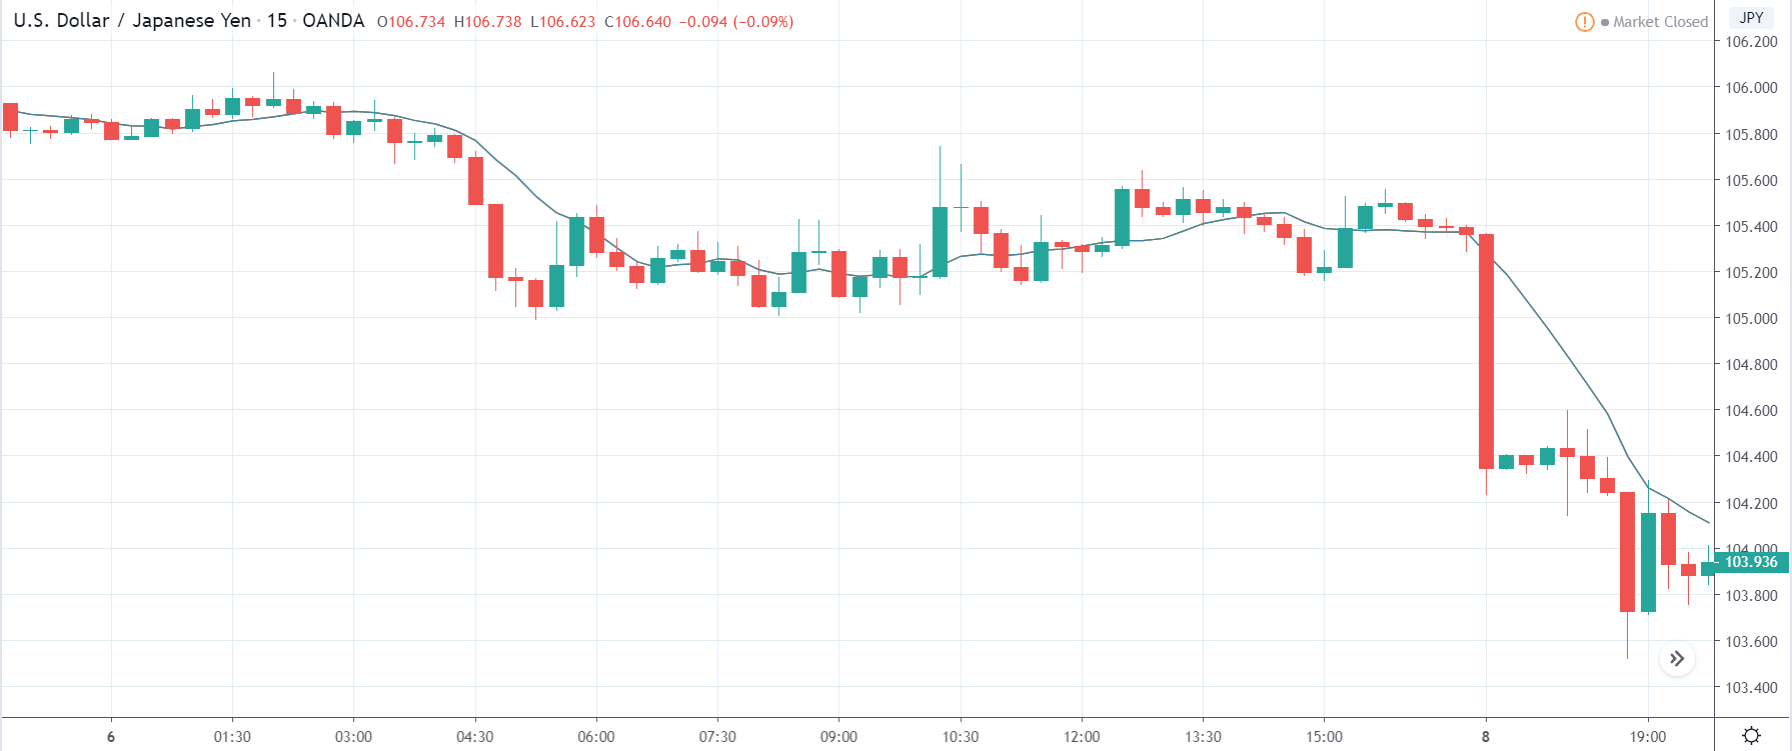
The first pair we will be reviewing is the USD/JPY currency pair, where the above image shows the characteristics of the price before the news announcement. It is very clear from the chart that the market is in a strong downtrend with no retracement. This means the Japanese Yen is stable, and we might not see price retracement until strength comes back in the U.S. dollar.
USD/JPY | After the announcement:
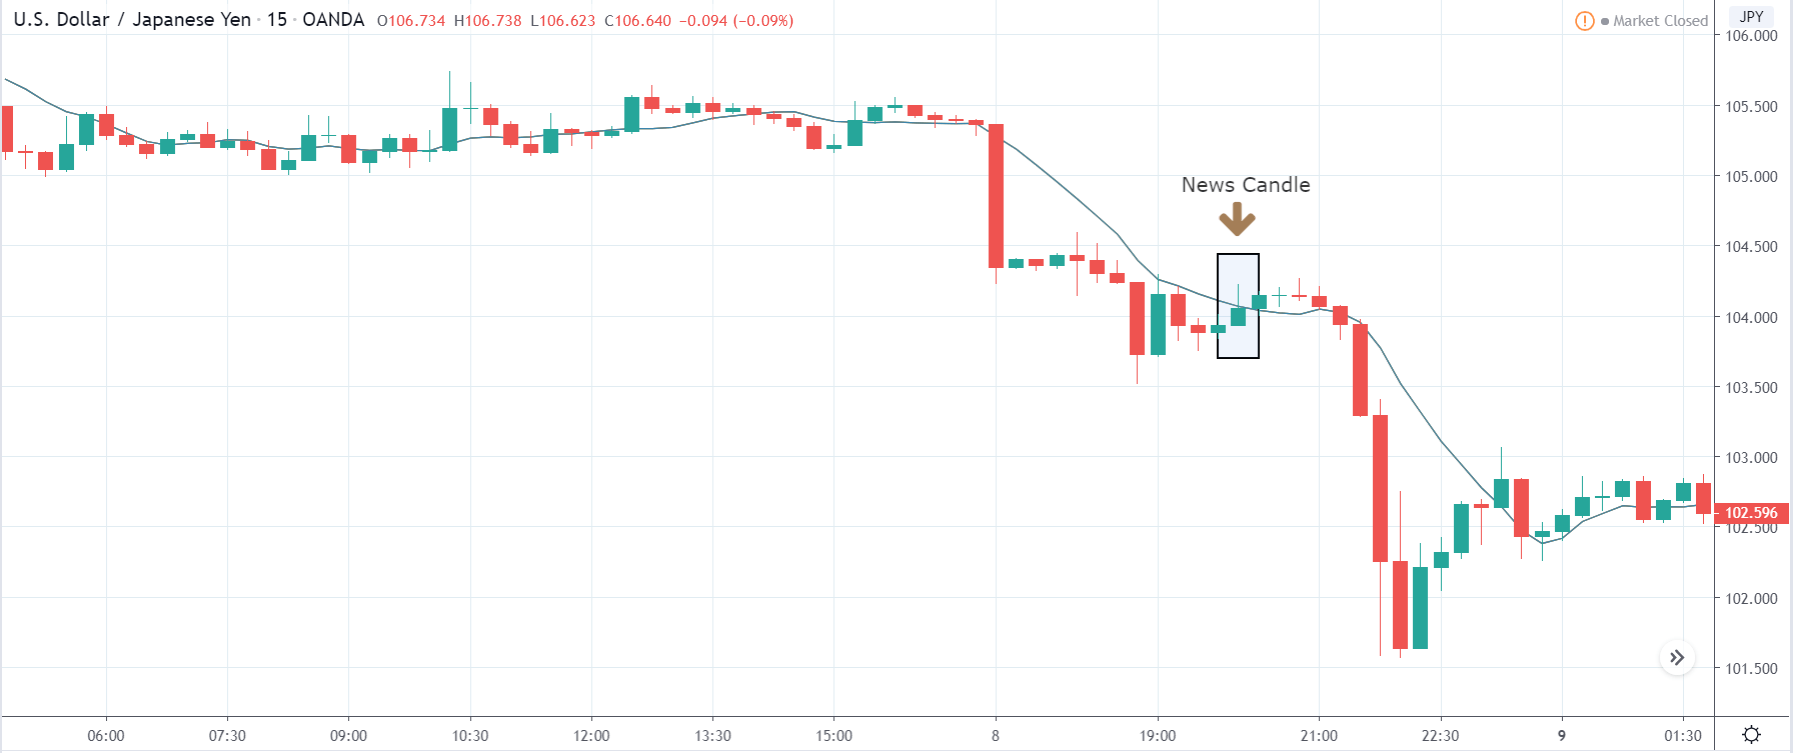
After the news announcement, volatility increases to the upside, and the price shows signs of bullishness. Since the Japanese Yen is on the left-hand side in this pair, and increasing price signifies the weakening of the currency. The market reacted negatively to the news release due to the weak numbers. However, we see that weakness does not sustain, and the volatility increases to the downside after a couple of candles.
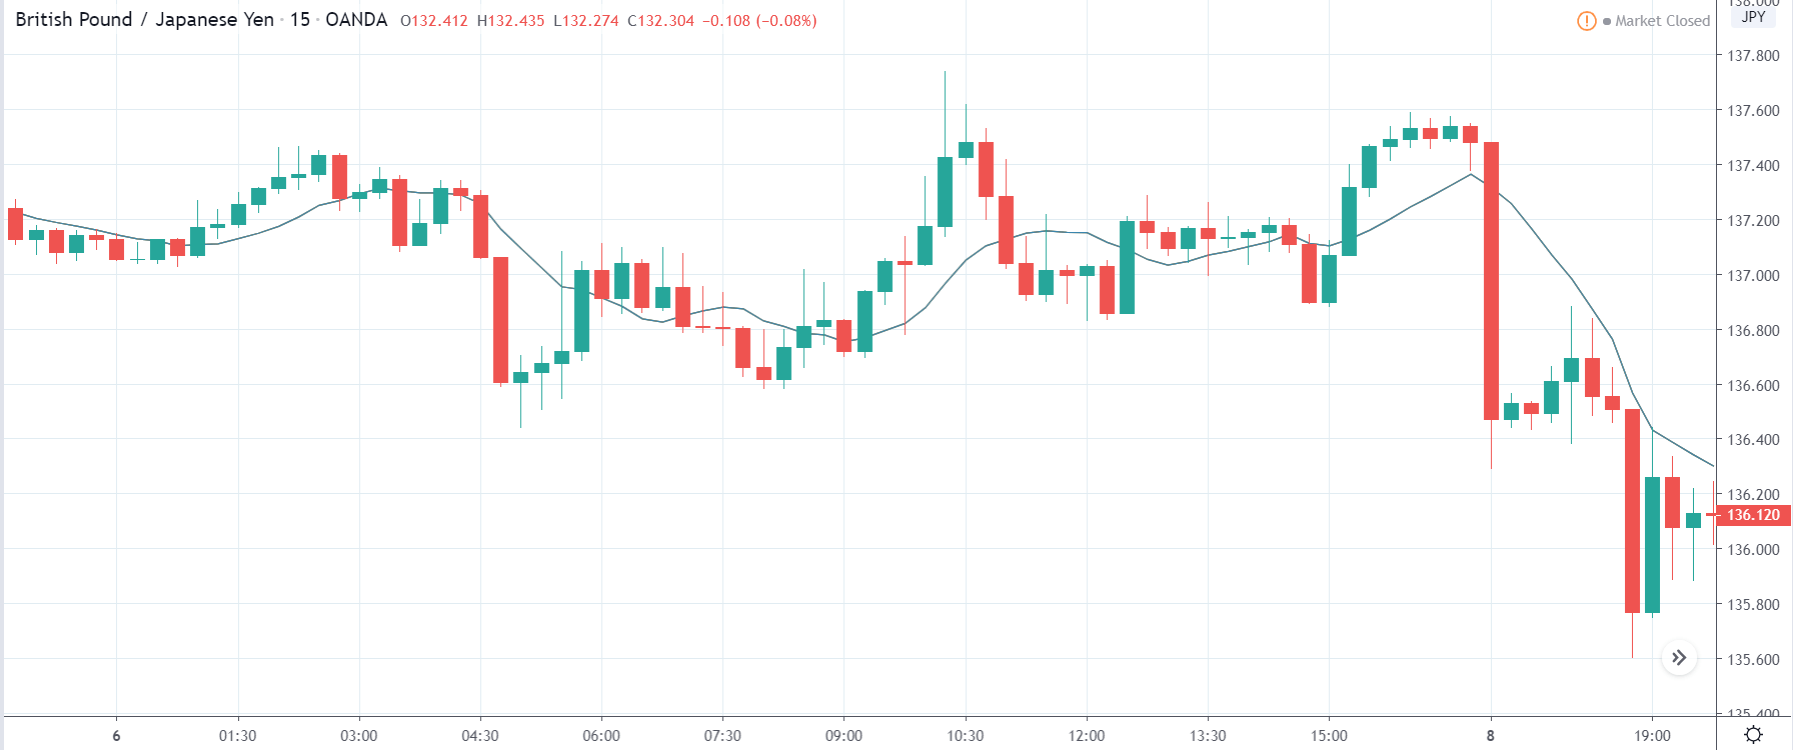
GBP/JPY | Before the announcement:
GBP/JPY | After the announcement:
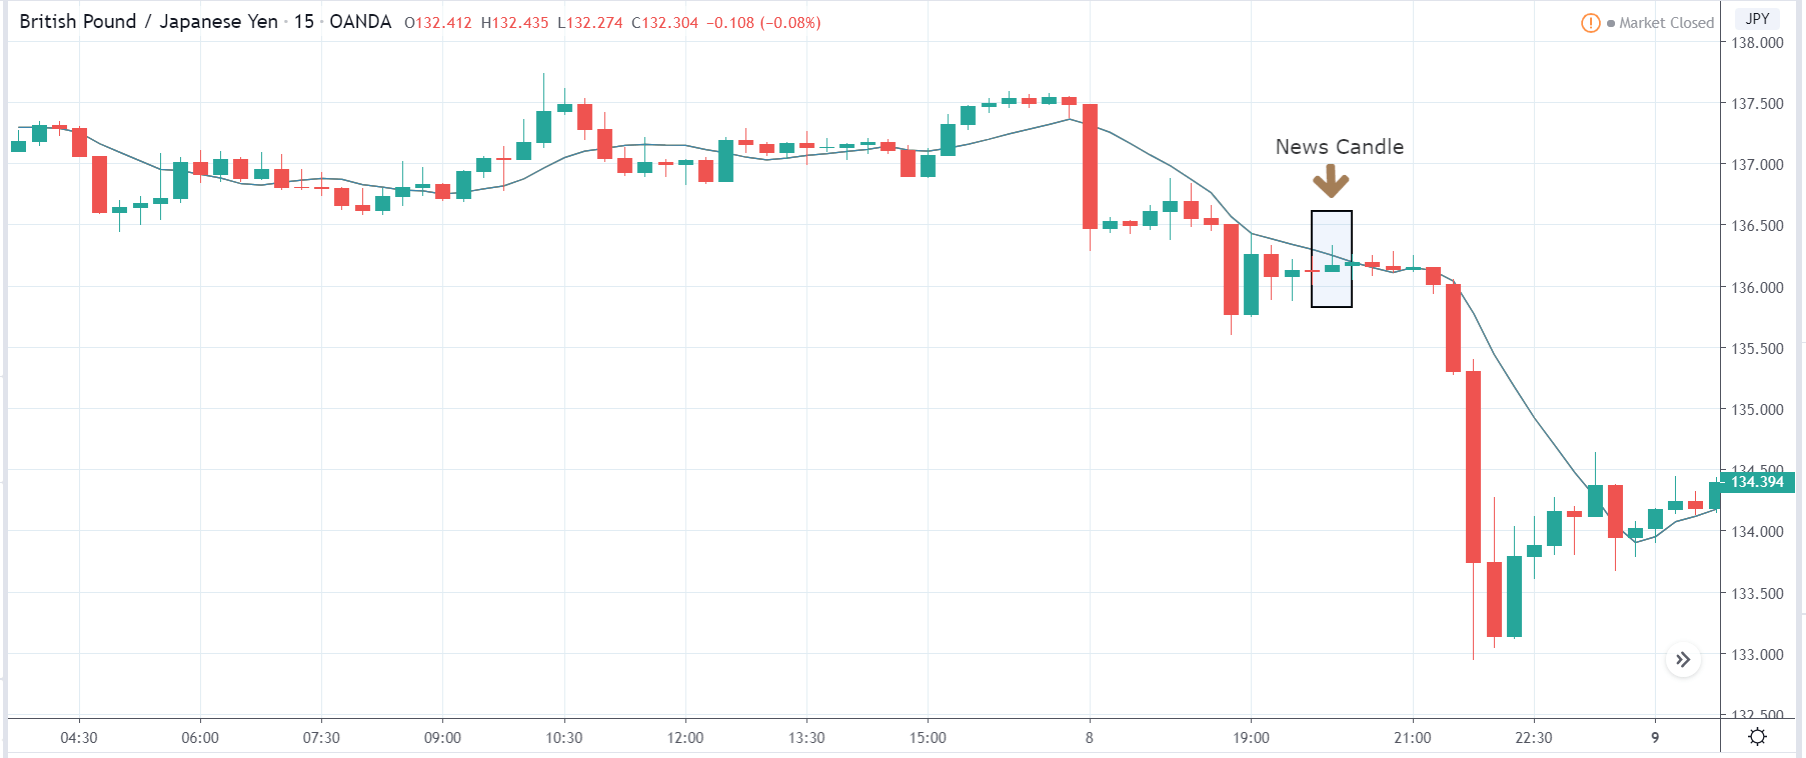
The above images are that of the GBP/JPY currency pair, where we see in the first image that the market is in a strong downtrend indicating that the Japanese Yen is stable. As there is a lot of bearishness in the market concerning the British Pound, an ideal trade plan would be to take a ‘short’ trade as the price pulls back to a ‘resistance’ or ‘supply’ area. Until then, we cannot position ourselves in the currency pair. After the news announcement, the price initially moves higher, owing to weak Capital Formations data where there was a reduction in the total assets compared to the previous quarter. Due to the selling pressure witnessed from the top, the weakness in Japanese Yen does sustain, and the ‘news candle’ closes with a wick on the upper side. The market fails to retrace even after the news release, and the price continues to move lower.
CAD/JPY | Before the announcement:

CAD/JPY | After the announcement:
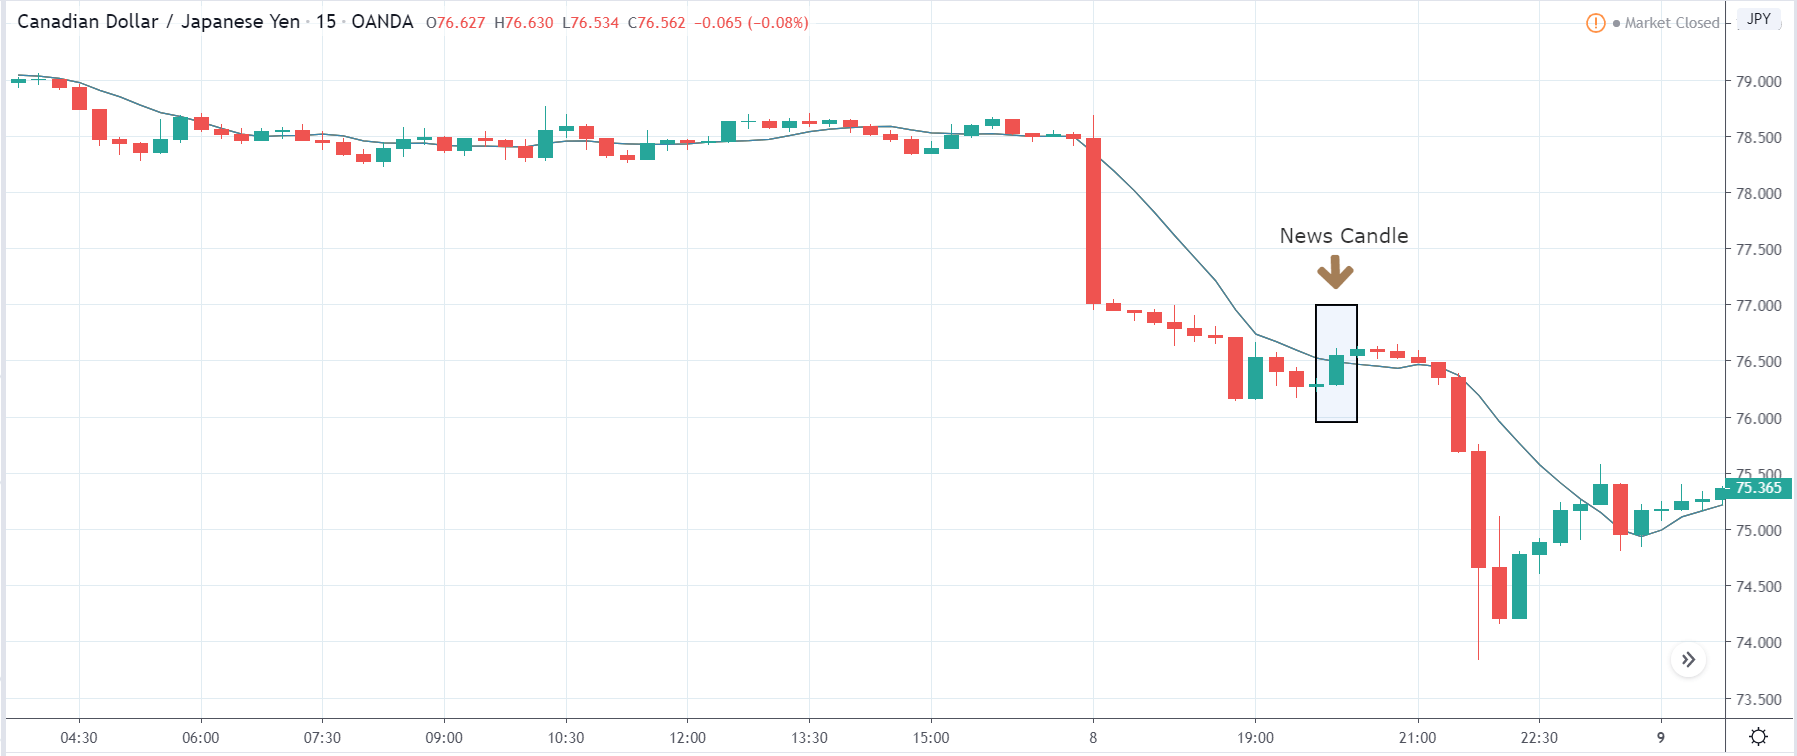
The above images represent the CAD/JPY currency pair, where the characteristics of the chart appear to be similar to that of the above-discussed pairs. The price is violently moving lower before the news announcement with almost no retracement of any kind. We will be looking to sell the currency pair only if we geta price retracement due to the news release or any other release.
After the news announcement, we see the volatility increases to the upside for some time, and the ‘news candle’ closes with some bullishness. The market goes up as a consequence of the below than expected Capital Formation data where there was a reduction in the Capital Formation during the fourth quarter. Cheers!