Introduction
Government Spending is an essential determinant of the economy’s growth. The portion of GDP that is allocated to Government Spending can primarily set the pace of economic growth. Increased Government Spending has been a critical lever to stimulate the economy during times of recession.
Government Spending numbers also determine whether the Government is elected by people next time or not. Hence, Government Spending numbers also can help or hurt the Government in elections. Thus, this can be considered a critical macroeconomic indicator for economists, analysts to predict upcoming trends.
What is Government Spending?
The Government Consumption Expenditures and Gross Investment are together, forming what is called Government Spending in general. Both of these are the final expenditures accounted for by the governing sector. Government Consumption Expenditures contains Spending by the governing body to produce and provide goods and services to the public. Expenditures would typically include National Defense and Public School Educations, etc.
Gross Investments includes the Spending by Government for fixed assets that directly benefit the general public. Investments can consist of road construction, public transports, or procuring military equipment. Hence, overall Government Spending refers to the money spent on the acquisition of goods and services such as education, health, social protection, and defense. When the Government procures products and services for current use to directly benefit an individual or collective requirements of the community, it is called Government final consumption spending. When the same is done for future use, it is classified as Government investment.
Government Spending assists businesses and people economically in many ways. Unemployment compensation, Child Nutrition, Student Loans, retirement and disability programs, etc. all are facilitated out of Government’s revenue. During the time of recession or economic contractions, the Government increases its Spending and decreasing tax rates to stimulate the economy and vice-versa.
There are four primary sources for Government Spending:
- Tax Receipts
- Indirect Taxes
- Money borrowing from citizens (ex: government bonds)
- Money borrowing from foreign (ex: Loans from World Bank)
How can the Government Spending numbers be used for analysis?
The main factors that affect Government Spending are:
Mandatory Programs: In the United States, necessary programs like Social Security, Medicaid, and Medicare make up about two-thirds of federal expenses. As more baby-boomers reach retirement age, the increase in all the above costs puts weight on Government that affects its spending capability. These kinds of payments where there is no exchange of goods and services in return are classified as Transfer Payments Spending.
National Debt and Interest bills: The United States currently has a record-high debt level of 22 trillion US dollars, which, when taken as a percentage of GDP, exceeds a hundred percent. What this means is that the National Debt is greater than the revenue it generates. Even if the entire GDP were allocated to service debt hypothetically, it would still not suffice. Such skyrocketed debt levels have put the country in between a rock and a hard place. The United States must keep the interest rates low to be able to continue paying its interests to avoid the risk of default.
Defaulting on the debt could be catastrophic for the nation and can lead to economic collapse. Increased deficit spending (Spending beyond budget) to stimulate the economy during times of recessions and bearing expenses of war and international contingency operations all have piled on the debt burden further.
Discretionary Spending: For the above two categories, the Government has no choice but to spend, but Discretionary Spending is for everything else. The Government decides how much money is to allocate to programs. Cutting back majorly on these can hurt the governing bodies in the next elections. Increased Discretionary Spendings can help in the short-run, but in the long run, all these will catch up, and consequences can be severe.
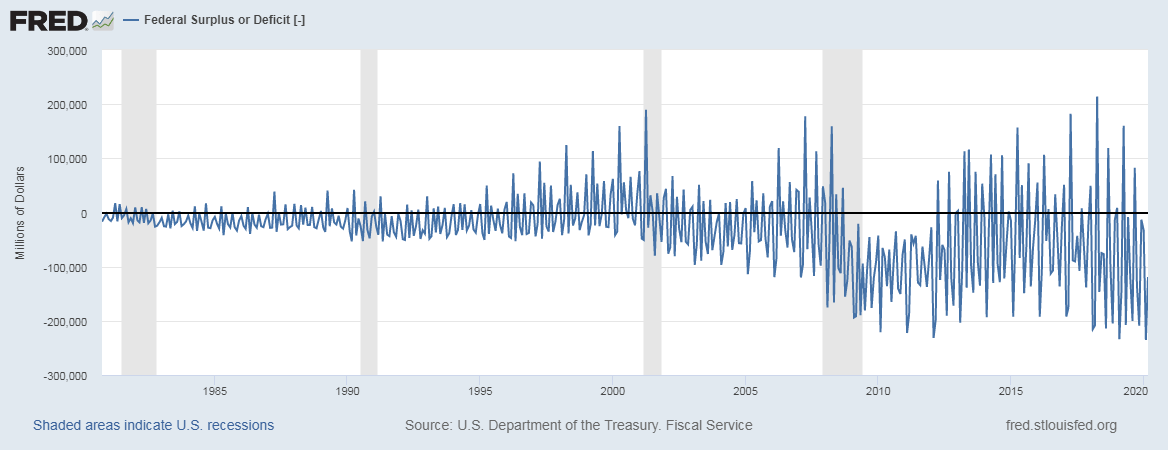
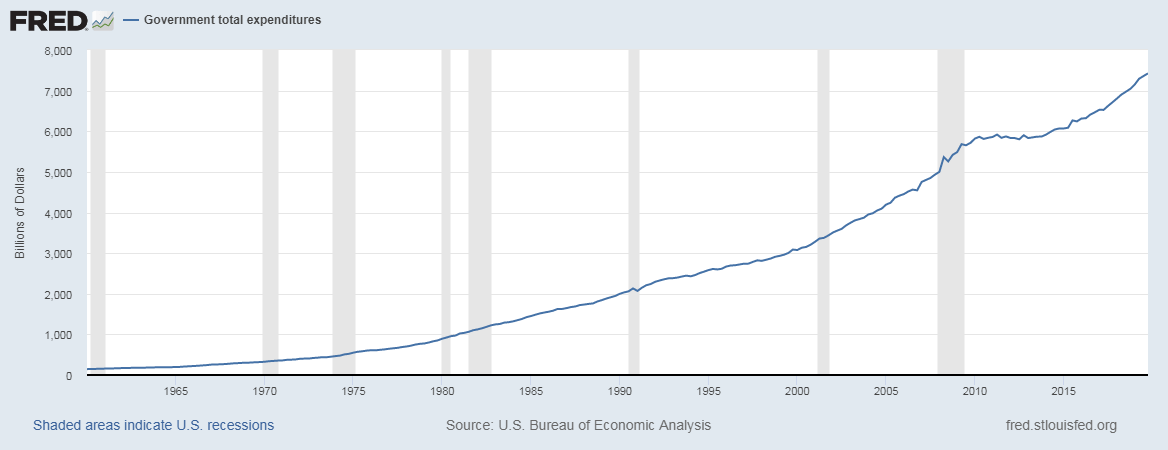
GDP: The revenue itself is an essential factor; decreased GDP rates can create deflationary situations that the Government tries to avoid in all conditions. Increased productivity and stimulations that result in higher prints in GDP can help service debts and still have enough resources to spend on economic activities freely. Increased taxes can help build up revenue for the Government but can lead to losing elections as the public might vote them out for imposing higher taxes. The Governments have increasingly relied on deficit spending to boost economic growth as indicative of the below graph.
Impact on Currency
By relative comparison with previous years, what policymakers have decided to spend on can determine many local level and national level economic impacts. Cutting back on certain sections can lead to slowdowns in that sector and vice-versa. Investors and Economists use this to predict economic trends.
In general, a relative increase in Government Spending is good for the economy. This indicator is typically expressed as a percentage of GDP, signifying how many portions of the total revenue Government has prioritized over debt servicing to stimulate growth. Government Spending for a given business cycle will decide the economy’s inflationary or deflationary conditions. When the economy is growing at a faster pace than the targeted rate, the Government can cut back on Spending and service their debts, or increase taxes to stabilize and vice-versa.
In this sense, Government Spending is a proportional indicator, the more, the better for the economy. It is a lagging indicator, as it is usually reactionary to situations in the marketplace and not an initiative effort. Government Spending is a lever used generally to fix an issue that already has happened (hyperinflation or deflation), hence has a lower impact on the long-term market volatility in the world of trading markets, although there may be some panic trading due to press releases.
Economic Reports
The Bureau of Economic Analysis releases quarterly reports on Government Receipts and Expenditures, which contains the Spending on different sectors, on their official website.
The Organisation for Economic Co-operation and Development also releases quarterly estimates of the associated countries on their official websites under the category of General Government Spending in two varieties: Government Spending per Capita and Government Spending as a percentage of its GDP.
Sources of Government Spending
The United States Bureau of Economic Analysis reports are available here:
The General Government Spending details are available for OECD countries on their official website here
Quarterly Government Spending reports of the United States Government can be found here categorically.
Below is a comparative index for countries – Government Spending as a percentage of GDP. Government Spending as a percentage of GDP – Trading Economics
Impact of the ‘Government Spending’ news release on the price charts
We understood in the previous section of the article that Government Spending refers to the money spent by the public sector for purchasing goods and providing essential services such as education, healthcare, social protection, and security. The two major categories of Spending include Current Spending and Capital Spending.
Government Spending ensures that the country is having basic facilities such as roads, bridges, hospitals, schools, and other allowances such as unemployment and disability benefits. Hence public sector spending plays a crucial part in the economic growth of a country. If Government Spending of a country is high, it also attracts foreign investment and other capital flows. Thus, the greater the Government spends, the greater will be the growth of the currency.

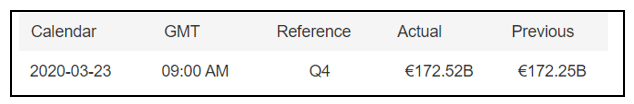
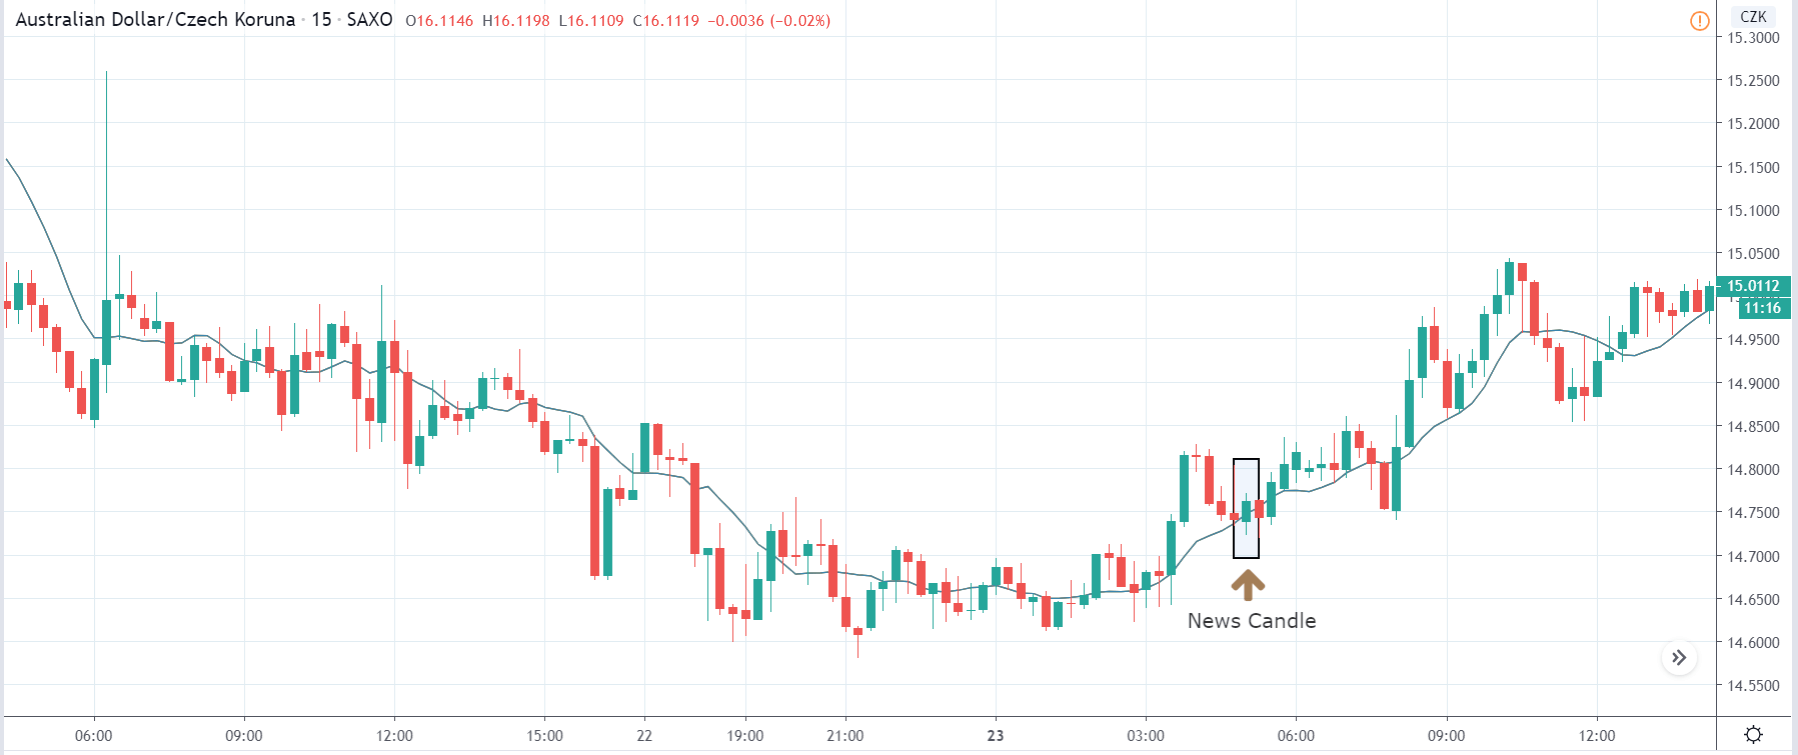
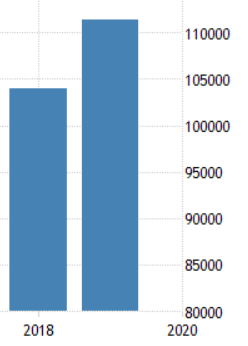
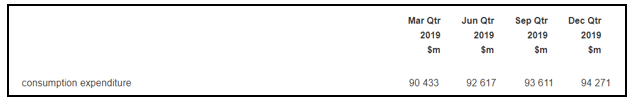
Today we will be discussing the impact of the news release on various currency pairs and examine the change in volatility before and after the release. For this, we have collected the latest Government Spending data of Australia, where the below image shows the quarter-on-quarter numbers of the same. The latest figures show an increase in Government Spending for the December quarter compared to the previous quarter.
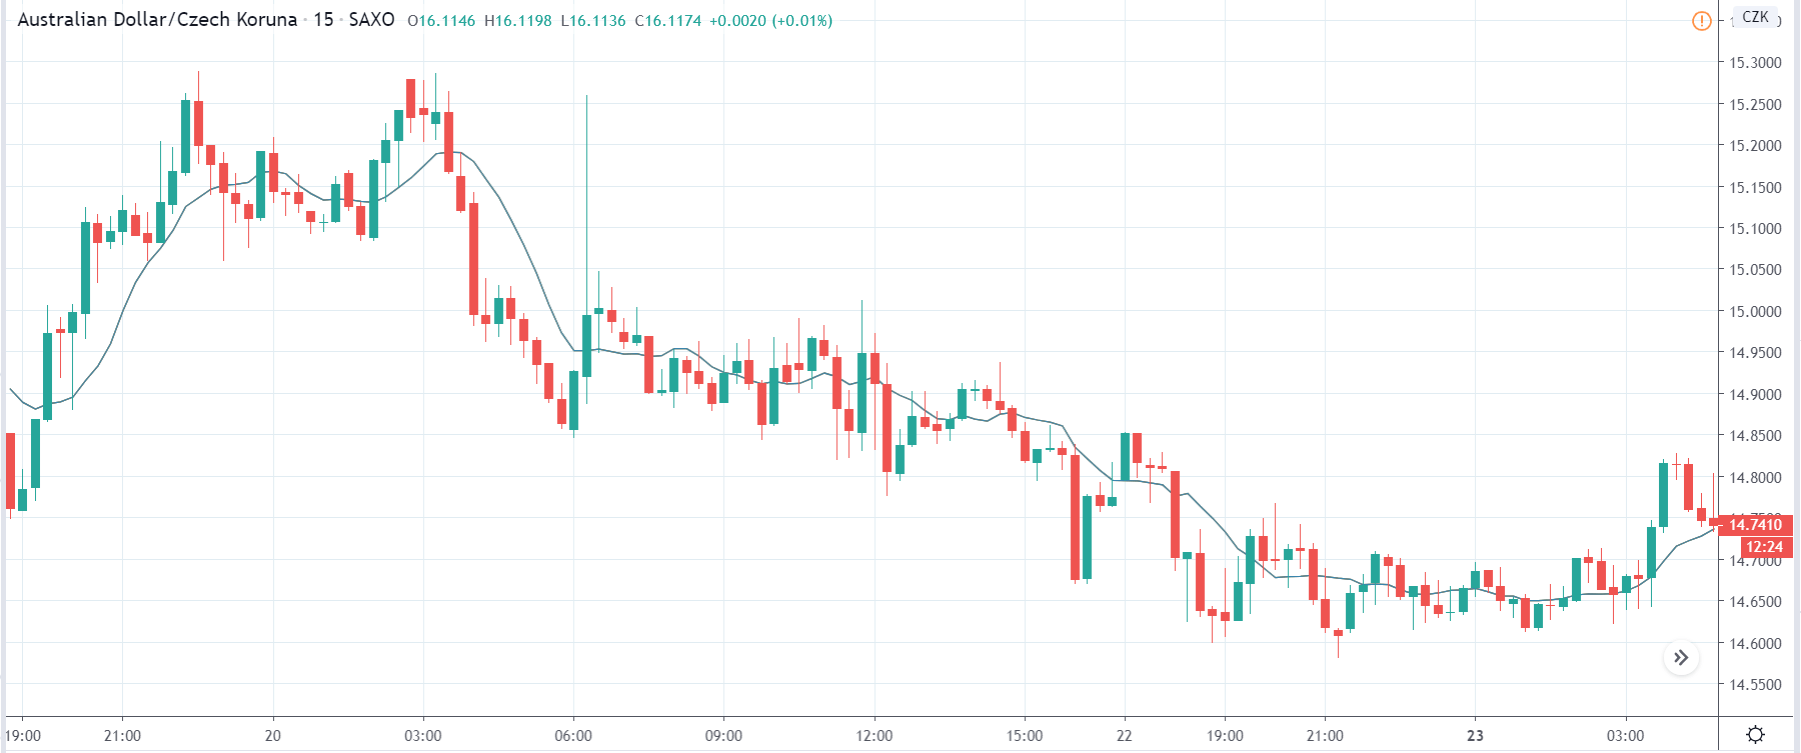
AUD/USD | Before the announcement:

The first currency pair we will be discussing is the AUD/USD pair, where, in the above image, we see that the market is on the verge of continuing its uptrend after an appropriate retracement. At this point, if the Government Spending comes out to be positive for the Australian economy, we can expect the price to rise at least the recent ‘high.’ But if it were to be negative, we can expect a short-term reversal in the market.
AUD/USD | After the announcement:
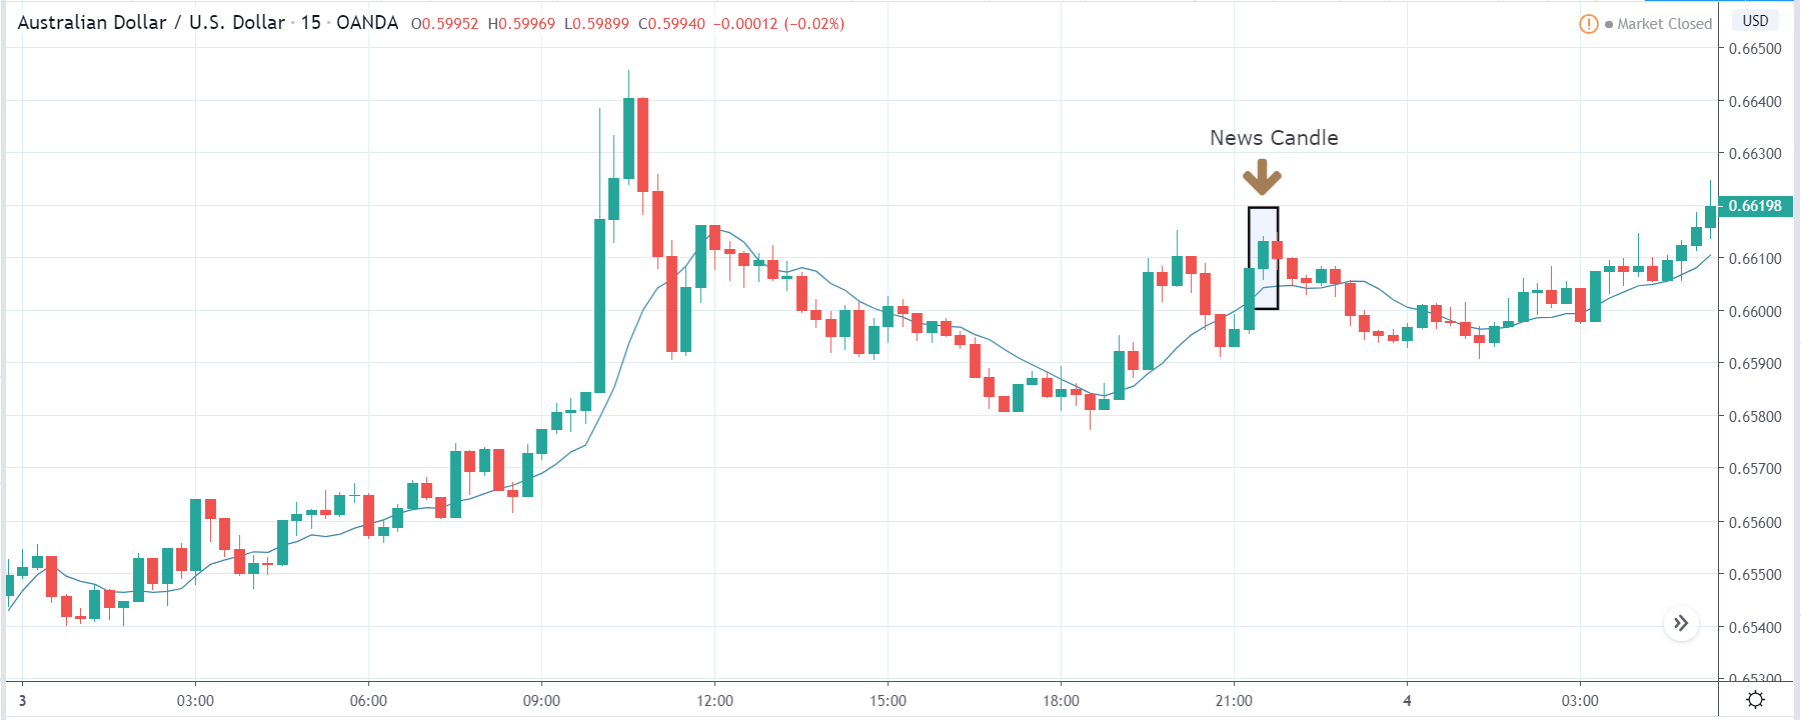
Looking at the chart above, we can say that the market reacted positively to the news announcement and the price closed as a bullish candle. The bullishness in currency is due to the encouraging Government Spending data, which showed an increase in expenditure from the previous quarter. The upbeat data created cheer among traders, which made them go ‘long’ in the currency pair and buy more Australian dollars. One can ‘buy’ the currency pair after the news release after seeing that the data was better than last time.
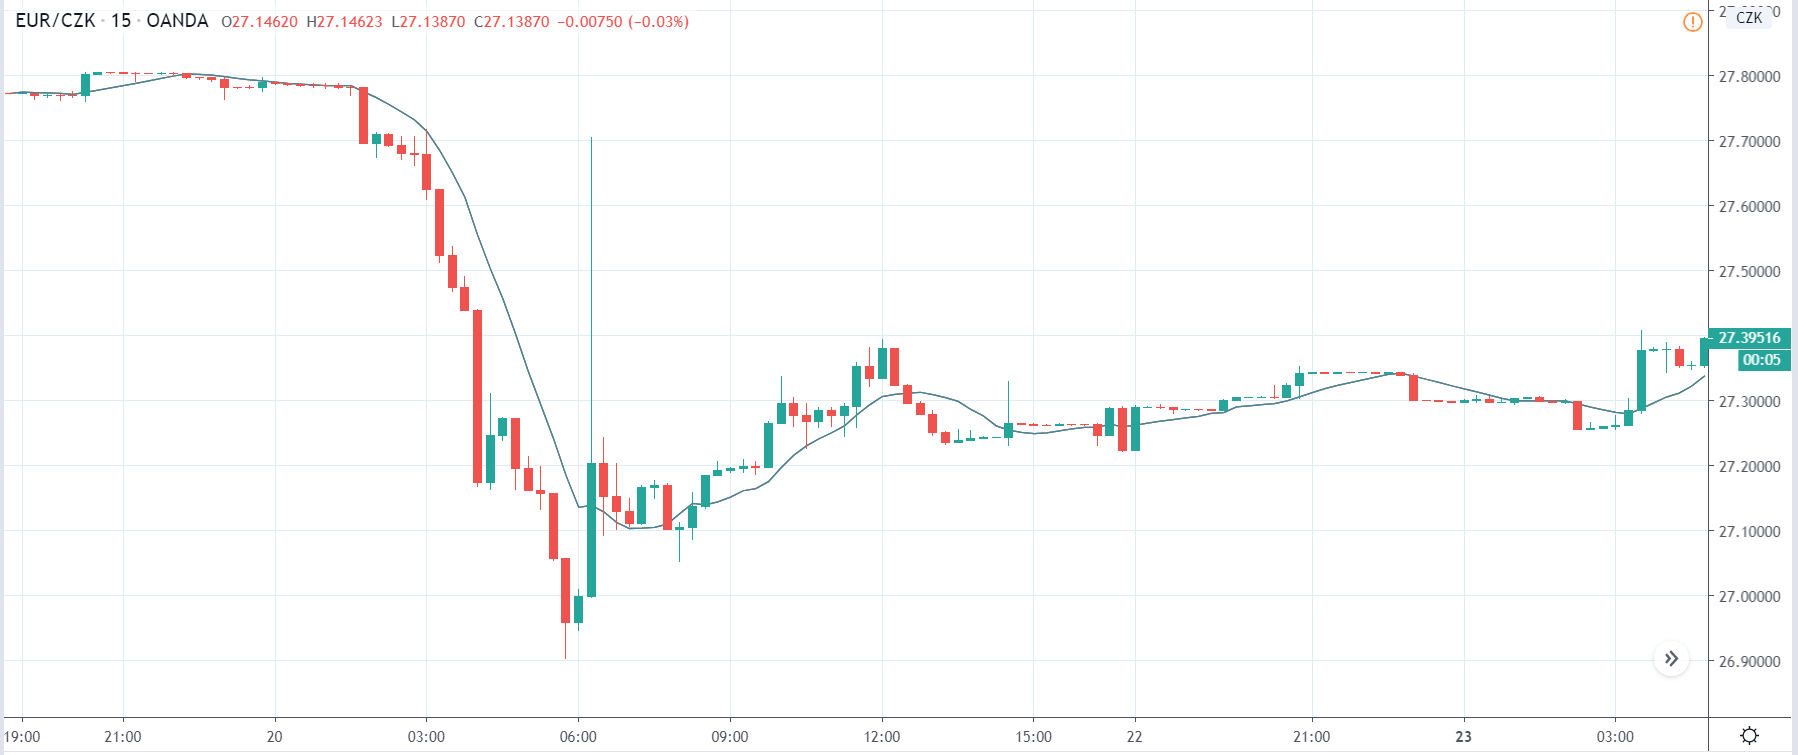
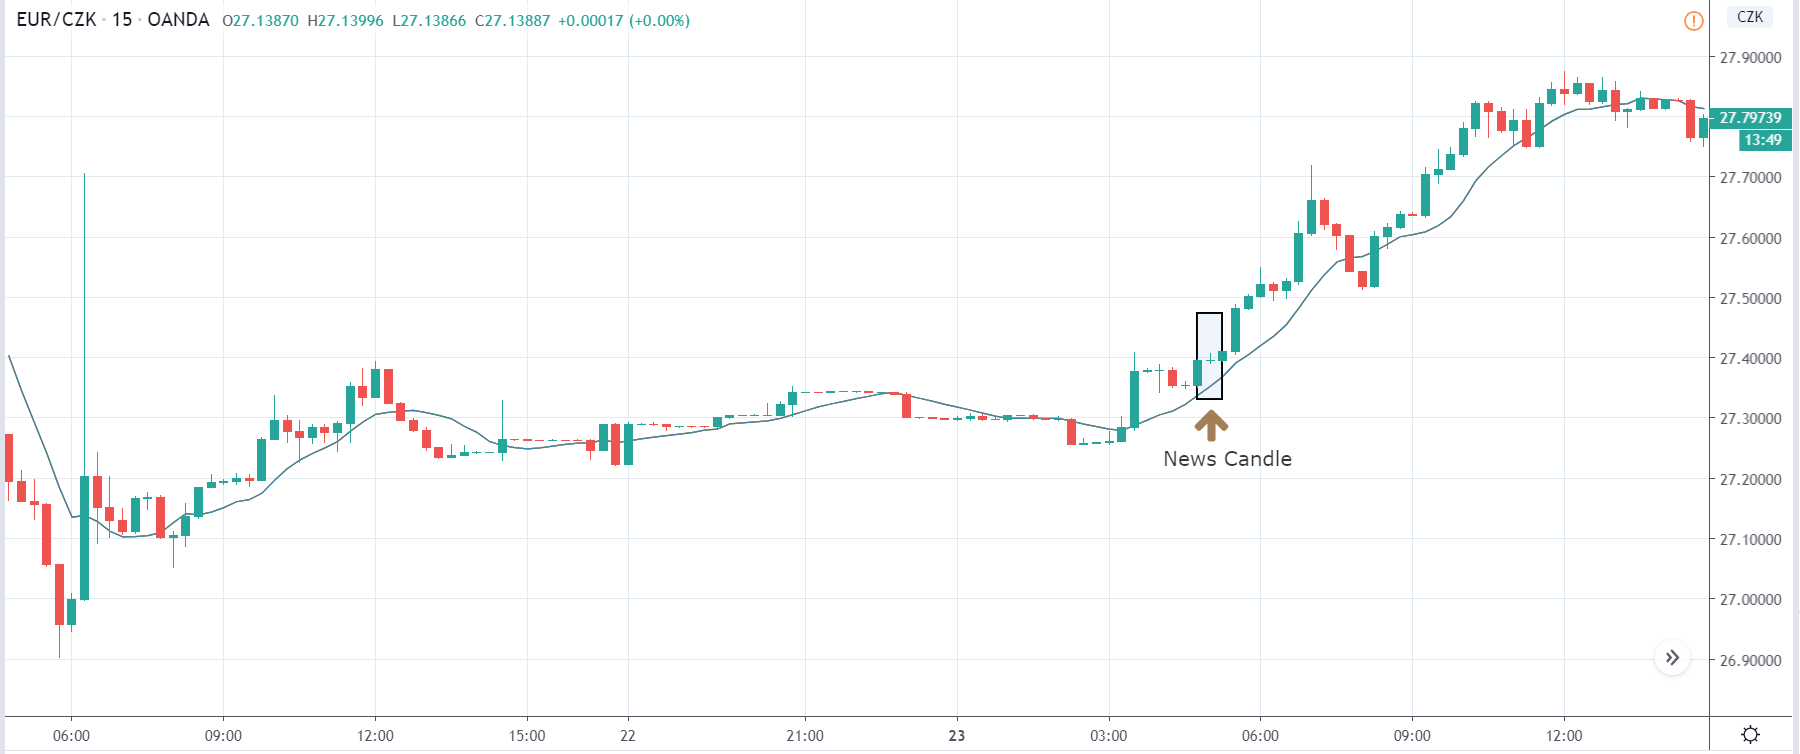
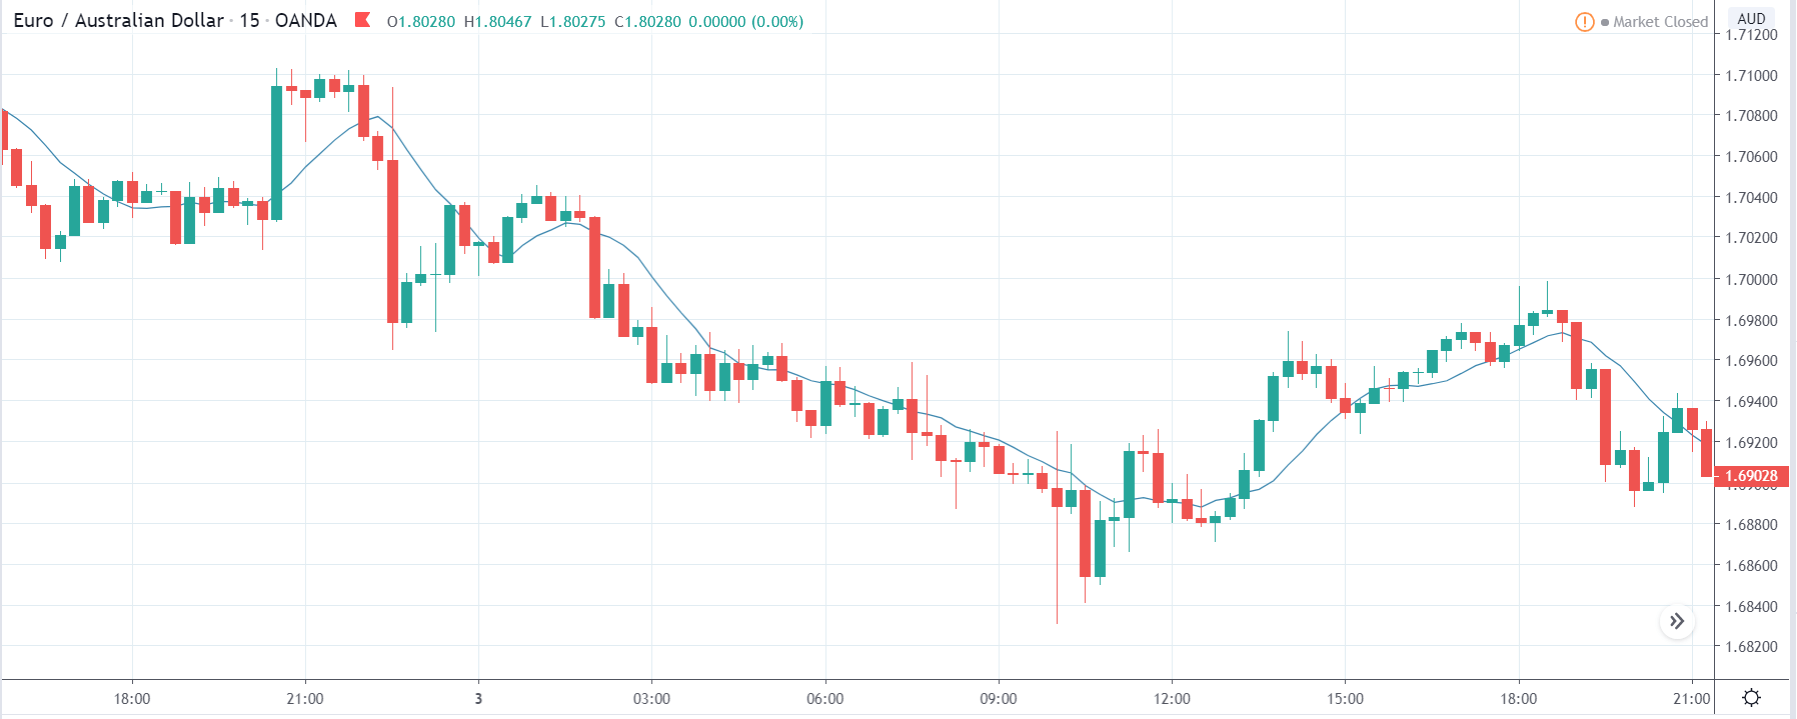
EUR/AUD | Before the announcement:
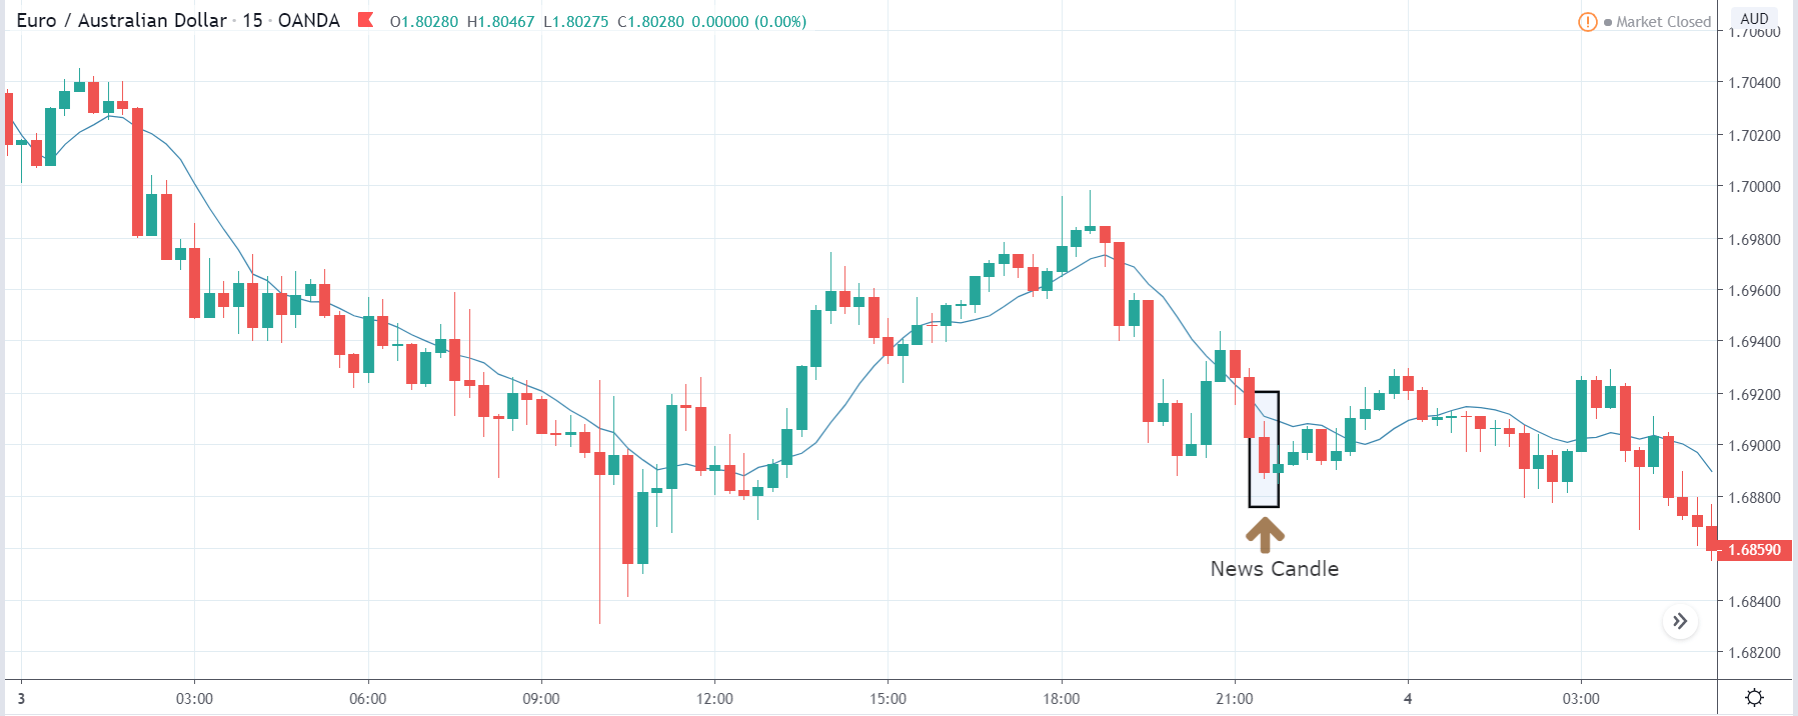
EUR/AUD | After the announcement:
The above images represent the EUR/AUD currency pair, and as we can see, the overall trend and here too market seems to be continuing its downtrend after an appropriate retracement. Since the Australian dollar is on the right-hand side, a downtrend shows strength in the currency. Aggressive traders can take go ‘short’ in the currency pair before the news announcement as the trend shows an increase in the Government Spending from quarter-on-quarter. Remember that the stop loss should be kept higher than the recent ‘high’ due to increased volatility during the announcement.
After the numbers are released, volatility increases on the downside, and the price closes as a bearish candle, indicating selling pressure in the market. This is due to better than expected Government Spending data, which was higher than last time, and thus the market suddenly goes lower. One can go ‘short’ in the currency pair after analyzing the outcome of the data, with a stop loss above the recent ‘high.’
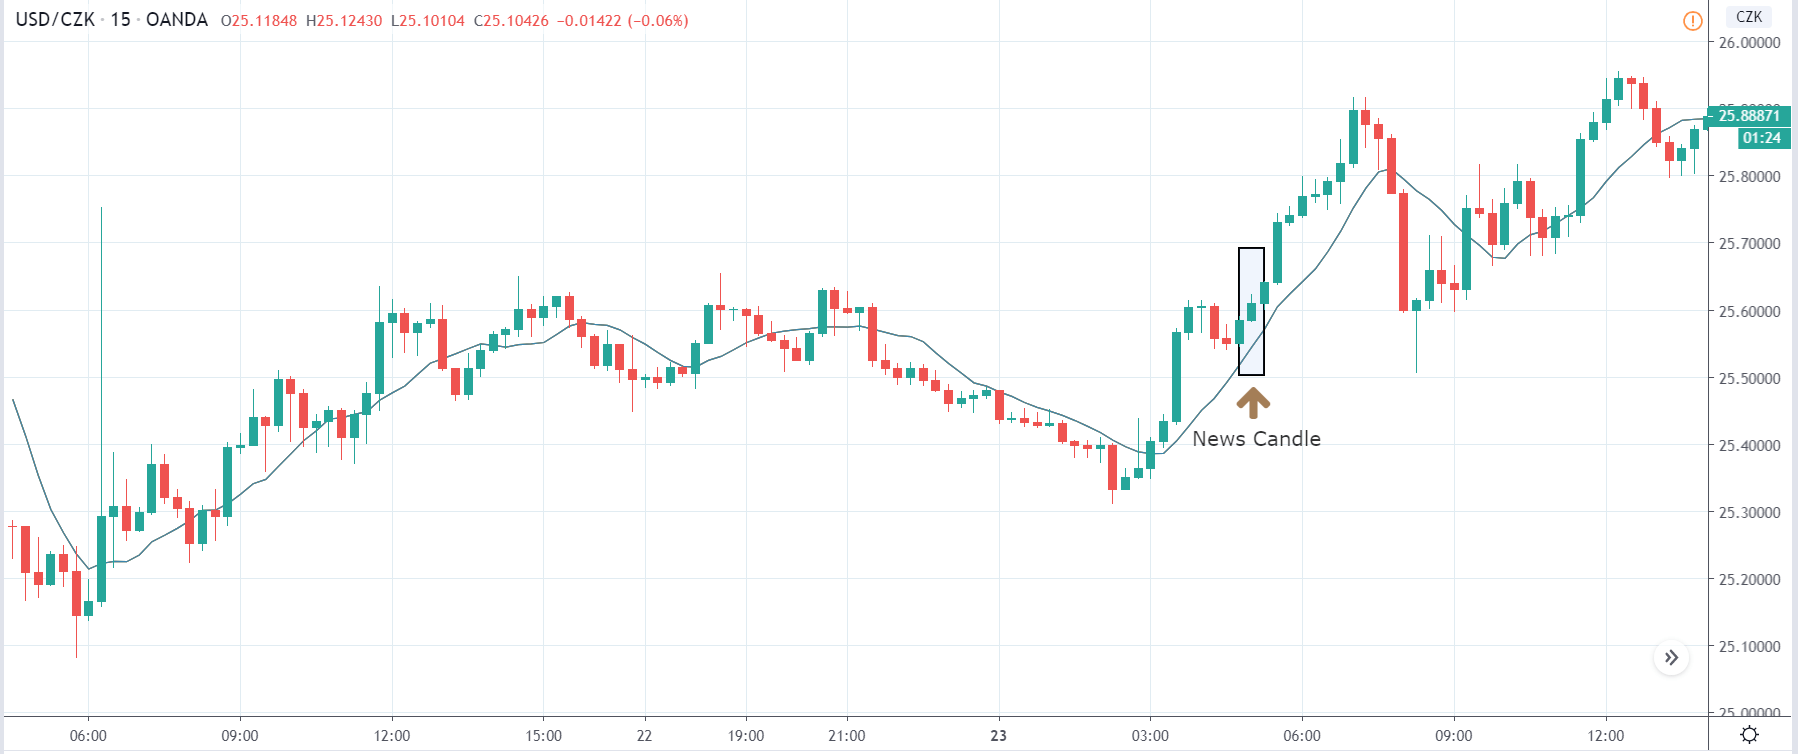
AUD/USD | Before the announcement:
AUD/USD | After the announcement:
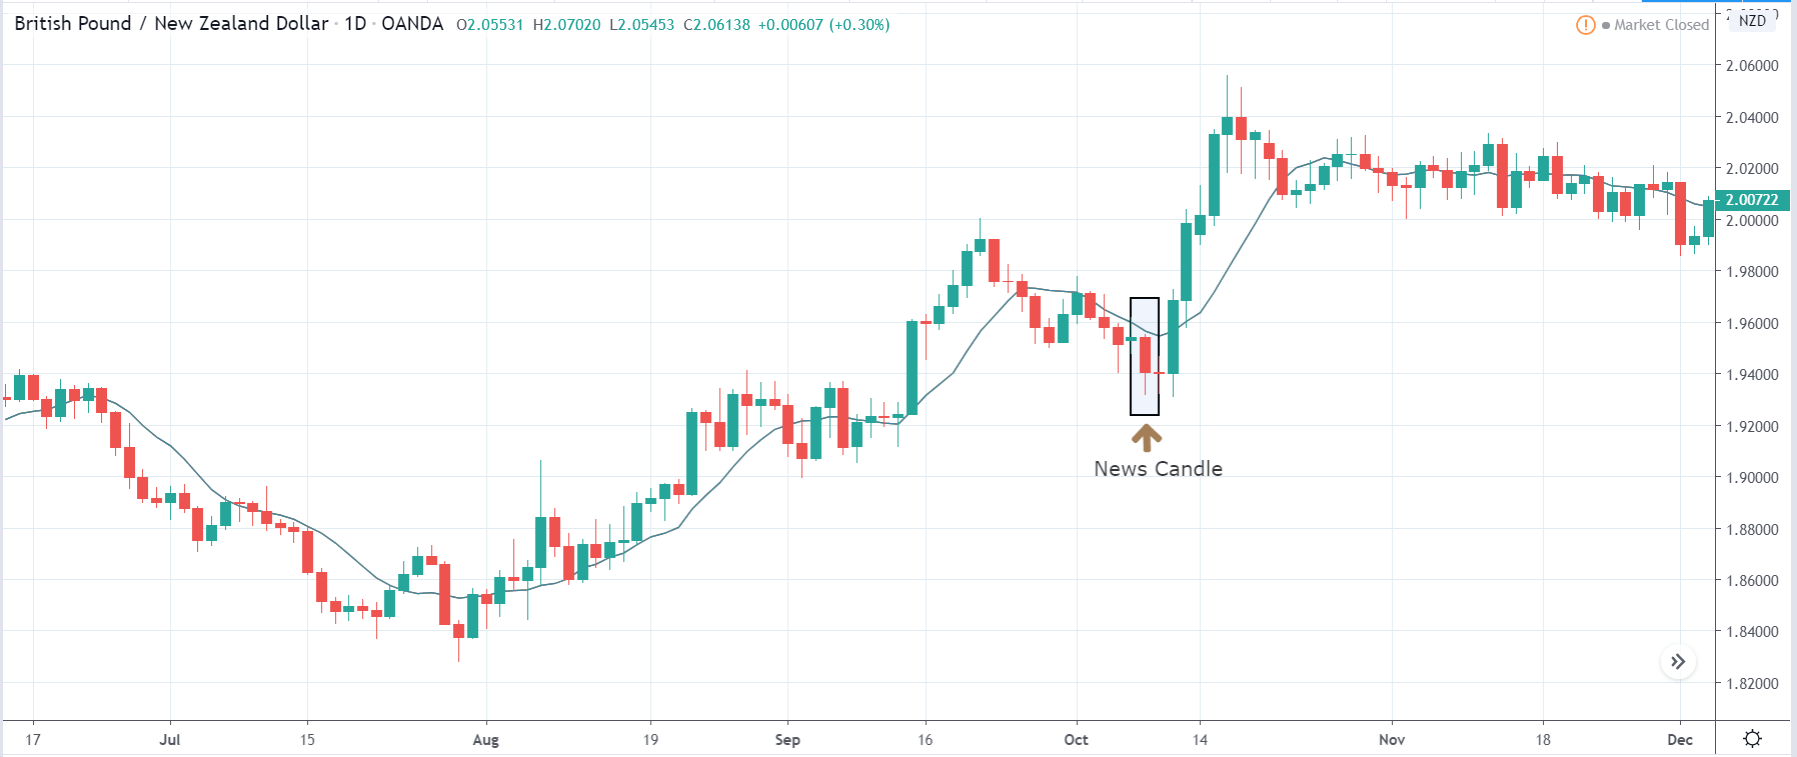
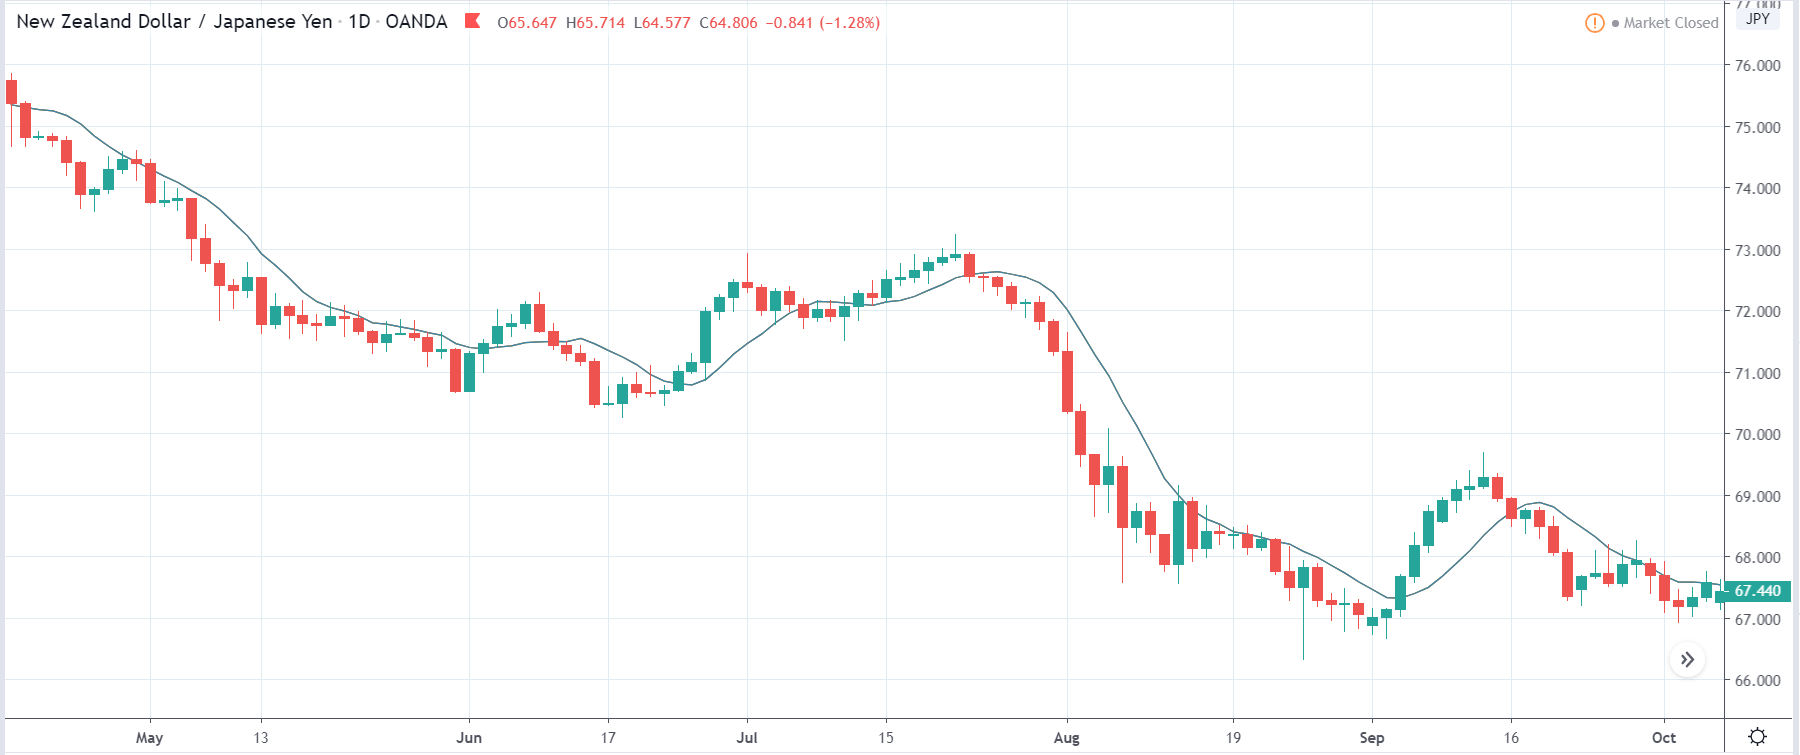
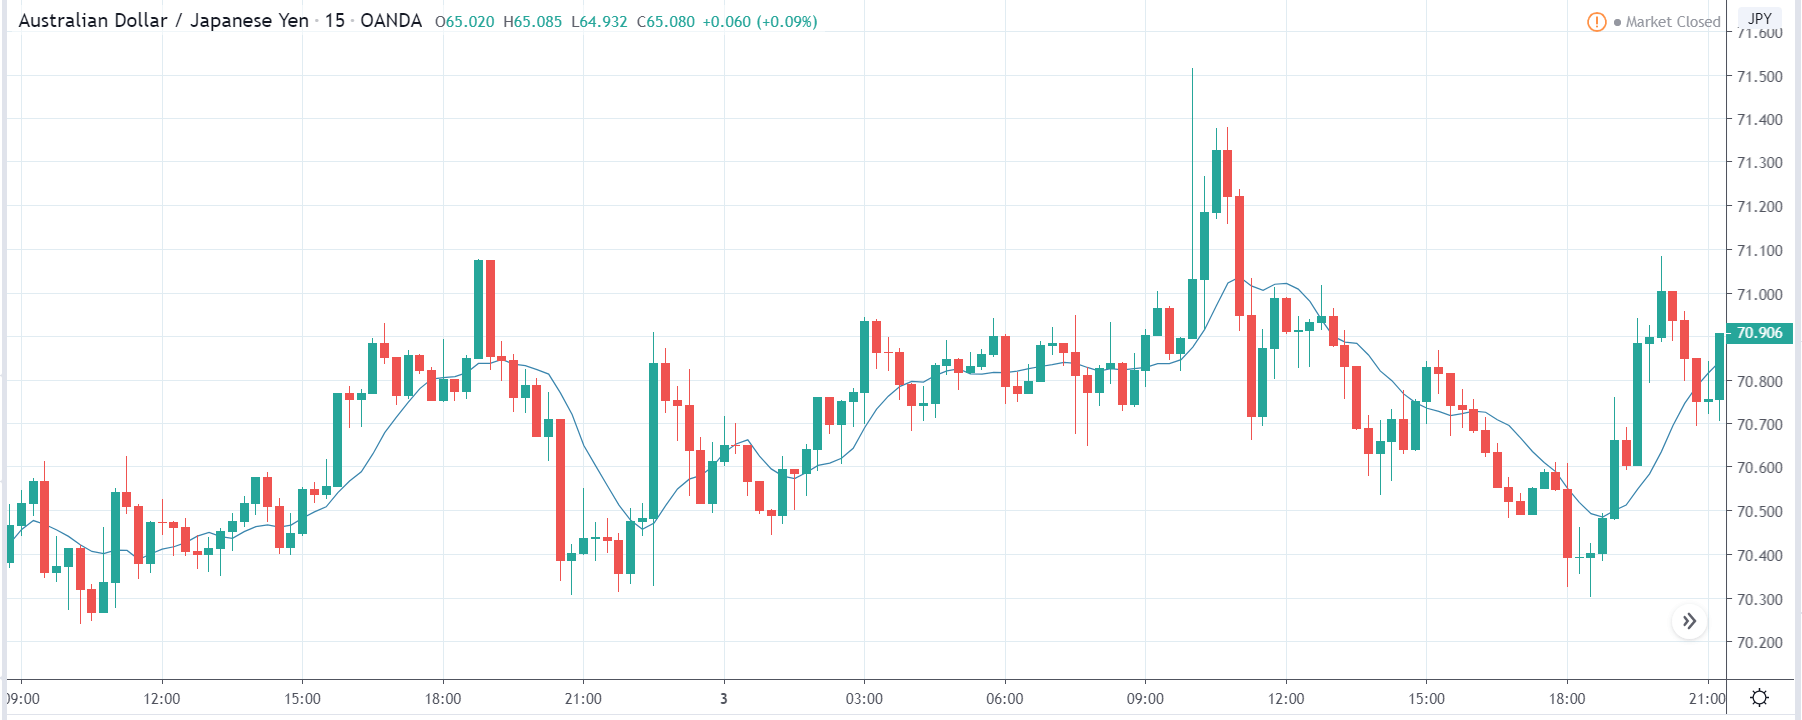
Lastly, we find out the impact of the news on AUD/JPY currency pair, where we, in the first image we see that the market is range-bound and just before the announcement the price is at the ‘resistance’ of the range. This means we could expect sellers to become active at this point. However, the reaction depends on the Government Spending data, which can cause spikes on either side of the market. A ‘buy’ is also not recommended as the market is not in an uptrend.
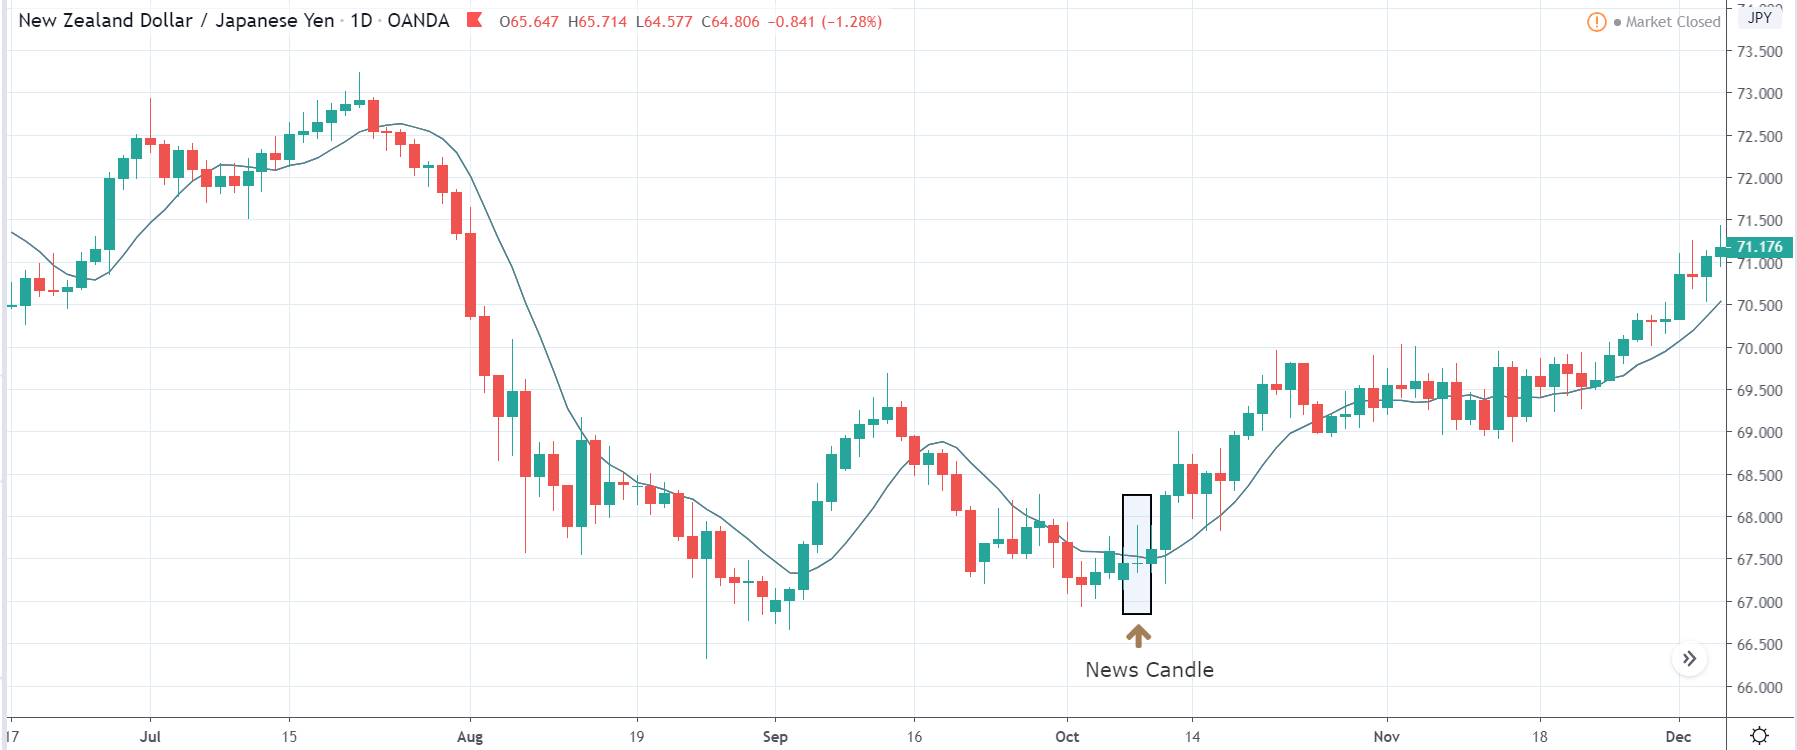
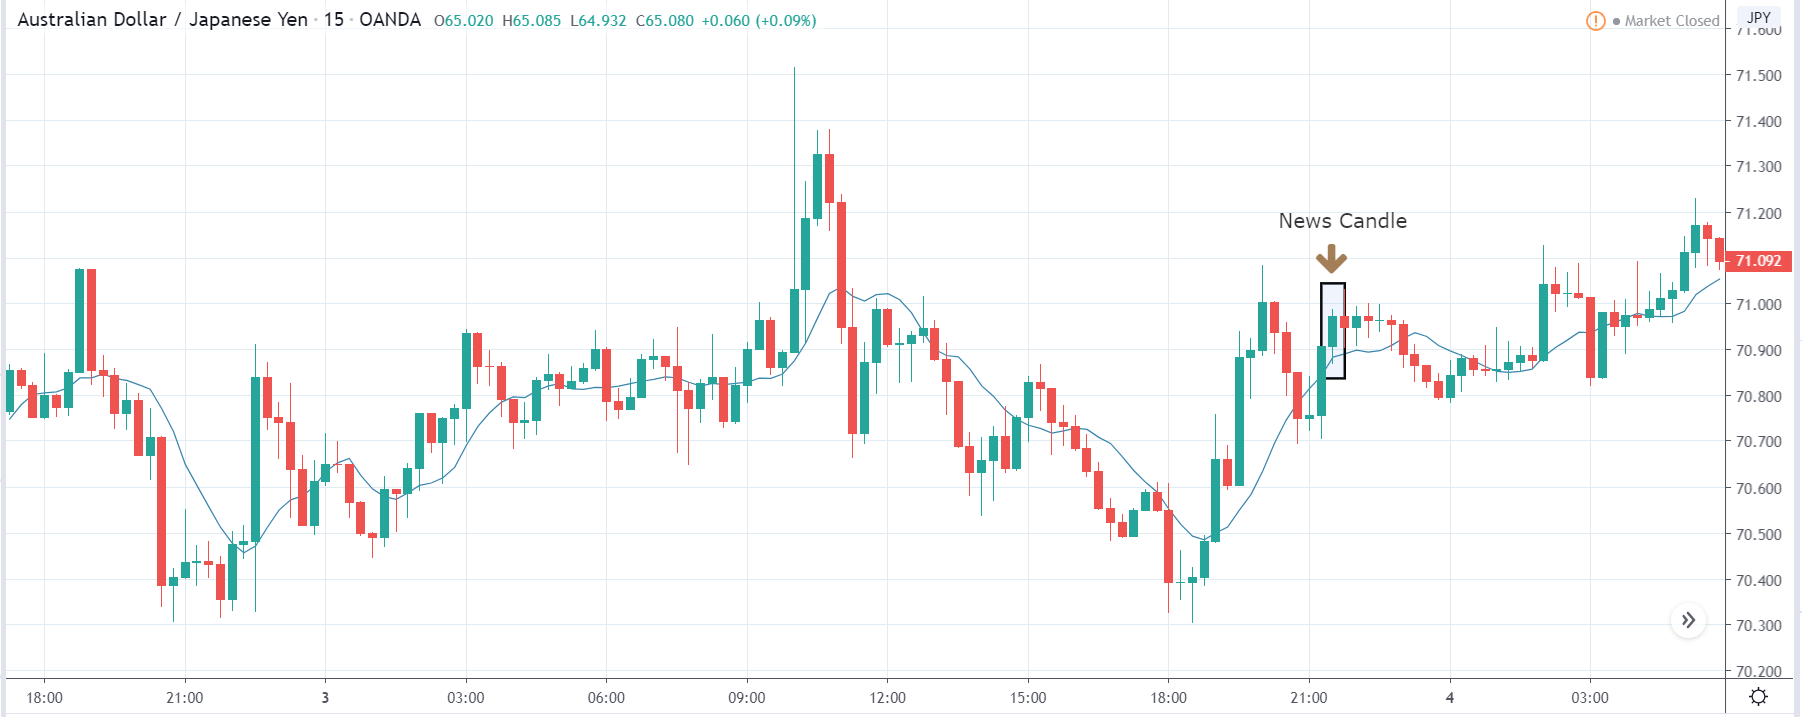
After the news is announced, we witness a similar impact where the price goes higher and closes as a bullish candle. The positive news outcome and an increase in volatility to the upside is the ideal trade setup for going ‘long’ in the market. Thus, one can buy the currency pair with a stop loss below the support and a higher ‘take-profit.’
That’s about ‘Government Spending’ and its impact on the Forex market after its news release. If you have any questions, please let us know in the comments below. Good luck!