Categories
Forex Videos

Fundamental Analysis For Novices – Consumer Confidence


Fundamental Analysis For Novices – Consumer Confidence

Thank you for joining the fundamental analysis for novices’ educational video. This time we will be reviewing consumer confidence.
Hopefully, you will be reviewing all the fundamental analysis for novices videos in the series is comprehensive, and we fully recommend that you work through each educational video.


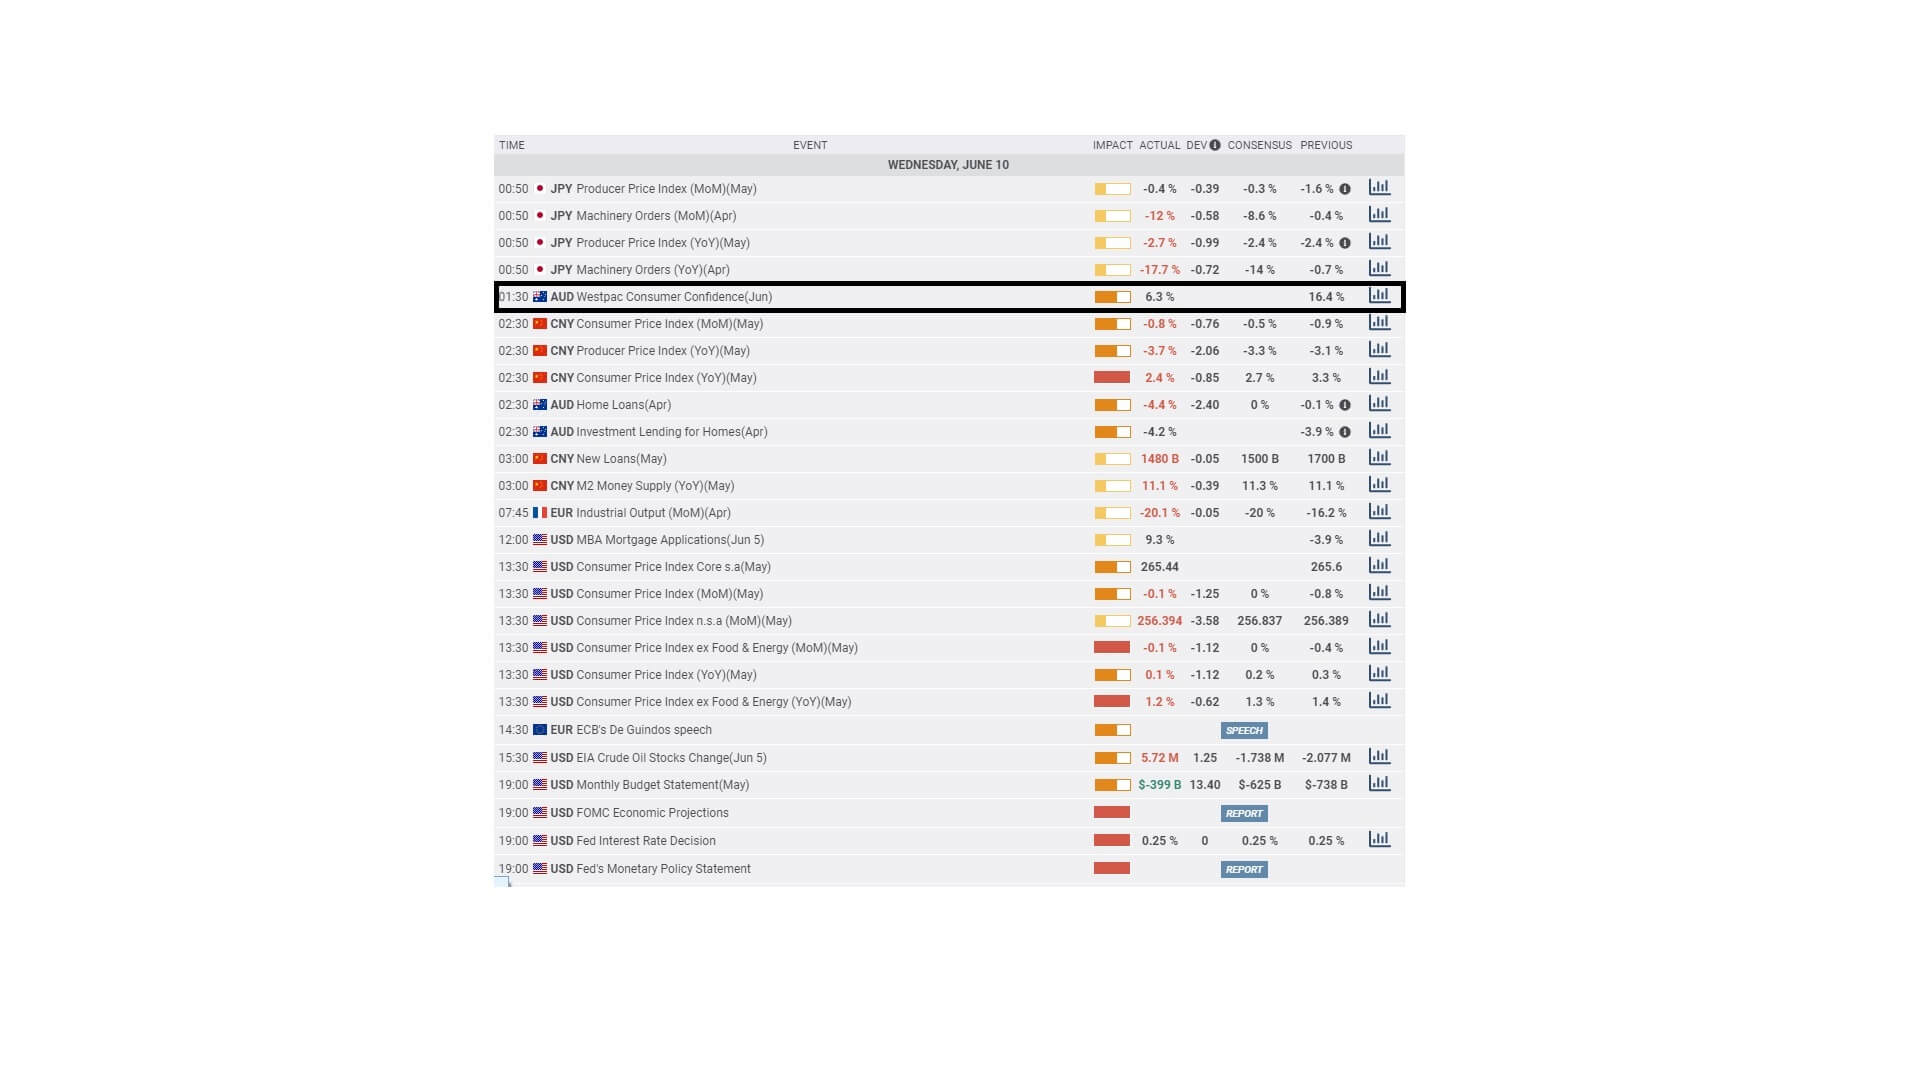
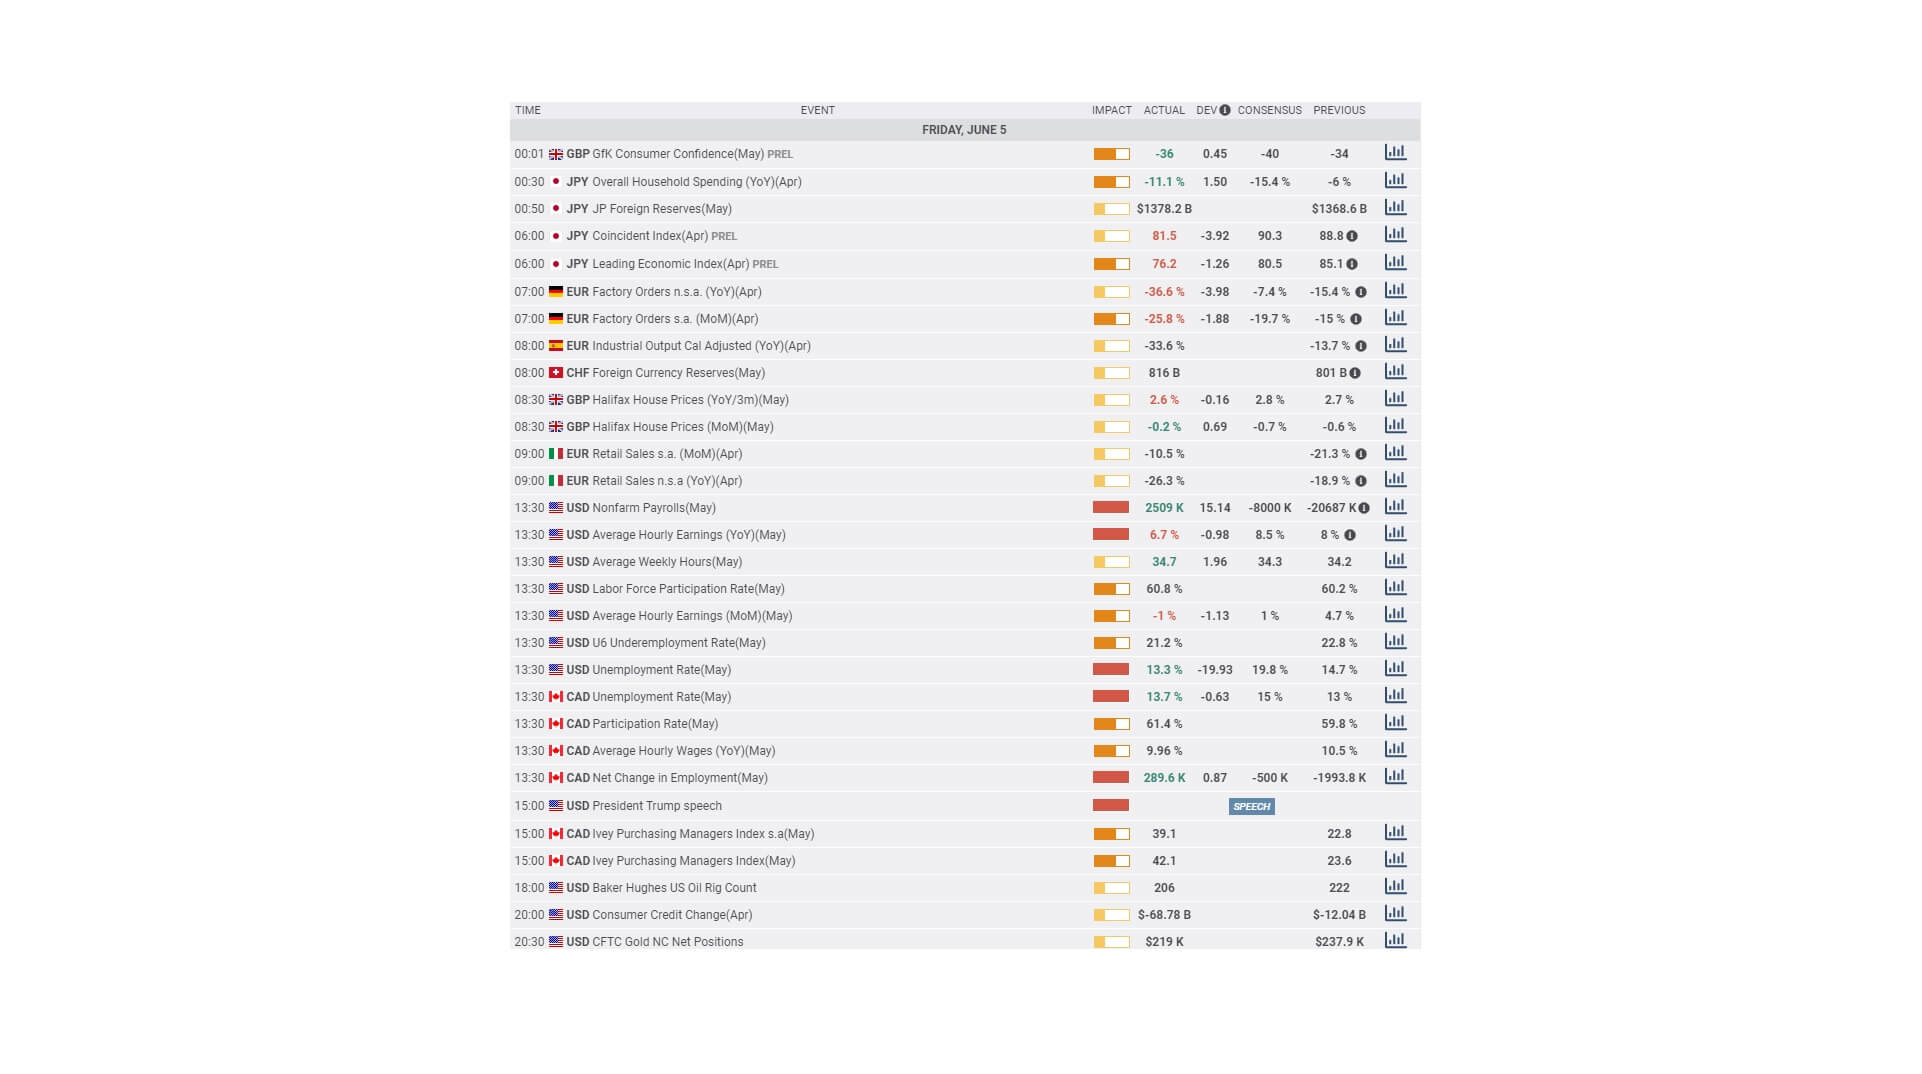
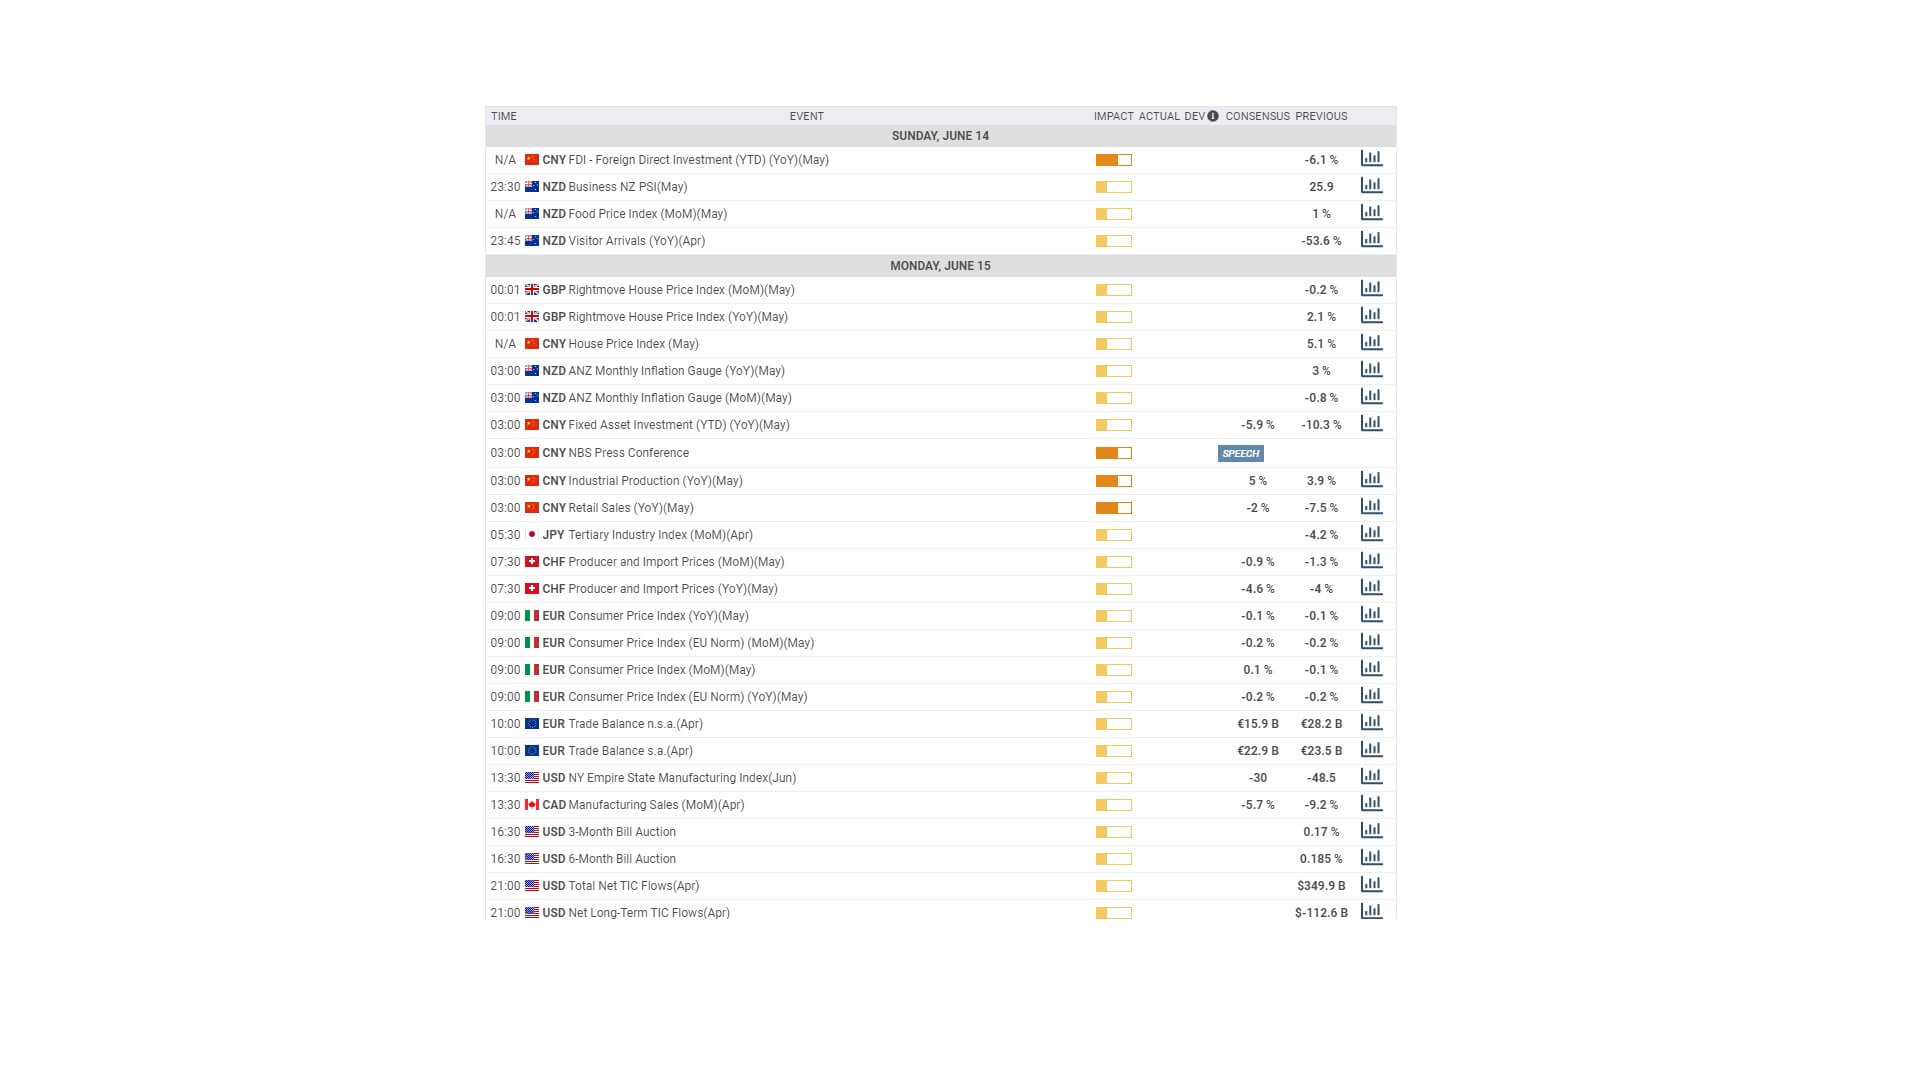
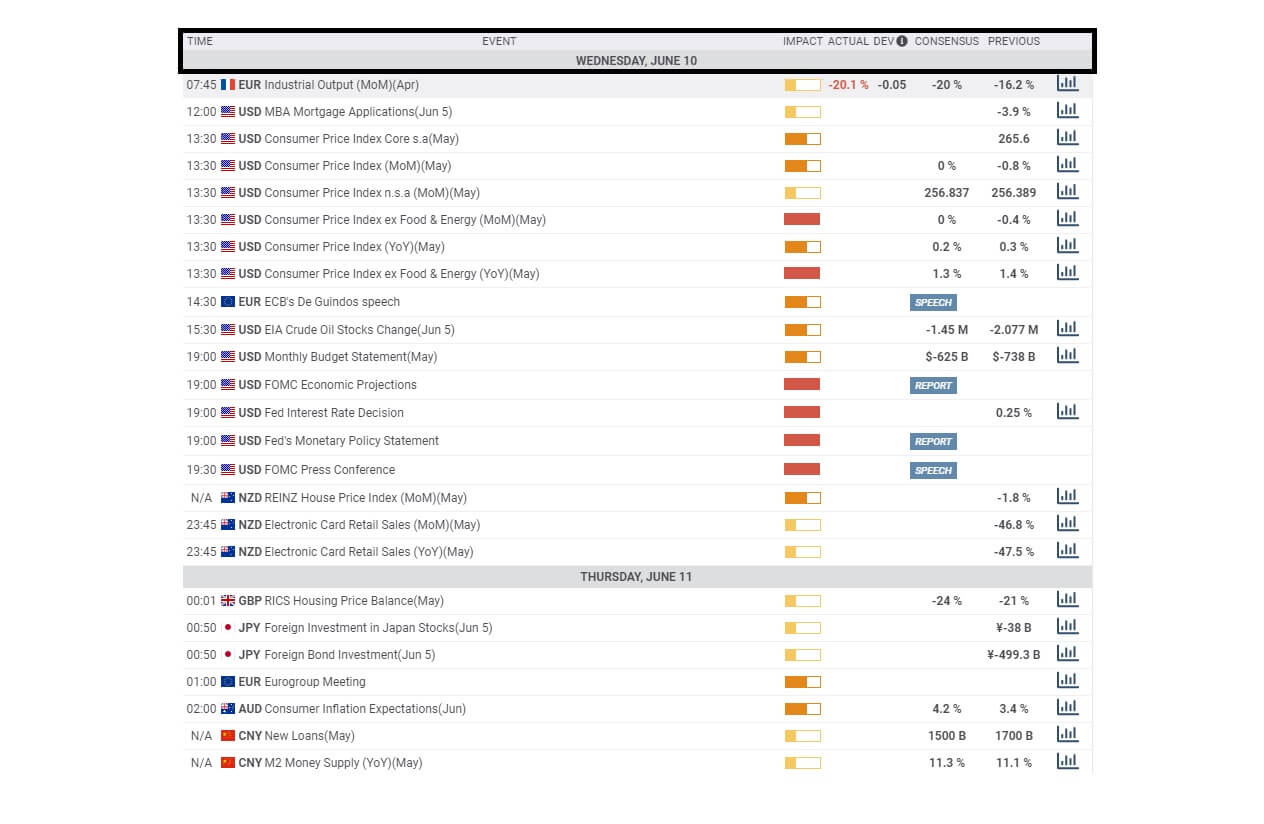
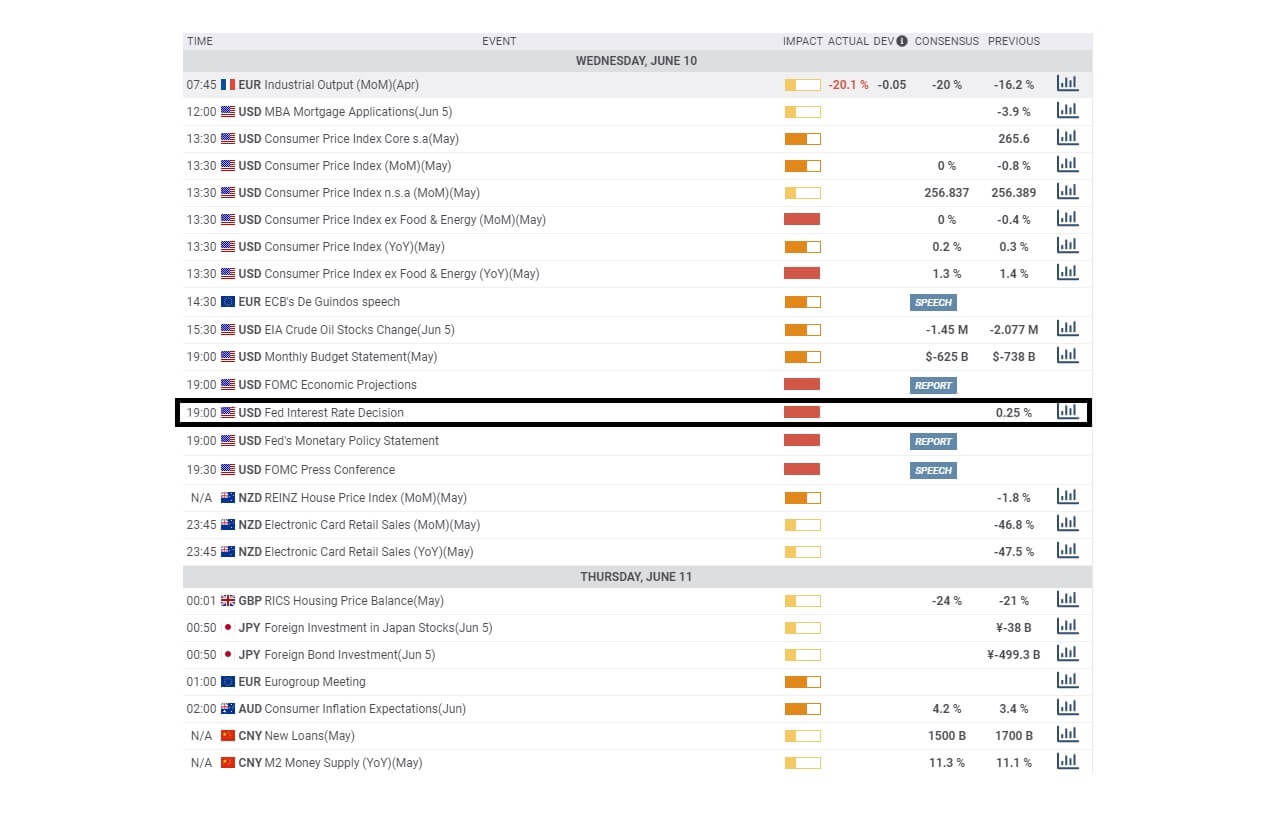
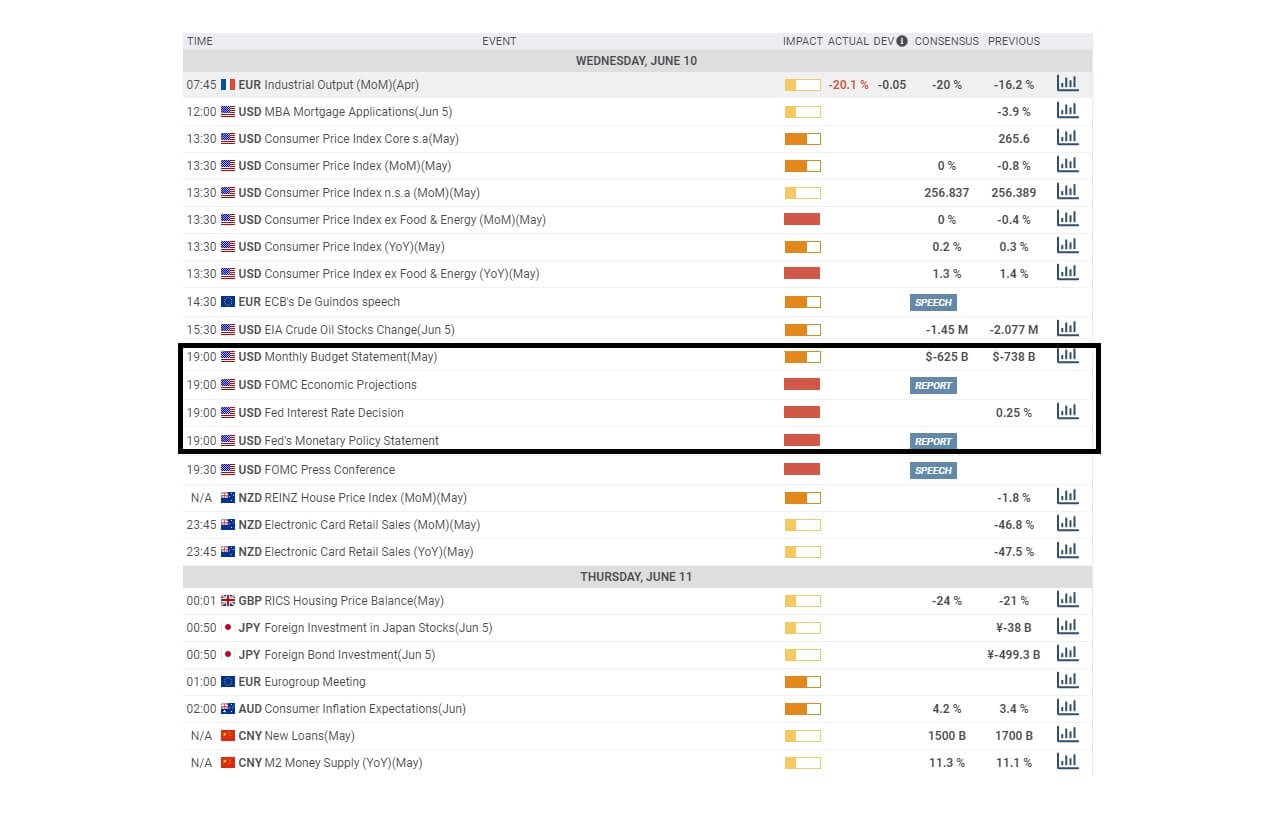
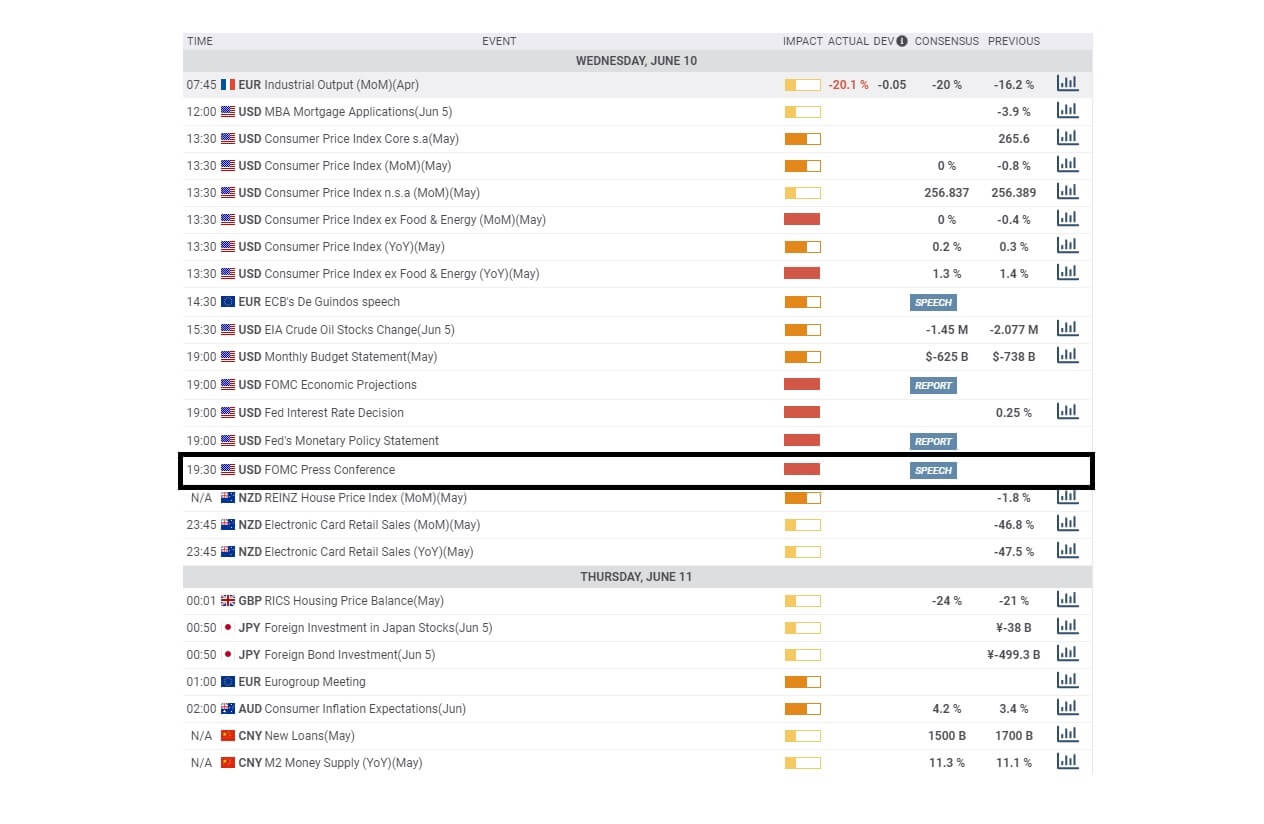
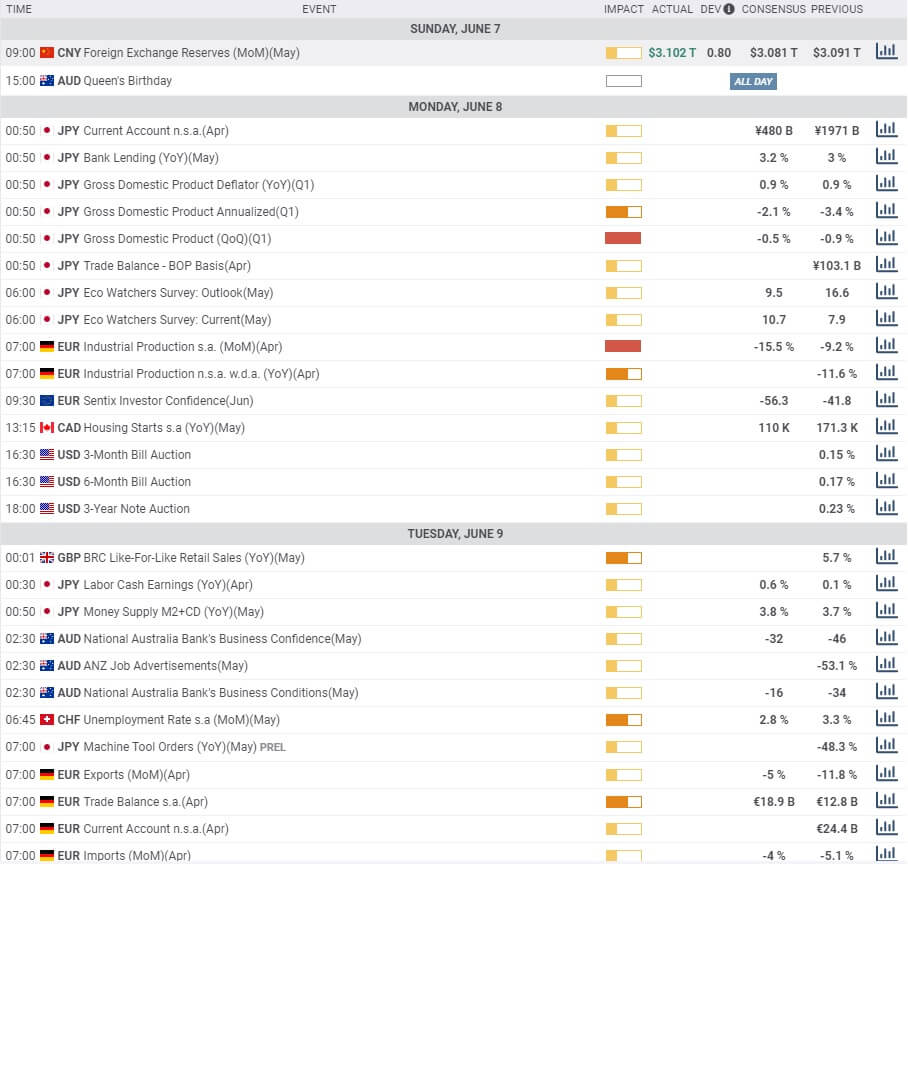
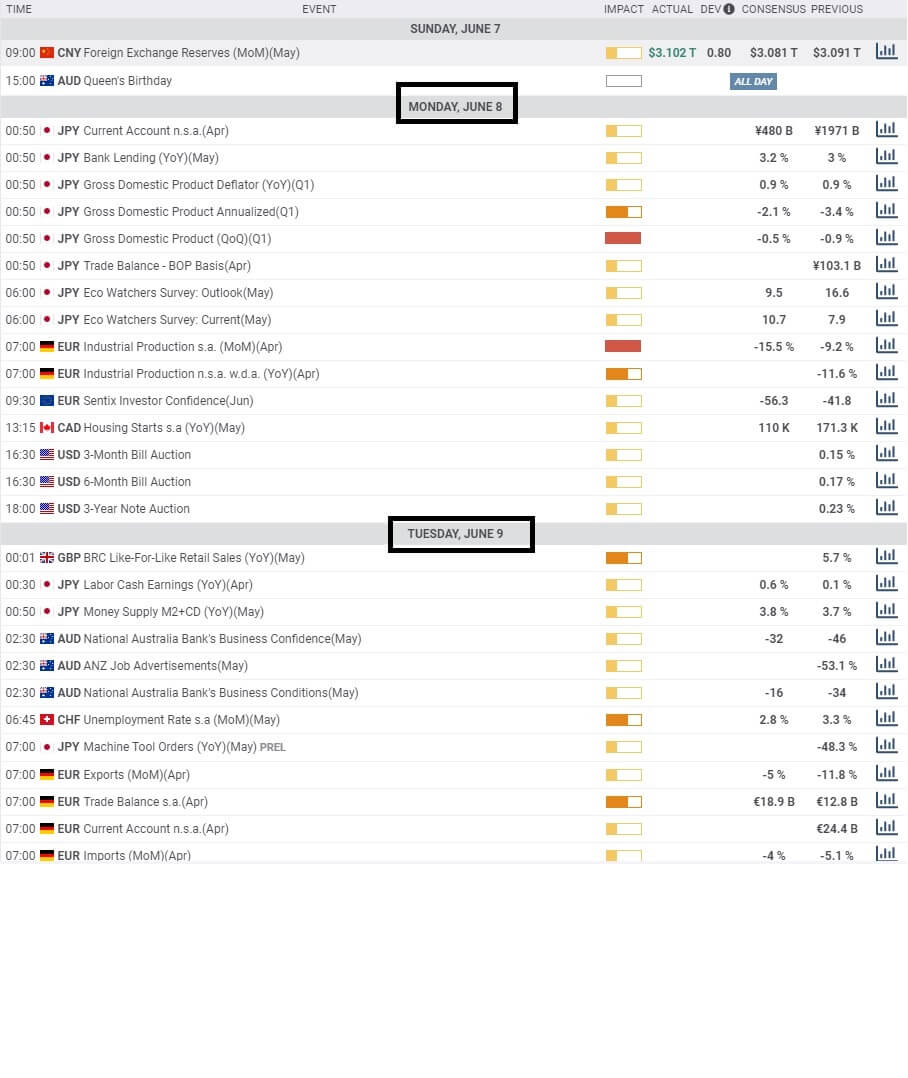
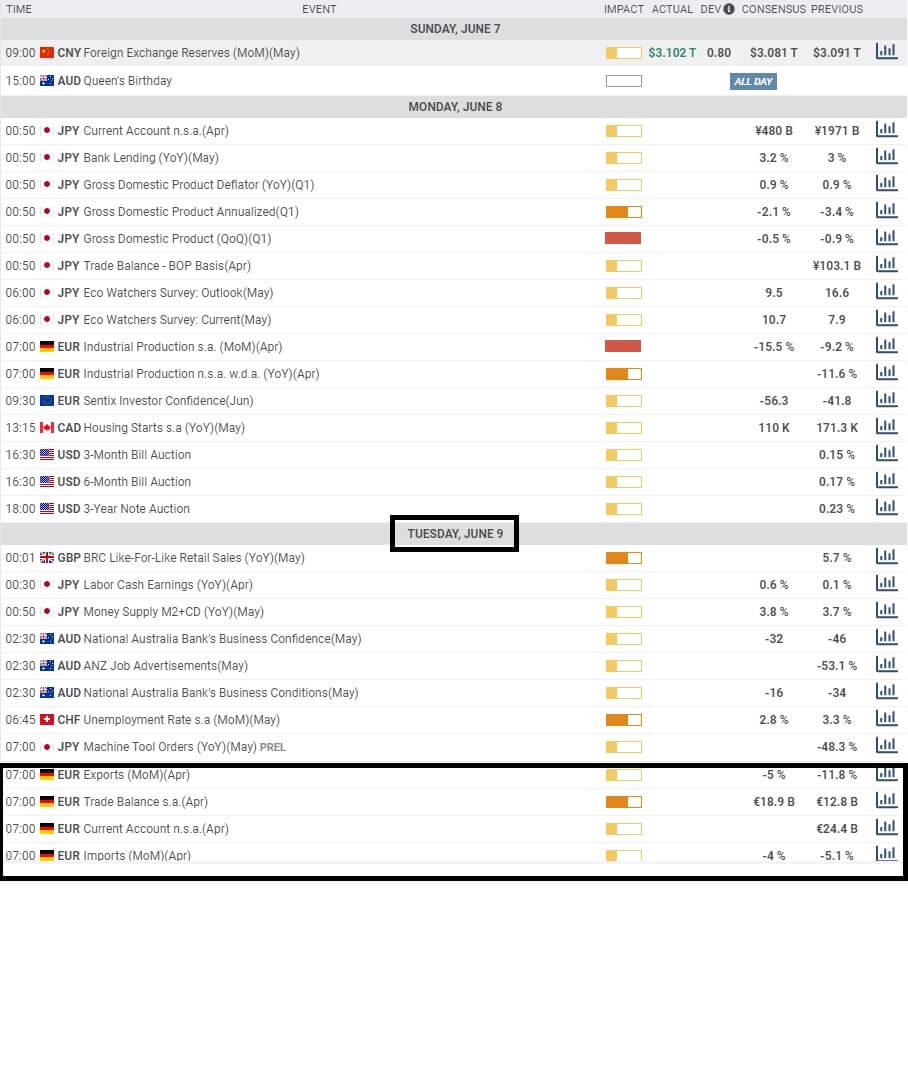
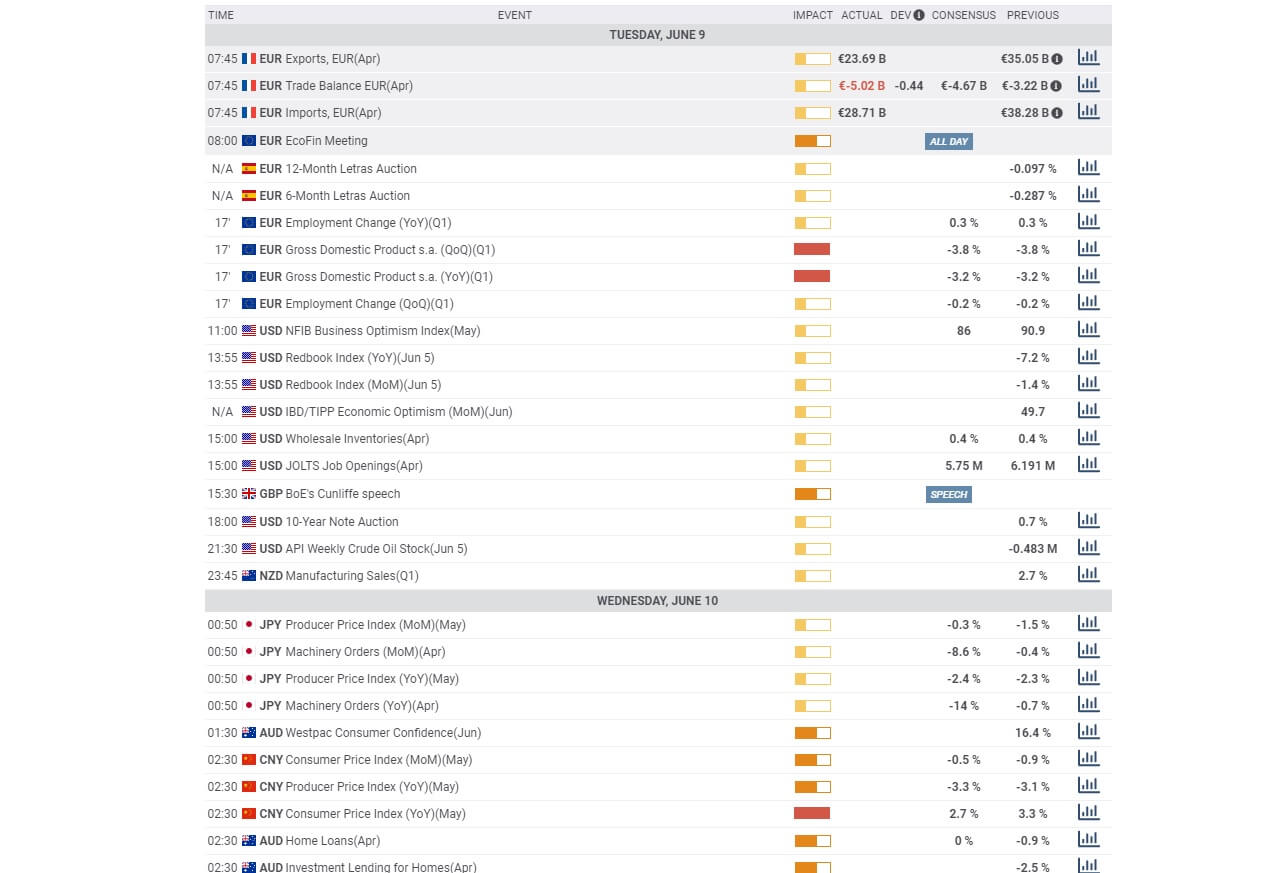
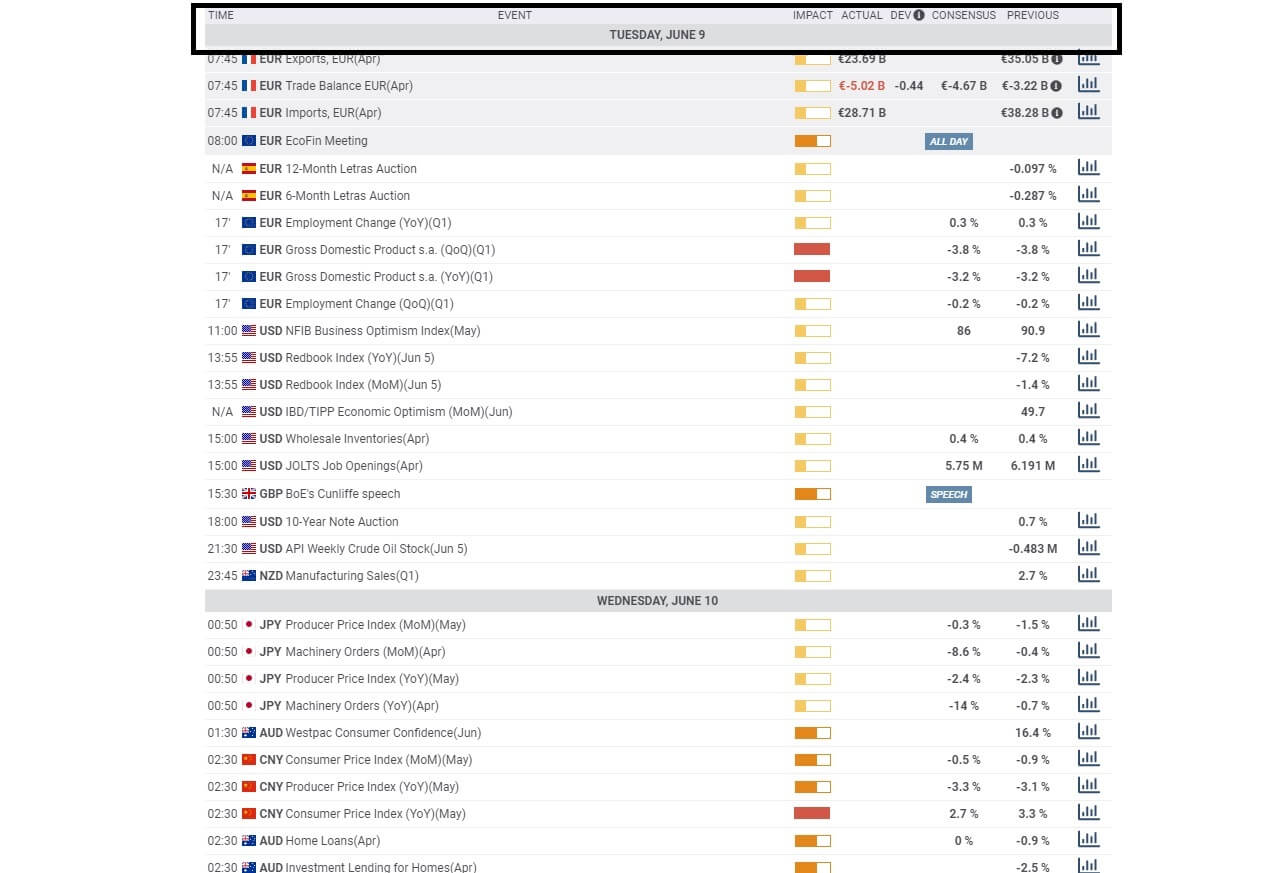
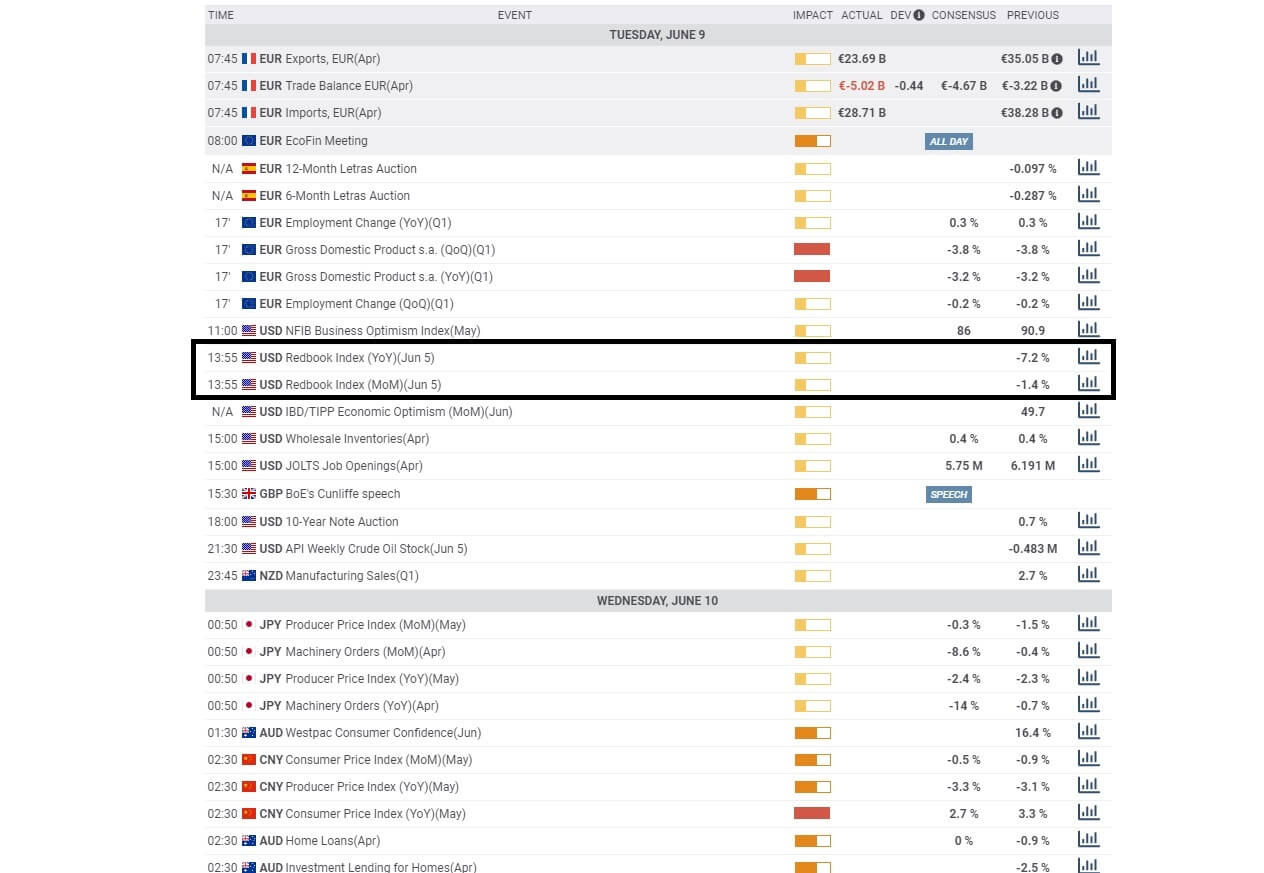
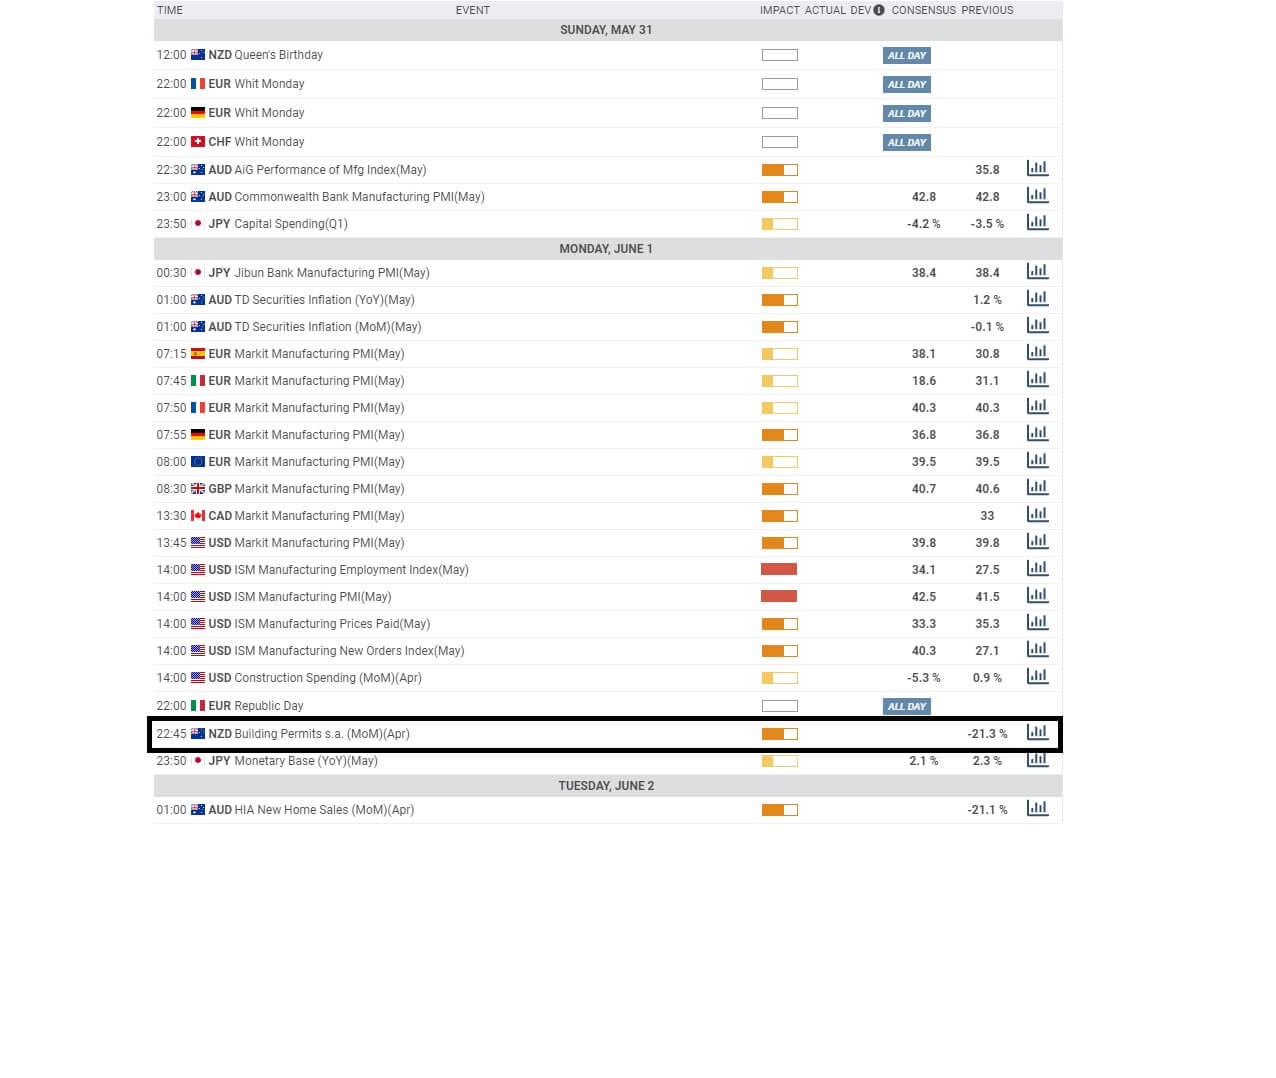
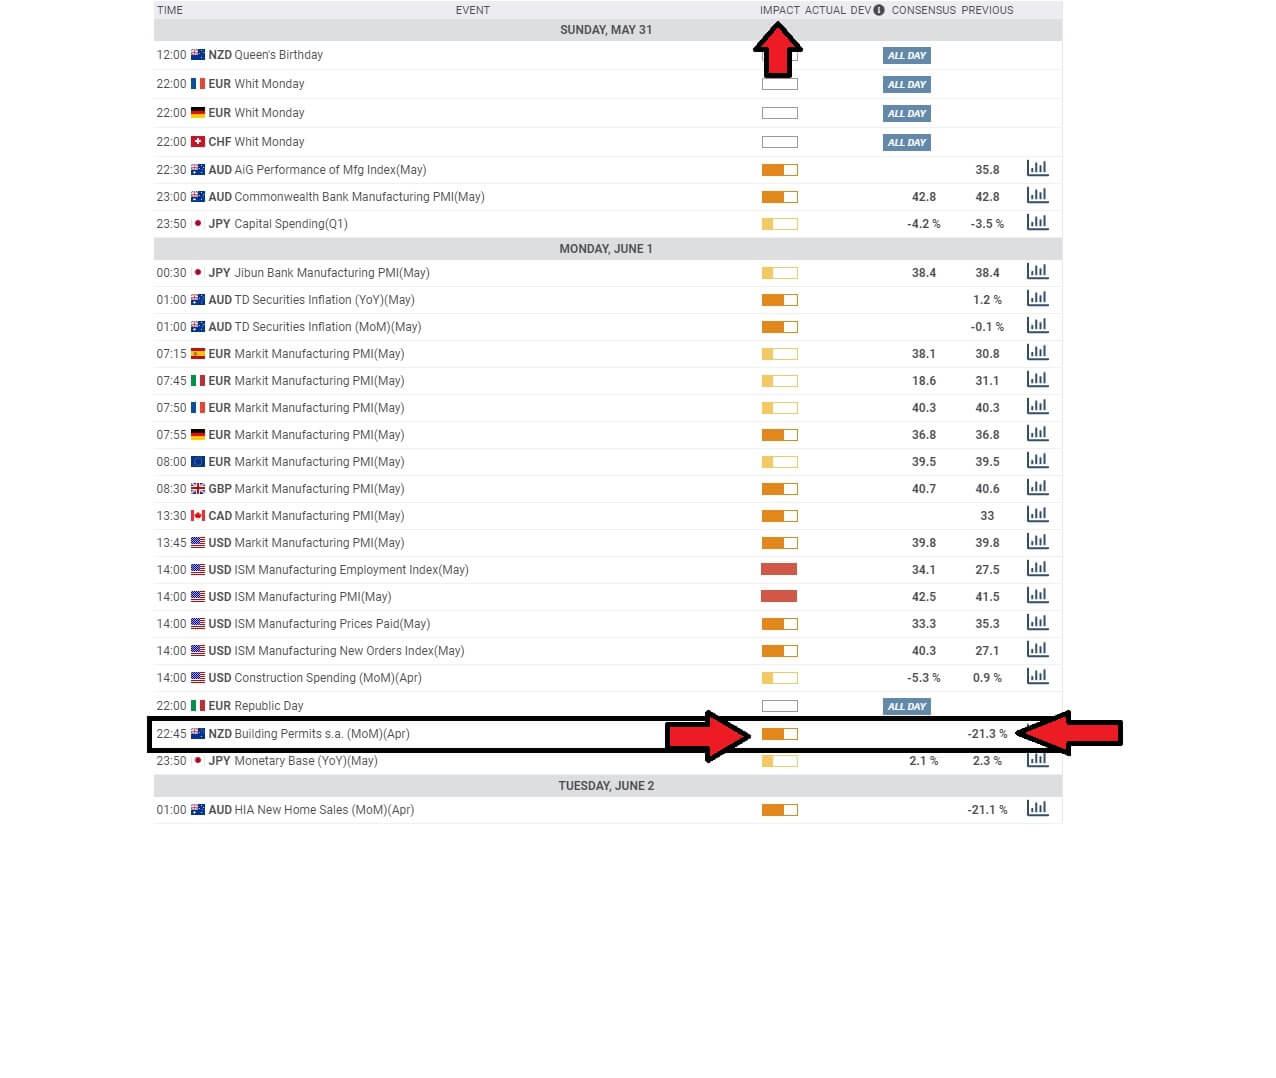
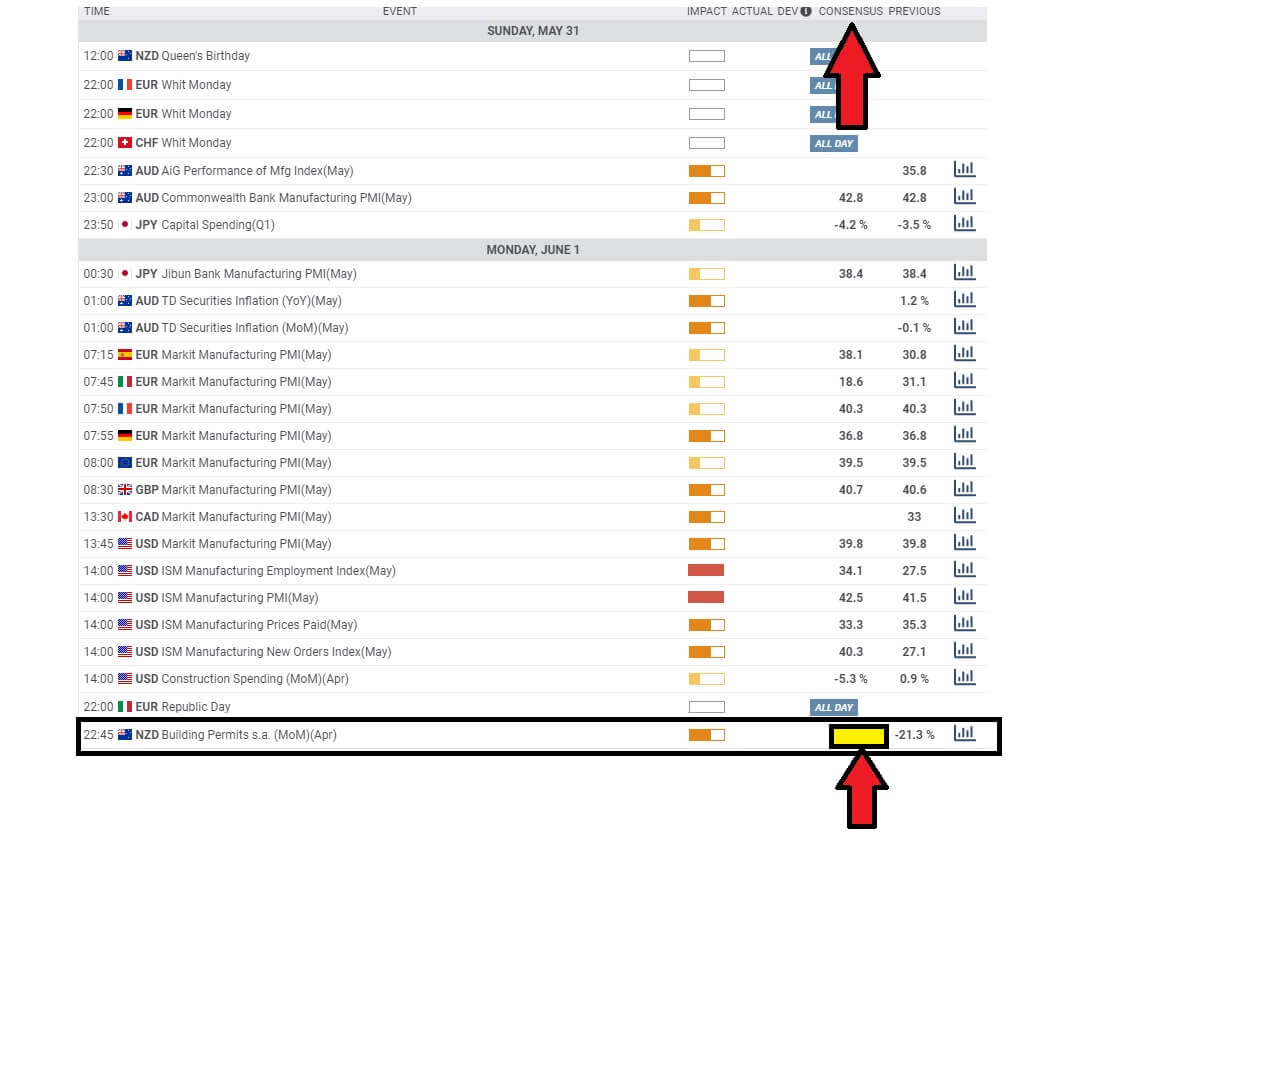
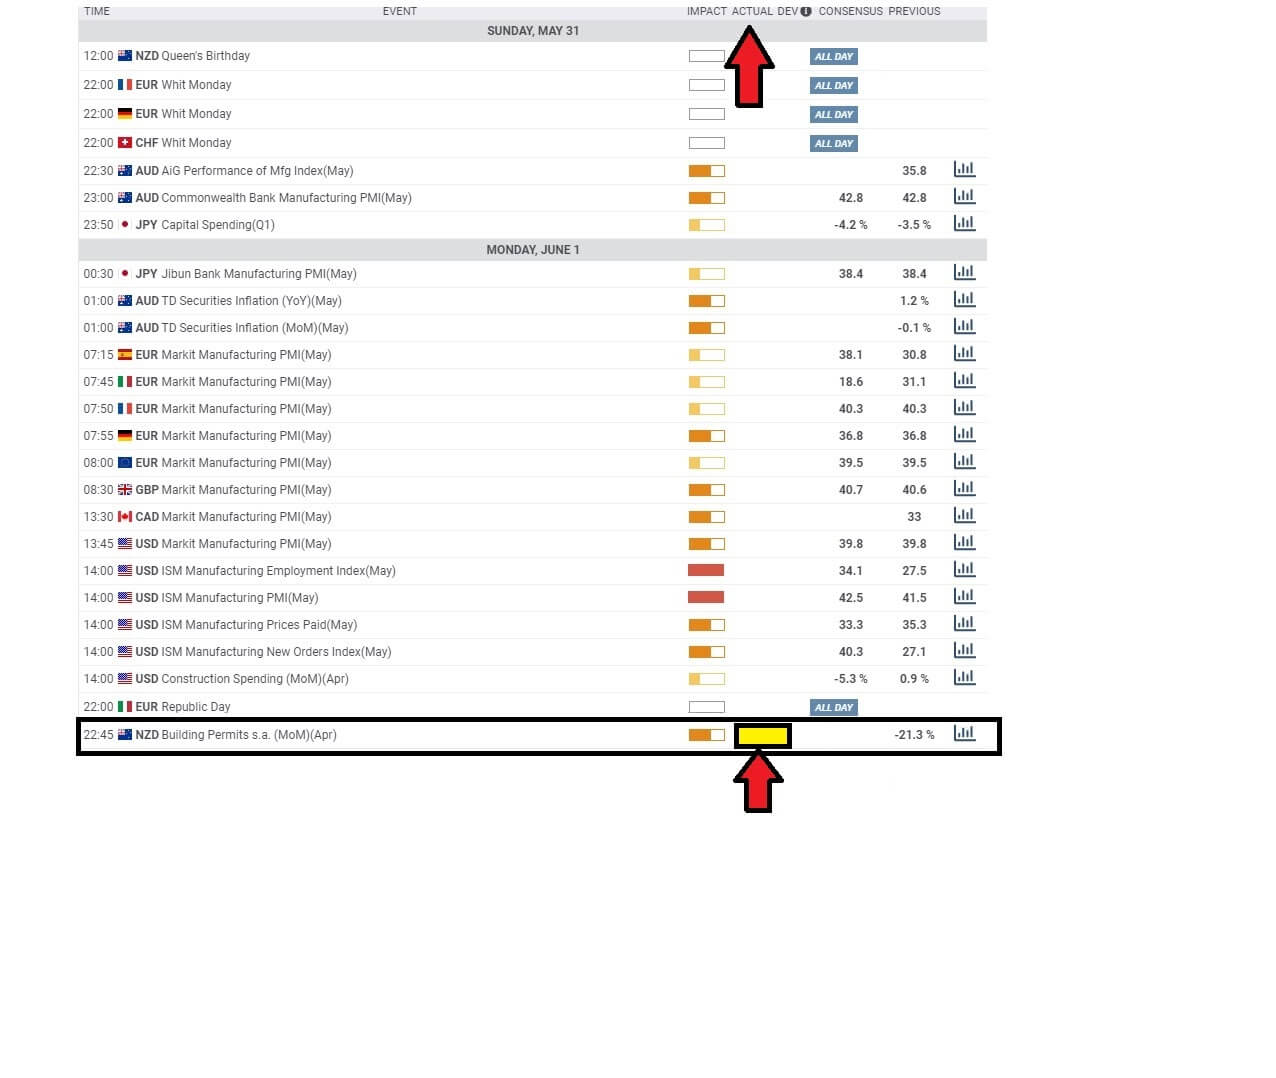
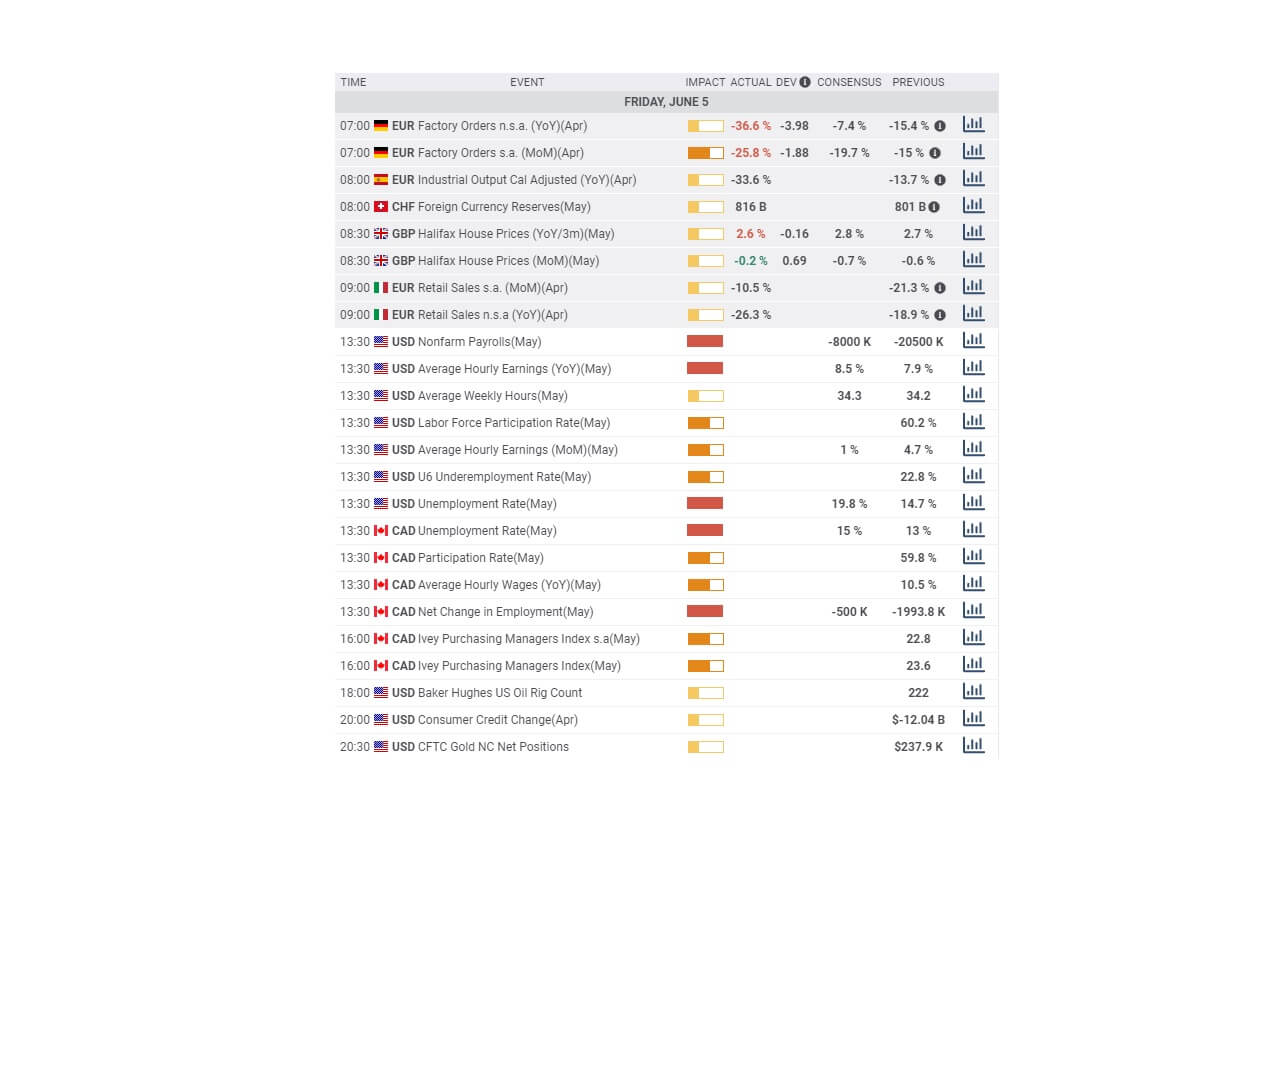
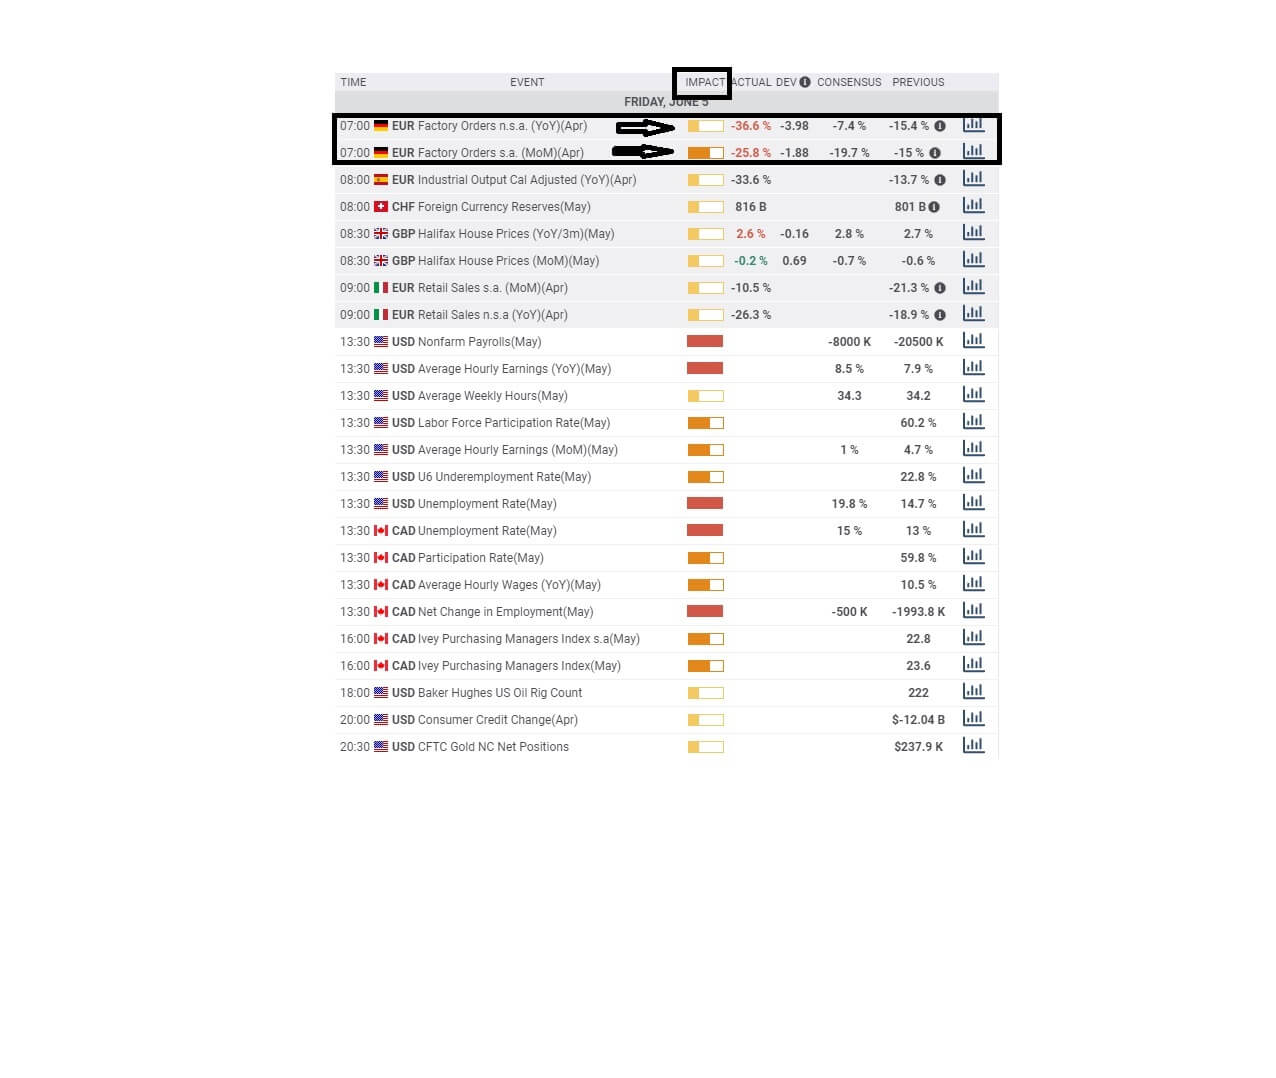
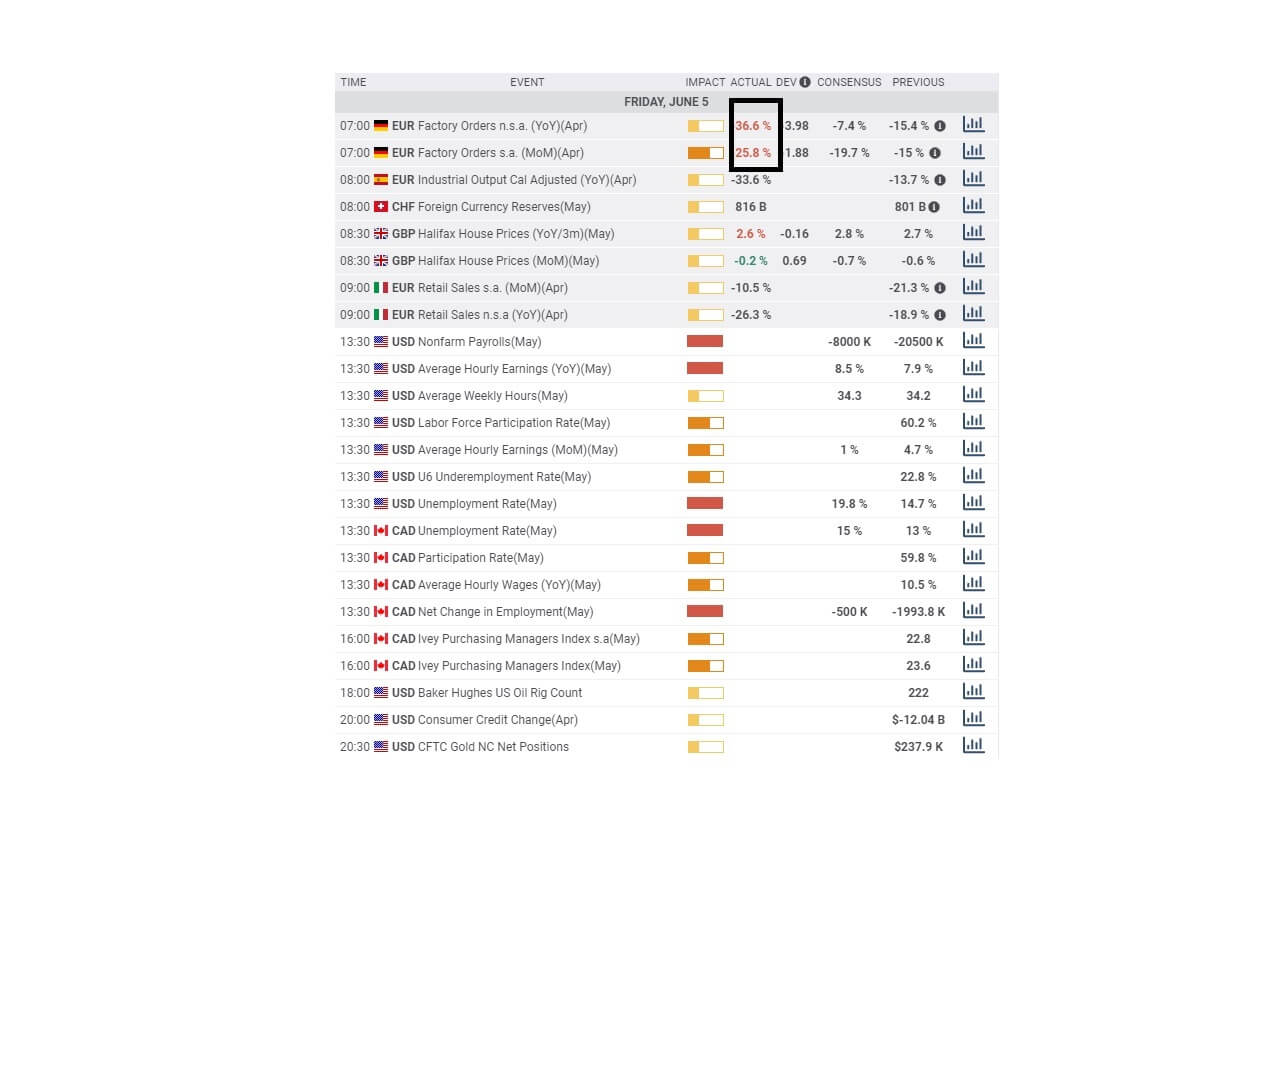
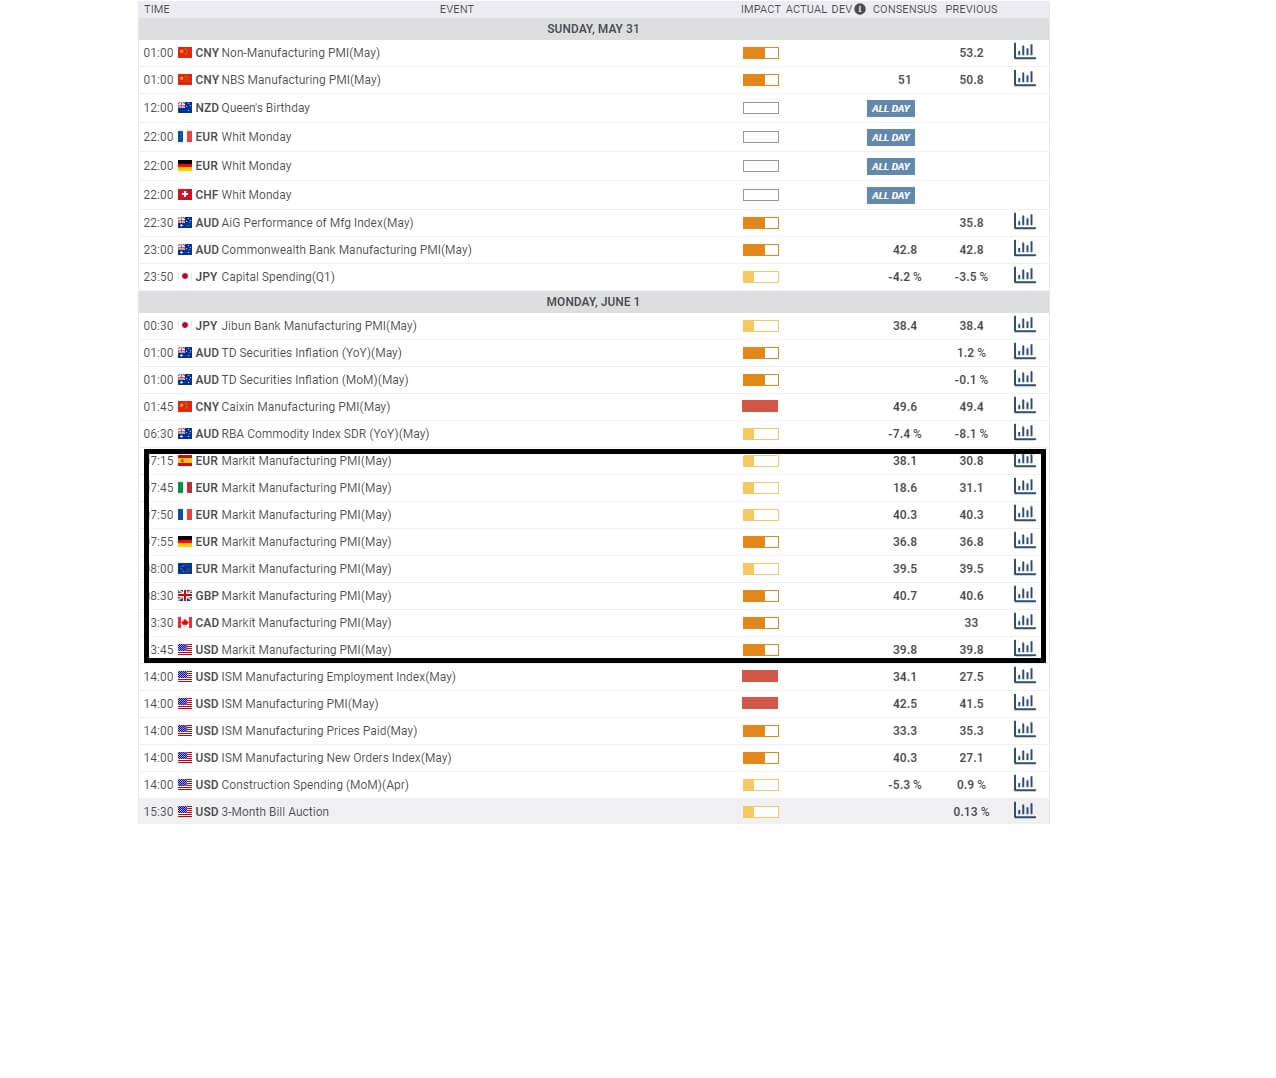
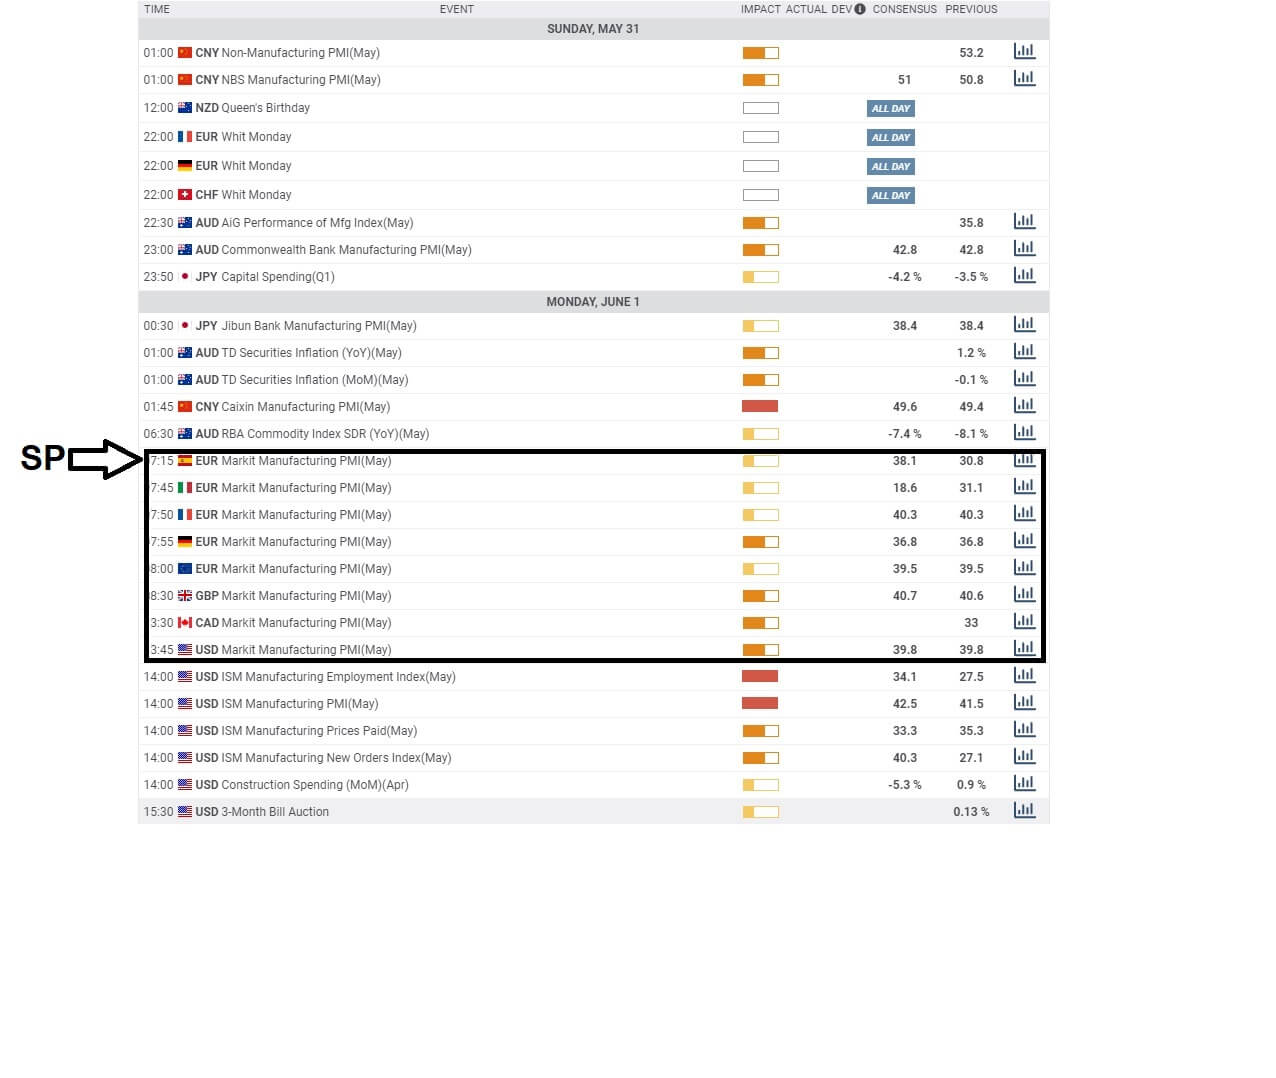
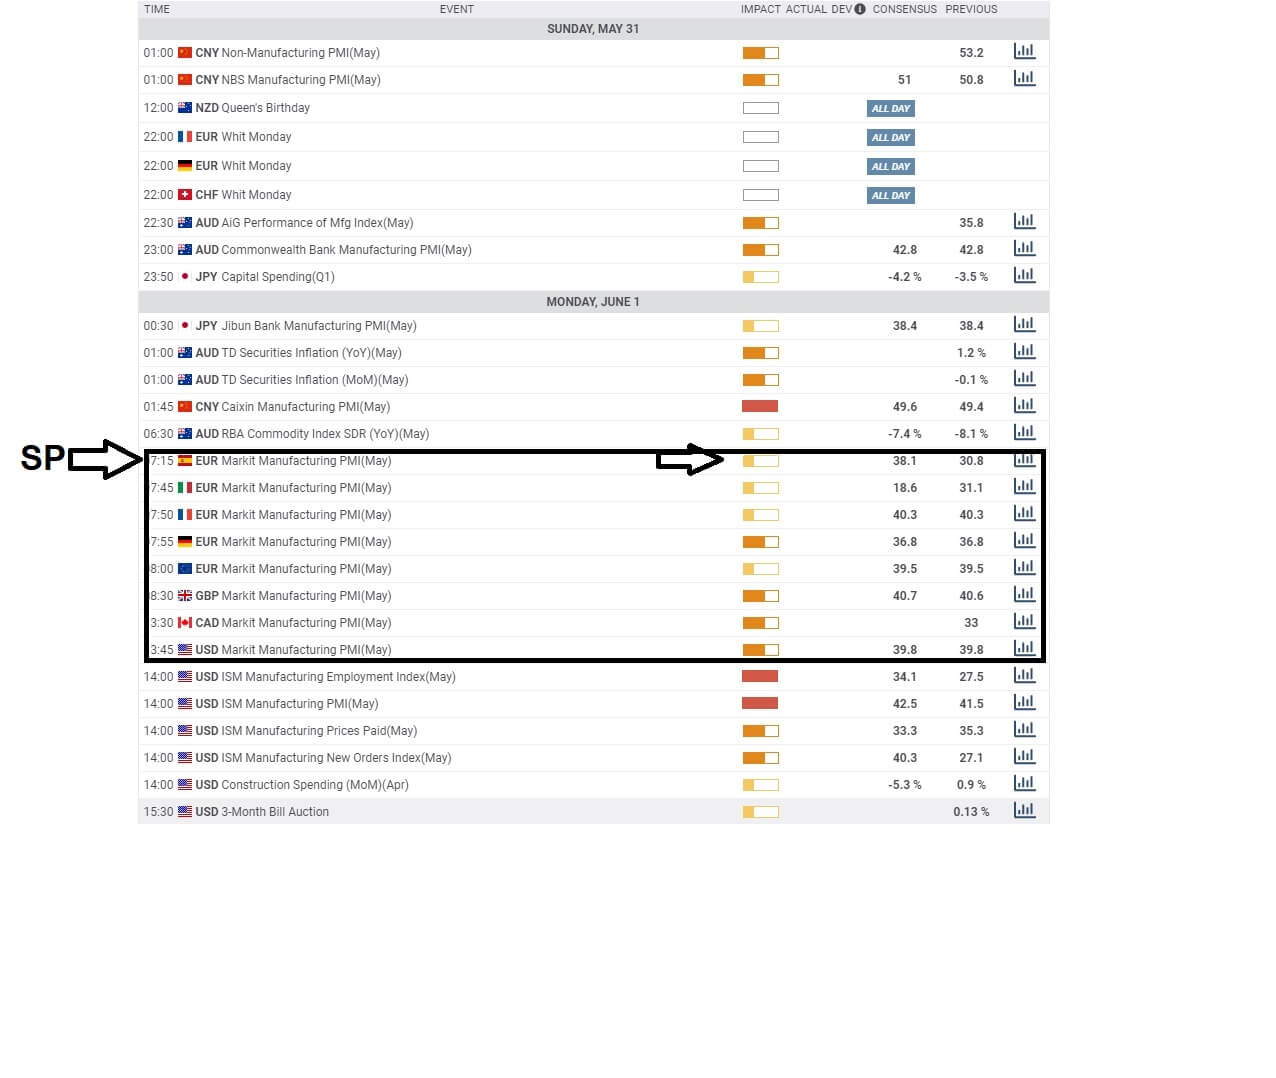
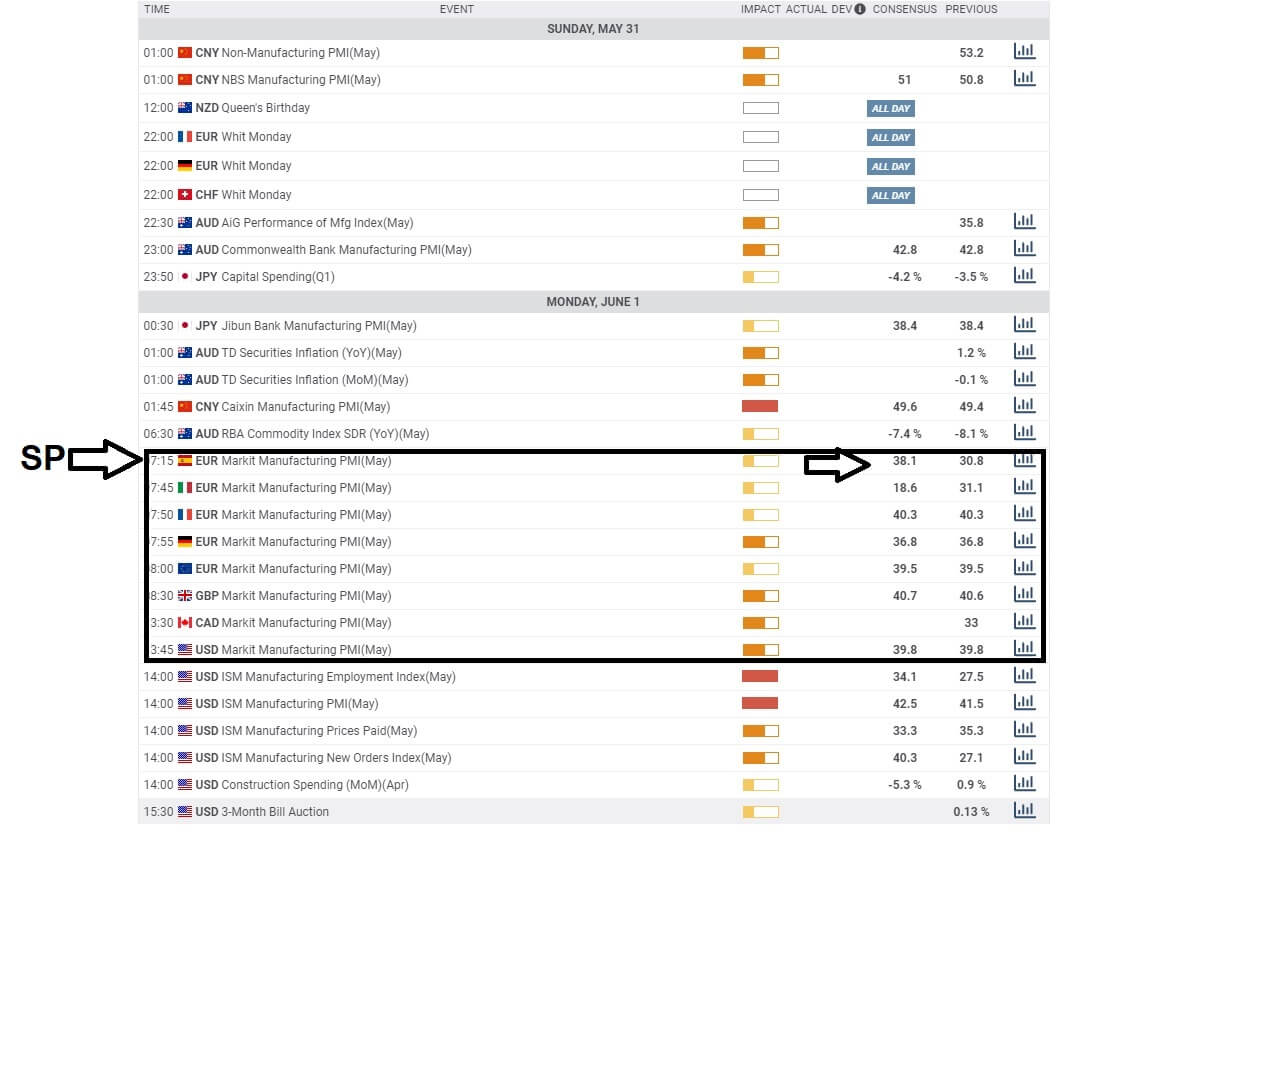
As a trader, it is imperative that you regularly refer to an economic calendar, such as this one, which is provided by most brokers. Consider this to be your Bible. Use it as a tool to plan your trades, and most importantly, use it as a facility to tell you when to trade and, more importantly, not to trade, especially at times of release of very important and potentially highly volatile producing economic data releases.


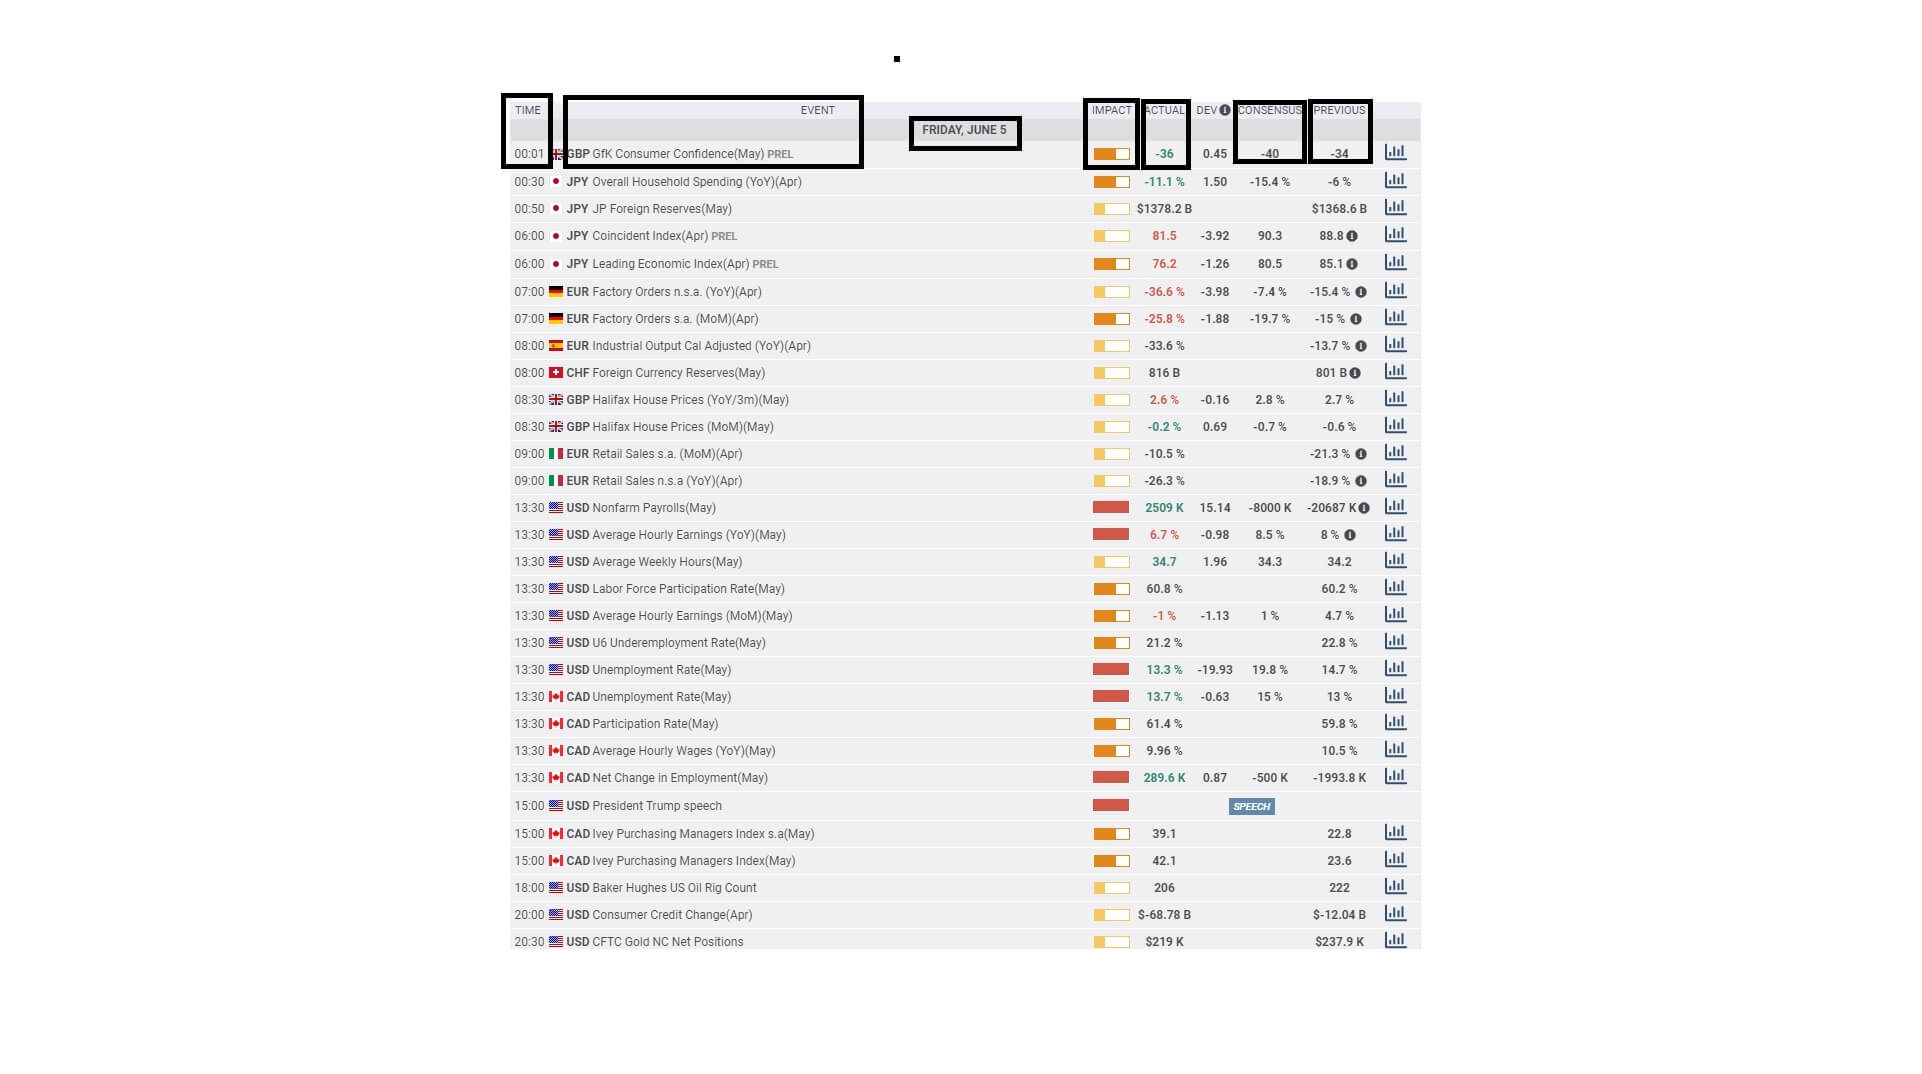
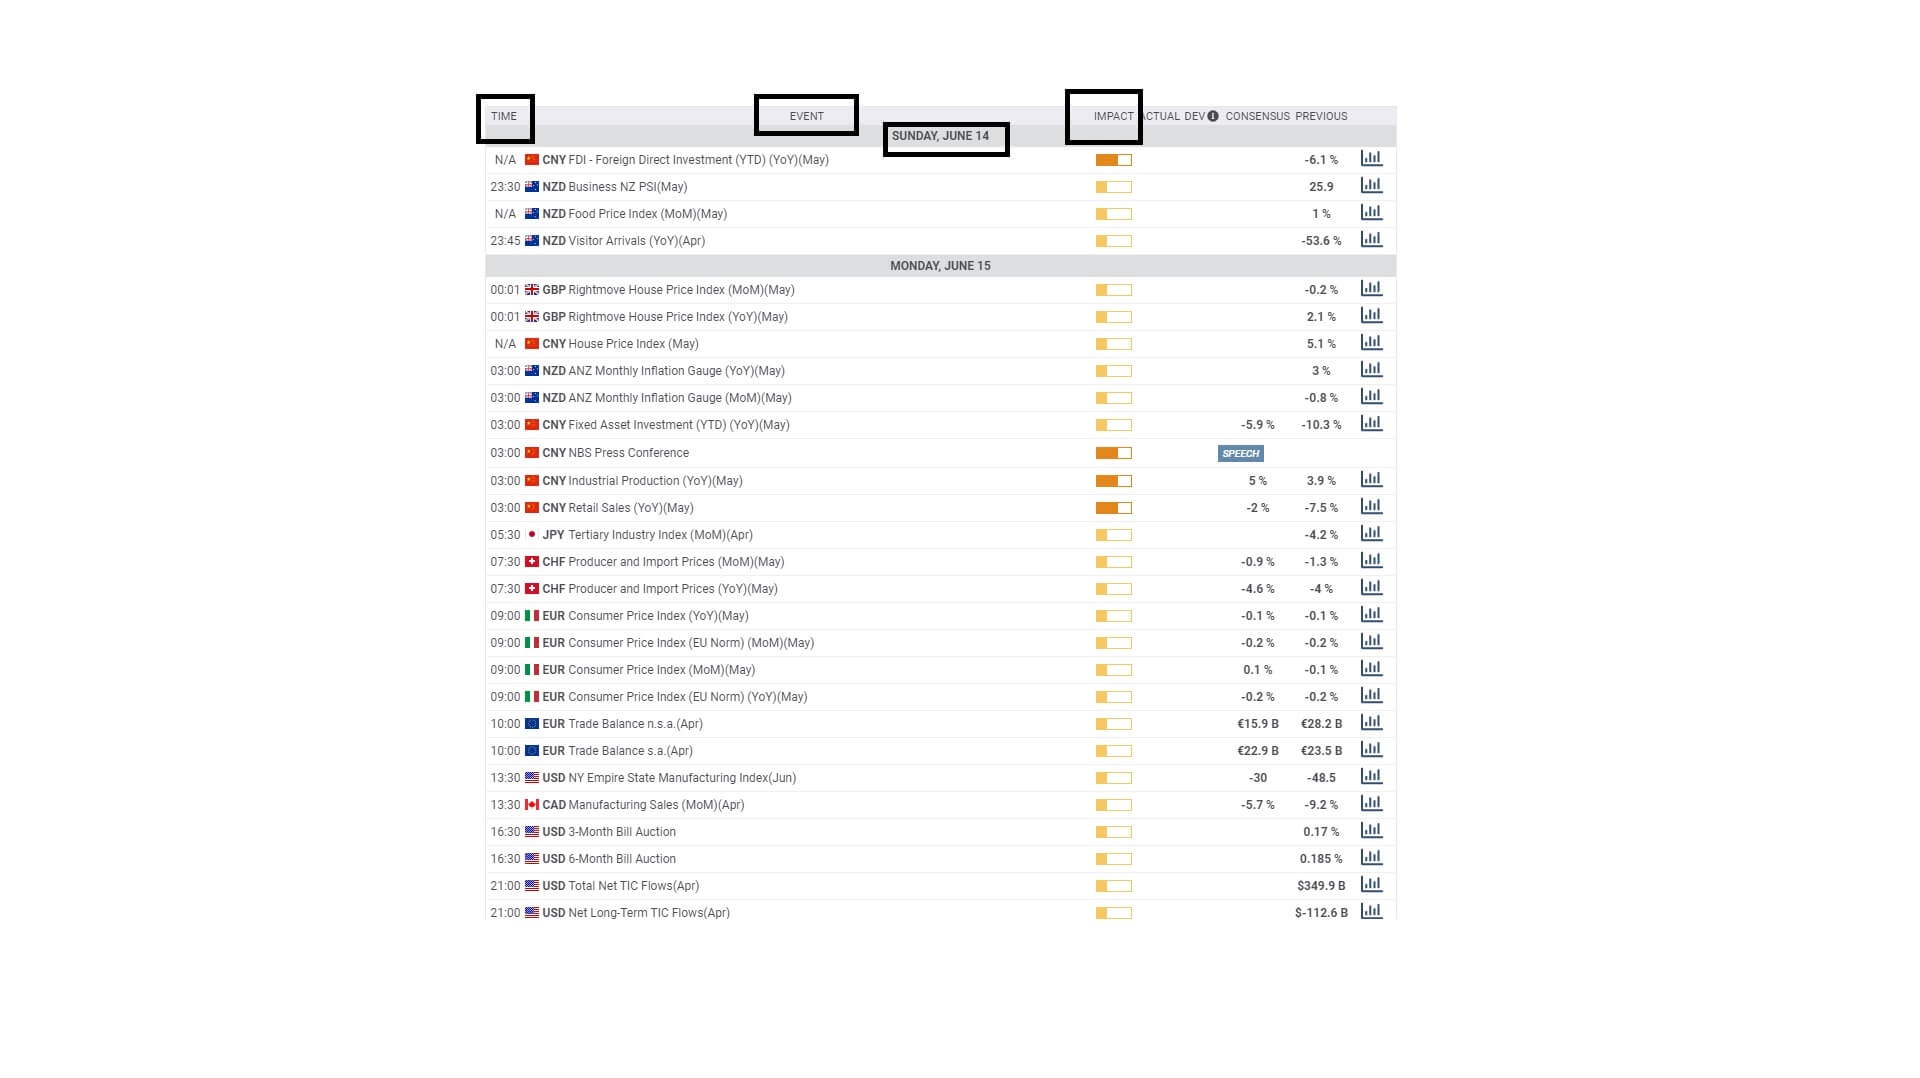
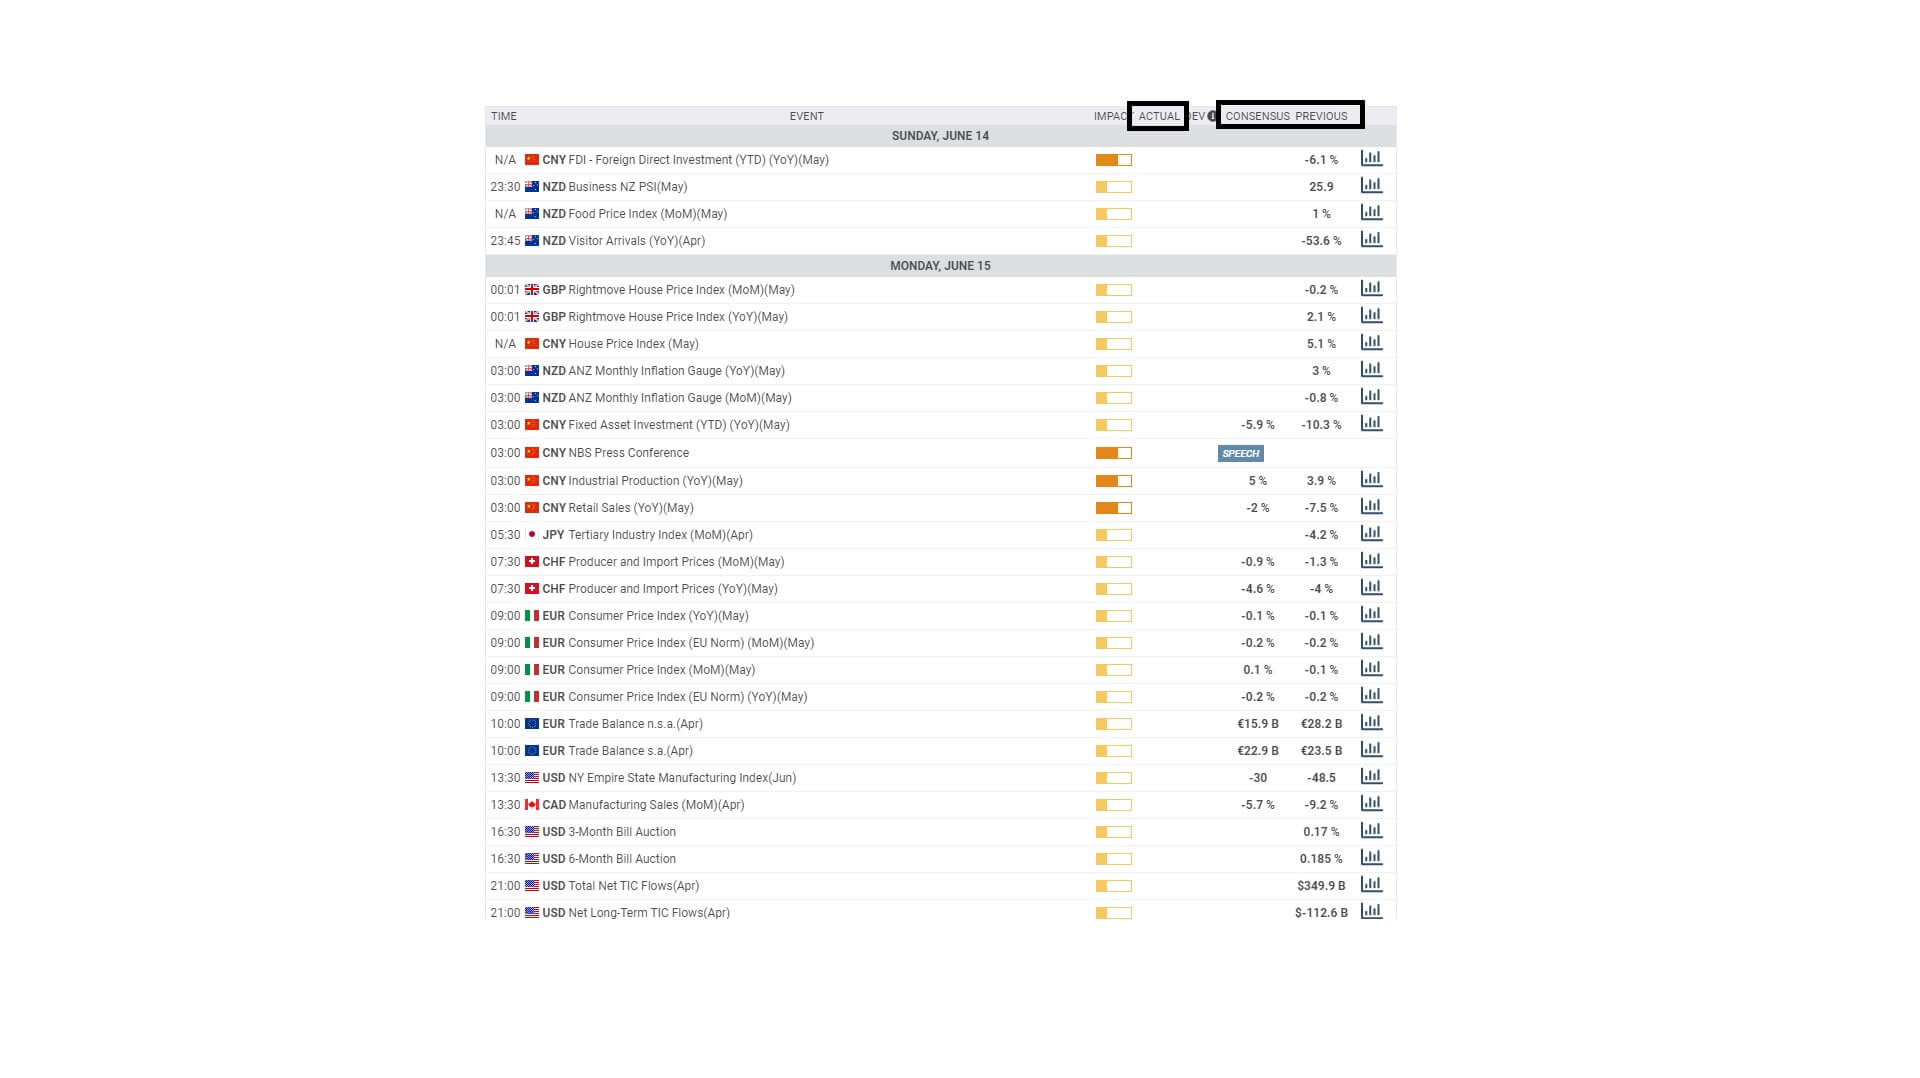
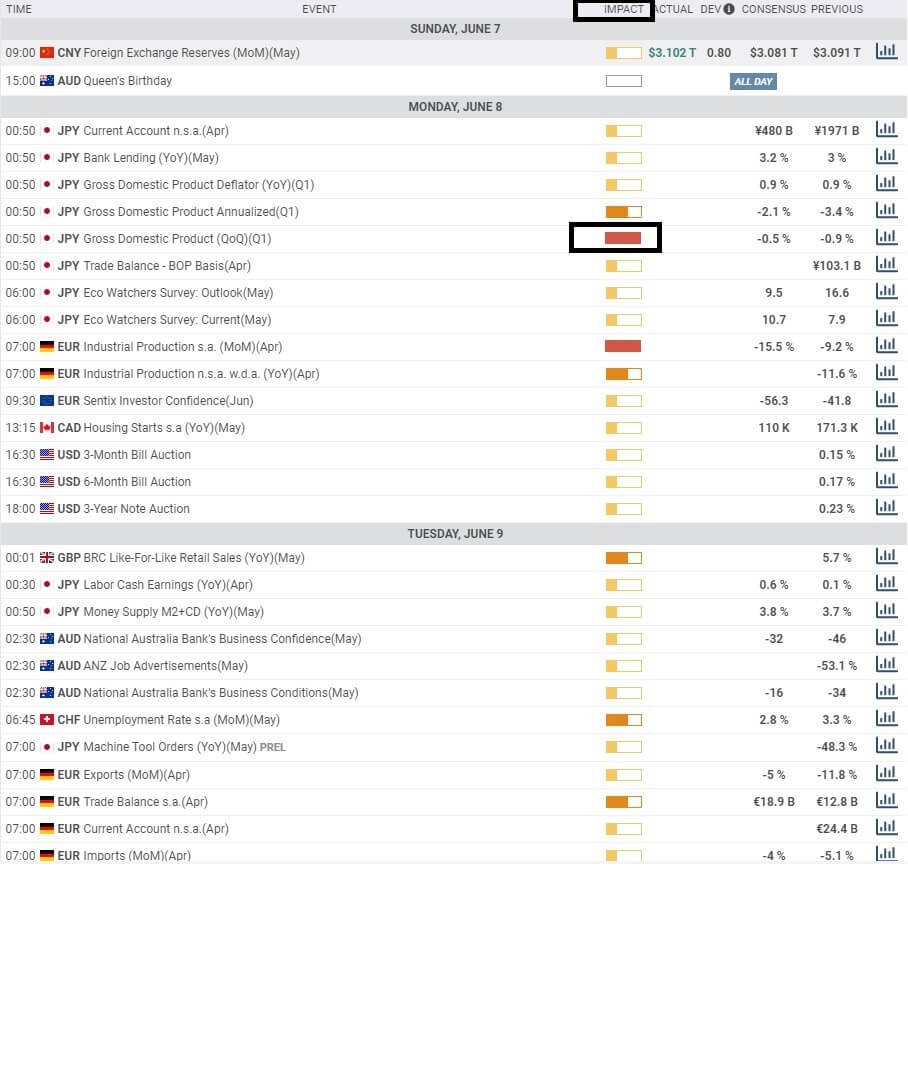
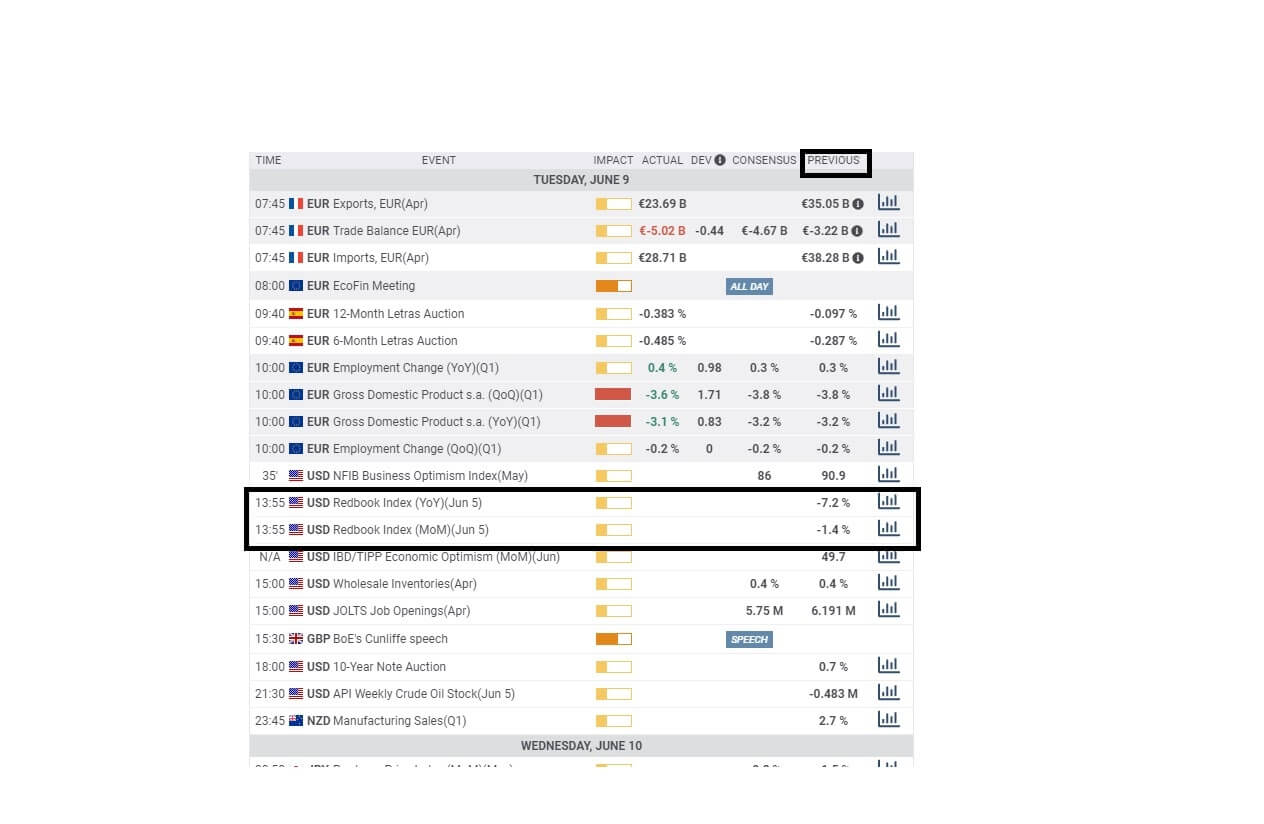
The key information that you need to take particular attention to is the time of the event, the economic event itself, the day and date, the impact level, which typically comes as low, medium, and high, the actual economic data release as listed at the time of the event, which is usually subject to an Embargo, and before this pay particular attention to the general consensus of what the actual figure might be. This is put together by leading economists and market analysis. Also, pay attention to the previous release of this data.

So what is Consumer Confidence?

The consumer confidence index, or CCI, is an economic barometer that tells the story via the consumer. This measure is how optimistic or pessimistic consumers are regarding their financial circumstances. If consumers are optimistic, they tend to spend more money, and if they are pessimistic, they tend to save more. If consumers aren’t spending, economies are failing, and if consumers are spending, it usually follows that economies are doing well.
The CCI is conducted by Nielson Inc. as a survey of over 5000 households within the United States, as an example, and is administered by the US conference board on the last Tuesday of every month. Households are asked five questions, 1: their view of the current business conditions, 2: their view of current employees conditions, 3: their expectations regarding business conditions in the next six months, 4: their expectations regarding employment conditions for the next six months and 5: their expectations regarding total family income for the next six months.
Financial markets look towards this barometer with regard to the varying degrees of the fluctuations up and down.


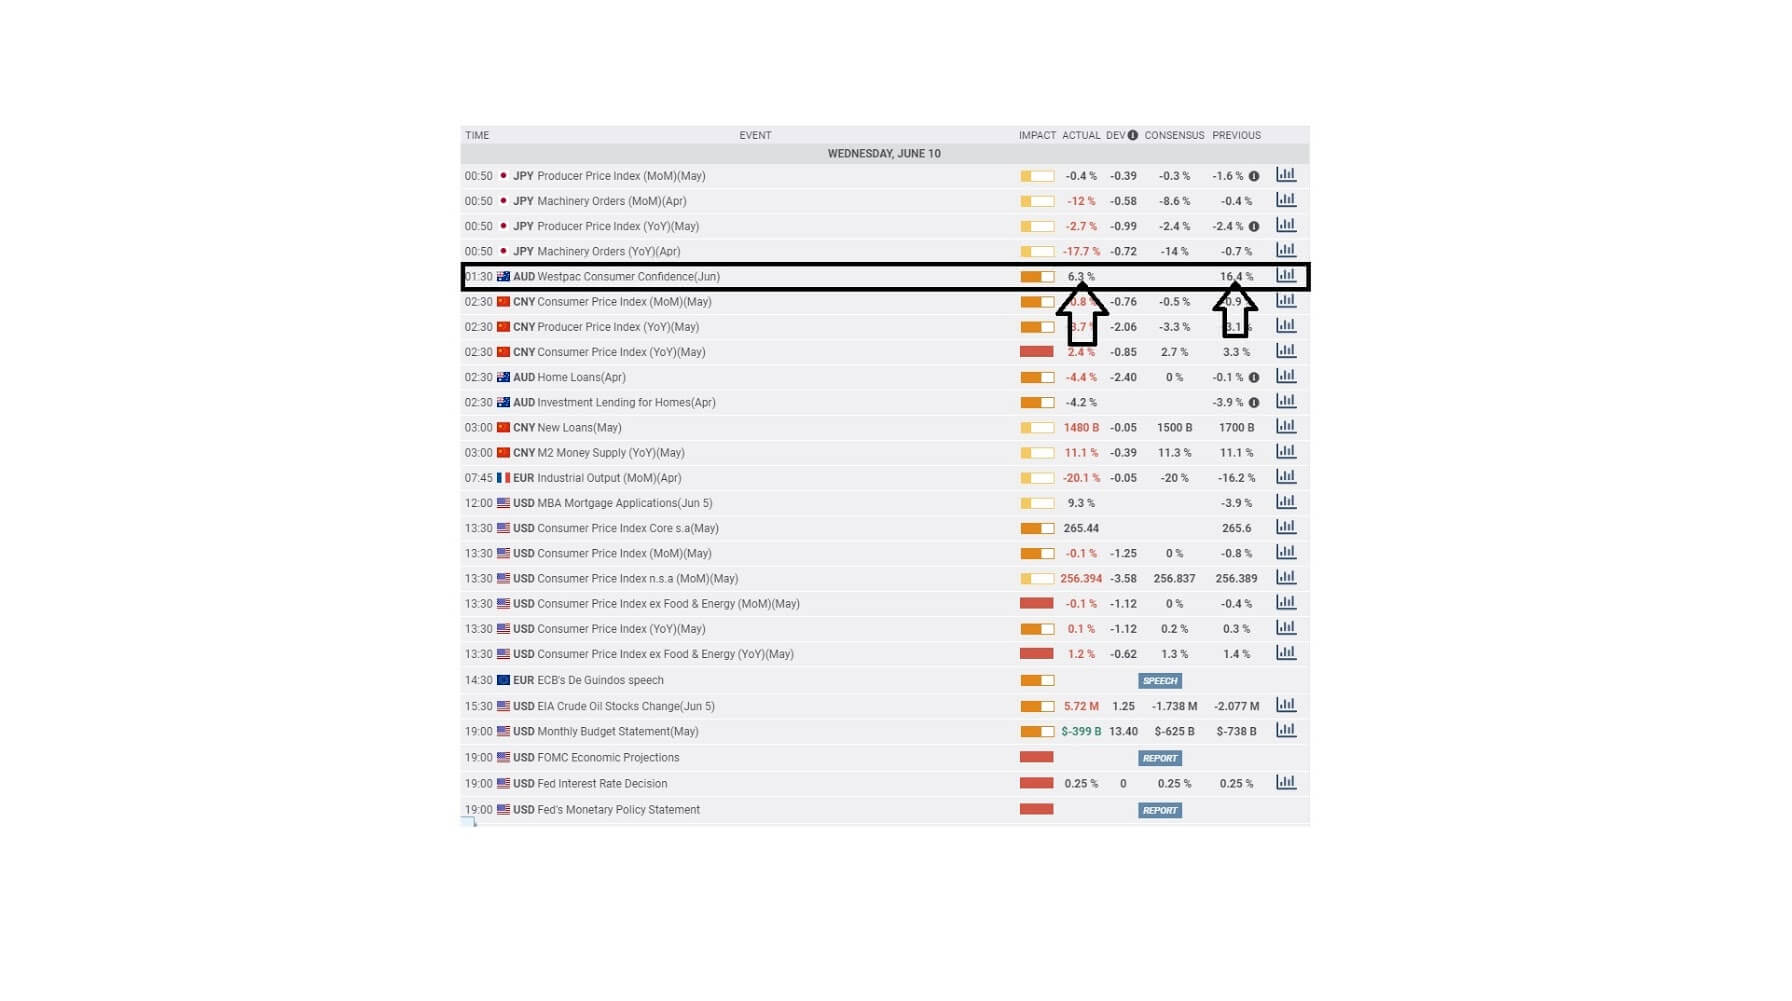
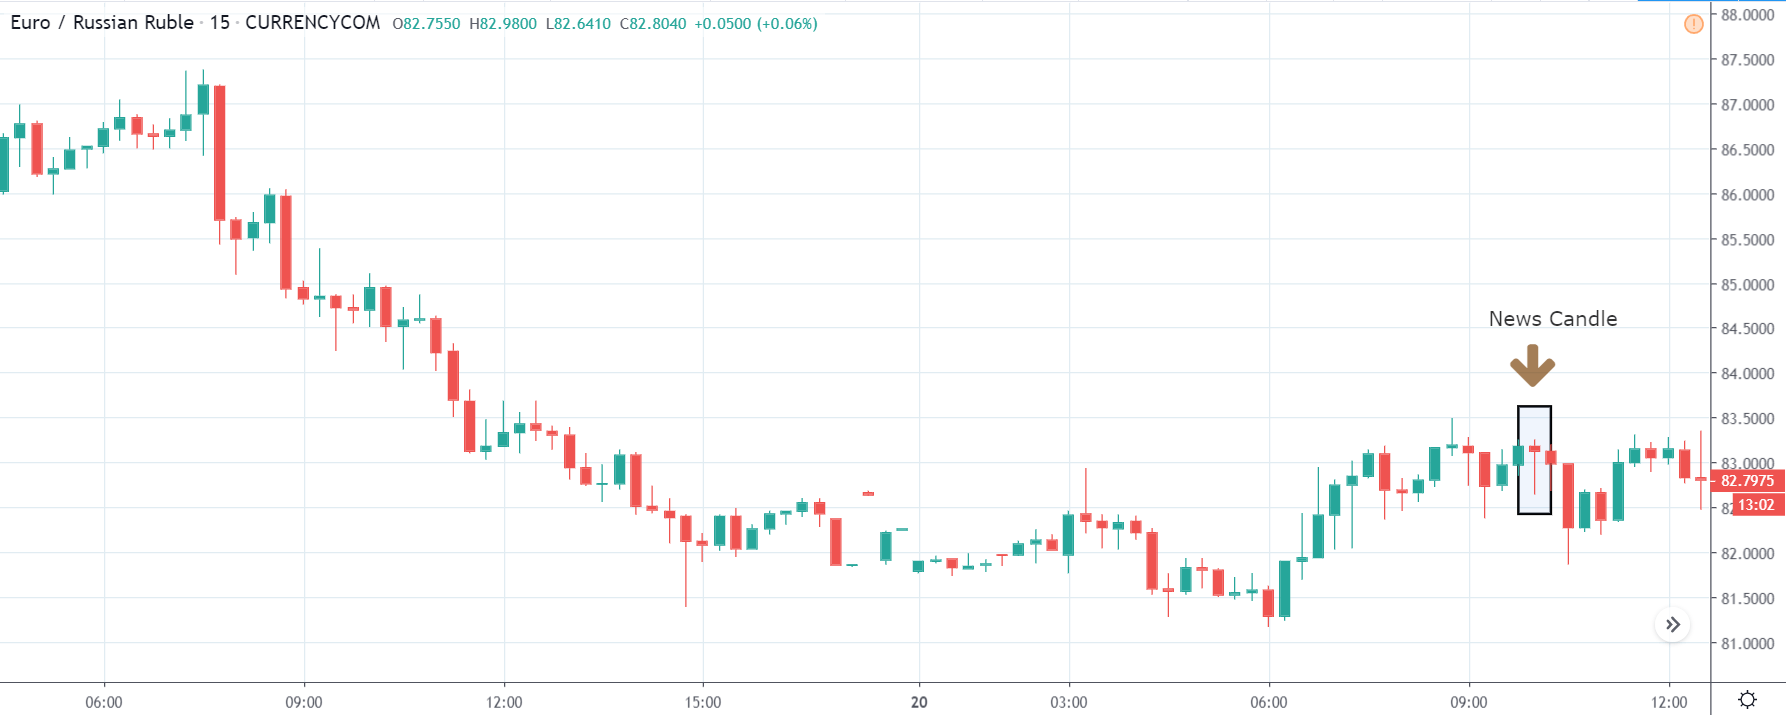
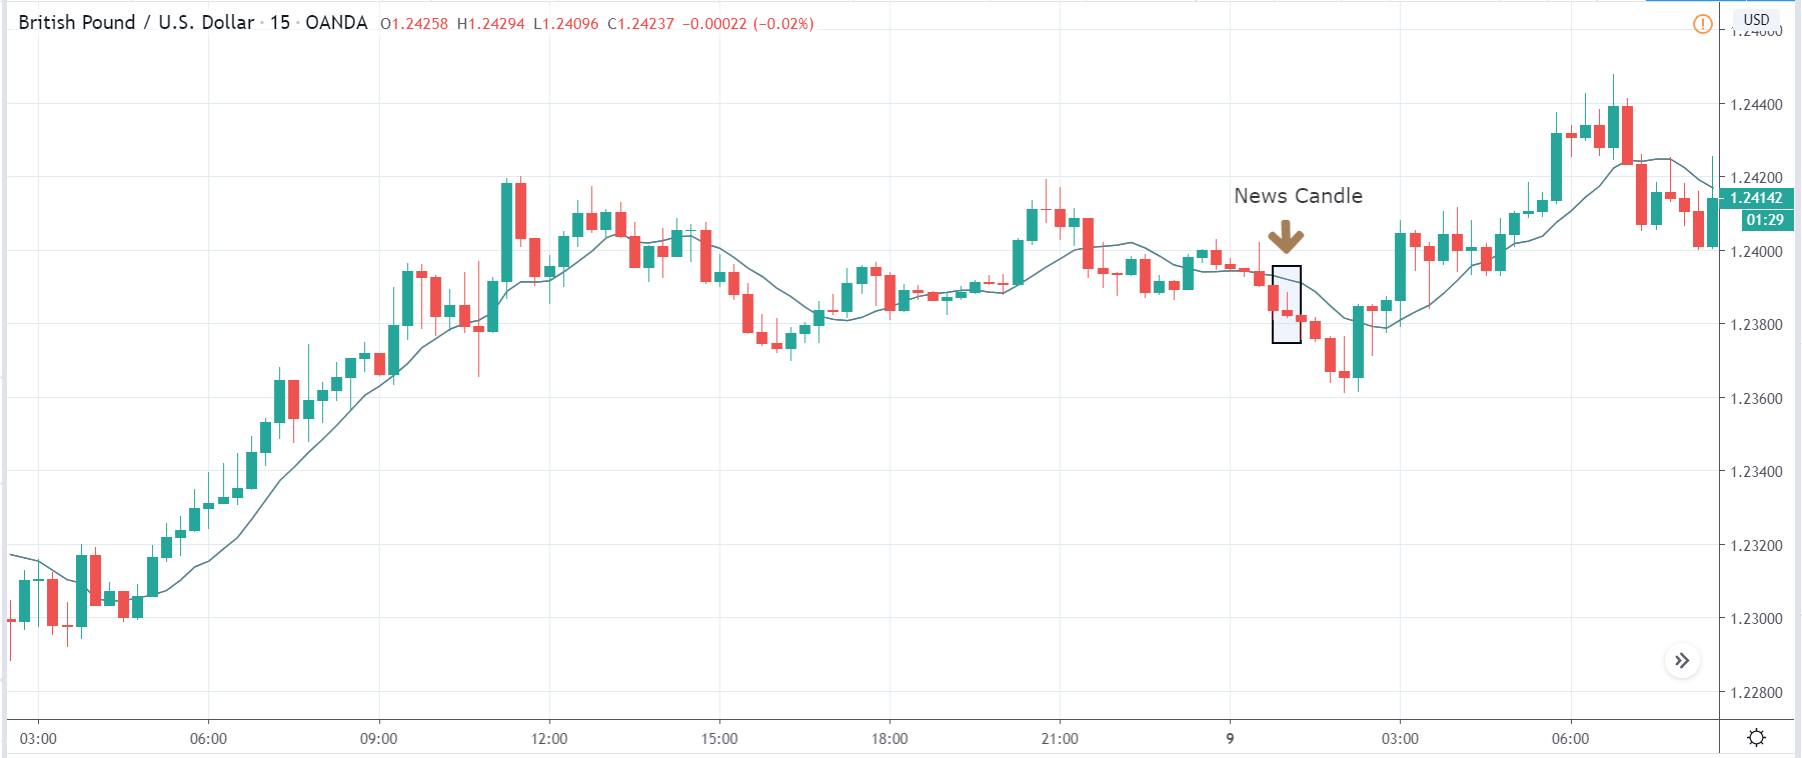
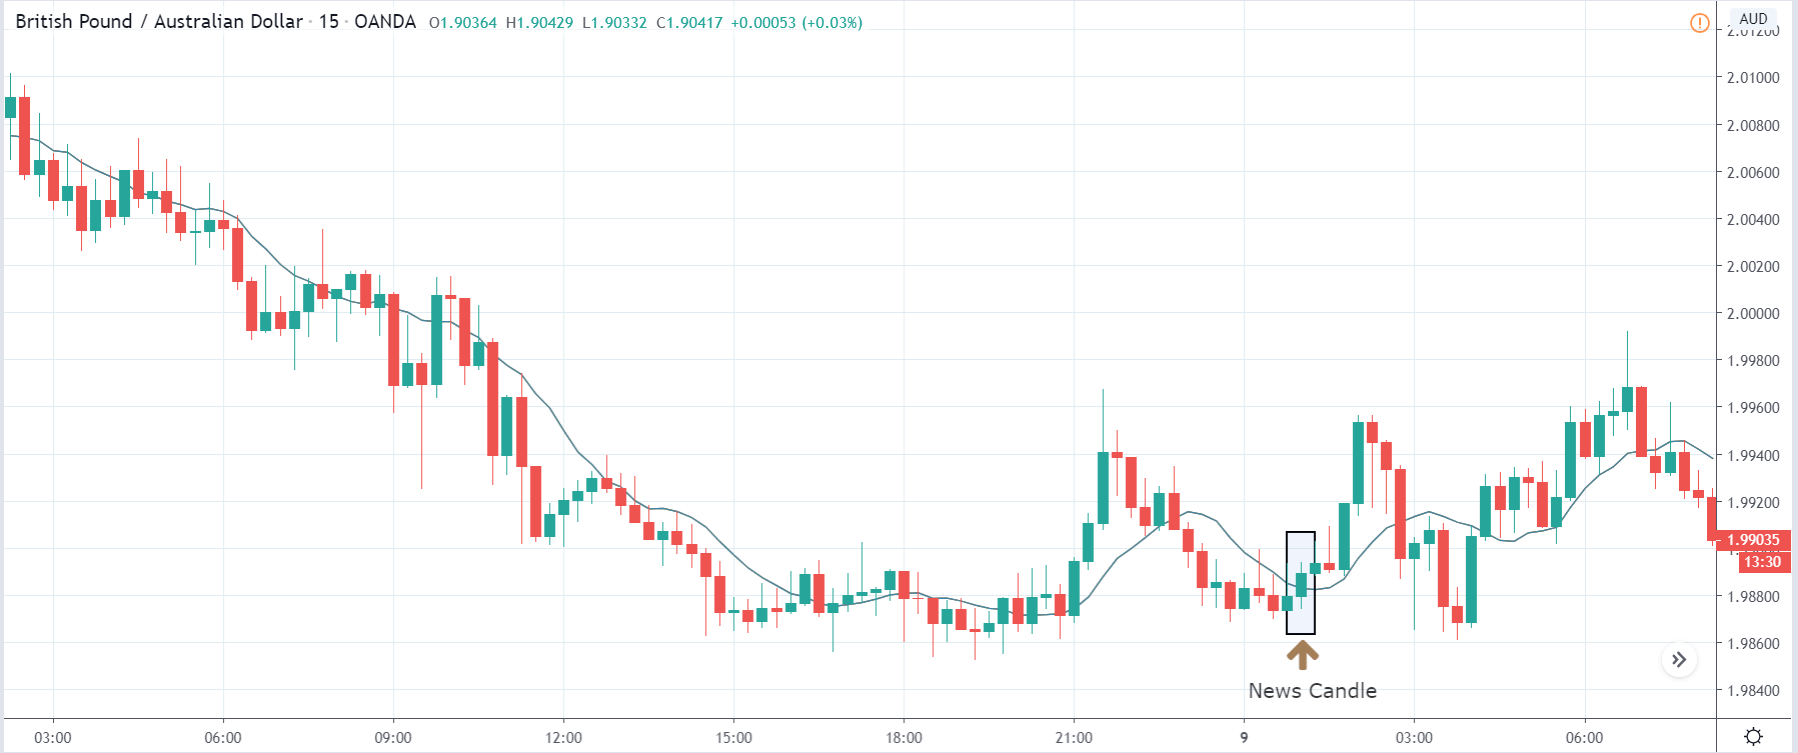
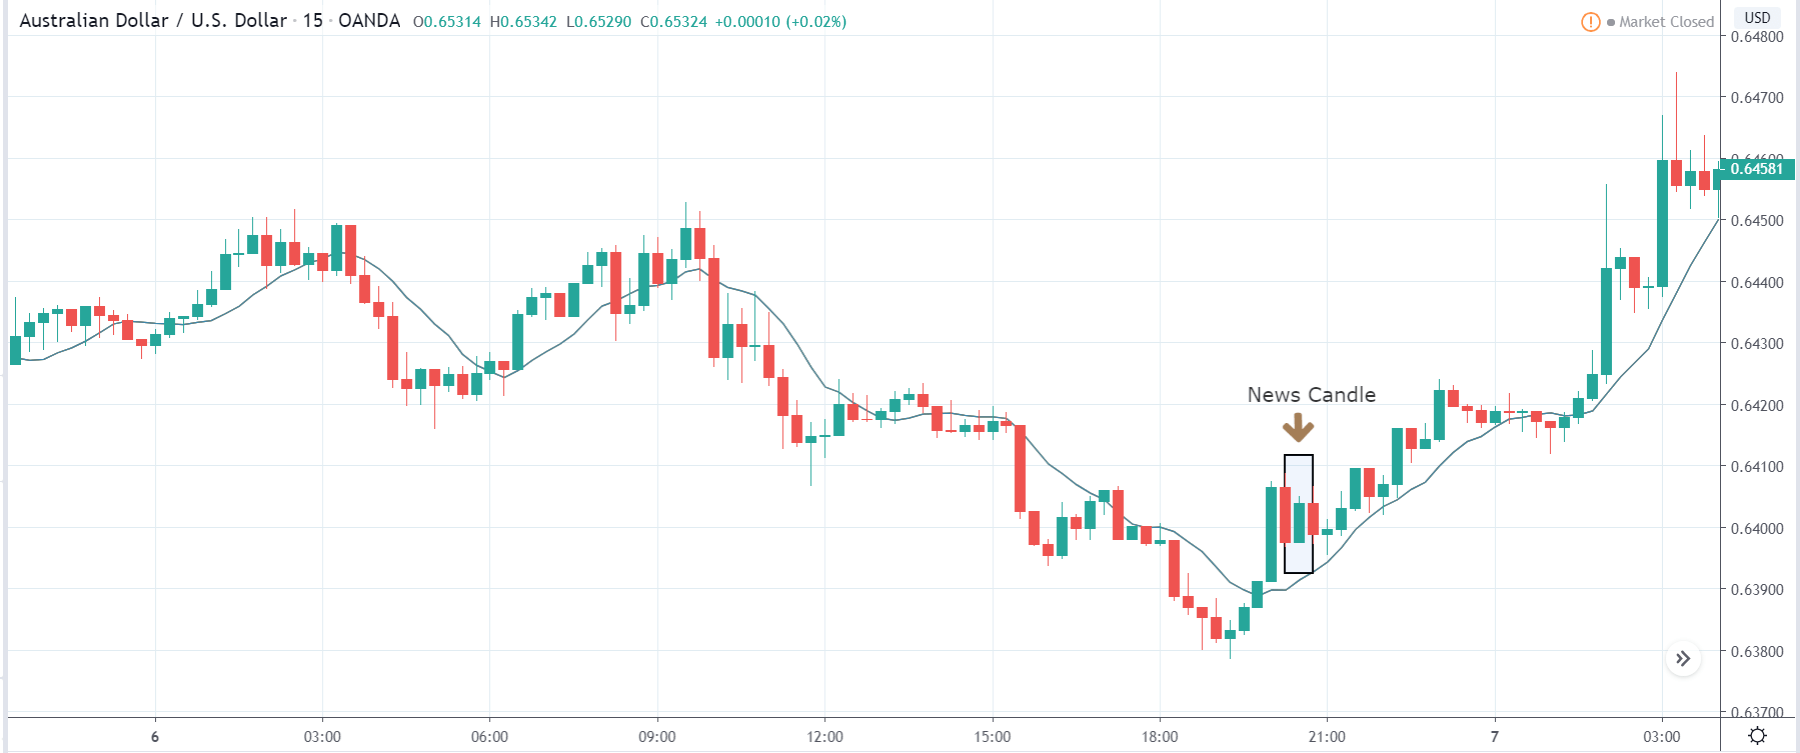
On Wednesday the 10th of June at 1:30 AM BST, Australia released its consumer confidence data for the month of June, which was considered to be a medium level of impact and which came out at 6.3%. No consensus was offered, and the previous figure was 16.4%. Straight away, we noticed that the actual figure is lower than the previous figure, and we will explore this further on in the video.
In Australia, the CCI is produced by the Melbourne Institute and published by the Westpac Banking Group. Countries vary slightly with regard to the questions asked of households. In Australia for example 1200

Australian adults asked their opinions on the household financial situation currently, compared to 12 months ago, their expected household financial situation for the coming year, their anticipated economic conditions over the coming year, their anticipated economic conditions over the next five years, and their buying conditions for major household items.
However, essentially the results are treated almost identically on a country-by-country basis.


Upon the release of the data, traders look for the actual figure, and in this case, it comes in lower than the previous, which suggests that consumer confidence is lower during the month of June and below the figure released for May.
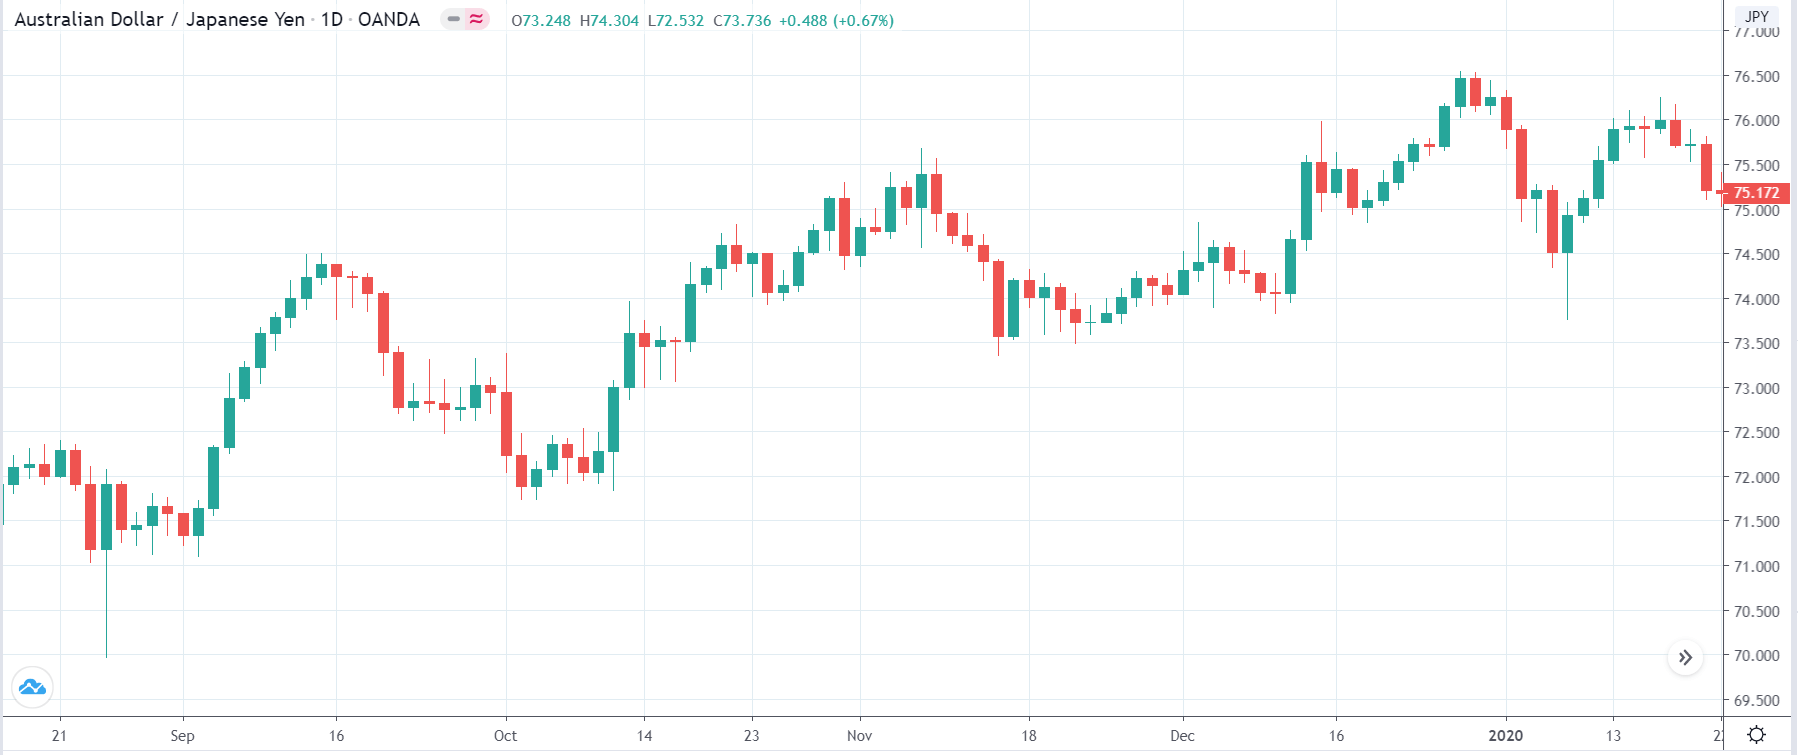
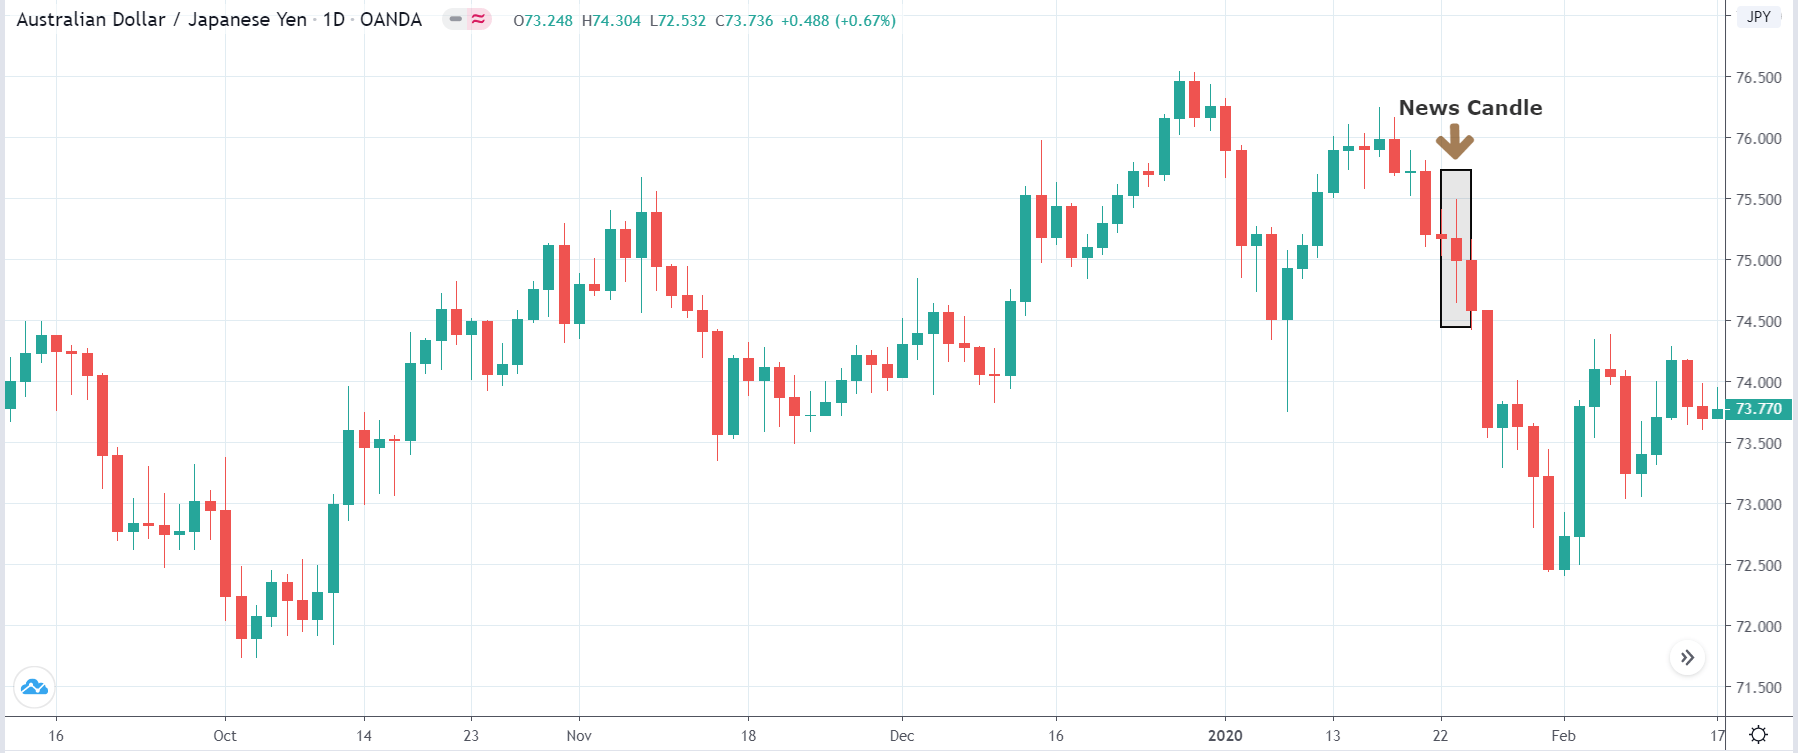
Potentially this means consumers are spending less, and this is therefore bad for the Australian economy, and we might expect a weakening of the Australian dollar against its counterparts. This is referred to as bearish.
Had the figure been higher than 16.4% for May, the reverse would have been true and would have shown the economy growing, with consumers more confident and potentially spending more money, and this would have been good for the Australian dollar against its counterparts. This is referred to as bullish.

Categories
Forex Daily Topic Forex Fundamental Analysis

The Impact Of ‘Factory Orders’ News Release On The Forex Price Charts

What are Factory Orders?

Factory orders are the dollar value of all orders received by factories. The U.S. Department of Commerce reports the number of new orders every month. Factory orders are divided into four parts: new orders, unfilled orders, shipments, and inventories. It includes information about durable goods and non-durable goods. Factory orders data is often not very surprising because the report of durable goods orders comes out one or two weeks earlier.

Dividing Factory Orders        

The factory orders data is divided into four sections:

  • New orders, which indicate whether orders are increasing or decreasing
  • Unfilled orders, indicating a backlog in production
  • Shipments, which indicate produced and sold goods
  • Inventories, which indicate the strength of future production

The figures are mentioned in billions of dollars and also as a percent from the previous month and previous year. Factory orders data is often dull, mostly because the durable goods orders come out a couple of weeks earlier, and people have an idea of factory orders for the current month. However, the official factory orders data gives more detailed information on orders estimate and fulfillment.

The factory orders report includes information about both durable and non-durable goods. Durable goods have a life span of at least three years and often refer to items not purchased frequently, such as machines, garden equipment, motor vehicles, and electronics. In contrast, non-durable goods include fast-moving consumer goods such as food, clothes, footwear, medication, and cleaning items.

Investors get an insight into the growing trend of the economy with the help of factory orders report, which largely influences their investment decisions. Factory orders give an early indication of the growth in the economy, and its impact is felt on the equity market.

Analyzing the data

When it comes to the fundamental analysis of a currency pair, it is important to understand how factory orders are analyzed to make proper investment decisions. Factory orders are analyzed by comparing the previous and current readings, where, if we notice a consistent drop in the ‘orders,’ it could signal a slump in the overall demand.

These factory orders are not just used for analyzing one country but also for comparing the economic growth of any two countries. Investors shift their funds to countries where there is a growth in the factory orders, and demand is high. One needs to remember to compare countries with the same economic status. For example, factory orders of a developed country should not be compared with that of a developing nation.

The economic reports

Factory orders are released monthly by the Censuses Bureau of the U.S. Department of Commerce. The full name is “Full report on Manufacturers’ Shipments, Inventories and Orders” but is commonly referred to as Factory Orders. This report usually follows the Durable Goods Reports, which provides data on new orders received from more than 4,000 manufacturers of durable goods.

The factory orders report is more comprehensive than the durable goods report, where it examines the trend within industries. For example, the durable goods report may account for a broad category, such as industrial equipment. In contrast, the factory orders report will provide details about the hardware, software, semiconductors, and raw materials. This lack of information in a durable goods report is attributed to its release speed.

Impact on currency

Factory orders are an important economic indicator. When factory orders increase, the economy usually expands as consumers demand more goods and services. High demand, in turn, requires retailers and suppliers to order more things from factories. This is interpreted as positive for the economy by foreign investors who then invest in the country through the stock market or currency.

An increase in factory orders could also mean that inflation is just around the corner. When factory orders decrease, the economy is usually contracted, which means there is less demand for goods and services, so retailers will not place a lot of orders. When this is reflected in reports, investors tend to have a negative on the economy and think twice before investing in such economies.

Sources of information on Factory Orders 

The factory Orders data is closely watched by investors around the world, which is why the report is immediately available on most of the open-source economic websites and some of the broker’s websites. The official source of information is the U.S. Census Bureau, where it provides statistical information of all the information related to factory orders.

Links to ‘Factory Orders’ information sources

GBP (Sterling) – https://tradingeconomics.com/united-kingdom/factory-orders

USD – https://tradingeconomics.com/united-states/factory-orders

EUR – https://tradingeconomics.com/germany/factory-orders

Factory orders are a key economic indicator for investors and others monitoring the health of economies. It provides information on how busy factories may be in the future. Orders placed in the current month may provide work in factories for many months to come as they will have to work to fill the orders. Businesses and consumers generally place orders when they are confident about the economy.

An increase in factory orders signifies that the economy is trending upwards. It tells investors what to expect from the manufacturing sector, a major component of the economy. The factory orders data often tend to be volatile with revision in the methodology now and then. Hence, investors typically use several months of averages instead of relying too heavily on a single month’s data.

Impact of the ‘Factory Orders’ news release on the Forex market

In the previous section of the article, we understood the factory orders economic indicator and saw how important it is for foreign investors. As defined earlier, it is a report which shows the value of new factory orders for both durable goods and non-durable goods. The survey is usually released a week after durable goods orders report. The report tends to be predictable, with only non-durable goods appearing as the new component compared to the previous report. Thus, investors would have priced in most of the information even before the official release. Still, it causes some volatility in the currency pair during the news announcement.

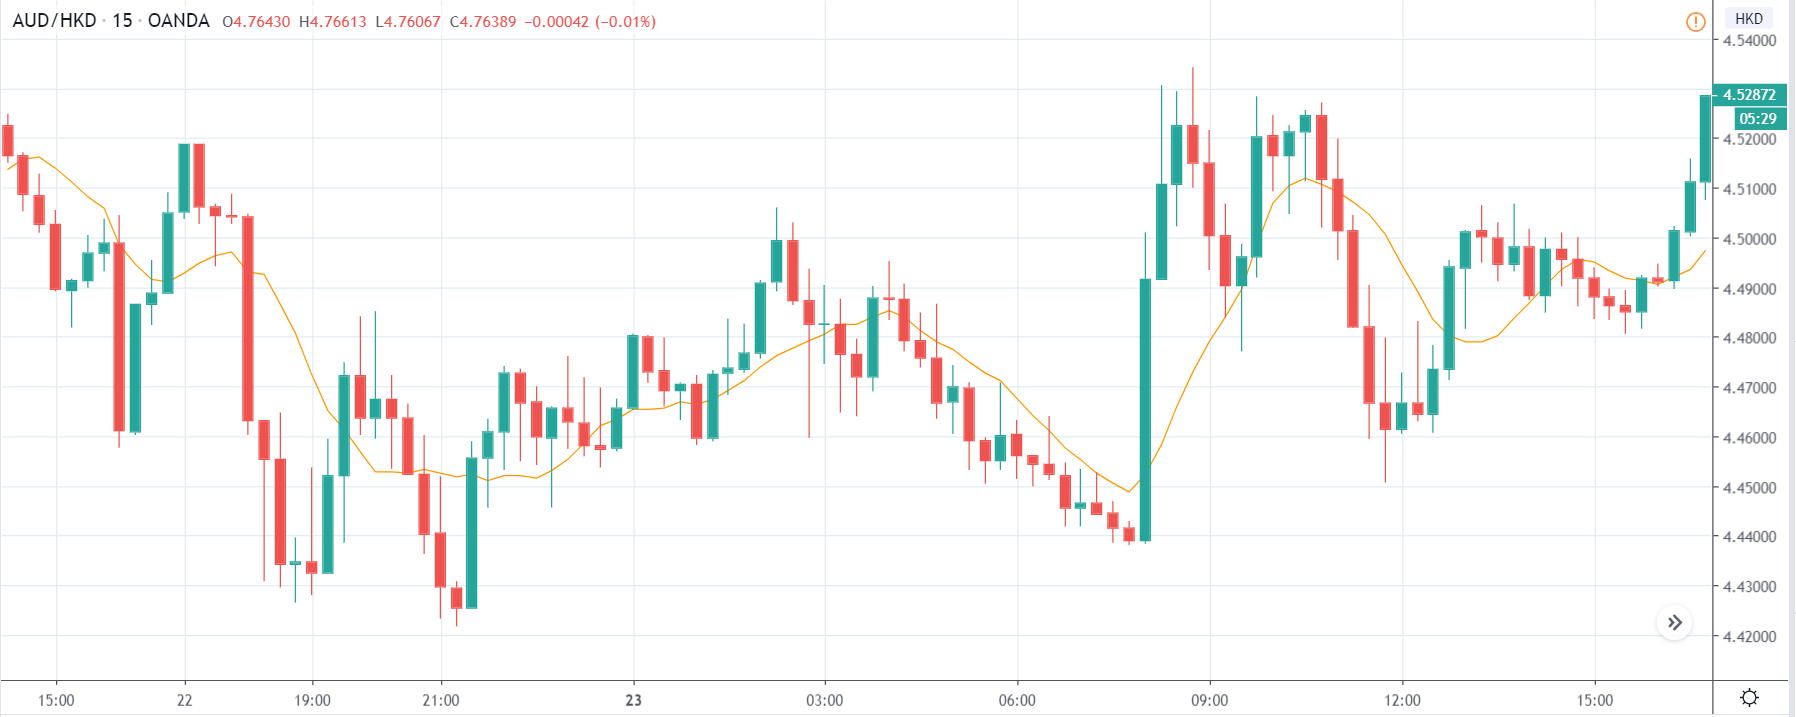
In today’s lesson, we will analyze the impact of the factory orders news announcement on various currency pairs and witness the change in volatility due to the news release. The below image shows the latest factory orders data of the United States, where it can be seen that the orders were better than expectations but were lower than last time. A higher than expected reading is considered to be bullish for the currency, while a lower than expected reading is considered negative. But, let us find out how the market reacts to this data.

EUR/USD | Before the announcement

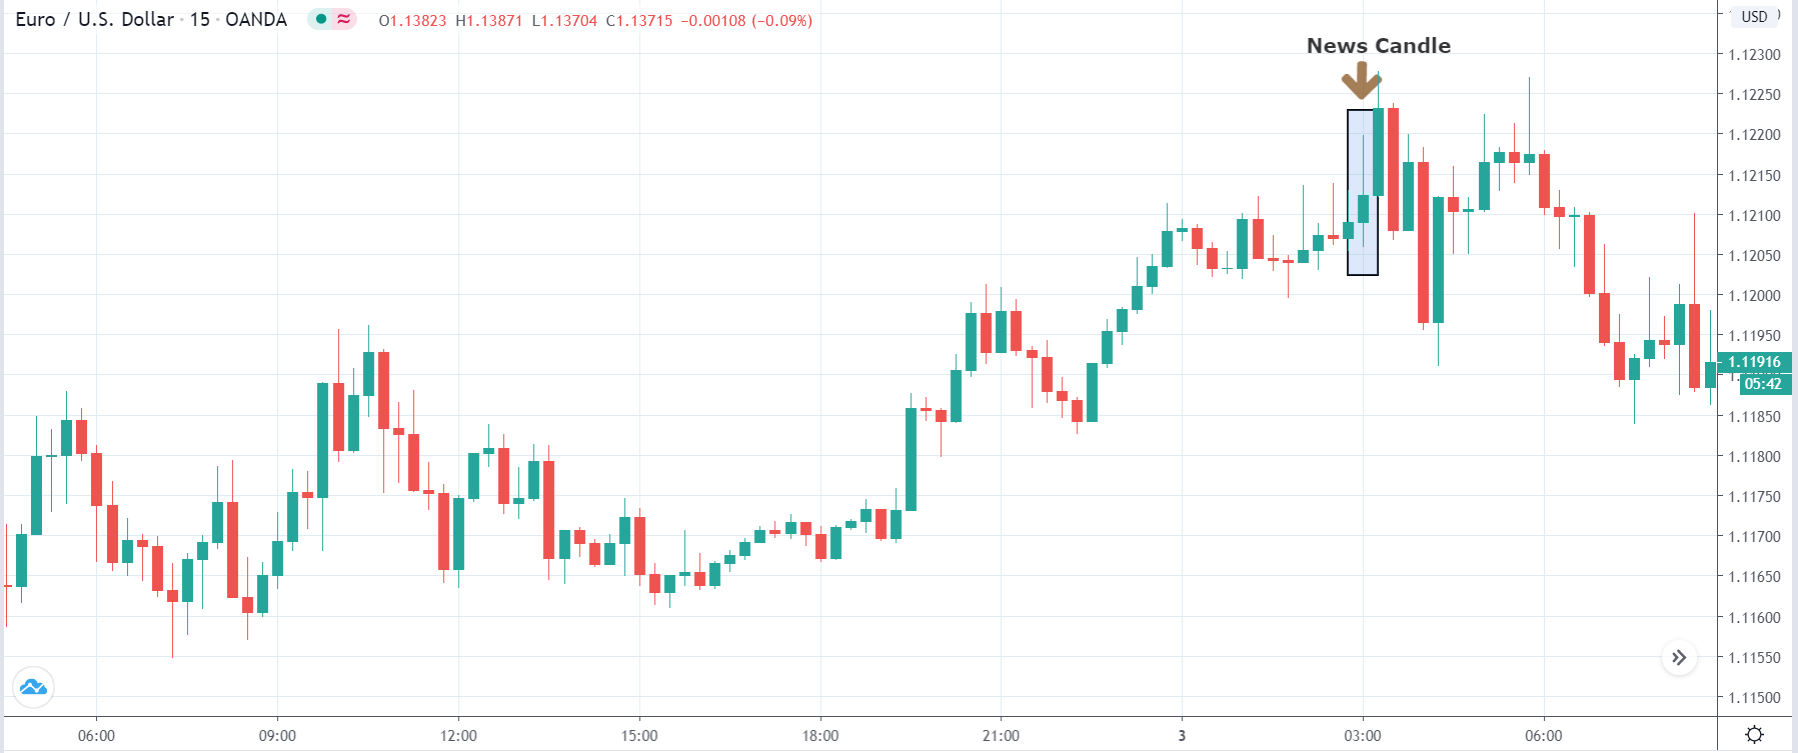
Let us start with the EUR/USD currency pair to observe the impact of factory orders on the U.S. dollar. The above image shows the 15 minutes time-frame chart of the currency pair where the market is in a strong uptrend before the news announcement. Recently the price has formed a ‘range,’ and the price is at the top of the ‘range’ at this moment. Technically, this is an ideal place for going ‘short’ in the market, but since a news announcement is due, it is advised not to take any portion before the announcement.

EUR/USD | After the announcement

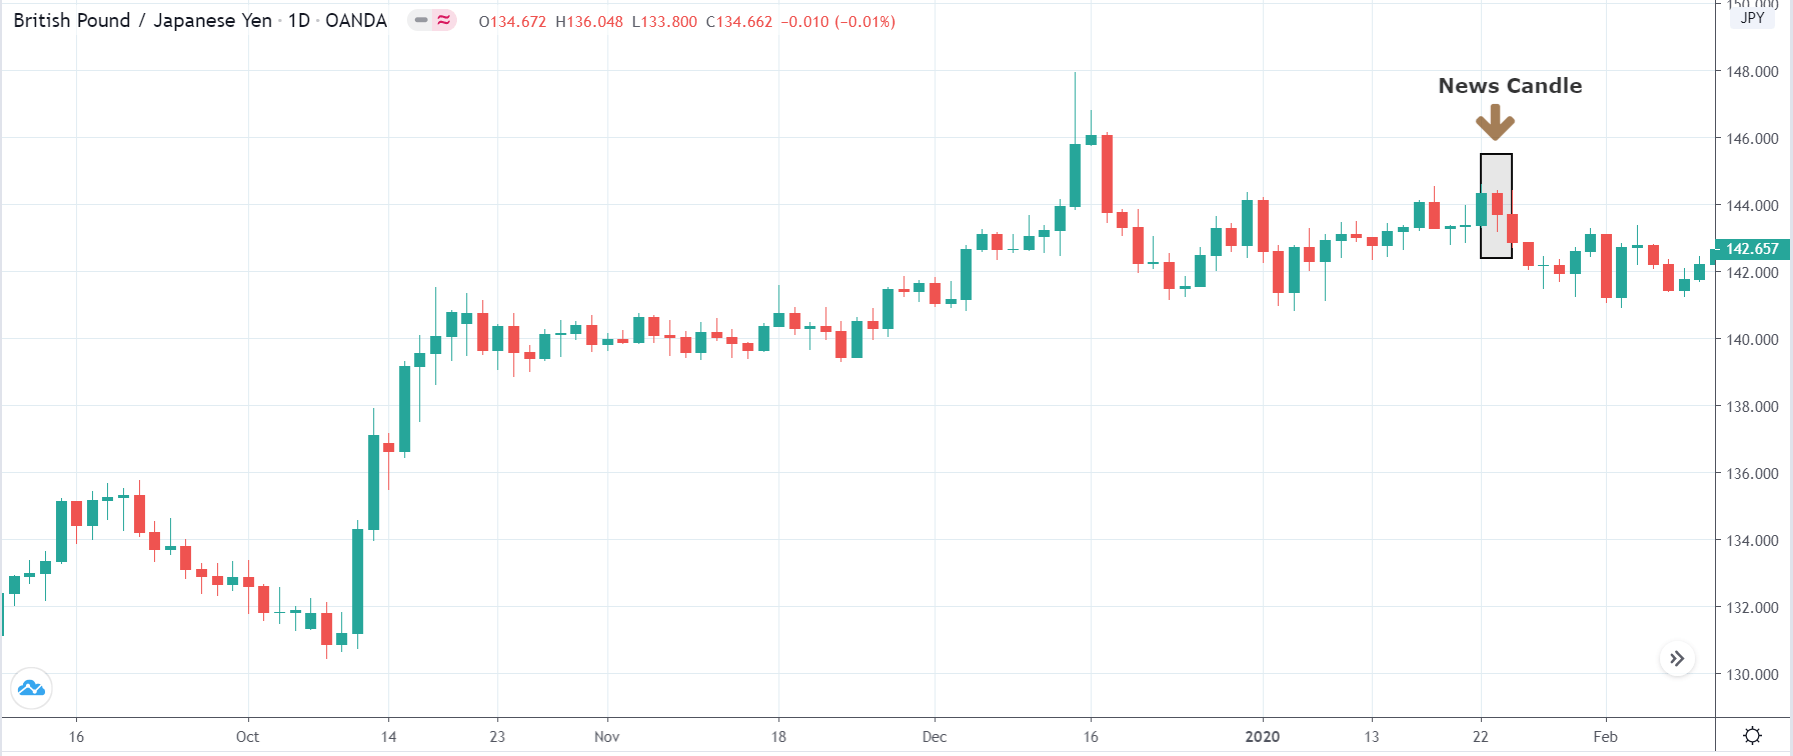
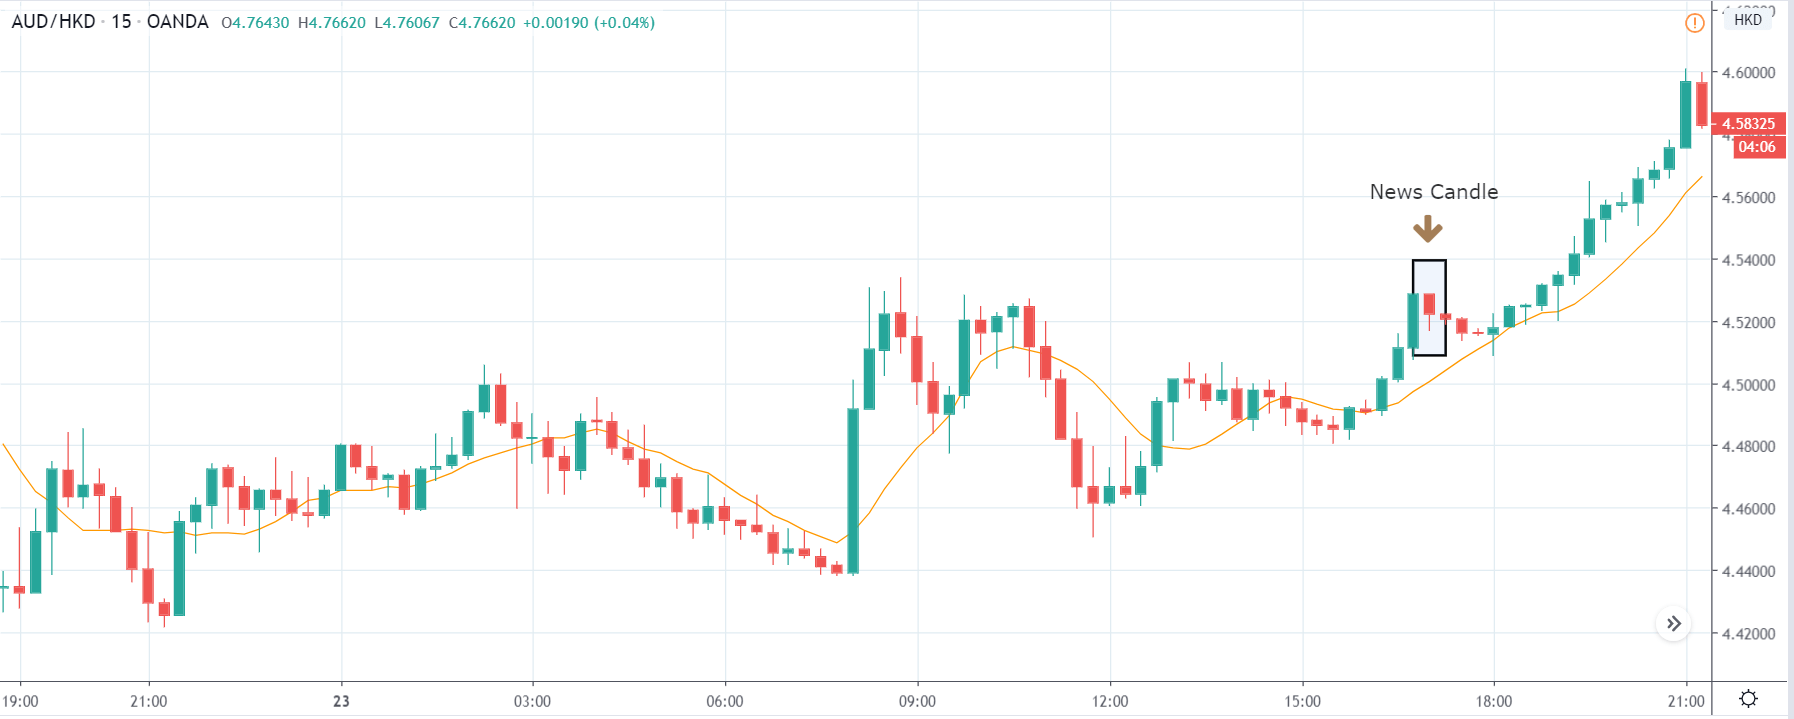
After the news announcement, the price initially moves higher, but this is immediately sold, and the market erases all the gains. The ‘news candle’ finally closes at the price where it had opened. Therefore, the factory orders data brought about a great amount of volatility in the currency pair, which is evident from the wick on top of the ‘news candle.’ One should wait for the volatility to settle down before taking a position in the market.

USD/CAD | Before the announcement

USD/CAD | After the announcement

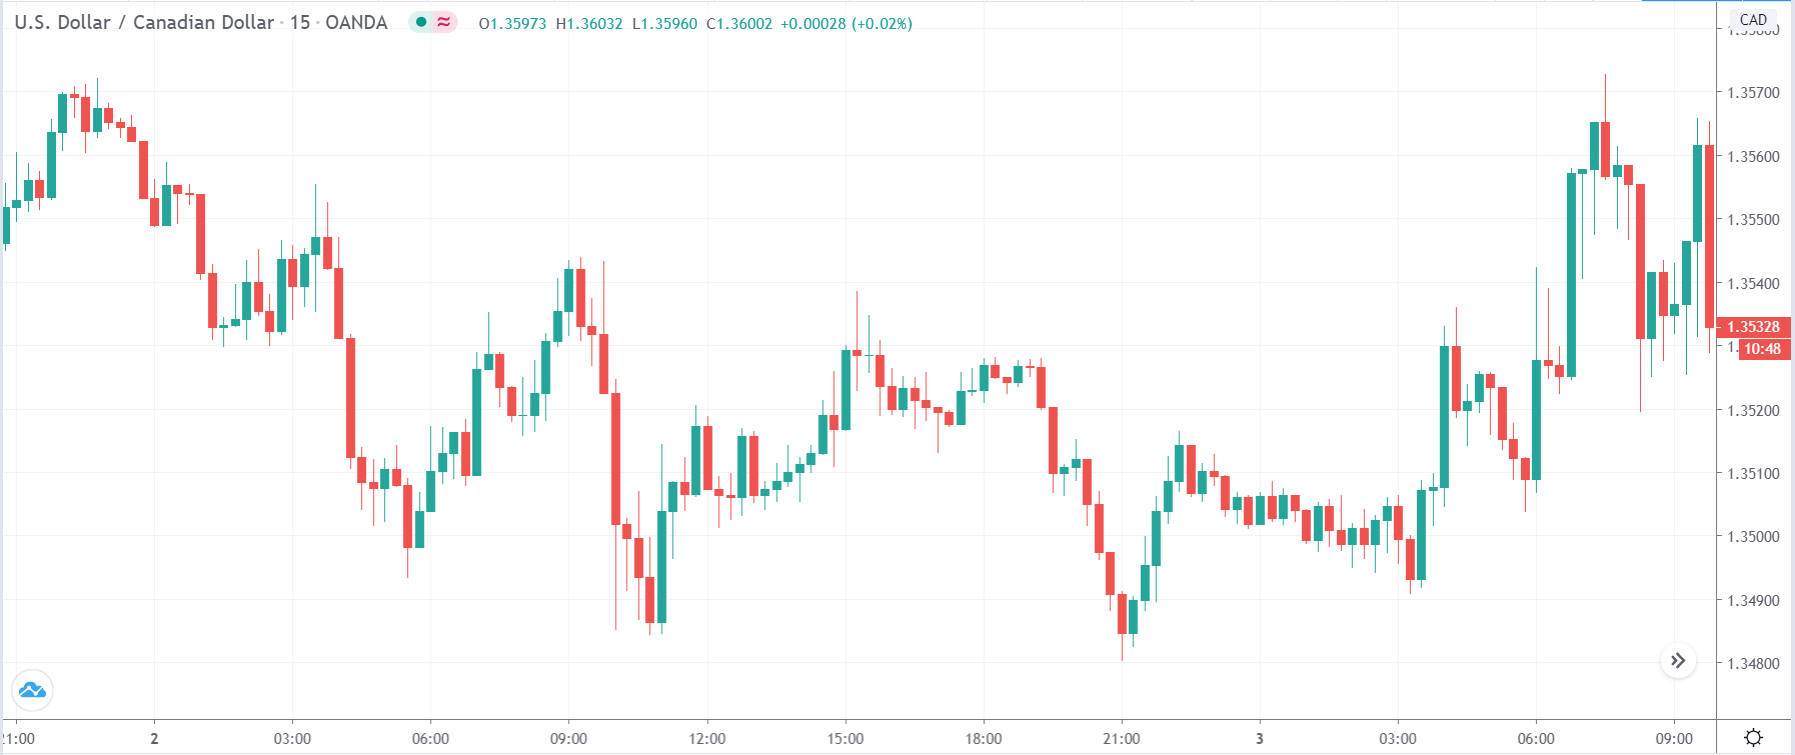
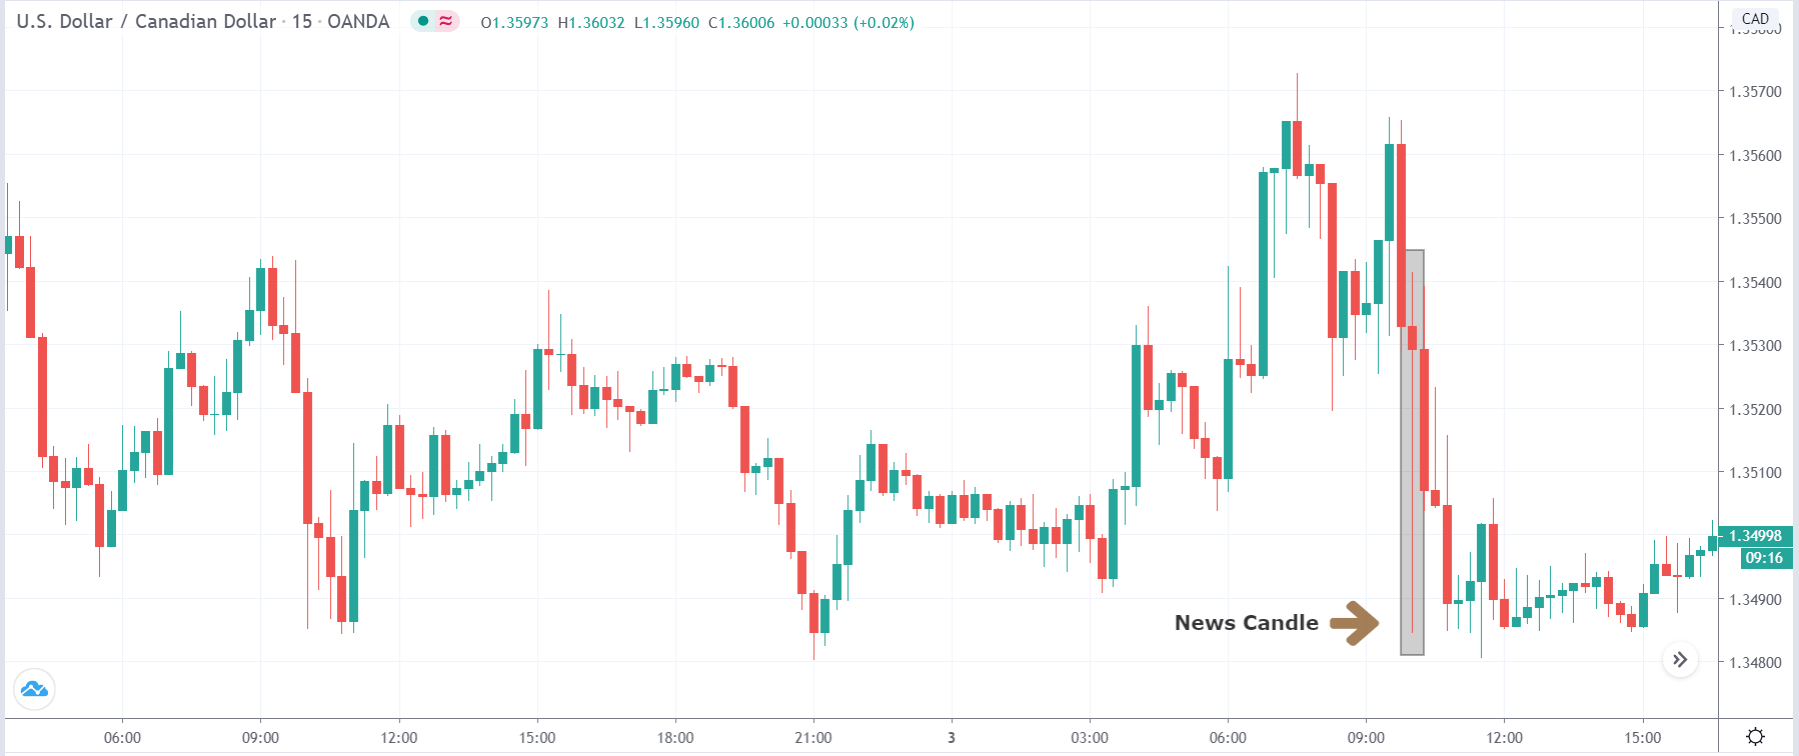
The above images represent the USD/CAD currency pair, where we see that the market is extremely volatile before the news announcement, and there is no clear direction of the market. As a point of a tip, it is not advisable to trade in currency pairs where the volatility is more than normal as there are a lot of risks associated with trading in trading such pairs.

After the news announcement, the currency pair gets exceedingly volatile where essentially the price drops greatly, but buyers pressure from the bottom takes the price back to its opening level. Therefore, the factory orders data had a major impact on the pair where the price continued to move lower a few minutes after the news release.

AUD/USD | Before the announcement

AUD/USD | After the announcement

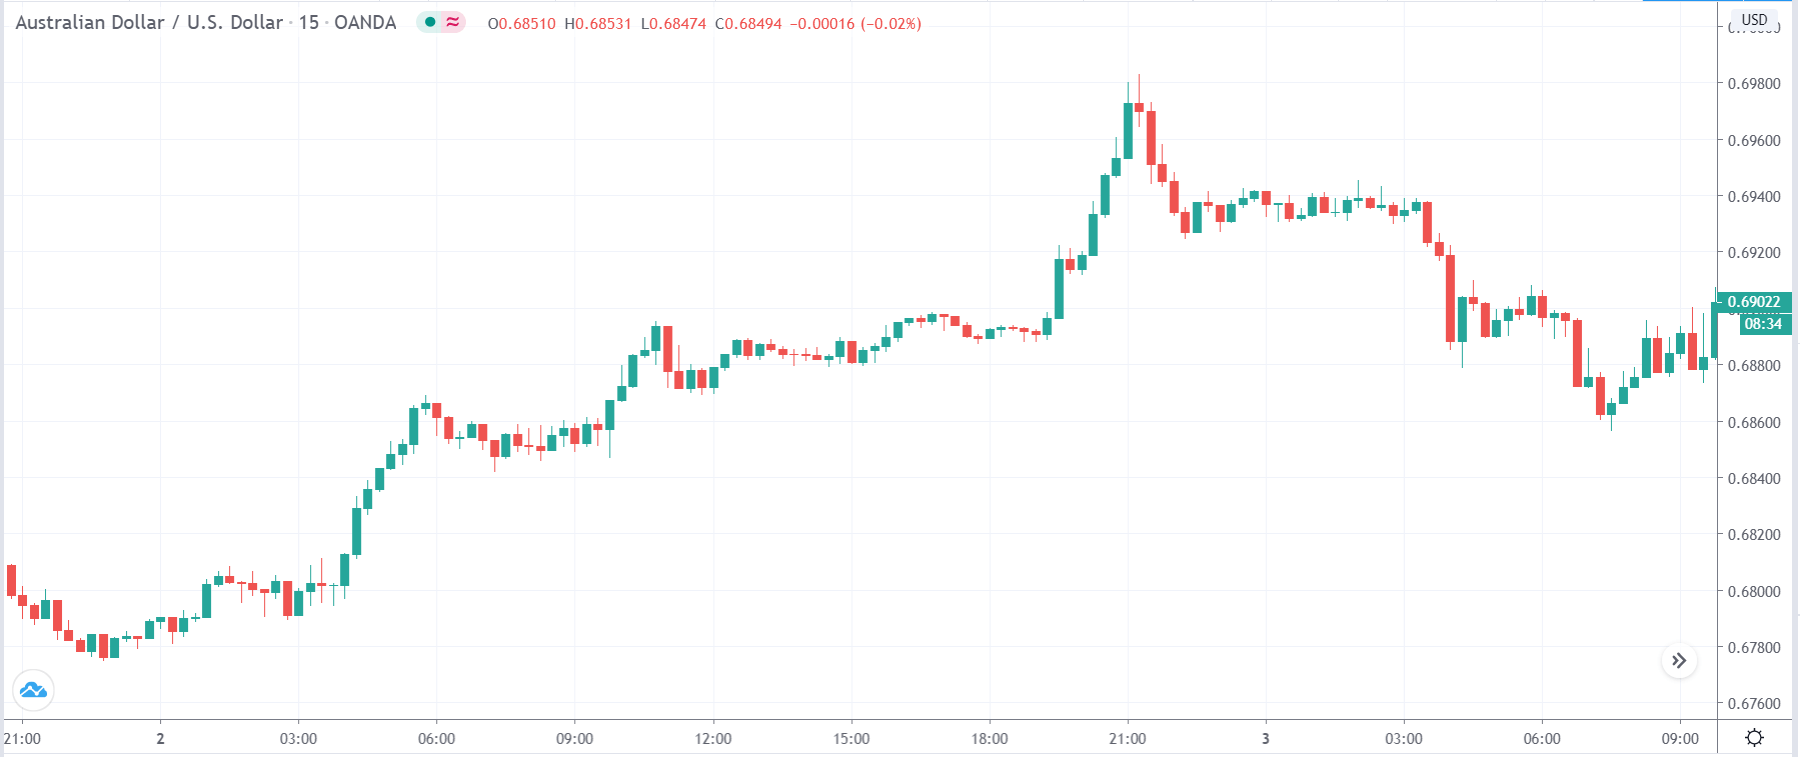
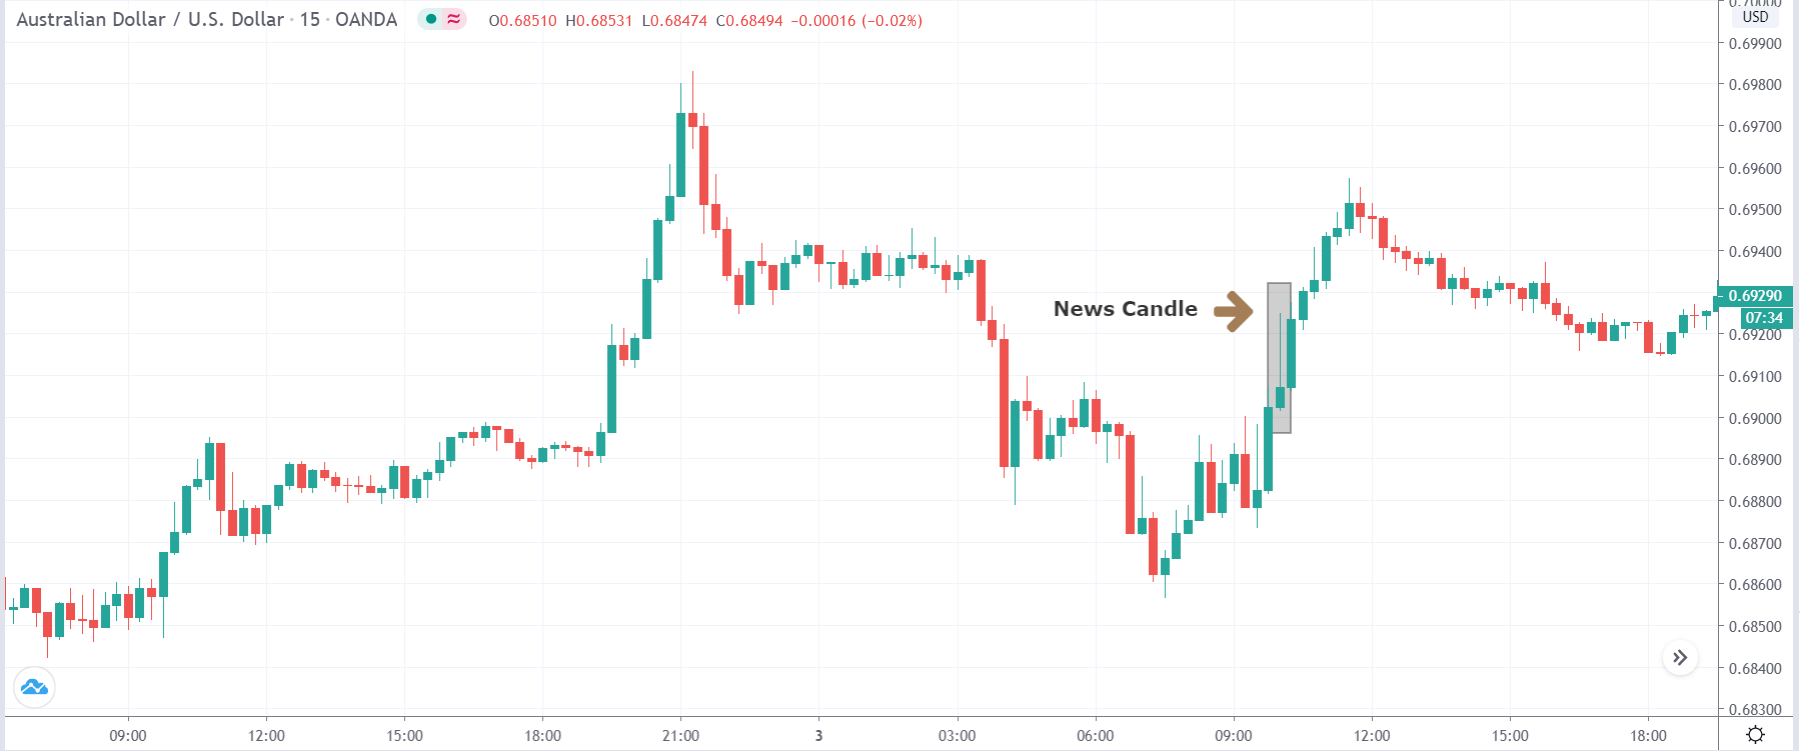
The above images are that of the AUD/USD currency pair, where the price is retracing the overall uptrend of the market. In such market situations, we should be looking for trend continuation candlestick patterns to confirm that the market will continue moving up.

After the news announcement, the price sharply moves higher and leaves a wick on top of the ‘news candle.’ Since volatility is high on both sides of the market during the announcement, we cannot ascertain if the factory orders data was positive or negative for the currency. As the market continues to move higher after the close of the ‘news candle,’ one should look for going ‘long’ in the market a few hours after the news announcement.

This ends our discussion on the ‘Factory Orders’ Fundamental driver. It is crucial to know its impact on the Forex price charts before trading this market. Cheers!

Categories
Forex Market Analysis

Daily F.X. Analysis, June 24 – Top Trade Setups In Forex – Focus on Technical Side!

On the news front, the market will be focusing on the German Business Climate figures along with Crude Oil Inventories. Overall the impact of these events is expected to be muted; therefore, our focus should be on the technical side of the market.

Economic Events to Watch Today 


EUR/USD – Daily Analysis

The EUR/USD pair was closed at 1.13085 after placing a high of 1.13484 and a low of 1.12329. Overall the movement of the EUR/USD pair remained bullish throughout the day. On Tuesday, the EUR/USD currency pair spiked above 1.13400 level, highest since June 16. The pair was up with 155 pips from the previous day’s low on the broad-based U.S. dollar weakness.

The U.S. dollar index, which measures the value of the U.S. dollar against the basket of six currencies, lost the gains of the previous five days in only two days and was down to 96.39 level, the lowest since June 11.

The U.S. dollar’s weakness came in after a new stimulus package from U.S. congress was announced by the U.S. Treasury Secretary Steve Mnuchin on Tuesday. Mnuchin also said that despite the rising number of coronavirus cases in some states of America, renewed lockdown would not be imposed.

Another reason behind the EUR/USD pair’s uptick was better than expected and robust macroeconomic data from the Eurozone about PMI.

 At 12:15 GMT, the French Flash Services PMI for June exceeded the expectations of 44.9 and came in as 50.3 and supported Euro. The French flash manufacturing PMI for June also surged to 52.1 against the expected 46.1 and supported Euro on Tuesday. At 12:30 GMT, the German Flash Manufacturing PMI increased to 44.6 from the forecasted 41.5 in June. The German Flash Services PMI exceeded expectations of 41.7 for June and came in as 45.8 and supported Euro.

At 13:00 GMT, the Flash Manufacturing PMI for the whole Eurozone came in better than expected as 46.9 against 43.8. The Flash Services PMI for whole bloc also supported the Euro when it was reported as 47.3 against the forecast of 40.5 and supported single currency Euro. The PMI from the Manufacturing and Services sector boosted in Europe and provided strength to the single currency Euro, which added gains in the EUR/USD pair.

On the other hand, from the American side, the Flash Manufacturing PMI from the United States was released at 18:45 GMT, which showed that Manufacturing activity in the U.S. dropped in June, and index came in as 49.6 against the expected 50.0 and hence, weighed on U.S. dollar.

The weak U.S. dollar added further in the gains of EUR/USD on Tuesday and pushed the pair above the 1.3400 level.

Daily Support and Resistance

  • R3 1.1479
  • R2 1.1414
  • R1 1.1361

Pivot Point 1.1297

  • S1 1.1244
  • S2 1.118
  • S3 1.1127

EUR/USD– Trading Tip

The EUR/USD pair is facing double top resistance at 1.1345 level, and below this, the EUR/USD has solid odds of staying bearish until 1.1266 level. Conversely, a bullish breakout of the 1.1345 level can extend buying until the next target level of 1.1415 level. While the bearish breakout of 1.12500 can lead EUR/USD prices towards 1.1230 and 1.1205. Besides, the leading indicators are mixed; for example, the RSI is suggesting a selling bias, while the MACD is indicating a bullish bias. Let us look for buying trades over the 1.1297 level today. 


GBP/USD – Daily Analysis

The GBP/USD pair was closed at 1.25209 after placing a high of 1.25317 and a low of 1.24317. Overall the movement of GBP/USD pair remained bullish throughout the day. GBP/USD pair rose above 1.2500 level and posted gains for 2nd consecutive day on Tuesday on the back of weak USD and strong British Pound after the release of PMI data. Another factor involved in the surge of GBP/USD pair was the plan set out by Britain on how it will regulate the city after Brexit.

On Tuesday, the finance minister of the U.K., Rishi Sunak, said that Britain’s government intends to regulate Europe’s biggest financial sector by making reforms to maintain the soundness of capital markets and managing future risks.

The U.K. left E.U. in January, and it will no longer be required to follow Europe’s financial rules after December when the transition period will end. Sunak said that Britain’s government would tailor the E.U. Capital rules for insurers known as Solvency II after Brexit. The U.K. lawmakers have long criticized the Solvency II rules as too inflexible, and the government intends to start to review it in autumn.

Besides tailoring the rules for the insurance sector, Britain will also make existing retail customer disclosure rules. Sunak showed concern and said that Britain would come under more pressure outside the E.U. to lee pots financial sector globally competitive. The EU is the biggest export customer of the U.K.’s financial services, and an enduring future relationship with the E.U. will help the U.K. maintain its role globally.

Furthermore, the negotiators of Britain and the E.U. have hit by a new obstacle to secure a trade deal after clashing over 70 billion euros worth of subsidies to E.U. farmers by Brussels. The E.U. negotiating team led by Michel Barnier was accused in the latest round of talks of trying to stop the U.K. government from defending British farmers from cut-price European imports.

On the data front, at 13:30 GMT, the Flash Manufacturing PMI from Great Britain for June came in as 50.1 against the expected 45.2 and supported British Pound. The Flash Services PMI for June from the U.K. also surged to 47.0 from the forecasted 39.1 and helped British Pound to gain traction.

The better than expected U.K. Preliminary Manufacturing & Services PMI data provided strength to British Pound on Tuesday, which lifted GBP/USD pair above 1.2500 level. On the other hand, from the U.S. Side, the Flash Manufacturing PMI for June was dropped to 49.6 from the expected 50.0 and weighed on the U.S. dollar. The weak U.S. dollar added in the gains of GBP/USD on Tuesday.

Daily Support and Resistance

  • R3 1.2378
  • R2 1.2369
  • R1 1.2357

Pivot Point 1.2348

  • S1 1.2337
  • S2 1.2327
  • S3 1.2316

GBP/USD– Trading Tip

The GBP/USD is trading bullish at a level of 1.2512, holding right above 50 periods of EMA, which is likely to extend support at a level of 1.2510. On the downside, the GBP/USD may find support around the value of around 1.2445, and the continuation of a selling trade can lead Sterling prices to be further lower until 1.2378 level. The MACD and RSI are expending a mixed bias, as the MACD is holding in a selling zone, while the RSI holds in a buy zone. The recent formation of neutral candles over 1.2510 support level is suggesting indecision among traders. Therefore, we should look for selling trades below 1.2470 and buying trades 


USD/JPY – Daily Analysis

The USD/JPY pair was closed at 106.534 after placing a high of 107.220 and a low of 106.071. Overall the movement of USD/JPY remained bearish throughout the day. The USD/JPY pair in early trading hours in Asian session surged above 107.200 level after White House advisor Peter Navarro clarified his statement that the phase one deal was over. Navarro issued a clarification stating that his comments had been taken widely out of context.

On Monday, Navarro said that the trade deal was over, and markets went on a roller coaster after this statement; however, right afterward, he issued a clarified statement which was then backed by the U.S. President himself. U.S. President also provided further assurance after his clarification that the phase-one deal was still intact to avoid any confusion.

U.S. dollar gained after that clarification but failed to post gains in the European session after the strong PMI data from Europe, which made the U.S. dollar weak. U.S. dollar came under pressure, and the pair USD/JPY starting to move in a downward trend. The U.S. Dollar Index was down 0.45% near 96.56 level on Tuesday, which exerted more pressure on the U.S. dollar. Greenback seemed to face high selling pressure after the release of U.S. economic data.

At 5:30 GMT, the Flash Manufacturing PMI from Japan for June dropped to 37.8 against the forecasted 39.5 and weighed on Japanese Yen. However, at 10:00 GMT, the Bank of Japan Core CPI for the year came in as 0.0% against the expected -0.1% and supported the Japanese Yen.

On the U.S. side, at 18:45 GMT, the Flash manufacturing PMI for June came in as 49.6 against the expected 50.0 and weighed on the U.S. dollar. The Flash Services PMI came in line with the expectations of 46.7.

At 18:59 GMT, the Richmond Manufacturing Index for June was up to 0 from expectations of -3 and supported the U.S. dollar. At 19:00 GMT, the New Home Sales in May were recorded as 676K against the expected 637K and supported the U.S. dollar.

The poor than expected PMI data, even after the reopening of economies from all states of America, gave a high selling pressure on the U.S. dollar.

The U.S. dollar’s selling bias was further supported by the latest comments from U.S. Treasury Secretary Steve Mnuchin, who said on Tuesday that U.S. Congress would issue more stimulus in July to overcome the pandemic crisis. This depicted the U.S. economy’s weakness, and hence, the U.S. dollar suffered and dragged the USD/JPY pair with itself below 106.100 level on Tuesday.

Daily Support and Resistance    

  • R3 107.13
  • R2 107.05
  • R1 106.94

Pivot Point 106.85

  • S1 106.74
  • S2 106.65
  • S3 106.54

USD/JPY – Trading Tips

The USD/JPY traded bearishly to break out of the descending triangle pattern, supporting the pair around 106.800 level. On the lower side, the support level can be seen at 106.400, and violation of this could trigger sell-off until 106 level. The breach of the descending triangle pattern suggests selling bias, but before this, we can expect upward movement in the market until 106.800. Let’s consider taking sell trades below 106.800 level today. 

Good luck! 

Categories
Crypto Market Analysis

Daily Crypto Review, Jun 24 – Italy Ready For The Digital Euro; Ethereum Rushing Towards Next Resistance Level

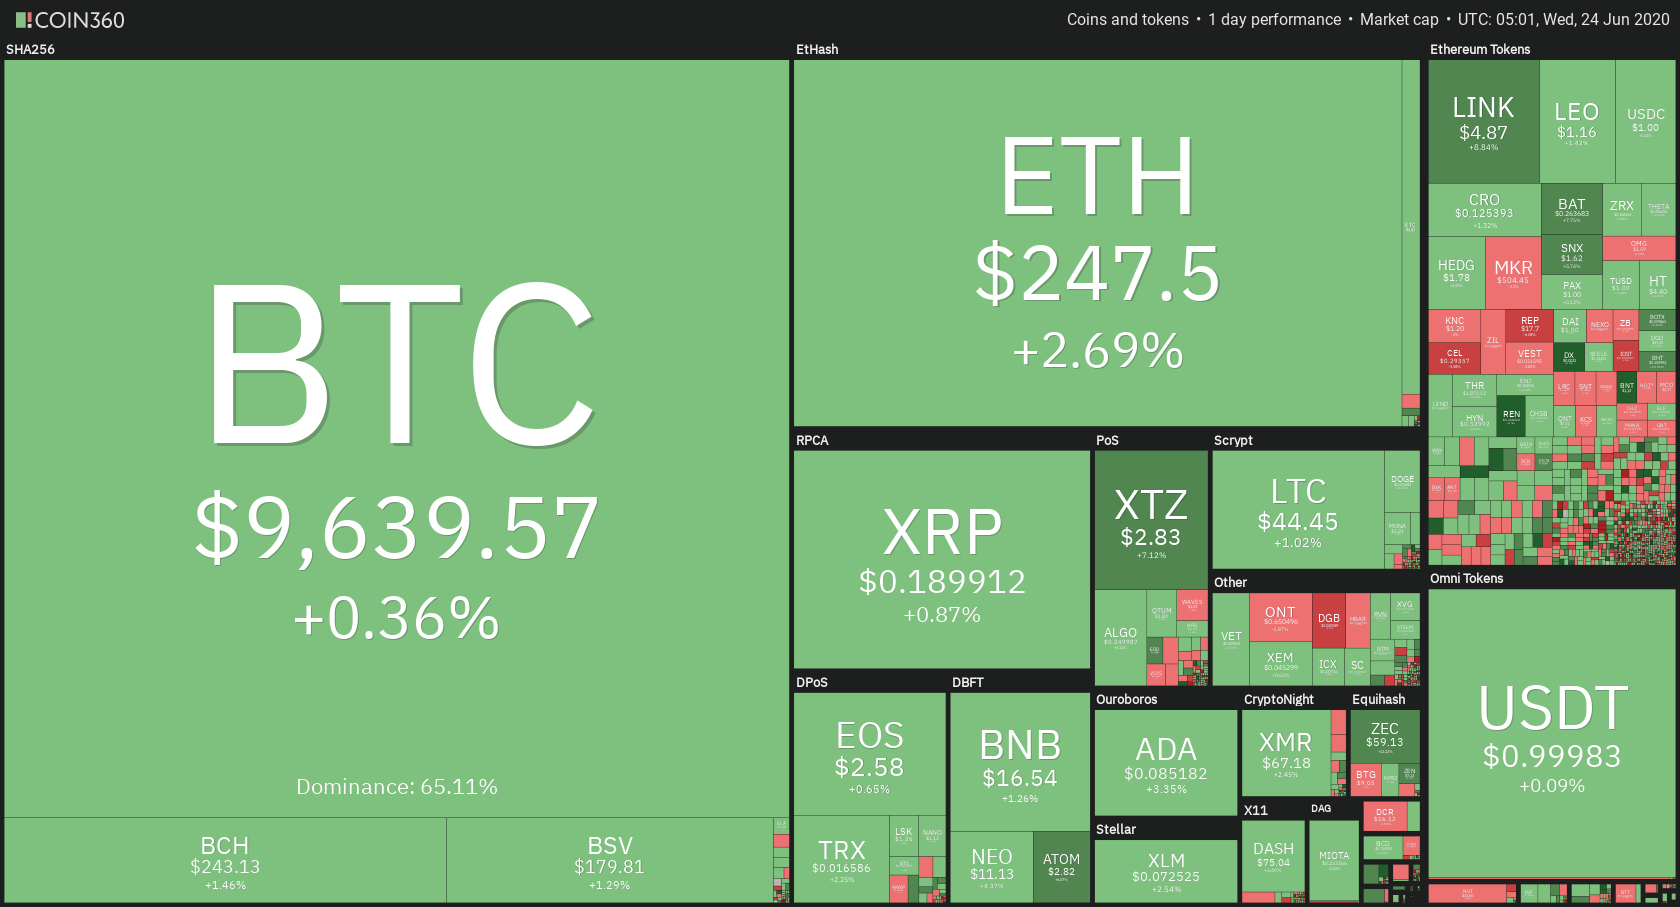
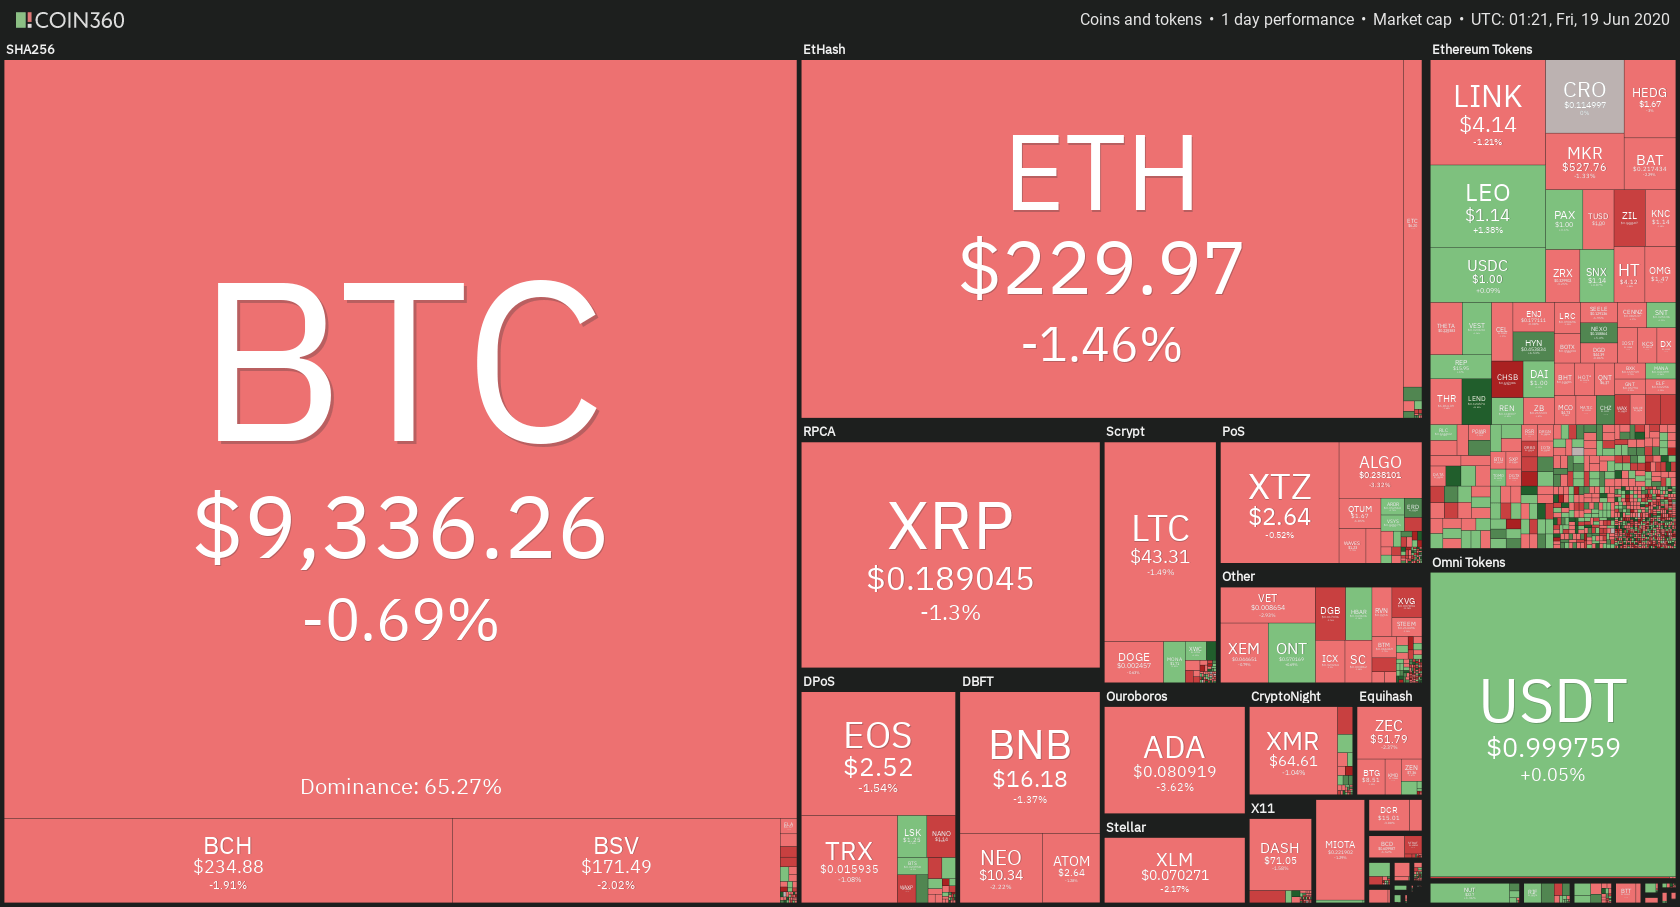
The cryptocurrency market has spent the past 24 hours, either establishing its current levels or gaining a bit of value. Bitcoin is currently trading for $9,639, which represents an increase of 0.36% on the day. Meanwhile, Ethereum gained 2.69% on the day, while XRP gained 0.87%.

DxChain Token took the position of today’s biggest daily gainer, with gains of 21.87%. Compound lost 17.50% of its daily value, making it the biggest daily loser.

Bitcoin’s dominance level decreased slightly since we last reported, with its value currently at 65.11%. This value represents a 0.17% difference to the downside when compared to yesterday’s value.

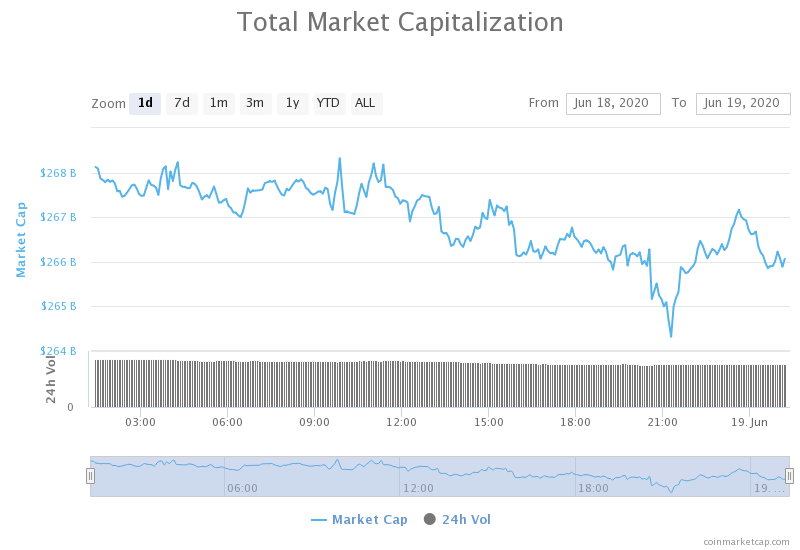
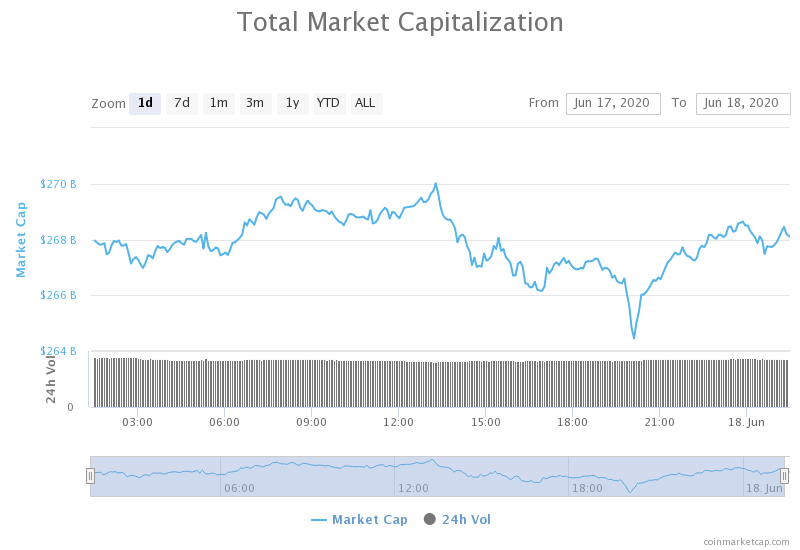
The cryptocurrency market capitalization increased slightly when compared to yesterday, with the market’s current value being $275.85 billion. This value represents an increase of $2.66 billion when compared to the value it had yesterday.

What happened in the past 24 hours

Is Italy implementing a digital Euro?

The Italian Banking Association has announced its willingness to support the implementation of a digital Euro. The IBA had approved guidelines governing its position on the digital currency as well as central bank digital currencies in general.

The ABI announced that monetary stability, as well as respecting regulations related to a digital Euro, are two of its top priorities.

_______________________________________________________________________

Technical analysis

_______________________________________________________________________

Bitcoin

The largest crypto by market capitalization spent the past 24 hours mostly stabilizing around the $9,600 level after taking over the $9,580 resistance (now support) level. The support level got tested and held up a couple of times, confirming that Bitcoin will (for the time being) trade within a range bound by it as well as the $9,735 resistance level.


Bitcoin’s volume is slowly decreasing while its RSI level is reaching the value of 60.

Key levels to the upside          Key levels to the downside

1: $9,735                                 1: $9,580

2: $9,870                                 2: $9,251

3: $10,010                                3: $9,120

Ethereum

Unlike Bitcoin, Ethereum spent the day reaching for new highs and trying to get to the $251.4 resistance level. The second-largest cryptocurrency by market capitalization managed to increase its value by over 2% on the day. Its volume is, however, lowering, while its RSI level on the 4-hour chart crossed into overbought territory. This might indicate a pause in the bullish move until Ethereum gathers enough strength to attempt a breakthrough the $251.4 resistance.


Key levels to the upside          Key levels to the downside

1: $251.4                                 1: $240

2: $260                                    2: $228

3: $225.4

Ripple

While XRP did not gain much percentage-wise, its move towards the upside is an extremely important one. The third-largest cryptocurrency by market cap is trying to get back above the $0.19 level, which will determine its position in the short-term. While the move initially moved above the resistance, XRP’s RSI is approaching overbought, while its volume is decreasing, signifying exhaustion.


Key levels to the upside          Key levels to the downside

1: $0.19                                      1: $0.178

2: $0.2                                  

3: $0.205


Categories
Forex Videos

Fundamental Analysis For Novices – Average Hourly Earnings

Fundamental Analysis For Novices – Average Hourly Earnings

Thank you for joining the fundamental analysis for novices’ educational video. This time we will be looking at.

Hopefully, you will be reviewing all the fundamental analysis for novices videos in this series of educational videos.


Professional traders regularly refer to an economic calendar, such as this one, which is provided by most brokers. Use it as a tool to plan your trades, and most importantly, use it as a facility to tell you when not to trade via expected volatile periods in the market, which potentially follow high impact or high importance regarded data releases.


The key information that you need to take particular attention to is the time of the event, the economic event itself, the day and date, the impact level, which typically comes as low, medium, and high, the actual economic data release as listed at the time of the event, which is usually subject to an embargo, and before this, pay particular attention to the general consensus of what the actual figure might be. This is put together by leading economists and market analysis. Also, pay attention to the previous release of this data.


In this video, we are looking at average hourly earnings, year on year, for May 2020. This data is typically more important within the United States and has a maximum impact value. It is always released on the first Friday of each month, along with the non-farm payrolls.
This particular session of releases he’s very widely anticipated by the markets because it gives a clear picture of the economic conditions for the United States, which is one of the biggest economies in the world.
The data is released by the US Bureau of Labor Statistics. It reflects labour cost inflation and throws light on the conditions of the Labour market. The board of the Federal Reserve uses this as a leading indicator when setting interest rates, along with the unemployment figures.


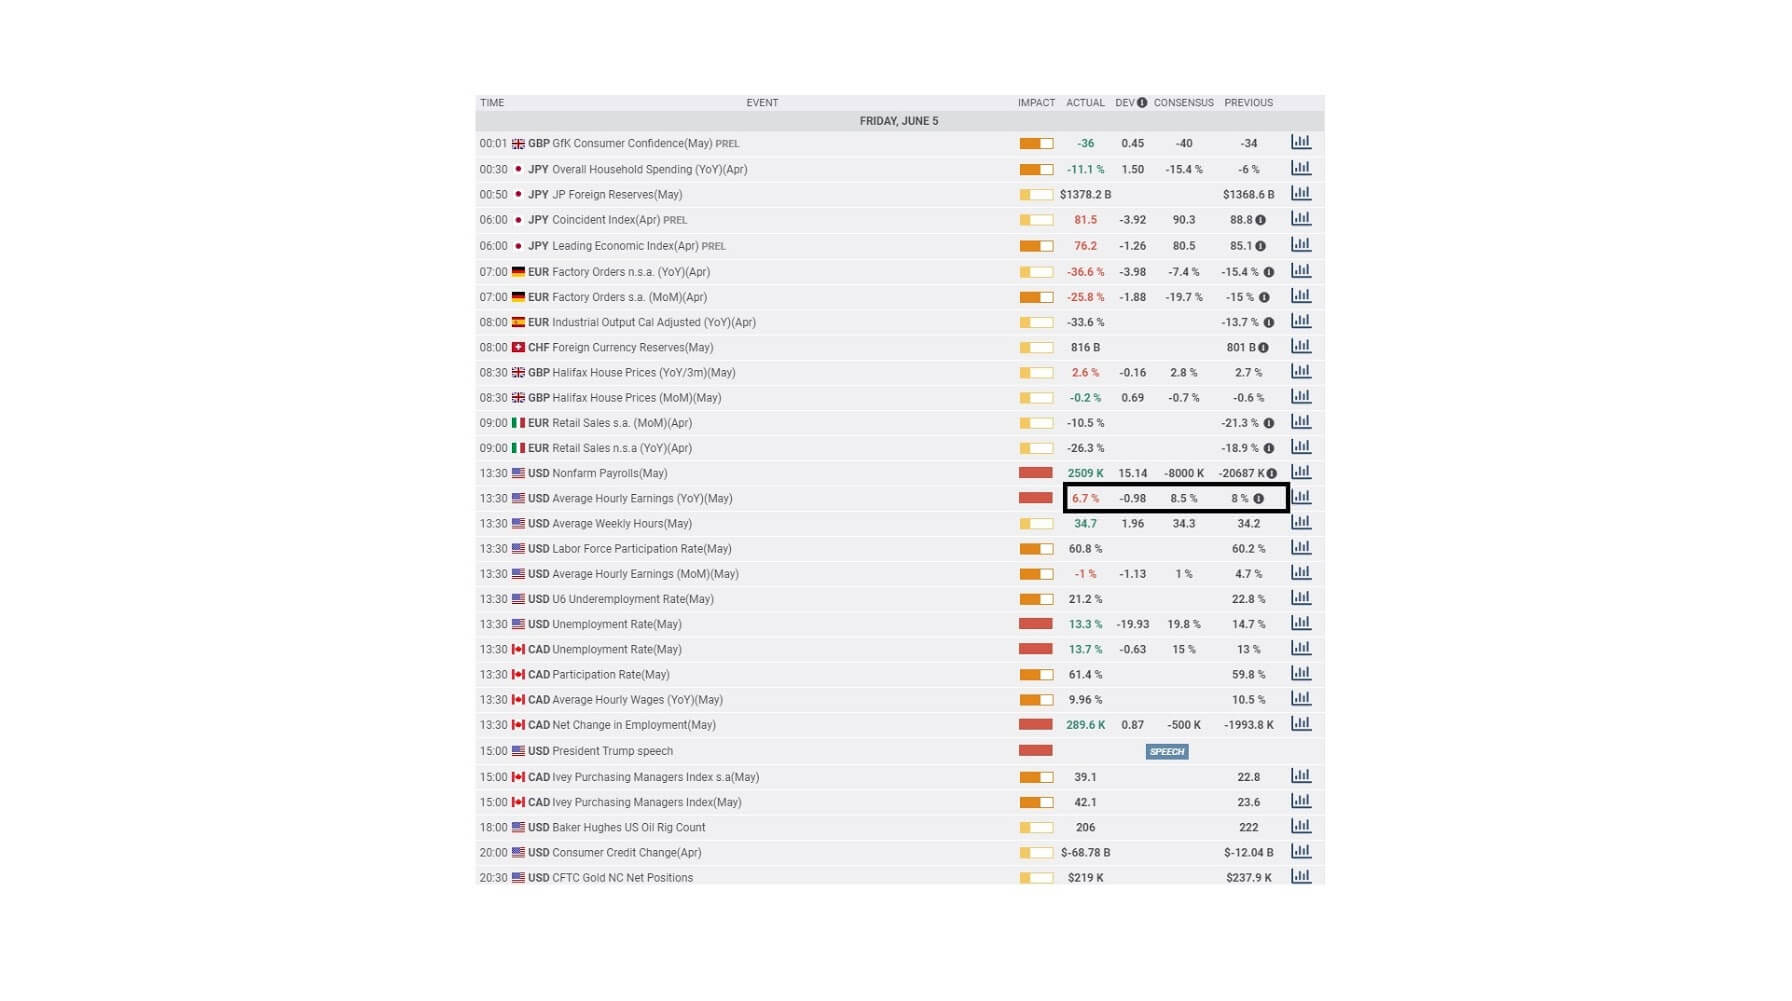
Here we can see that the average hourly earnings figure for May came in at 6.7%, which was below the consensus value of 8.5% and below the previous figure of 8% for April. The deviation is also shown as -0.98%.
A higher reading would have been positive or bullish for the USD, while this reading is negative or bearish for the USD.

This is why it is always imperative to wait until the market has analysed all of the data, including average hourly earnings before you jump in and start trading purely on the non-farm payrolls figure only.

Tread cautiously and wait for a trend to begin and then join that in either direction. When trading this data always expect the unexpected because the market can become extremely volatile post data release.

Categories
Forex Videos

Fundamental Analysis For Novices – House Price Index

Fundamental Analysis For Novices – House Price Index

Welcome to the educational video for Fundamental Analysis For Novices. In this session, we will be looking at the House Price Index.


If you are not already doing so, we strongly recommend that you regularly check a reliable economic calendar each day to be forewarned about economic data releases from countries that might affect your open or planned trades.


Economic data releases impact the market in various degrees, and you should pay particular attention to the date of the event, the time, and most importantly, the likely impact it will have, which usually is in 3 degrees, low, medium, and high.


Most calendars will also provide you with the previous data release in each category, the consensus, or the expected data release as analysed by economists and analysts who have come to an average consensus value, and the actual figure which is updated with the data upon release.

Each country releases similar titled economic data into the market, mostly on an embargoed basis, in order not to give traders an advantage and to avoid market manipulation.

Today we are looking at House Price Index!


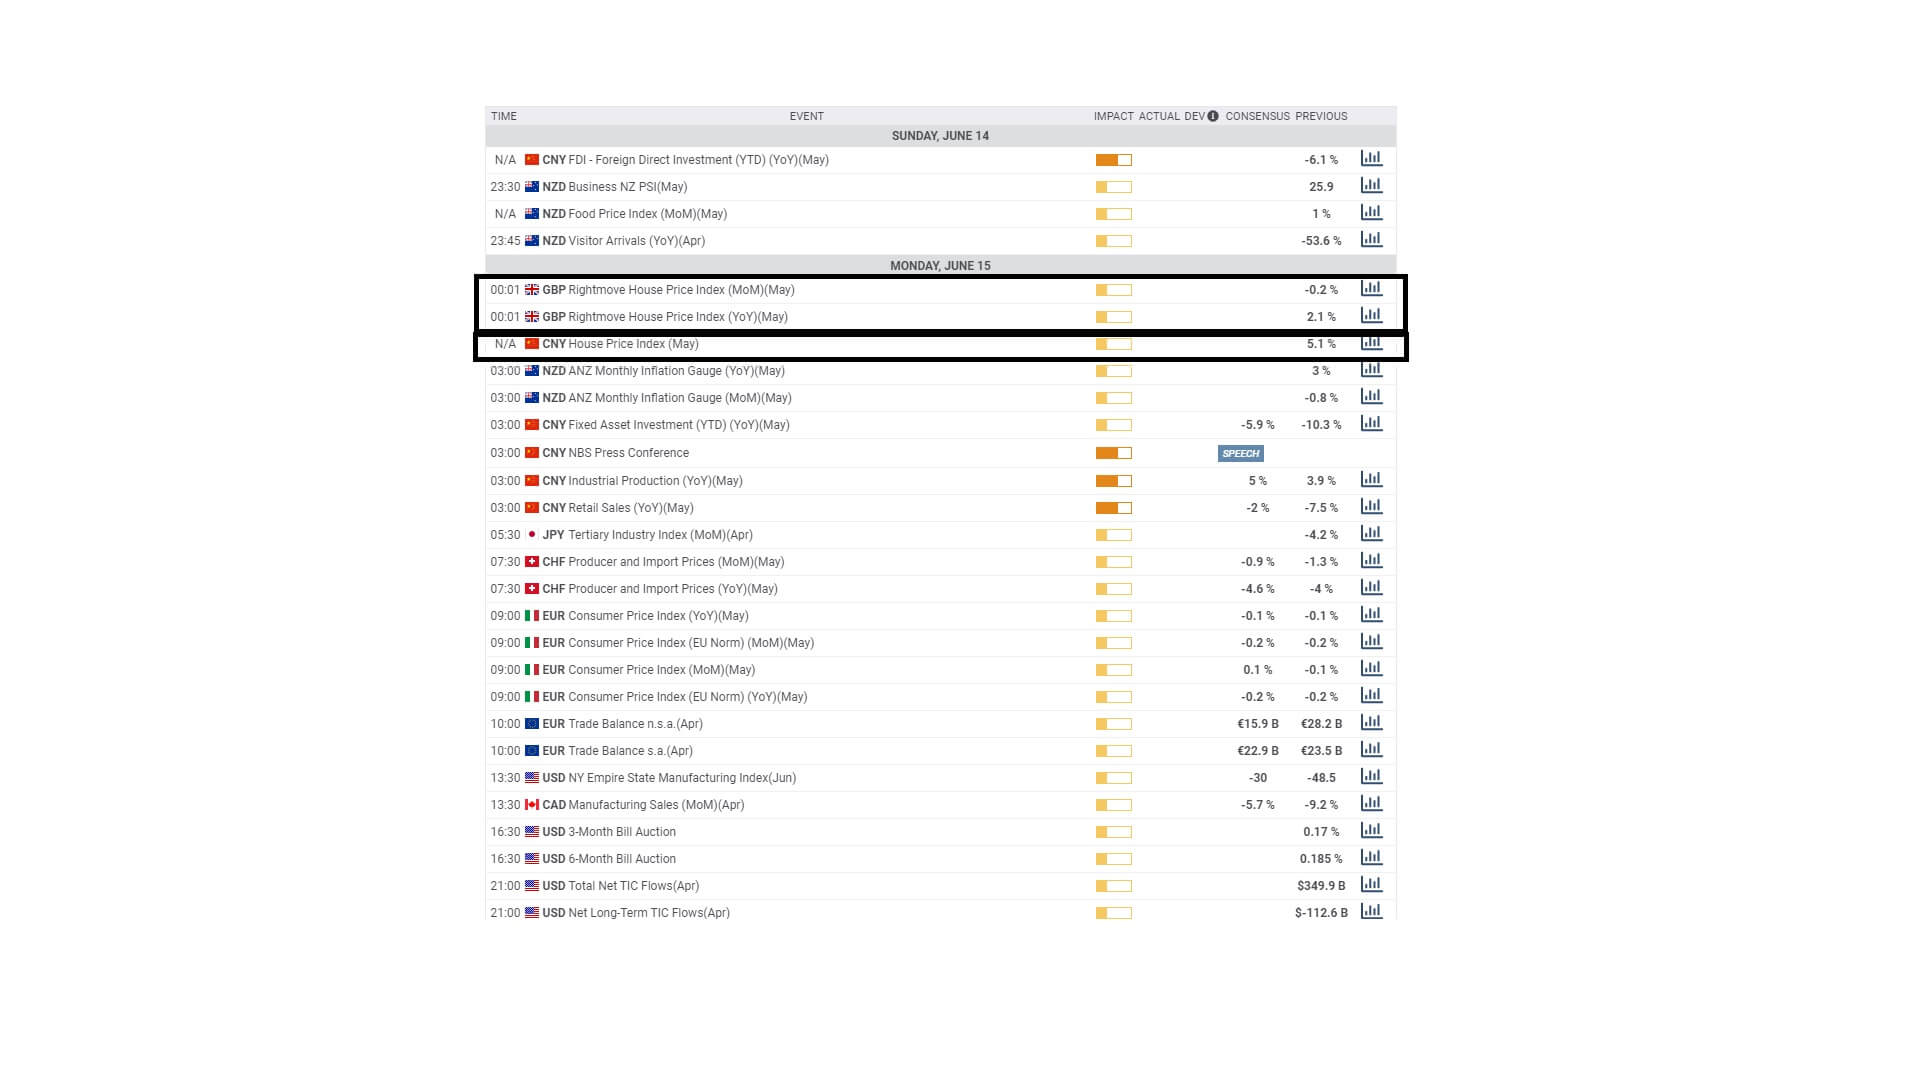
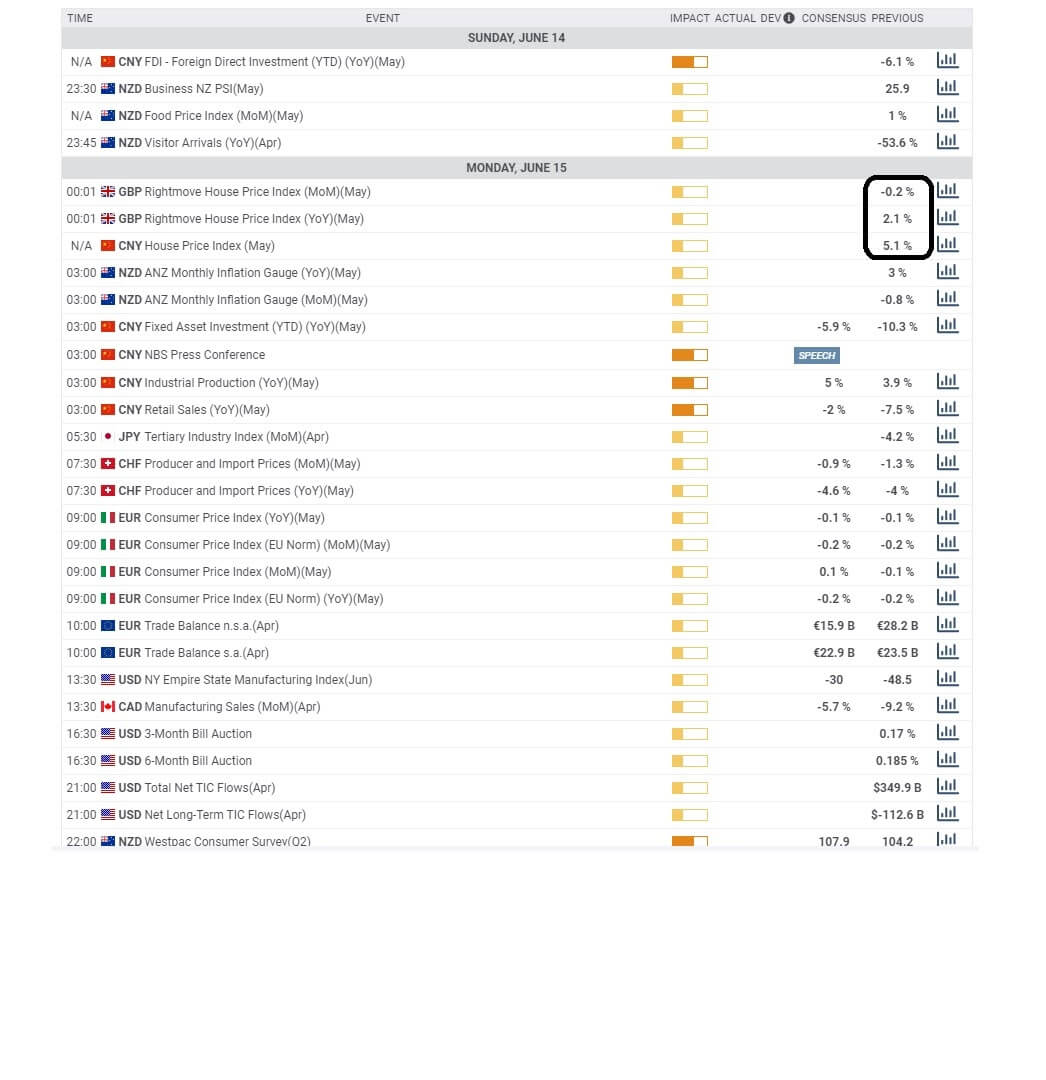
Here we can see there are two releases due for the 15th June 2020; one has been collated by Rightmove property website for the UK where the numbers are a sample only and are reflected of the period for May and are devised on a month by month basis and the second which is updated on year by year basis. and the other
The impact level for this type of indicator is typically low and does not usually cause market volatility.


So what is the House Price Index, and how do you trade it?

The house price index or HPI, as it is also known, measures the price change in the value of residential houses. The data is typically released into the market on a month-by-month basis or updated on an annual basis.


The data, in all cases, is calculated as a percentage figure from a specific start date. In most cases, the statistical method to calculate price swings is called a hedonic regression model.

In the UK, the HPI is released by the Office for National Statistics. In the United States, the HPI is published by The US Federal Housing Finance Agency, where it measures those family homes that have been sold or refinanced in 363 metropolises. Not to be confused with the FNC Residential price index as published by FNC Incorporated, which records value in non-distressed home sales and is widely used by the mortgage sector as a tool to gauge price movements.

The basic rule of thumb is that house prices that are falling in value are reflective of an economy that is struggling and whereby perhaps unemployment is high, wages are low, and the growth of an economy is slowing, stalled, or in recession. This would have a negative impact on the currency of a particular country. Therefore you might find the value of a local currency falling in value in terms of exchange

rates.
On the flip side, a higher than expected HPI number might be reflective of an improving economy, in which case it is better for the local currency, and you might find it increasing in value on exchange rates.
Always compare the actual HPI release number to the consensus value and the previous release and remember that markets do not like shocks. Deviations from the consensus and previous releases can cause market instability.

Categories
Forex Daily Topic Forex Fundamental Analysis

Understanding ‘Industrial Production Index’ & Its Relative Impact On The Forex Market

What is the Industrial Production Index?

Industrial Production Index or IPI, as it is commonly called, is an index that tracks manufacturing activity in different sectors of the economy. The IPI number measures the industrial production for the period under consideration, usually a month. IPI is a key economic indicator of the manufacturing sector of the economy. It measures the real output in the mining, electric, and gas industries, relative to the base year.

How is IPI calculated? 

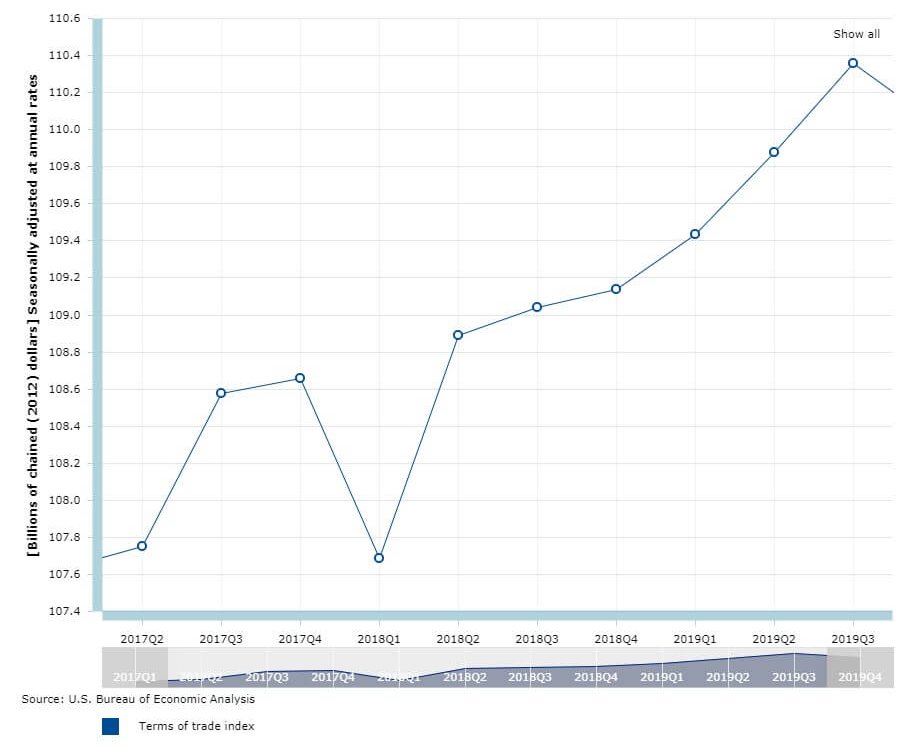
Industrial Production is expressed as an index relative to the base year, which is 2012. They do not express absolute production numbers or volume, but the percentage change in production relative to 2012. The parameter taken into account is often varied, including physical inputs and outputs such as tons of iron, or inflation-adjusted sales figures, and when these parameters are not available, hours logged in by production workers is considered. This data is obtained from industry associations and government agencies, and the index value figure is obtained after incorporating these numbers in the Fisher-Ideal formula.

Within the IPI index, several sub-indices provide a detailed look at the production levels of highly specific industries. One can find the monthly production data of residential gas sales, ice cream, carpet and rug mills, spring and wire products, audio and video equipment, and paper in these sub-indices. The indices are seasonally adjusted, and sometimes the format is unadjusted.

Limitations of the IPI

While GDP estimates show that the manufacturing sector has picked up, the IPI doesn’t. In such cases, the question arises, which of the two should we believe. The selection of items for measuring the production output has remained the same for many years. This will have implications on the index value. IPI growth will have a certain directional bias. The recommendation has always been to make it more dynamic. All they are saying is to revise it more frequently. But the officials have been only pushing the dates forward.

Another limitation is in the selection of the base year. The 2011-2012 base year series shows faster growth than the previous one, 2004-2005 base year. Therefore, it is suggested to use the old methodology alongside the new method.

Analyzing the IPI 

The IPI data is particularly useful for money managers and investors who are a part of the business. At the same time, the composite index is an important macroeconomic indicator for economists who analyze the impact of the numbers on the economy and industry. Fluctuations within the industrial sector account for variation in the overall economic growth. The monthly metric keep investors informed about the shifts in the production levels.

At the same time, IPI ignores the most popular economic output measure, the Gross Domestic Product (GDP). GDP calculates the price paid by the end-user, so it includes the value-added in the retail sector. This is ignored by IPI. Another observation is that the industrial sector is losing its share in the GDP of a country; for instance, it made up less than 20% of the GDP of the U.S. economy as of 2016.

Along with IPI, capacity utilization is another useful indicator that investors analyze to assess the demand scenario. Low capacity utilization or overcapacity, in other words, signals weak demand. Policymakers read it as a need for fiscal or monetary stimulus in the economy. Investors read it as a sign of coming downtrend for the currency and the stock market. High capacity utilization, on the other hand, acts as a warning signal that the economy is overheating, suggesting the risk of price hikes and asset bubbles. Policymakers react to such threats with interest rate hikes or fiscal austerity. There is also a possibility that this could ultimately result in a recession.

Impact on Currency

Industrial production figures are directly proportional to the value of a currency. When Industrial Production is high, it means economic activity is improving in the country that directly contributes to the GDP. A rate of GDP leads to an appreciation in the currency value. However, an effect on the overall economy is felt when industrial production is increasing each month. An improvement in the production output for one month has no impact on the currency; the average value of at least three months makes a difference. The IPI is an early indication of growth in the manufacturing sector, which is why it is closely watched by investors and traders.

Sources of information on Industrial Production Index

The Federal Reserve Board publishes the industrial production index (IPI) every month, which is released approximately in the 2nd week of the month. The revisions in the method of calculation, if any, are released at the end of every March. As it is an important indicator of growth in the manufacturing sector, most open-source economic websites keep track of their respective countries’ data.

GBP (Sterling) – https://tradingeconomics.com/united-kingdom/industrial-production

AUD – https://tradingeconomics.com/australia/industrial-production

USD – https://tradingeconomics.com/united-states/industrial-production

CAD – https://tradingeconomics.com/canada/industrial-production

EUR – https://tradingeconomics.com/european-union/industrial-production

JPY – https://tradingeconomics.com/japan/industrial-production

The Industrial Production Index (IPI) is an important economic indicator published by the Federal Reserve Board (FRB) of the United States that measures manufacturing, mining, and utilities’ real production output. The indices are computed mainly as fisher indices with more weightage on the annual estimates of value-added. The fisher methodology only preserves the growth information, which is why the value of the base year, i.e., 2012, is randomly set to 100. This index, along with other industrial output indexes and construction, accounts for the bulk of the total output variation throughout the business cycle.

Impact of the ‘Industrial Production Index’ news release on the Forex market

In the previous part of the article, we understood the significance of Industrial production fundamental indicators in an economy. Now let’s discuss the impact of the Industrial Production Index news announcement on the value of a currency and witness the change in volatility due to the news release. As discussed previously, Industrial Production measures the change in the total inflation-adjusted value of output produced by manufacturers, mines, and utilities.

For instance, Industrial Production measures the output of businesses in the industrial sector of the United States economy, where the manufacturing sector accounts for 78 percent of total production. Some of the biggest segments of this sector are Chemicals, food, drinks and tobacco, machinery, computer and electronics, motor vehicles, and others.

Now let’s analyze the Industrial Production data of the United States released in June. As we can see in the below image, Industrial Production in the United States increased to 1.4% percent in May, which was much higher than the previous month. The Industrial Production numbers in April and May are largely influenced by COVID-19. Let us find out the reaction of the market to this data.

EUR/USD | Before the announcement

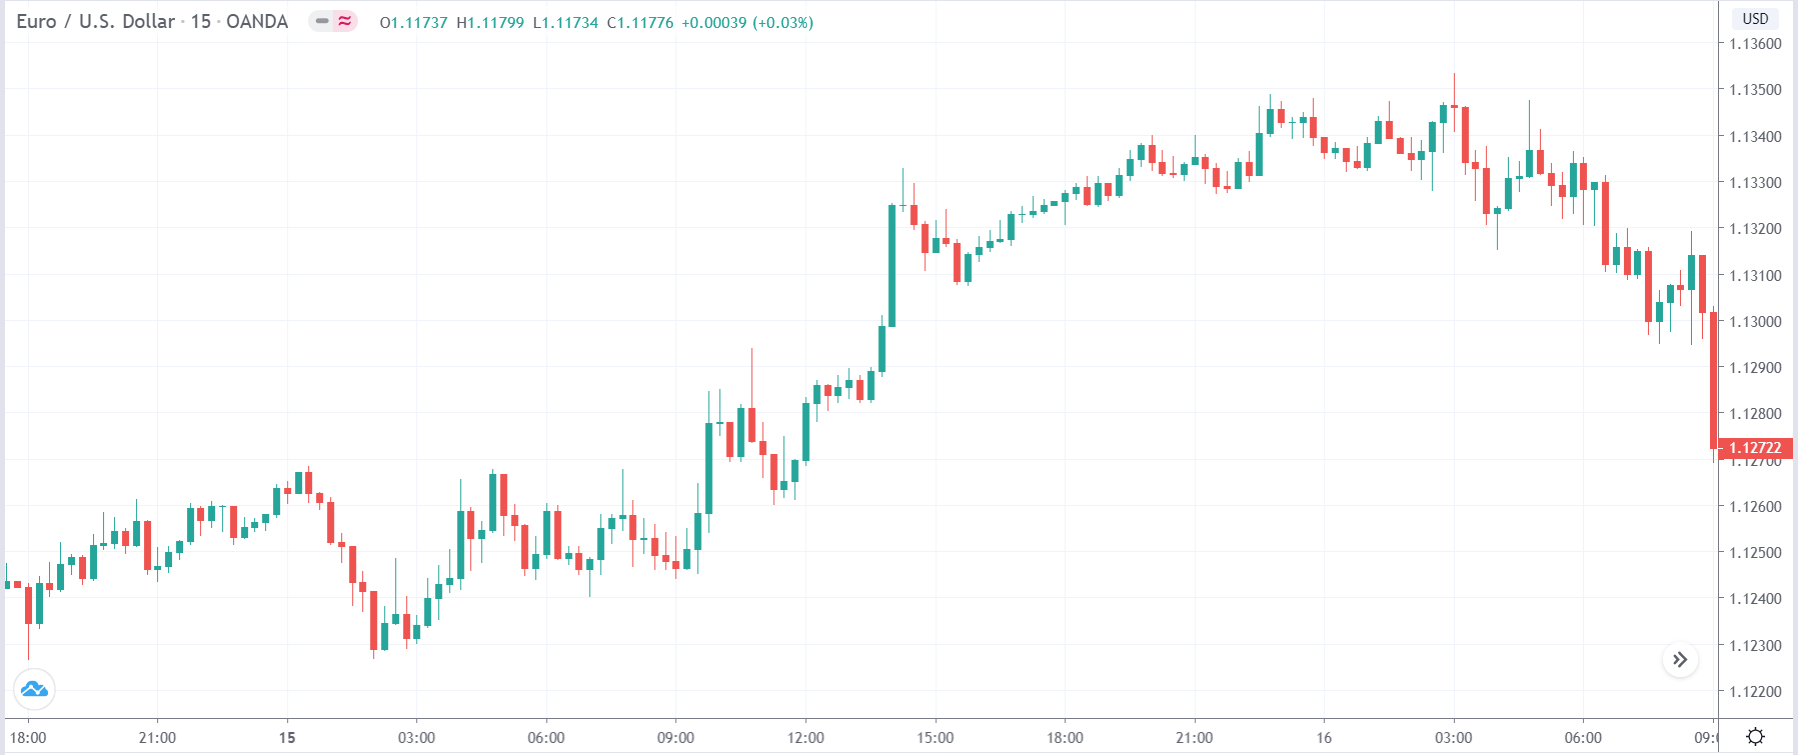
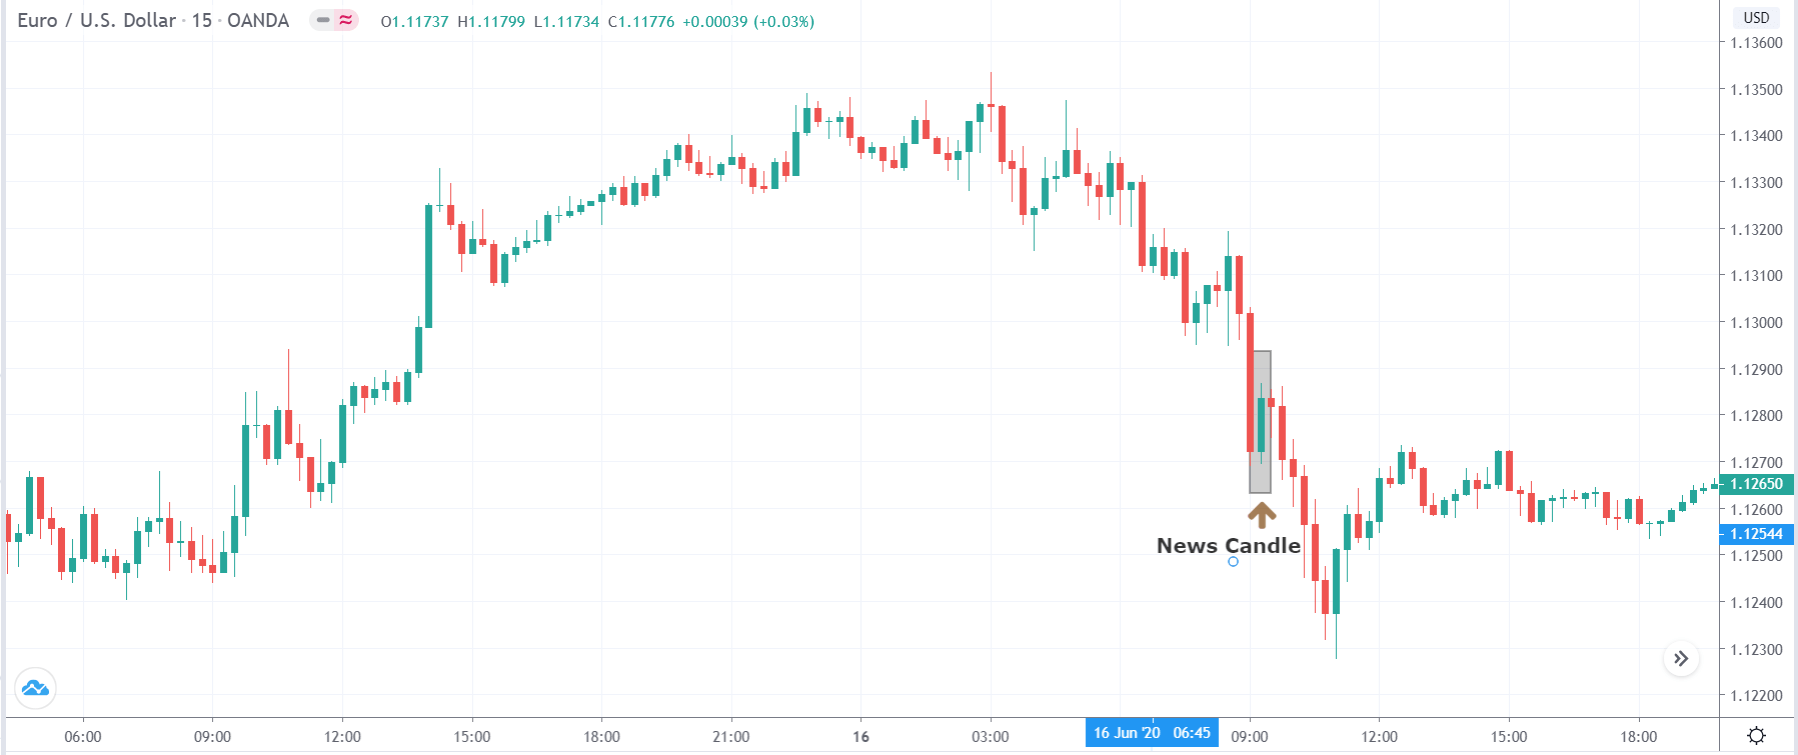
Let us start with the EUR/USD currency pair witness the change in volatility due to the news announcement. The above image shows the state of the chart before the news announcement, where we see that the market was in an uptrend and recently has laid out signs of reversal.

EUR/USD | After the announcement

After the news announcement, the price moves higher, and volatility slightly increases to the upside. However, the price does not go much higher, and the major trend to the downside continues. Thus, it would be right to say that the news announcement had a positive impact on the U.S. dollar.

USD/JPY | Before the announcement

USD/JPY | After the announcement

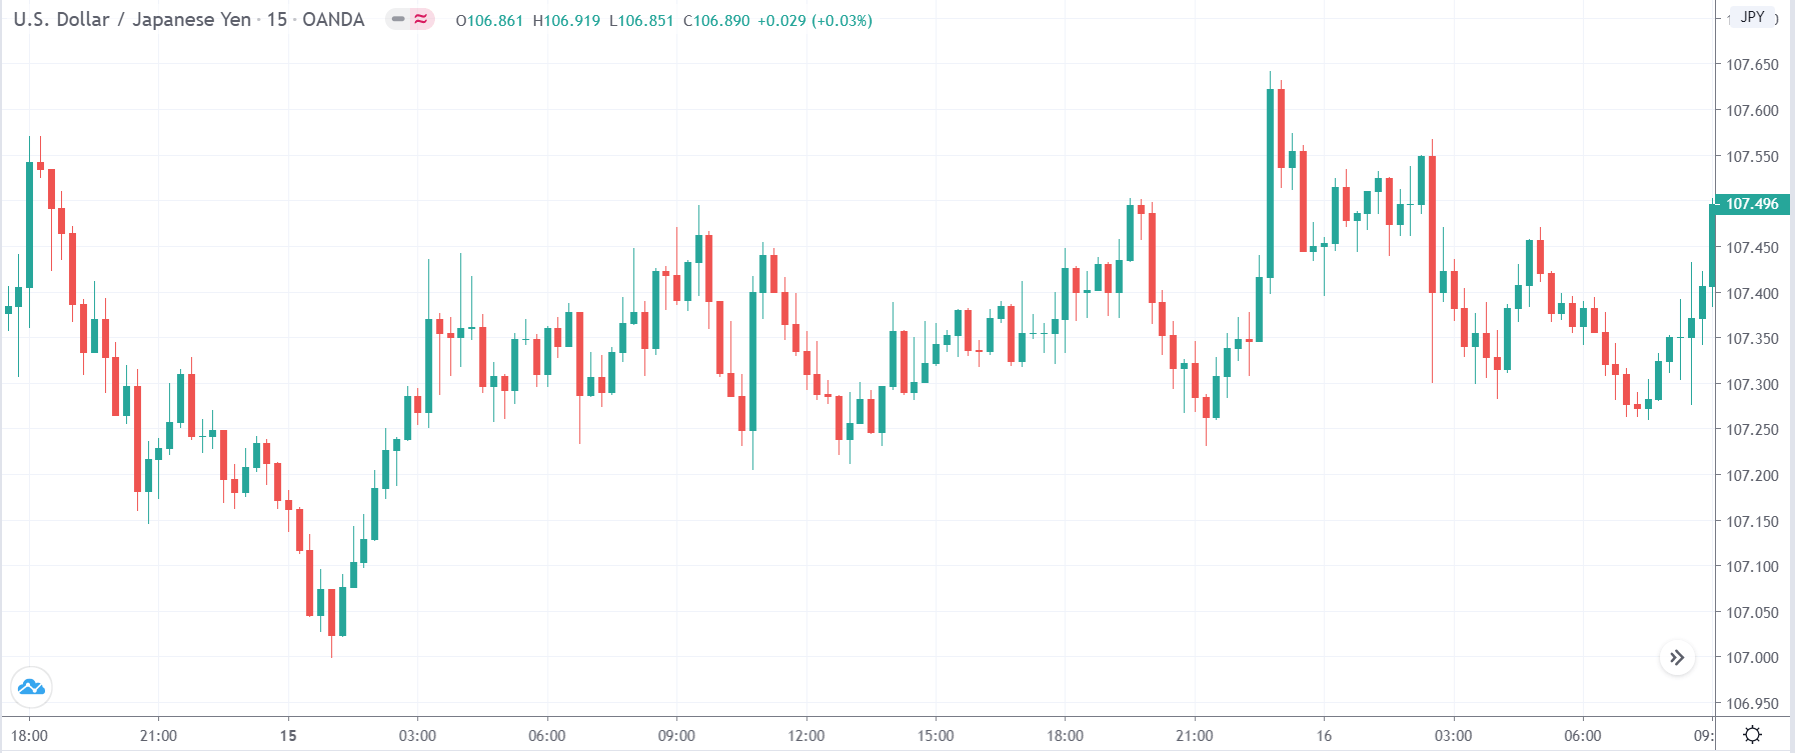
The above images represent the USD/JPY currency pair, where we see that the market is moving within a ‘range’ before the news announcement. Just when the Industrial production numbers are to be released, the price is at the top of the ‘range,’ and volatility is high. Depending on the impact of the news release, we take a suitable position in the currency pair.

After the news announcement, the market moves lower by a couple of candles, as seen in the above image, and gets retraced by strong buyers who take the price above the ‘news candle.’ But since the price is again at resistance, it eventually moves lower and reaches the support. By this price action, we can say that the currency pair becomes highly volatile after the news announcement.

NZD/USD | Before the news announcement

NZD/USD | After the news announcement

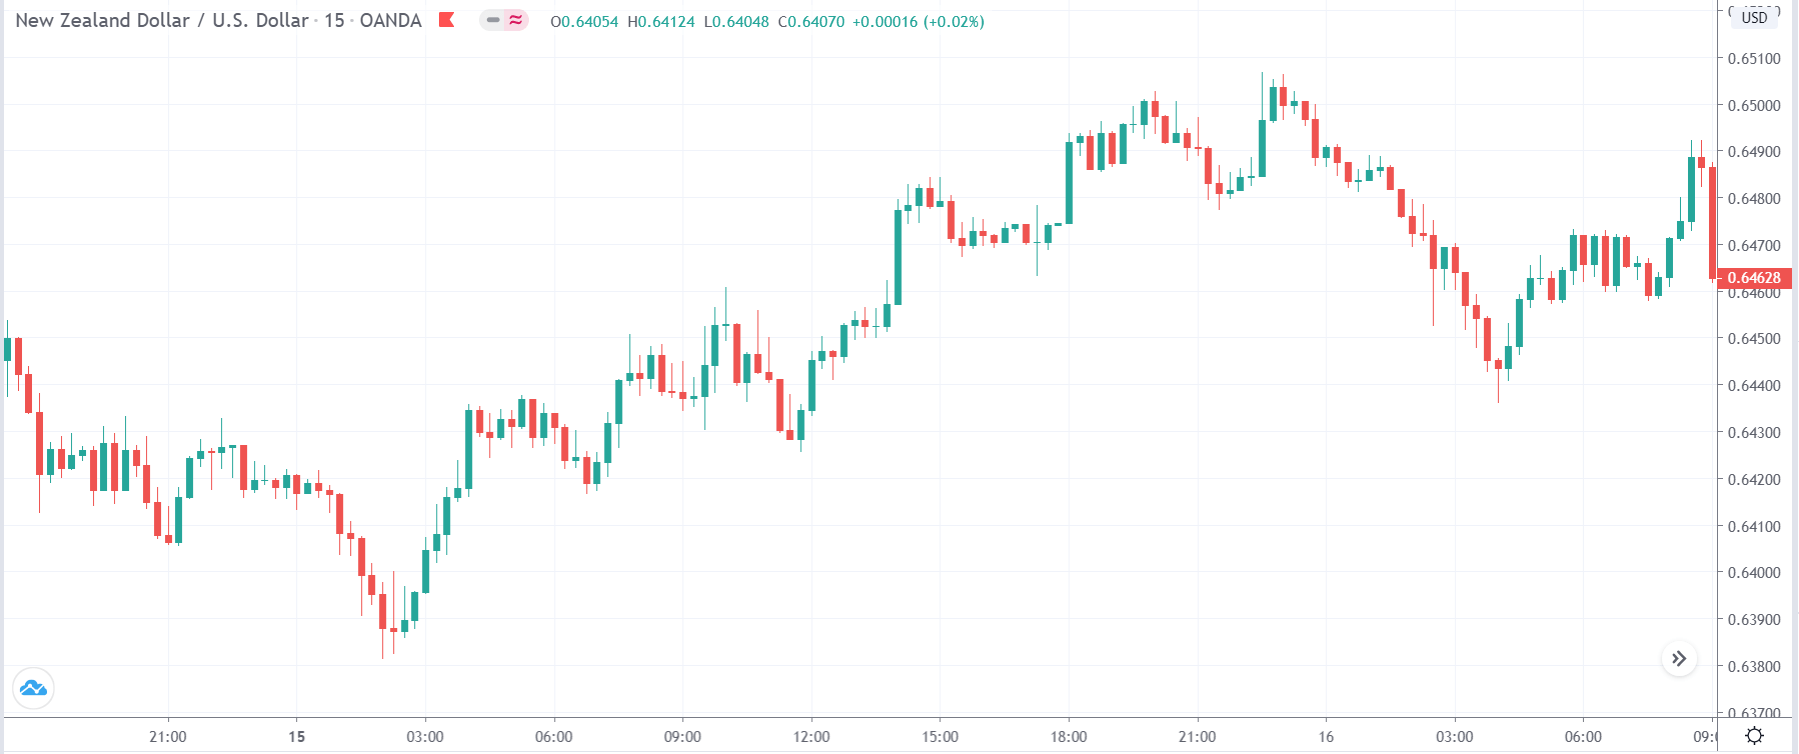
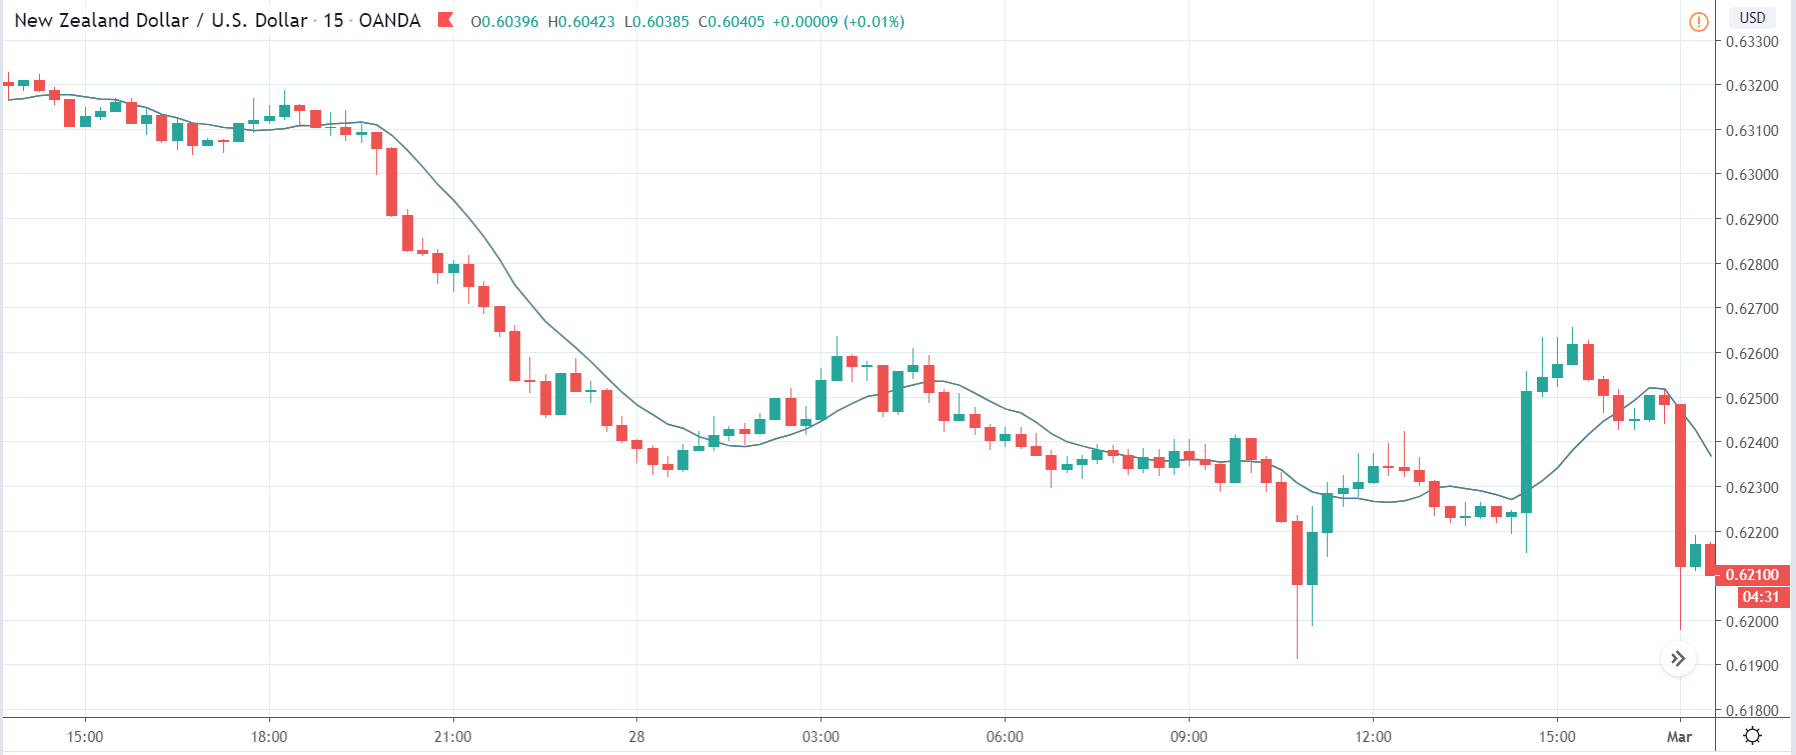
The above price charts belong to NZD/USD currency pair, where we see that before the news announcement, the price was moving higher, and now it has displayed a strong reversal pattern in the market, indicating a reversal to the downside. If the news release does not change the underlying price action pattern, one can take a risk-free ‘short’ position in the currency pair. This is how technical analysis is used in conjunction with fundamental analysis.

After the news announcement, the price moves higher by a little, and ultimately the reversal pattern dominates the market, and price makes a ‘lower low.’ Therefore, the slight bullishness that was witnessed due to the news announcement was of significance, and the market crashed.

We hope you got the gist on what the ‘Industrial Production Index’ is and its impact on the Forex price charts after its news release. In case of any questions, let us know in the comments section below. Cheers!

Categories
Forex Market Analysis

Daily F.X. Analysis, June 23 – Top Trade Setups In Forex – PMI Figures in Highlights! 

On the news front, we need to keep an eye on Manufacturing and Services PMI figures, which are expected to drive movement in the EUR/USD and EUR/CHF pairs. Besides, the U.S. Flash Manufacturing PMI will be in focus for the precious metal gold.

Economic Events to Watch Today 


EUR/USD – Daily Analysis

The EUR/USD prices were closed at 1.12612 after placing a high of 1.12697 and a low of 1.11684. Overall the movement of EUR/USD remained bullish throughout the day. The EUR/USD pair rose on Monday and broke the bearish streak of the previous four days on the back of U.S. dollar broad-based weakness.

The U.S. 10-year Treasury yield fell to 0.676%, its lowest since June 15, this exerted a negative impact on the U.S. dollar and rose EUR/USD pair on Monday. The Wall Street Journal’s main indexes, Dow Jones rose by 0.45%, and Nasdaq rose by 0.80% on increased risk appetite, which eventually weakened the greenback.

The safe-haven demand rose after an increased number of reported infection cases throughout the world, failed to hit EUR/USD pair. The safe-haven rallies were too short-lived that it failed to raise the U.S. dollar; hence, the EUR/USD pair followed its direction.

The EUR/USD gained traction on Monday on the back of E.U. coronavirus measures because Eurozone has been perceived as a region that handled the coronavirus pandemic relatively well than the U.K. and the U.S. as the methods to control the economy from falling by the U.K. and the U.S. have been criticized. Despite the delayed decision on the distribution of the latest fiscal policy of the Eurozone, the pair EUR/USD managed to find its demand based on the fact that the policy will be agreed on by member states eventually.

On the data front, from Eurozone, the Consumer Confidence over the Eurozone economy remained flat with the expectations at -15 for June. From America, the Existing Home Sales in May dropped to 3.91M from the expected 4.15M and weighed on the U.S. dollar. The weak U.S. dollar against the Euro also helped the pair EUR/USD to post gains. The dollar was stronger last week, but due to concerns over the impact of coronavirus over the U.S. economy, the U.S. dollar struggled to hold its ground.

The optimism over the Eurozone handling of the coronavirus pandemic kept the pair EUR/USD pair higher. This also means that if Eurozone outlook became gloomy, then the pair EUR/USD could lose its traction.

On Tuesday, the PMI projections from Eurozone will be released, giving a better idea to investors how well the Eurozone economy was performing in the given pandemic circumstances. If data came disappointing, then the pair EUR/USD would suffer on the back of the Eurozone’s weak outlook, which would eventually raise the appeal for the U.S. dollar as well.

Daily Support and Resistance

  • R3 1.1224
  • R2 1.1211
  • R1 1.1193

Pivot Point 1.1181

  • S1 1.1163
  • S2 1.1151
  • S3 1.1133

EUR/USD– Trading Tip

The EUR/USD is trading in a sideways range of 1.1278 – 1.1250 level. On the higher side, a bullish breakout of 1.1278 can lead EUR/USD prices towards 1.1300 and 1.1325 level. While the bearish breakout of 1.12500 can lead EUR/USD prices towards 1.1230 and 1.1205. Besides, the leading indicators are mixed; for example, the RSI is suggesting a selling bias, while the MACD is indicating a bullish bias. Let us look for buying trades over the 1.1245 level today. 


GBP/USD – Daily Analysis

The GBP/USD closed at 1.24699 after placing a high of 1.24768 and a low of 1.23346. Overall the movement of GBP/USD pair remained bullish throughout the day. After posting losses for four consecutive days, GBP/USD pair rose on Monday and recovered all of its previous day’s losses amid U.S. dollar weakness and Brexit hopes.

The latest meeting of PM Boris Johnson with French PM Emmanuel Macron and E.C. President Ursula von der Leyen last week gave some hope to Brexit when the E.U. agreed that the U.K. would not extend the transition period. Both sides reported that the UK-EU trade deal was possible as they pledged to prioritize the Brexit-trade deal.

The optimism after that meeting concerning Brexit has eased the selling pressure on the British Pound. Furthermore, the U.K. government has planned to ease the restrictions concerning COVID-19 included social distancing; it will allow the restaurants and puns to reopen and increase their capacities.

This report also helped the British pound gain traction as reopening restaurants will help the economy get back on track. On the data front, at 15:00 GMT, the CBI Industrial Order Expectations for June came in as -58 against the expected -50 and weighed on British Pound, which eventually exerted pressure on GBP/USD.

On the other hand, at 19:00 GMT, the Existing Home Sales in May were reported as 3.91M against the forecasted 4.15M and weighed on the U.S. dollar, which gave a push to GBP/USD prices on Monday. U.S. dollar opened this week with a softer tone due to decreased hopes of quick U.S. economic recovery after the renewed cases of coronavirus. The market has shifted its viewpoint from the fears of the second wave of coronavirus to the concerns about economic recovery, and this made the U.S. dollar weaker on Monday.

Meanwhile, Japan gave the U.K. just six weeks to strike a post-Brexit deal, if accomplished, it would be one of the fastest trade negotiations in history, along with Britain’s first trade deal in more than 40 years.  

Daily Support and Resistance

  • R3 1.2378
  • R2 1.2369
  • R1 1.2357

Pivot Point 1.2348

  • S1 1.2337
  • S2 1.2327
  • S3 1.2316

GBP/USD– Trading Tip

The GBP/USD is trading bullish at a level of 1.2479, holding right above 50 periods of EMA, which is likely to extend support at a level of 1.2445. On the downside, the GBP/USD may find support around the value of around 1.2440, and the continuation of a selling trade can lead Sterling prices to be further lower until 1.2378 level. The MACD and RSI are holding around in a buying zone right now, and the recent formation of a bullish engulfing candle can lead to GBP/USD prices further higher until 1.2511 level.


USD/JPY – Daily Analysis

The USD/JPY was closed at 106.899 after placing a high of 107.009 and a low of 106.728. Overall the movement of USD/JPY remained bullish throughout the day. After falling for three consecutive days, USD/JPY pair surged on Monday and posted gains on the back of decreased U.S. dollar strength against Japanese Yen.

The safe-haven currency Japanese Yen was stable due to the rising fears of coronavirus second wave and renewed restrictions in some countries to prevent the virus from spread again. World Health Organization said that 183,000 new cases of coronavirus were reported on Sunday, which indicated the renewed spread of the virus throughout the world. The organization said that the virus was deadly, and there were no signs of virus losing its potency.

This statement gave a surge to safe-haven demand amid rising fears of the second wave of coronavirus, and hence, Japanese Yen gained traction and weighed on USD/JPY pair, and the pair lost some of its daily gains. A large number of increased cases were reported by North & South America, which exerted negative pressure over the outlook of the U.S. economy, and hence, the U.S. dollar remained consolidated on the day. The Federal Reserve officials had already warned that if a pandemic was not brought under control, then the jobless rate could rise again.

However, despite the U.S. dollar weakness and Japanese Yen’s strength, USD/JPY barely moved and remained consolidated mostly in the day. The U.S. Dollar Index, which measures the value of the U.S. Dollar against the basket of six currencies, fell by 0.1% on the day.

On the other hand, E.U. leaders were aiming to reach an agreement before summer break on the attest stimulus package distribution, which they were failed to reach in the last virtual meeting. This time hopefully, they will conduct a physical meeting in July or early August. 

The latest stimulus package from E.U. commission in aid to fight against coronavirus pandemic crisis to E.U. members has already given strength to Euro, the rival of the U.S. dollar. It has also weighed on the U.S. dollar a bit, which is why the agreeability of E.U. member states on this package holds importance over the U.S. dollar movement.

However, given the fundamentals & news, everything was against the U.S. dollar, and despite this, USD/JPY pair moved in an upward direction, which indicated that investors took profit from their positions, which caused a surge in USD/JPY prices.

Moreover, some good news from China that it wanted to comply with phase one deal requirements and showed a willingness to buy more U.S. farm products also helped the U.S. dollar to gain its strength back.

Adding to the optimism and USD/JPY gains was the news that Donald Trump held the sanctions on Chinese officials over Uighurs only to pursue a trade deal. He said that a great deal means that he could not impose further sanctions on China as he wanted the phase one deal to complete.

Daily Support and Resistance    

  • R3 107.13
  • R2 107.05
  • R1 106.94

Pivot Point 106.85

  • S1 106.74
  • S2 106.65
  • S3 106.54

USD/JPY – Trading Tips

The USD/JPY is trading with a bullish bias at 107.220 level, but the overall trading range of 107.620 – 106.630 remains intact. It failed to break above an immediate resistance level of 107.580. This level is working as resistance for USD/JPY, and the 50 periods EMA is also prolonging strong resistance at 107.200 zones while immediate support lingers nearby 106.600. The USDJPY bearish trend can trigger a sell-off unto the next support level of the 106.017 level today. Let’s wait for the USD/JPY to test the 107.650 level before entering a sell in the USD/JPY. 

Good luck! 

Categories
Crypto Market Analysis

Daily Crypto Review, Jun 23 – Bitcoin Logo and Name Trademarked. Defender of Bitcoin or Just Another Scammer?

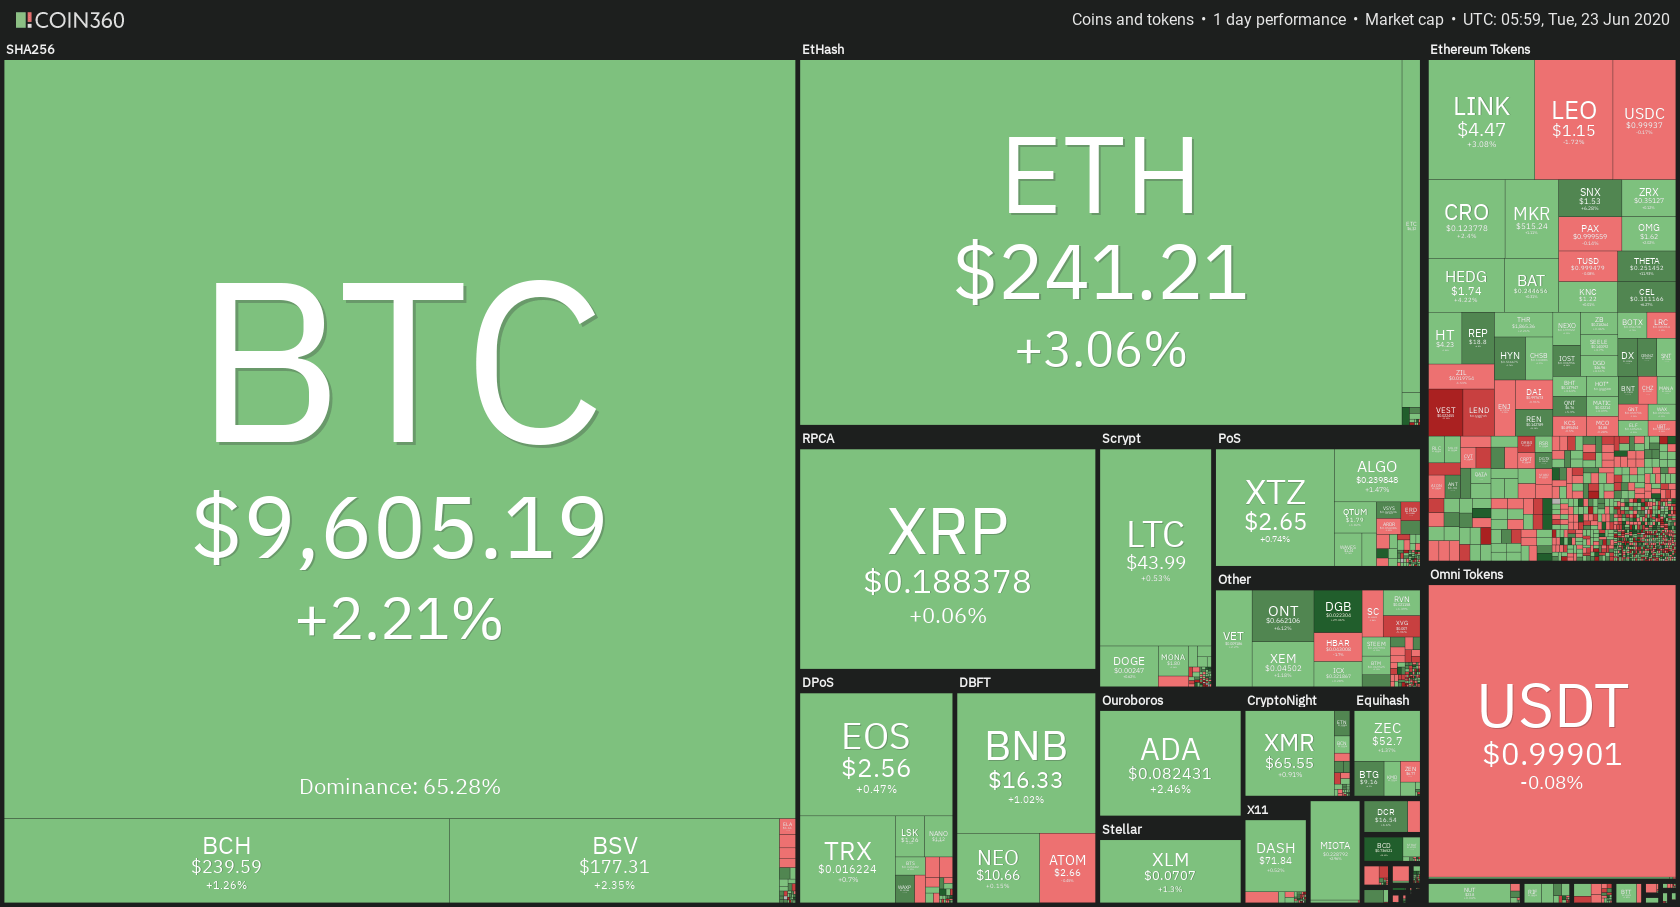
The crypto market has spent the past 24 hours testing (and surpassing) its immediate resistance levels. Bitcoin is currently trading for $9,605, which represents an increase of 2.21% on the day. Meanwhile, Ethereum gained 3.06% on the day, while XRP gained 0.06%.

DigiByte took the position of today’s biggest daily gainer, with gains of 24.92%. Flexacoin lost 15.62% of its daily value, making it the biggest daily loser.

Bitcoin’s dominance level stayed at the same place since our last report, with its value currently at 65.28%. This value represents a 0.05% difference to the upside when compared to yesterday’s value.

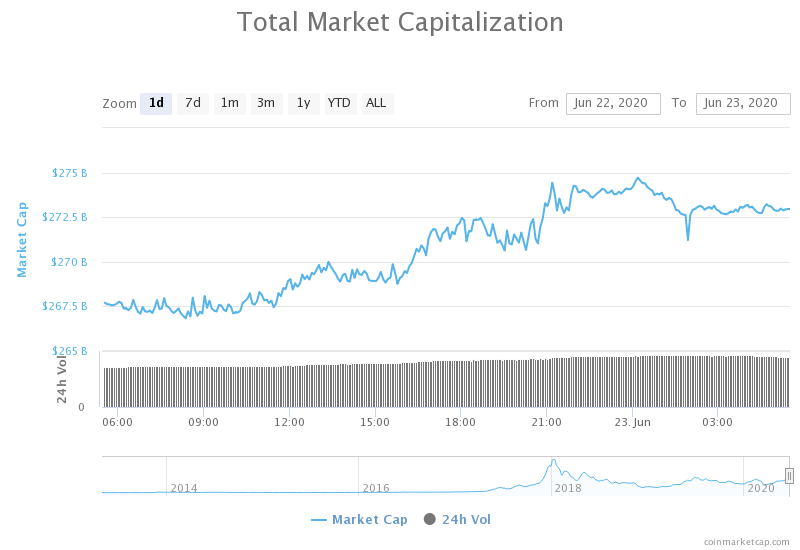
The cryptocurrency market capitalization increased when compared to yesterday, with the market’s current value being $273.19 billion. This value represents an increase of $7 billion when compared to the value it had yesterday.

What happened in the past 24 hours

Bitcoin defender or a scammer? Bitcoin name logo trademarked

The Bitcoin name and logo have been trademarked in Spain by Ignacio Rubio Menéndez, a compliance expert and lawyer. He explained that he now owns the logo and the word ‘bitcoin’ that is registered at the national level. When asked why he bothered with doing this, he explained that he wants to protect Bitcoin, at least in Spain. He claims he will stand up to anyone that will try to abuse the logo or the name of the cryptocurrency he bases his business on.

Whether he will use his (now) right justly or abuse it, only time will tell.

_______________________________________________________________________

Technical analysis

_______________________________________________________________________

Bitcoin

The largest crypto by market capitalization spent the past 24 hours testing its immediate resistance level of $9,580. In fact, there was no actual “testing,” as Bitcoin skyrocketed and went past the resistance level in an instant. The move passed through $9,735 as well, but quickly came back below it. Bitcoin is now trying to find a price to consolidate at, and it will most likely test $9,580 as a support level.


Key levels to the upside          Key levels to the downside

1: $9,735                                 1: $9,580

2: $9,870                                 2: $9,251

3: $10,010                                3: $9,120

Ethereum

Ethereum followed in the footsteps of Bitcoin and used the momentum it created to push its price past the $240 level. On top of that, the price gain it made surpassed Bitcoin by half a percent. The second-largest cryptocurrency by market cap stopped its bullish move at around $247 and then started consolidating slightly below that price. The $240 level will be tested in the near future, so traders can expect a solid and easy trade, in whichever direction ETH goes.


Key levels to the upside          Key levels to the downside

1: $251.4                                 1: $240

2: $260                                    2: $228

3: $225.4

Ripple

Unlike Bitcoin and Ethereum, XRP did not have such a good day. While the price technically did end up in the green when compared to 24 hours ago, the price gain is negligible. The third-largest cryptocurrency by market cap didn’t have enough buying pressure to pass the $0.19 resistance level it fell under a couple of days ago.


XRP’s volume is extremely low, meaning that traders don’t really have many opportunities to trade it.

Key levels to the upside          Key levels to the downside

1: $0.19                                      1: $0.178

2: $0.2                                  

3: $0.205


Categories
Forex Fundamental Analysis

Significance Of ‘Composite PMI’ As A Forex Fundamental Driver

Introduction

Composite Purchasing Manufacturing’s Index (PMI) is one of the major indicators of the country’s economic health. It is mainly concerned with the manufacturing and service sectors. The PMI provides information about the current business conditions from the data gathered from the company’s decision-makers, such as analysts and purchasing managers.

The PMI survey of each country consists of a questionnaire for the manufacturing or service sector, which collects the responses from the panel of senior purchasing executives at over 400 companies. The Composite PMI is basically a number that ranges between 0 to 100. The number above 50 represents an expansion compared to the previous reading. A PMI reading below 50 represents a contraction, and a reading at 50 indicates no change.

Calculation of the PMI

As mentioned in the above paragraph, the PMI is a number from 0 to 100, but we need to understand how one arrives at those numbers. The PMI is calculated using the below formula.

PMI = (P1 * 1) + (P2 * 0.5) + (P3 * 0)

Where:

P1 = percentage of answers stating an improvement

P2 = percentage of answers stating no change

P3 = percentage of answers stating a deterioration

The percentage stating deterioration has a zero multiplier; thus, it is always zero, but the larger the value of P3, the fewer the weight of the first two factors, thus lowering the total PMI value. in the case of P3=100% PMI = 0.

Use of Composite PMI

The PMI data is a critical decision-making tool for money managers that influences their investment across sectors to a great extent. Let us take the case of an automobile manufacturer, where the production decisions are based on the new orders it expects from the customers in future months. This will make them buy dozens of parts and raw materials, such as tires and plastics. The inventory rules also drive the amount of production the manufacturer needs to finish to fill new orders and to keep some inventory at the end of the month.

From the supplier’s point of view, the PMI data matter to him the most as well. The parts supplier to a manufacturing company will estimate the amount of demand it might get from these companies based on the PMI. Due to this, the suppliers charge more for their parts. The new orders data is closely related to the Composite PMI. For instance, if the new orders are growing, the manufacturing company may raise the prices of its products and accept the high cost of the parts. A company also uses the Composite PMI to plan its annual budget, supervise staffing levels, and manage cash flow.

The Economic Reports 

The Economic Reports of Composite PMI and related data are published monthly by the Institute for Supply Management (ISM) that is extremely useful for manufacturers and the investment managers. The ISM monitors changes in production levels from month to month and is at the core of the Manufacturing report. This is one of the earliest indicators of economic activity and that investors and economists get regularly. The institute also releases a Semi-annual report in May and December. When the number is rising, investors anticipate a bullish reaction from the market to the data that is seen in the currency and stock market.

Analyzing the data

The PMI data is very easy to analyze, where we only have to look at the number and compare it with the previous readings. A PMI reading above 50 indicates growth or expansion of the manufacturing sector. A reading of 50 indicates that the number of manufacturers reporting good business is equal to those stating business is not good. Another key number to look for is 43.2. If the PMI index has been above this number for a period of time, it indicates an expansion of the overall economy. Any number under 50 indicates a contraction in the manufacturing sector and that most businesses are not expecting good business in the near future.

Impact on the currency 

The composite PMI is closely watched by traders and investors around the world that greatly influences their investment decision. They mainly if the number is below or above the 50 levels, which shows potential contraction or expansion in the economy. If the number is greater than 50 over the last few quarters, it indicates growth in the economy, which drives the currency higher. If the number remains below the 50 mark, it means the economy has entered into a recession. Investors will not be interested in investing in countries where the economy is in a recession, which leads to a depreciation of the currency.

Sources of information on Composite PMI

Composite PMI is available on the official website of the Institute for Supply Management (ISM), which also provides a comprehensive analysis of the same. The data can also be found on some open-source economic websites and financial magazines.

Links to Composite PMI information sources

GBP (Sterling) – https://tradingeconomics.com/united-kingdom/composite-pmi

AUD – https://tradingeconomics.com/australia/composite-pmi

USD – https://tradingeconomics.com/united-states/composite-pmi

EUR – https://tradingeconomics.com/euro-area/composite-pmi

NZD – https://tradingeconomics.com/new-zealand/composite-pmi

JPY – https://tradingeconomics.com/japan/composite-pmi

The Composite PMI is a monthly survey sent to senior executives at more than 400 companies in 19 primary industries. The industries and companies are selected based on their contribution to the GDP and the sector, respectively. The surveys include questions about business conditions and any changes, whether it be improving, no change, or deteriorating. Hence, traders must keep an eye on this data and watch for its official releases.

Impact of the ‘Composite PMI’ news release on the Forex market 

Investors consider Composite PMI as a leading indicator of the economic health of a country. It is extremely for international investors looking to form an opinion on a country. The PMI is also a leading indicator of the growth in the gross domestic product (GDP). When formulating monetary policy, central banks use PMI surveys, which is reflected in the fixing of interest rates.

When it comes to predicting the GDP growth, a reading above 42 is considered a benchmark for economic expansion. In contrast, a reading below 42 indicates that the economy is heading into a recession. Since it is an important indicator for most of the people related to the economy and financial sector, it is bound to have a major impact on the value of a currency.

In today’s lesson, we will analyze the impact of composite PMI on different currency pairs and identify the change in volatility due to the news announcement. We will be looking at the PMI data in the Eurozone that was released in June (May as the reference month). The below image shows the previous, predicted, and latest PMI reading, where we see a big increase in the number compared to the previous month. Let us find out if the market receives the data positively or negatively.

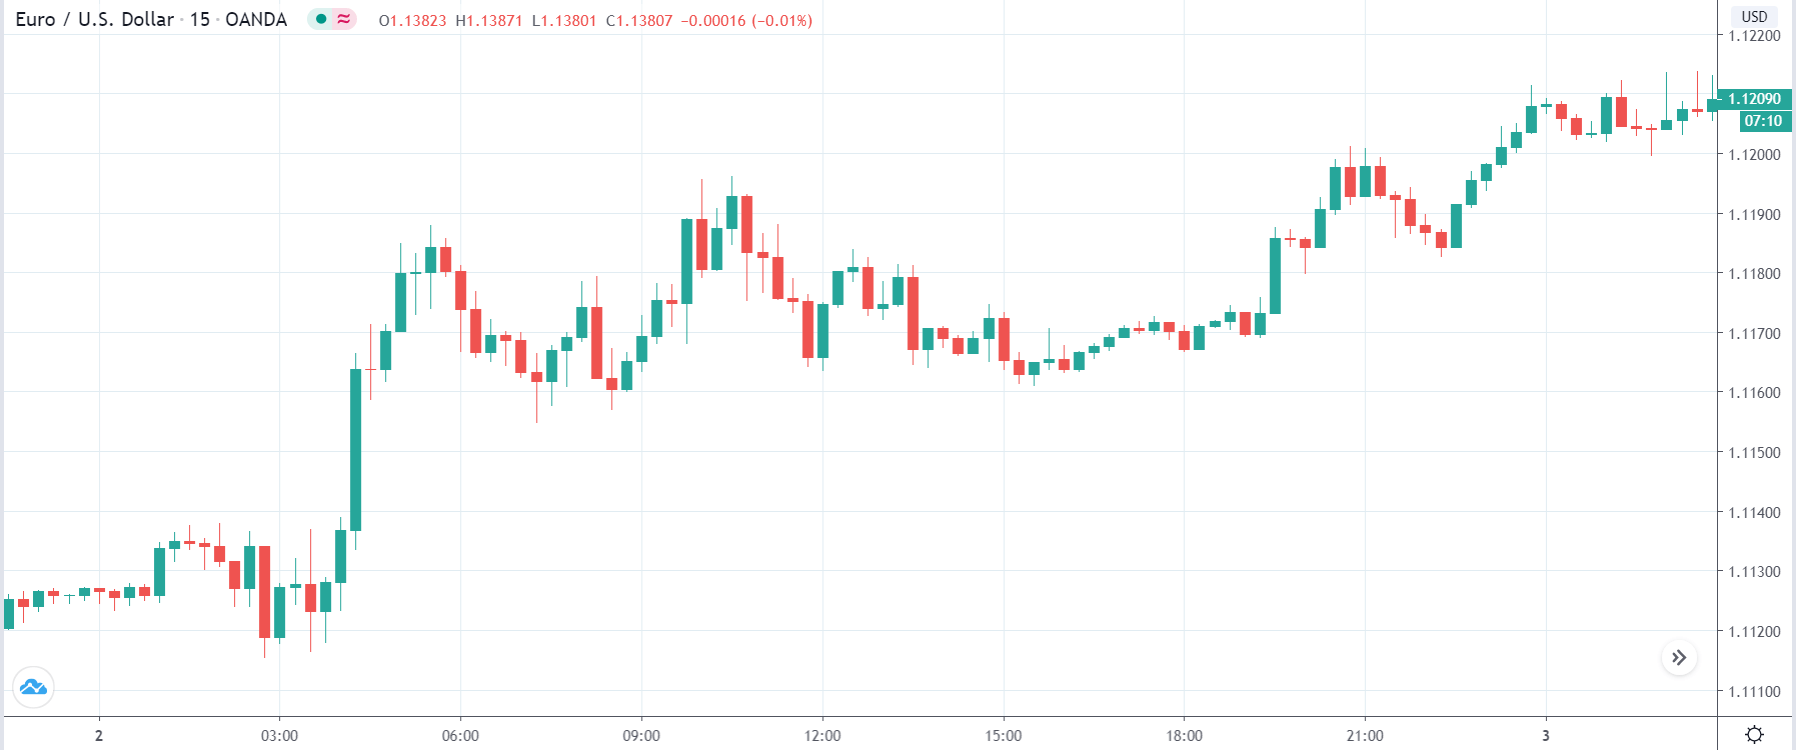
EUR/USD | Before the announcement

Let us start with the EUR/USD currency pair to observe the change in volatility due to the news release. The above image shows the price’s behavior before the news announcement, where we see that the market is a strong uptrend. We will be looking to buy the currency pair after a price retracement to a support or demand level. At this point, we shouldn’t be taking any position in the currency pair.

EUR/USD | After the announcement

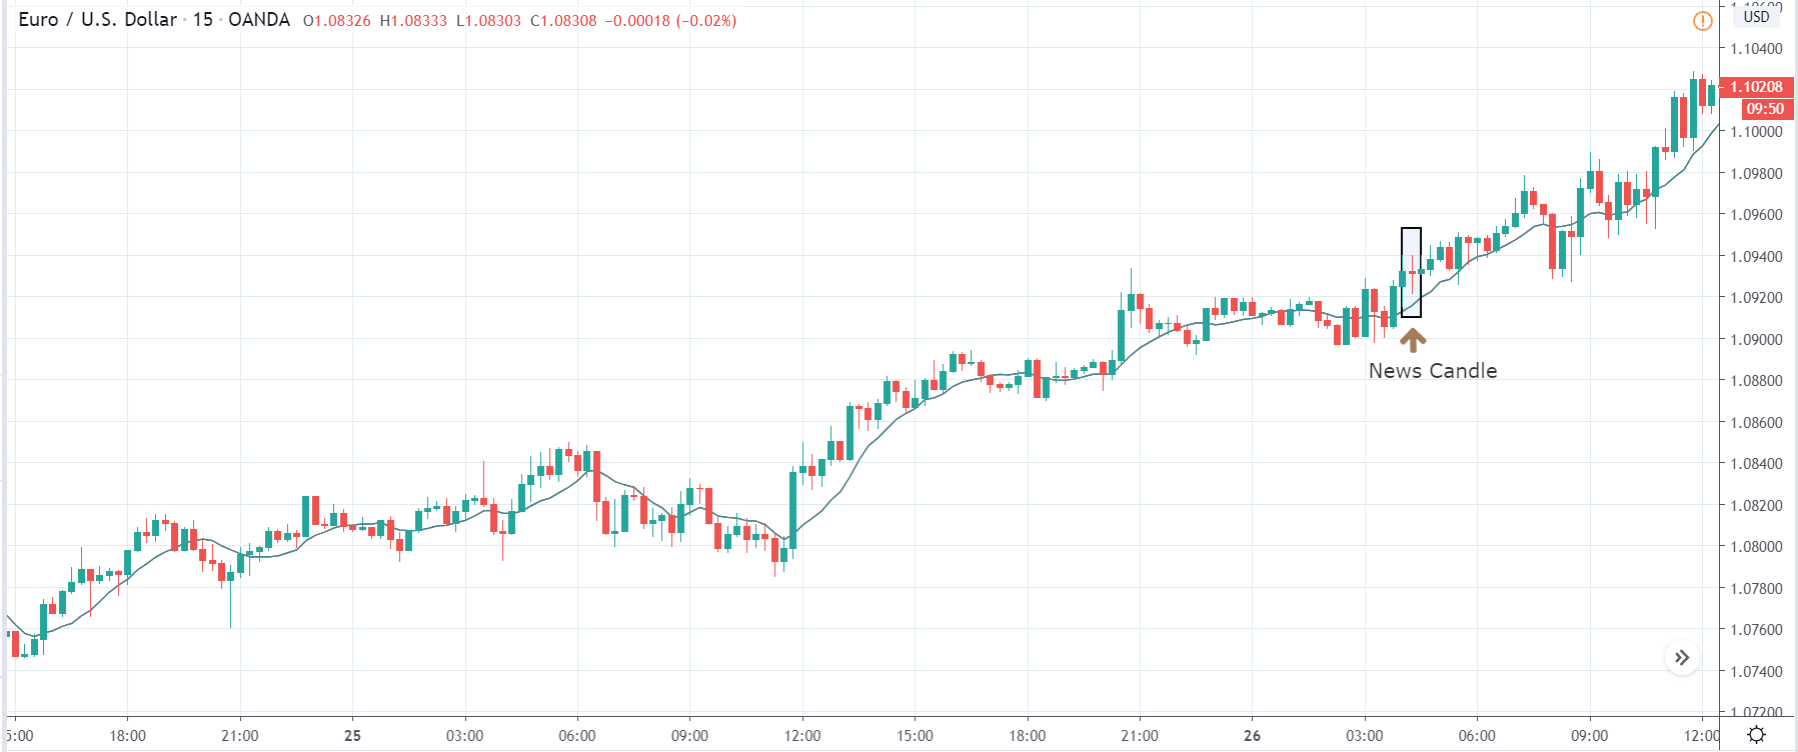
After the news announcement, volatility expands to the upside, and the market moves higher. As the PMI data was extremely positive for the economy, traders bought the currency and took the price higher. The PMI data had a positive impact on the currency pair, and the market makes new ‘high.’ One has to be cautious here by not jumping into the market for a ‘buy’ as it is against risk management rules.

EUR/JPY | Before the announcement

EUR/USD | After the announcement

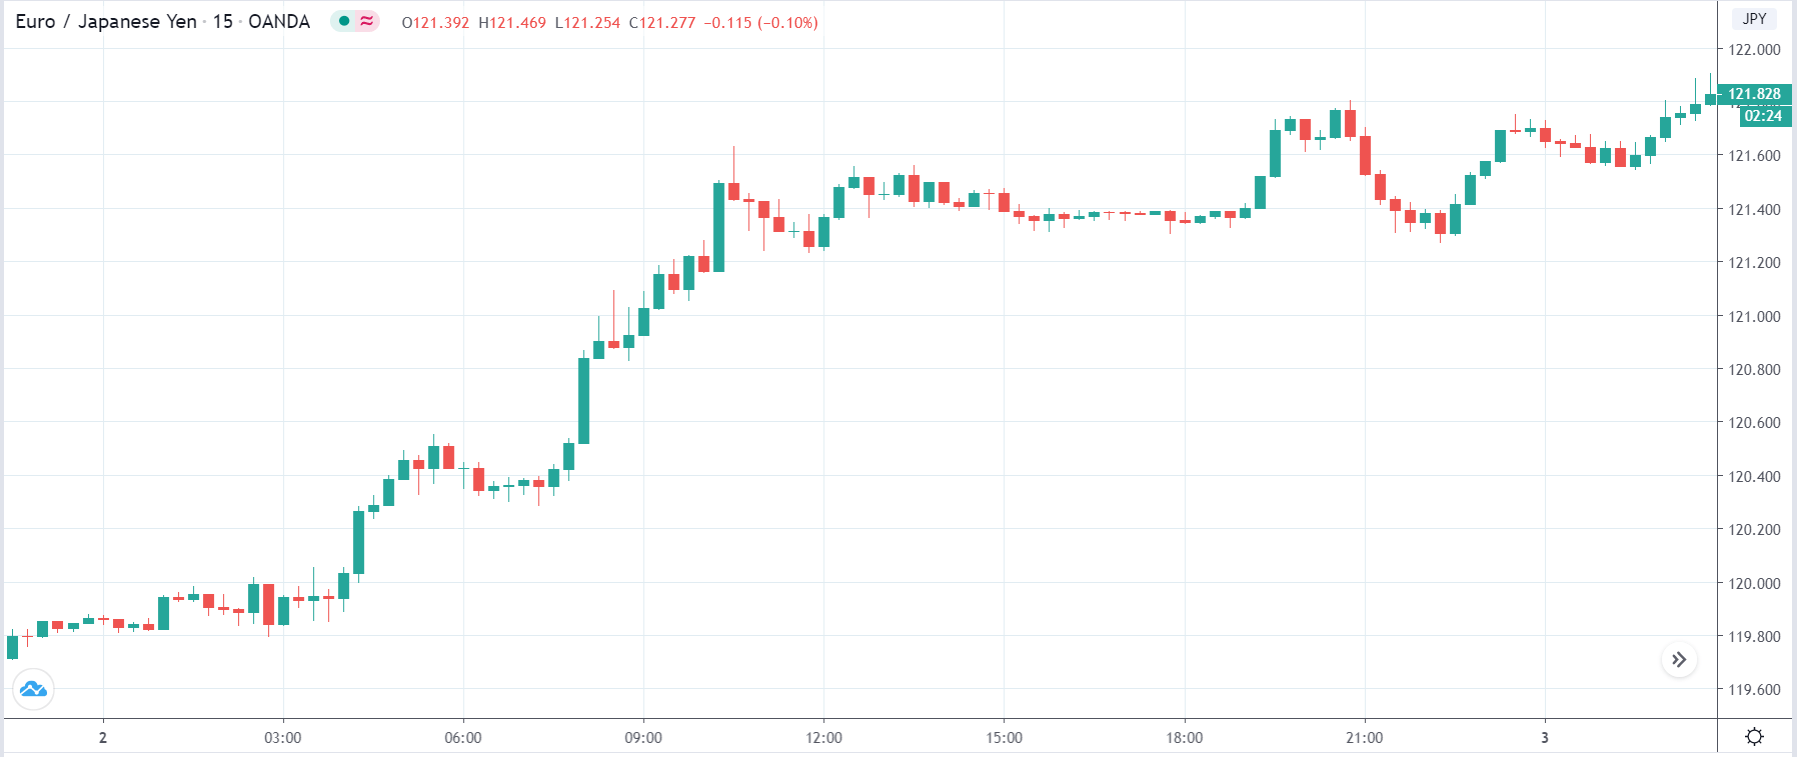
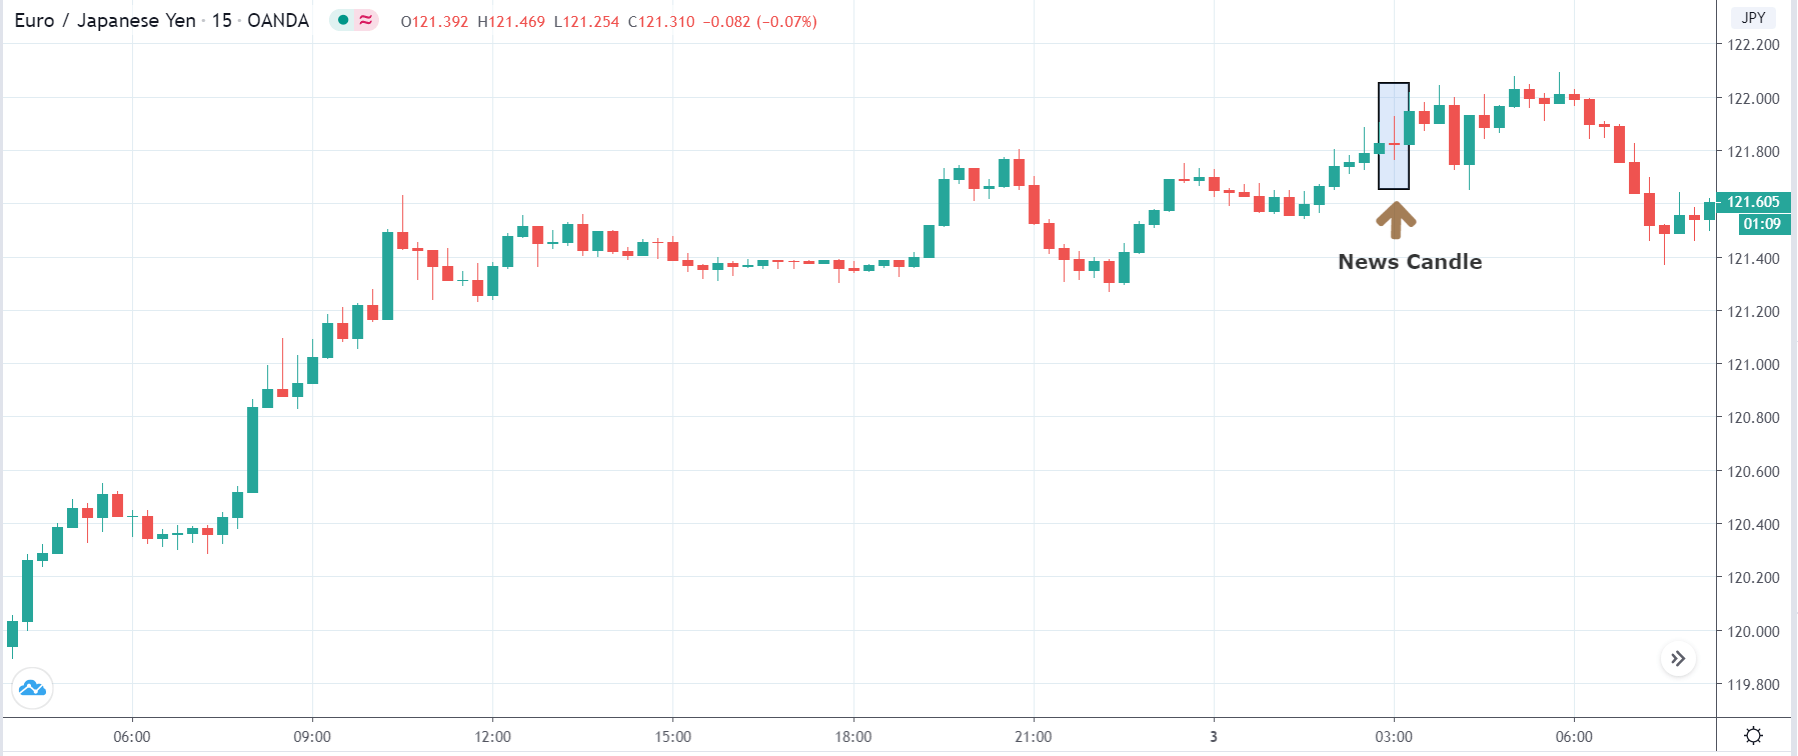
The above images represent the EUR/JPY currency pair, where we see that the price is continuously moving higher with minimum retracements before the news announcement. It means the uptrend is very strong. From a ‘trade’ point of view, a similar approach will be followed here as well as we had in the previous currency pair, where we will be looking to buy the currency pair only a price retracement.

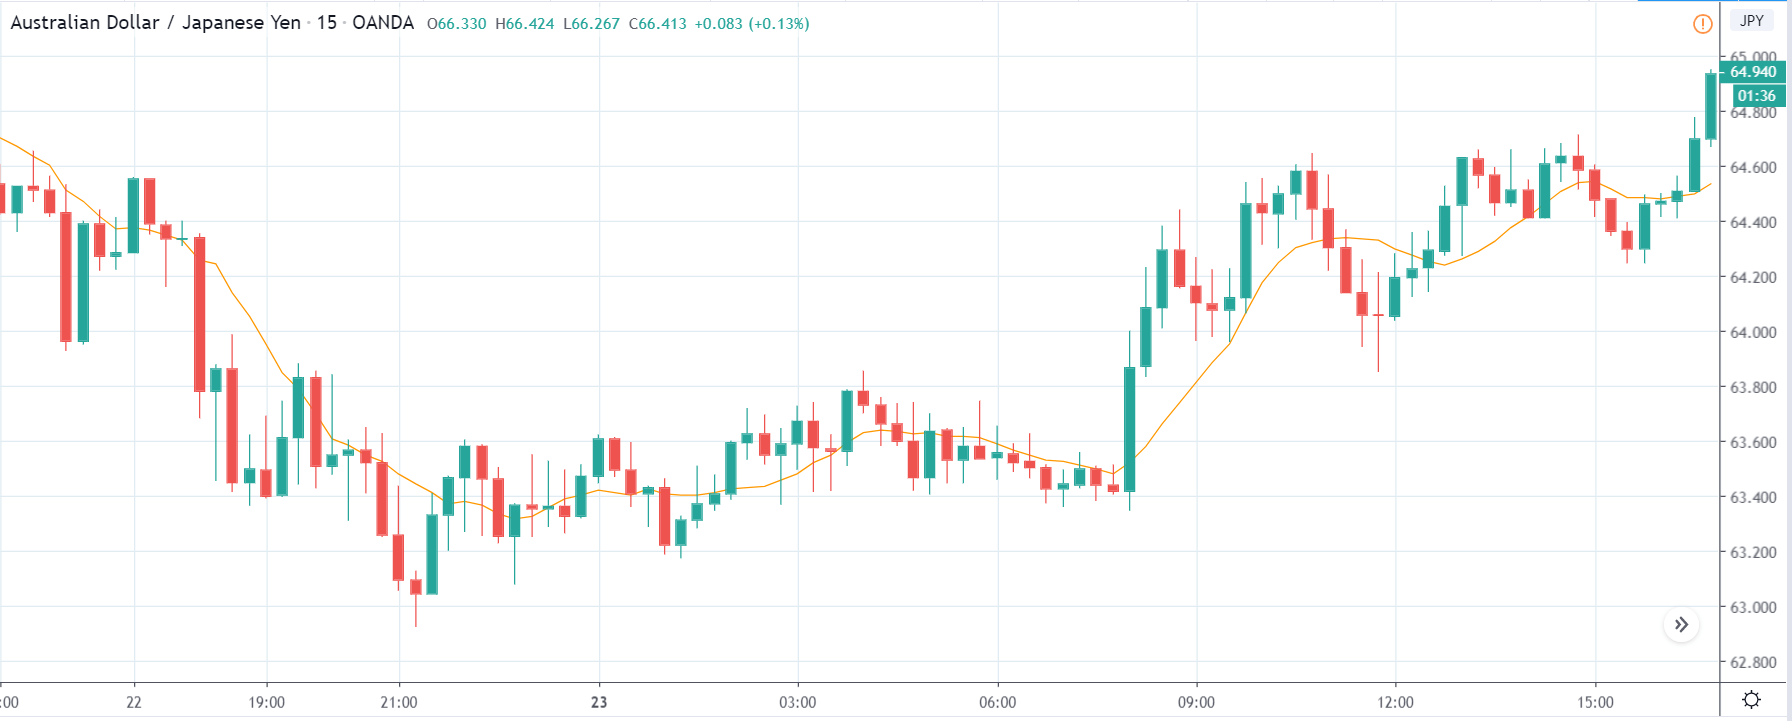
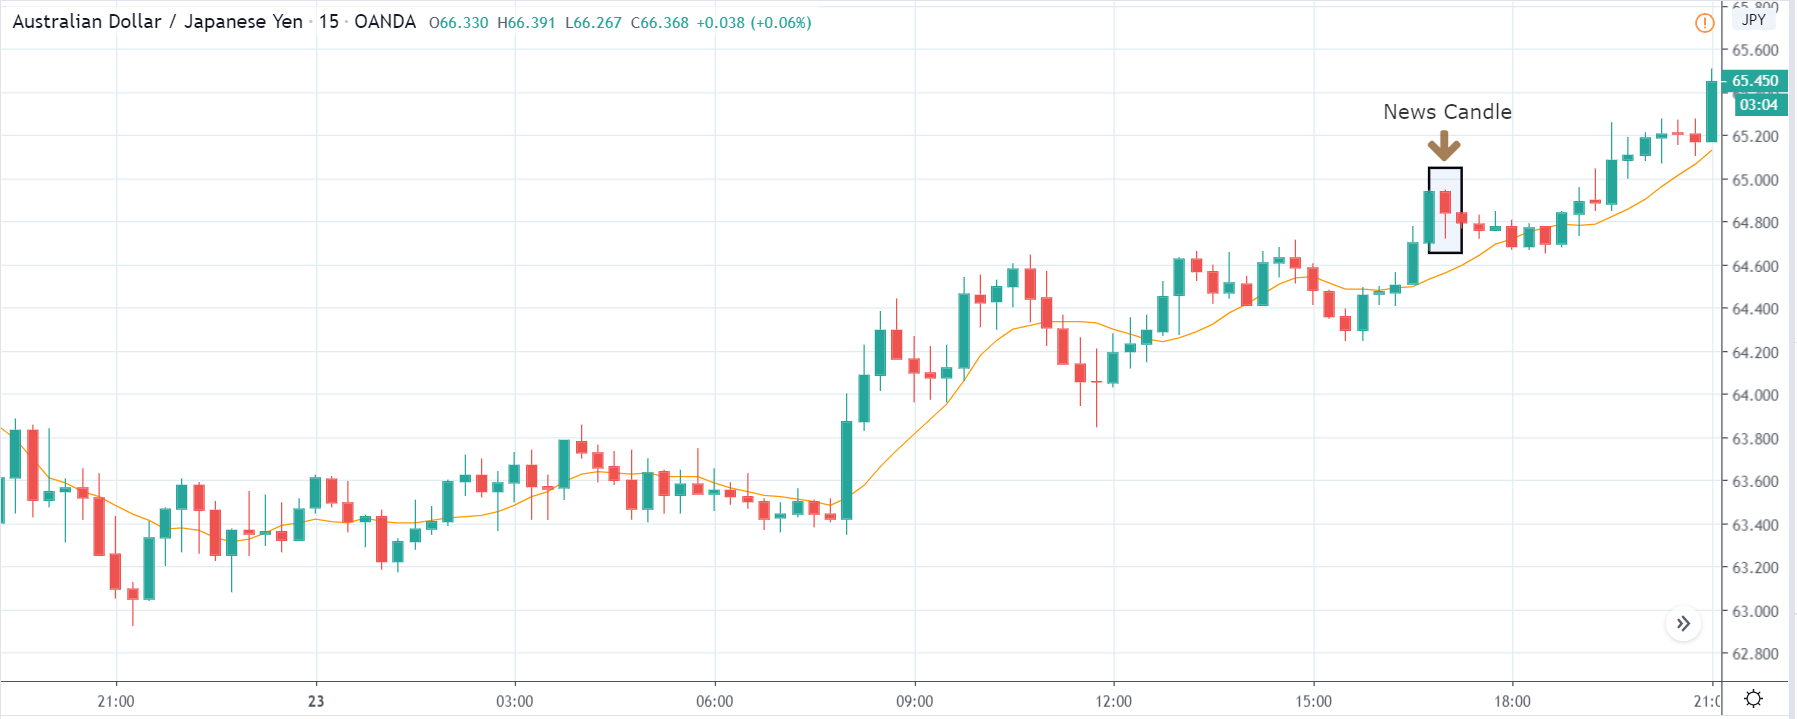
Right after the news is released, the price initially moves higher, but later selling pressure makes the ‘news candle’ to close near the opening. Therefore, we witness volatility in both the directions of the market in this currency pair. We can say that the PMI data did not have a major impact on the currency where the market remains sideways a few minutes after the news release as well.

EUR/AUD | Before the announcement

EUR/AUD | After the announcement

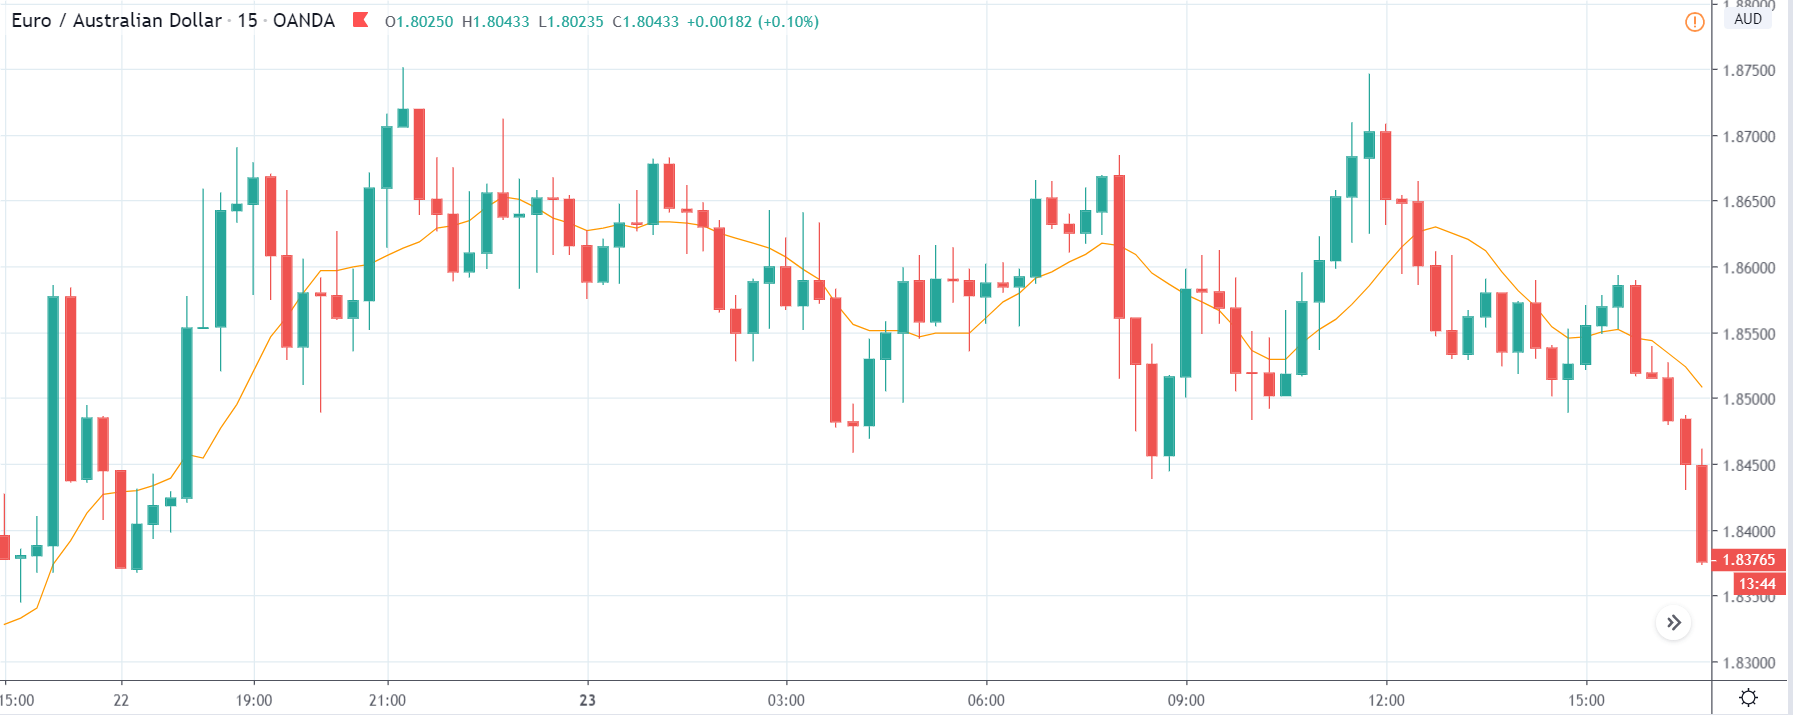
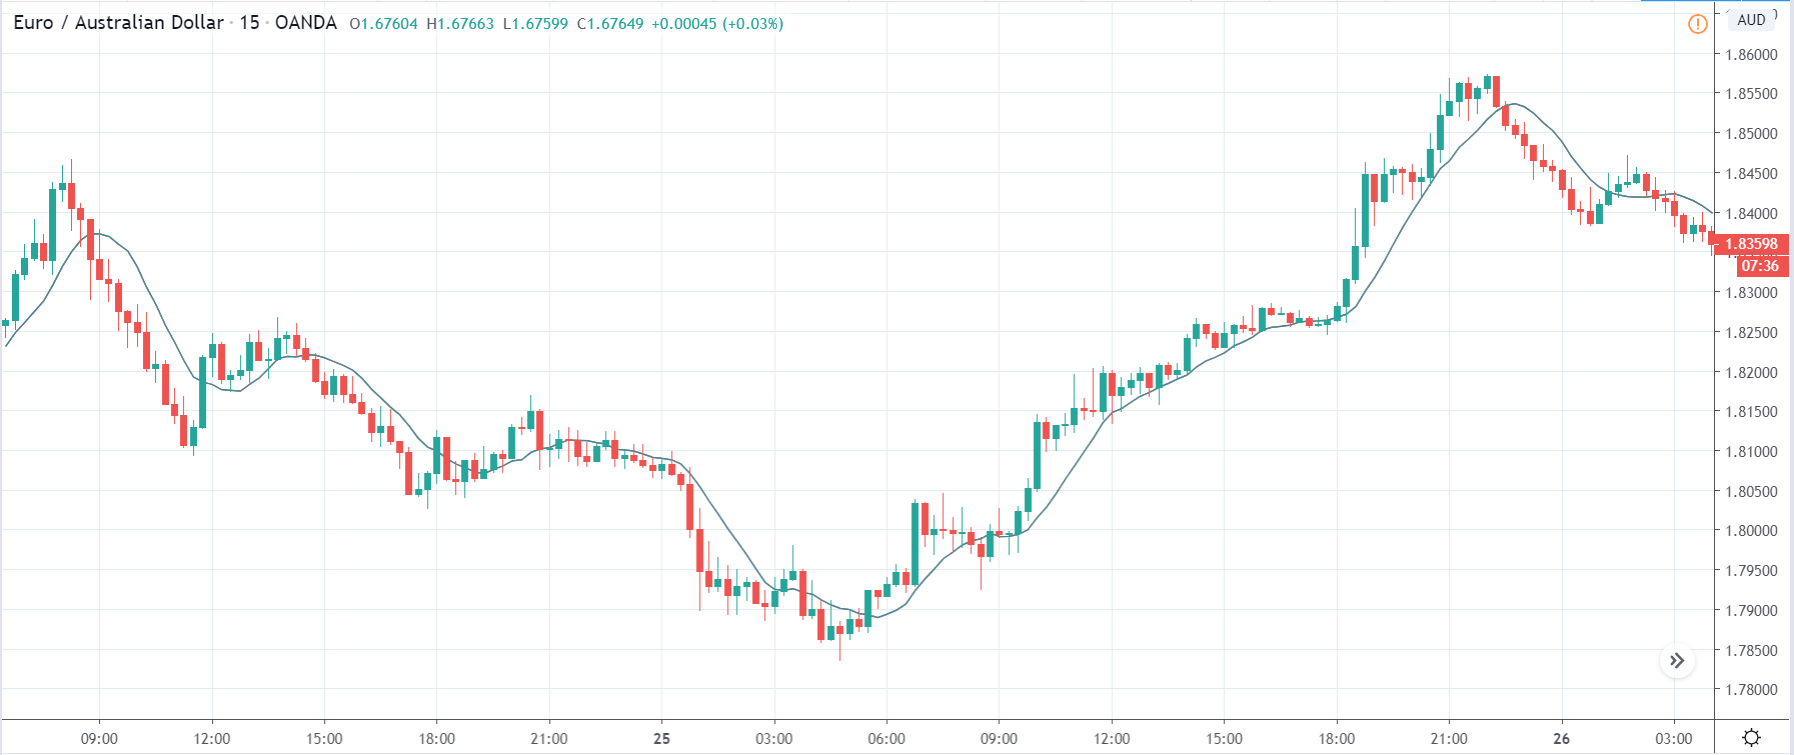
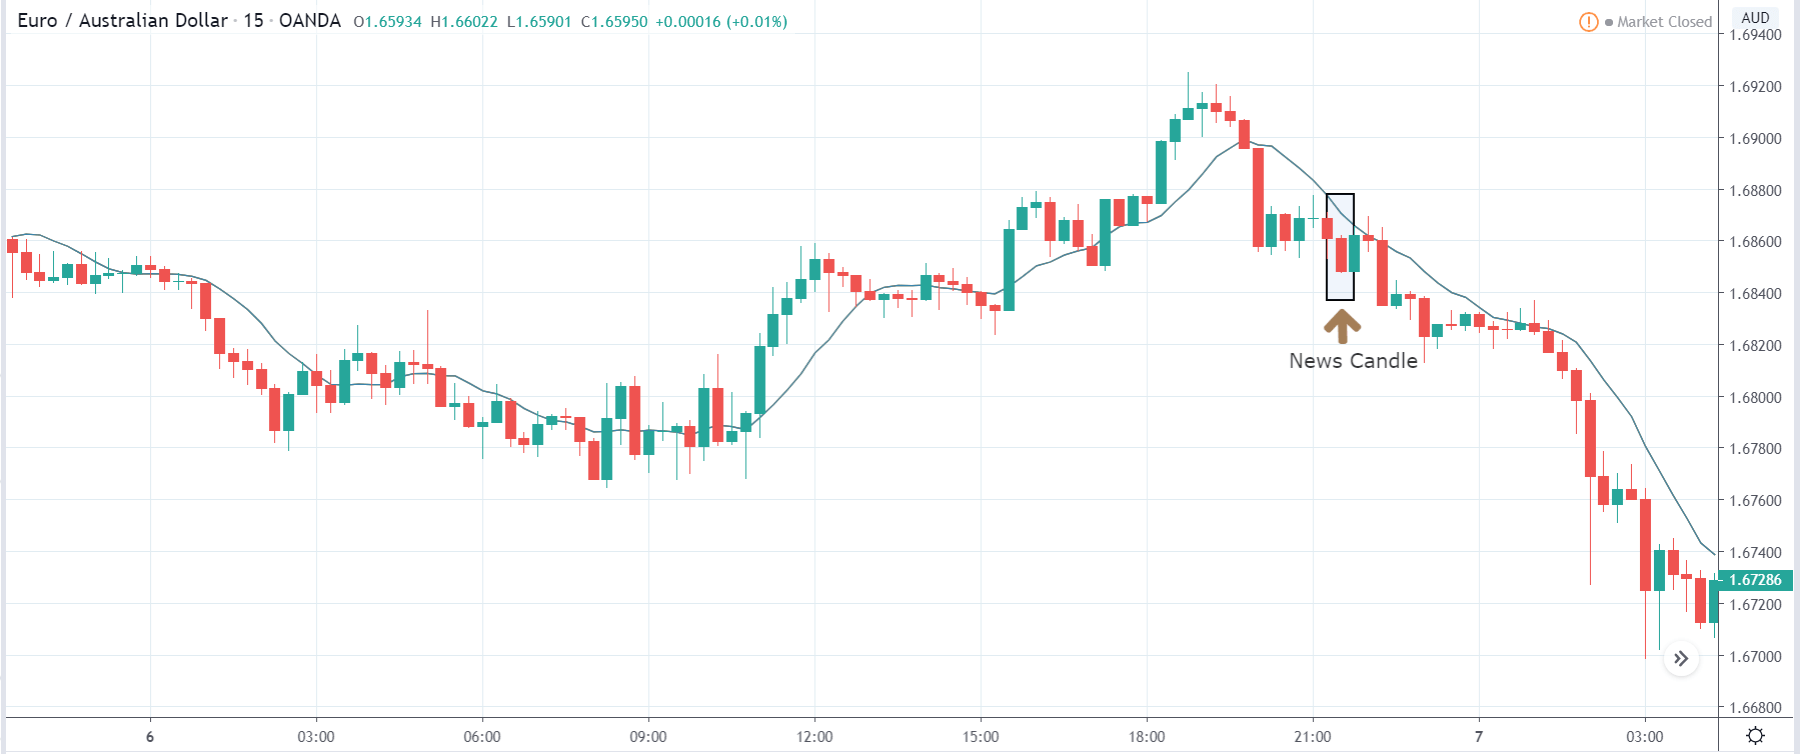
The above charts are that of the EUR/AUD currency pair, where the market shows a strong downtrend signifying a great amount of weakness in the Euro. Recently, the price has shown signs of retracement, and so we can expect a continuation of the down move after noticing trend continuation patterns. Until then, we will see what impact the PMI data makes on the currency pair.

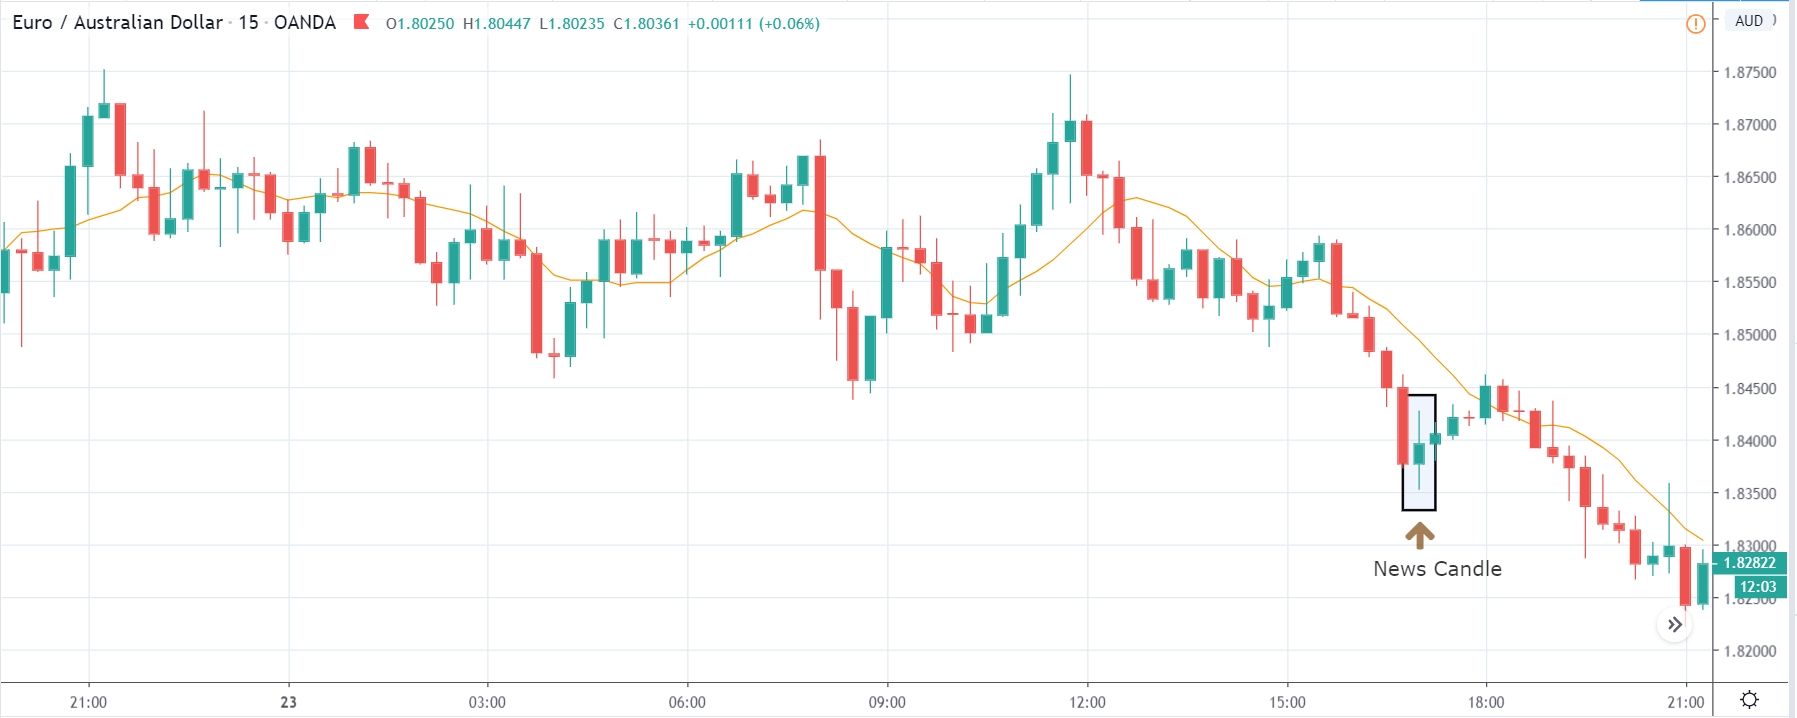
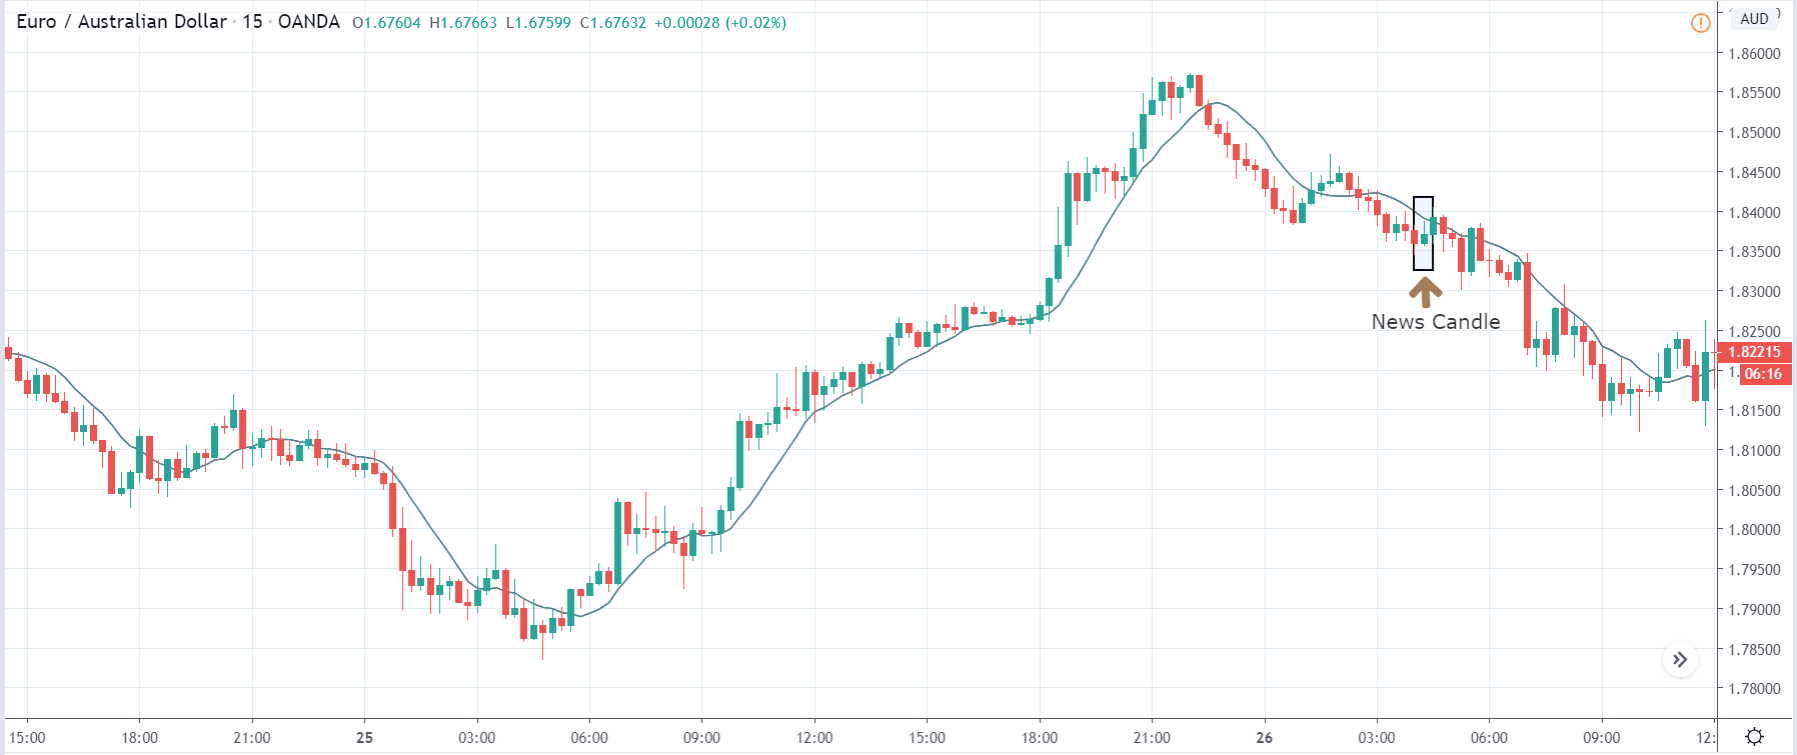
After the news announcement, the price does not move adversely in any direction and remains almost at the same place as it was before. The PMI data has a neutral effect on the currency pair where ‘news candle’ forms a ‘Doji’ candlestick pattern. However, the Euro becomes bullish a few minutes after the news release and markets move higher, nearly reversing the downtrend.

This ends our discussion on ‘Composite PMI,’ and its relative impact on the Forex market post its news release. In case of any questions, please let us know in the comments below. All the best!

Categories
Forex Market Analysis

Daily F.X. Analysis, June 22 – Top Trade Setups In Forex – Mixed Market Sentiments Plays! 

On Monday, the market continues to trade sideways due to a lack of high impact economic events. Last week, the current account balance from the U.S. showed a deficit of 104B against the expected 101B deficit and weighed on the U.S. dollar, which dragged the currency pair USD/JPY on the downside. In his speech on Friday, Fed Chair Jerome Powell suggested and demanded from Congress to ramp up the federal relief spending program. According to Powell, the government should aid the states and provide more unemployment benefits along with the public health measures to keep the economy afloat.

Economic Events to Watch Today


EUR/USD – Daily Analysis

The EUR/USD closed at 1.11766 after placing a high of 1.12541 and a low of 1.11679. Overall the movement of EUR/USD remained bearish throughout the day. On Friday, the EUR/USD pair extended its losses and followed its previous day’s bearish trend for the 4th consecutive day and posted losses for the second consecutive week. The pair’s prices moved to 13th day lowest level on the back of risk-off market sentiment after the increased fears of the second wave of coronavirus and intensified US-China tussles.

The risk-off market sentiment was caused by the rising fears of renewed lockdown restrictions throughout the world after several reported infectious cases continuously increased. As well as, the US-China conflicts showed signs of cooling down and weighed on risk sentiment, which ultimately dragged the EUR/USD pair downward.

Meanwhile, E.U. leaders held a virtual summit via video conference on Friday to discuss and finalize the coronavirus recovery plan. However, the video summit failed to strike a compromise on the proposed rescue fund, and the decision remained pending until the next budgetary talks in July.

The European Commission President, Ursula von der Leyen, said that member states had severe differences on many items but agreed on the desire to strike a deal ASAP. This weighed severely on the single currency Euro; hence, the pair EUR/USD moved downward.

Friday’s summit was just the starting point for the talks on European Commission’s $2 trillion (1.85 T euros) budget proposal. The new 750 billion euros plan was also included in the budget, which was launched to help the European economy after COVID 19 crisis. The scheme was set to provide loans of worth 250 B euros and grants to E.U. member states worth 500 B euros. A credit would finance this all that the European Commission would take from international financial markets.

Furthermore, Leyen also urged rich nations to share any future coronavirus vaccine with the poorer neighbors. She said as she launched the Brussels pandemic strategy that member states would work together to find a vaccine without competition and also suggested other world powers to do the same.

On the data front, the German Purchasing Price Index (PPI) for May was released at 11:00 GMT, which showed a decline of 0.4% against the expected decline by 0.3% and weighed on Euro. At 13:00 GMT, the Current Account Balance from the European Union showed a surplus of 14.4B in April. The weaker than expected data from the Eurozone weighed on EUR and dragged the pair EUR/USD further on the down track on Friday. On the other hand, China and E.U. top leaders are set to hold an annual summit on Monday, which will be a crucial factor to look at next week.

Daily Support and Resistance

  • R3 1.1224
  • R2 1.1211
  • R1 1.1193

Pivot Point 1.1181

  • S1 1.1163
  • S2 1.1151
  • S3 1.1133

EUR/USD– Trading Tip

The EUR/USD pair is trading with a slightly bullish bias at 1.1207, but the overall trend still seems bearish. On the hourly chart, the 50 periods EMA is likely to weigh on the EUR/USD pair and may keep it in a selling zone below 1.1209 today. The support is likely to be found around the 1.1170 level. Besides, the leading indicators are mixed; for example, the RSI is suggesting a selling bias, while the MACD is indicating a bullish bias. On the higher side, a bullish breakout of the 1.1208 level can extend bullish bias until 1.1254 level today. Let us look for buying trades over 1.1170 and selling below the same today. 


GBP/USD – Daily Analysis

The GBP/USD closed at 1.23511 after placing a high of 1.24559 and a low of 1.23439. Overall the movement of GBP/USD pair continued to be bearish throughout the day. The GBP/USD pair dropped for the 4th consecutive day on Friday and posted losses on the back of the increased risk-off market sentiment, insufficient BoE support, and rising coronavirus concerns. The Pound suffered back-to-back weekly losses as the risks of no-deal Brexit and the potential second wave of coronavirus will eventually offset the monetary stimulus of BoE.

Investors start selling British Pound on the view that the recent stimulus of Bank of England might not be sufficient to overcome the economic crisis as the number of infected cases increased day by day in an environment of potential no-deal Brexit. After an uptick in the reported coronavirus cases from the U.S. & China, the U.S. dollar gained and exerted a negative impact on GBP/USD pair on Friday. However, risks to no-deal Brexit played an essential role in the downward movement of the GBP/USD pair.

The PM Boris Johnson has repeatedly ruled out the extension to the Brexit transition period despite the coronavirus crisis. The talks between Brussels & London have been compromised due to the pandemic, and this fact cannot be denied. However, Johnson has still denied calling for an extension in the transition period. This has left only two options on the table, either strike a deal with possible compromises or go for a no-deal Brexit on December 31. Both parties have been disputing over two basis points, one is fishing access, and the other is the level playing field.

Meanwhile, at 11:00 GMT, the Retail Sales in May from Great Britain surged to 12.0% from the forecasted 6.3% and supported British Pound. The Public Sector Net Borrowing was increased to 54.5B from the expected 49.3B and weighed on British Pound that also dragged the GBP/USD pair further.

Daily Support and Resistance

  • R3 1.2378
  • R2 1.2369
  • R1 1.2357

Pivot Point 1.2348

  • S1 1.2337
  • S2 1.2327
  • S3 1.2316

GBP/USD– Trading Tip

On Monday, the GBP/USD is trading is showing a slight bullish correction to trade at 1.2409 level. However, it is holding right below 50 periods EMA which is likely to extend resistance around 1.2415 level. On the downside, the GBP/USD may find support around the value of around 1.2340, and the continuation of a selling trade can lead Sterling prices to be further lower until 1.2278 level. The MACD and RSI are holding around in a buying zone right now. Therefore, we cannot simply open a sell trade here. Let us wait for taking sell trades below 1.2348 level. 


USD/JPY – Daily Analysis

The USD/JPY pair was closed at 106.863 after placing a high of 107.056 and a low 106.764. Overall the movement of USD/JPY remained bearish throughout the day. The USD/JPY posted losses for the 3rd consecutive day of Friday Bank of Japan kept policy steady this week after increasing stimulus in March & April. The bank also issued its April’s monetary policy meeting minutes on Friday. According to the latest minutes issued by Bank of Japan, the governor Haruhiko Kuroda said that inflation would persist well below its 2% target for years to come.

At 4:30 GMT, the National Core Consumer Price Index for the year showed that nationwide CPI, which includes oil but excludes volatile fresh food prices, fell 0.2% in May from the expected fall of 0.1% and weighed on Japanese Yen. The Core Consumer prices from Japan fell for the second straight month during May, reinforced deflation expectations. It also raised challenges for policymakers who were battling the coronavirus pandemic to revive the economy.

Decreased CPI will make the job of BoJ more complicated in respect of restoring growth and inflation during the pandemic as the nation had seen the worst economic slowdown since the war. Many board members of BoJ warned that monetary support from banks in coordination with the government was needed to prevent Japan from returning to deflation. On Friday, in its meeting of April 27, BOJ eased policy further and informed a rise in buying corporate bonds and commercial paper. BoJ also promises to buy an unlimited JCBs. Japan also lifted all coronavirus related restrictions on domestic travel on Friday as the PM Shinzo Abe called people to go for sightseen and attend events to help Japan’s economy to recover.

On the other hand, the current account balance from the U.S. showed a deficit of 104B against the expected 101B deficit and weighed on the U.S. dollar, which dragged the currency pair USD/JPY on the downside.

In his speech on Friday, Fed Chair Jerome Powell suggested and demanded from Congress to ramp up the federal relief spending program. According to Powell, the government should aid the states and provide more unemployment benefits along with the public health measures to keep the economy afloat.

Powell stressed that the economic recovery from the pandemic crisis will be challenging and that there would be no quick fix. He provided a cautionary stance over the U.S. economic outlook, which exerted a negative impact on the U.S. dollar and dragged the pair further.

Daily Support and Resistance    

  • R3 107.13
  • R2 107.05
  • R1 106.94

Pivot Point 106.85

  • S1 106.74
  • S2 106.65
  • S3 106.54

USD/JPY – Trading Tips

On Monday, the USD/JPY is trading at 106.914 level as it continues trading sideways in a wide trading range of 107.620 – 106.630. It failed to break above an immediate resistance level of 107.580. This level is working as resistance for USD/JPY, and the 50 periods EMA is also prolonging strong resistance at 107.580 zones while immediate support lingers nearby 106.600. The USDJPY bearish trend can trigger a sell-off unto the next support level of the 106.017 level today. Let’s wait for the USD/JPY to test the 107.650 level before entering a sell in the USD/JPY. 

Good luck! 

Categories
Crypto Market Analysis

Daily Crypto Review, Jun 22 – COVID-19 Test Results Stored on the Blockchain; Ethereum Chasing $240

The crypto market has spent the past weekend being quite stable. Bitcoin is currently trading for $9,351, which represents a decrease of 0.08% on the day. Meanwhile, Ethereum gained 1.25% on the day, while XRP lost 0.08%.

Compound took the position of today’s biggest daily gainer, with gains of 14.26%. Golem lost 9.21% of its daily value, making it the biggest daily loser.

Bitcoin’s dominance level stayed at the same place since our last report, with its value currently at 65.23%. This value represents a 0.04% difference to the downside when compared to yesterday’s value.

The cryptocurrency market capitalization stayed at almost the same place as yesterday, with the market’s current value being $266.19 billion. This value represents a decrease of $1.78 billion when compared to the value it had yesterday.

What happened in the past 24 hours

COVID-19 testing on blockchain

Blockchain tracking platform called VeChain made a Twitter announcement on June 20, saying that its blockchain-based platform that performs medical data management has gone live, and that it will store COVID-19 testing results. The platform, called E-NewHealthLife, was deployed in and for the Mediterranean Hospital in the Republic of Cyprus.

Cyprus citizens who go to this hospital’s COVID-19 laboratory will have their medical as well as test records on the blockchain.

_______________________________________________________________________

Technical analysis

_______________________________________________________________________

Bitcoin

The largest crypto by market capitalization spent the weekend moving within a range, bound by the support level of $9,251 and the resistance level of $9,580. The support level was tested a couple of times over the weekend, but there was no real initiative in breaking it to the downside.


Bitcoin’s volume is slowing down and reducing while its RSI level is rising slightly (52).

Key levels to the upside          Key levels to the downside

1: $9,580                                 1: $9,251

2: $9,735                                 2: $9,120

3: $9,870                                  3: $8,980

Ethereum

Unlike Bitcoin, Ethereum wasn’t so static over the weekend. While the second-largest cryptocurrency did start the weekend slowly, the most recent volume increase and price spike show its potential to possibly approach the $240 level. However, it is unlikely that Ethereum will pass the level by itself (without the help of Bitcoin), so traders can watch what Bitcoin does and trade accordingly.


Key levels to the upside          Key levels to the downside

1: $240                                    1: $228

2: $251.4                                 2: $225.4

3: $198                                    3: $217.6

Ripple

The third-largest cryptocurrency by market cap has broken its immediate support level of $0.19 on Friday, and has maintained its position over the weekend. Even though XRP managed to gain some value in the past hours, it is still extremely unlikely that it will go above the $0.19 resistance level.


XRP’s volume is extremely low, while its RSI level increased to 48.

Key levels to the upside          Key levels to the downside

1: $0.19                                      1: $0.178

2: $0.2                                  

3: $0.205


Categories
Forex Daily Topic Forex Fundamental Analysis

Understanding ‘Electricity Production’ & Its Importance As A Forex Fundamental Driver

Introduction

Electricity is the most versatile and controlled form of energy. It is non-polluting and loss-free. It can be produced entirely using renewable methods, such as wind, water, and sunlight. Electricity is weightless, more comfortable to transport and distribute, and represents the most efficient way of consuming energy. Strategies are being developed to generate and use electricity in the most efficient way. It must be produced in the least damaging way, without inhibiting economic development.

Net power generation

The total worldwide production of electricity in 2016 was 25,082 TWh. Sources of electricity were coal 38.2%, natural gas 23.1%, hydroelectric 16.6%, nuclear power 10.4%, oil 3.7%, solar 5.6%, biomass and waste 2.3%.

Choosing the mode of production 

The selection of electricity production mode and their economic viability is linked with the demand and supply in that region. The dynamics vary considerably around the world, resulting in different selling prices across the globe; for example, the price in Iceland is 5.54 cents per kWh while in island nations, it is 40 cents per kWh. Hydroelectric plants, thermal power plants, nuclear power plants, and renewable sources have their pros and cons, and selection is based on the local power requirement and fluctuations in demand. All power plants have varying loads on them, but the daily minimum is baseload, often supplied by plants that run continuously. Nuclear, coal, gas, oil, and some hydro plants can supply baseload.

Due to the advancement in technology, renewable sources other than hydroelectricity experienced decreases the cost of production, and the energy in many cases is cost-comparative with fossil fuels. Many governments around the world are allocating funds to offset the higher cost of new power production and make the installation of renewable energy systems economically feasible. However, their use is curtailed by their intermittent nature, less demand, and sometimes transmission constraints.

Economic development and electricity

Electricity is a major contributor to the economic development of a nation. It is the wheel that drives most aspects of everyday life in society. A nation is a compilation of activities and people whose progress is determined by the infrastructural components. Electricity is the source of fuel for almost all sectors of the economy. Most of our daily activities are dependent on electricity, our hospitals need electricity for various purposes, and airports need electricity for regular functioning and ensuring the safety of passengers.

When so many activities are dependent on electricity, production of the same is very important for every nation’s economic development because it brings investment opportunities for the country. In a country where electricity production is more, investors get interested because the cost of production in such a country is minimal compared to where there is no electricity. Running machines on electricity is cheaper compared to running them on generators. High electricity production helps to reduce the mortality rate in the country because the hospitals will be efficiently powered and is a key factor in service delivery at hospitals.

In countries with good electricity production, agricultural productivity is also high because electricity can help in powering irrigation, food preservation, and seed preservations. They enable the country to have fewer damages to agricultural products because they can be kept in storage facilities, and wastage can be avoided.

Impact on currency

Although electricity production is an important sector of the economy and a vital component, it may not have a direct impact on the value of a currency. The effect of shortage in electricity is first felt on the company, which will be reflected in its quarter-quarter data. If the results are bad, one can analyze the impact of electricity on the numbers and the stock price. If the industry itself is suffering, it primarily impacts the stock market and not the currency value. Hence, we can say that the impact of electricity is minimal on the value of a currency where investors, too, do not give much importance to this data.

Sources of information on Electricity Production

Economists and investors have not keenly tracked the electricity production data, so not many economic websites and newspapers publish the data regularly. The country’s electricity board is the official source of the data from where reliable figures can be obtained. However, we were able to collect the data on the electricity production of a few countries that can be used for reference and comparison.

GBPAUDUSDCADNZDJPY

High levels of electricity production improve the standard of living of the people in the country. This is very important for the economic advancement of a country. If people live in better conditions, it has ripple effects on every aspect of the country. It reduces unnecessary expenditures for the government. It improves the security of the country and helps to create job opportunities for the entire country because the indirect sectors use electricity to power their businesses. Development can only be realized when the key drivers of the economy are unhindered by the country’s lack of infrastructural components.

Impact of Electricity Production’s News Release On The Forex Market

In the previous section of the article, we comprehended the Electricity Production economic indicator and saw it’s economic importance. We shall extend our discussion and understand the impact of the Electricity Production news announcement on various currency pairs.

It is important to note that although electricity is needed for the economic development and well-being of citizens, it is not a crucial fundamental indicator. Therefore, investors and traders do not invest based on Electricity Production data. However, let us find out the impact on a few currency pairs on the day of the announcement.

The below image shows total Electricity Production in the United Kingdom, where it increased to 29731 in Gigawatt-hour in December from 28902 Gigawatt-hour in November of 2019. Let us see how the market reacts to this data.

GBP/USD | Before the announcement

We will begin our analysis with the GBP/USD currency pair and observe the change in volatility due to the news announcement. The above image shows the daily time frame chart of the currency pair before the news announcement. We see that the market has been moving in a ‘range,’ and currently, the price is almost at the top of the ‘range.’ Aggressive traders can take ‘short’ positions with a large stop-loss, as there can be volatility in the pair during the news announcement.

GBP/USD | After the announcement

After the news announcement, the price hardly makes a move and stays at the same place as it was before. There is no change in the volatility, as indicated by the ‘news candle.’ The market continues to move higher on subsequent days and breaks out from the ‘range.’ The move should not be considered as a result of news but instead was a technically driven move. Now traders should trade this currency pair using their breakout strategy.

GBP/CAD | Before the announcement

GBP/CAD | After the announcement

The above images represent the GBP/CAD currency pair, where we see that the market is in a strong uptrend before the news announcement and recently has been sideways. We should not expect major volatility in the pair. Technically speaking, we will be looking to go ‘long’ in the market after a suitable price retracement to the nearest support or demand level.

After the news announcement, the market moves higher by little, and volatility expands to the upside. We could say that since the Electricity Production data was slightly positive for the British economy, traders bought the currency after the news announcement and raised its value. At this point, we cannot take any trade as there is no formation of an appropriate continuation pattern in the market.

GBP/CHF | Before the announcement

GBP/CHF | After the announcement

The previous images are of the GBP/CHF currency pair, where we see that before the news announcement, the market is in a strong uptrend, indicating a great amount of the strength in the British Pound. Here too, the idea is to go ‘long’ in the market after a price retracement to a key technical level. The price seems to have broken out a small ‘range.’ Thus, we cannot take any position in the market at this point.

After the news announcement, the market instantly drops, and the prices move lower. The news data had a negative impact on the currency pair, where volatility increases to the downside. As the Electricity Production data does not have a long-lasting effect on the currency, the fall in price due to the release of the news can be an opportunity for joining the uptrend.

We hope you find this article informative. Let us know if you have any questions in the comments below. All the best.

Categories
Forex Market Analysis

Daily F.X. Analysis, June 19 – Top Trade Setups In Forex – E.U. Economic Summit Ahead! 

A day before, the U.S. dollar was also supported by the Philly Fed Manufacturing Index, which surged to 27.5 from the expected -23.0. The C.B. Leading Index for May also supported dollar when came in as 2.8% against the .4%. Today, the eyes will remain on the Canadian economic events and E.U. economic summit. Overall, the price action will be driven by the technical levels today.

Economic Events to Watch Today


EUR/USD – Daily Analysis

The EUR/USD pair was closed at 1.12045 after placing a high of 1.12611 and a low of 1.11854. Overall the movement of the EUR/USD pair remained bearish throughout the day. The EUR/USD pair followed its previous day’s trend and posted losses for 3rd consecutive day on Thursday amid risk-off market sentiment and bleak economic data. The pair extended its losses and dropped to its lowest level near 1.11800 since June 3.

The bearish trend of EUR/USD was supported by the increased demand for the U.S. dollar, which made it strong across the board. U.S. dollar was higher on Thursday amid its safe-haven status, which was buoyed by the multiple factors. The safe-haven market sentiment was supported by the increased fears of coronavirus second wave after the U.S. & China reported an increased number of infection cases from some parts of their country.

The U.S. dollar was also supported by the Philly Fed Manufacturing Index, which surged to 27.5 from the expected -23.0. The C.B. Leading Index for May also supported dollar when came in as 2.8% against the .4%.

However, the losses of EUR/USD were limited after the release of Unemployment Claims from the U.S. that surged to 1.508M against the 1.3M forecasts.

From the Eurozone side, at 13:03 GMT, the Italian Trade Balance in April showed a deficit of 1.16B against the expected surplus of 4.88B. Poor than expected Trade Balance from Italy weighed heavily on the single currency Euro as the difference between expected and actual value was very large.

Despite poor than expected jobless claims, the U.S. dollar index, which measures the U.S. value against a basket of six currencies, rose to 97.4 level. Increased dollar stressed the demand for EUR/USD, and hence, pair fell for 3rd consecutive day.

Furthermore, the European Central Bank issued another trillion million euros to strengthen the economies from the coronavirus pandemic. The offer made by the Central Bank to commercial banks of its ultra-cheap three years loan was taken up by 742 banks on Thursday. Bloomberg reported that a total of 1.31 trillion euros of offers were taken by the banks, which were in line with the predicted range of 1.2T – 1.5T euros.

These loans were carrying below zero interest rates, which means ECB was paying the lenders to lend to households and business people to bolster the economic recovery from the pandemic and cushion the losses.

Daily Support and Resistance

  • R3 1.1462
  • R2 1.1408
  • R1 1.1336

Pivot Point 1.1282

  • S1 1.1211
  • S2 1.1156
  • S3 1.1085

EUR/USD– Trading Tip

On Friday, the EUR/USD pair is trading with a bearish bias, holding below the descending triangle pattern, which can lead EUR/USD prices towards 1.1164 level. On the higher side, the pair may find resistance at 1.1219 level, which is extended by the downward trendline that can be seen on the hourly timeframe. Besides, the leading indicators are mixed; for example, the RSI is suggesting a selling bias, while the MACD is indicating a bullish bias. However, the 50 EMA is in support of selling. Therefore, we can look for selling trade below 1.1219 level today. 


GBP/USD – Daily Analysis

The GBP/USD pair was closed at 1.2407 after placing a high of 1.25667 and a low of 1.24014. Overall the movement of GBP/USD pair remained bearish throughout the day. The GBP/USD pair dropped on Thursday and extended its losses for 3rd consecutive day on the back of dovish commentary from BoE and Brexit uncertainties.

On Thursday, the BOE held its monetary policy meeting in which it left the rates unchanged at 0.10% but increased the Quantitative Easing package by100 Billion Pounds. Bank of England dropped its expectations for the U.K.’s economic contraction for Q1 and Q2. In its previous meeting, the Bank of England anticipated that the economy would shrink by 27% in Q1 and Q2. But in the latest meeting on Thursday, BoE issued its expectation for GDP to contract by 20% in the first half of 2020.

The Governor of BoE, Andrew Bailey, said on Thursday that Britain’s economy was recovering a bit faster than Bank thought in the previous month. It could be due to decreased lockdown measures; however, the labor market was mostly providing negative data.

Bailey told reporters that BoE announced an increase of 100 billion pounds around $124 billion in its bond-buying program, but it also slowed the pace of purchases. He added that BoE had plans to stretch its 745 billion pounds bond-buying program. Bailey repeated his previous comments on negative interest rates that they were an option for the Bank as the issue was complex, but given the situation, when banks could afford bond-buying and another stimulus, taking borrowing cost below zero was not going to happen.

The Bank of England also said that it would take further necessary actions to support the economy and boost inflation towards its 2% target.

On Brexit front, the European Union’s Chief executive, Ursula von der Leyen, said on late Wednesday that there would be no post-Brexit trade deal without a level playing field, including everything from state aid to labor to environmental interests. She said that the Bloc would do everything to secure a deal by the end of 2020, but it will not compromise its core values.

Daily Support and Resistance

  • R3 1.2695
  • R2 1.2632
  • R1 1.2529

Pivot Point 1.2465

  • S1 1.2362
  • S2 1.2298
  • S3 1.2195

GBP/USD– Trading Tip

On Friday, the GBP/USD is trading at a level of 1.2430, holding right below support to become a resistance level of 1.2480. The pair is in the oversold zone now, and we may see a slight bullish correction until 1.2465 and 1.2485. But below this, the odds of selling will remain high, and it can lead Sterling lower towards the next support area of 1.2350 level. The RSI and 50 periods of EMA are suggesting a selling bias today. Let’s consider taking selling trades below 1.2450 today.  


USD/JPY – Daily Analysis

The USD/JPY pair was closed at 106.969 after placing a high of 107.127 and a low of 106.655. Overall the movement of USD/JPY pair remained flat but slight bearish throughout the day. The USD/JPY painted a fresh three day low at 106.65 after a short-lived rise toward 107.1 in the beginning session. Japanese Ye was amongst the best performer currencies on Thursday on the back of lower U.S. yields and mixed sentiment.

The U.S. dollar data showed mixed results as jobless claims exceeded the expectations and weighed on the U.S. dollar, but the Philly Fed Manufacturing Index jumped and supported the U.S. dollar.

At 17:30 GMT, the Philly Fed Manufacturing Index for June reported as 27.5 against -23.0. The Unemployment Claims for last week were reported as 1.508M against the expected 1.3M. At 19:00 GMT, the C.B. Leading Index for May surged to 2.8% against the expected 2.4% and supported the U.S. dollar. The U.S. Dollar Index (DXY) surged above 97.44 level and posted weekly high. While U.S. stocks posted losses where Dow Jones was down by 0.15%, and S&P 500 was down by 0.27%.

An FOMC member Loretta Mester gave a speech on Thursday where she said that Fed and Fed longer than expected the road to economic recovery would have to provide additional and continuous support by being very easy on the monetary policy till 2023. The dovish comments exerted downside pressure on the U.S. dollar and ultimately to USD/JPY pair on Thursday.

Some reports suggested Beijing has succeeded in containing the virus after the renewed cases emerged due to ease of lockdown restrictions. Apart from Beijing, many states of America and other countries also send reports about rebuilt virus cases.

The hopes for V shape recovery for the global economy also faded away as the development of the vaccine was needed for that which only can increase the confidence of people against the virus spread.

However, the increased tensions between China & India and North & South Korea on their disputed borders also kept the USD/JPY pair under pressure.

Daily Support and Resistance    

  • R3 108
  • R2 107.82
  • R1 107.57

Pivot Point 107.39

  • S1 107.14
  • S2 106.96
  • S3 106.71

USD/JPY – Trading Tips

The USD/JPY is trading at 106.914 level as it continues trading sideways in a wide trading range of 107.620 – 106.630. It failed to break above an immediate resistance level of 107.580. This level is working as resistance for USD/JPY, and the 50 periods EMA is also prolonging strong resistance at 107.580 zones while immediate support lingers nearby 106.600. The USDJPY bearish trend can trigger a sell-off unto the next support level of the 106.017 level today. Let’s wait for the USD/JPY to test the 107.650 level before entering a sell in the USD/JPY. 

Good luck! 

Categories
Crypto Market Analysis

Daily Crypto Review, Jun 19 – Bitcoin Mid-Term Bullish vs. Bearish Outlook – Explained

The crypto market has spent the past 24 hours being on a slow downward-facing path. Bitcoin is currently trading for $9,336, which represents a decrease of 0.69% on the day. Meanwhile, Ethereum lost 1.46% on the day, while XRP lost 1.37%.

Aave took the position of today’s biggest daily gainer, with gains of 26.09%. SwissBorg lost 16.61% of its daily value, making it the biggest daily loser.

Bitcoin’s dominance level stayed at the same place since our last report, with its value currently at 65.27%. This value represents a 0.01% difference to the downside when compared to yesterday’s value.

The cryptocurrency market capitalization stayed at almost the same place as yesterday, with the market’s current value being $266.19 billion. This value represents a decrease of $1.78 billion when compared to the value it had yesterday.

What happened in the past 24 hours

Russia lifting ban on Telegram

After many years of unsuccessful efforts to ban Telegram in Russia, the local authorities have finally decided to fully cancel the ban. Russia’s Federal Service for Supervision of Communications, IT, and Mass Media, better-known as Roskomnadzor, has lifted the two-year-long ban imposed on Telegram.

The authority has removed requirements that restrict the access to the Telegram messenger in an agreement with the Prosecutor General of Russia.

_______________________________________________________________________

Technical analysis

_______________________________________________________________________

Bitcoin

The largest crypto by market capitalization spent the past 24 hours slowly moving towards the downside, ultimately testing its support level of $9,251. The bullish trend that Bitcoin was in (on the 1-day chart) was broken to the downside with the most recent Bitcoin drop. In order for BTC movements to still be considered bullish in the long run, its price needs to be above 9,120 on June 30. On the other hand, even though the outlook is not exactly bullish at the moment, Bitcoin seems to have some good support in its $9,251 level as well as the 1-day 50-period moving average.


If, on the other hand, Bitcoin makes a higher high at above $10,500, bull run will be almost certain, and people should consider pulling more of their portfolio into crypto.

Key levels to the upside          Key levels to the downside

1: $9,580                                 1: $9,251

2: $9,735                                 2: $9,120

3: $9,870                                  3: $8,980

Ethereum

Ethereum keeps creating lower highs and slowly moving lower throughout the day. The second-largest cryptocurrency by market cap is on its way to test the $228 once again. As this support level is a new one, it might not hold as well, and the price is likely to fall towards $225.4 level.


Ethereum’s long-term outlook will greatly depend on how Bitcoin moves, so there is no reason to discuss it at the moment.

Key levels to the upside          Key levels to the downside

1: $240                                    1: $228

2: $251.4                                 2: $225.4

3: $198                                    3: $217.6

Ripple

XRP has also spent the day slowly moving to the downside, but with one major difference. The third-largest cryptocurrency by market cap has, unlike Bitcoin and Ethereum, broken its immediate support level. While the $0.19 support level isn’t completely beaten and there is still time for the price to recover, it is likely that the price will remain below it due to the lack of volume and initiative when it comes to either buying or selling XRP at the moment.


Key levels to the upside          Key levels to the downside

1: $0.2                                      1: $0.19

2: $0.205                                  2: $0.178

3: $0.214


Categories
Forex Fundamental Analysis

Why Understanding ‘Corruption Index’ Is Crucial In Determining Economy’s Health?

Introduction To Corruption Index

The corruption index is a score that is given to the government of a country, which indicates the degree of corruption in the country. The value is assigned from 0 to 100, with 0 indicating high levels of corruption and 100 indicating low levels. The score is given by Transparency International, an organization that tries to stop bribery and other forms of corruption activities in the country. Transparency international started ranking in 1995, and today it scores more than 176 countries and territories.

The Corruption Index focusses on the public sector and evaluates the degree of corruption among public officials and politicians. In highly corrupt countries, the judiciary’s quality and independence are usually low, and official statistics try to underestimate the level of corruption to hide the bitter truth. The international agencies are a valuable alternative source of information to report the extent of illegal practices being done by civil servants and politicians in a given country.

Impact of corruption on the economy  

Most economists view corruption as a key obstacle to economic growth. It is seen as one of the reasons for low income and plays a critical role in generating poverty traps. It prevents economic and legal systems from functioning properly. Other effects are a misallocation of talent or human development, reduction in the incentive to accumulate “capital.”

Corruption hampers development by allowing agents to interfere in the usual functioning of the government. Economists believe that corruption is like a competitive auction; those who want a service, use the power of money to get it, and the result is an inefficient allocation of resources. The resources get used by people who do not deserve or are not meant to use it.

Contrary to this idea, some people argue that corruption ‘greases’ the wheels of development and that foster growth. The main idea is that corruption facilitates beneficial trades that otherwise would not have taken place. In this way, it promotes productivity by allowing individuals in the private sector to correct or avoid government failures of various sorts.

Limitations of Corruption Index

The index has been criticized lately based on its methodology used for ranking countries. Political scientists find some flaws in the way the corruption index is calculated. These flaws include:

  • Corruption data is too complex to be captured by a single source. For example, the type of corruption in rural Michigan will be different from that in the city administration of Chicago, yet the index measures them in the same way.
  • It is seen that the corruption index is influenced by perception about it. It means it is not measured by considering its real value, where the index may be reinforcing existing stereotypes and clichés.
  • The index only measures public sector corruption and ignores the private sector. This means the well-publicized scandals such as the Libor scandal, or the VW emissions scandal were not included in the corrupt segment.

 Analyzing the data

Corruption index is an important economic indicator that most economists and money managers look at before making investments. In recent times, it is making a huge impact on the economic development of a country. Thus, we need to understand how the data is analyzed. By comparing the two countries’ rankings, one can determine which of the two economies is stronger and enjoying investor confidence.

While analyzing the data, it important to keep in mind that economies of the same stature should be compared. We cannot compare the ranking of a developed country with that of a developing country. This is because corruption has a much greater impact on the growth rates of developing countries.

Impact on currency

Public corruption in emerging countries, especially, contributes to currency crises and put a major dent in the development of the country. Corruption acts repel stable forms of foreign investment and leave countries dependent on foreign bank loans to finance growth. Foreign investors refuse to put their money in developing countries where, for example, local bureaucrats accept bribes, and the government has been known to fall prey to businesspersons and builders.

A corrupt government may be undesirable for foreign direct investment (FDI), but it may not be equally disadvantageous when it comes to obtaining loans from international creditors. This is because governments of most countries offer considerably more insurance and protections to lenders than to direct investors. The result is a country with high debts and no foreign investment. Such an imbalance leaves an economy much more vulnerable to currency crises.

Sources of information on Corruption Index

The Corruption Index is published annually by Transparency International since 1995, which ranks countries by their perceived levels of corruption in the public sector. Transparency International is the official agency that keeps track of the corruption activities and wrongdoing of the government, which is reflected in the rankings. However, other economic websites measure corruption based on their parameters and factors. They also provide a statistical comparison of different countries with a clear graphical representation.

GBP (Sterling) – https://tradingeconomics.com/united-kingdom/corruption-index

AUD – https://tradingeconomics.com/australia/corruption-index

USD – https://tradingeconomics.com/united-states/corruption-index

CAD – https://tradingeconomics.com/canada/corruption-index

NZD – https://tradingeconomics.com/new-zealand/corruption-index

JPY – https://tradingeconomics.com/japan/corruption-index

The corruption index is gaining a lot of attention and importance around the world. Corruption decreases the amount of wealth in a country and lowers the standard of living. The economic impact of corruption is measured in two ways, first, the direct impact on the GDP growth rate and, secondly, an indirect impact on human development and capital inflow. The new methodology used by Transparency International uses four basic steps, including the selection of data, rescaling source data, aggregating the rescaled data, and a statistical measure indicating the level of certainty. The data collection and calculations are done by two in-house researchers and academicians.

Impact of Corruption Index’s news release on the Forex market 

The Corruption Perception Index (CPI) scores countries on how corrupt a country’s public sector is perceived to be by experts and business executives. It is a composite index, which is a combination of 13 surveys and assessments. The data is collected and compiled by a variety of reputed institutions.

The CPI is the widely used indicator of corruption all over the world. The corruption index is closely watched by investors who take investment decisions based on the ranking. However, it has a long-term impact on the currency, and the effect may not be seen immediately after the official news release.

In this section of the article, we will observe the impact of the CPI announcement on different currency pairs and witness the change in volatility due to the news release. For that purpose, we have collected the CPI ranking of Japan, where the below image shows Japan’s corruption score and rank in 2019. A score above 50 indicates low corruption levels and that the country’s government is clean.

USD/JPY | Before the announcement

Let us start our analysis with the USD/JPY currency pair and analyze the reaction of the market. The above image shows the daily time frame chart of the forex pair before the news announcement, where we see that the market is moving in a ‘range’ with the price at the top of the range. We will look to take a ‘short’ trade once we get confirmation from the market.

USD/JPY | After the announcement

After the news announcement, volatility increases to the downside, and the price falls drastically. The market reacted positively to the news data, where we see that the Japanese Yen gains strength after the news release. As the corruption index score was positive, traders strengthened the currency, as indicated by the large bearish ‘news candle.

GBP/JPY | Before the announcement

GBP/JPY | After the announcement

The above images represent the GBP/JPY currency pair, where we see that before the announcement, the market is in a strong uptrend, and recently the market has shown signs of reversal. We should be looking to sell the currency pair if the market is not able to move higher. However, we should wait for the news release to get a clear idea of the direction of the market.

After the news announcement, the market reacts similarly as in the previous currency pair, where the price moves lower and volatility expands to the downside. As the CPI data came out to be positive, traders sold British Pound and bought Japanese Yen, thereby strengthening the currency. At this moment, one can take risk-free ‘short’ trade with a stop loss above the ‘news candle.’

AUD/JPY | Before the announcement

AUD/JPY | After the announcement

Lastly, we will find out the impact on the AUD/JPY currency pair. The first image shows the characteristic of the chart before the news announcement, where it appears that the price is moving in a channel. One needs to be cautious before taking a ‘short’ trade as the price is at the bottom of the channel.

After the news announcement, the market gets a little volatile where we see that the price moves in both directions and finally closes near the opening. The overall reaction was bullish for the currency due to the healthy CPI data. The ‘news candle’ is not enough to confirm that the market is going lower as it has lower wick on the bottom, indicating buying pressure.

We hope you understood what ‘Corruption Index’ is and the impact on the Forex market after its news announcement. Cheers!

Categories
Crypto Market Analysis

Daily Crypto Review, Jun 18 – Binance Pool the Biggest Miner of Craig Wright’s Bitcoin SV – What’s Actually Happening?

The crypto market has spent the past 24 hours testing its support levels after failing to break the resistance levels during yesterday’s price increase. Bitcoin is currently trading for $9,412, which represents a decrease of 0.62% on the day. Meanwhile, Ethereum lost 0.71% on the day, while XRP lost 1.37%.

SwissBorg took the position of today’s biggest daily gainer, with gains of 31.95%. DigiByte lost 7.95% of its daily value, making it the most prominent daily loser.

Bitcoin’s dominance stayed at the same place since our last report, with its value currently at 65.28%. This value represents a 0.04% difference to the downside when compared to yesterday’s value.

The cryptocurrency market capitalization stayed at the same place as yesterday, with the market’s current value being $267.97 billion. This value represents a decrease of $0.02 billion when compared to the value it had yesterday.

What happened in the past 24 hours

Binance Pool mining the most Bitcoin SV – Why?

Only a year after removing Bitcoin SV from its exchange, news came out that Binance (through its Binance Pool) produces more Bitcoin SV blocks through mining than any other pool. Many people would jump to the conclusion that Binance knows something we don’t, but that really isn’t the case.

Even though Binance Pool is undoubtedly the largest miner of Bitcoin Satoshi’s Vision blocks at the moment (with 26.39% of total Bitcoin SV mining on June 17), it is not Binance who is mining them, but rather the users of the Pool. However, Binance is profiting from the mining operations by imposing a 2.5% pool fee. That being said, it is highly unlikely that Binance will return Bitcoin SV to its exchange, or that its stance on the controversial coin changed.

_______________________________________________________________________

Technical analysis

_______________________________________________________________________

Bitcoin

The largest cryptocurrency by market capitalization spent the past 24 hours testing its support levels, right after failing to break the $9,580 resistance. While the $9,251 level showed strength, bouncing the price back immediately, Bitcoin is still moving down slightly. If nothing changes in terms of volume and market sentiment in general, Bitcoin might have another go at testing this support level.


Bitcoin’s volume has decreased slightly when compared to the previous days, while its RSI level is at 50.

Key levels to the upside          Key levels to the downside

1: $9,580                                 1: $9,251

2: $9,735                                 2: $9,120

3: $9,870                                  3: $8,980

Ethereum

Ethereum made the same move as Bitcoin and had no initiative when it came to a non-correlated movement today. After failing to reach its resistance level of $240, ETH started moving towards the downside. It, however, got stopped by the (possibly) new support level of $228, bouncing the price slightly up towards $235. The price stopped after reaching $235 and started moving sideways, possibly threatening the downside once again.


Key levels to the upside          Key levels to the downside

1: $240                                    1: $228

2: $251.4                                 2: $225.4

3: $198                                    3: $217.6

Ripple

XRP had a slightly different movement when compared to BTC and ETH, but with the same sentiment. The third-largest cryptocurrency by market cap failed to reach $0.2 successfully, therefore making the possibility of breaking the resistance almost none-existent in the short-term. This triggered the bears to test the support level of $0.19, which (after some fighting) managed to hold its position. XRP is now trading just above the support line, preparing for the next move.


Key levels to the upside          Key levels to the downside

1: $0.2                                      1: $0.19

2: $0.205                                  2: $0.178

3: $0.214


Categories
Forex Market Analysis

Daily F.X. Analysis, June 18 – Top Trade Setups In Forex – BOE Rate Decision In Focus!

Let’s keep an eye on the U.K. Monitory Policy meeting, especially on the MPC members voting for the Asset Purchase facility. Overall, the bank isn’t expected to change it’s interest rate today. Besides, the U.S. Jobless Claims and Manufacturing Index will remain in focus.

Economic Events to Watch Today


EUR/USD – Daily Analysis

The EUR/USD prices were closed at 1.12425 after placing a high of 1.12938 and a low of 1.12068. Overall the movement of the EUR/USD pair remained bearish throughout the day. The EUR/USD pair extended its losses for the second consecutive day on Wednesday on the back of the risk-off market sentiment.

The escalating geopolitical tensions in the disputed border between India & China and North Korea and South Kore weighed on the risk-on market sentiment on Wednesday. The risk-off market sentiment was then bolstered by the fears of a fresh second wave of coronavirus after an increased number of infection cases from Beijing and some states of the United States.

To stop the virus from further spread and second wave to emerge, China ordered to impose strict restrictions in 29 communities of Beijing on Wednesday, and hence, risk sentiment dropped. Riskier currency Euro suffered and moved in a downward direction.

Meanwhile, the European Commission presented a “European Strategy” to accelerate the development, manufacturing, and deployment of vaccines against COVID-19. According to the European Commission, the pandemic’s permanent solution was an effective and safe vaccine development.

The announced European Strategy proposed a joint E.U. approach and was built on the mandate received from E.U. health ministers. The latest strategy gave some support to the falling Euro currency and kept a lid on any additional losses.

On the other hand, the chief of Eurogroup meeting, Mario Centeno on Wednesday, said that his decision to step down from his post had no specific political reason but was simply the end of the cycle. He claimed that his tenure was due to the period, and he just did not apply for a second chance. E.U. leaders are due to meet later this week to discuss the trillion-euro fund that will finance the European coronavirus recovery plan.

On the data front, the Consumer price index (CPI) for the year remained in line with the expectations of 0.1%, and the Final Core CPI from the Eurozone also came as expected 0.9% and had a null effect on Euro currency.

On the U.S. front, the Building permits remained flat with the expectations of 1.22M however, the Housing Starts in May were recorded as 0.97 M against the expected 1.1M and weighed on the U.S. dollar.

In his second testimony of Federal Reserve Chairman Jerome Powell, he stressed that Fed would use all of its tools to curb the damage caused by coronavirus pandemic. He also showed that no hike in interest rate was any near in the future. This decision helped the U.S. dollar to find demand in the market, and hence, the EUR/USD pair suffered more on the day.

Daily Support and Resistance

  • R3 1.1462
  • R2 1.1408
  • R1 1.1336

Pivot Point 1.1282

  • S1 1.1211
  • S2 1.1156
  • S3 1.1085

EUR/USD– Trading Tip

The EUR/USD pair is testing the double bottom support level at 1.1210 level in the 4-hour timeframe, and now it’s bouncing off towards 1.12730 level. Continuation of a bullish trend can extend bullish bias until the next resistance level of 1.1340. Elsewhere, a bearish breakout of 1.1210 can trigger selling until 1.1170. Let’s look for selling below 1.1298 and buying above the same level today. 


GBP/USD – Daily Analysis

The GBP/USD pair was closed at1.25548 after placing a high of 1.25885 and a low of 1.25106. Overall the movement of GBP/USD remained bearish throughout the day. The pair GBP/USD posted losses for the second consecutive day on Wednesday amid the sudden pick up in the U.S. dollar demand.

The greenback’s relative safe-haven status was continuously benefitted by the growing fears of the second wave of coronavirus and geopolitical tensions in Asia. However, the bearish trend for the GBP/USD pair remained under stress due to the latest optimism related to the Brexit progress.

The market expectations of no-deal Brexit have faded away after the U.K. & E.U. agreed to intensify post –Brexit talks. Besides, UK PM Boris Johnson said that the end of July could reach an outline of a deal. This helped to limit the additional losses in the GBP/USD pair.

Investors are keenly awaiting the update from Bank of England, which will hold its monetary policy meeting on Thursday. Although the moves from BoE in upcoming monetary policy meeting are highly anticipated, market participants still await the monetary policy update.

On the data front, the CPI from the U.K. at 11:00 GMT was released, which showed that during May, CPI remained as expected to be 0.5%. The Core CPI from the U.K. dropped to 1.2% from the expected 1.3% and weighed n GBP.

The P.I. Input for May also dropped to 0.3% against the expected 4.1% and weighed on British Pound. The PPI Output for May reached -0.3% from the anticipated 0.0% and weighed on British Pound. At 11:02 GMT, the RPI for the year in May decreased to 1.0%from the forecasted 1.2% and weighed on GBP. Poor than expected economic data dragged the pair near 1.2500 level on Wednesday. In the meantime, risk-off market sentiment also weighed on GBP/USD risky currency pair.

Daily Support and Resistance

  • R3 1.2794
  • R2 1.2741
  • R1 1.2659

Pivot Point 1.2606

  • S1 1.2524
  • S2 1.2471
  • S3 1.2388

GBP/USD– Trading Tip

On Thursday, the GBP/USD is trading at a level of 1.2580, holding right above a next support level of 1.2550. Continuation of a bullish trend requires the cable to break above 1.2585 level first. The 50 periods EMA is weighting on Sterlin gat 1.2585 level while the RSI and MACD are holding in the bearish zone. Although they are very close to crossover into the bullish zone, so we should wait for a bullish breakout before taking a buy trades. By the way, a bullish breakout of 1.2585 level can extend to buying until the next target level of the level of 1.2685, while bearish breakout of 1.2545 level can lead Sterling to be lower towards 1.2475. 


USD/JPY – Daily Analysis

The USD/JPY pair was closed at 107.004 after placing a high of 107.439 and a low of 106.950. Overall the movement of the USD/JPY pair remained bearish throughout the day. After moving in a consolidation phase for the previous two days, the USD/JPY pair finally found a trend to follow on Wednesday and dropped below 107.06 level. The bearish trend of USD/JPY was because of the risk-off market sentiment.

At 4:50 GMT, the Trade Balance of Japan for May showed a deficit of 0.6T against the expected 0.68T and supported the Japanese Yen. The strength of the Japanese Yen dragged the pair USD/JPY lower on Wednesday.

The downward trend was then supported by the U.S. economic docket, which released negative or flat results. At 17:30 GMT, the Building permits for May from the U.S. came flat with the expectations of 1.22M. The Housing Starts in May dropped to 0.97Mfrom the expected 1.10M and weighed on the U.S. dollar.

The decreased housing starts weighed on the U.S. dollar and dragged the USD/JPY prices further. In his second round of testimony to Congress, the Fed Chair, Jerome Powell, told the lawmakers that the U.S. economy was beginning to recover from the worst of coronavirus crisis. He added that to provide support to 25M jobless Americans with ongoing pandemic will need more help.

He said that with interest rates remain near zero for an extended period, the U.S. central bank would have to continue to buy bonds to make the longer-term borrowing cost lower. Powell also said for Congress to extend in some form the extra $600 weekly payments to the unemployed people that were the part of the relief package which was passed in March and will expire in July.

Congress has already allocated 3T USD for coronavirus related economic aid, and the U.S. central bank has also pumped trillions of dollars of credit into the economy to support the economy through the pandemic crisis.

On the other hand, the rising geopolitical tensions in Asia between India and China over their disputed border. The site left 20 Indian soldiers dead in a fistfight and an unspecific number of Chinese casualties.

Meanwhile, the tensions between North Kore and South Korea also escalated after North Korea blew up the de facto embassy of South Korea near both nation’s highly armed border on Tuesday and threatened to send troops. These geopolitical tensions faded away from the market’s risk sentiment, which weighed on USD/JPY, and the pair posted losses on Wednesday.

The risk-off market sentiment was further bolstered by the recent lockdown measures imposed in 29 communities of Beijing to control the increasing number of virus cases. Meanwhile, the Fed Chairman Jerome Powell presented a gloomy outlook for a road to recovery of the U.S. economy and faded away from the optimism of V-shaped global economic recovery, which also weighed on USD/JPY pair.

Daily Support and Resistance    

  • R3 108
  • R2 107.82
  • R1 107.57

Pivot Point 107.39

  • S1 107.14
  • S2 106.96
  • S3 106.71

USD/JPY – Trading Tips

The USD/JPY pair is trading at 106.914 level as it continues trading sideways in a wide trading range of 107.620 – 106.630. It failed to break above an immediate resistance level of 107.580. This level is working as resistance for USD/JPY, and the 50 periods EMA is also prolonging strong resistance at 107.580 zones while immediate support lingers nearby 106.600. The USDJPY bearish trend can trigger a sell-off unto the next support level of the 106.017 level today. Let’s wait for the USD/JPY to test the 107.650 level before entering a sell in the USD/JPY. 

Good luck! 

Categories
Forex Fundamental Analysis

Ease of Doing Business – Comprehending This Macro-Economic Indicator

What is the ‘Ease of Doing Business Index?’

The ease of doing business index was created jointly by two leading economists, namely Simeon Djankov and Gerhard Pohl from the Central and Eastern sector of the World Bank Group. It is an aggregate number that includes different parameters that define the ease of doing business in a country. The ease of doing business (EODB) measures the country’s position in offering the best regulatory practices. Though the World Bank started publishing the reports in 2003, the ranking only started only in 2006.

The EODB study captures the experience of small and medium-sized companies in a country with their regulators and the relationship with their customers, by measuring time, costs, and red tape they deal with. The goal of the World Bank is to provide an objective basis for understanding and to improve the regulatory environment for businesses worldwide.

Methodology

The survey consists of a questionnaire made by a team of experts with the assistance of academic advisors. The questionnaire consists of feedback on business cases that cover topics such as business location, size, and nature of its operations. This survey’s motive is to collect information that is affecting their business and not to measure conditions such as the nation’s proximity to large markets, quality of infrastructure, interest rates, and inflation.

The next step of the data-gathering process involves over 12,500 expert contributors such as lawyers and accountants from 190 countries in the survey to interact with the Doing Business team in conference calls, written reviews, and visits by the global team. Respondents fill out the surveys and provide information relevant to laws, regulations, and different fees charged.

A nation’s ranking is decided after assessing the following factors:

  • Starting a business – idea, time, procedure, and capital required to open a new business
  • Construction permits – permissions, land, and cost to build a warehouse
  • Electricity access – procedure, time and cost needed to obtain an electricity connection from the electricity board
  • Property registration- procedure, time, and cost required to register the warehouse with the local government body
  • Getting credit and loan – the process involved in getting credit from banks, and depth of credit information index
  • Investor protection – the extent of disclosure, liability, and ease of shareholder suits
  • Payment of taxes – tax filing process, preparation of tax filing and number of taxes paid
  • Cross border trading – number of documents required, and cost for import and export
  • Enforcing contracts – procedure, time, and cost to impose debt contract
  • Insolvency process – time, cost and recovery rate under a bankruptcy proceeding

Based on the score obtained in the above sub-indices, a country is assigned a rank in the ease of doing business index. The ease of doing business report is a complete assessment of competitiveness or the business environment. Still, rather it should be considered as a proxy of the regulatory framework faced by the private sector before starting a new business.

The Economic Reports

The ease of doing business reports is an annual report published by a team led by Djankov in 2003. The report is then elaborated by the World Bank Group that basically measures the costs firm is incurring for business operations. The World Bank report is, in fact, an important knowledgeable product in the field of private sector development. It has also motivated the design of various regulatory reforms in developing countries. The study presents a detailed study of costs, time, and procedures that a private firm is subject to before opening the company. This then creates rankings for a country.

Impact on Currency

The Doing Business report is used by policymakers, politicians and development experts, journalists, and, most importantly, the fund managers to understand the easiness of starting a business in the country. More companies mean more jobs, and more jobs mean faster development. Growth in the economy is directly related to the companies’ performance and the opening of new businesses. Therefore, when regulations are eased for starting a business, it contributes to the GDP of the country longer and increases the value of the currency in the international market.

Sources of information on Ease of Doing Business 

The ease of doing business report is one of the most sought reports in the finance industry, so many financial institutions and economic websites give mention ranking of a country after collecting the data from official sources. However, the data published by the World Bank is the most reliable and factual.

Sources

GBP (Sterling) – https://tradingeconomics.com/united-kingdom/ease-of-doing-business

AUD – https://tradingeconomics.com/australia/ease-of-doing-business

USD – https://tradingeconomics.com/united-states/ease-of-doing-business

CAD – https://tradingeconomics.com/canada/ease-of-doing-business

CHF – https://tradingeconomics.com/switzerland/ease-of-doing-business

JPY – https://tradingeconomics.com/japan/ease-of-doing-business

NZD – https://tradingeconomics.com/new-zealand/ease-of-doing-business

Ease of Doing Business report is one of the most discussed issues around the world. The report that is issued by the World Bank gets a lot of attention from the government around the world. For country authorities, it sheds light on regulatory aspects of their business climate. For business representatives, it helps initiate debates and dialogue about reform.

The private sector creates pressure on the respective government to ensure required reforms to indirectly improve the country’s rank in the EODB index. Investors take the decision of investment in a country based on the ranking of that country in the ease of doing business report. From the World Bank’s point of view, it demonstrates an unconditional ability to provide knowledge and resource information. This exercise by the World Bank generates information that is useful and relevant.

Impact due to news release

In the previous section of the article, we understood the definition of ‘Ease of Doing Business’ and the methodology used for ranking a country. Now we will extend our discussion in identifying the impact of the news announcement on the value of a currency. Many case studies tell correlation exists between ease of doing business and FDI flows.

One study finds that judicial independence and labor market flexibility are significantly associated with FDI flows. The number of procedures required to start a business and strength of the arbitration regime both have a significant and robust effect on FDI. Due to these reasons, foreign investors always invest in an economy where business activities can be carried out without any obstructions.

In today’s lesson, we will analyze the impact of ‘Ease of Doing Business’ on different currencies and analyze the change in volatility due to its news release. The below image is a graphical representation of Switzerland’s rank in 2018 and 2019. We see that the country had shown improvement in it’s ranking by two places. Let us find out the reaction of the market to this announcement.

USD/CHF | Before the announcement

Let us start with the USD/CHF currency pair to analyze the impact of the ‘Ease of Doing Business’ announcement. The above image is the daily time frame chart of the currency pair, where we can see that the pair is moving within a ‘range.’ Presently, the price is at a resistance area, which means sellers can push the price lower anytime soon. Therefore, we should be cautious before taking a ‘buy’ trade in this pair.

USD/CHF | After the announcement

After the news announcement, a slight amount of volatility is witnessed, which takes the price higher that results in the formation of a bullish ‘news candle.’ Since the Swiss Franc is on the left-hand side of the pair, a bullish candle indicates bearishness for the currency, and that is becoming weak. We can say that the news announcement a slight negative on the currency.

CAD/CHF | Before the announcement

CAD/CHF | After the announcement

The above images represent the CAD/CHF currency pair, where it appears that the market is moving in a channel before the news announcement. We should be looking to sell the currency pair as the price is at the top of the channel. However, the news announcement shall give us a clear direction of the market. We will not be taking any position before the news release as the news release has a moderate to high impact on the currency pair.

After the news announcement, the price moves a little higher and closes with some amount of bullishness. As the ‘ease of doing business’ was not so encouraging for the economy, traders went ‘short’ in Swiss Franc right after the news release. However, the effect does not last long, and the market collapses a couple of days later.

CHF/JPY | Before the announcement

CHF/JPY | After the announcement

The above images are that of the CHF/JPY currency pair, where we see a strong move to the upside before the news announcement, and currently, the price is at the resistance turned support area. There is a high chance of buyers becoming active at this point; hence, sell trades should be avoided.

After the news announcement, we witness some volatility in the market that takes the price lower but not by a lot. The impact was not great on this currency pair as the country slipped below by two places in the ‘ease of doing business’ ranking. When the impact of news settles down, one should start analyzing the pair technically and take the position accordingly.

That’s about the ‘Ease of Doing Business’ as an economic indicator and its relative impact on the Foreign Exchange market. Cheers!

Categories
Forex Market Analysis

Daily F.X. Analysis, June 17 – Top Trade Setups In Forex – FED Chair Testimony In Focus! 

On the news side, the CPI figures from the U.K. and Canada will be in focus. These may impact the GBP and Canadian related pairs today. Besides, a major focus will remain on the Fed Chair Powell Testimony, while he isn’t expected to do any change with an interest rate, but the recent series of positive data can make dollar bullish.

Economic Events to Watch Today


EUR/USD – Daily Analysis

The EUR/USD closed at 1.12637 after placing a high of 1.13532 and a low of 1.12276. Overall the movement of the EUR/USD remained bearish throughout the day. After touching a daily high of 1.1353 during the European trading hours, the EUR/USD pair reversed its run in the second half of the day and ended its day with losses. The pair moved into a consolidation phase after dropping 100 pips on Tuesday and posted a daily low below 1.1228.

Furthermore, the rising Treasury bond yields during the American session gave strength to the U.S. dollar after the release of U.S. economic data. The Dollar Index also rose along with the Wall Street Journal. The main indexes if WSJ opened a sharp higher and made the market move higher.

From the European side, at 10:59 GMT, the German Wholesale Price Index (WPI) showed a decline of 0.6%against the expected decline of 1.0% and supported Euro. At 11:00 GMT, the German Final CPI came in line with the expectations of -0.1% in May.

At 14:00 GMT, the ZEW Economic Sentiment index also rose to 58.6 from the expected 53.4 and supported Euro. The German ZEW Economic Sentiment also surged to 63.4 from the expected 60.0. During European trading hours, EUR/USD surged above 1.1353 level due to better than expected macroeconomic data release.

Meanwhile, the U.S. economic docket released the U.S. Retail Sales data for May on Tuesday, showing that the Retail Sales in May increased by 17.7% against the expected 5.5% and supported the U.S. dollar. The stronger U.S. dollar dragged the pair EUR/USD towards its daily lows. The U.S. Dollar Index rose by 0.4% on the day near 97.01, and the 10-year U.S. Treasury bond earned around 3.7% near 0.75%.

After the release of U.S. economic data, the EUR/USD pair started to follow and then remained depressive throughout the day. Jerome Powell, the Chairman of Federal Reserve, commented on the data and said that the Sales figure showed an increase in demand. However, Powell stressed that full economic recovery was uncertain until the public had confidence that the COVID-19 pandemic had controlled.

On Wednesday, European traders will look forward to the release of the Consumer Price Index from Europe, and later in the day, Powell’s testimony will continue for the second day of the semi-annual monetary policy report.

Daily Support and Resistance

  • R3 1.1462
  • R2 1.1408
  • R1 1.1336

Pivot Point 1.1282

  • S1 1.1211
  • S2 1.1156
  • S3 1.1085

EUR/USD– Trading Tip

The EUR/USD is trading at 1.1340, having violated the double top resistance level of 1.1280 level. The extension of a bullish trend can lead the EUR/USD prices further higher until the next target level of 1.1330 level. The MACD and RSI are suggesting bullish bias in the pair, and this bullish bias can help traders to capture a quick buy trade over 1.1270 level today until the next target level of 1.1380, only if 1.1330 gets violated. While support stays at 1.1280 and below this, the next support will stay around 1.1267. 


GBP/USD – Daily Analysis

The GBP/USD closed at 1.25722 after placing a high of 1.26873 and a low of 1.25524. Overall the movement of GBP/USD pair remained bearish. The pair in its earlier trading hours on Tuesday moved higher and followed the previous day’s trend and surged to 1.26800 level on the fresh hopes about Brexit negotiations. However, the gains were changed into losses after the concerns related to the second wave of coronavirus infections rose and strengthened the safe-haven U.S. dollar against its main rivals like GBP.

The pair rose on Monday and earlier Tuesday after the optimism surrounding Brexit talks emerged. The U.K. & E.U. committed to approaching the next meeting with new energy and aimed to avoid an unorderly exit from the bloc in December. The Unemployment Rate from the U.K. supported the surge in GBP on Tuesday. The unemployment rate in the U.K. during April decreased from 4.7%of expectations to 3.9% and supported Pound.

However, the pair GBP/USD started to move in the opposite direction after the release of Claimant Count Change that was closely watched by the investors on Tuesday. In May, 528.9K jobless benefits claims made in Great Britain against the expected 405.3K that depressed the GBP and dragged the pair GB/USD with itself.

The U.S. dollar also remained stronger across the board due to multiple factors. One included the better than expected U.S. economic data release included Retail Sales. The Retail Sales in May increased to 17.7% from the expected 5.5% and supported the U.S. dollar.

The strength of the U.S. dollar further dragged the currency pair. The GBP/USD down that day. The fresh concerns about the second wave of coronavirus in China led towards the renewed emergency lockdown after the increasing number of coronavirus cases in Beijing was another reason behind the strength of the safe-haven U.S. dollar on Tuesday was 

The downfall of the GBP/USD pair could also be attributed to the political front where no news came out of the recent round of talks between PM Boris Johnson and E.U. commission.

Later in the week, the Bank of England rate decision will also release in which another massive increase in quantitative easing is expected. There are chances of some talks about negative interest rates by Governor Bailey, given the upside-down condition of the market.

Daily Support and Resistance

  • R3 1.2794
  • R2 1.2741
  • R1 1.2659

Pivot Point 1.2606

  • S1 1.2524
  • S2 1.2471
  • S3 1.2388

GBP/USD– Trading Tip

The GBP/USD is trading at a level of 1.2580, holding right above a next support level of 1.2550. Continuation of a bullish trend requires the cable to break above 1.2585 level first. The 50 periods EMA is weighting on Sterlin gat 1.2585 level while the RSI and MACD are holding in the bearish zone. Although they are very close to crossover into the bullish zone, so we should wait for a bullish breakout before taking a buy trades. By the way, a bullish breakout of 1.2585 level can extend to buying until the next target level of the level of 1.2685, while bearish breakout of 1.2545 level can lead Sterling to be lower towards 1.2475. 


USD/JPY – Daily Analysis

The USD/JPY pair was closed at 107.314 after placing a high of 107.639 and a low of 107.210. Overall the movement of the USD/JPY pair remained flat throughout the day. The USD/JPY pair remained range bound and did not give any specific movement on Tuesday as the market mood was mixed due to mixed fundamentals.

The Bank of Japan kept its monetary policy steady on Tuesday and signaled that it had taken enough steps in support of economic growth. BoJ has stuck with its view that the economy will gradually recover from the pandemic. BoJ, in its monetary policy meeting, increased the nominal size of its lending packages for cash strapped firms to $1 trillion from about $700 billion announced last month.

The increased lending program from Japan added strength to the Japanese Yen and dragged the pair USD/JPY on Tuesday. While the Chairman of Federal Reserve Jerome Powell warned on Tuesday that the U.S. economy was facing a deep downturn with significant uncertainty about the time and strength of a recovery. He was worried that the longer the recession would last, the worse the damage would be on the job market and businesses.

Powell, in his testimony to Congress, stresses that the Fed was committed to using its all financial tools to lessen the economic damage from the coronavirus crisis. But he was concerned and said that until the public was satisfied that the virus has been contained, the chances for a full recovery were unlikely. He also warned that a downturn for a longer period could impose severe damage, especially to low-income workers who already have been hit hardest.

Daily Support and Resistance    

  • R3 108
  • R2 107.82
  • R1 107.57

Pivot Point 107.39

  • S1 107.14
  • S2 106.96
  • S3 106.71

USD/JPY – Trading Tips

On Wednesday, the USD/JPY continues to follow previously discussed technical levels. The Japanese pair is trading sideways as it failed to break above an immediate resistance level of 107.580. This level is working as resistance for USD/JPY, and the 50 periods EMA is also prolonging strong resistance at 107.580 zones while immediate support lingers nearby 106.600. The bearish trend in the USD/JPY pair can trigger a sell-off unto the next support level of the 106.017 level today. Let’s wait for the USD/JPY to test the 107.650 level before entering a sell in the USD/JPY. 

Good luck! 

Categories
Crypto Market Analysis

Daily Crypto Review, Jun 17 – Craig Wright Called a Thief or a Fraud by the Ex CEO of Mt. Gox

The crypto market has taken its time to consolidate throughout the day, as well as possibly test nearest resistance levels. Bitcoin is currently trading for $9,447, which represents an increase of 0.56% on the day. Meanwhile, Ethereum gained 1.6% on the day, while XRP lost 0.07%.

SwissBorg took the position of today’s biggest daily gainer, with gains of 30.87%. DigiByte lost 6.96% of its daily value, making it the most prominent daily loser.

Bitcoin’s dominance stayed at the same place since we last reported, with its value currently at 65.32%. This value represents a 0.2% difference to the downside when compared to yesterday’s value.

The cryptocurrency market capitalization increased over the course of the day, with the market’s current value being $267.99 billion. This value represents an increase of $2.35 billion when compared to the value it had yesterday.

What happened in the past 24 hours

Craig Wright called a liar or a thief by Mark Karpeles

Former CEO of Mt. Gox Mark Karpeles claims that the 80,000 Bitcoin that Dr. Craig Wright lays claim to was actually stolen from the Mt. Gox exchange in March 2011. This claim isn’t just empty words, as cryptocurrency experts side with Karpeles. The Bitcoin residing at one of the addresses that Craig Wright listed among the numerous addresses he supposedly owns was stolen from Mt. Gox.

Karpeles said, “This was confirmed in 2011, and records are a part of court documents available publicly.”

_______________________________________________________________________

Technical analysis

_______________________________________________________________________

Bitcoin

The largest cryptocurrency by market capitalization spent the past 24 hours trying to consolidate above $9,251 as well as to test the $9,580 resistance level for a brief amount of time. The resistance was strong, and Bitcoin couldn’t break it, which continued its consolidation within a range bound by $9,251 and $9,580.


Bitcoin’s volume decreased after the recovery bull run ended, while its RSI level currently stagnates at around 51.

Key levels to the upside Key levels to the downside

1: $9,580 1: $9,251

2: $9,735 2: $9,120

3: $9,870 3: $8,980

Ethereum

Ethereum seems to have had a solid day, not only recovering from the plunge but slowly rising in price as well. However, the most recent sentiment shows that bears are testing how far they can go. Whether bears manage to drive ETH’s price down a bit or not, there’s still a long way until the $225.4 support level.


Ethereum’s volume lower and lower as the time passes, while its RSI level hovers below the value of 50.

Key levels to the upside Key levels to the downside

1: $240 1: $225.4

2: $251.4 2: $217.6

3: $198

Ripple

XRP had a decent day as well, as the price drop ended after the price hit the red descending line and bounced from it. The third-largest cryptocurrency by market cap managed to get back above $0.19 (which is, as we mentioned yesterday, a big deal for XRP) and consolidate above it. The line got tested once, without much success for the bears.


XRP’s volume is a bit below the weekly average (after excluding the volume bumps for upward and downward spikes), while its RSI level is just below 50.

Key levels to the upside Key levels to the downside

1: $0.2 1: $0.19

2: $0.205 2: $0.178

3: $0.214


Categories
Forex Videos

Fundamental Analysis For Novices – Fed Interest Rate Decision

FOMCFundamental Analysis For Novices – Fed Interest Rate Decision

Thank you for joining the fundamental analysis for novices educational video. In this session, we are going to be talking about the federal reserve interest rate decision.

So what is it, and how can you trade it?


Professional Traders keep a careful eye on their economic calendars, and you should do the same, paying particular attention to the daily activity of economic release information, especially as you plan your day or week ahead, with regard to trading.

The critical information is the time of release, the name of the event, the impact that it is likely to have upon release into the marketplace, the previous data release, and the consensus of professional economists and analysts as to what the figure is likely to be.


The US fed interest rate decision, as seen here, is released to the market at 7 PM BST, and is subject to an embargo. The impact of status is a full red bar on this particular calendar, and in fact, this economic release is one of the most important data releases, and especially at this time during the coronavirus pandemic.
The Federal Open Market Committee or FOMC is the branch of the Federal Reserve Board that has the power to set monetary policy and alter interest rates for the United States.
The FOMC comprises of the board of governors and includes seven members and five federal reserve bank presidents.
The board of governors of the Federal Reserve, which is also known as the Central Bank for the United States, meet at intervals of 5 to 8-weeks, and this is where they decide to set their interest rates, where this will have effects on loans and advances to commercial banks in the United States, especially if they are changed.


The interest rate decision is simultaneously released with the FOMC’s economic projections, monthly budget statement, and, more importantly, the fed’s monetary policy statement.


Thirty minutes later, there is an FOMC press conference to explain the rationale behind the decisions for any changes interest rate changes, or not, as the case may be, and also to explain the monthly monetary policy.
The conference lasts for around an hour and includes a prepared statement, and then the floor is opened to press questions that are unscripted and often leads to market volatility as traders and analysts try to decipher future policy decisions and directions.

How to trade fed interest rate decisions?

Firstly, pay particular attention to the consensus. Deviations from the consensus can cause market volatility.

As a rule of thumb, When the Fed increases interest rates, it typically tends to attract investors to buy dollars because they get a better yield from the higher interest rate. This is typically better for the economy.
On the other hand, a rate cut is seen as a sign of a poor economy with inflationary headaches for the FOMC, and in turn, investors tend to move out of Dollars, and this weakens the local currency.
Always trade this economic data released with extreme caution because it will typically cause extreme volatility, and sometimes this may not occur until the FOMC press conference and especially when the board member is answering questions from the press. Wait for a trend to develop and pick an opportunity to join it.

Categories
Forex Daily Topic Forex Fundamental Analysis

Understanding The Importance Of ‘Terms Of Trade’ As A Macro Economic Indicator

Introduction

Terms of Trade is a direct and useful measure of an economy’s International Trade health and gives us a good measure of how fast capital is moving in or out of the country. Terms of Trade make analyzing Balance Of Payments and, more specifically, Current Account Balance easier. Understanding of Terms of Trade can help us better analyze the current liquidity of the economy and its changes in a more crude way.

What are Terms Of Trade Indices?

Terms of Trade is the ratio of its Export Prices and Import Prices. It is the ratio of money received on exports to money spent on imports. If there is an individual’s analogy to be made, then it would be the ratio of an individual’s monthly income to his monthly expenses. Mathematically, it would be the number of export goods that can be purchased per unit of import.

Terms of Trade ratio expressed in percentages, and hence the ratio is multiplied by a hundred. A TOT figure above100 indicates that the country is receiving more on its exports than on its income and vice-versa.

When a country has a TOT figure of more than 100, it means that it is receiving more capital on exports compared to sending capital out on imports. Hence, on an overall basis, capital is flowing into the country. Higher the ratio, the faster the rate at which capital flows into the country. It ultimately translates to the pace at which a country is becoming wealthy and liquid.

When a country has a TOT figure less than 100, it means capital is flowing out of the economy, and its import expenses exceed that of its export revenue generated. Continued periods of TOT figures less than 100 will drive the economy to a vicious debt cycle from which recovery may be difficult. The ratio will tell us how fast the capital is depleting from the economy and is nearing a financial crisis. Countries prefer to have a ratio above 100.

The ratio tells us the rate at which the economy is accumulating capital. On the global market place and International Trade, the ratio will determine what portion of the world’s wealth goes to each country. In other words, based on the demand and supply on the international markets, the ratio will tell us how profits from international trade will be distributed amongst the participating countries.

How can the Terms Of Trade numbers be used for analysis?

Since TOT is a ratio change in TOT, figures can imply multiple things. An improvement in TOT figure could mean:

  1. Export prices have increased in contrast to Import prices being stagnant or dropped.
  2. Export prices would have dropped but not as sharply as import prices. Both dropped but not to the same degree.
  3. Export prices would have stayed the same while Import prices would have dropped.

All the above scenarios can lead to an improvement in the TOT figure. Hence, simple changes in TOT figures cannot be directly used to draw economic conclusions. It is crucial to understand the factors that have resulted in a change in TOT numbers. It is crucial to know whether the change is a consequence of a short-term shock or development or a consistent long-term trend that will persist throughout the coming periods.

TOT is susceptible to multiple economic factors, some of which are:

Exchange rate: A decrease in exchange rate adversely affects imports and benefits exports and vice versa. Imports become costly, and exports become cheap, adversely affecting TOT.

Inflation: The inflation rate across different economies and different sectors affect different economies having different export and import portfolios. For example, a sharp increase in Iron Ore prices can greatly benefit Australia, whose chief exports are Iron Ore, while it can affect importing countries like China and Japan adversely. So inflation across sectors have different impacts across economies and within the country amongst different sectors.

Demand and Supply: Increase in demand, coupled with the availability of those resources also affects TOT as exports and imports are a function of demand and supply. Scarcity increases prices and oversupply decreases the same.

Quality of Produce: Size and quality affect the pricing of products. A high-quality product is likely to cost more and benefit the exporter more. Hence, the portfolio of the country’s exports and imports determines the TOT fluctuations of different product grades.

Trade Tariffs: Protectionist strategies from Governments lead to putting trade barriers on imports. The political and trade ties between countries can also affect the long term trend of TOT figures for a given economy.

Portfolio of Exports and Imports: What types of Goods and Services a country exports and imports also matter. Countries that export goods and services that are more of primary importance (ex: food and energy) tend to always have high demand and TOT ratio more than 100 both within the economy and on the global economy.

Impact on Currency

When the TOT figure is above a hundred, it implies domestic currency is flowing into the country and creating a deficiency in the global market. Hence, higher TOT figures will increase its currency demand and thereby leading to currency appreciation. On the other hand, a continued TOT less than 100 indicates the world is being supplied with domestic currency and therefore leads to currency depreciation.

It is a coincident indicator and is more useful as a long-term trend indicator rather than short-term changes. The indicators affecting TOT would have been identified through Trade agreements or other media sources in general and hence, is a mild-impact indicator.

Economic Reports 

The Bureau of Economic Analysis publishes its TOT figures in the National Income and Product Accounts every quarter of the year on its official website. Below is a figure for an illustration of the same:

We can also find the aggregated TOT reports for the OECD countries on the official website. The World Bank also aggregates and maintains TOT data for most countries on its official website.

Sources of Terms Of Trade

For the US, we can find the Terms of Trade in their National Income and Product Accounts here:

BEA – National Income and Product Accounts

OECD – Terms Of Trade

World Bank – TOT

We can also find Terms of Trade Index for many countries categorized here.

Impact of the ‘Capacity Utilization’ news release on the price charts

In the previous section of the article, we learned the Terms of Trade economic indicator and understood its significance in an economy. The ToT Index measures the ratio of an export to the price of an import, per commodity. A country that heavily relies heavily on exports, this number gives an important hint of the nation’s growth. Even though the Terms of Trade is useful in determining the balance of trade in a country, it does not have a major influence on the GDP of the economy. Therefore, investors don’t give much importance to the data during the fundamental analysis of a currency.

Today, we will be analyzing the impact on Terms of Trade on different pairs and witness the change in volatility due to the news release. The below image shows the latest Terms of Trade data of New Zealand that indicates an increase in the value compared to the previous quarter. A higher than expected reading is considered to be positive for the currency while a lower than expected reading is considered as negative. Let’s see how the market reacted to this data.

NZD/USD | Before the announcement:

We shall start with the NZD/USD currency pair to examine the impact of Terms of Trade on the New Zealand dollar. In the above price chart, we see that the market is in a strong downtrend before the news announcement with increased volatility. Currently, the price is at a key technical area, which is known as the ‘demand’ area, and hence we can expect buyers to come in the market at any moment. Thus, once needs to be cautious before taking a ‘short’ trade.

NZD/USD | After the announcement:

After the news announcement, the market moves lower and volatility increases to the downside. The Terms of Trade data showed an increase in the total percentage, but this was not good enough for the market players who apparently took the price down and weakened the New Zealand dollar. Although the ‘News Candle’ closes in red at the time of release, it gets immediately taken over by a bullish candle, as this was a ‘demand’ area.

NZD/JPY | Before the announcement:

NZD/JPY | After the announcement:

The above images represent the NZD/JPY currency pair, where we see that the characteristics of the chart are similar to that of the above-discussed pair. Before the news announcement, here too, the market is in a strong downtrend, and the volatility appears to be high on the downside. One thing that is different in this pair is that the price is presently at its lowest point and seems to have made a ‘lower low.’ This means New Zealand is weaker in this pair.

After the news announcement, market crashes and the price drops sharply. The Terms of Trade has a similar impact on the pair, where we see a further increase in volatility to the downside. Again. the weakness does not sustain, and the price shows a large bullish candle after the ‘news candle.’

NZD/CAD  | Before the announcement:


NZD/CAD  | After the announcement:

Lastly, we shall discuss the impact on the NZD/CAD currency pair and observe the change in volatility. Here, we see that the market is continuously moving lower before the news announcement indicating a great amount of weakness in the New Zealand dollar. Just before the news release, the price seems to be approaching the ‘demand’ area, which can possibly change the trend for a while by initiating some bullishness in the pair.

The Terms of Trade news announcement gets lukewarm from the reaction where the price initially moves higher little and finally closes forming a ‘Doji’ candlestick pattern. The news release leads to further weakening of the currency where the volatility expands on the downside.

That’s about ‘Terms Of Trade’ and its impact on the Forex market after its news release. If you have any questions, please let us know in the comments below. Good luck!

Categories
Forex Market Analysis

Daily F.X. Analysis, June 16 – Top Trade Setups In Forex – Eyes on U.S. Retail Sales! 

On the news front, the eyes will remain on the U.K. Jobless Claims and U.S. Retail sales data. Both of the events are expected to perform better than before, but traders are highly doubtful due to lockdown, the numbers can get worse and drive selling trends in the GBP during the European session and USD during the New York session. The yield on U.S. 10 year Treasuries jumped as traders favored risk to the safety of bonds. Furthermore, on Tuesday, Fed Chair Jerome Powell will testify before the virtual hearing of the Senate Banking Committee, and traders will look forward to it for fresh impetus.

Economic Events to Watch Today


EUR/USD – Daily Analysis

The EUR/USD pair closed at 1.13255 after placing a high of 1.13323and a low of 1.12263. Overall the price action of the EUR/USD remained bullish throughout the trading day, although the EUR/USD pushed lower at the end of last week. After the risk sentiment increased on Monday, the pair EUR/USD reversed its movement and started posting gains. 

In earlier sessions’ the U.S. dollar was strong, which kept a lid on EUR/USD pair’s upward movement, but in the late session, the U.S. dollar lost its pace, and the currency pair EUR/USD started to move higher. The U.S. Dollar Index, which gauges the value of the U.S. dollar against the basket of six currencies, spent most of its day in positive territory above 97.00 level but it turned negative in the second half of the day and helped EUR/USD to start posting gains.

On the data front, at 14:00 GMT, the Trade Balance from Eurozone showed a surplus of only 1.2B against the expected 20.3 B in April and weighed on Euro. From the American side, the only data from the U.S. was New York’s Empire State Manufacturing Index, which rose to -0.2 from the expected -30.0 and supported the U.S. dollar.

In the Late session on Monday, Federal Reserve announced that it would begin broad buying of corporate bonds and debts, which boosted the risk appetite in the market and perceived EUR. The air EUR/USD recovered almost all of its previous day’s losses on the back of U.S. dollar weakness after the Fed’s announcement.

According to the Fed, it would start purchasing investment-grade U.S. corporate bonds in a view to secure companies and ensure credit market liquidity due to coronavirus crisis. After this news, risk sentiment was back in the economy, and the EUR/USD pair moved higher. After the Fed announcement, the yield on U.S. 10 year Treasuries jumped as traders favored risk to the safety of bonds. Furthermore, on Tuesday, Fed Chair Jerome Powell will testify before the virtual hearing of the Senate Banking Committee, and traders will look forward to it for fresh impetus.

Daily Support and Resistance

  • R3 1.1293
  • R2 1.1275
  • R1 1.1263

Pivot Point 1.1245

  • S1 1.1233
  • S2 1.1215
  • S3 1.1203

EUR/USD– Trading Tip

The EUR/USD pair is trading at 1.1340, having violated the double top resistance level of 1.1328 level. The continuation of a bullish trend can lead the EUR/USD prices further higher until the next target level of 1.1380 level. The MACD and RSI are suggesting bullish bias in the pair, and this bullish bias can help traders to capture a quick buy trade over 1.1328 level today until the next target level of 1.1380. While support stays at 1.1328 and below this, the next support will stay around 1.1267. 


GBP/USD – Daily Analysis

The GBP/USD pair was closed at 1.26059 after placing a high of 1.26063 and a low of 1.24539. Overall the movement of GBP/USD pair remained bullish throughout the day. The Pound jumped from session lows against the dollar on Monday as the U.K. & Brussels agreed to boost up post-Brexit talks. PM Boris Johnson gave hope that the end of next month could reach an outline of a deal.

The lack of progress in negotiations following the latest round of talks between the U.K. & European Union, PM Boris Johnson said that he would personally work with the E.U. to find common ground to break the deadlock. Britain left the European Union in January, but it is still under transition period until 2020 when it should strike a deal over its future trade, travel, security, and financial relations with Europe. Many rounds of trade talks between trade representatives from both parties failed to secure a deal, and then PM Boris Johnson decided to do it himself.

On Monday, PM Boris Johnson held talks with Brussels chief Ursula von der Leyen, and Charles Michael as the European Union finally acknowledged the rejection of the U.K. overextension of the transition period. Both parties have agreed that new momentum in the countdown period to secure a deal was required. Brussels formally accepted that the U.K. would not seek an extension to the transition period, and both parties agreed on work to conclude an agreement by the end of the year. It means both parties are hopeful that an agreement could be reached before the year-end.

The PM Boris Johnson added on Monday after his video conference with E.U. members that there was no reason not to agree to the Brexit deal’s outline by the end of July. E.U. has suggested October 31 as the latest date for a deal to reach. In the time from October to the end of the transition period in December, member states will back and ratify the deal.

The optimism about the Brexit deal gave a push to British Pound, and the pair GBP/USD surged and recovered its previous day’s losses on Monday.

On the other hand, after the announcement of the Federal Reserve to start buying corporate bonds in the secondary market to overcome the losses U.S. economy faced in the coronavirus crisis, the U.S. dollar turned weak and added in the currency pair’s gains.

Daily Support and Resistance

  • R3 1.2593
  • R2 1.2568
  • R1 1.2538

Pivot Point 1.2512

  • S1 1.2482
  • S2 1.2456
  • S3 1.2426

GBP/USD– Trading Tip

On Tuesday, the GBP/USD pair is trading with a bullish bias around 1.2650, but the recent candles seem to peak out of the upward regression channel, which may drive selling in the market. The pair is most likely to find resistance around 1.2707 level, and continuation of a selling trend below this level can lead the pair lower towards 1.2595 and 1.2550 Conversely, a bullish breakout of 1.2707 level can extend buying trend until 1.2805 level in upcoming days. 


USD/JPY – Daily Analysis

The USD/JPY was closed at 107.353 after placing a high of 107.552 and a low of 106.583. Overall the movement of USD/JPY remained bullish throughout the day. The USD/JPY gained strength after posting losses for the previous four consecutive days. The stronger U.S. dollar and negative macroeconomic data release from Japan might have added in the strength of this pair USD/JPY.

At 9:30 GMT, the Revised Industrial Production from Japan in April was declined by 9.8% against the forecasted 9.1% and weighed on Japanese Yen and moved the pair USD/JPY in the upward direction on Friday.

The brighter market sentiment due to come back of risk appetite in the market after the possibility of renewed lockdowns increased due to increased fears over the second wave of coronavirus outbreak.

The fears of the renewed spread of virus grew after the U.S. reported more than 2 million coronavirus cases as of June 12, and the infection cases were reported from the most populous states of America. The high level of new infections was reported from California, Texas, and Florida, which raised the possibility of a new wave of COVID-19 and prompted risk aversion.

Risk appetite increased the demand for the U.S. dollar across the board as the bar for renewed restrictions of lockdown raised. Federal Reserve has already announced that the road to economic recovery will be longer than expected, which indicated more need for stimulus packaged from governments.

However, the U.S. Dollar Index was up to 97 levels on Friday, and the strength of the U.S. dollar pushed the USD/JPY pair above 107.5 level.

Another factor aiding in the U.S. dollar’s strength was better than expected macroeconomic data from the USA. At 19:00 GMT, the Prelim Consumer Sentiment from the University of Michigan (UoM) surged to 78.9 in June from the expected 75.0 and supported the U.S. dollar. The Import Prices in May also increased by 1.0% from 0.6% of forecast and supported the U.S. dollar. The Prelim UoM Inflation expectation in June was reported as 3.0%.

Daily Support and Resistance    

  • R3 107.93
  • R2 107.75
  • R1 107.54

Pivot Point 107.36

  • S1 107.15
  • S2 106.97
  • S3 106.75

USD/JPY – Trading Tips

The USD/JPY pair is trading sideways as it failed to break above an immediate resistance level of 107.500. This level is working as resistance for USD/JPY, and the 50 periods EMA is also prolonging strong resistance at 107.650 zones while immediate support lingers nearby 106.600. The bearish trend in the USD/JPY pair can trigger a sell-off unto the next support level of the 106.017 level today. Let’s wait for the USD/JPY to test the 107.650 level before entering a sell in the USD/JPY today. 

Good luck! 

Categories
Crypto Market Analysis

Daily Crypto Review, Jun 16 – BTC Whale Count Back To Dec 2017 Levels; BTC Back Above $9,000

The crypto market has taken the day to restore its price level to the pre-drop of June 15. Bitcoin is currently trading for $9,386, which represents an increase of 1.46% on the day. Meanwhile, Ethereum lost 0.05% on the day, while XRP gained 1.85%.

Verge took the position of today’s biggest daily gainer, with gains of 21.03%. Flexacoin lost 13.05% of its daily value, making it the most prominent daily loser.

Bitcoin’s dominance stayed at exactly the same place since we last reported, with its value currently at 65.52%. This value represents a 0% difference when compared to yesterday’s value.

The cryptocurrency market capitalization increased over the course of the day, with the market’s current value being $265.64 billion. This value represents an increase of $11.37 billion when compared to the value it had yesterday.

What happened in the past 24 hours

Bitcoin whales returning to pre-December 2017 pump levels

The number of investors that are holding an immense amount of Bitcoin (otherwise known as Bitcoin whales) is starting to approach the level that the crypto community hadn’t seen since the 2017 levels when Bitcoin rallied to $20,000.

According to Glassnode’s report dating June 15, we can see steady growth in the number of Bitcoin whales (traders holding over 1000 BTC) since April 2019.

_______________________________________________________________________

Technical analysis

_______________________________________________________________________

Bitcoin

The largest cryptocurrency by market capitalization managed to return to its pre-price drop level, reaching back above $9,000. Bitcoin has skipped the $9,120 and $9,251 levels as well, currently stabilizing between $9,251 and $9,580.


Bitcoin’s volume increased during the rally but returned to the previous levels, while the RSI level increased to 50.

Key levels to the upside                    Key levels to the downside

1: $9,580                                           1: $9,120

2: $9,735                                           2: $9,251

3: $9,870                                            3: $8,980

Ethereum

Ethereum also had a correction over the day, bouncing above the $225.4 and trying to consolidate. However, the price action looks like the $225.4 level will be tested to the downside. If it stays strong, traders will have a chance to possibly enter a strong position towards the upside from there.


Ethereum’s volume increased both during the price spike as well as in general. Its RSI level is currently at 43.5.

Key levels to the upside                    Key levels to the downside

1: $240                                               1: $225.4

2: $251.4                                           2: $217.6

                                                           3: $198

Ripple

XRP moved back above the $0.19 during the day, which represents a great bullish sign for it. Unlike with Bitcoin and Ethereum, XRP doesn’t have many support levels below $0.178, and dropping below it would be extremely bearish. However, the recent price increase returned XRP’s price to pre-price drop levels.


XRP’s volume returned to average after a slight increase due to the price increase, while its RSI level came to 50.

Key levels to the upside                    Key levels to the downside

1: $0.2                                              1: $0.19

2: $0.205                                            2: $0.178

3: $0.214                                          


Categories
Forex Videos

Forex Fundamental Analysis For Novices Exports & Trade Balance

Fundamental Analysis For Novices Exports & Trade Balance

Thank you for joining our educational video on fundamental analysis for novices. In this presentation, we will be looking at exports and trade balance. Today we will be looking at a snapshot of this data as it is due on an economic calendar and pertaining to the country of Germany.


The best way to approach trading is to plan your day and week in advance, and one of the best tools that you can utilise here is the economic calendar, which is provided by most brokers.


Always check that you are looking at the correct day’s economic releases.


Always keep a careful eye out for the level of impact for any data release pertaining to the financial asset which you want to trade. The more importance attached to the impact, the greater amount of volatility which could occur after it’s release.


In this example, we will be looking for a couple of days ahead to Tuesday, June 9th, and paying particular interest to German imports and exports and trade balance.
As we can see here, we are expecting for economic data releases for German exports, month on month for April, where the impact is low and where we have a previous month of March coming in at – 11.8 with a consensus of – 5% expected for the release at 7:AM CEST.
The trade balance for April has more significance associated to it, where we can see a 12.8 billion euros surplus for the month of March and where this is anticipated to rise to 18.9 billion Euros by economists and analysts.

So what do all these mean for the German economy and also for the Euro currency?
Firstly the information is collected and released by Statistisches Bundesamt Germany and is subject to an embargo.
The first segment exports, which is expected to come in at – 5% for April, provides details of All goods and services which were exported i.e., sold outside of the country of Germany.
Countries’ exports are extremely important to their economy because it influences the level of economic growth and provides a picture of employment. The bigger the export figure, the healthier an economy is likely to be.
In the post-war period, lower transportation costs have made it much cheaper to export to other countries around the globe. This globalization, as it is known, has an effect of making international trade far easier.

The second element is the trade balance, and this is more important, and this has a greater impact significance because now we are looking at the difference between what a country exports and what it imports.
Germany is the biggest economy within the Eurozone. Typically it exports more than it imports.

Therefore traders and economists will be looking for a positive figure on release because this shows that there is a trade surplus. A negative value would show a trade deficit.
The next segment is the current account, which measures the difference in value between exported and imported goods, services, and cross border interest payments. It also includes payments to overseas investors and other payments, such as foreign aid.
Again we are looking for a surplus or a deficit, which will show whether the country is a net exporter, which is good for their economy, and thus the Euro, or if it is a net importer of goods and services, which is bad for their economy and thus the Euro currency exchange rate.
The last segment is imports month on month for April. This provides a percentage plus or minus for the value of imports of goods and services from countries outside of Germany for the previous month.

How to trade Exports and trade data releases. Remember, a negative value on the trade balance shows more goods are being imported than exported; this is bad for an economy and affects growth. As a result, the Euro might depreciate against other currencies. Conversely, if there is a trade surplus, the opposite should apply.

The economic data release is similar for all countries, and the methodology to trading its release applies to all. Look out for data that is out of sync with the general consensus, as this might cause shock waves in terms of market volatility.

Economies do better when they export more than they import, and this is the basic premise to trading this type of data.

Categories
Forex Fundamental Analysis

What Is ‘Services PMI’? How Important Is It In Assessing A Nation’s Economy?

Introduction

The Services Purchasing Manager’s Index is an excellent leading or advanced macroeconomic indicator, which is used widely to predict economic expansion or contractions. It has various applications for economists, investors, and traders. This indicator predicts inflation, GDP, and the unemployment rate of an economy. Hence, understanding of Services PMI can be hugely beneficial for a trader’s fundamental analysis. 

What is Services PMI?

The Services Purchasing Manager’s Index, also called the Non-Manufacturing Index (NMI), is a survey of about 400 largest non-manufacturers in the United States of America. The word non-manufacturing here implies that the study is associated with the industries that do not produce physical goods; instead, they provide services. Non-physical goods mean the services provided by the IT and software giants like Microsoft and Google etc. The services PMI has fewer survey questions than the manufacturing PMI as some questions, such as inventories, not being relevant to many service providers.

The Services PMI was born more out of a need to accommodate the changing world due to the technological advancements in the last few decades. For most developed nations like the United States, the Service sector contributes more than the Manufacturing industry due to which it had to be taken into account to predict economic trends more accurately.

Purchasing Managers in a company are the purchasing and supply executives associated with procuring the required goods and services that are necessary for running the company. For example, A software company’s Purchasing Manager would typically be in charge of contacting and getting the best internet service provider for the entire company at the lowest or best prices from the market.

They may also be responsible for tie-ups with fellow software companies to get the required software to run their operations. The purchasing Managers have a decent idea of what a company needs, and during what periods these requirements change.

How is the Services PMI calculated?

The Services PMI hence is a compilation of the survey answers given by the Purchasing Managers of the largest 400 non-manufacturing companies of about 60 sectors in the USA. The questions typically asked in the study are related to month-over-month changes in the Business Activity, New orders, Deliveries, and Inventories with equal weightage, as shown in the table below:

All the four categories, as seen when putting together, form the NMI. These four components are enough to ascertain a growth or contraction in the business activity of that company.

The rating of Services PMI range between 0-100. A score > 50 indicates an expansion of economic activity in the non-manufacturing sector. Likewise, a score < 50 indicates contraction.

How can the Services PMI be Used for Analysis?

The data of ISM NMI Reports on Business goes back to 2008 due to which the levels of confidence in the data set may be lower than that of Manufacturing PMI; nonetheless, it is no less effective in ascertaining economic figures like GDP, inflation and employment, etc.

The Non-Manufacturing sector of the United States makes up 80% of the total GDP, and hence the Services PMI is a significant economic indicator in that regard. The Non-Manufacturing sector primarily drives the macroeconomic numbers like the GDP. Together the NMI and PMI cover more than 90% of the industrial sectors that contribute to GDP; hence Services PMI is a must for fundamental analysis.

The correlation between the ISM NMI Data and real GDP is about 85%, which is pretty good. The main advantage of studying Services PMI is that it is an advanced economic indicator. It predicts the real GDP a year ahead, which is commendable.

Below is a snapshot of Services PMI plotted against the real GDP growth rate historically, and we can see the strong correlation existing between them. This explains the importance of these leading indicators in the fundamental analysis of traders.

Impact on Currency

The impact of Services PMI on the currencies is as same as the impact of Manufacturing PMI. You can find this information here.

Sources of Services PMI Reports

We can monitor the NMI reports on the official website of the ISM official website. We can also go through the NMI of other countries from the IHS Markit official website on a subscription basis.

Impact of the ‘Services PMI’ news release on the price charts

The Flash PMI, like Manufacturing PMI, measures the activity level of purchasing managers but that in the services sector. This report is based on surveys taken by the officials covering 300 business executives in the private sector services companies. Traders keep a close watch on the services PMI data as the decisions of Purchasing managers give early access to data about the company’s overall performance, which in turn acts as an indicator of the economy.

Since the services PMI only gives an insight into the performance of the service sector, it does not directly affect the economy. Therefore, the impact of the data on currency is quite less. But traders, build and liquidate some positions in the market based on the PMI data.

The below image shows the previous and latest Services PMI data of Australia, where we see a decrease in the value of the same for the month of February, and now we will analyze the impact it created on the Australian dollar. A higher reading than forecasted is considered to be bullish for the currency while a reading lower than what is forecasted must be considered negative.

AUD/JPY | Before the announcement:

We begin with the AUD/JPY currency pair, where, in the above image, we see that pair is an uptrend before the news announcement. The volatility is high, and the price is making a new ‘higher high.’ As the impact of the PMI data is less, positive data should take the currency higher, and negative PMI data might result in a short-term downtrend. It is preferable to trade the above pair if we come to encounter the second situation as it could essentially result in a retracement of the uptrend, which can be used to join the trend.

AUD/JPY | After the announcement:

After the PMI data is released, owing to a decrease in the PMI number and this immediately is followed by some buying pressure. This is where we can understand the impact of the indicator on a currency where initially due to poor PMI data, the price falls, but it could not even go below the moving average. Thus, one can take this opportunity to join the major trend by trading the retracement, which was brought in due to the bad news. Since the uptrend is strong, one can hold on their trades as long as the market shows signs of reversal.

EUR/AUD | Before the announcement:

EUR/AUD | After the announcement:

The above images represent the EUR/AUD currency pair, and the reason why the chart is going down is that the Australian dollar is on the right-hand side. The chart characteristics almost appear to be the same as in the above pair, but the volatility on the downside is more violent and strong, indicating more strength in the Australian dollar. The only way to trade the pair is the market pulls back and gives us an opportunity to enter, which is the typical way of trading a trend.

After the news release, volatility expands on the upside due to weak PMI data, and the market moves higher. This change in volatility can be used as an opportunity to enter for a ‘sell’ expecting a continuation of the downtrend. This is how the impact of the news can be used to our advantage.

AUD/HKD | Before the announcement:

AUD/HKD | After the announcement:

The next currency pair we will be discussing is the AUD/HKD, and since the Australian dollar is on the left-hand side, the market should move up if the currency gets strong. But here the market is more range-bound, and there is no clear trend. Before the news announcement, price is exactly at the ‘resistance’ area, and soon after the outcome, the price could either try to break out or fall from the ‘resistance.’

After the news announcement, we see that volatility increases on the downside, and later it slows down. This low impact could be signing that traders may not sell at the ‘resistance,’ and thus, it can breakout. If you are an aggressive trader, consider going ‘long’ in the market with a tight stop loss below the recent ‘low.’

That’s about ‘Services PMI’ and the relative impact of its news release on the Forex market. Good luck!

Categories
Forex Market Analysis

Daily F.X. Analysis, June 15 – Top Trade Setups In Forex – Stronger Dollar In Play! 

 On Monday, the fears of the renewed spread of virus grew after the U.S. reported more than 2 million coronavirus cases as of June 12, and the infection cases were reported from the most populous states of America. The high level of new infections was reported from California, Texas, and Florida, which raised the possibility of a new wave of COVID-19 and prompted risk aversion.

Risk appetite increased the demand for the U.S. dollar across the board as the bar for renewed restrictions of lockdown raised. Federal Reserve has already announced that the road to economic recovery will be longer than expected, which indicated more need for stimulus packaged from governments.

Economic Events to Watch Today


EUR/USD – Daily Analysis

The EUR/USD pair closed at 1.12563 after placing a high of 1.13403 and a low of 1.12124. Overall the movement of the EUR/USD pair remained bearish throughout the day. At 11:45 GMT, the French Final CPI for May came in as 0.1% against the expected 0.0% and supported Euro. At 13:00 GMT, the Italian Quarterly Unemployment Rate came in as 8.9% against the expected 8.8% and weighed on Euro. At 14:00 GMT, the Industrial Production in April was declined by 17.1% against the forecasted decline of 19.0% and weighed on Euro.

Poor than expected macroeconomic data from Eurozone weighed on shared currency Euro and dragged the pair EUR/USD to one week’s lowest level near 1.1212. On the other hand, the greenback was stronger on Friday, and the U.S. Dollar Index (DXY) jumped to 97.15 level. The strength of the U.S. dollar also added to the downfall of the EUR/USD currency pair at the ending day of the week.

From the American side, at 17:30 GMT, the Import Prices in May were surged by 1.0%, which were previously forecasted to increase by 0.6% and supported the U.S. dollar. At 19:00 GMT, the Prelim UoM Consumer Sentiment increased to 78.9 from the anticipated 75.0 in June and supported the U.S. dollar. The Prelim UoM Inflation Expectations decreased to 3.0% from previous months’ 3.2% in June and supported the U.S. dollar. After better than expected data from the American side, the pair EUR/USD was further dragged down towards its six day’s lowest level.

Furthermore, the Commissioner President of the European Union, Von der Leyen, will meet the Prime Minister of the United Kingdom, Boris Johnson, on Monday to revive the talks related to the post-Brexit deal. So far, there hasn’t been much progress on a free-trade agreement between U.K. & Brussels while there is not much time left to extend the deadline for a deal till end-2020.

However, on Thursday and Friday this week, the E.U. leaders will meet to discuss the proposed recovery fund to overcome the economic damage caused by the pandemic. All members except the Frugal Four I,e Netherland, Austria, Demark, and Sweden, support the recovery fund. All member’s acceptance is needed for the recovery fund to succeed, and any delay will be a major setback for the shared currency Euro.

Daily Support and Resistance

  • R3 1.1293
  • R2 1.1275
  • R1 1.1263

Pivot Point 1.1245

  • S1 1.1233
  • S2 1.1215
  • S3 1.1203

EUR/USD– Trading Tip

The EUR/USD pair is trading at 1.1260 level, having entered into the oversold zone. Today, we can expect bullish correction until 1.1270 and 1.1290 levels, which marks 50% and 61.8% Fibonacci retracement levels. Below these levels, the EUR/USD pair can show selling bias again as the 50 EMA can pressure the pair for selling. On the lower side, support continues to hold around 1.12250 and 1.1208.


GBP/USD – Daily Analysis

The GBP/USD pair was closed at 1.25414 after placing a high of 1.26533 and a low of 1.24735. Overall the movement of GBP/USD pair remained bearish throughout the day. The GBP/USD pair was dropped to its lowest of 8 days on Friday due to mediocre than expected economic data release and U.S. dollar strength. At the ending day of the week, British Pound dropped against the U.S. dollar after the British GDP contracted by a quarter year-on-year in April.

At 11:00 GMT, the Gross Domestic Product (GDP) in April from the United Kingdom was dropped to -20.4% from the expected -18.6% and weighed on GBP. The Manufacturing Production for April also dropped to negative 24.3% from the expectations of -15.0% and weighed on British Pound.

The Industrial Production in April was dropped to -20.3% against the forecasted -15.0% and added in the weight of British Pound. However, at 11:02 GMT, the Goods Trade Balance for April showed a deficit of 7.5B against the forecasted deficit of 11.0B and supported Pound.

At 11:03 GMT, the Construction Output in April was recorder to decline by 40.1% against the forecasted 240% decline and weighed on British Pound. However, the Index of Services was declined by 9.9% against the expected decline of 10.6%.

At 13:30 GMT, the Consumer Inflation Expectations for the United Kingdom were dropped to 2.9% for this quarter from 3.0% of the previous quarter. At 18:08 GMT, the Institute of Economic and Social Research (NIESR) Estimate for GDP in May was -17.6% against the previous months’ -10.3%. At 18:30 GMT, the C.B. Leading Index for April was dropped by 2.9% from the previous month’s 1.2%.

The poor-than-expected macroeconomic data from Great Britain exerted negative pressure on British Pound and dragged the pair to its one week’s lowest level below 1.2500 level.

Apart from negative macroeconomic data, the uncertainty surrounding Brexit also weighed on British Pound on Friday ahead of the PM Boris Johnson’s video conference with European Council President Charles Michel, European Commission President, Ursula von der Leyen and European Parliament President David Sassoli on Monday.

The lack of progress in Brexit talks with Brussels and the calls to review the policy options, including negative interest rates by BoE has also been lagging in the recovery of Pound. Ahead of the BoE meeting, it has already been confirmed on Friday that U.K.’s economy has contracted by 20.4% in April. This means that BoE will likely announce further easing in its policy next week. The current purchase plan of BOE comprises 200 Billion GBP, which is likely to extend further in the next meeting.

Furthermore, the latest round of talks with Brussels failed to deliver any significant progress in the post-Brexit trade deal, which has raised the odds for a no-deal exit from the E.U. As the transition period will expire on January 1, 2021.

On the other hand, from the American Side, the Prelim Consumer Sentiment from the University of Michigan increased in June to 78.9 from the expected 75.0 and supported the U.S. dollar. The U.S. dollar was already strong in the market, and after this release, it exerted even more pressure on the GBP/USD pair.

Daily Support and Resistance

  • R3 1.2593
  • R2 1.2568
  • R1 1.2538

Pivot Point 1.2512

  • S1 1.2482
  • S2 1.2456
  • S3 1.2426

GBP/USD– Trading Tip

The GBP/USD pair is trading with a bearish bias at a depth of 1.2470, following a downward channel extending resistance around the value of 1.2540. On the 4 hour timeframe, the Cable has entered the oversold zone as we can see the RSI and MACD both were holding below 20 and below 0 levels, respectively. On the lower side, the Cable may find initial support at a level of 1.2385 after the violation of 1.2455 level. On the higher side, the GBP/USD prices may find resistance at 1.2543 area today. Let’s consider sell positions below 1.2450 level. 


USD/JPY – Daily Analysis

The USD/JPY was closed at 107.353 after placing a high of 107.552 and a low of 106.583. Overall the movement of USD/JPY remained bullish throughout the day. The USD/JPY gained strength after posting losses for the previous four consecutive days. The stronger U.S. dollar and negative macroeconomic data release from Japan might have added in the strength of this pair USD/JPY.

At 9:30 GMT, the Revised Industrial Production from Japan in April was declined by 9.8% against the forecasted 9.1% and weighed on Japanese Yen and moved the pair USD/JPY in the upward direction on Friday.

The brighter market sentiment due to come back of risk appetite in the market after the possibility of renewed lockdowns increased due to increased fears over the second wave of coronavirus outbreak.

The fears of the renewed spread of virus grew after the U.S. reported more than 2 million coronavirus cases as of June 12, and the infection cases were reported from the most populous states of America. The high level of new infections was reported from California, Texas, and Florida, which raised the possibility of a new wave of COVID-19 and prompted risk aversion.

Risk appetite increased the demand for the U.S. dollar across the board as the bar for renewed restrictions of lockdown raised. Federal Reserve has already announced that the road to economic recovery will be longer than expected, which indicated more need for stimulus packaged from governments.

However, the U.S. Dollar Index was up to 97 levels on Friday, and the strength of the U.S. dollar pushed the USD/JPY pair above 107.5 level.

Another factor aiding in the U.S. dollar’s strength was better than expected macroeconomic data from the USA. At 19:00 GMT, the Prelim Consumer Sentiment from the University of Michigan (UoM) surged to 78.9 in June from the expected 75.0 and supported the U.S. dollar. The Import Prices in May also increased by 1.0% from 0.6% of forecast and supported the U.S. dollar. The Prelim UoM Inflation expectation in June was reported as 3.0%.

Daily Support and Resistance    

  • R3 107.93
  • R2 107.75
  • R1 107.54

Pivot Point 107.36

  • S1 107.15
  • S2 106.97
  • S3 106.75

USD/JPY – Trading Tips

The USD/JPY pair fell sharply after violating the upward channel, which supported the pair around 107.500. For now, this level is working as resistance for USD/JPY. The 50 periods EMA is also extending strong resistance at 107.650 area while immediate support stays around 106.600. The bearish trend in the USD/JPY pair can trigger a sell-off until the next support level of the 106.017 level today. Let’s wait for the market to test the 107.650 level before entering a sell in the USD/JPY today. 

Good luck! 

Categories
Crypto Market Analysis

Daily Crypto Review, Jun 15 – Bitcoin Under $9,000; What Happens Next?

The crypto market has been relatively stable over the weekend only to drop in the past couple of hours. Bitcoin fell under $9,000, which brought other cryptos’ prices down. Bitcoin is currently trading for $8,962, which represents a decrease of 4.47% on the day. Meanwhile, Ethereum lost 6.13% on the day, while XRP lost 4.34%.

Flexacoin took the position of today’s biggest daily gainer, with gains of 18.57%. Loopring lost 17.68% of its daily value, making it the most prominent daily loser.

Bitcoin’s dominance stayed at the same place since we last reported, with its value currently at 65.52%. This value represents a 0.24% difference to the upside when compared to Friday’s value.

The cryptocurrency market capitalization decreased over the course of the weekend, with the market’s current value being $254.27 billion. This value represents a decrease of $10.24 billion when compared to the value it had on Friday.

What happened in the past 24 hours

Bitcoin transaction fee average decreased by 91%

The average fee for Bitcoin transactions has dropped under the $1 mark, meaning it is back to levels previously seen only before the Bitcoin reward halving.

According to data shown by the crypto analytics website BitInfoCharts, Bitcoin transaction fees decreased by 91% from May 20 until June 14. With the fees going down from $6.65 to $0.56, we can certainly see the improvement in the tx fee department of Bitcoin.

_______________________________________________________________________

Technical analysis

_______________________________________________________________________

Bitcoin

The largest cryptocurrency by market capitalization had a slow weekend of consolidation after the 11 June price drop. While many analysts were suggesting a bull run, Bitcoin dropped in price yet again, this time below $9,000. The move reached $8,900 before stabilizing between $9,980 and $9,120 level.


Bitcoin’s volume seems to be following a pattern of decreasing its volume from day to day until a spike happens, which brings its volume up.

Key levels to the upside                    Key levels to the downside

1: $9,120                                           1: $8,980

2: $9,251                                           2: $8,820

3: $9,580                                            3: $8,650

Ethereum

Ethereum has been pretty stable over the weekend and had low volatility as well as volume. Bitcoin’s move towards the downside dragged it down as well, pulling the price down to $217 levels. The $217.6 level held greatly, stopping the bearish move in its tracks.


Ethereum’s volume increased from almost non-existent to almost the levels of the June 11 price drop.

Key levels to the upside                    Key levels to the downside

1: $225.4                                            1: $217.6

2: $240                                              2: $198

3: $251.4                                            3: $193.6

Ripple

XRP spent the weekend performing slightly worse than the aforementioned Ethereum and Bitcoin, slowly losing value as it went towards the $0.19 level. However, the most recent price drop brought its price to $0.182 levels, where it was stopped by the long-term descending trend line.


XRP’s volume increased slightly as the bearish move occurred, while its RSI level entered the oversold territory.

Key levels to the upside                    Key levels to the downside

1: $0.19                                             1: $0.178

2: $0.2 

3: $0.205                                          


Categories
Forex Daily Topic Forex Fundamental Analysis

The Importance Of ‘Steel Production’ & Its Impact On The Forex Market

Introduction

Steel is a commodity of paramount importance in today’s international economy. Steel is a staple for the modern economy, and its wide range of usage from the tiniest needles to the largest bridges and tallest buildings makes it an essential commodity for economic prosperity.

Steel is no less critical than Food and Energy for today’s modern world. The far-reaching utility and demand thereof of Steel makes it a good economic indicator for us to understand its impact on exporting and importing economies.

What is Steel Production?

Iron and alloying elements like carbon, chromium, manganese, nickel, and vanadium are added to produce different types of Steel.  Steel industry began in the late 1850s before which it was an expensive commodity that was exclusively used for armors and cutleries primarily.

After the invention of the Bessemer and open-hearth process, Steel Production became easier. By the 1860-70s, the steel industry started to grow rapidly and continues to do so even today. Steel is the most sought after commodity for its durability and strength. It is used for building heavy machinery in the world, like in cars and engines. The natural abundance of Iron and Carbon makes it an affordable commodity for large scale production and supply.

Today Steel is mainly produced through techniques called basic oxygen steelmaking and Direct Reduced Iron (DRI) in an electric arc furnace. Steel’s unique magnetic properties make it an accessible material to recover from the waste for recycling. Steel retains its properties even after undergoing many recycling processes. Hence, it is reusable and economical.

How can the Steel Production numbers be used for analysis?

On a standalone basis, the steel industry directly contributes about 3.8% to the total global GDP as per 2017 research. The indirect impacts meaning the industries that depend on steel production, contribute 10.7% to the global GDP.

The importance of Steel Production apart from its utility is that the supply chain of Steel is very long. The number of dependent industries way more than any other industry. As per 2017’s research by Oxford Economics for every two jobs added in the steel sector, 13 additional jobs are supported through its worldwide supply chain. About 40 million people work in this supply chain of Steel. Indirectly it supported 259 million jobs worldwide and was worth 8.2 trillion dollars in 2017.

Steel is a critical input in the work of many other industrial sectors that produce items essential for the economy to function like hand tools, complex factory machines, Lorries, trains, railway tracks, and aircraft. It is apart from the countless items from day-to-day life like cutlery, tables, cars, bikes, etc. Hence, the economic activity goes beyond the steel-producing locations to multiple sectors across countries. Some of the primary industries that use Steel are Construction, Electronic, Transportation, Automotive, Mechanical Equipment, Energy Production and Distribution, Food and Water, Tools, and Machinery industries.

As the demand for Steel continues to rise, the exporting countries would be at a more significant advantage in terms of economic growth, as evident by below ongoing historical trend.

(Source – worldsteel.org)

Below are the rankings of major economies ranked in terms of exports and imports

(Source – worldsteel.org)

Hence, countries that are net exporters of Steel would be at a higher economic advantage in terms of its own consumption needs and revenue generation through exports. As economies continue to improve the standard of living of their population, the demand for Steel will continue to increase.

Developing economies like China and India have tapped into this market and increased their Steel production over the last decade to achieve export-led-growth. As evident from the above statistics, the developed economies like the United States and the European Union continue to be a net importer while developing economies China and Japan are the leading exporters of the same.

Significant changes in the Steel Production figures will, therefore, have adverse effects on the exporting and importing economy. Hence, Steel Production directly influences economic performance and, therefore, the currency value of that economy.

Impact on Currency 

Steel production is a proportional indicator. An increase in production is beneficial for the economy and thereby for the currency. Steel is a global commodity produced worldwide. Hence, Steel Production figures are useful in identifying the long term megatrends and newly developing Steel industries that will have long term impact.

The short-term fluctuations within the Steel Industry itself would be recorded through other more extensive indicators like Industrial Production (IP) Index in the United States. It is a low impact indicator and is more useful for making long-term sector-wise investment strategies.

Economic Reports

The World Steel Association represents about 85% of the total steel producers across the world. It aims to find global solutions to the environmental challenge to identify trends and bring together regional and national steel producers.

It publishes monthly and annual reports on steel production figures comparing economies in terms of exports, imports, contributions to global GDP on its official website. The monthly reports are usually published in the last week of a month for the previous month.

Sources of Steel Production

The WSA monthly press releases are available here. Statistical figures of global economies are available here and here. The worldwide statistical figures are also available here. The economic impact of Steel is also reported by the American Iron and Steel Institute here.

Impact of the ‘Steel Production’ news release on the Forex market

We saw how Steel Production plays a vital role in an economy with both economic and social impact. Steel is one of the essential materials for the construction of buildings and the manufacturing of many other materials. It creates opportunities in the innovation sector and in research & development projects around the world. Given such a wide range of applications, it is apparent that it has a fair amount of impact on the economy and on the currency. An in-depth analysis revealed that in 2017, the steel industry sold 2.5 trillion worth of products and created U.S. $500 billion value. The steel industry also supports and facilitates 96 million jobs globally.

In this article, we will be analyzing the impact of U.K. Steel Production on the British Pound and witness the change in volatility during the official news announcement. The below image shows the latest Steel Production data in the U.K. produced in the month of April. A higher than expected reading is taken to be bullish for the currency. Contrarily, a lower than expected reading is considered to be negative.

GBP/USD | Before the announcement:

We shall start with the GBP/USD currency pair for examining the impact on the British Pound. In the above price chart, it is clear that the overall trend of the market is down, but recently the price has pulled back quite deep. This is an indication that the downtrend may be coming to an end, and this could turn into a reversal. We will take a suitable position in the market based on the news release.

GBP/USD | After the announcement:

After the news announcement, volatility increases on the downside in the beginning, but later, the price reverses and closes in the green. The buyers push the price higher owing to positive Steel Production data, and the price forms a ‘hammer’ candlestick pattern. The Steel Production news release produced moderate volatility in the currency pair and, lastly, strengthened the British Pound. We need to be careful before taking a ‘buy’ trade as the major trend is down, and the impact of this news is not long-lasting.

GBP/AUD | Before the announcement:

GBP/AUD | After the announcement:

The above images represent the GBP/AUD currency pair. Before the news announcement, the market is in a strong downtrend, and recently the price has pulled back is very gradual in nature. The price action suggests that the market might continue its downtrend and so we will be looking to sell the currency pair after noticing some trend continuation patterns.

After the news announcement, the price reacts mildly to the news data where it nor sharply moves higher nor crashes below. The Steel Production has a slightly positive impact on the pair and lately the volatility to the upside. One should not forget that traders do not give much importance to this data, so one cannot expect the market to continue moving higher. As long as we don’t see trend reversal patterns in the market, an uptrend is far away.

GBP/CHF | Before the announcement:

GBP/CHF | After the announcement:

The above images are that of the GBP/CHF currency pair, where we see that the market is in a downtrend, and lately, the price is has retraced to the ‘resistance’ area. With this, the market has also shown some trend continuation patterns indicating that the downtrend will continue at any moment. If the news release does not change the structure of the chart, this can be an ideal chart pattern for taking a ‘short’ trade.

After the news announcement, the price initially falls lower, but buyers immediately take the price higher, and the candle closes with a wick on the bottom. Although the volatility is low after the announcement, the market is moving on both the directions and produces a neutral effect on the currency pair.

That’s about ‘Steel Production’ and its impact on the Forex market after its news release. If you have any questions, please let us know in the comments below. Good luck!

Categories
Forex Videos

Fundamental Analysis For Novices! Redbook Index!

Fundamental Analysis For Novices: Redbook Index

Welcome to the educational video for novices on fundamental analysis. In this video, we will be looking at the Redbook index.
So what is the Redbook index, and how can it help you trading forex?


Successful traders keep a close eye on their economic calendar. They review it at least once a day. This is a typical calendar which is provided by most brokers.


The information that you are looking for is the type of economic event, the time of its scheduled release, which is usually subject to an embargo, and the impact that it is likely to have upon its release. You will also be able to look at the previous weekly, monthly, quarterly or annual release of this data if applicable, and you will be able to study the consensus value which will have been put together by economists and analysts and whereby this is the figure which is generally expected by the market upon its release.


Here we can see that on Tuesday the 9th of June at 13:55 BST, the red book index year on year and month on month is scheduled for release.
The Johnson’s Redbook index is a sales-weighted proprietary indicator as released by Redbook research incorporated in the United States since 1964. This indicator only applies to the US, where it represents the weekly, monthly, quarterly, and annual sales activity of 9000 stores. The data is released every Tuesday at the same time to its subscribers via a conference call or an email prior to its public release. The data forms 80% of the total data as collated in this sector and is officially released into the market by the US Department of Commerce.
Although it is a private indicator, it is closely watched by traders on Wall Street, including the Forex community, because it identifies trends in the short to medium term relating to the retail sector.

The stock market finds this information useful because it ranks retailers across categories including apparel, books, toys and hobbies, department stores, discount stores, footwear, furniture, drug stores, home Improvements, home furnishers, electronics, jewelry, and sporting goods and miscellaneous.
But all traders recognize that it provides an advance warning of changes in consumer spending that, in turn, affect the business growth in this sector and shows warning signs of inflation fluctuations and interest rates.


So, how to trade the Redbook Index?
Information is provided on a percentage basis, and we can see that the previous figures for year on year and month on month were minus figures, and this is related to the coronavirus epidemic. If the actual numbers are released and as percentage terms are worse than the previous numbers shown here, this would be considered to be bad for the US economy, and therefore bad or bearish for the US Dollar. Conversely, should the numbers come in higher than the previous numbers, this would show a pickup in retail sales and a continuing overall trend in the upturn of the US economy, which is filtering through at the moment, and therefore this would be good or bullish for the US dollar.

Categories
Forex Fundamental Analysis

How Does The ‘Private Sector Credit’ Data Impacts The Foreign Exchange Market?

Introduction

Changes in Private Sector Credit and the nominal values can be used to assess the recent economic stability and oncoming trend. It is an indicator of economic health and can be used as a broad metric to know the overall economy’s liquidity and rate of economic growth. Hence, Private Sector Credit can be utilized as an economic indicator for our fundamental analysis to double-check our current assessments and forecasts.

What is the Private Sector Credit?

As the name suggests, Private Sector Credit refers to the financial resources provided to the Private Industry in the form of loans, securities, or other forms of capital by the financial institutions like Commercial banks, finance companies, or other financial institutions, etc.

How can the Private Sector Credit numbers be used for analysis?

Private Sector Credit is affected by the following factors:

Interest Rates – Higher interest rates from financial institutions can discourage private business firms from taking credit. As the credit becomes “expensive,” it drives out the small businesses’ chances of obtaining credit. Only the top-tier institutions may be able to borrow the credit. The Interest Rates that are prevalent in the market is influenced by the Central Bank’s interest rates. In the United States, it is called the Fed Funds Rate. Hence, Central Authorities also play a key role in loan affordability for the private sector.

A loose monetary policy, where Central Banks inject money into the market through open market operations (purchasing bonds, securities), increases the liquidity of the banking sector, which slowly passes on to other sectors of the economy. It decreases the overall Bank Lending Rates and encourages people and businesses to avail credit. It is generally called a dovish approach.

In a tight monetary policy, Central Banks withdraw money from the economy by selling bonds, securities to decrease liquidity. It results in Banks increasing their short-term interest rates. It encourages people to deposit and save more than borrow and spend. It is generally called a hawkish approach.

Credit Rating – Every individual and corporation has a credit rating that tells the worthiness of the candidate for credit. It measures the risk associated with defaulting on the credit. A high credit rating indicates the risk of default is very less, and banks would be willing to lend more, and even in some cases, at a lower rate. A bad credit rating, in most cases, prevents banks from lending, while some institutions may prefer to lend less, or at a higher interest rate than the market rate for the risk associated.

The Credit Rating is backward-looking; it looks at the candidate’s credit history. The good performance of the business is possible in a healthy economy and vice-versa. Hence, past economic health also influences current credit scores. Economic health, business performance, and credit ratings are interlinked, in a feedback loop, one affects the other.

Property Prices – Since Credits are mostly backed by collateral in the form of assets like real estate, or houses, an increase in the property prices creates a wealth effect. It gives a positive sentiment for the financial institutions to lend resources to the private sector, be it consumers or business firms.

Government Backing – When businesses are backed by Government support, lending is also easy. It is more observable in developing economies, where Governments actively support private businesses to boost employment rates, wage growth, and overall economic growth. The government in developing economies may assist in land acquisition for business set up or disburse loans at cheaper rates to the corporate firms.

Increase in Private Sector Credit indicates the financial institutions are confident about the past and current economic conditions and predict that the economic stability shall continue for the near future, at least. When the confidence of financial institutions is deteriorated by inflation fluctuations, unstable markets, banks increase deposit rate interests, to promote saving, thereby increasing their liquidity, and refrain from lending to a significant extent.

Tight lending environments are symptoms of a weak economic growth rate. An increase in the real GDP growth rate has been observed to be followed by increased Private Sector Credit. In turn, this increased credit helps businesses to increase employee staff, improve productivity. It overall increases economic activity and further assists in the GDP growth rate. Hence, both feed-off each other. Slowdowns also feed-off each other, and it accelerates the stagnation or economic downturn. In such cases, the Government or Central Bank intervention is crucial to keep the economy going.

Impact on Currency

In the context of currency markets, Private Sector Credit figures would be a backward-looking indicator (lagging or coincident indicator) as credit is issued if past business performance and current economic conditions are favorable. Hence, Private Sector Credit is a coincident indicator reflective of the current economic conditions.

The Private Sector Credit is not market sensitive, changes in the figures build up over time, and hence, it is a low impact indicator for predicting short-term currency moves within a 1-2 month time horizon. It is useful for assessing a long-term economic trend, though.

Economic Reports

The World Bank maintains the Domestic Credit to Private Sectors in the form of an online database on its official website. Statistics are added once individual countries’ statistics are reported.

For the United States, a weekly report of the Assets and Liabilities of Commercial Banks in the United States is released by the Federal Reserve, from which we can derive the Private Sector Credit information. The report is released every Friday at 4:15 PM.

Sources of Private Sector Credit

For the United States, Private Sector Credit data is maintained by the St. Louis FRED, and that information can be found here. World Bank Private Sector data is available here.

We can find Private Sector Credit statistics for many countries in nominal terms and as percentages of GDP here.

Impact of the ‘Private Sector Credit’ news release on the price charts

Now that we have a clear understanding of the Private Sector Credit economic indicator, we will now watch the impact of the news announcement on various currency pairs and analyze the data. Private loans measure the change in the total value of new loans issued to consumers and businesses in the private sector. To an extent, the allowances will determine the growth of the private sector.

Thus, the higher the government and banks lend to companies, the greater will be the development. The investor considers this data to be an important parameter when making large investment decisions in a currency or in the stock market. However, when it comes to short term movement of the currency, traders don’t pay a lot of attention to the data.

In today’s example, we will be analyzing the Private Sector Credit in the Eurozone and examine the change in volatility in major Euro pairs due to the announcement. A higher than expected reading should be positive for the currency while a lower than expected reading should be negative for the currency.

EUR/USD | Before the announcement:

We shall begin with the EUR/USD currency pair and examine the impact on this pair. In the above image, we see that the pair is in an uptrend, and just before the news announcement, the price has is at its highest point. Depending on the reaction of the market to the Private Sector Credit news, we will be able to take a position in the market.

EUR/USD | After the announcement:

After the news announcement, we witness a lukewarm reaction from the market, and there is hardly any change in volatility. This is because the Private Sector Credit was nearly the same as before with an increase in a mere 0.1%. This cannot be considered as a major boost to the private sector as the government and banks did not increase lending of loans by a vast percentage. As the impact was least, one can trade the pair on the ‘long’ side by joining the uptrend.

EUR/AUD | Before the announcement:

EUR/AUD | After the announcement:

The above images represent the EUR/NZD currency pair, where we see that before the news announcement, the market has displayed reversal patterns, and there is a possibility that the market might turn into a downtrend. If the news announcement does not increase the volatility to the upside and price does not cross above the moving average, one can some ‘short’ positions expecting a further downward move.

After the news announcement, the price moves higher by a tad bit, and the ‘news candle’ displays little volatility. As the price remains below the moving average and impact was not great, one can take a risk-free ‘short’ trade in the market with a stop-loss above the recent ‘high.’

EUR/CHF | Before the announcement:

EUR/CHF | After the announcement:

Finally, we will discuss the impact on the EUR/CHF currency pair. Here, we see that the overall trend of the market is up and recently the price has started moving in a ‘range.’ Before the news announcement, the price is at the bottom of the range, and thus a buying pressure can come back into the market at any moment. As the impact of Private Sector Credit is less, aggressive traders can ‘long’ position in the market as the price is at the lower end of the range.

After the news release, volatility expands on the upside, and the price closes with a huge amount of bullishness. The Private Sector Credit data proved to be very positive for this pair, which resulted in a sharp rise in the price to the higher side. After the close of ‘news candle,’ traders can go ‘long’ with stop loss below the support and a ‘take-profit’ at the resistance of the range. We cannot have a much higher ‘take-profit’ as the impact will not last long.

That’s about ‘Private Sector Credit’ and its impact on the Forex market after its news release. If you have any questions, please let us know in the comments below. Good luck!

Categories
Forex Assets

Trading The ‘LINK/USD’ Crypto Fiat Pair & Analyzing The Costs Involved

Introduction

Chainlink is a decentralized oracle network whose purpose is to connect smart contracts with the real world. LINK is its native digital currency, which is used to node operators on the Chainlink decentralized oracle network. LINK has a market capitalization of $1.5 billion and stands 14th on CoinMarketCap. LINK can be bought using fiat currency as well as traded against other cryptocurrencies like BTC and ETH.

Understanding LINK/USD

The price of LINK/USD depicts the value of the US Dollar equivalent to one Chainlink. It is quoted as 1 LINK per X USD. For example, if the market price of LINK/USD is 4.36166, then each LINK will be worth so many dollars.

LINK/USD specifications

Spread

Spread is nothing but the arithmetic difference between the buying and selling price of the cryptocurrency. Unlike forex brokers, these prices are decided by the traders and not the exchange. Hence, the spread constantly varies in exchange as well as across exchanges.

Fee

Typically, there are three types of the fee charged by exchanges including

  • Execution fee (Taker or Maker) – twice, for opening and closing the trade
  • 30-day trading volume fee
  • Margin opening fee, if applicable

Example

  • Long 1,000 LINK/USD at $4.45509
  • 30-day volume fee is $0
  • Order is executed as Taker
  • With Leverage

Total cost of the order = 1,000 x $4.45509 = $4455.09

Assuming the taker fee to be 0.26%, the opening fee will be – $4455.09 x 0.26% = $11.58

The margin opening fee of 0.02% is charged for opening the position using leverage – $4455.09 x 0.02% = $0.89

If the order is closed at $4.50000, the total cost of closing will be – 1,000 x $4.50000 = $4500.00. And the fee for closing will turn to be – $4500.00 x 0.26% = $11.70

Thus, the total fee will be the sum of all the fees – $11.58 + $0.89 + $11.70 = $24.17

Trading Range in LINK/USD

Chainlink is traded in cryptocurrency exchanges and not forex brokers. So, there is no concept of pip and pip value. Instead, the value of the crypto is directly taken into account.

A trading range is the tabular representation of the approximate value movement of the pair, which is obtained through the Average True Range (ATR) indicator. In layman terms, the numbers in the table depict the amount of US dollars a trader will gain or lose in a given time frame. The following table shows the value of the price movement for 1,000 quantities LINK/USD.

Note: the above values are for trading 1,000 units of LINK/USD. If X units of the pair are traded, then the ATR values will be,

(ATR value from the table / 1,000) x X units

Procedure to assess ATR values

  1. Add the ATR indicator to your chart.
  2. Set the period to 1
  3. Add a 200-period SMA to this indicator.
  4. Shrink the chart so you can assess an extensive period
  5. Select your desired timeframe
  6. Measure the floor level and set this value as the min
  7. Measure the level of the 200-period SMA and set this as the average
  8. Measure the peak levels and set this as Max.

LINK/USD Cost as a Percent of the Trading Range

Below are two tables representing cost variations for different time frames in terms of a percentage for taker execution and maker execution.

Taker Execution Model

Opening = $11.58 | Margin fee = $0.89 | Closing = $11.70 | 30-day volume = $0

Total fee = Opening + Margin fee + Closing + 30-day volume = $11.58 + $0.89 + $11.70 + $0 = $24.17

Maker Execution Model

Opening = $7.12 | Margin fee = $0.89 | Closing = $7.2 | 30-day volume = $0

Total fee = Opening + Margin fee + Closing + 30-day volume = $7.12 + $0.89 + $7.2 + $0 = $15.21

*Assuming maker fee to be 0.16% the trade value.

Interpretation of Cost as a Percent of the Trading Range

Let us directly understand the table with an example.

1H time frame

ATR value = 41.92

Cost percentage = 57.66%

4H time frame

ATR value = 92.32

Cost percentage = 26.18%

Comparing ATR values, we infer that more profit can be generated in the 4H time frame ($92.32) than in the 1H time frame ($41.92). But, a critical point to note is that the cost is the same for both the trades. A fee that is paid to gain $92.32, the equal fee must be paid to gain $41.92. This difference is represented using the cost percentage. Thus, the percentage in the 1H time frame is higher than that in the 4H time frame, indicating that the relative costs are higher.

Trading the LINK/USD

LINK can be traded against USD and few cryptocurrencies as well. However, LINK/USD is seen to have the highest trading volume. Comparing the liquidity with other cryptocurrency pairs like BTC/USD, ETH/USD, and XRP/USD, LINK/USD is less liquid.

From the above comprehension of the cost percentage, we understood that the costs remain the same irrespective of the time frame you trade. Thus, to relatively reduce the costs, we must focus on the columns of the table. The effective way to trade this pair is to enter the market when the volatility is at or above the average values. For example, if you are a day trader who trades the 1H time frame, you must make sure that the volatility is above the average level. In doing so, you will be able to extract more from the market for the same total fee. Cheers!

Categories
Forex Fundamental Analysis

Significance Of ‘Wage Growth’ As A Forex Fundamental Driver

Introduction

Wage Growth is an essential fundamental indicator that influences the GDP of a country, where the income of people of the country has a major say in the GDP calculation. So, even if Wage Growth does not directly affect the economy but shows its importance by affecting other economic indicators. In today’s article, we will understand how Wage Growth is measured and how it impacts the value of a currency indirectly.

What is Wage Growth?

Wage Growth is referred to the rise in wages of employees that is inflation-adjusted and is often expressed in percentage. It is a macroeconomic concept that determines the economic growth of a country in the longer-term, as it reflects the purchasing power of people in the economy and the living standards. A high wage growth implies price inflation in the economy, and low wage growth indicates deflation. A low wage growth scenario requires intervention from government agencies such as the Reserve Bank, which will stimulate the economy through changes in the fiscal policy.

One of the important ways of maximizing wage growth is through the re-skilling process and investing in the development of the skills of employees. When skilled workers are involved in the decision-making process, it leads to the growth of business and industry as a whole. Hence, more financial compensation can be given for skilled workers who not only lift wage growth but also stimulate competitiveness in the economy. This leads to higher productivity and, thus, GDP per worker.

Measuring Wage growth

The key drivers of Wage Growth are productivity and inflation expectations. Wage Growth that is relative to the increase in prices of commodities in the economy—also known as real wage growth—reflects labor productivity growth as well. However, there are several other factors in a business cycle that results in wage growth diverging from production growth.

There are two different ways of measuring real wages. One is from the producer perspective, while the other is from the consumer perspective. Producers fix their labor costs by calculating them relative to the price of their outputs. Consumers measure wage growth by comparing their income with the cost of goods and services they purchase. Thus, most countries examine real wage growth by adjusting it with the rate of inflation. In Australia, for example, real wage growth is determined by considering three parameters, including inflation, hourly wages, and the average number of working hours.

Factors affecting Wage Growth Rate

Today, wage payment is a crucial factor in influencing labor and management relations. Workers are worried about the annual rise in their wages as it affects their standard of living and purchasing power. Managements in some companies are not concerned about higher wages to their employees as they feel the cost of production will go up and their profits will decrease. Let us see some other factors that affect wage growth.

Demand and Supply

The labor market operates on the forces of demand and supply. When demand for a particular type of skilled workers is more, and there is less number of people skilled in that job, the wage growth rate will be high.

Government Regulation

In countries where the wages are very low, the government may pass legislation for fixing the minimum wages of workers. This will also ensure a minimum level of living. This is especially the case in underdeveloped countries where the bargaining power of laborers is weak.

Training and Development Cost

Before handing over the projects to employees, it is necessary to train them enough, so they are capable of doing the job with high skill. This process usually takes time and money, which the company has to bear. Hence this has an effect on the annual growth in wages of employees.

The Economic Reports

The Wage Growth Rate Reports are released annually and on a quarterly basis that covers the review of the data from the previous quarter to the current quarter. All the major economies of the world and some developing countries publish this data on a quarterly and yearly basis that money managers use for evaluating various performance metrics.

Analyzing the DATA

The Economic Data of Wage Growth is a major determiner of the GDP of a country and, thus, the economy. The GDP, as we know, is a key measure in determining the strength of a country’s economy and, thereby, the value of the currency. By comparing the year on year wage growth, we can predict the growth of the economy and improvements in the standard of living. One can also compare the Data of two countries and analyze why the country with higher Wage Growth has been able to achieve it. The monetary committee can note down the differences in the policies.

Impact on Currency

There is an indirect relation between Wage Growth and the value of a currency. When we see a growth in the wages of workers, this is said to increase industrial growth and overall productivity, which in turn improve the GDP of the country. Higher levels of GDP will generate a higher demand for the currency and will increase the economic activity of the country. However, when wages are stagnant and do not show any rise, this will decrease consumer spending and leads to lower living standards. Due to this, the GDP will be affected and will drive the currency lower.

Sources of information Wage Growth

Most countries release Wage Growth data on a quarterly and yearly basis, and countries like the United States and Australia provide a detailed analysis of the same. The reports are published by the respective governments on their ‘Treasury’ website, which includes the International comparison of wage growth rates, Trends in wage growth, and more. 

Links to Wage Growth Information Sources   

AUD- https://tradingeconomics.com/australia/wage-growth

CAD- https://tradingeconomics.com/canada/wage-growth

EUR- https://tradingeconomics.com/euro-area/wage-growth

JPY- https://tradingeconomics.com/japan/wage-growth

CHF- https://tradingeconomics.com/switzerland/wage-growth

GBP- https://tradingeconomics.com/united-kingdom/wage-growth

USD- https://tradingeconomics.com/united-states/wage-growth

The growth in demand for goods and services depends on the spending power and the income that flows to the population, a significant portion of which comes from wages. Companies and government need to understand that growth in wages is not just a cost of production but are also a source of spending and thus of revenue and profit for the business.

Impact of the ‘Wage Growth’ news release on the price charts

After understanding the significance of Wage Growth in an economy, we shall extend our discussion and find out the impact of Wage Growth data on currency pairs. From the below image, we can infer that the Wage Growth may not cause a drastic change in volatility of a forex pair as the level of importance assigned to it is very low. Wage Growth numbers are announced on both a monthly and yearly basis, but to estimate the degree of change in volatility, we will be analyzing the year-on-year numbers of the same. A reference currency that we have chosen for this purpose is the Russian Ruble (RUB).            

Below is an image showing the latest, estimated, and previous Wage Growth data of Russia, where we see that there has been a decrease in Wages by 0.4% from the previous year. A higher reading than before is said to be positive for the currency while a lower than before data can negatively impact the currency. The Wage Growth data is officially released by the ‘Russian Federation Federal State,’ which is responsible for maintaining the fundamental information of Russia. Since the impact of the Wage Growth news announcement is least, let us look at the reaction of the market.

USD/RUB | Before the announcement:

We shall first look at the USD/RUB currency pair and analyze the impact of Wage Growth on this pair. In the above chart, we see that the market is a strong downtrend and recently we see a retracement from the lowest point. Since economists have forecasted a much lower wage growth than before, it is not prudent to take ‘long’ positions in the market as, technically speaking, this would mean we are trading against the trend. Therefore, a risk-free approach would be to wait for the news announcement and then trade based on the change in volatility.

USD/RUB | After the announcement:

The above chart shows the market reaction to the Wage Growth news announcement where the data came was beyond expectations and mildly lower than the previous year’s numbers. Since the data was robust, the price goes down, and the Russian Ruble strengthens. As the difference between the forecasted to actual data was huge, the volatility increases a lot on the downside, and the market seems to continue its downtrend. After the clarification of Wage Growth data and confirmation signs from the market, we can enter the market by ‘shorting’ the currency pair with a stop loss above the ‘news candle.’

EUR/RUB | Before the announcement:

EUR/RUB | After the announcement:

The above images represent the EUR/RUB currency pair, which is similar to that of the USD/RUB pair in terms of price behavior. However, the downtrend here is more resilient and stronger than in the above pair. The pullback, too, has been very little, which shows the strength of the Russian Ruble. Therefore, an above-average Wage Growth data should take the currency much lower while below-average data can result in a rally for a small duration of time, but not a trend reversal.

After the news announcement, we see that the price falls and leaves a wick on the bottom. This wick is due to the reaction at the support area, but this shouldn’t scare us, and we can confidently take ‘short’ positions in the market with a compulsory stop loss.

GBP/RUB | Before the announcement:

GBP/RUB | After the announcement:

The above charts are that of the GBP/RUB currency pair, where we see that the characteristics of this pair are totally opposite to that of the above-discussed pairs. Before the news release, we witness a strong uptrend, and the price is currently at a resistance area. We have two options at this point in time, one, to ‘long’ in the market as Wage Growth data is expected to be very bad and second, to wait for the news announcement, and if the numbers are weak, go ‘short’ in the market.

After the release of Wage Growth data, the price initially goes down as the numbers were better than expectations, but later, the candle closes in green. The volatility increases on both sides, but the numbers were not good enough to strengthen the Russian Ruble. Therefore, the only way to trade this pair is to wait for a breakout above the resistance area and then trade the retracement of it -using the Fibonacci tool.

That’s about ‘Wage Growth’ and its impact on the Forex market after its news release. In case of any queries, let us know in the comments below. Good luck!

Categories
Forex Market Analysis

Daily F.X. Analysis, June 12 – Top Trade Setups In Forex – U.S. Prelim UoM Consumer Sentiment Ahead! 

On the news front, eyes will remain on the UK GDP figures, which are expected to perform worse than the previous month’s data. Alongside the U.S. Prelim UoM Consumer Sentiment figures will be in play to drive price action in gold and dollar related pairs today.

Economic Events to Watch Today


EUR/USD – Daily Analysis

The EUR/USD pair was closed at 1.12974 after placing a high of 1.14035 and a low of 1.12886. Overall the movement of the EUR/USD pair remained bearish throughout the day. The EUR/USD pair gained traction in the early session and rose to a daily high of 1.1403 on Thursday. However, the pair EUR/USD lost its traction on the back of the risk-averse market sentiment, which boosted the demand for safe-haven U.S. dollar.

In the early trading session, the EUR/USD pair followed its previous day’s movement and rose above 1.140 level but failed to remain there in the wake of a strong U.S. dollar against Euro. Dollar Index (DXY) stayed relatively calm near 96.00 level in the first half of the day.

After the release of economic data from both sides, the EUR/USD pair started to lose its daily gains and turned the gains into losses.

On the data front, at 10:30 GMT, the French Final Private Payrolls for the quarter came in as -2.5% against the forecasted -2.3%and weighed on Euro. At 13:00 GMT, the Italian Industrial Production in April was dropped by 19.1% against the expected fall of 24.0%.

At 17:30 GMT, the Core PPI from the U.S. for May came as -0.1% the same as expected and PPI as 0.4% against the expectations of 0.1% and supported the U.S. dollar. The jobless claims for the week also dropped to 1.542M against forecasted 1.550M and supported the U.S. dollar.

Furthermore, the Eurogroup meeting was held on Thursday to discuss the distribution of 750 billion euros to member states to deal with the economic shock from the crisis. Five hundred billion euros were planned to disburse as grants and 250 billion as loans.

 Meanwhile, the finance minister of the Eurozone approved the distribution of 748 million to Greece from profits of European Central Bank that purchased Greek sovereign bonds.

Moreover, the 19 finance ministers of the euro area were looking for a new president and at the time when the region was facing tough negotiations over 750 billion euros fiscal plans to help it recover from the coronavirus.

The Eurogroup current president, Mario Centeno, resigned from the Portuguese government served as a finance minister since October 2015. However, the three names for potential candidates are Spain’s finance minister Nadia Calvino, Luxembourg’s finance Chief Pierre Gramegna and from Ireland, Paschal Donohoe.

Daily Support and Resistance

  • R3 1.1522
  • R2 1.1473
  • R1 1.1422

Pivot Point 1.1372

  • S1 1.1321
  • S2 1.1271
  • S3 1.122

EUR/USD– Trading Tip

The EUR/USD pair is trading at 1.1296 level, having entered into the oversold zone. Today, we can expect bullish correction until 1.1309 and 1.1340 levels, which mark 38.2% and 50% Fibonacci retracement levels. Below these levels, the EUR/USD pair can show selling bias again as the 50 EMA can pressure the pair for selling.


GBP/USD – Daily Analysis

The GBP/USD pair was closed at 1.26016 after placing a high of 1.27541 and a low of 1.25863. Overall the movement of GBP/USD pair remained bearish throughout the day. The GBP/USD pair dropped on Thursday after posting gains for ten previous days on the back of strong intraday U.S. dollar buying, which dragged the pair further below towards 1.2500 level.

The risk-off market sentiment emerged after the comments of Federal Reserve on Thursday and the news that some American states were showing some signs of coronavirus cases again.

The Fed Chair Jerome Powell said that the U.S. economy was set to contract by 6.5% this year, and the unemployment rate was expected to reach 9.3%. The U.K. will release its latest GDP growth figures on Friday, which was previously estimated to show a contraction in April by 18%, followed by a 5.8% decline in March.

On Brexit front, the negotiations between the U.K. & E.U. will now intensify with weekly talks throughout July into August and in the hope of a breakthrough. The U.K. is facing a very difficult time from relatively increased COVID-19 cases and negotiations at that time are weighing even more on British Pound. The hopes of any breakthrough for post Brexit deal rely on the talks between UK PM Boris Johnson and E.C. President von der Leyden, which will hold after the E.U. Summit.

Meanwhile, some fresh bearish pressure for GBP/USD came after the Organization for Economic Co-operation and Development warned that U.K.’s economy was set to be the hardest hit amongst the world’s developed countries from coronavirus pandemic.

At the data front, the RICS House Price Balance for May from the U.K. was released at 4:01 GMT, which showed a decline of 32% against the expected decline by 24% and weighed on British Pound and dragged the GBP/USD pair.

From the American side, the Unemployment Claims for last week were reported as 1.542M against the expected 1.550M and supported the U.S. dollar, which ultimately dragged the pair GBP/USD further toward downside on Thursday.

Daily Support and Resistance

  • R3 1.2912
  • R2 1.2863
  • R1 1.2804

Pivot Point 1.2755

  • S1 1.2696
  • S2 1.2647
  • S3 1.2588

GBP/USD– Trading Tip

On Friday, the GBP/USD pair is trading with a bearish bias at 1.2570 level ever since it has violated an upward trendline support level of 1.2650. On the 4 hour timeframe, the Cable has entered the oversold zone as we can see the RSI and MACD both were holding below 20 and below 0 levels, respectively. On the lower side, the Cable may find initial support at a level of 1.2550, and below this, the next support may be found around 1.2503 level today while the bullish breakout of 38.2% Fibonacci resistance level can lead the GBP/USD pair towards 1.2650 level, which marks 61.8% Fibo level today. 


USD/JPY – Daily Analysis

 The USD/JPY was closed at 106.859 after placing a high of 107.232 and a low of 106.569. Overall the movement of the USD/JPY pair remained bearish throughout the day. The USD/JPY currency pair dropped for the 4th consecutive day on Thursday despite strong demand for the U.S. dollar due to the risk-off market sentiment after the Fed’s gloomy outlook on the U.S. economy presented in its latest monetary policy meeting.

The increasing fears of a second wave of coronavirus after the increased number of appearing cases of infected people due to easing of lockdown restrictions added in the risk-off market sentiment and currency pair’s declines on Thursday.

FOMC turned down the odds of negative interest rates and held its rates near zero at 0-0.25% on Wednesday but suggested that the recovery road would be longer for the U.S. economy as the impact of coronavirus crisis was deeper than expectations. Fed said that it would use all its tools to overcome the damage caused by a coronavirus.

The risk-off market sentiment caused the USD/JPY pair to move in a downward direction on Thursday towards the lowest level of 106.569.

On the data front, at 4:50 GMT, the BSI Manufacturing Index dropped by 52.3 against the forecasted decline by 20.5 and weighed on Japanese Yen. At 17:30 GMT, the Core PPI for May came in line with the expectations of -0.1%. The PPI for May increased to 0.4% from the expected 0.1% and supported the U.S. dollar. The Unemployment Claims from last week were reported 1.542M against the expected 1.550M and gave strength to the U.S. dollar. Despite the strength of the U.S. dollar, the USD/JPY pair moved in a downward direction and posted losses for 4th consecutive day on Thursday.

Furthermore, Moderna told Bloomberg on Thursday that the final-stage trial of its vaccine for COVID-19 will start July. Moderna was the first company to start human clinical trials of its vaccine in the U.S.

The last stage of the trial will be completed with the partnership of the U.S. National Institute of Allergy and Infectious Diseases (NIAID). The study will include 30,000 people and will provide definite clinical proof that vaccines actually prevent people from developing COVID-19.

Daily Support and Resistance    

  • R3 108.58
  • R2 108.23
  • R1 107.67

Pivot Point 107.33

  • S1 106.77
  • S2 106.43
  • S3 105.87

USD/JPY – Trading Tips

The USD/JPY pair fell sharply after violating the upward channel, which supported the pair around 107.500. For now, this level is working as resistance for USD/JPY. The 50 periods EMA is also extending strong resistance at 107.650 area while immediate support stays around 106.600. The bearish trend in the USD/JPY pair can trigger a sell-off until the next support level of the 106.017 level today. Let’s wait for the market to test the 107.650 level before entering a sell in the USD/JPY today. 

Good luck! 

Categories
Forex Daily Topic Forex Fundamental Analysis

Importance Of ‘Construction Output’ As An Economic Indicator

Introduction

Construction activity is the beginning phase of an expected economic growth, which is more vividly evident in the developing economies than developed economies. New infrastructures, buildings, renovations are all part of an expanding economy. Construction is an important economic indicator to assess economic health.

What is Construction Output?

Construction Output is the measure of building and civil engineering work in monetary terms. It is the amount of construction work done measured as the money charged to the customers. It refers to the construction work performed by an enterprise whose principal activity is classified as Construction. Since a measure of the amount of work is proportional to fees charged for the activity, it is measured in the domestic currency of the region where the construction activity was undertaken.

Overall, Construction Output is a measure of the amount charged to customers for construction activity by construction companies in a specific period ( monthly, quarterly, annually). The UK Construction Output is based on a sample survey of 8,000 businesses employing over 100 people or having an annual turn over greater than 60 million sterling pounds. The Construction Output excludes the Value Added Tax (VAT) and payments to subcontractors.

The Construction Output data reporting based on sectors, new or existing renovations, seasonal adjustments, volume, value-based, etc. precisely as illustrated for reference below:

(Picture Credits – Ons.gov)

The Construction Output data is also reported in the index format, where the base index period is 2016, for which the score is 100, and subsequent reports would be scored in comparison to this index period. Typically, it is widely discussed in terms of percentage changes concerning the previous month.

How can the Construction Output numbers be used for analysis?

The Construction Output is a significant economic indicator in the United Kingdom, that is closely watched by both private and public sectors, especially by the Bank of England and HM Treasury. The Construction Output figures assist them in policy reforms and economic-decisions. Growth is a process of emergence of new and better things and discarding old inefficient ones. Construction, in this sense, is just that. Construction involves the erection of new buildings, infrastructures, renovations, expansions of existing infrastructures.

Increased Construction Output implies more people employed, better wages in the construction sector, more demand for raw materials for the Construction, etc. The very act of Construction has a ripple effect on the economy.

Secondly, the Construction of corporate infrastructures or commercial structures implies that these buildings will be used for further economic activities. For example, a company doubling its company size is planning to double its staff and correspondingly the business that it generates. Hence, Construction Output figures improvement is indicative of an improvement in many other sectors.

All these improvements correlated with Construction Output also stimulate consumer confidence and encourages consumer spending, which further stimulates the economy and boosts growth. The importance of Construction Output is also evident from the fact that it is taken into account for the compilation of the GDP monthly estimate.

New Orders in the Construction Industry

It is a quarterly report produced by the administrative data provided by the Barbour ABI. Construction Output data reflects immediate short term health of the economy as it accounts for the construction work that has already taken place. Whereas, the New Orders report from the ONS provides more a forward-looking estimate of the potential construction activity in Great Britain.

New Orders are also crucial in gaining insight into the upcoming economic trends. Hence, it is advisable to use the New Orders report in conjunction with Construction Output report data to assess current and ongoing economic trends more precisely. It is a quarterly report. It is also presented as an index report for which the base index period is 2016, i.e., the New Orders score for 2016 is 100, and all subsequent reports are reported in comparison to this index value.

Impact on Currency

The Construction Output is a coincident indicator in the short-run. Still, it can also be used to gauge upcoming economic trends based on the type of Construction Activities are being undertaken. Also, if we take the New Orders report, both together can act as a leading economic indicator.

Construction Output reflects the current economic conditions by showing the value of the Construction Activity that has already taken place every month.  It is a proportional economic indicator, meaning an increase in Construction Output figures is good for the economy and correspondingly for the currency and vice-versa.

Economic Reports

The Construction Output reports are published approximately six weeks after the reference month by the Office for National Statistics (ONS) on its official website.

Monthly Construction Output reports go back to 2010 for the United Kingdom. A derived data set going back to 1997 can be obtained from monthly GDP data sets. The Construction Output reports are available in seasonally adjusted and unadjusted formats, and at current prices and chained volume measures (excludes effects of inflation).

For the United States, the Bureau of Economic Analysis releases GDP by Industry quarterly and annual estimates, which serves as a close or relatable statistic for the Construction Output of the United Kingdom. As such, there is no Construction Output dedicated nationwide statistics in the United States. Hence, GDP by Sector analysis helps us to analyze the Construction Industry’s performance in the United States.

Sources of Construction Output

We can find the latest Construction Output statistics for the United Kingdom can be found below.

For the United States – Gross Output of Private Industries: Construction

Construction Output reports for various countries are available here.

Impact of the ‘Construction Output’ news release on the price charts

By now, we believe that you have understood the significance of Construction Output in an economy, which essentially includes construction work done by enterprises that are used for measuring the growth of the construction sector. It gives an insight into the supply on the housing and construction market. The Construction industry is one of the first to go into recession when the economy declines but also to recover as conditions improve. The Construction Sector has a marginal influence on the GDP of an economy. Thus, investors do not give a lot of importance to the data when it comes to the fundamental analysis of a currency.

In today’s illustration, we will explore the impact of the Construction Output news announcement on different currency pairs and compare the change in volatility. The below image shows the previous, forecasted, and latest data of the United Kingdom, where we see a reduction in total output in the month of March. Let us look at how the market reacted to this data.

GBP/USD | Before the announcement:

The first pair we will look into is the GBP/USD currency pair, where the above image shows the characteristics of the pair before the news announcement. The market is in a strong uptrend and has started moving in a range with the price at the bottom of the range at the moment. Thus, we can expect buyers to show up any time from this point. As economists are expecting healthier Construction Output data, traders can take a ‘long’ position with a strict stop loss below the ‘support.’

GBP/USD | After the announcement:

After the news announcement, the market drops slightly owing to weak Construction Output data, and the volatility is seen to increase on the downside. But since the impact of this news release is less, the effect will not last long on the currency pair, and we cannot expect the market to break key technical levels. This is why the price reacts strongly from the ‘support’ and bounces off. Traders need to analyze the pair technically and trade accordingly.

GBP/AUD | Before the announcement:

GBP/AUD | After the announcement:

The above images represent the GBP/AUD currency pair, where we see that before the news is announced, the market was in a strong downtrend indicating a great amount of weakness in the British Pound. Currently, we can say that the price in the ‘demand’ area and thus we can expect bullish pressure to come back in the market at any moment. It is not recommended to buy the currency pair as the downtrend is dominant, and there are no signs of reversal.

After the news announcement, the price quickly moves up and closes as a bullish candle. In this pair, the Construction Output data get an opposite reaction from the market where the volatility increases to the upside soon after the announcement. Traders can take a ‘short’ position in the market after a suitable price retracement to a key technical level.

EUR/GBP | Before the announcement:

EUR/GBP | After the announcement:

The above charts belong to the EUR/GBP currency pair, where we see that the market is in an overall downtrend before the announcement, and currently, the price is in a retracement mode. Since the British Pound is on the right-hand side of the pair, a down-trending market means the currency is extremely strong. Looking at the price action, we can say that the downtrend will continue and now we need to find the right place to enter the market.

After the news announcement, the price initially goes lower, but the currency gets immediately bought into, and volatility increases to the upside. This was a result of poor Construction Output data were traders bought the currency pair by selling British Pound. As the impact is least, the up move does not sustain, and the downtrend continues.

That’s about ‘Construction Output’ and the impact on its news release on the Forex price charts. Shoot your questions in the comments below, and we would be happy to answer them. Cheers!

Categories
Crypto Market Analysis

Daily Crypto Review, Jun 12 – BTC Plunging To Two-Week Lows; Binance Launching BTC Futures Contracts

The crypto market has plunged over the course of the day, bringing the overall crypto market to a two-week low point. Bitcoin is currently trading for $9,337, which represents a decrease of 5.51% on the day. Meanwhile, Ethereum lost 6% on the day, while XRP lost 5.61%.

DigiByte took the position of today’s biggest daily gainer, with gains of 5.14%. Loopring lost 20.86% of its daily value, making it the most prominent daily loser.

Bitcoin’s dominance stayed at the same place since we last reported, with its value currently at 65.28%. This value represents a 0.6% difference to the downside when compared to yesterday’s value.

The cryptocurrency market capitalization decreased greatly over the course of the day, with the market’s current value being $264.51 billion. This value represents a decrease of $16.72 billion when compared to the value it had yesterday.

What happened in the past 24 hours

500 Crypto Companies in Estonia losing their permits

Estonia is one of the European Union’s most crypto-friendly countries when it comes to regulation. However, due to the $220 billion scandal regarding money laundering through crypto, Estonia started cracking down on many licensed cryptocurrency companies. So far, over 500 companies have lost their permits.

Honorable Mention

Cryptocurrency exchange powerhouse Binance has just launched a new Bitcoin futures product. The launch came through despite institutional investors visibly showing uncertainty about the future of cryptocurrencies.

In a blog post that came directly from Binance on June 11, the company revealed its quarterly futures contracts product is going live. The first contracts will have a settlement due in September.

_______________________________________________________________________

Technical analysis

_______________________________________________________________________

Bitcoin

The largest cryptocurrency by market capitalization has spent the day plunging to its two-week lows, falling as low as $9,070. The $9,251 line has, however, held up, and BTC is now consolidating above it. The downward-facing move should be over for now as RSI stepped into oversold while the volume faded.


Bitcoin’s volume increased multiple-fold over the course of the price dump but has since returned to its average levels.

Key levels to the upside                    Key levels to the downside

1: $9,580                                           1: $9,251

2: $9,735                                           2: $9,120

3: $9,870                                            3: $8,980

Ethereum

Ethereum followed Bitcoin’s initiative to move towards the downside and fell as low as $225. However, the $225.4 support line held up and stopped the move from going any further. Ethereum has recovered slightly and is now trading at a $233 level.


Ethereum’s volume increased drastically during the peak of the move but has since returned to normal. Its RSI level has entered the oversold territory but has (again) returned above it once the pressure faded.

Key levels to the upside                    Key levels to the downside

1: $240                                               1: $225.4

2: $251.4                                           2: $217.6

3: $260                                               3: $198

Ripple

XRP did not stray away from other cryptocurrencies in terms of market direction. The third-largest cryptocurrency by market cap has broken the range it was trading in for a long time as it fell below the $0.2 support level. The downward-facing move reached $0.184 before going up. XRP is still trying to find equilibrium and a place to consolidate at, and it is still uncertain whether that will be above or below the $0.19 level.


Key levels to the upside                    Key levels to the downside

1: $0.2                                               1: $0.19

2: $0.205                                           2: $0.178

 3: $0.214                                          


Categories
Forex Videos

Fundamental Analysis For Novices- Building Permits!

Fundamental Analysis For Novices Building Permits

Welcome to the Fundamental analysis video for novices. In this session, we will be looking at building permits.

So, what are building permits?

Before residential house construction, or business premises can be built, or remodeling projects can commence on such properties, permits have to be granted from an officially approved local government agency to allow contractors to proceed with the work. This allows for standards to be maintained and improved and allows for Governments to keep tabs on what is happening for statistical analysis of their economies.
The actual building permit itself will allow for the structural integrity of the framework, water and sewage lines, fire and gas connectivity, fire protection, zoning, and sanitation.
The granting of building permits varies from country to country because not all home construction and renovation projects require a building permit. However, typically, projects which require major constructional changes and certainly new build projects require building permits.

Building permits within an economy are important indicators of growth or stagnation in particular segments of the economy. An upturn in commercial building permits is a good indication that businesses are expanding. An upturn in home construction is a good indicator that employment is going well and that people are moving homes, buying new homes, and renovating. In other words, there is a need for new homes. These are positive signs that economies are doing well. Conversely, the opposite is true.

There is a knock-on effect with regard to financing, employment, and manufacturing
and supply of associated materials. And so building permits are seen as an important barometer to the financial health of a nation and are carefully observed by economists, analysts and traders.


Each month countries such as New Zealand, in this example, on our economic calendar, releases statistics for their building permits. The information is scheduled for release during the usual business hours of the country in question, and typically in the mornings, and is subject to an embargo.


Let’s take a closer look at the New Zealand permits which are due for release on Monday the 1st of June, we have been inserted red arrows to show you the impact significance of the release, where an updated month on month building permits data for the month of April is due, and where the previous figure for March came in at – 21.3%.

So how to trade using building permits data release?

The larger the economy, the more significant the building permits data release is taken. So let’s take a look at the USA, where the Building Permits report is released by the U.S. Census Bureau on the 18th working day of each month, having conducted a survey of 9,000 permit issuers before publishing their findings into the financial markets. The Census Bureau has been gathering this data since the 1960s.
Typically, a growing number of permits above previous months’ data release is seen to be bullish for an economy, and numbers that are lower than the previous months’ data release are seen to be bearing.


Keep an eye out for the consensus figure which will be updated prior to the release,


And then compare it to the actual number after the release. Markets hate shocks, and therefore if the number is markedly lower than that of the consensus, where professional analysts and economists have been carefully monitoring events in order to draw their conclusions, you might expect a negative effect on the value of that particular country’s currency against other counterparts. But, if the data is higher than expected, then you might see that particular country’s currency gain in strength against other counterparts being traded.

Categories
Forex Videos

Forex Fundamental Analysis For Novices – Factory Orders!

Fundamental Analysis For Novices Factory Orders

Welcome to the educational video Fundamental Analysis For Novices regarding factory orders
What are factory orders, and what do they tell you as an economic indicator?


Each day when you look at your Economic Calendar, you will see different types of economic events due for release on particular days.
At the top of the economic calendar for Friday the 5th of June, we can see factory orders highlighted for Germany for both year on year and month on month.

Factory orders provide a picture of the financial health of countries that produce durable and non- durable goods. Durable goods are things such as sports equipment, machinery, household appliances, and generally things that are not consumed. Typically they will have a lifespan of a minimum of 3 years. Non-durable goods are produced by consumers and typically have a short shelf life of fewer than three years, Such as toothpaste, laundry detergent, soaps, deodorants, light bulbs, paper plates, and clothing.
Factory orders comprise four sections, new orders, unfulfilled orders, shipments, and Inventories. This data will show whether there is a backlog in production and trends in current sales. All of these taken together will show the strength of the current and future production for an economy.
In America, factory orders are so huge they are reported in the billions of dollars and are released by the Census Bureau of the United States Department of Commerce. All countries report their data as a plus or minus a percentage of previous reports.


The market attaches a certain amount of importance to all economic data releases, and here we can see color bars that depict the impact that the release of this information will have. We can see that the month on month has a higher impact status than the year on year figure.


Hey, we can see that the actual data has been released at 7 AM CET and which was subject to an embargo. And when compared to the consensus, which is what the market was expecting and also the previous release from the month of March, the numbers are badly down at – 36.6 % year on year and -25.8% month on month for April.
These are bad numbers and can be put down to the fall out from the coronavirus pandemic, which has severely affected economic activity around the world.

Germany is the strongest economy in the Eurozone, and analysts and economists, as well as financial traders, keep a particular eye open for this type of underperformance.
Factory orders show an overall direction of an economy. When factory orders increase, it means the economy is expanding, and consumer demand is high for goods. If a country is contracting, it will show up as bad economic data, such as we have just seen for Germany.
INSERT G: How to trade factory orders data release

Look out for the previous factory orders number and compare it to the previous release and, more importantly, the consensus which will have been formulated by economists and analysts. Big differences between the consensus and the actual number can cause market shocks or volatility. Remember, a higher percentage than the previous month and increase year on year indicate that the economy of a country is likely to be improving. This will reflect in higher consumer demand and is good for the exchange rate of a particular currency, which may move higher against its counterparts.
Conversely, if the data release is lower than the previous month and shows a decline this is a sign that the economy of a particular country is stagnating or contracting and therefore there is less consumer demand, and this could have the opposite effect of an exchange rate moving it potentially lower against its counterparts.

Categories
Forex Market Analysis

Daily F.X. Analysis, June 11 – Top Trade Setups In Forex – Brace for Eurogroup Meetings!

On the news front, the market will be focusing on the Eurogroup meeting, which is usually held in Brussels and attended by the Eurogroup president, Finance Ministers from euro area member states, the Commissioner for economic and monetary affairs, and the President of the European Central Bank. The agenda will be to discuss upcoming policies considering the economic slowdown driven by the coronavirus. Besides, the U.S. Unemployment Claims will also remain in the highlights today.

Economic Events to Watch Today


EUR/USD – Daily Analysis

The EUR/USD pair was closed at 1.13753 after placing a high of 1.14222 and a low of 1.13214. Overall the movement of the EUR/USD pair remained bullish throughout the day. The EUR/USD pair rose to its three months highest level on Wednesday after the Federal Reserve’s monetary policy decision. The currency pair crossed the level of 1.1400 on the back of broad-based U.S. dollar weakness that day.

The Fed left its interest rates unchanged at 0-0.25% on Wednesday and projected a contraction of 6.5% this year along with the unemployment reaching 9.3% for this year. Furthermore, the bank has shown its commitment to support the credit flow to household and business by increasing its Treasury security purchases.

Though negative interest rate was not expected from the Fed but taking the pledge to keep the interest rates at low near zero until market participants did not expect 2022, this moved the investors to sell the U.S. dollar, which in turn gave a push to EUR/USD pair.

Adding in the upward movement of EUR/USD pair on Wednesday was the poor than expected economic data from the U.S. At 17:30GMT, both CPI & Core CPI readings from the U.S. came in as -0.1% against the expected 0.0% during May and exerted pressure on the U.S. dollar. AT 23:00 GMT, the Federal Budget Balance showed a deficit of 398.8B against the expected deficit of 580.0B and weighed on the U.S. dollar.

The broad-based U.S. dollar weakness pushed EUR/USD pair above 1.1400 level on Wednesday. While the U.S. Dollar Index also fell to 3 months low against its rival currencies. U.S. stocks also turned negative and posted losses on Wednesday.

On the other hand, at 11:45 GMT, the French Industrial Production was dropped by -20.1%against the expected -10.0% during April and weakened Euro. Furthermore, On Wednesday, the European Commission said that Russia and China were running targeted influence operations and disinformation campaigns in the European Union and its neighborhood and also around the globe.

Daily Support and Resistance

  • R3 1.1522
  • R2 1.1473
  • R1 1.1422

Pivot Point 1.1372

  • S1 1.1321
  • S2 1.1271
  • S3 1.122

EUR/USD– Trading Tip

The EUR/USD continues to trade sideways in a narrow trading range of 1.1400 – 1.1348 level, and right now, it seems to test the lower boundary of this range. On the lower side, the next target level appears to be 1.1270. Currently, the pair is facing immediate support around 1.1340 level, and closing of candles above this level may lead the EUR/USD prices to further lower towards 1.1400. The 50 EMA is also suggesting a bullish bias for the EUR/USD pair as the pair has closed a Doji candle right above the EMA. On the higher side, a violation of 1.1400 resistance can lead to EUR/USD prices until 1.1465. Odds of bullish bias remains solid today.


GBP/USD – Daily Analysis

The GBP/USD pair was closed at 1.27457 after placing a high of 1.28130 and a low of 1.27060. Overall the movement of GBP/USD pair remained bullish throughout the day. The currency pair GBP/USD continued its bullish trend for the 10th consecutive day and maintained its bullish streak on Wednesday on the back of the latest monetary policy decision by Federal Reserve.

On Wednesday, the U.S. Fed announced its monetary policy decision in which it held its interest rates on the same level near zero and did not go for negative interest rates. However, the Fed also announced to hold the interest rates at the same level until the end of 2022. Federal Reserve also announced that over the coming months, it would increase the holdings of Treasury securities and agency residential and mortgage-backed securities at the current level to support the credit flow to households and businesses. This all was decided to sustain smooth market functioning and defend the U.S. economy.

Additionally, the Open market Desk will continue to offer large-scale overnight and term repurchase agreement operations. The Committee will keep a close eye on market conditions to adjust its plans as needed.

The DXY fell off from 96 levels and was down by 0.5% on Wednesday, the dovish statement from Fed weighed on the U.S. dollar and hence, GBP/USD pair reached near 3-months highest level.

On the other hand, Brexit trade negotiations did not go well between the U.K. and Brussels, and the U.K. wanted to reach an agreement with the E.U. this year. There are no chances of even any progress in trade talks with the deadline to seek an extension coming closer day by day.

According to the boss of the U.K.’s most influential business group, the CBI, U.K.’s economy was not ready to withstand the additional disruption of no-deal Brexit. The furlough scheme and grants will end at once, and then thousands of businesses and millions of jobs will likely hit the water. A CBI member, Carolyn Fairbairn, said that British firms do not have the resilience to cope with leaving the European Union without any deal after the losses of the coronavirus crisis.

On Wednesday, GBP/USD prices rose above the level of 1.27710 but dropped below it and continued moving in a confined range. The surge in prices was due to the broad-based U.S. dollar weakness after the Fed’s statement and economic data release. At 17:30, The CPI & Core CPI for May from the U.S. showed a decline of 0.1% against the expected 0.0% and weighed on the U.S. dollar. The weak dollar pushed GBP/USD pair on the higher level.

Daily Support and Resistance

  • R3 1.2912
  • R2 1.2863
  • R1 1.2804

Pivot Point 1.2755

  • S1 1.2696
  • S2 1.2647
  • S3 1.2588

GBP/USD– Trading Tip

The GBP/USD pair is trading with a bearish bias at 1.2650 level ever since it has violated the upward channel on the lower side. On the 4 hour timeframe, the Cable has closed a strong bearish engulfing candle, which suggests a dominance of sellers in the market as this can trigger selling until 1.2625 level. Immediate support can be found around 1.2625, while a breakout of this can trigger more selling until the next support level of 1.2582 level. Let’s look for selling trades below 1.2690 level today. 


USD/JPY – Daily Analysis

 The USD/JPY pair was closed at 107.123 after placing a high of 107.872 and a low of 106.987. Overall the movement of the USD/JPY pair remained bearish that day. AT 4:50 GMT, the Core Machinery Orders from Japan for April dropped to -12% against the expected -7.5% and weighed on Japanese Yen. The PPI for the year from Japan was declined by 2.7% against the expected decline of 2.4% and exerted pressure on JPY.

On the other hand, at 17:30 GMT, the CPI and the Core CPI during May from the United States was dropped to -0.1% from 0.0% of expectations and weighed on the U.S. dollar. The Federal Budget Balance for April was declined by 398.8B against the expected 580.8B.

The poor than expected CPI & Budget data from the United States on Wednesday weighed on the U.S. dollar, which dragged down the USD/JPY pair with itself. Furthermore, the dovish statement from the Federal Reserve will keep its interest rates on hold at a level near zero until the end of 2022. U.S. economy was not in good condition, and the projections made by the Fed about the economic contraction this year was 6.5% and of unemployment to be raised by 9.3.

Fed reduced its interest rates in March to near zero amid coronavirus crisis and said that until the economy was back on track Federal Reserve has pledged to maintain low rates. Fed has provided trillions of dollars to its financial system, Treasury purchases to support business, state, and local governments. It also started a new program to lend to small, medium-sized firms. Wall Street, major indices such as the S&P 500 and Dow Jones Industrial Average were negative that day, and the U.S. dollar index also fell to fresh three months low against major currencies.

Daily Support and Resistance    

  • R3 108.58
  • R2 108.23
  • R1 107.67

Pivot Point 107.33

  • S1 106.77
  • S2 106.43
  • S3 105.87

USD/JPY – Trading Tips

The USD/JPY is trading sharply bearish below 107.100 level, having violated the upward trendline at 107.600. Below this, the pair has a great potential to go for a 107.08 level, while a bearish breakout of 107.082 can dip further until 106.770. On the 4 hour chart, the MACD, and RSI, both are holding in the selling zone, demonstrating that there’s further room for selling in the USD/JPY pair. Let’s consider taking selling trades below 107.33 today. Good luck! 

Categories
Crypto Market Analysis

Daily Crypto Review, Jun 11 – Chinese Crypto Traders’ Bank Accounts Getting Frozen; BTC Attempting To Break $10,000

The crypto market has spent the day with increased volatility as Bitcoin was trying to pass the $10,000 mark.  While the level got rejected once again, the price increase did happen. Bitcoin is currently trading for $9,941, which represents an increase of 1.69% on the day. Meanwhile, Ethereum gained 2.18% on the day, while XRP gained 0.81%.

Aave took the position of today’s biggest daily gainer, with gains of 20.26%. WAX lost 20.34% of its daily value, making it the most prominent daily loser.

Bitcoin’s dominance increased since we last reported, with its value currently at 65.34%. This value represents a 0.14% difference to the upside when compared to yesterday’s value.

The cryptocurrency market capitalization increased slightly over the course of the day, with the market’s current value being $281.26 billion. This value represents an increase of $3.57 billion when compared to the value it had yesterday.

What happened in the past 24 hours

Are Chinese bank accounts getting frozen by the government?

Almost 4,000 Chinese bank accounts have reportedly been frozen by the local government due to cryptocurrency trading. According to a report published on Monday, the Chinese police force froze the bank accounts of thousands of OTC traders from the Chinese province of Guangdong.

The report stated that the authorities started freezing bank accounts on Thursday. While the law enforcement is claiming that they are freezing only accounts tied to illicit activities, retail investors saw their bank account frozen after buying cryptocurrency on credible crypto exchanges.

_______________________________________________________________________

Technical analysis

_______________________________________________________________________

Bitcoin

The largest cryptocurrency by market capitalization has spent the day preparing for a move towards the upside. The price attempted to break the $10,000 threshold several times, each time being unsuccessful. However, even though the price point got rejected, Bitcoin gained some value and managed to pass $9,870 (which is being tested at the time of writing).


If Bitcoin manages to pass $10,000, it can face resistance above the $10,300 level.

Key levels to the upside                    Key levels to the downside

1: $10,010                                         1: $9,870

2: $10,355                                         2: $9,735

                                                           3: $9,580

Ethereum

Ethereum also made a move towards the upside while attempting to break its resistance level of $251.4. While the break is (so far) unsuccessful, it seems like the second-largest cryptocurrency by market cap has strong support in both the $240 level and the 21-period moving average, which means that the price will not dramatically fall without a fight.


Ethereum’s volume increased drastically during the peak of the move towards the upside but started to fade as the $251.4 level kept resisting.

Key levels to the upside                    Key levels to the downside

1: $251.4                                            1: $240

2: $260                                              2: $225.4

                                                           3: $217.6

Ripple

XRP stayed in its tight range over the course of the day, bound by the $0.2 support and $0.205 resistance level. While its price increased slightly, XRP didn’t make a determined move towards the upside (like Bitcoin and Ethereum did).


While scalp traders might enjoy the ranging moves, a confirmed break to either the upside or downside will benefit any trader as the move would most likely be easy to spot and profit from.

Key levels to the upside                    Key levels to the downside

1: $0.205                                           1: $0.2

2: $0.214                                           2: $0.19

 3: $0.227                                                        


Categories
Forex Fundamental Analysis

‘Employed Persons’ – Impact Of This Fundamental Driver On The Forex Market

Introduction

The number of people who hold a legal job, or conversely, the percentage of unemployed people is a direct gauger for a country’s economic health. It is one of the most obvious and direct reflectors of a nation’s health. Common people often misinterpret the rate of employment or unemployment as we will see next, Due to which a good background understanding of what such numbers reflect is paramount for economic analysis.

What is Employment?

An individual who gets paid for a certain work he/she performs is said to be “Employed.” People work to earn a living and make ends meet at the most basic level and once these requirements are met people work to improve their standard of living through more work or better work or switching place of work etc.

There are a variety of modes through which an individual within a nation can find work. For example, an individual can be a freelancer or a regular employee in an organization or even run his or her own business and be called self-employed.

How is the Employed Persons’ Statistic calculated?

In this regard, The Bureau of Labor Statistics (BLS) has left no stone unturned. The range of data that is available with them regarding the employment situation is huge. BLS surveys and tracks monthly employment and unemployment situation within the country and classifies them based on geographical region, sex, race, industry, etc.

The technique employed by BLS is called the Current Population Survey (CPS). Since asking every individual in the country every month about his employment status and verifying those details is an impractical task Government employs CPS to survey the data.

CPS survey takes in about sixty thousand eligible households. The selected households, going to be surveyed, are representative of all geographical locations within the nation hence making it a miniature version of the country’s population. The authorities also take care of not repeating the same surveyed members in succession and make sure that no one household is survey consecutively more than four times.

Neither the surveyor nor the surveyed person does not directly ask or get to decide their employment status. The surveyors ask a specific set of questions which and the responses to these questions are decoded by computer algorithms to determine the status of the individual automatically. Once the data is collected and calculated, based on a wide variety of factors, like race, ethnicity, age, gender, and residing state, they are categorized.

Why is the Employment Situation important?

The Employment Situation report published by the Bureau of Labor Statistics in the United States goes as far back as the 1940s. Hence, there is good confidence in the data set due to its range and good accuracy in assessing and predicting economic activity within a nation.

The importance of employment rate, employment-to-population ratio, unemployment rate, or any other employment metric is understood when we understand the interaction of various economic factors on each other and how one coherently affects the other.

If the number of employed people within a country increases, it means the number of people who are getting paid is more, which means more money is in circulation in the economy;  This means that more people now have the purchasing power to procure produces and thereby increasing the overall consumption of goods and services within the nation. When the consumption is on the rise, it means the demand is on the rise, which makes the business flourish, which in turn can increase the need for more employment or give the industries a good push towards growth. Overall, either more people will be employed, and some of the currently employed sections of people may enjoy better pays over time due to flourishing business.

We understand here there is positive feedback within an economy where one section feedback into other sections of the society and growth compounds and macroeconomic metrics like Gross Domestic Products reflect these positively, giving further confidence to policymakers, investors, and foreign businesses.

Here we have seen above how such a simple statistic can imply such big macroeconomic conditions of a nation. No wonder why BLS has such a diverse set of employment survey statistics released every month, which receives such huge media attention. For instance, Every month, when the nonfarm payroll numbers also are released, it is closely watched by many analysts, people in business, investors, and traders all over to make critical decisions. Employment reports based on industrial sectors can also give investors a good idea of different sector’s performances and help them make informed investment decisions.

How can the Employed Persons’ Report be Used for Analysis?

As useful as the Employment reports that are released every month, they are equally tricky to understand. For example, below is a snapshot of “All Employees, Total Nonfarm (PAYEMS) ” from the St. Louis Federal Reserve Economic Data (FRED)

When we see the above graph, one might think that the nation’s economy has been continuously growing, but that is not the case as the employment graph here is simply a function of population. Certainly, the population has increased from 1940 to 2020; hence the graph may seem increasing, but it is not solely because of improvements in the economic conditions of the country. We should also pay attention as some of the statistics of employment are not seasonally adjusted values meaning that during certain months of the year employment is on the low, and conversely, there seems to be an increase in unemployment like in January and February where seasonal jobs like construction are on a slowdown. Hence low numbers during these periods do not signal an economic contraction or slowdown in the economy.

Unemployment rate statistics are also used by Policymakers to assess causes of unemployment and take the necessary action to rectify the same. Investors use to assess the performance of certain industrial sectors before deciding to invest within a particular sector of a country. Many people use different categories of employment and unemployment statistic to analyze which sectors are facing slowdowns, layoffs, and which sectors have possible employment opportunities.

Apart from all these media, institutions, economic analysts all use these statistics in its diverse forms for their specific purposes.

Sources of Employment Reports

The U.S. Bureau of Labor Statistics is responsible for releasing this data, and that data can be found here – Employment | Unemployment

You can also find the data related to Employed Persons on the St. Louis Fed website.

Impact of the ‘Bank Lending Rate’ news release on the price charts

Just as how the unemployment rate plays a major role in fundamental analysis and determines the state, the economy, employment level is an equally important fundamental indicator. The employment level measures the number of people employed during the previous quarter. It gives the number of jobs created in an economy during a quarter. We understood in the previous section of the article that Job Creation is directly related to consumer spending. Therefore, it is a high impactful event. Even though most countries release unemployment data on a monthly, there are few countries that announce the number of Employed Persons in a quarter.

In today’s article will be analyzing the 4th quarter employment data of Switzerland, which was released in the month of February. A forecasted data of Employment level is not available as investors rely more on the unemployment rate for making investment decisions. The Employment level of Switzerland is released by the ‘Federal Statistical Office.’ A higher than previous reading is taken to be positive for the currency, while lower than previous reading is considered to be negative.

EUR/CHF | Before the announcement:

We shall start with the EUR/CHF currency pair where, in the above chart, we see that before the news announcement, the market has shown signs of reversal and is getting ready for a major event. Technically, the chart is in a perfect spot for taking a ‘short’ trade as this is a perfect reversal pattern. Therefore, aggressive traders with large risk appetite can enter the market with bigger stop loss since there can be a sudden surge in volatility after the news release. However, conservative traders should wait for the announcement and then take a suitable position.

EUR/CHF | After the announcement:

As we can see in the above chart, the price quickly goes up until its most recent high but immediately gets sold. The reason behind this increase in volatility to the upside is a lower number of employed persons in the 4th quarter compared to the previous quarter. Since the data was weak, traders sold Swiss Franc and bought Euro.

But later we notice that the candle leaves a big wick on the top and closes near its opening price. This means the data was not hugely worse, and since it was close to the previous quarter’s reading, there is a shift in volatility to the downside. This wick is a confirmation sign of the reversal, and now we can enter the market with a lower risk.

USD/CHF | Before the announcement:

USD/CHF | After the announcement:

The above images represent the USD/CHF currency pair where before the news announcement, we see a ranging action of the market and presently approaching the support area. Since the market is already volatile here, a news release can essentially augment this volatility on either side. In such market situations, one should wait for the news release and then take a position based on the data. However, the ‘options’ market can offer an advantage of this volatility and hence can be traded by few.

After the news announcement, the currency moves similarly as in the above pair, where the volatility initially increases on the upside and later retraces back. An important thing we need to notice here is, we are very close to the support area, and hence going ‘short’ can be risky. This is how technical analysis can be useful.

GBP/CHF | Before the announcement:

GBP/CHF | After the announcement:

Before the news announcement, we see that the GBP/CHF currency pair is in an uptrend pointing towards the weakness of Swiss Franc. This chart seems to be behaving opposite to that of EUR/CHF, where the uptrend is very strong with no sign of reversal. One of the reasons for this trending nature could be due to the strength in British Pound with little influence of Swiss Franc.

After the news announcement, we observe that the Employment data has the least impact on this pair, and the price fails to fall below and remains above the moving average. Since we don’t witness a drastic change in volatility, the only way to trade this pair is by waiting for an appropriate retracement and using technical indicators to join the trend.

That’s about ‘Employed Persons’ and its impact on the Forex market after its news release. If you have any questions, please let us know in the comments below. Good luck!

Categories
Forex Videos

Fundamental Analysis For Novices Markit Manufacturing PMI!


Fundamental Analysis For Novices Markit Manufacturing PMI

Welcome to the educational video on fundamental analysis, and this one is about, Markit manufacturing PMI.
The PMI element is the Purchasing Managers’ Index and is compiled by IHS Markit for over 40 major economies throughout the world. The information is updated month on month and released subject to an embargo at certain times, depending on the country.


And so if you are keeping an eye on your economic calendar, you would expect to see something like this for Markit Manufacturing PMI’s.


So the first one due on Monday, June 1st, is Spain.

The bar on this type of calendar shows the impact the news release will have in the financial markets, pertaining to the economic conditions of the country and as a part of the Eurozone, where Spain shares the common currency.


And then we have the previous month’s release, which was 30.8, the consensus by market analysts for this month’s figure, which is 38.1.


And when the figure is released at 7:15 a.m in Europe, the actual number will appear here.
The PMI, which stands for the purchasing managers index, is a snapshot of business conditions in the manufacturing sector for each country. Manufacturing is a huge component of a country’s gross domestic product, and therefore provides a picture of the overall economic conditions and financial health of a nation, in this case, Spain.

Generally speaking, a result above 50 signals bullish sentiment for the Euro, whereas a result below 50 is seen as bearish. Obviously, Spain is only one of 19 countries that use the Euro and one of 27 Eurozone member states, and because its economy is small in relation to some of the other country’s it has a lower impact.


Here we can see that the impact bar is higher for Germany because it has a larger economy than Spain, and therefore its relevance is greater because Germany contributes more to the Eurozone coffers.


Similarly, the impact for Great Britain is of high importance.


And when it comes to the United States, the PMI is very widely anticipated because it has a huge impact on the American economy and also because the US Dollar is the dominant currency in the world.
In the United States, this data is collated by a company called the Institute for Supply Management, or ISM and where they measure the manufacturing activity of more than 300 manufacturing firms across the USA, and where the monthly report, which is also referred to as the ISM Manufacturing Index, is announced on the first business day of each month, in line with most other countries, and where a reading below 50 suggests a contraction in manufacturing and where a number above 50 suggests expansion and where a reading of 50 means no change.

So how to trade the market manufacturing PMI and the ISM manufacturing index. Remember, we are looking for numbers above or below 50 and where above 50 is bullish and good for an economy, in which case you might expect to see a country’s currency exchange rate getting stronger. Conversely, numbers below 50 indicate a contraction in manufacturing for that country, and therefore this is a bearish number, and you might expect to see that country’s currency exchange rate move lower.

You will very likely find extreme volatility when the PMI numbers are released and are completely out of line with the market consensus. Markets do not like shocks, and when they occur, it creates market volatility.

Categories
Crypto Market Analysis

Daily Crypto Review, Jun 10 – Crypto Ransomware Cartels Forming; Market Preparing For A Move

The crypto market has spent the day without much movement and with low volatility.  Bitcoin is currently trading for $9,737, which represents an increase of 0.54% on the day. Meanwhile, Ethereum gained 0.18% on the day, while XRP lost 0.78%.

Swiss Borg took the position of today’s biggest daily gainer, with gains of 18.23%. HedgeTrade lost 7.87% of its daily value, making it the most prominent daily loser.

Bitcoin’s dominance decreased since we last reported, with its value currently at 65.20%. This value represents a 0.92% difference to the downside when compared to yesterday’s value.

The cryptocurrency market capitalization increased slightly over the course of the day, with the market’s current value being $277.69 billion. This value represents an increase of $1.61 billion when compared to the value it had yesterday.

What happened in the past 24 hours

Crypto Ransomware Cartel?

Ransomware attacks started happening all over the world recently. They were performed by well-known cybercriminal groups, which are reportedly teaming up and creating cartel-style alliances, all with the idea to pressure their respective victims into paying the ransom requests.

The central feature to show that this is happening is that the gang notes that Ragnar Locker, which is a ransomware group, provided this info, as the title of the blog post they have posted says: “MAZE CARTEL Provided by Ragnar.”

_______________________________________________________________________

Technical analysis

_______________________________________________________________________

Bitcoin

The largest cryptocurrency by market capitalization has spent the day without much movement. As we noted yesterday, the $9,735 level was breached to the downside but was not confirmed (the lack of confirmation made us think that the move might be corrected soon). Bitcoin regained its price as well as the $9,375 level. There aren’t many opportunities for traders at the moment, but scalp traders might use the fact that Bitcoin is fluctuating around $9,735 and testing support and resistance levels above and below it.


Key levels to the upside                    Key levels to the downside

1: $9,870                                           1: $9,735

2: $10,010                                         2: $9,580

                                                           3: $9,250

Ethereum

Ethereum had no movement throughout the day, as it stayed within a one-dollar range. The second-largest cryptocurrency by market capitalization is secured by the 21-period moving average on its downside, while it has absolutely no volume to even try to test the upper levels.


Ethereum’s volume is extremely low while its RSI level is flat for a couple of days, sitting at 53.

Key levels to the upside                    Key levels to the downside

1: $251.4                                            1: $240

2: $260                                              2: $225.4

                                                           3: $217.6

Ripple

XRP slowly moved towards the $0.2 downside and tested the level after failing to break $0.205 due to the lack of volume. The third-largest cryptocurrency by market cap is in an inverse spot to Ethereum, as both the 21-period and 50-period moving averages are guarding the upside rather than the downside. XRP will require a substantial increase in volume in order to break this range. On top of that, unless it gets “pulled” up by Bitcoin or fundamentals, XRP is most likely to go under $0.2.


Key levels to the upside                    Key levels to the downside

1: $0.205                                           1: $0.2

2: $0.214                                           2: $0.19

 3: $0.227                                                        


Categories
Forex Market Analysis

Daily F.X. Analysis, June 10 – Top Trade Setups In Forex – US CPI and FOMC In Play! 

It’s going to be a busy day from the trading viewpoint as the U.S. CPI and FOMC will be the main highlight of the day. FED isn’t expected to cut the rates, but the CPI figures are expected to improve a bit, just like labor market figures. The dollar can stay stronger on sentiments until the actual data comes out.

Economic Events to Watch Today


 EUR/USD – Daily Analysis

The EUR/US is trading with a bullish bias below 1.1366 level. The price action of the EUR/USD pair remained flat throughout the Asian session. The President of the ECB (European Central Bank), Christine Lagarde, said that the central bank’s measure to fight the coronavirus crisis was proportionate to the severe risks facing its mandate. Lagarde said during a hearing at the Committee on economic and monetary affairs of the European Parliament, which was conducted via video conference that the crisis-related measures were temporary, targeted, and proportionate.

Besides, the ECB announced an additional 600 billion euros in its pandemic emergency purchase program (PEPP) and scaled up its previous 750 billion Euro, to extend the program till mid-2021. According to Lagarde, ECB continuously monitors the proportionality of its instruments, and she said that the net effects to be gained by PEPP expansion were overwhelmingly positive. The need for expansion was to avoid any deeper recession and quickening the pathway towards normalization.

When asked about the German court ruling of the ECB’s massive public sector purchase program, she said she was confident that a solution could be found because it was addressed to the German federal government and the German Parliament. On the data front, at 11:00 GMT, the German Industrial Production showed a decline of 17.9% in April against the expectations of 16% and weighed on shared currency euro. AT 13:30 GMT, the Sentix Investor Confidence from the Eurozone for June decline to 24.8 from the expected reduction of 22.0 and weighed on Euro.

The depressed Euro after inferior to expected German Industrial Production dragged the pair EUR/USD with itself to the low of 1.12680.

Meanwhile, Lagarde’s Speech explaining the benefits of ECB’s latest expansion in PEPP provided strength to Euro, which pushed the EUR/USD pair higher. For now, the eyes will remain on the U.S. CPI and FOMC data while the FED isn’t expected to change its policy rate, but the CPI can be a main driver in the market.  

Daily Support and Resistance

  • R3 1.1516
  • R2 1.1441
  • R1 1.1391

Pivot Point 1.1316

  • S1 1.1267
  • S2 1.1191
  • S3 1.1142

EUR/USD– Trading Tip

On Wednesday, the EUR/USD is consolidating in a narrow trading range of 1.1370 – 1.1276 level, and right now, it seems to break out of this trading range. On the lower side, the next target level seems to be 1.1185. Currently, the pair is facing immediate support around 1.1274 level, and closing of candles below this level may lead the EUR/USD prices further lower towards 1.1185 level, which is extended by the 50 EMA level. On the higher side, resistance holds at 1.1315 level today. Odds of bearish bias remains solid today.


GBP/USD – Daily Analysis

The GBP/USD continues to extend its 8-day winning streak and soars to 1.2766, the highest since March 12, 2020, mainly due to the broad-based U.S. dollar strength triggered by the geopolitical tensions between the Korean neighbors. Currently, the GBP/USD is holding at 1.2769 and consolidates in a new trading range of 1.2702 – 1.2815. However, the Brexit concerns remain on the card while showing no progress, which ultimately exerted some downside pressure on the British Pound and contributed to the currency pair declines.

It should be noted that the British retailers reported a sharp drop in annual sales last month, but less bad than April due to some COVID-19 restrictions eased, and more customers started online shopping.

At the data front, the British retail consortium May total sales -5.9% YoY vs. April -19.1% pct YoY, second-biggest fall since records began in 1995. The British retail consortium May like-for-like sales +7.9% YoY vs. April +5.7% YoY, excluding temporarily closed stores and including online sales. In the meantime, the Barclaycard U.K. may consider consumer spending -26.7% YoY vs. April -36.5% YoY.

However, the reason for limiting further losses in the currency pair could be attributed to the report that the United Kingdom and Japan are set to discuss the post-Brexit trade deal on the day which could underpin the cable pair.

At the USD front, the broad-based U.S. dollar recovered its previous session losses and drawing bids at press time as investors awaiting the next moves from the U.S. Federal Reserve ahead of its policy meeting. The U.S. dollar gains were further bolstered by the risk-off market sentiment triggered by the growth in geopolitical stresses between the Korean neighbors. However, the U.S. dollar’s bullish bias turned out to be one of the key factors that kept a lid on profits in the GBP/USD currency pair. Whereas, the U.S. Dollar Index that tracks the greenback against a basket of other currencies increased by 0.10% to 96.707 by 12:53 AM ET (5:53 AM GMT).

The U.S. 10-year Treasury yields fell 4-basis points (bps) to 0.844% while the stocks in Asia and the U.S. stock futures reported modest losses. The lack of significant data/events will urge the Cable traders to look for further details on risk catalysts for a fresh impetus. The UK-Japan trade talks and the US-China tension could offer hints and can help the greenback to gains further bullish traction.

Daily Support and Resistance

  • R3 1.2926
  • R2 1.2841
  • R1 1.2787

Pivot Point 1.2702

  • S1 1.2647
  • S2 1.2563
  • S3 1.2508

GBP/USD– Trading Tip

The bullish bias in the GBP/USD continues to dominate the market, and it’s leading the GBP/USD prices higher towards 1.2760 while the next resistance holds around 1.2816 level. Continuation of an upward trend can lead Sterling towards 1.2866 level while the support holds around 1.2707 level today. Below this, the prices can drop to 1.2638 level. On the 4 hour timeframe, the Cable has formed an upward channel that may keep the Sterling bullish today. Let’s look for buying over 1.2702 level today. 


USD/JPY – Daily Analysis

 The USD/JPY is trading dramatically bearish, falling from 107.900 level to 107.300. The USD/JPY remained strongly bearish throughout the Asian session, and it posted a steeper loss on Tuesday, followed by Mondays’ bearish trend amid the broad-based U.S. dollar weakness and improved Japanese economic outlook.

On the data front, at 4:50 GMT, the Bank Lending for the year from Japan increased to 4.8% in May from 2.9% in April. The Final GDP for the quarter decreased by 0.6% against the expected decline of 0.5% and weighed on Yen. 

At 4:52 GMT, the Current Account Balance for April came short of expectations of 0.33T as 0.25T and weighed on Japanese Yen. The Final GDP Price Index for the year came in line with the expectations if 0.9%. At 10:02 GMT, the Economy Watchers Sentiment, however, came in favor of Japanese Yen as 15.5 against the expected 12.6.

The preliminary reading of Japan’s Q1 GDP moved from -0.9% to -0.6% and came in better, which indicated the readiness of Japanese policymakers with extra stimulus if needed to fight against the pandemic.

Moreover, the better outlook of Japan’s current economic condition supported the Japanese Yen on Monday and weighed on the USD/JPY pair.

On the other hand, despite upbeat economic data from the U.S., the greenback lost its demand due to the drop in risk barometer that day. The rush of traders’ return from riskier assets weighed on the U.S. dollar and made it weak. 

Daily Support and Resistance    

  • R3 109.26
  • R2 108.91
  • R1 108.33
  • Pivot Point 107.97
  • S1 107.39
  • S2 107.03
  • S3 106.45

USD/JPY – Trading Tips

The USD/JPY is trading sharply bearish at 107.300 level, having violated the upward trendline at 107.600. Below this, the pair has a great potential to go for a 107.08 level, while a bearish breakout of 107.082 level can dip further until 106.770 level. On the 4 hour chart, the MACD, and RSI, both are holding in the selling zone, demonstrating that there’s further room for selling in the USD/JPY pair. Let’s consider taking selling trades below 107.97 today. Good luck! 

Categories
Forex Daily Topic Forex Fundamental Analysis

Everything About ‘Exports’ & The Impact Of Its News Release On The Forex Market

Introduction

Exports make one half of a country’s International Trade Balance. In today’s modern economy, with many countries pursuing their economic growth through the main focus on their exports, we must understand Export and its implications on the domestic as well as the global economy. The big words that are thrown around in the media like “Currency Wars,” “Trade Wars,” etc. all revolve around the exports among countries. A thorough understanding of the International Trade and Balance of Payments of countries can help us gauge economic growth on a macroeconomic level very well.

What is Exports?

The sale of locally produced goods to foreign countries is called Exports. Goods and Services produced in one country only when sold to other countries it is called an Export. Countries generally export goods and services that they have a competitive advantage over other countries. For example, Germans export Cars, America export Capital Goods, China export electronic goods, Jamaica exports Coffee, etc.

The advent of Globalization led to an increase in international trade opening doors for domestic industries to tap into the global market. The journey has not been smooth, during the Great Depression, and the following World War II slowed down international trade where many countries closed off their doors to foreign goods as part of protectionist strategies.

Before the 1970s, countries were following an import substitution strategy for growth where countries believed in self-sustenance by producing their goods and services without relying on foreign countries. After the 1970s, the countries began to realize the failure of import substitution and started opting for Export-led growth strategy, and that has been the case to date.

In general, a trade surplus, i.e., a country’s exports, exceeds its imports, is good for the economy. Although, it may not always be necessary as countries may import more than their current exports to build future and long term projects that will assist them in their economic prospects in the long run. In today’s world, China, the United States, Germany, Japan, and the Netherlands are the biggest exporters in the world in terms of revenue.

How can the Exports numbers be used for analysis?

Exports are crucial for today’s modern economies because of the many-fold that it brings with it to the exporting country. The following are the benefits and impacts of exports on the economy:

Broader Market – Companies always want to sell more and increase their profits. By exposing them to a broader range of audience gives them a much better chance of making profits than with a limited audience. By tapping into foreign markets, the domestic companies have to evolve to meet the local demands of other nations and learn how to mix what they sell and what is required by the world well. All this makes the companies grow more robust and overall increases their size and revenue a lot faster than what they would have achieved through operating domestically.

Wealth – Exports increase demand and, consequently, profits. It ultimately leads to employment, increases in wages, and ultimately raises the standard of living. Governments actively promote and encourage exports by reducing tariffs and use protectionist strategies like import barriers to protect their domestic business.

Foreign Reserves – As the trade happens between two countries with different currency regimes, where the payment can be in the domestic or foreign currency, this increases the Central Bank’s currency reserves. With sufficient currency reserves, the Government can manipulate exchange rates to control inflation and deflation by increasing or decreasing currency volume in the global market whenever needed.  During times of substantial exports, countries intentionally peg their currency value lower to make their products appear cheaper and increase the returns on their exports. China has been accused of this low pegging their currency in their favor. Subsequently, other countries have retaliated by lowering their currencies as well. It is what is being called “Currency Wars.”

Trade Surplus – It is always better to be owed money than to owe money as an individual. The same, in general, applies to countries that want to be net creditors to the world than net debitors. Increasing trade deficits can pile up the country’s debt, which can multiply over the years and can be very difficult to overcome. A healthy level of exports, in general, brings more money into the country and keeps the economy going at a steady and healthy growth rate.

Impact on Currency

Today’s global currency markets are free-floating and self-adjusting. Any sudden surge in exports will be followed by a rise in the currency value to compensate for the increased demand on the global market for its currency. A decline in exports will be followed by decreased demand for the currency, and accordingly, the currency depreciates.

Although the market forces are self-adjusting, frequent Government interventions to speed up the correction process to keep the output of the business constant is common.

Economic Reports

Exports form part of a country’s Trade Balance, which is reported under the Current Account Section of the International Balance of Payments Report of the country. The Balance of Payments reports is released quarterly and annually for most countries. The Trade Balance reports are published every month, which consists of Exports and Imports figures.

For the United States, the Bureau of Economic Analysis publishes the monthly Trade Balance reports on their website in the 1st week of every month for the previous month.

Sources of Exports

Impact of the ‘Exports’ news release on the price charts

In the previous section of the article, we understood the importance of Exports in an economy and saw how it contributes to the growth of the country. Exports are nothing but goods and services that are sent to the rest of the world, including merchandise, transportation, tourism, communication, and financial services. A nation that has positive net exports experiences a trade surplus, while a negative net exports mean the nation has a trade deficit. Net exports may also be called the balance of trade. Economists believe that having a consistent trade deficit harms a nation’s economy, creating pressure on the nation’s currency and forcing lowering of interest rates.

In today’s lesson, we shall analyze the impact of Exports data on different currencies pairs and observe the change in volatility due to the news release. A higher than expected number should be taken as positive for the currency, while a lower than expected number as negative. The below image shows the total Exports of Australia during the month of March and April. It is evident that there was an increase in Exports in the current month by 20%. Let us look at the reaction of the market to this data.

AUD/USD | Before the announcement:

We shall begin with the AUD/USD currency pair to witness the impact of Exports on the Australian dollar. The above image shows the state of the chart before the news announcement, where we see that the market is in a downtrend, and recently the price has displayed a reversal pattern indicating a possible reversal to the upside. Based on the Exports data, we will look to position ourselves in the currency.

AUD/USD | After the announcement:

After the news announcement, the market moves higher and volatility increases to the upside. The sudden rise in the price is a result of the extremely positive Exports data where there was a rise in the value by 20% compared to the previous month. This brought cheer in the market, making traders to ‘buy’ Australian dollars and thus, strengthening the currency. One can go ‘long’ in the market after the news release with a stop loss below the recent ‘low.’

AUD/NZD | Before the announcement:

AUD/NZD | After the announcement:

The above images are that of AUD/NZD currency pair, where we see that the market is in a downtrend that began just a few hours ago, and recently the price has shown sharp reversal from its recent ‘low.’ Technically this is an ideal reversal pattern that signals a reversal of the trend. One can take a risk-free ‘long’ position if the news announcement does not change the dynamics of the chart.

After the news announcement, the price sharply rises and closes, forming a strong bullish candle. As the Exports were exceedingly high, traders bought Australian dollars and increased the volatility to the upside. This could be a confirmation sign of the trend reversal, where we can expect the market to move much higher.

EUR/AUD | Before the announcement:

EUR/AUD | After the announcement:

The above images represent the EUR/AUD currency pair, where the first image shows the state of the chart before the news announcement. From the chart, it is clear that the overall trend of the market is up, but recently the price has shown a strong reversal pattern to the downside. Looking at the price action, we will prefer taking a ‘sell’ trade depending on the impact of the news release.

After the news announcement, the price falls lower, with an increase in volatility to the downside. The bearish ‘news candle’ is a consequence of the upbeat Exports data, which came out to be exceptionally well for the economy. Since the Australian dollar is on the right-hand side of the pair, traders sold the currency pair in order to strengthen the Australian dollar. This is a perfect ‘sell’ for all.

That’s about ‘Exports’ and its impact on the Forex market after its news release. If you have any questions, please let us know in the comments below. Good luck!

Categories
Forex Market Analysis

Daily F.X. Analysis, June 9 – Top Trade Setups In Forex – European GDP in Highlights! 

On the news front, the Eurozone is due to release series of high impact events that may drive movements in the Euro related currency pairs. The events like trade balance, GDP, and final employment change will be in the highlights.

Economic Events to Watch Today


EUR/USD – Daily Analysis

The EUR/US prices were closed at 1.12937 after placing a high of 1.3196 and a low of 1.12680. Overall the movement of the EUR/USD pair remained flat throughout the day.

On Monday, the President of the European Central Bank, Christine Lagarde, said that the central bank’s measure to fight the coronavirus crisis was proportionate to the severe risks facing its mandate.

Lagarde said during a hearing at the Committee on economic and monetary affairs of the European Parliament, which was conducted via video conference, that the crisis-related measures were temporary, targeted, and proportionate.

On Thursday in its monetary policy decision, ECB announced an additional 600 billion euros in its pandemic emergency purchase program (PEPP) and scaled up its previous 750 billion Euro, to extend the program till mid-2021.

According to Lagarde, ECB continuously monitors the proportionality of its instruments, and she said that the net effects to be gained by PEPP expansion were overwhelmingly positive. The need for expansion was to avoid any deeper recession and quickening the pathway towards normalization.

When asked about the German court ruling of the ECB’s massive public sector purchase program, she said she was confident that a solution could be found because it was addressed to the German federal government and the German Parliament.

On the data front, at 11:00 GMT, the German Industrial Production showed a decline of 17.9% in April against the expectations of 16% and weighed on shared currency euro. AT 13:30 GMT, the Sentix Investor Confidence from the Eurozone for June decline to 24.8 from the expected reduction of 22.0 and weighed on Euro.

The depressed Euro after inferior to expected German Industrial Production dragged the pair EUR/USD with itself to the low of 1.12680.

Meanwhile, Lagarde’s Speech explaining the benefits of ECB’s latest expansion in PEPP provided strength to Euro, which pushed the EUR/USD pair higher.

Lagarde’s Speech and economic data from Eurozone moved in the opposite direction, and hence, the pair EUR/USD remained flat throughout the day as it closed at the same level it was started with. No data was to be released from the American side, so the pair followed Euro’s directions.

Daily Support and Resistance

  • R3 1.1357
  • R2 1.1338
  • R1 1.1327

Pivot Point 1.1308

  • S1 1.1296
  • S2 1.1278
  • S3 1.1266

EUR/USD– Trading Tip

The EUR/USD is consolidating in a narrow trading range of 1.1370 – 1.1276 level, and right now, it seems to break out of this trading range. On the lower side, the next target level seems to be 1.1185. Currently, the pair is facing immediate support around 1.1274 level, and closing of candles below this level may lead the EUR/USD prices further lower towards 1.1185 level, which is extended by the 50 EMA level. On the higher side, resistance holds at 1.1315 level today. Odds of bearish bias remains solid today.


GBP/USD – Daily Analysis

The GBP/USD pair was closed at 1.27235 after placing a high of 1.27358 and a low of 1.26278. Overall the movement of GBP/USD remained bullish throughout the day. The broad-based U.S. dollar selling bias after the positive tone around greenback followed by Friday’s job report vanished pushed the pair GBP/USD higher on Monday. The currency pair GBP/USD raised for the 8th consecutive day on Monday and continued its bullish rally.

The weakness of the U.S. dollar was attributed to weak U.S. yields. The U.S. dollar index (DXY) turned negative on the day and fell back to below 97.00 level. The U.S. stock was high on the back of increased risk appetite.

On the other hand, the E.U. chief negotiator, Michel Barnier, was supposed to present a compromise proposal on access to British waters during the latest round of talks, but at the last minute, he was blocked to present the proposal by its member states with large fishing communities.

E.U. now expects the talks to drag into October, but the U.K. has ruled it out and said that it was unacceptable. E.U. wanted to intensify and accelerate its work to make progress with the negotiations, and the U.K. need to prepare its businesses for a new trading environment.

On the fishing issue, the E.U. wants the U.K. to follow the structures of standard fisheries policy (CFP) from the end of 2020. But British fishing communities claim that the policy left the U.K. with far too few fish to catch, so they want to be an independent coastal state from the end of 2020. On the data front, there was no macroeconomic data to be released from both sides so, the pair continued following its previous day’s trend and posted gains on the back of the risk-on market sentiment.

Daily Support and Resistance

  • R3 1.28
  • R2 1.2765
  • R1 1.2742

Pivot Point 1.2707

  • S1 1.2684
  • S2 1.2649
  • S3 1.2627

GBP/USD– Trading Tip

The GBP/USD’s overall trend is bullish as the pair continues to reach 1.2690 levels, having violated the triple top level on the 4-hour timeframe. The pair is retracing a bit; perhaps, investors are doing some profit-taking before taking any additional buying position in Sterling. Bullish trend continuation leads to GBP/USD prices towards the next resistance level of 1.2760 level. Above this, the next resistance holds around 1.2795 level. Conversely, the support is likely to be found around 1.2665 and 1.2601 level today. Let’s look for selling below 1.2707 and buying above this level today. 


USD/JPY – Daily Analysis

 The USD/JPY pair was closed at 108.426 after placing a high of 109.691 and a low of 108.232. Overall the movement of the USD/JPY pair remained strongly bearish throughout the day. The pair USD/JPY posted a steeper loss on Monday amid the broad-based U.S. dollar weakness and improved Japanese economic outlook. The pair dropped on Monday after posting gains for the previous four consecutive days.

On the data front, at 4:50 GMT, the Bank Lending for the year from Japan increased to 4.8% in May from 2.9% in April. The Final GDP for the quarter decreased by 0.6% against the expected decline of 0.5% and weighed on Yen. At 4:52 GMT, the Current Account Balance for April came short of expectations of 0.33T as 0.25T and weighed on Japanese Yen. The Final GDP Price Index for the year came in line with the expectations if 0.9%. At 10:02 GMT, the Economy Watchers Sentiment, however, came in favor of Japanese Yen as 15.5 against the expected 12.6.

The preliminary reading of Japan’s Q1 GDP moved from -0.9% to -0.6% and came in better, which indicated the readiness of Japanese policymakers with extra stimulus if needed to fight against the pandemic.

Moreover, the better outlook of Japan’s current economic condition supported the Japanese Yen on Monday and weighed on the USD/JPY pair.

On the other hand, despite upbeat economic data from the U.S., the greenback lost its demand due to the drop in risk barometer that day. The rush of traders’ return from riskier assets weighed on the U.S. dollar and made it weak. 

Daily Support and Resistance    

  • R3 110.81
  • R2 110.25
  • R1 109.34

Pivot Point 108.79

  • S1 107.88
  • S2 107.33
  • S3 106.42

USD/JPY – Trading Tips

The USD/JPY fell dramatically to violate the narrow trading range of 109.800 – 109.255, and now it’s trading somewhere around 107.900. On the 4 hour timeframe, the USD/JPY is likely to find support at 107.900, and below this, the upward trendline may extend support around 107.600 level. The Japanese currency pair has already crossed below 50 EMA, favoring selling bias in the pair today. Let’s consider taking selling trades below 108.50 today. Good luck! 

Categories
Crypto Market Analysis

Daily Crypto Review, Jun 09 – Bitcoin Gaining 700% Soon? Analyst Estimates BTC At $75,000

The crypto market has spent the day mostly with low volatility, except for the past few hours when the price bounced up and down quickly before returning to its original values.  Bitcoin is currently trading for $9,700, which represents a decrease of 0.56% on the day. Meanwhile, Ethereum lost 0.04% on the day, while XRP gained 0.16%.

Kyber Network took the position of today’s biggest daily gainer, with gains of 9.7%. Divi lost 23.7% of its daily value, making it the most prominent daily loser.

Bitcoin’s dominance increased slightly since we last reported, with its value currently at 66.12%. This value represents a 0.87% difference to the upside when compared to yesterday’s value.

The cryptocurrency market capitalization decreased slightly over the weekend, with the market’s current value being $276.08 billion. This value represents a decrease of $0.24 billion when compared to the value it had yesterday.

What happened in the past 24 hours

Bitcoin soon at $75,000?

Bitcoin analysis from Timothy Peterson (Cane Island Alternative Advisor) shows a strong possibility of BTC going to $75,000. The analysis is based on finding an uncanny similarity to Bitcoin’s chart movement in 2013. Peterson called this similarity “almost perfect.”

Peterson tracked Bitcoin’s price recovery from its 3,600 lows from mid-March, which (as he noted) looks almost exactly like the price action from seven years ago. If the price action from seven years ago can be translated into the future, Bitcoin should move 700% to the upside, giving it a price of around $75,000.

_______________________________________________________________________

Technical analysis

_______________________________________________________________________

Bitcoin

The largest cryptocurrency by market capitalization has spent the day mostly without any large price fluctuations. The market has been slow except for one single candle which tried to break both the upside and downside key levels but failing to do either completely.


Bitcoin’s volume is on the same levels as over the past week, while its RSI level fell to 50. The key level of $9,735 will be moved to the “upside” once the break is confirmed.

Key levels to the upside                    Key levels to the downside

1: $9,870                                           1: $9,735

2: $10,010                                         2: $9,580

                                                           3: $9,250

Ethereum

Ethereum had quite a slow day as well, with its price making a move only in a recent couple of candles. While one candle was strictly bullish, the other one had large wicks to both the upside and downside. The 21-period moving average seems to be holding the price quite well.


Ethereum’s volume increased in the past few candles, while its RSI level came down to 54.

Key levels to the upside                    Key levels to the downside

1: $251.4                                            1: $240

2: $260                                              2: $225.4

                                                           3: $217.6

Ripple

XRP made a move towards the upside and spent the whole day trying to break the $0.205 resistance level. However, the move was unsuccessful, triggering a severe drop, which even broke the $0.2 support level for a few minutes. However, the bulls came back almost instantly and picked up where they left off, threatening the $0.205 resistance level once again.


A break above $0.205 with an increase in volume (or a confirmation of breaking $0.205) could be a good trading opportunity for scalp traders.

Key levels to the upside                    Key levels to the downside

1: $0.205                                           1: $0.2

2: $0.214                                           2: $0.19

 3: $0.227                                                        


Categories
Forex Fundamental Analysis

The Importance Of ‘Government Revenue’ As An Economic Indicator

Introduction

Government Revenue is one half of the Government Budget that will shape the economic growth for the fiscal year. It is closely watched statistic by traders and investors to analyze the policy maker’s behavioral trends, actions, and corresponding economic consequences for the current fiscal year.

What is Government Revenue?

Government revenue is the money received from tax receipts and other non-tax sources by a government that allows the Government to maintain the economy, finance its functions, and undertake government expenditures. The Federal Government receives income through a variety of sources which are as follows:

Taxes

Taxes are the most important source of Government revenue, with various forms of tax income coming to the Government. The personal individual income tax makes a significant part of the tax revenue of the Government. Other forms of tax like business or corporate tax, consumption tax, value-added land tax, tax on city maintenance and constructions, enterprise income tax, resource tax, etc. are other forms in which the Government collects taxes. Taxes are a compulsory payment from the consumers and businesses of the economy without any quid pro quo (i.e., getting nothing in return for tax payments from the Government).

Rates or Rental Incomes

These refer to local taxations. The rates are usually proportional to the rentable value of a business or domestic properties. It can take the form of Government-owned lands and buildings leased out for businesses or organizations.

Fees

These are the income the Government receives for its services. These could include services like public schools, insurance, etc.

License Fees

These are the payments received for authorizing permission or privilege. For example, issuing a building permit, or driving license, etc.

Public Sector Surplus

Revenue generated through sales of goods and services like water connection, electricity, postal services, etc.

Fines and Penalties

This is not intended to generate revenue but to make the public adhere to the law. Examples would include parking tickets or speeding tickets.

Gifts

These are the donations received from non-government members of the country and form a small portion of the Government’s revenue. These are usually received to help the Government during wars or emergencies.

Borrowing

This is the least preferred way to raise capital. The Government can borrow from investors in the form of bonds to finance its operations, and this method, although prevalent, is not preferable.

Below is a snapshot of the Federal Government’s Revenue from various sources:
(Picture Source – Fiscal Treasury)

How can the Government Revenues numbers be used for analysis?

The amount the Government receives in revenues determines how much it can spend. The revenue generated is directly correlated to the GDP. The GDP is directly influenced by how much the Government spends on the economy to spur growth. Both are linked in a feedback loop. By effectively drafting out the Federal Policy for a fiscal year, the Government can increase or decrease their tax revenues.

When the Government increases tax revenues, it may receive more than its fiscal expenditures, but that would burden the consumers and business. When taxes are increased, it leaves less money for people to spend, and people prefer to save than invest. It slows down the economy, and correspondingly a deflationary environment begins to start, and the economy risks going into a stagnation or worse a recession. During these times, the GDP will fall, and correspondingly the next fiscal year’s revenue would decline.

When the Government cuts back on taxes levied, the revenue decreases for the Government, but consumers and businesses would have more disposable income on their hand, which would encourage spending and thus stimulating the economy. It would keep the GDP growth positive and maintain a reasonable inflation rate. Consequently, this leaves little room for Government expenditures. When the expenditure is low, the stimulus is low, which results in a slowdown in the economic activity in the next business cycle.

Hence, Government Revenue and Government Expenditure both are two levers that have to be carefully adjusted to achieve an optimal balance for the healthy functioning of the economy. Too much spending with little revenue results in deficits that piles up debt burden in the long run. Too much revenue with little spending slows down the economy.

In recent times, most of the developed economies’ Governments have been failing to maintain steady growth without low tax and increased spending that has resulted in substantial deficits for the Government. Hence, monitoring Government revenue and its corresponding expenditures in the fiscal policy has become essential for traders and investors in the recent times, as the deficits increase Sovereign Credit Risk (defaulting on debt), or threaten the economy into a recession.

Impact on Currency

In an ideal situation, where a Government has zero debt and has a balanced budget (taxes and spending equal) would contribute to a steady and stable economy. An increase in tax revenues would indicate high GDP prints indicating a growing economy.

But in the real world, most of the Governments are debt-ridden, and an increase in tax revenues means the burden on the citizens and businesses,  which deflates the economy as it takes money out of the economy the currency appreciates and vice versa. Hence, Government revenue is a proportional indicator where decreased revenue deflates the economy and currency appreciate in the short-run (for the fiscal year) and vice versa.

More importantly, Government Revenue is half of the equation, what the Government spends on is the second half. It is, therefore, beneficial to keep both figures in consideration to assess economic growth in the near term.

Economic Reports

For the United States, the Treasury Department releases monthly and annual reports on its official website. The treasury statements detailing the Fiscal Policy containing Government revenue and expenditures are released at 2:00 PM on the 8th business day every month. The World Bank also maintains the annual Government Revenue and Spending data on its official website, which is easily accessible.

Sources of Government Revenues

United States Monthly Fiscal Policy statements can be found below.

Monthly Treasury Statement – United StatesGovernment Revenue as a percent of GDP

We can find Government Revenues for the OECD countries below.

Government Revenues – OECDWorld Bank – Government Revenue data

We can find the monthly Government Revenue statistics of world countries here –

Trading Economics – Government Revenues

Impact of the ‘Government Revenues’ news release on the price charts

After getting a clear understanding of the Government Revenue economic indicator, we will now extend our discussion and find the impact it makes on various currency pairs. The revenue of a government is used for multiple reasons, that directly or indirectly facilitates the growth of the country. Revenue is basically the amount of money that is brought into the Government’s kitty through various activities.

These revenues are received from taxation, fees, fines, inter-government grants or transfers, security sales, resource rights, as well as any other sales that are made. However, investors believe that the data does not have a major impact on the currency and is not of great value when it comes to fundamental analysis.

Today, we will be analyzing the impact of Government Revenue data of Brazil on the Brazilian Real. We can see in the snapshot below that the Brazilian Government received less revenue in the month of March compared to its previous month. A higher than expected reading should be taken as positive for the currency while a lower than expected reading is taken as negative. Let us find out the reaction of the market.

Note: The Brazilian Real is an illiquid currency, and hence there will be lesser price movement on charts.

USD/BRL | Before the announcement:

We shall start with the USD/BRL currency pair to examine the change in volatility due to the announcement. The above image shows the characteristics of the chart before the news announcement, where we see that the market is in a strong uptrend with gap ups every subsequent day. This means the Brazilian Real is extremely weak, and there is no price retracement until now. Technically, we will be looking to buy this currency pair after the price retraces to a key ‘support’ or ‘demand’ level.

USD/BRL | After the announcement:
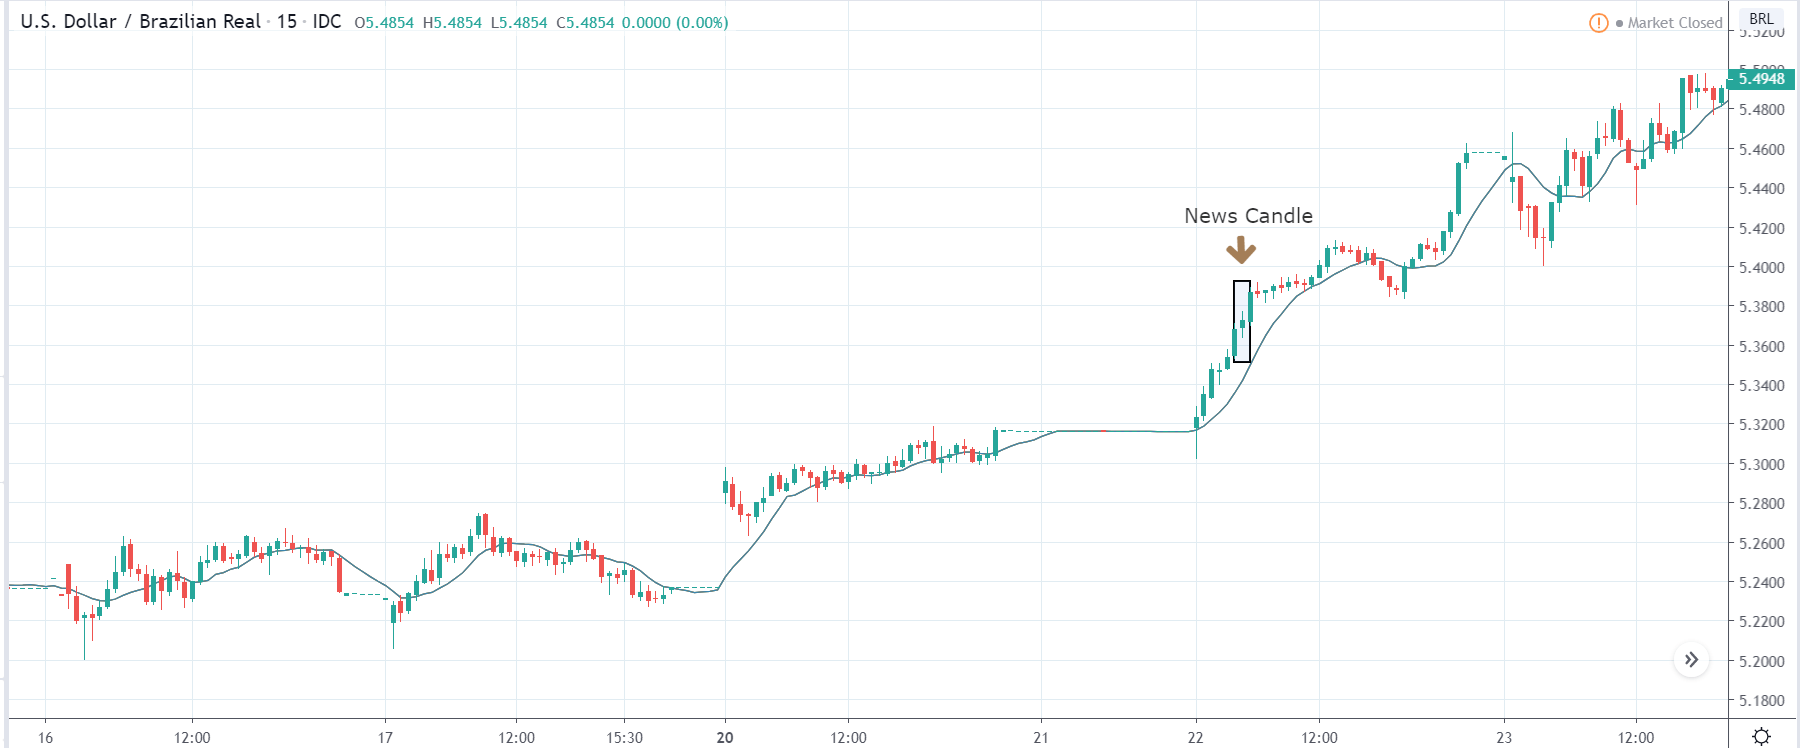
After the news announcement, the market moves higher and volatility expands on the upside. The Brazilian Real weakened further as a result of weak Government Revenues data where there was a reduction in net revenues for the current month. Traders bought U.S. dollars after the news release, which took the price much higher. The bullish ‘news candle’ is an indication of the continuation of the trend, but still, we need to wait for a retracement to enter the market.

EUR/BRL | Before the announcement:
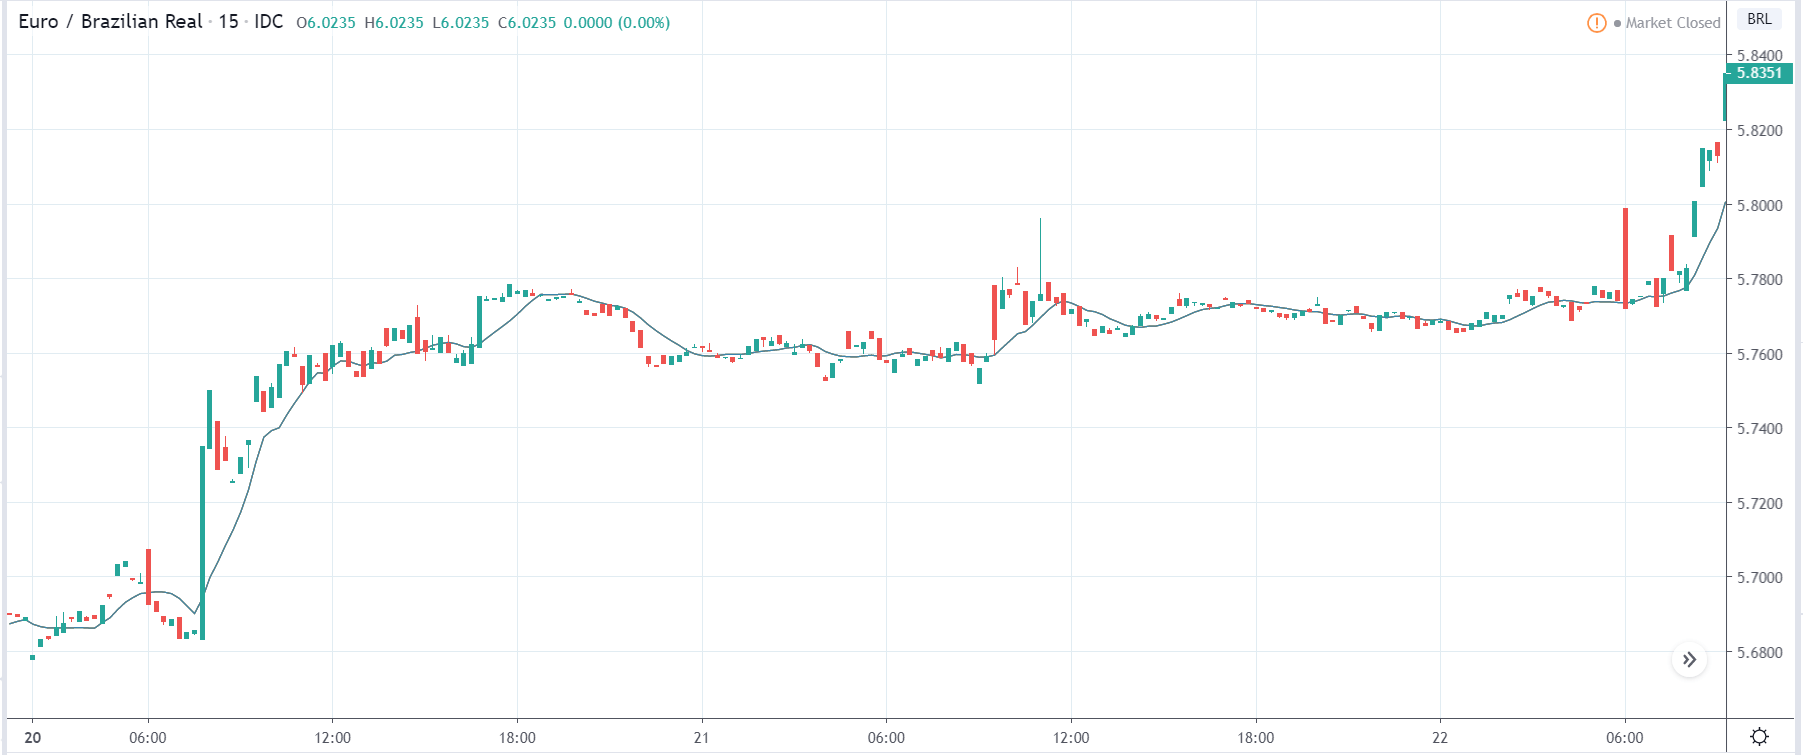
EUR/BRL | After the announcement:
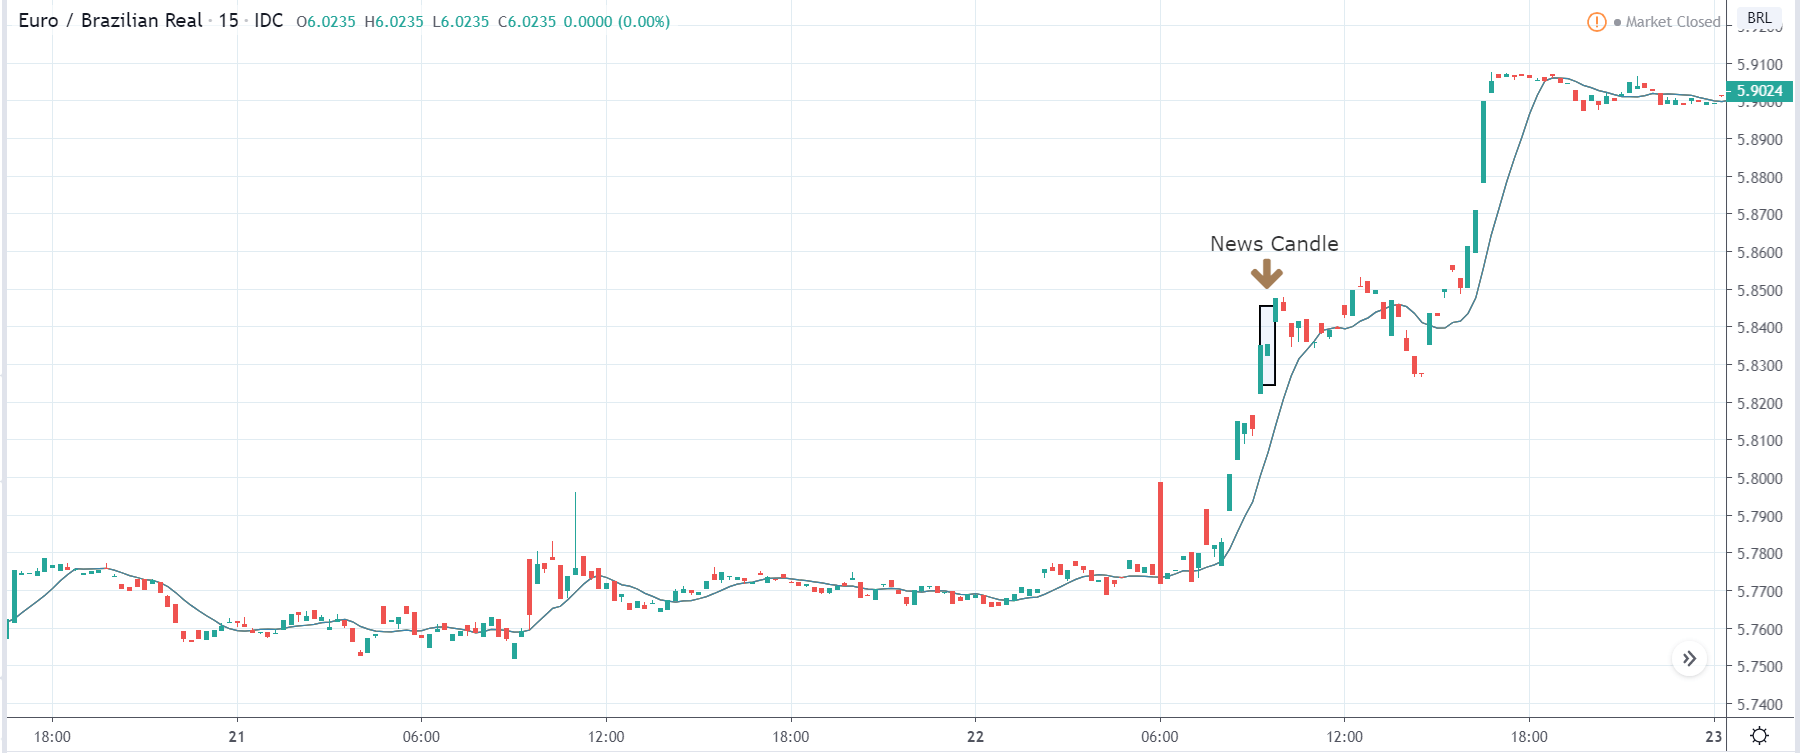
The above images represent the EUR/BRL currency pair that shows the state of the chart before and after the announcement. In the first image, it is clear that the market is again in a strong uptrend, and the price has recently broken out of the ‘range.’ Since the market is violently moving up, we should wait for the price to pull back near a ‘support’ area so that we can join the trend. We should never be chasing the market.

After the news announcement, the market reacts positively to the news data, and the price closes as a bullish candle. The increase in the volatility to the upside is a consequence of the poor Government Revenue data, where the Government collected lesser revenue in that month. The news release has a fair amount of impact on the pair that essentially weakened the currency further.

BRL/JPY | Before the announcement:

BRL/JPY | After the announcement:
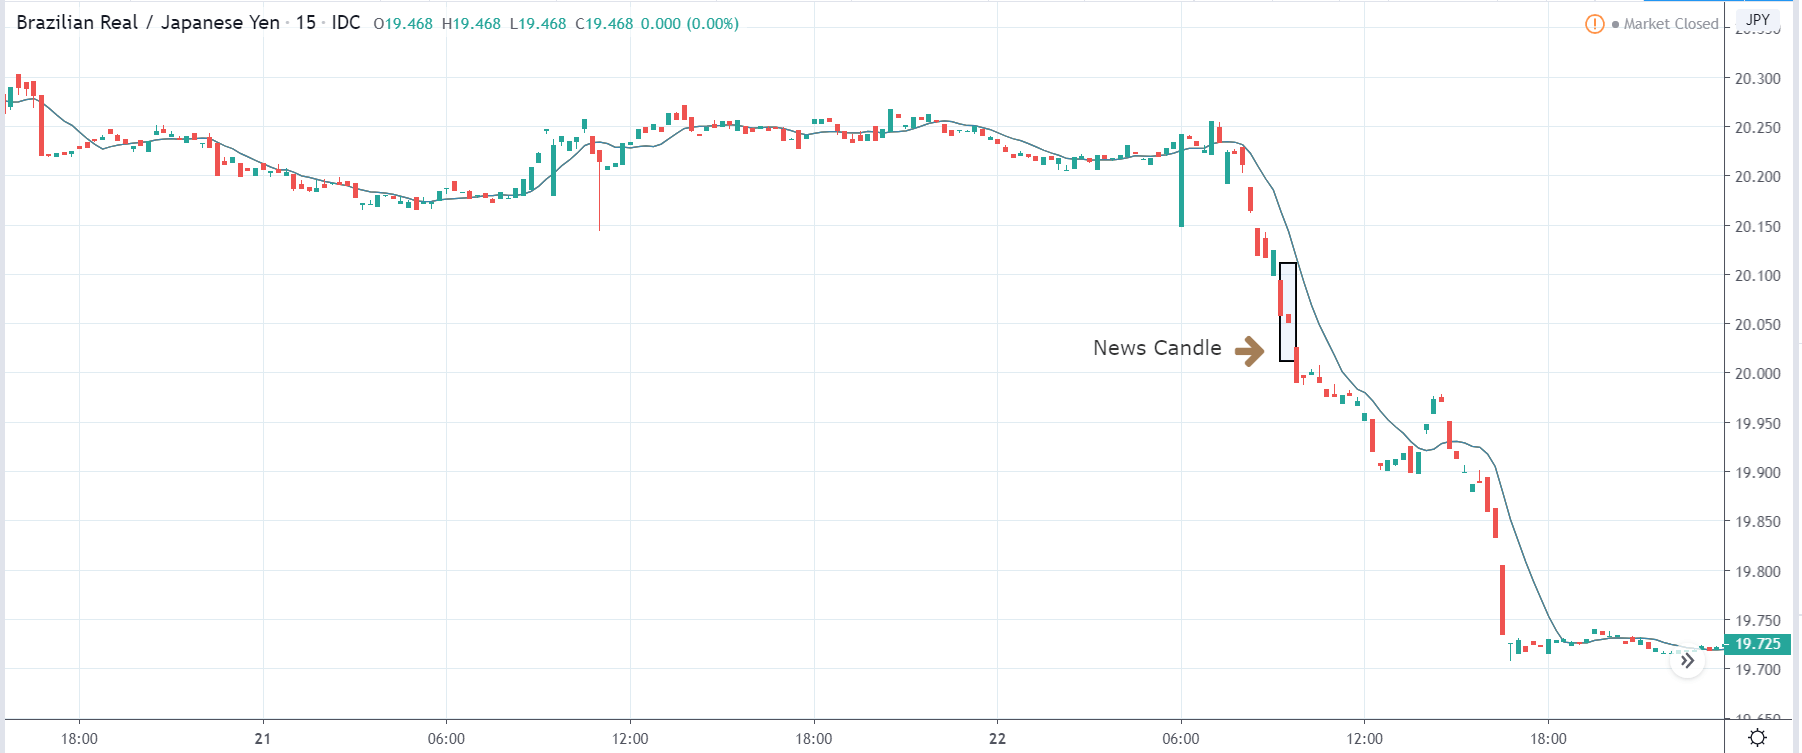
The above images are that of the BRL/JPY currency pair, where we see that the market is a strong downtrend before the news announcement and is currently at its lowest point. Since the Brazilian Real is on the left-hand side of the pair, a down-trending market signifies a great amount of weakness in the currency. We need to wait for the price retracement to a ‘resistance’ area so we can take a ‘short’ trade.

After the news announcement, the volatility expands on the downside, and the market moves further down. The ‘news candle’ closes with signs of bearishness, and later too, the price continues to move lower. This was the impact of the news on this pair. We should wait for the price to retrace to join the downtrend.

That’s about ‘Government Revenues’ and its impact on the Forex market after its news release. If you have any questions, please let us know in the comments below. Good luck!
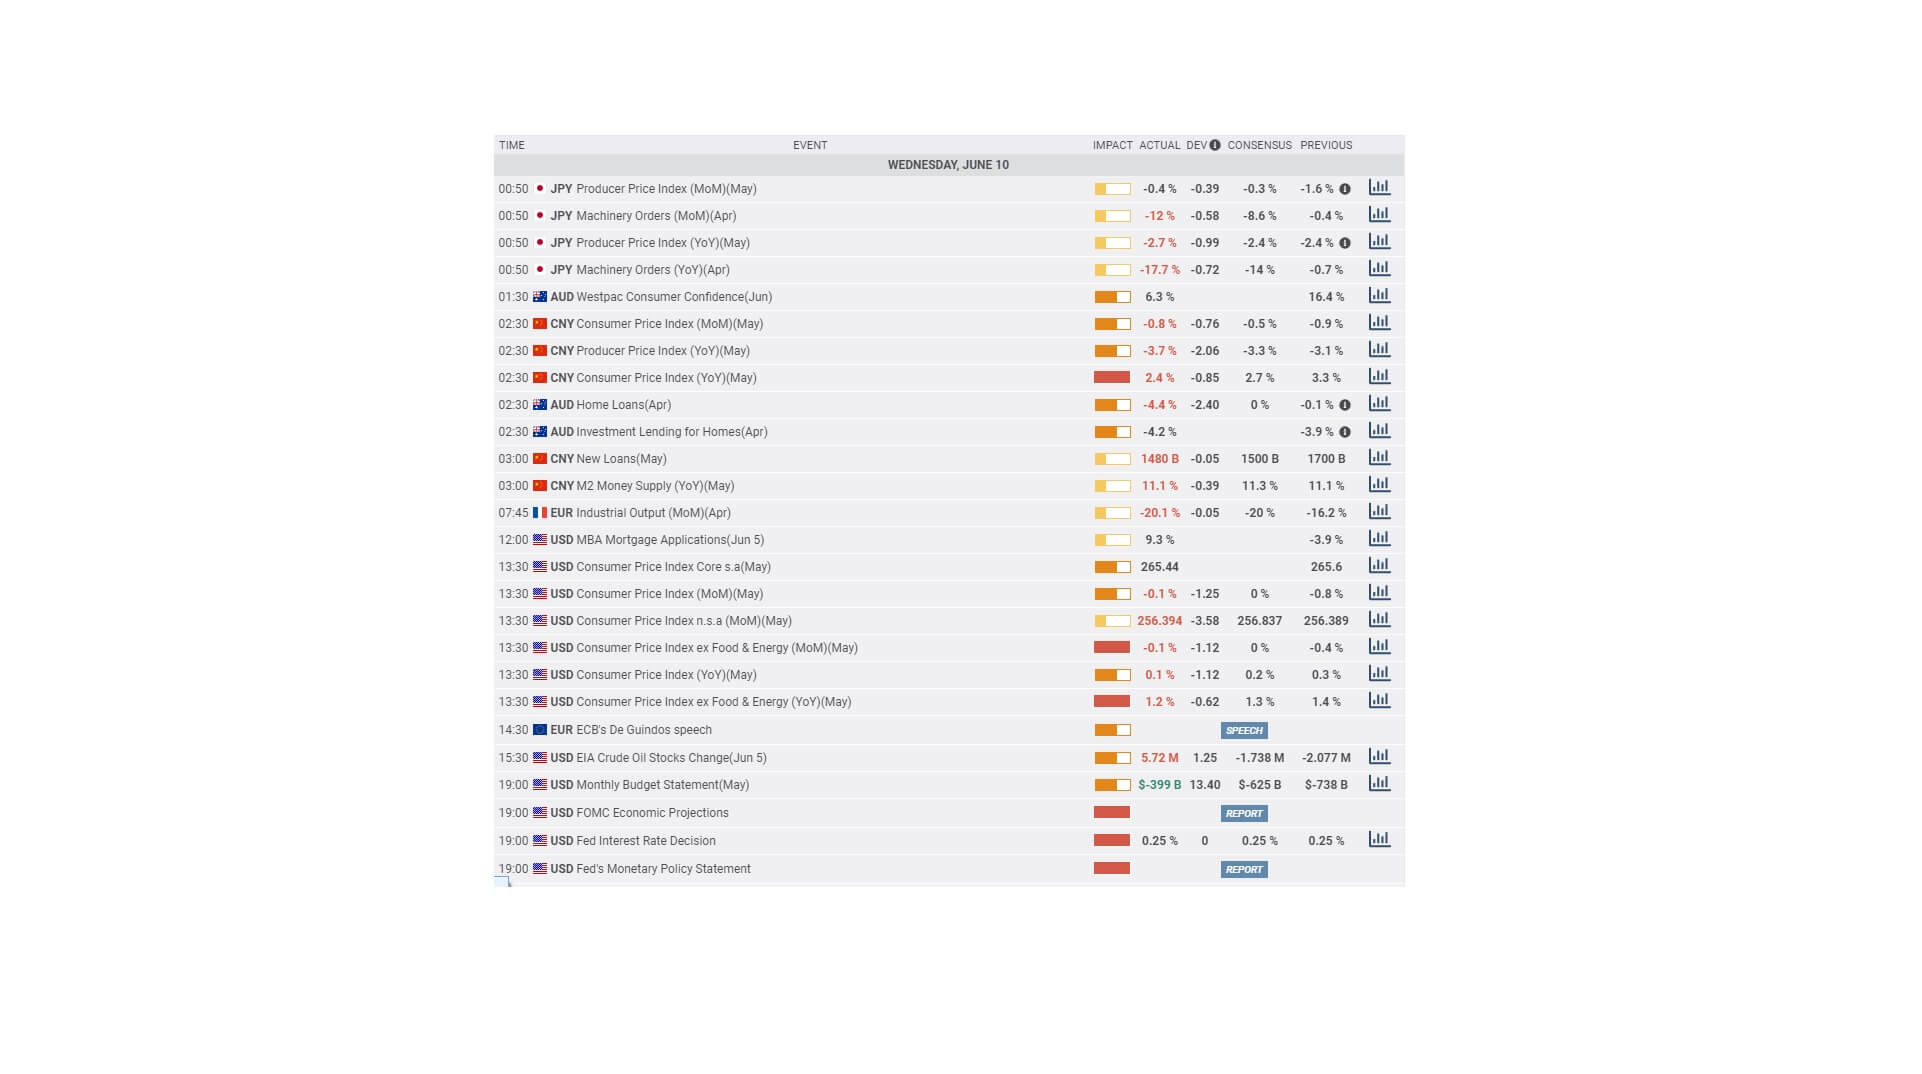
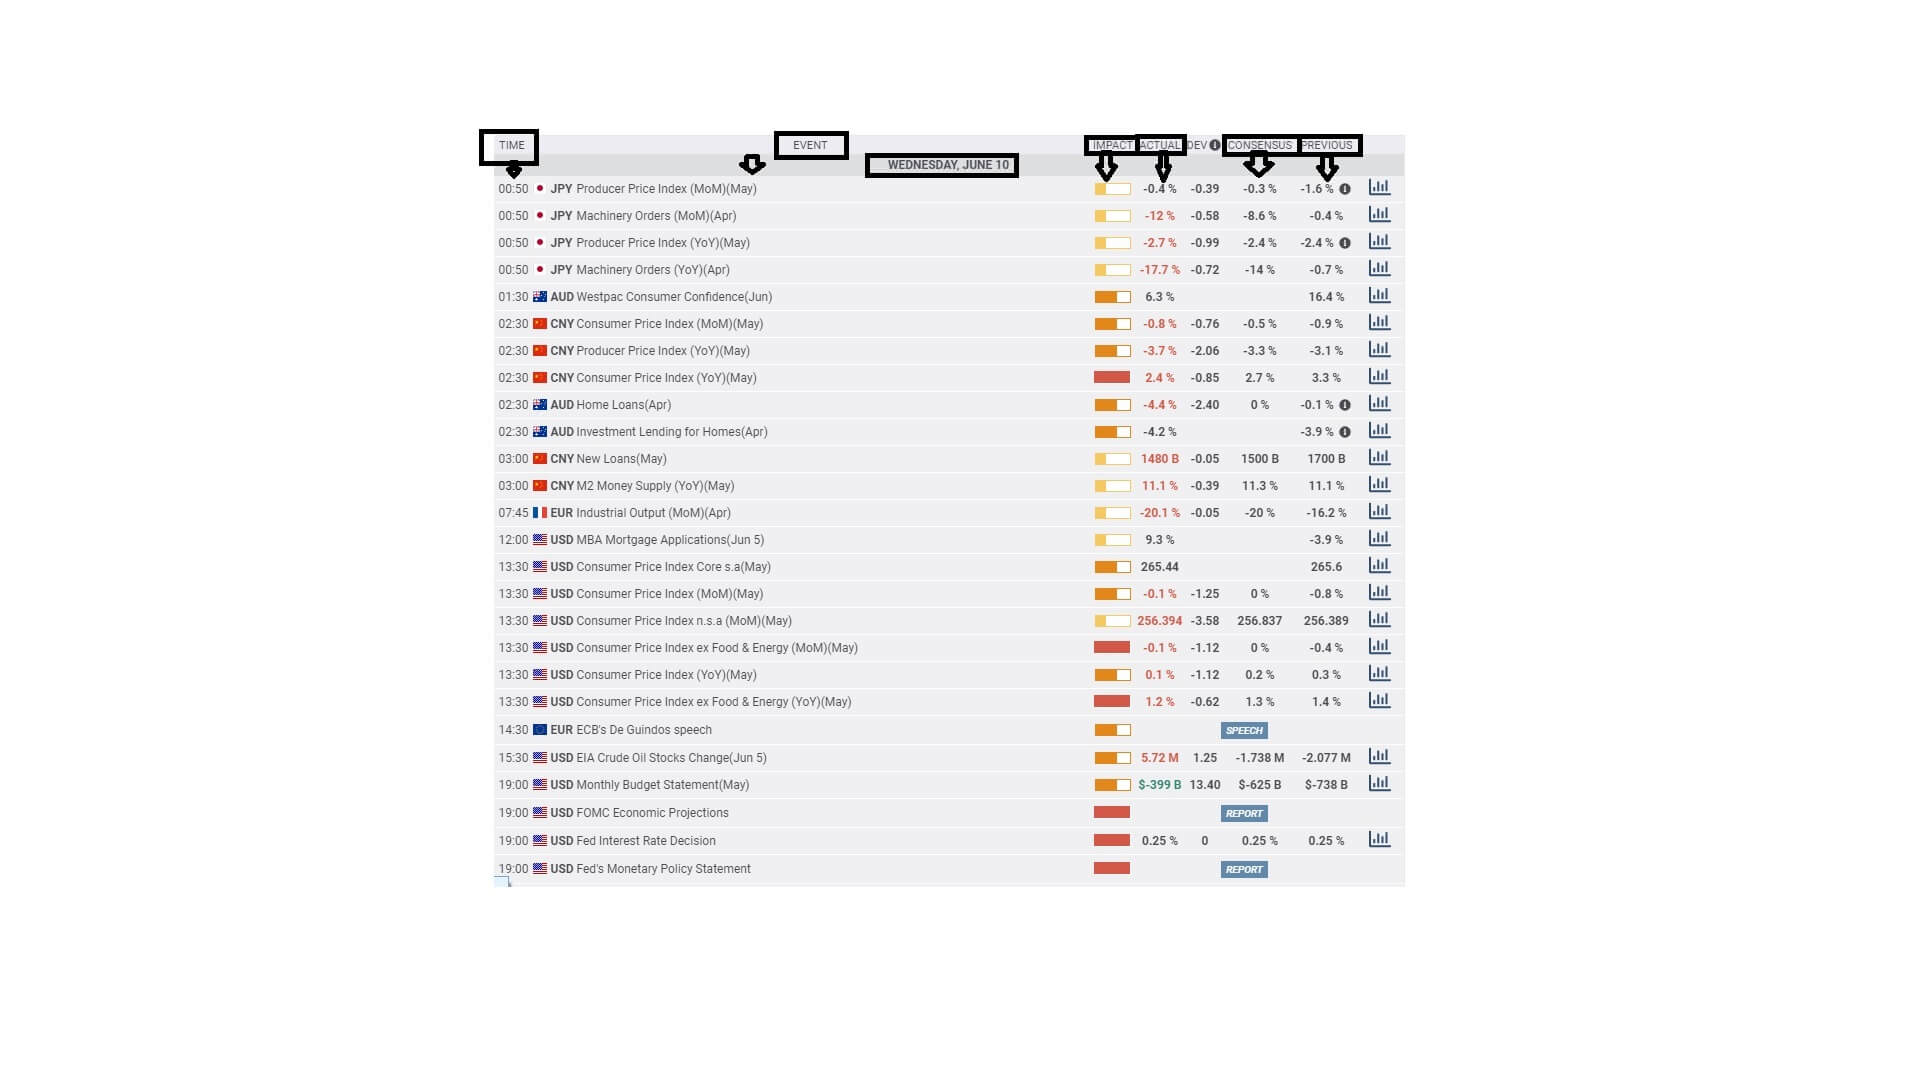
Categories
Forex Market Analysis

Daily F.X. Analysis, June 8 – Top Trade Setups In Forex – Dollar Strengthens Over NFP! 

On the news front, the eyes will remain on the German Industrial Production m/m and ECB President Lagarde Speaks. Both of these may have an impact on the Euro related currency pairs.

Economic Events to Watch Today


EUR/USD – Daily Analysis

The EUR/USD pair was closed at 1.12911 after placing a high of 1.13835 and a low of 1.12781. Overall the movement of EUR/USD remained bearish throughout the day. The EUR/USD pair rose to 1.13835 near 13-weeks highest level but failed to remain there and broke its nine days bullish streak and fell on Friday amid U.S. dollar strength across the board after the release of US Non-Farm Employment Change.

The pair EUR/USD was on bullish track after the announcement of an additional 600 billion euros in the emergency package from the European Central Bank on Thursday. The package was announced to cover up the losses faced after the coronavirus induced lockdowns across the globe and its impact on the global economy.

The additional 600 billion euros by ECB in its pandemic emergency purchase program (PEPP) made the total size of aid provided after the coronavirus crisis to 1.35 trillion euros. ECB also said that the updated forecast about GDP showed a contraction of 8.7% this year, and the inflation expectations were to rise by 0.3% this year and 0.8% in next year. EUR/USD moved in an upward direction after the ECB’s PEPP announcement and continued to follow the trend in early sessions on Friday and rose above 13-weeks higher level.

However, after the release of US Non-Farm Employment Change, the pair EUR/USD started to move in the opposite direction at the ending day of the week. At 17:30 GMT, the Non-Farm Employment Change from the United States showed that 2.509M people were hired in May against 7.750M of job loss expectations. A stronger than expected job report from the U.S. gave strength to the U.S. dollar across the board and weighed on EUR/SD pair.

Adding in the strength on the U.S. dollar was the Unemployment Rate, which came in as 13.3% against the expectations of 19.4% and further dragged down the pair EUR/USD pair.

On the other hand, from the Europe side, at 11:00 GMT, the German Factory Orders for April were also released which showed that factory orders were reduced by 25.8% in April against the expected drop of 20% and weighed on Euro which ultimately dragged the pair in a downward trend.

Daily Support and Resistance

  • R3 1.1357
  • R2 1.1338
  • R1 1.1327

Pivot Point 1.1308

  • S1 1.1296
  • S2 1.1278
  • S3 1.1266

EUR/USD– Trading Tip

The EUR/USD is also following a bearish trend on the back of a stronger dollar. Currently, the pair is facing immediate support around 1.1284 level, and closing of candles below this level may lead the EUR/USD prices further lower towards 1.1244 level, the support, which is extended by the 50 EMA level. On the higher side, resistance holds at 1.1315 level today. Odds of bearish bias remains solid today.


GBP/USD – Daily Analysis

The GBP/USD was closed at 1.26689 after placing a high of 1.26901 and a low of 1.25828. Overall the movement of GBP/USD pair remained bullish throughout the day. The pound rose for 7th consecutive day on Friday amid the rising hopes for a deal between E.U. & U.K. but lost some of its daily gains after the release of U.S. on-Farm Employment Change.

Matt Hancock, the Cabinet Minister of the U.K., said that a trade deal with the E.U. was still possible on very reasonable demands. In the latest rounds, both sides admitted that a little progress was made, and they were very hopeful that no-deal outcomes to the talks could be avoided.

The U.K. & E.U. differences have remained under four key points of fisheries: competition rules, governance, and police cooperation. UK PM Boris Johnson and President of European Commission, Ursula von der Leyen, are expected to meet later this month.

The U.K. has only until the end of June to apply for the extension of the transition period, but Johnson has ruled it out. However, the hopes that U.K. & E.U. will reach a deal after the described little progress in talks from both sides increased, and hence, the pair GBP/USD found traction in the market.

Whereas, the investors think that chances for no-deal Brexit were more than ever because the coronavirus pandemic will lead to one of the worst recessions in modern history, and investors think that hardcore Brexiteers will use the recession as a perfect distraction to get to a no-deal Brexit done.

On the data front, at 12:30 GMT, the Halifax Housing Price Index for May from the United Kingdom was declined by 0.2% against the expected decline of 0.7% and supported British Pound which ultimately pushed the GBP/USD pair on bullish track on Friday and added in the pair gains.

Meanwhile, the U.S. dollar strength after the release of US Non-Farm Employment Change exerted pressure on the rising prices of GBP/USD pair on Friday and made it lose some of its daily gains.

Daily Support and Resistance

  • R3 1.28
  • R2 1.2765
  • R1 1.2742

Pivot Point 1.2707

  • S1 1.2684
  • S2 1.2649
  • S3 1.2627

GBP/USD– Trading Tip

On Monday, the technical side of the GBP/USD seems bullish as the pair continues to reach 1.2690 levels, having violated the triple top level on the 4-hour timeframe. The GBP/USD pair has formed an upward regression trend channel, and it’s driving further buying trend in the Cable. Bullish Continuation of a bullish trend can lead to GBP/USD prices towards the next resistance level of 1.2760 level. Above this, the next resistance holds around 1.2795 level. Conversely, the support is likely to be found around 1.2665 and 1.2601 level today. Let’s look for selling below 1.2707 and buying above this level today


USD/JPY – Daily Analysis

The USD/JPY was closed at 109.573 after placing a high of 109.848 and a low of 109.042. Overall the movement of USD/JPY remained bullish throughout the day. The USD/JPY pair surged for the fourth consecutive day on Friday and gained some strong follow-through traction after the release of surprisingly stronger than expected U.S. monthly jobs data. The headline data of Friday, NFP, showed that 2.509M jobs were added in May, whereas the forecast was about 8M job loss.

Adding in the optimism was the unemployment rate, which beat the market expectations and was reported as 13.7% against 19.4% of expectations. Better than expected, data from the U.S. economy raised the bars for recent optimism over the sharp V-shaped recovery for global economic recovery. This increased the already stronger risk appetite In the market and hence, the USD/JPY pair gained for the 4th consecutive day on Friday.

At 4:30 GMT, the Household Spending for the year from Japan was declined by 11.1% against the expected decline of 12.8% and supported the Japanese Yen. At 10:00 GMT, the Leading Indicators from Japan remained flat with the expectations of 76.2%.

From the American side, the Average Hourly Earnings in May was declined by 1.0%, whereas it was expected to rise by 1.0%. The US Non-Farm Employment Change showed that 2.509M people were hired back in May, which were expected to show job loss of 7.750M people. The Unemployment Rate in April fell short of 19.4% expectations and came in as 13.3% and supported the U.S. dollar.

Daily Support and Resistance    

  • R3 109.79
  • R2 109.74
  • R1 109.67

Pivot Point 109.62

  • S1 109.56
  • S2 109.5
  • S3 109.44

USD/JPY – Trading Tips

The USD/JPY is consolidating in a narrow trading range of 109.800 – 109.255. The stronger than expected NFP figures drove buying in the USD/JPY pair on Friday, but now the traders seem to capture retracement in the market. A bearish breakout of 109.280 level can drive selling until the next support level of 109, which marks 38.2% Fibonacci retracement. The 50 EMA and MACD both are supporting the buying trend in the USD/JPY pair, and it can lead the USD/JPY prices further higher today. On the higher side, the resistance holds around 109.850. Let’s wait for a breakout of 109.800 – 109.255 to determine further trends in the USD/JPY pair. All the best for today!