Fundamental Analysis For Novices: Redbook Index
Welcome to the educational video for novices on fundamental analysis. In this video, we will be looking at the Redbook index.
So what is the Redbook index, and how can it help you trading forex?

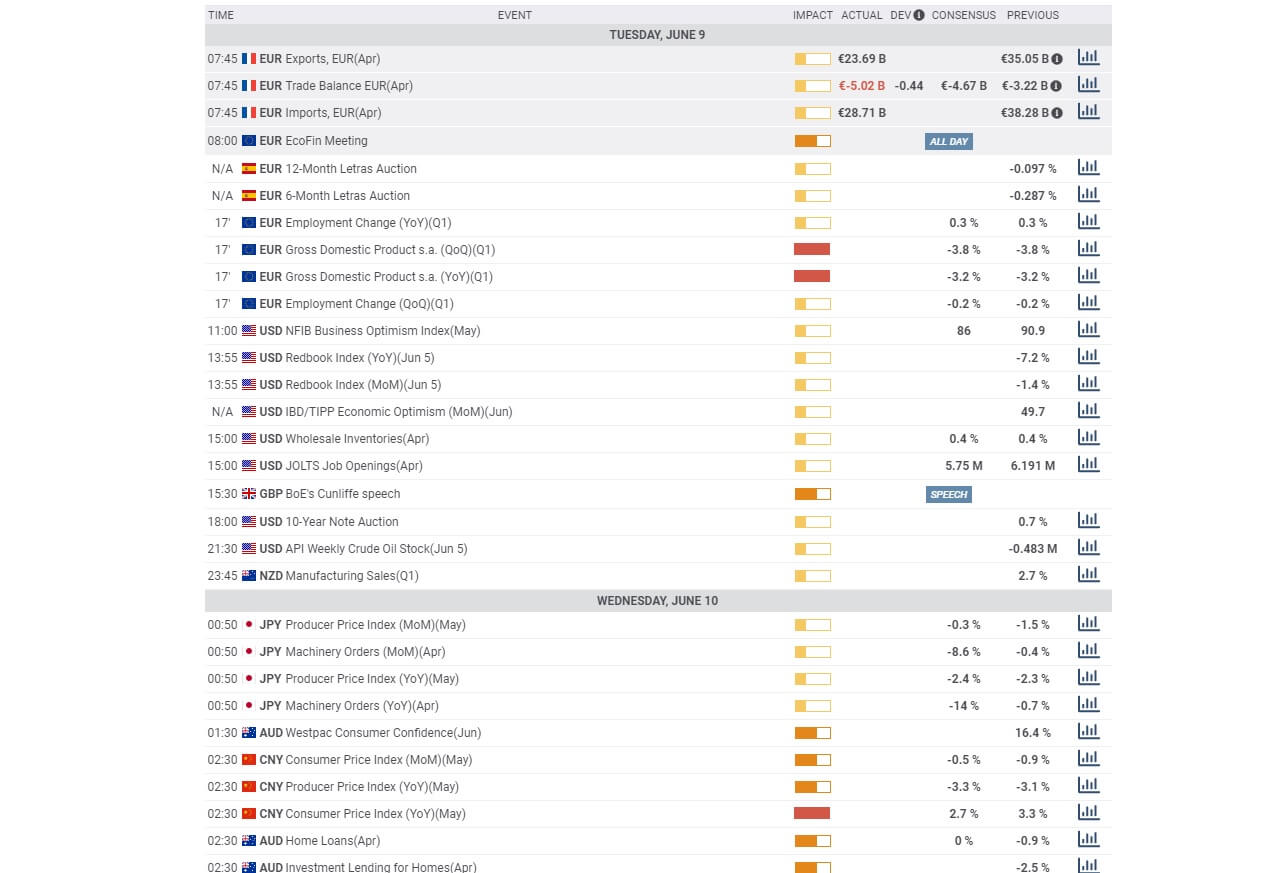
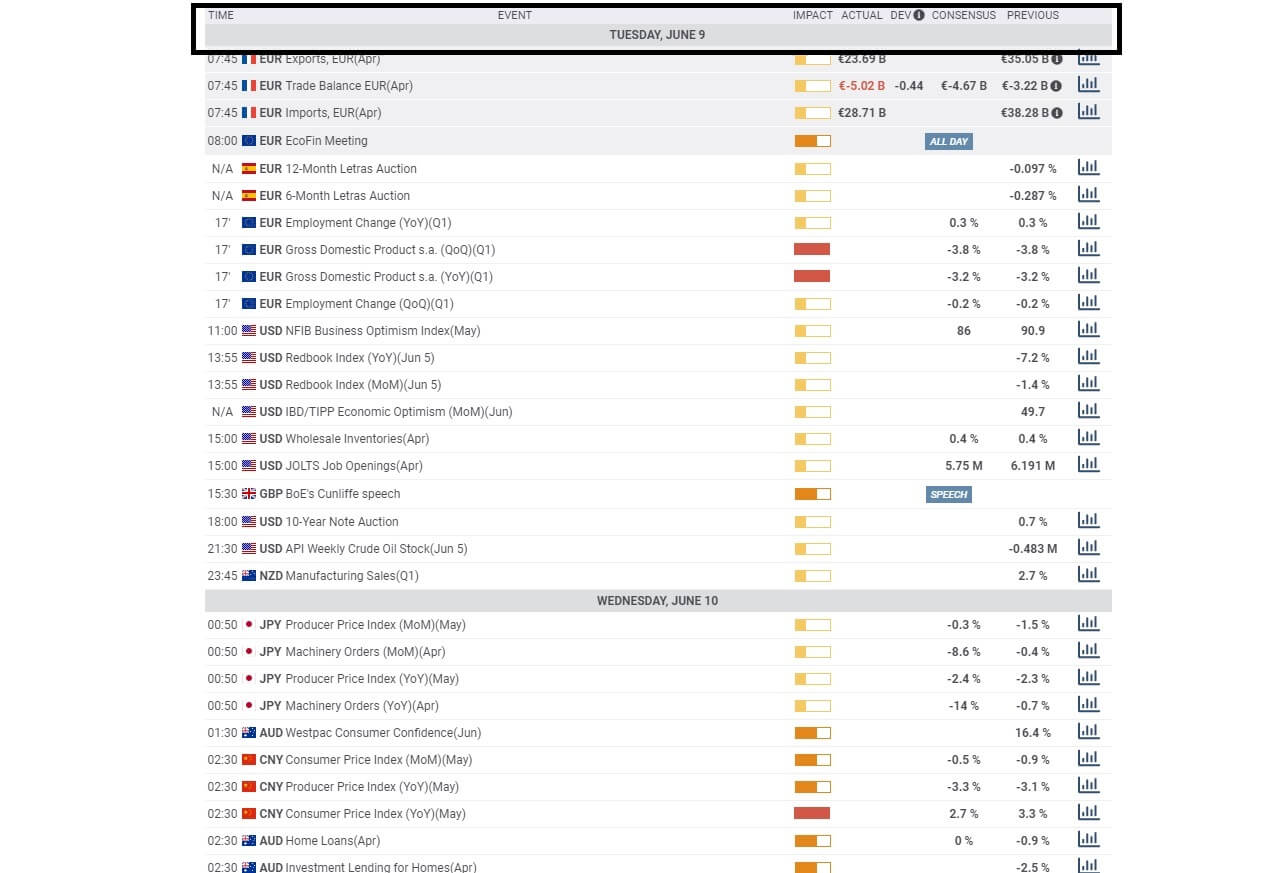
Successful traders keep a close eye on their economic calendar. They review it at least once a day. This is a typical calendar which is provided by most brokers.

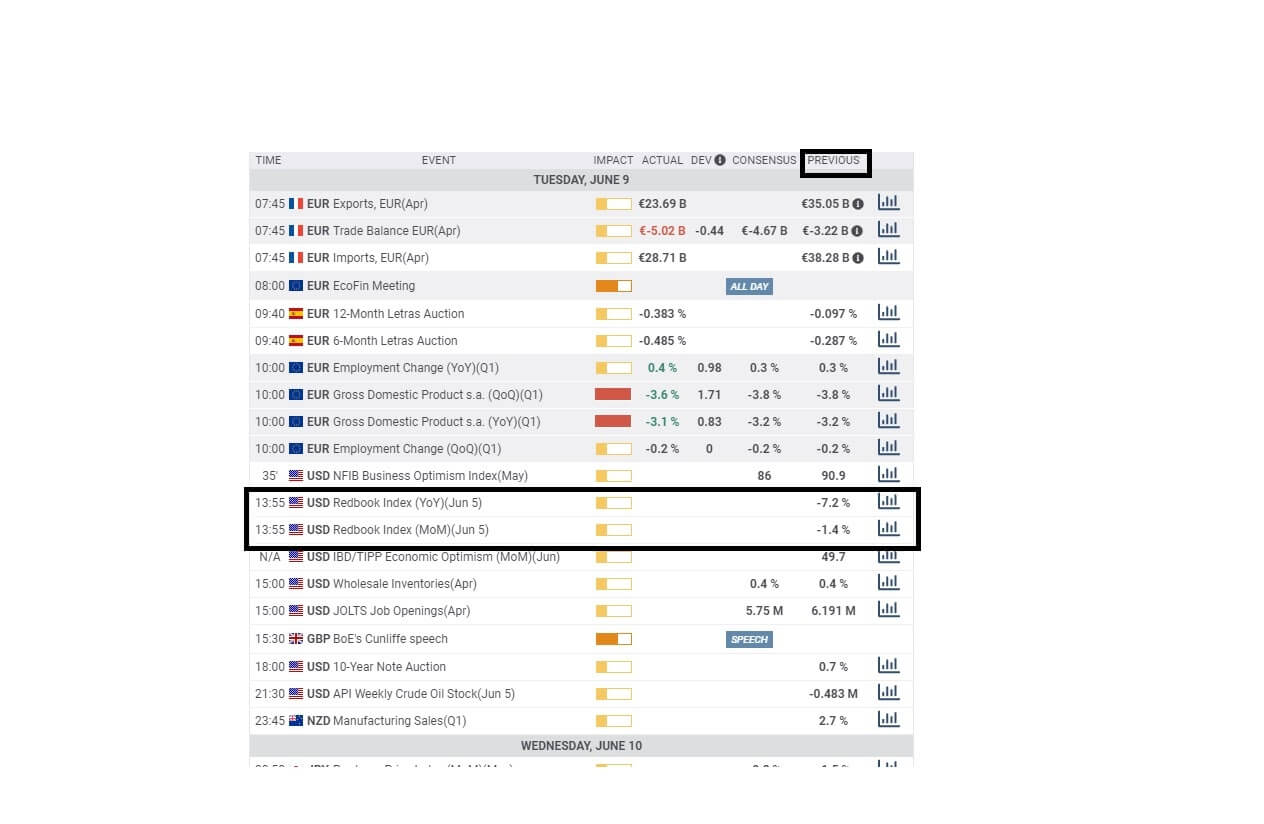
The information that you are looking for is the type of economic event, the time of its scheduled release, which is usually subject to an embargo, and the impact that it is likely to have upon its release. You will also be able to look at the previous weekly, monthly, quarterly or annual release of this data if applicable, and you will be able to study the consensus value which will have been put together by economists and analysts and whereby this is the figure which is generally expected by the market upon its release.

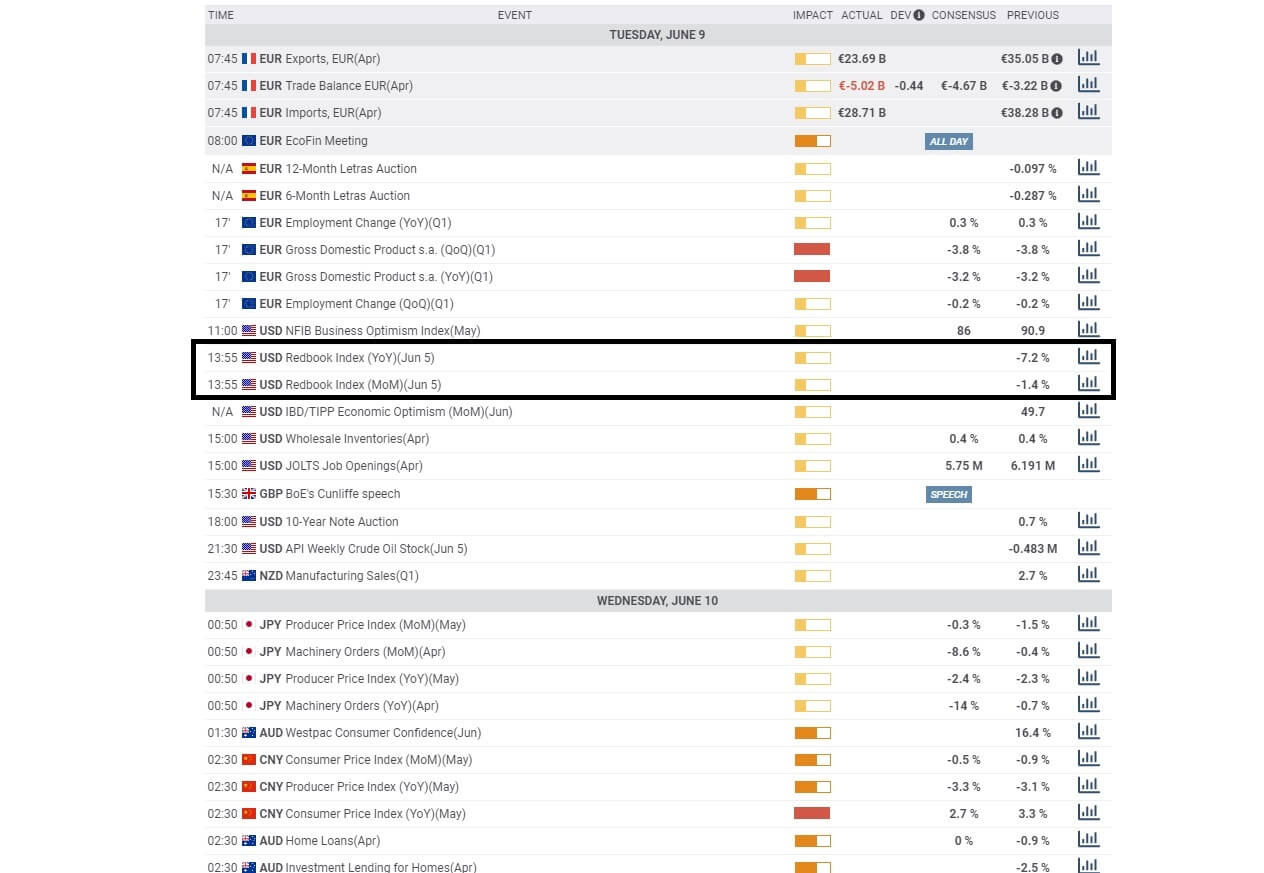
Here we can see that on Tuesday the 9th of June at 13:55 BST, the red book index year on year and month on month is scheduled for release.
The Johnson’s Redbook index is a sales-weighted proprietary indicator as released by Redbook research incorporated in the United States since 1964. This indicator only applies to the US, where it represents the weekly, monthly, quarterly, and annual sales activity of 9000 stores. The data is released every Tuesday at the same time to its subscribers via a conference call or an email prior to its public release. The data forms 80% of the total data as collated in this sector and is officially released into the market by the US Department of Commerce.
Although it is a private indicator, it is closely watched by traders on Wall Street, including the Forex community, because it identifies trends in the short to medium term relating to the retail sector.
The stock market finds this information useful because it ranks retailers across categories including apparel, books, toys and hobbies, department stores, discount stores, footwear, furniture, drug stores, home Improvements, home furnishers, electronics, jewelry, and sporting goods and miscellaneous.
But all traders recognize that it provides an advance warning of changes in consumer spending that, in turn, affect the business growth in this sector and shows warning signs of inflation fluctuations and interest rates.

So, how to trade the Redbook Index?
Information is provided on a percentage basis, and we can see that the previous figures for year on year and month on month were minus figures, and this is related to the coronavirus epidemic. If the actual numbers are released and as percentage terms are worse than the previous numbers shown here, this would be considered to be bad for the US economy, and therefore bad or bearish for the US Dollar. Conversely, should the numbers come in higher than the previous numbers, this would show a pickup in retail sales and a continuing overall trend in the upturn of the US economy, which is filtering through at the moment, and therefore this would be good or bullish for the US dollar.

