On the news front, the economic calendar remains busy on Friday. Today’s releases may trigger some price action in the Euro and U.S. related pairs, especially on the release of German GDP, Eurozone Flash GDP, and U.S. core retail sales figures, which are due to come out during European and U.S. session respectively.
Economic Events to Watch Today
EUR/USD – Daily Analysis
During the early Asain trading session, the EUR/USD pair was closed at 1.08181 after placing a high of 1.08509 and a low of 1.07887. Overall the movement of the EUR/USD pair remained bullish throughout the day.
EUR/USD pair gained on Friday after falling for two consecutive days and recovered some of its weekly losses at the ending day of the week.
The pair recovered its upward trend on the back of stronger EUR against weaker USD. Euro remained robust due to better than expected economic data from the whole bloc, and the U.S. dollar was ineffective due to poor than expected data on Friday. At 11:00 GMT, the German Purchasing Price Index for April was released, which showed a decline of 0.7% against the expected decline of 0.6% and weighed on single currency Euro. At 11:45 GMT, the French Final CPI for April came in as 0.0% against the expected 0.1% and weighed on Euro.
At 13:00 GMT, the German Prelim GDP for the quarter came in line with the expectations of -2.2%. At 14:00 GMT, the Flash Employment Change for the quarter came in as -0.2% against the expectations of -2.0% and supported Euro. The Flash GDP for the whole bloc during the quarter came in line with the expected -3.8%. The Trade Balance for the whole bloc showed a surplus by 23.5B against the expected 17.2B and supported Euro.
Better than expected Employment data and Trade Balance from the whole bloc gave strength to the single currency and moved the pair towards the upside. On the other hand, the U.S. dollar was weaker against EUR due to poor than expected Retail Sales and Industrial Production data on Friday. The headline U.S. Retail Sales dropped by 16.4% during the month of April and weighed on the U.S. dollar while the Core Retail Sales were dropped by 17.2%, which added in the weakness of the dollar against Euro and moved the pair EUR/USD on the upside direction.
The U.S. Industrial Production showed a decline by 11.2% in the month of April against the forecasted decline by 11.5%, despite falling under the expected figure, the drop in U.S. industrial production gave an impact of weak U.S. economy and weighed on U.S. dollar. Stronger Euro against U.S. dollar and weaker dollar combined gave a push to EUR/USD pair on Friday to place a high of 1.08509.
Daily Support and Resistance
- S1 1.0673
- S2 1.0758
- S3 1.079
Pivot Point 1.0843
- R1 1.0874
- R2 1.0928
- R3 1.1013
EUR/USD– Trading Tip
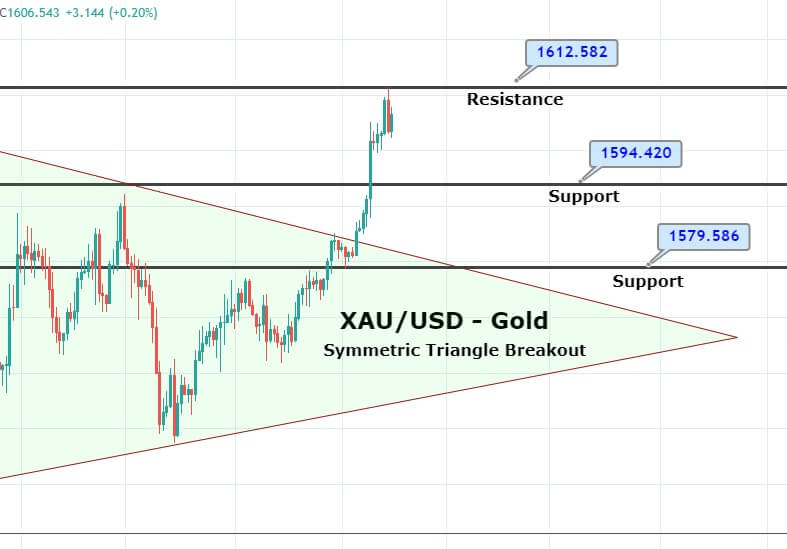
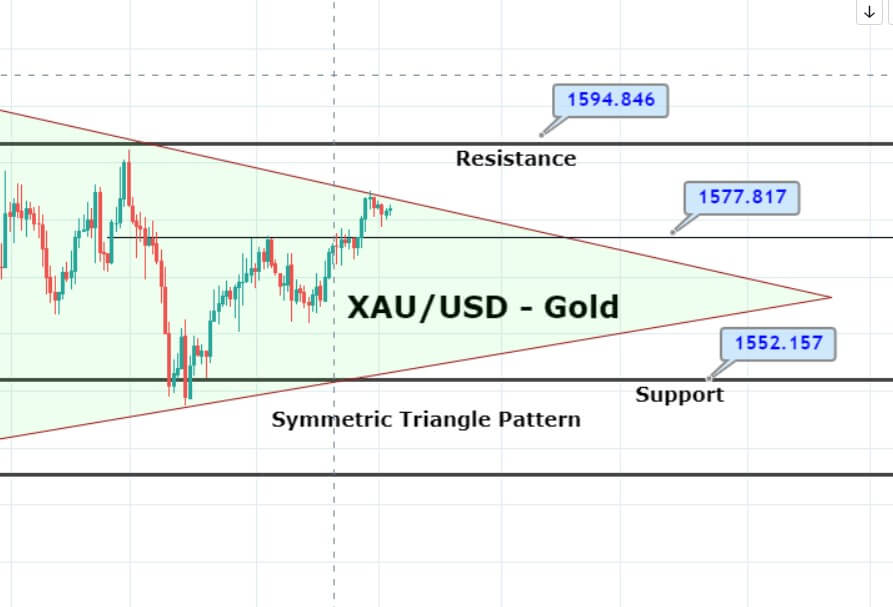
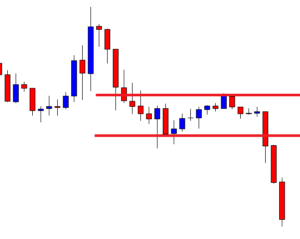
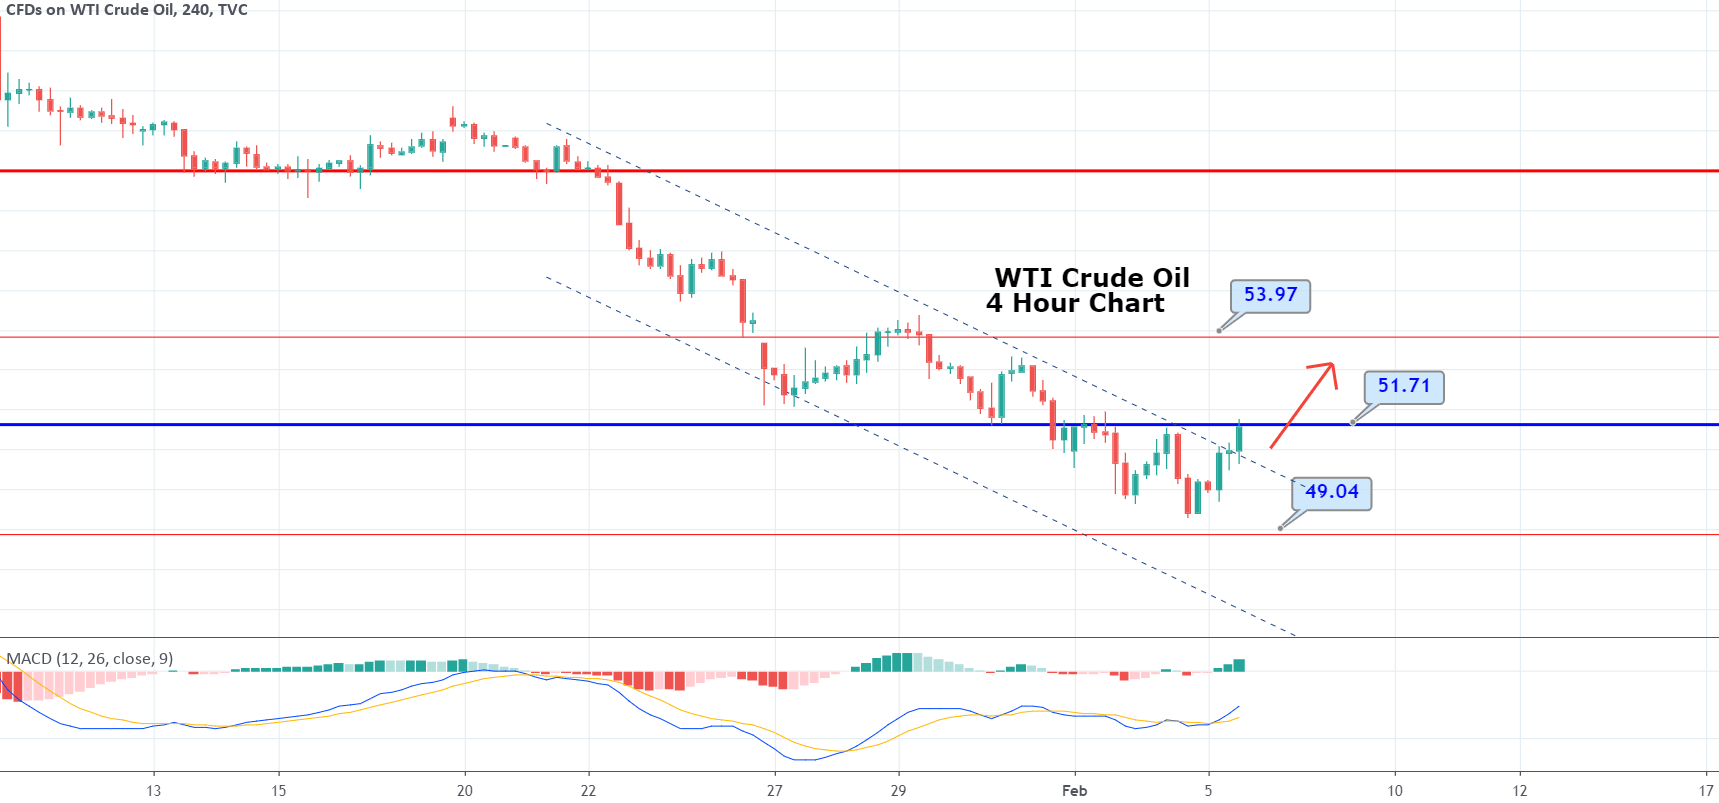
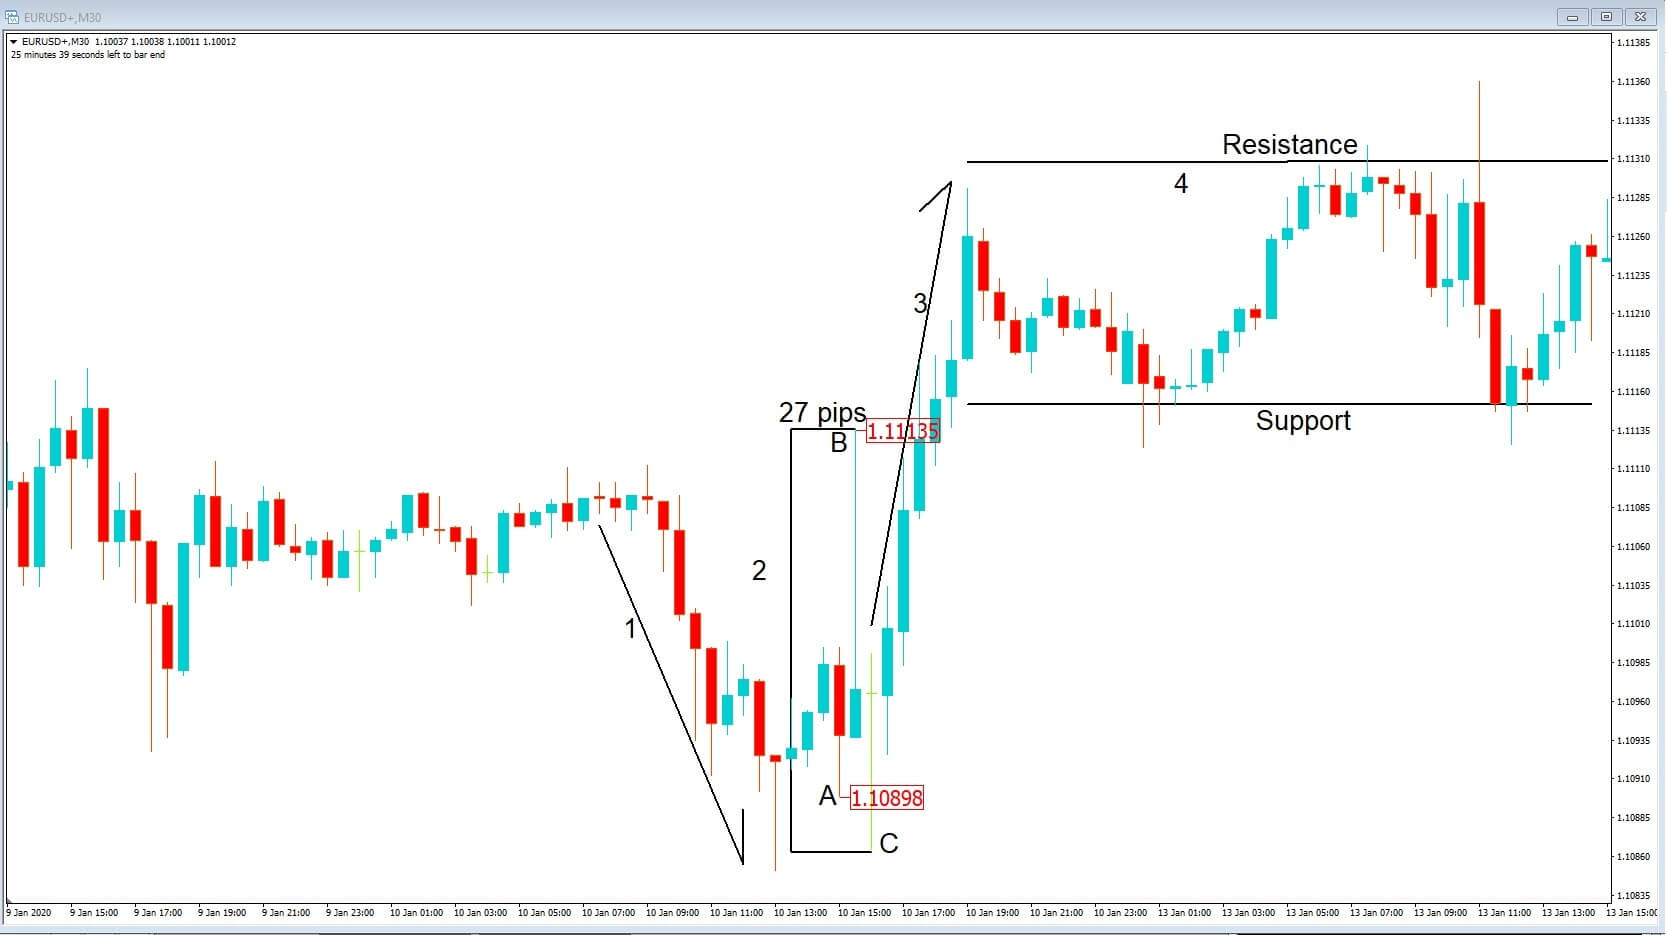
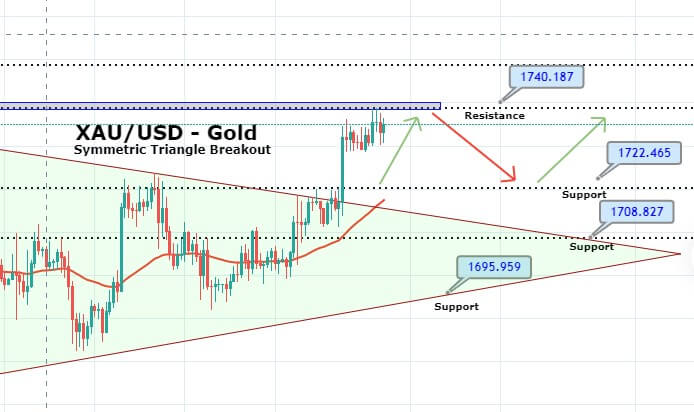
The EUR/USD is trading at 1.0817, trading below 50 periods EMA resistance at 1.0838 level. Last week, the pair bounced off over the double bottom support level of 1.07756. On the 4 hour chart, the EUR/USD is closing candles within a symmetric triangle pattern, which drives mixed sentiment in the market. Extension of selling below 1.0843 level may lead the EUR/USD prices towards 1.07782 level, and below this, the next support is likely to be found around 1.0730. Consider staying bullish above and bearish below 1.0770 level today.
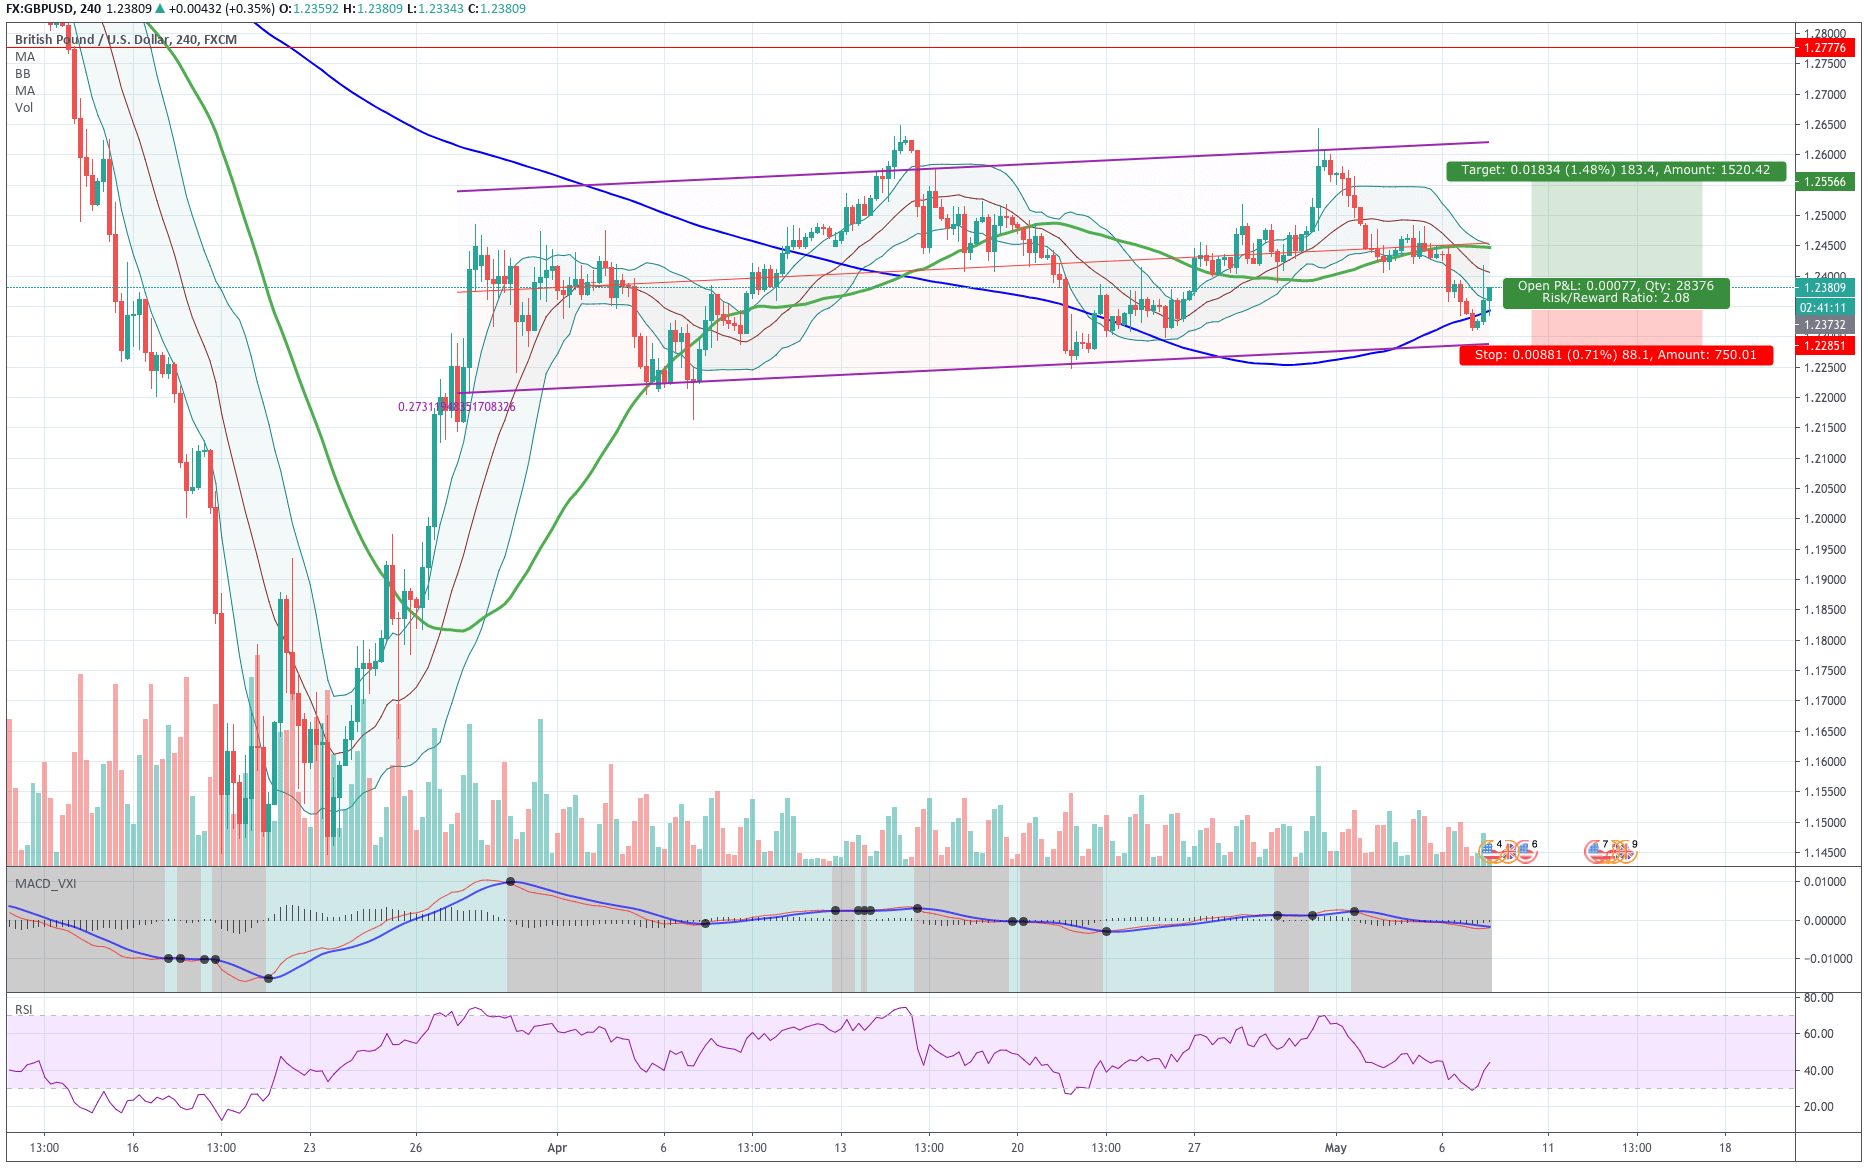
GBP/USD – Daily Analysis
The GBP/USD pair was closed at 1.21040 after placing a high of 1.22386 and a low of 1.31013. Overall the movement of pair remained bearish throughout the day. The GBP/USD pair was dropped to its fresh seven-week lowest level near 1.2100 on Friday on the back of the sudden pickup in demand for the U.S. dollar at last hours. Despite poor than expected Retail Sales data from the United States on Friday, the pair GBP/USD was dropped to its multi-week low level at the ending day of the week.
The growing fears of second-wave of coronavirus faded the hopes for quick global economic recovery and weighed on the U.S. dollar. The already weaker trend was then escalated after the relationship between the United States and China started to become even worse. The Sino-US relation headed towards a renewed trade war, especially after the U.S. commerce department cited security concerns against China on Friday. The U.S. Commerce Dept. took another step to cut off Chinese telco Huawei from the overseas chip manufacturing companies.
The U.S. also accused Huawei of building backdoors in network infrastructure to help the Chinese government spying efforts. Huawei repeatedly denied this accusation of spying efforts by Trump’s administration. Chinese officials have said they would respond to this, which decreased the risk appetite and gave a push to the greenback’s perceived safety-haven status. This ultimately dragged down the pair GBP/USD on Friday as there was no economic data to be released from the United Kingdom. The pair’s movement was solely dependent on the greenback’s demand.
Furthermore, over the weekend, the Cabinet Office Minister Michael Gove said that Brexit negotiations were going well, but E.U. needed to show some flexibility. He added that very little progress was made after the third Brexit talks, which were conducted on Friday. Both sides have shown frustration over the slow progress in trade talks, and the U.K. has geared up its preparations to leave the block without any deal. The U.K. has already said that it will not extend the negotiations process beyond December 31.
The sticking point during the negotiations has been the access to fishing waters. E.U. wanted to have the same access they had to the U.K.’s fishing water, but Britain was not allowing it. If no-deal Brexit happened then, both parties would have to follow the rules of the World Trade Organization. On the other side, E.U.’s top negotiator, Mr. Barnier, has said that the U.K. could not have the best of both worlds, and if it were meant to be No-deal Brexit, then E.U. would step up to prepare for no-deal outcomes.
The E.U. has also denied that the U.K. was wrong to think that slowing the process of talks would end up E.U. accepting the deal at any price. Growing fears of No-deal Brexit also caused GBP’s weakness against the U.S. dollar and dragged the pair to its lowest for seven weeks.
Daily Support and Resistance
- R3 1.2137
- R2 1.2123
- R1 1.2104
- Pivot Point 1.209
- S1 1.2071
- S2 1.2057
- S3 1.2038
GBP/USD– Trading Tip
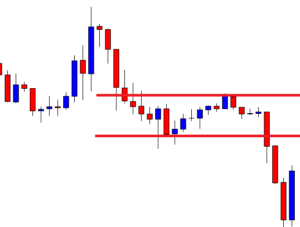
The GBP/USD fell into the oversold zone to trade at 1.2070 level, but the recent closing of Doji candle and bullish engulfing above 1.2076 support zone is likely to drove bullish correction in the market. On the higher side, the GBP/USD is likely to provide resistance around 1.2177, while the support level continues to hold around 1.2070. Below this, the next support could be found around 1.2040, which is extended by the bottom of the downward channel and can be seen on the 4-hour chart. Let’s consider staying bullish above 1.2070 today.
USD/JPY – Daily Analysis
The USD/JPY pair was closed at 107.086 after placing a high of107.434 and a low of 106.855. Overall the movement of the USD/JPY pair remained bearish throughout the day. The decreased appetite for the risk helped the safe-haven JPY to gather strength in the early American trading session and dragged the USD/JPY pair prices on Friday below the 107 level. However, the pair USD/JPY managed to erase some of its daily losses after gaining traction in the late trading session.
At 4:50 GMT, the Purchasing Price Index for the year from Bank of Japan was released, which dropped to -2.3% against the forecasted decline by -1.4% and weighed on JPY. From the American side, the closely watched Retail Sales data was released, which came in poor than expectations and weighed on the U.S. dollar. At 17:30 GMT, the Core Retail Sales for April dropped by 17.2% compared to -8.6% forecasted. The Retail Sales from the United States also declined in April by 16.4% while it was expected to be decreased by 12%.
More than expected decline in the total value of sales at the retail level from the United States during the previous month showed a decline in consumer spending and gave the negative impact of the U.S. economy, which in turn weighed on U.S. currency. Weak USD dragged the USD/JPY pair along with it below the 107 level on Friday.
The Empire State Manufacturing Index showed a decline to 48.5 against the expected reduction of 65.0. At 18:15 GMT, the Capacity Utilization Rate, which measures the capacity by which raw-material was used by manufacturers during April increased to 64.9% from the forecasted 63.9% and supported USD.
The Industrial Production in April also dropped by 11.2% but remained less than the forecasted decline of 11.3%. At 19:00 GMT, the Consumer Sentiment from the University of Michigan showed an improvement in consumers’ confidence over the U.S. economy when released as 73.7 against 68.0 in May.
Daily Support and Resistance
- R3 109.37
- R2 108.57
- R1 108.12
Pivot Point 107.33
- S1 106.88
- S2 106.09
- S3 105.64
USD/JPY – Trading Tips
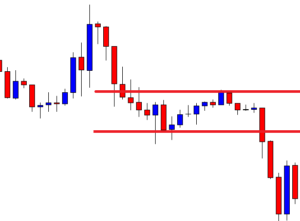
On Monday, the USD/JPY traded bearishly to trade below the support level of 107, which marked the 50% Fibonacci retracement level. The USD/JPY is holding at 107.05, where the 50 EMA is supporting the pair, and it may drop further below the 107 level. At the moment, the 4-hour candle appears to close below 107 support become resistant, and this may drive more selling in the USD/JPY pair. The pair may extend selling until 106.600 level, whereas the closing of buying candles above 107 can trigger bullish bias until 107.50. By the way, bearish bias seems solid today. All the best for today!

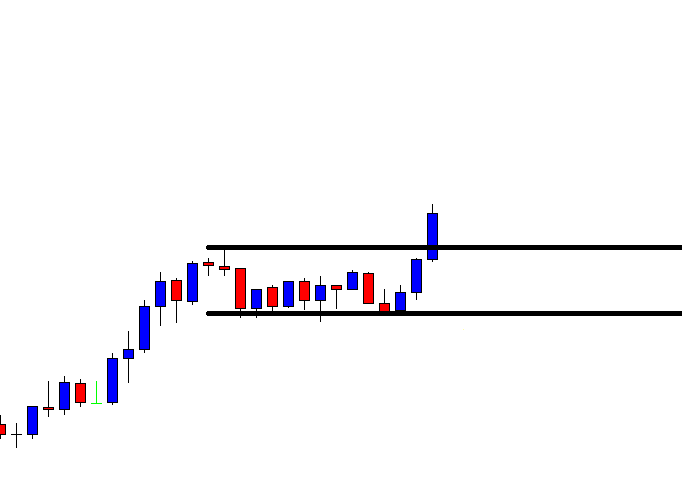
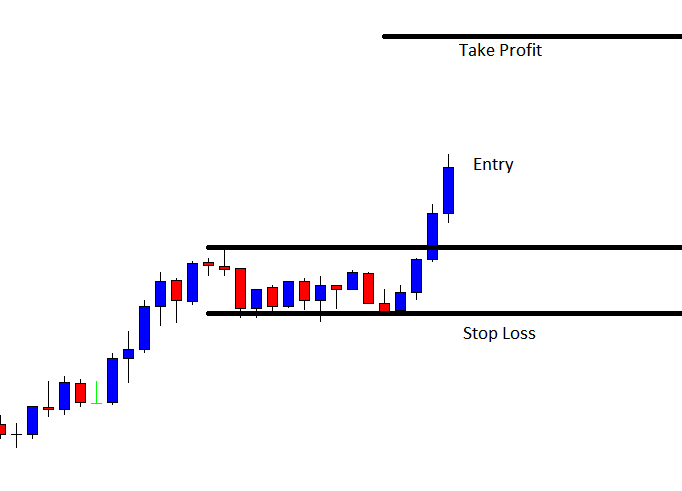
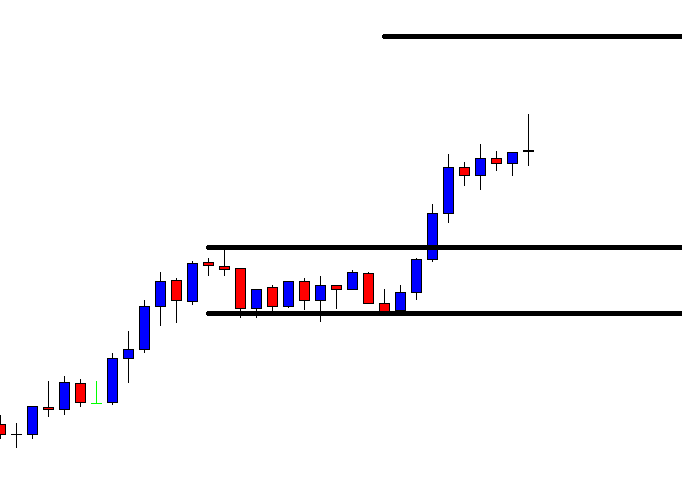
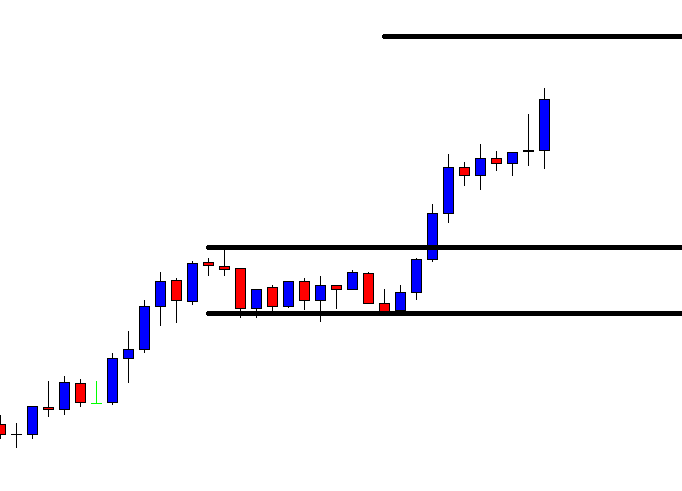
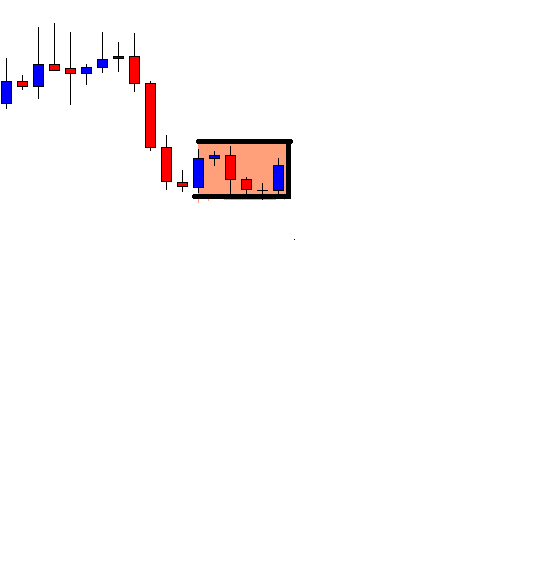
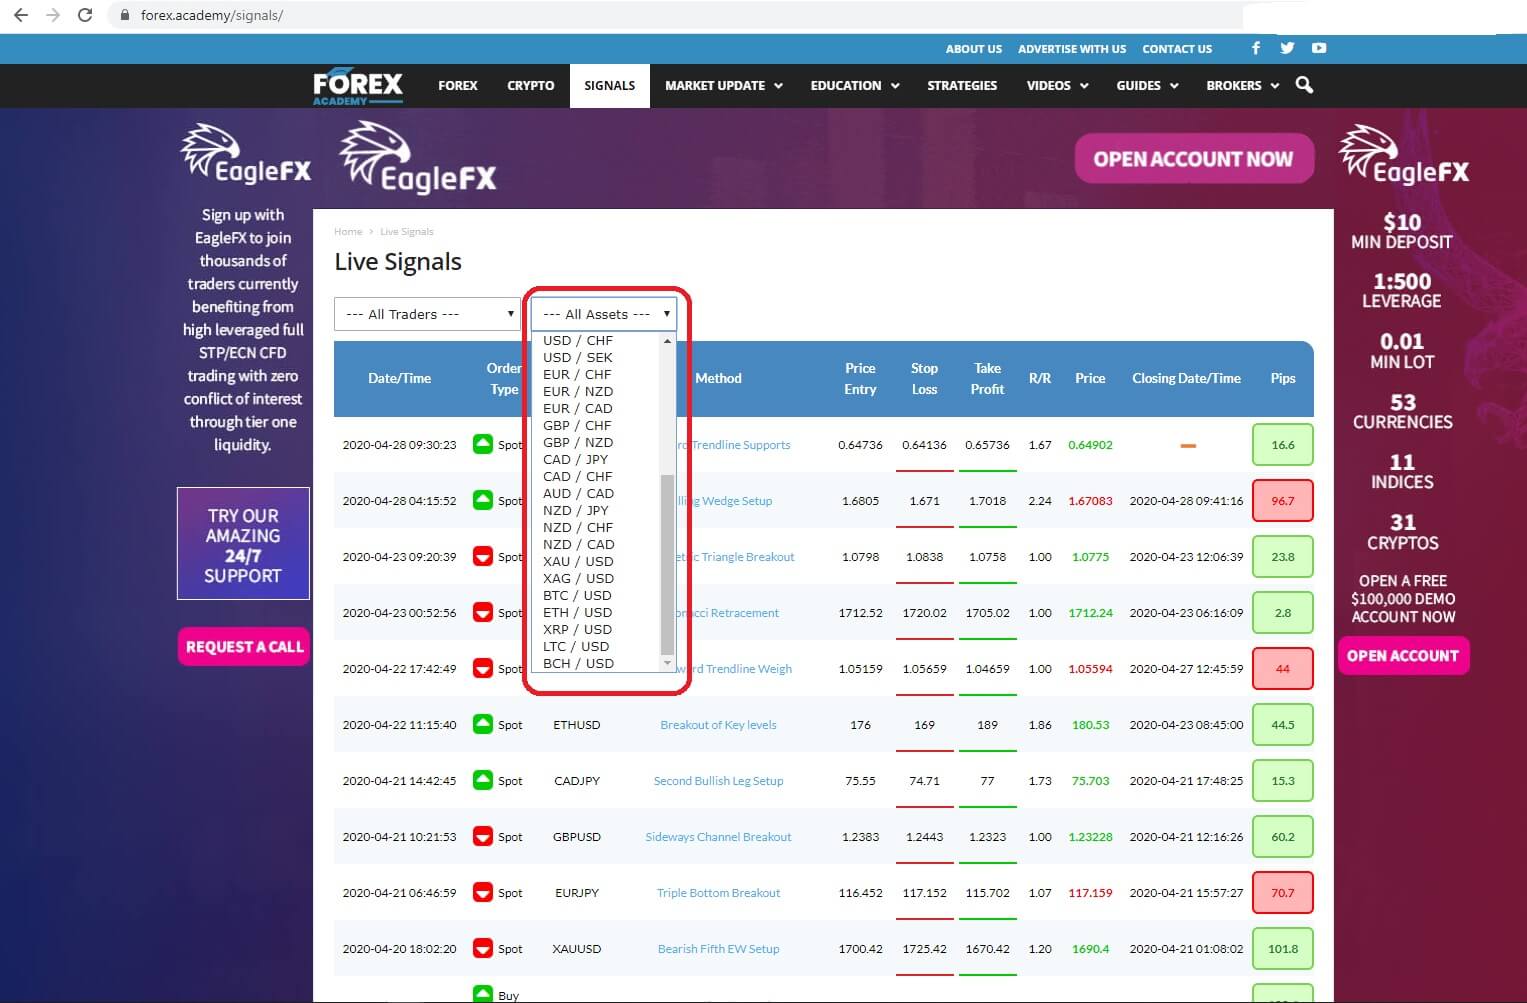 Welcome to how can you make money using forex academies free trading signals service part 2. By connecting to the Forex.Academy website and clicking the tab for our Free
 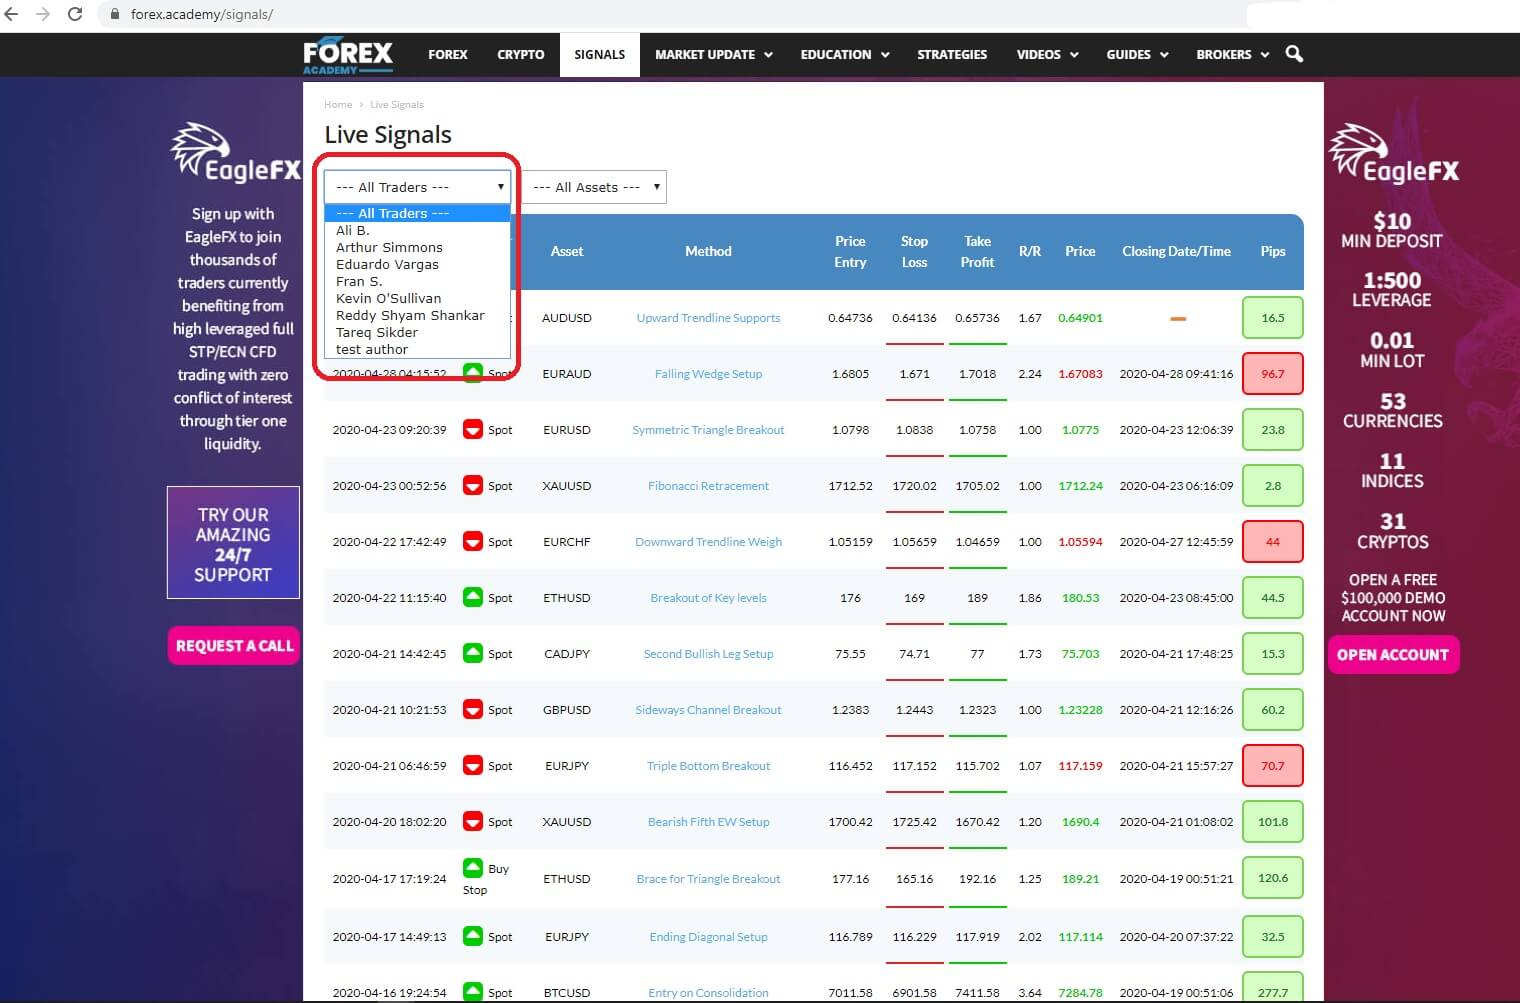 And where you get to choose the type of asset which is traded, from a basket of currencies and bitcoins.
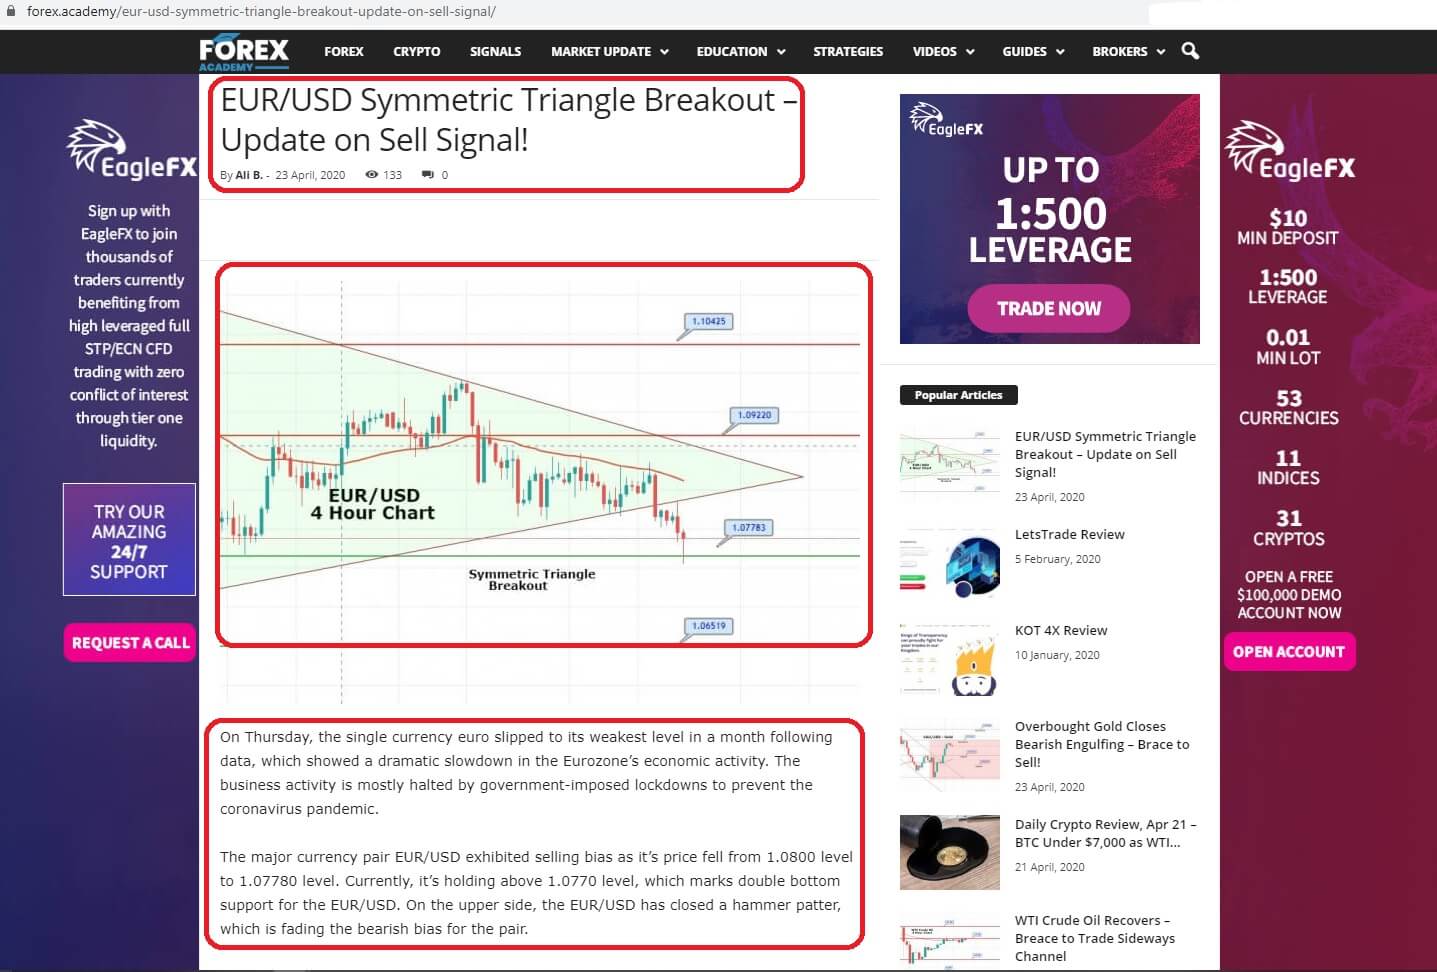
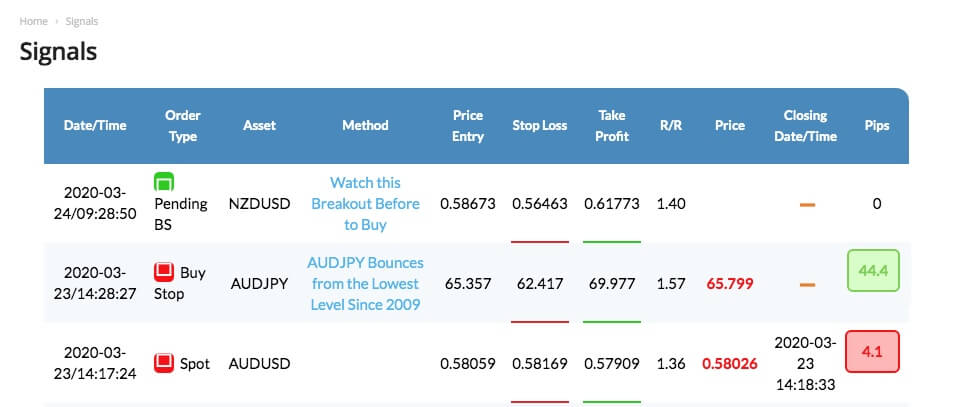
 And where you can find details of the trade, including the name of the asset being traded, the technical analysis name for the trade setup, up-to-date visual technical analysis charts of the setups, and a written description of the fundamental and technical analysis behind each and every trade. Our professional traders only use technical and fundamental analysis setups that are widely used in the
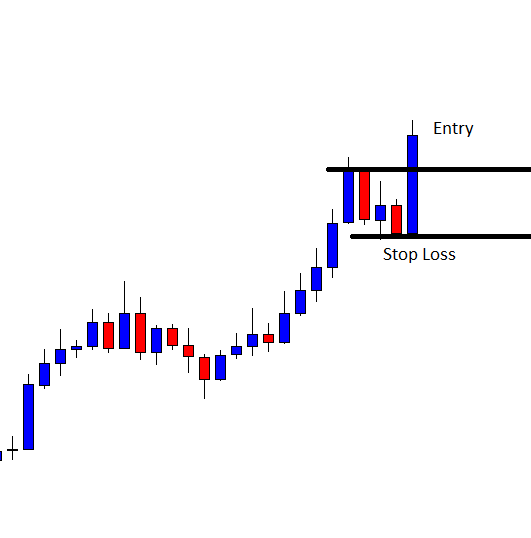
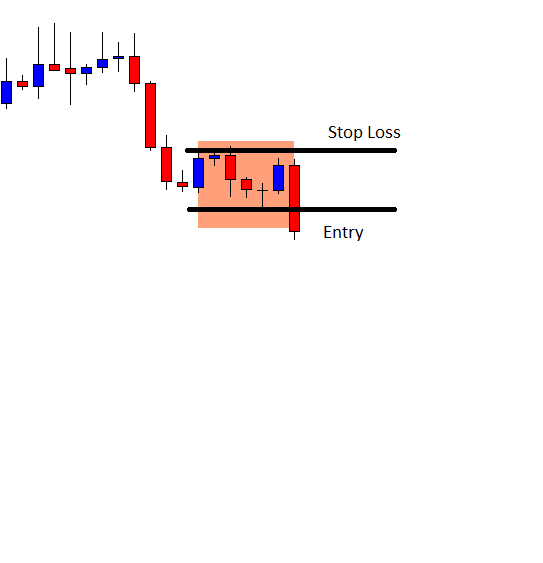
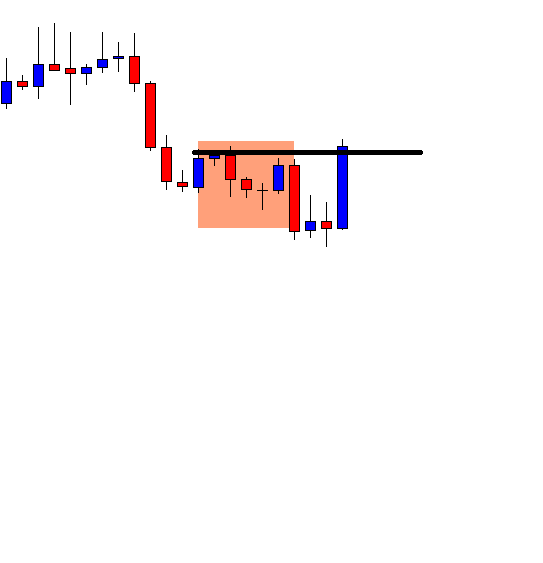
 bearing in mind that if it is an instant execution you might miss a few pips unless you are monitoring the table continually. However, you would be more likely to get in at the beginning of the trade by copying pending orders such as this