Categories
Crypto Market Analysis

Stratis Bulls in Control

Stratis (STRAT)

Market Cap. $775.46M

Circulating Supply: 98.84M STRAT

Max Supply: 0 STRAT

Volume (24h) $16.00M


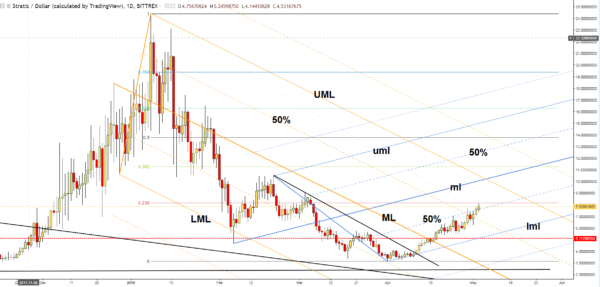
Stratis Coin Price Prediction: STRAT/USD rose up to 8.09944618 today and passed above 7.90072126, yesterday’s highs. The crypto has increased by 30.24% in the last 7-days, signalling that the buyers are very strong. STRAT/USD has managed to climb above a strong dynamic resistance line but it remains to see if this will be a valid breakout.

It is close to reaching a very strong static resistance, that’s why we have to stay away from this crypto for now because only a valid breakout will confirm a further increase towards the 10.00000000 psychological level.

STRAT/USD chart

STRAT/USD has closed above the 50% Fibonacci line in yesterday’s trading session signalling that we may have a valid breakout. A valid breakout above the 23.6% retracement level will validate a further increase towards the median line (ml) of the ascending pitchfork and the upper median line (UML) of the descending pitchfork.

Only an aggressive bullish momentum will drive the rate towards the confluence area formed between the median line (ml) with the UML. The confluence area acts as a magnet and attracts the price. The several retests of the lower median line (lml) have signalled an increase at least till the median line (ml). So, we need a valid breakout above the WL1 and above the median line (ml) to be convinced that the rate will move towards the 38.2% retracement level and towards the next upside targets.

Conclusion

The pair will maintain a bullish perspective as long as it is trading within the ascending pitchfork’s body. If you want to go long, you can place a Stop Loss below the 5.49432004 low.

Categories
Crypto Market Analysis

Crypto Picks Review: EOS and VEN

EOS/USD

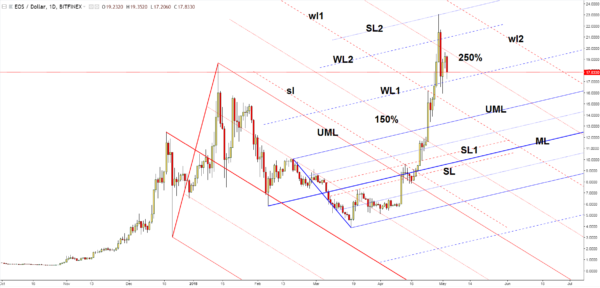
Crypto Picks Review: EOS/USD increased significantly after the breakout above the sliding line (SL1) of the minor ascending Pitchfork as expected (EOS Bullish Perspective), (EOS reached a major target, now what?). It has increased as much as 23.0290 level where it has found a very strong resistance.

EOS/USD chart - forex academy

The price dropped significantly and failed to stay above the second warning line WL2 and above the 250% Fibonacci line. The rate decreased today, signalling a selling pressure after the failure to retest the 250% Fibonacci line. EOS/USD failed to stay above the 18.6850 former high and now could drop further in the short term.

It could increase and approach the previous high only if it makes a valid breakout above the 250% Fibonacci line. The minor drop is natural and was somehow expected after the impressive rally. A valid breakdown below the first warning line (wl1) will confirm a further drop.

VEN/USD

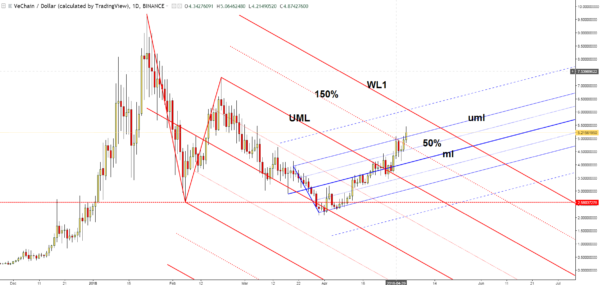
The VEN/USD has increased as expected (VeChain broader increase validated) and has reached an important upside target. The rate is bullish and is targeting other major upside levels.

VEN/USD crart - forex.academy

The next upside targets will be at the first warning line (WL1) of the descending Pitchfork and higher at the first warning line (wl1) of the minor ascending pitchfork. This scenario will happen as long as the rate will stabilize above the broken upper median line (uml) of the minor ascending pitchfork. Only a breakout above the next targets will signal a larger upside movement.

©Forex.Academy

Categories
Crypto Market Analysis

Binance Coin – could we sell this?

Binance Coin (BNB)

Market Cap. $1.61B

Circulating Supply: 114.04M BNB

Max Supply: 0 BNB

Volume (24h) $78.38M


Binance Coin went down a bit and seems undecided right now because is hovering right above a very strong dynamic support. It remains to be seen what will really happen in the upcoming days because the price seems exhausted and could start a corrective phase. Right now it is premature to talk about a corrective phase because the rate could still recover after a false breakdown.

Binance Coin (BNB) chart

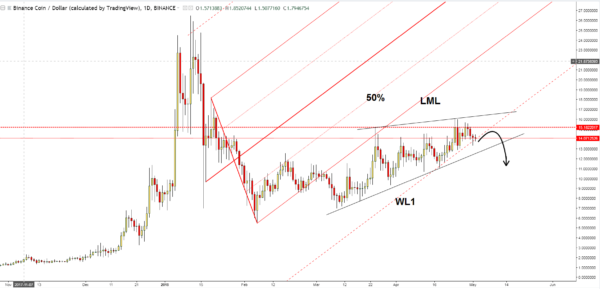
BNB/USD price increased in the previous weeks but has made another false breakout above the 15.1822017 static resistance signaling a potential drop. We have a bearish divergence on the Daily chart that’s why we could think of a significant drop.

We should wait for a selling opportunity. This could be confirmed by a valid breakdown below the first warning line (WL1) of the ascending Pitchfork. Price has moved away from the lower median line (LML) of the ascending Pitchfork and now has managed to close almost on the WL1.

You can notice that the rate has developed a Rising Wedge pattern, so only a breakdown will confirm a significant corrective phase. You should stay away from this crypto because a false breakdown below the WL1 will send the rate much above the 15.1822017 static resistance. A buying opportunity may arise after a valid breakout above the upside line of the chart pattern.

Conclusion

You can see this crypto after a valid breakdown below the WL1 or after a breakdown from the Rising Wedge pattern.

©Forex.Academy

Categories
Crypto Market Analysis

LTC/BTC – could we have another leg higher?

Litecoin (LTC)

Market Cap $8.23B

Circulating Supply: 56.34M LTC

Max Supply: 84M LTC

Volume (24h) $345.98M

LTC/USD = $144.06


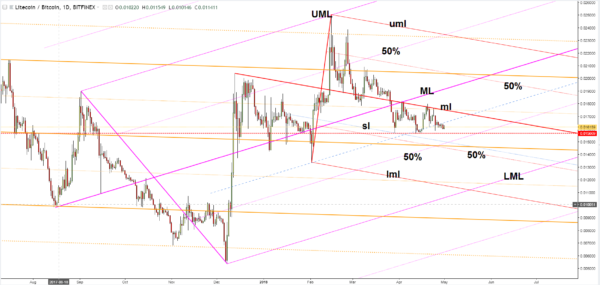
The LTC/BTC moves sideways on the short term signaling an oversold.  It seems like that the corrective phase could be completed after the failure to approach and retest a dynamic support. It is trading at 0.016167 level, right above the 0.015669 crucial support level.

It remains to see if this will be an accumulation or a distribution movement. Price is narrowing, but I really hope that we’ll have a fresh trading opportunity soon.

The LTC/BTC could drop a little to test and retest the 0.015669 static support after another failure to close above the median line (ml) of the ascending pitchfork. Price has failed to drop towards the 50% Fibonacci line signaling that the bears could be exhausted. I’ve drawn a sliding parallel line (sl), the rate has failed to approach and retest this level so we could think of another bullish movement.

However, the rate could continue to move sideways in the upcoming days before will decide what will do next. We have a crucial support at the 0.015669, at the sliding line (sl) and at the 50% Fibonacci line of the ascending pitchfork. The rate could bounce back as long as it stays above these downside obstacles.

Personally, I believe that a valid breakout above the median line (ml) of the descending pitchfork it will signal another significant leg higher.

Conclusion

You can go long after a valid breakout above the median line (ml). You can place targets at the median line (ML) and higher at the upper median line (uml). Only a breakout above the second target will confirm an increase above the 0.025004 swing high.

A potential increase will be invalidated by a valid breakdown below the 50% line of the ascending pitchfork and below the sliding line (sl) of the descending pitchfork.

Categories
Crypto Market Analysis

Bitcoin Increase Was Invalidated For Now

Bitcoin (BTC)

Market Cap. $152.98B

Circulating Supply: 17.01M BTC

Max Supply: 21M BTC

Volume (24h) $8.43B


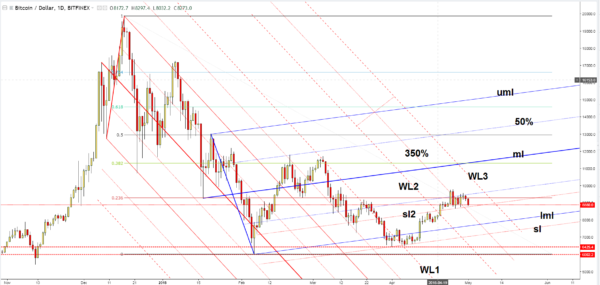
BTC/USD dropped aggressively today and resumed the yesterday’s bearish candle. The crypto failed to take out a crucial resistance level and Bitcoin value now could drop significantly in the short term. Right now is premature to talk about a larger drop in the short term because this could be only a temporary drop. Price could try to accumulate more energy before will really start a larger increase.

Bitcoin Value Now

I talked about the Bitcoin two weeks ago (Bitcoin long, the most expected setup) and I’ve signaled a minor drop in the short term before the rate will really start a larger upside movement. I’ve said that the rate could come down after the breakout above the WL2 of the ascending pitchfork and could retest the lower median line (lml) or the outside sliding line (sl).

BTC/USD increased, but has failed to make a valid breakout above the 50% Fibonacci line (ascending dotted line) and above the 23.6% retracement level.

A valid breakdown below the inside sliding line (sl) will lead the rate towards the 350% line and towards the lower median line (lml). I’ve told you that we may have a great buying opportunity from the lower median line (lml) or after the retest of the outside sliding line (sl).

Personally, I was expecting a drop from 50% Fibonacci line or from the median line (ml) of the ascending pitchfork because was hard to believe that we’ll have a larger upside movement towards the 15000 level without a corrective phase.

Conclusion

The conditions haven’t changed too much. We’ll have an excellent buying opportunity if the rate comes down to test the lower median line (lml) of the sliding line (sl). You could go long also if the rate makes a valid breakout above the 50% Fibonacci line and above the WL3.

The first upside target will be at the median line (ml), the next one at the upside 50% Fibonacci line and a crucial one at the upper median line.

©Forex.Academy

Categories
Crypto Market Analysis

Verge – is this a buy or a sell?

Verge (XVG)

Market Cap. $1.02B

Circulating Supply: 14.94B XVG

Max Supply: 16.56B XVG

Volume (24h) $51.78M


Verge (XVG) Price Prediction:

XVG/USD moves sideways in the short term and seems undecided. Verge price is trading in the red right now and resumed the yesterday’s bearish candle. It is pressuring a dynamic support so that a valid breakdown will bring us a selling opportunity.

However, we may have a buying opportunity if the rate will have enough bullish energy to jump and stabilize above a dynamic resistance. I will show you two potential scenarios, a selling one, and a buying opportunity.

Verge (XVG) Price Prediction:

The rate could drop significantly if will close below the lower median line (LML) of the ascending pitchfork and if will come higher to retest it and the sliding line (sl) or the 505 Fibonacci line (descending dotted line).

So, it could drop at least till the median line (ml), a valid breakdown will send the rate towards the 0.02331280 former low and towards the lower median line (lml).


I’ve added another Daily chart to show you what could happen if the rate will remain within the ascending pitchfork’s body. XVG/USD it should climb much higher in the upcoming period if it will jump and will close above the sliding line (sl) and the 50% Fibonacci line (descending dotted line).

The last corrective phase could be completed, and the rate could approach and reach fresh new highs if the LML will hold and will keep the rate within the ascending pitchfork’s body.

Conclusion

The corrective phase was natural after the false breakout above the ML of the ascending Pitchfork and after the failure to close near this line. You can go short on this crypto if it makes a valid breakdown below the LML of the ascending pitchfork.

We may have a buying opportunity if the rate will climb above the sliding line (sl). The upside targets will be at the upper median line (uml), at the median line (ML) and much higher at the UML.

©Forex.Academy

Categories
Crypto Market Analysis

EDO/BTC Breakout In Play

Eidoo (EDO)

Market Cap. $81.26M

Circulating Supply: 29.26M EDO

Max Supply: 0 EDO

Volume (24h): $11.77M

The EDO/BTC rallied today and resumed the yesterday’s impressive increase. Price increased as much as 0.00027700 level where it has found a temporary resistance. The rate has reached two very important and crucial resistance levels.

The pair seems determined to increase further and to jump in the buyer’s territory. EDO/BTC is pressuring a resistance zone, so we have to wait for a valid breakout before we take action again. We had a great buying opportunity in the previous days, so, now we have to wait for another one.

 Eidoo Price Chart (EDO/BTC)

Eidoo price increased aggressively after the failure to retest the 0.00022195 static support and the inside sliding line (sl1) of the ascending pitchfork. You can see that the rate has finally managed to close above the second sliding parallel line (sl2) and now has reached the median line (ml) of the ascending pitchfork and the upper median line (UML) of the major descending pitchfork.

It remains to see how the rate will react in the upcoming hours, but you should know that a breakout is favored after the failure to close near the 50% Fibonacci line of the descending pitchfork in the last retest attempt.

A valid breakout above the UML will signal a further increase, while a valid breakout above the median line (ml) will confirm that the EDO/BTC is strongly bullish and it should approach the upper median line (uml) and the first warning line (WL1) of the descending pitchfork. We have an important upside target at the 0.00040010 swing high as well.

Conclusion

You could still go long on this crypto pair if the rate will close and will stabilize above the median line (ml) of the ascending pitchfork. You should wait for the rate to make another low in the upcoming period where you’ll place the stop loss.

Categories
Crypto Market Analysis

Dogecoin Could Start a Bullish Movement

Dogecoin (DOGE)

Market Cap. $604.75M

Circulating Supply: 114.24B DOGE

Max Supply: 0 DOGE

Volume (24h) $39.50M


The cryptocurrency is narrowing in the short term and maintains a bullish perspective. Dogecoin DOGE/USD changed was limited in the last days, but I really hope that we’ll have an impressive move soon. Is trading at 0.00529422 level after the failure to resume the yesterday’s minor increase.

Price has developed a minor chart pattern, but it remains to see if this is an accumulation or a distribution movement. The rate is pressuring a strong support area right now, so I really hope that we’ll have a great buying opportunity in the upcoming days.

Dogecoin (DOGE) - Forex Academy

You can see that the DOGE/USD has managed to jump above the downtrend line and now is retesting it. DOGE/USD has found temporary resistance at the 50% Fibonacci line (ascending dotted line) and now is trying to find strong demand again.

A valid breakout above the downward trend line will signal another upside momentum. The rate could continue the minor sideways movement before will have enough energy to make a larger move.

DOGE/USD could increase and could reach fresh new highs if it stays above the broken downtrend line and above the 0.00491848 static support. The rate could try to retest the lower median line (lml) in the upcoming days. Only a breakdown below the lower median line (lml) and a drop below the mentioned support levels would invalidate a further increase.

Conclusion

DOGE/USD will become strongly bullish only if will have enough directional energy to make a valid breakout above the 50% Fibonacci line (ascending dotted line). A valid breakout will confirm an increase at least till the median line (ML).


©Forex.Academy
Categories
Crypto Market Analysis

Is The NEO/BTC Poised To Climb Higher?

NEO (NEO)

Market Cap. $4.95B

Circulating Supply: 65M NEO

Max Supply: 100M NEO

Volume (24h) $144.05M


NEO/BTC decreased a little today and failed to resume the yesterday’s minor increase. Right now is premature to talk about the next move because is located between two crucial obstacles. It remains to see the breakout direction.

The crypto pair is trading at 0.008192 level after the failure to stabilize above the 0.009000 psychological level. Price has shown an overbought signal, but we still need a confirmation that the rate will turn to the upside and will reach new highs.

 NEO/BTC Forex Academy

The NEO/BTC has found strong support at the 61.8% retracement level. It has retested it showing that the buyers could take the lead again in the short term. Price has managed to breakout from the descending pitchfork’s body and above the first warning line (WL1).

Unfortunately, the crypto pair failed to stabilize above the downside 50% Fibonacci line (ascending dotted line) and above the 50% Fibonacci level signaling a minor exhaustion.

The rate has tested and retested the broken warning line (WL1), and now he’s moving away. NEO/BTC could come down to retest the sliding line (SL) before will try another breakout above the 50% level and above the 50% Fibonacci line. A breakdown from the red ascending pitchfork’s body will confirm a further drop.

Conclusion

You could go long on this crypto pair after a valid breakout above the 50% Fibonacci line (ascending dotted line). The near-term target will be at the median line (ML), while the major upside target will be at the upper median line (UML) and the 0.015200 highest high.

©Forex.Academy

Categories
Crypto Market Analysis

Santiment In The Buyer’s Territory

Santiment (SAN)

Market Cap. $117.29M

Circulating Supply: 62.66M SAN

Max Supply: 0 SAN

Volume (24h) $2.61M


SAN/USD increased today and resume the yesterday’s bullish candle. Price has managed to get back above a very strong dynamic resistance. The breakout needs confirmation because we had another false breakout the last days. Santiment Network Token increased by 10.35% today but is premature to talk about a larger increase at this moment.

santiment network token

You can notice that the rate has made a false breakout above the median line (ML) of the descending pitchfork. SAN/USD is trying to make a valid breakout right now but remains to see if the bulls will be strong enough. Price dropped sharply on Wednesday as the crypto market has crashed, but it has failed to close right on the lower median line (lml) signaling that the bulls are still in the game.

The crypto has tested and retested the lower median line (lml) of the ascending pitchfork and now is somehow expected to start an important upside momentum. Price needs to take out the resistance from the sliding line (SL) of the descending pitchfork because only a valid breakout will confirm a further increase.

It will become strongly bullish after a valid breakout above the inside sliding parallel line (sl) of the ascending Pitchfork. We may get a buying opportunity after a breakout above the SL and only if it will stay above the lower median line (lml).

Conclusion

The SAN/USD will climb towards the upper median line (UML) of the descending pitchfork and towards the median line (ML) only if will stay within the ascending pitchfork’s body.

©Forex.Academy

Categories
Crypto Market Analysis

Zcash Breakout Still In Cards

Zcash (ZEC)

Market Cap. $1.12B

Circulating Supply:3.79M ZEC

Max Supply: 0 ZEC

Volume (24h) $ 64.10M


The ZEC/USD dropped today and erased some of the yesterday’s gains. Price remains under pressure after the last false breakout and because is still trapped below some crucial resistance levels. The has found a temporary resistance, but we could see another breakout attempt soon.

Zcash rose by 4.17% today and by 10.80% in the last 7 days. We need a confirmation that the crypto will start a larger upside movement.

Zcash (ZEC) chart

The rate is trapped within a Falling Wedge pattern after the false breakout above the upside line of this pattern. ZEC/USD has also made a false breakout above the 23.6% retracement level and above the 50% Fibonacci line (ascending dotted line), so the minor decrease is natural.

It will drop towards the lower median line (lml) of the ascending pitchfork if the downtrend line will hold. A valid breakout above the upside line of the chart pattern will signal a further increase, but only a valid breakout above the 50% Fibonacci line will confirm a sharp increase in the upcoming weeks and months.

The ZEC/USD further increase could be invalidated only if the rate will drop and will stabilize outside the ascending pitchfork’s body.

Conclusion

We may have a buying opportunity after the breakout above the downtrend line and above the 23.6% retracement level, but only if the rate will stay above the lower median line (LML) of the ascending pitchfork. The next major upside target will be at the median line (ML) of the ascending pitchfork.

©Forex.Academy

Categories
Crypto Market Analysis

ZEC/BTC Long Trading Setup

ZEC/BTC

ZEC/BTC changed little today and seemed undecided on the short term. The cryptocurrency pair dropped in the last two days as the crypto market crashed. It remains to see what will really happen in the upcoming days because the rate is still under some pressure.

We may have a great buying opportunity if the rate will come back down to test and retest some very important support levels. It is trading at 0.03192501 after the failure to reach the 0.03500000 psychological level.

 ZEC/BTC Charts - Forex Academy

The last corrective phase was expected after the failure to stabilize above the median line (ML) of the ascending pitchfork and after the valid breakdown below the downside 50% Fibonacci line. ZEC/BTC increase a little, but this could be only temporary if will fail to stay above the median line (ml) of the minor descending pitchfork.

The pair has shown an oversold when has failed to approach and reach the lower median line (lml) of the minor descending Pitchfork.

We’ll have a great buying opportunity if the price makes a minor consolidation in the upcoming days and if will continue to stay above the median line (ml) and above the first warning line (WL1) of the ascending pitchfork.

Conclusion

The rate is somehow expected to increase further after the breakout above the median line (ml). Price has come to retest the broken dynamic resistance. The rate could increase from here and could jump above the 50% Fibonacci line (descending dotted line), but personally, I would like to see a minor decrease and a consolidation before will climb much higher.

©Forex.Academy

Categories
Crypto Market Analysis

Metaverse – Buy a Valid Breakout

Metaverse (ETP)

Market Cap. $36.84M

Circulating Supply: 35.46M ETP

Max Supply: 100M ETP

Volume (24h): $5.94M


ETP/USD dropped aggressively in the yesterday’s trading session and erased some of the latest gains. Price is struggling to increase again and to stay above the 1.0000 psychological level. The crypto increased by 2.09% today, but unfortunately, the rate is under massive selling pressure after a false breakout.

It could drop further in the upcoming days to test and retest a potential support before will try to increase again.  Metaverse dropped sharply in yesterday’s trading session as the Crypto Market crashed. The retreat was somehow expected after the last period bullish movement.

Metaverse Coin Price

The rate was rejected once again by the lower median line (lml) of the ascending pitchfork and now is expected to test and retest the outside sliding parallel line (sl) before will make a significant move.

You could go long only if the rate will make a valid breakout above the lower median line (lml) of the ascending pitchfork and you can place the first target at the median line (ml). It will drop much farther in the short term if it slips and stabilizes below the sliding line (sl).

You can see that the rate has made a false breakout above the 1.1105 static resistance signaling a minor exhaustion. A valid breakout above the mentioned static obstacle will signal a  potential valid breakout above the lower median line (lml).

Conclusion

ETP/USD increase like the other cryptocurrencies after the massive drop, so the minor drop was natural as well.  We still need a confirmation that the Metaverse will resume the rebound and will reach at least the median line (ML)  in the upcoming weeks.

©Forex.Academy

Categories
Crypto Market Analysis

DASH/BTC Bullish Setup

Dash (DASH)

Market Cap. $3.81B

Circulating Supply: 8.03M DASH

Max Supply 18.9 DASH

Volume (24h) $111.72M


DASH/BTC Tradingview:

The DASH/BTC increased today and recovered a little after the yesterday’s massive drop. The pair remains under selling pressure in the short term because it is still located below two very important resistance levels. The minor retreat was natural after that important rebound. Right now we should wait for a confirmation that the rate will resume the upside movement.

The rate has come down to test and retest a broken dynamic resistance (resistance has turned into support), and now we could see another breakout attempt.

DASH/BTC chart

DASH/BTC has found strong resistance at the confluence area formed between the first warning line (WL1) with the 50% Fibonacci line (ascending dotted line) of the ascending pitchfork. It has come back down to test and retest the broken downtrend line and now is fighting hard to jump higher again.

The rate has started an increase after the failure to retest the upper median line (uml) of the former descending pitchfork. I’ve drawn an ascending Pitchfork hoping that I’ll catch a significant upside movement.

You can go long on this crypto pair only if the rate will increase and will make a valid breakout above the downside 50% Fibonacci line (ascending dotted line). The first upside target will be at the median line (ML) of the ascending pitchfork.

Conclusion

DASH/BTC will move towards the ML and towards the upper median line (UML) only if will make a valid breakout above the 50% line. The Stop Loss could be placed somewhere below the 0.04853320 level.

Categories
Crypto Market Analysis

STEEM_Further_Increase_Awaits_Confirmation

Steem (STEEM)

Market Cap. $909.33M

Circulating Supply: 254.27M STEEM

Max Supply: 0 STEEM

Volume (24h) $96.44M


We had very high volatility on the STEEM/USD today. The crypto dropped aggressively in the morning, but the bulls have stepped in and have forced the rate to increase again. Price is trading in the green right now and has managed to increase by 2.47%  and by 21.82% in the last 7-days.

As you already know, the crypto market crashed today after the last period rebound. Steem maintains a bullish perspective on the Daily chart despite the today’s drop.


You can see that the rate was close to reach and retest the 50% Fibonacci line (ascending dotted line). Price has rallied and erased the morning losses, but it has failed to close and stabilize above the median line (ML) of the major ascending pitchfork and the 3.63158182 static resistance.

STEEM/USD it was expected to increase after the failure to test and retest the lower median line (LML) of the ascending pitchfork. It will move towards the 6.00000000 psychological level if will make a valid breakout above the median line (ml) of the ascending pitchfork.

The cryptocurrency will resume the upside movement and could be attracted by the upper median line (UML) if will close and will stabilize above the median line (ML).

Conclusion

Price squeezed in the second part of the day and now is trading in the green again. You can go long on this crypto after a valid breakout above the median line (ML). The next major upside target will be at the upper median line (UML), while the Stop Loss could be placed below the 2.52287131 level.

©Forex.Academy

Categories
Crypto Market Analysis

Bitcoin Cash Long Again?

Market Cap. $21.76B

Circulating Supply: 17.09M BCH

Max Supply: 21M BCH

Volume (24%) $1.95B


Bitcoin Cash (BCH)

The BCH/USD signaled an exhaustion since yesterday, so the current drop is somehow natural. Price dropped as much as 1227 today and now is pressuring a very strong dynamic support (resistance turned into support). We could have a great buying opportunity in the upcoming days if the rate will test and retest the near-term support levels and will stay above.

Bitcoin Cash (BCH) chart

The rate has finally managed to break above the 50% Fibonacci line of the descending pitchfork and now is retesting it. Price has shown an oversold when has failed to stabilize below the median line (ML) after many breakdown attempts.

Technically, the BCH/USD it was expected to approach and reach the upper median line (UML) of the descending pitchfork. Right now is very important to see if we’ll have a valid breakout above the 50% Fibonacci line  (descending dotted line).

Bitcoin Cash could drop in the upcoming days after the failure to close on the 250% Fibonacci line and near the 1567 static resistance.

Price has also made a false breakout above the 23.6% retracement level, which has signaled an exhaustion. It could drop along the 50% Fibonacci line till will reach and retest the upper median line (uml) of the ascending pitchfork or even the median line (ml).

Conclusion

You can go long again after the retests and after a significant increase. It could climb at least till the upper median line (UML) if will have enough energy to make a valid breakout above the sliding line (SL).

©Forex.Academy

Categories
Crypto Market Analysis

EOS reached a major target, now what?

EOS (EOS)

Market Cap. USD 11.16B

Volume (24h) $3,36B

Circulating Supply: 815.92M EOS

Total Supply: 900.000.000 EOS

Max Supply: 1.000.000.000 EOS


EOS Price Analysis:

EOS/USD rallied aggressively in the last days and has managed to reach a major dynamic resistance. Price plunged today and could try to test and retest some support levels before will make the next move.

eos price target - eos price chart

You can see on the daily chart that it has registered an impressive rally in the yesterday’s trading session. EOS increased as much as 16.1460 level failing to approach and reach the 18.6700 historical high.

The perspective remains bullish despite the current drop. This could be only temporary before it tries to reach the historical high and to pass above it.

I’ve said in the last week’s trade setup that the EOS price should increase further after the breakout above the UML of the descending pitchfork. The confirmation has come after the amazing breakout above the sliding parallel line (sl) of the ascending pitchfork.

EOS/USD has found strong resistance at the first warning line (WL1) of the descending pitchfork and now is somehow expected to come to test and retest the upper median line (uml) of the ascending pitchfork.

You should know that only a valid breakout above the WL1 will confirm a further increase. Otherwise, the rate will drop towards the median line (ml) of the ascending pitchfork and towards the 150% Fibonacci line of the descending pitchfork.

© Forex.Academy

Categories
Crypto Market Analysis

ZRX/USD Buying Opportunity

0x (ZRX)

Market Cap. $592.68M

Circulating Supply: 524.68M ZRX

Max Supply: 0 ZRX

Volume (24h): $17.70M


ZRX/USD price jumped up by 11.48% today and by 42.06% in the last 7-days becoming an important performer. Price has finally managed to jump above the 1.0000 psychological level signaling that the bulls have taken full control. Right now is important that the rate close the day somewhere near the 1.1500 today’s high.

0x Price Prediction

The rate has moved sideways on the short term signaling and oversold and a potential upside movement. ZRX/USD has managed to break out above the minor downtrend line after the failure to reach the 0.3525 lowest low.

Price has found strong support at the 250% Fibonacci line of a former ascending pitchfork and now has jumped above the 50% Fibonacci line (red ascending dotted line) signaling that the rate will resume the upside movement.

The next upside target is at the median line (ml) of the red ascending pitchfork. It could be reached in the upcoming days. Only a valid breakout above this major dynamic resistance will confirm a further increase towards the 2.0000 psychological level and towards the upper median line (uml).

Technically, it is expected to move towards the 3.0000 level in the upcoming weeks and months if the crypto market will continue the rebound and as long as it will stay within the ascending pitchfork’s body.

ZRX/USD buying opportunity - Forex Academy

ZRX/USD made a valid breakout above the 50% Fibonacci line after several breakout attempts. It could be attracted by the confluence formed between the median line (ml) with the first warning line (wl1) of the former ascending pitchfork. The current upside movement is natural after the several false breakdowns below the lower median line (lml).

Conclusion

The perspective is bullish on the short term, so you should place a Stop Loss somewhere below the 0.4531 if you decide to go long on this crypto on the medium to the long term.

©Forex.Academy

Categories
Crypto Market Analysis

Qtum Crucial Breakout Eyed

Qtum (QTUM)

Market Cap. $1.92B

Circulating Supply: 88.55M QTUM

Max Supply: 0 QTUM

Volume (24h): $231.36M


QTUM/USD increased and resumed yesterday’s bullish candle. It went up by more than 4.4% today, and the bullish movement should continue. The crypto is trading near an important resistance area, so you should wait for a valid breakout.

qtum price chart

The current increase is natural and it was expected after the breakout above the minor downtrend line. It has shown an oversold when has failed to approach and reach the 10.74387040 swing low. Qtum price increased again after many retests of the upper median line (UML) of the descending pitchfork.

Right now is premature to talk about a more significant increase as long as the rate is trapped below the first warning line (WL1) of the descending pitchfork and below the 21.75638400 static resistance.

Personally, I want to see a valid breakout above the  WL1 followed by a lower median line (lml) retest to be sure that it will increase at least till the 50% Fibonacci line (ascending dotted line).

A further increase will be invalidated by a valid breakdown below the outside sliding parallel line (sl) of the ascending pitchfork. You should be careful because we don’t have a valid breakout above the lower median line (lml).

It has made a false one in the last days, so we need a confirmation that it will stabilize above the lower median line (lml). You should know that only a valid breakout above the 50% Fibonacci line will confirm an increase towards the median line (ml) and towards the 38.2% retracement level.

qtum chart - forex academy

QTUM/USD reached a dynamic resistance represented by the inside sliding parallel line (sl2). It will be very important for the rate to close above this dynamic obstacle because another rejection could send the price towards the outside sliding line (sl1).

QTUM Price Prediction Conclusion:

If you decide to go long from above the 23.00000000 psychological level, then you should place a Stop Loss somewhere below the 18.00000000 level. The crypto market has shown signs of life as the major cryptocurrencies have registered significant gains in the last days, but you should be very careful because this could still be only a temporary rebound.


Categories
Crypto Market Analysis

VeChain Broader Increase Validated

VeChain (VEN)

Market Cap. $2.15B

Circulating Supply: 525.78M VEN

Max Supply: 0 VEN

Volume (24h) $94.45M

VeChain increased significantly today and erased the last day’s minor drop. It has finally managed to jump in the buyer’s territory, so we should have a further increase. The next hours could be crucial because we still need one more confirmation that it will jump much above the 5.0000000 psychological level in the upcoming period.

VeChain (VEN) price - Forex Academy

VEN/USD has finally made an aggressive breakout above the upper median line (UML) of the descending Pitchfork and now approaches the 50% Fibonacci line. It should climb towards the upper median line (uml) of the minor ascending Pitchfork and the first warning line (WL1) of the major descending Pitchfork.

The perspective will remain bullish on the Daily chart as long as the price stays within the ascending pitchfork’s body. The crypto could increase without a broken upper median line (UML) retest. You can notice that its price has been pressing the UML in the last days. However, it could still retest the median line (ml) of the ascending pitchfork in the upcoming days because it could try to capture more directional energy. A significant retreat could appear if the crypto market crashes again.

vechain price prediction 2018

An important upside movement will be confirmed if the price gets enough directional energy to close above the 4.20381996 high. VEN/USD could be attracted by the confluence area formed between the upper median line (uml) with the150% Fibonacci line. A valid breakout will validate a further increase towards the WL1 of the major descending pitchfork.

Conclusion

If you go long on this crypto, you should place a Stop-loss somewhere below the lower median line (lml) of the ascending pitchfork. Technically, it is expected to double its value in the upcoming months, so it should approach and reach the 8.0000000 level again.

©Forex.Academy

Categories
Crypto Market Analysis

NEM Further Increase Could Be Confirmed

NEM (XEM)

Market Cap. $3.05B

Circulating Supply: 9.00B XEM

Max Supply: 0 XEM

Volume (24h): $30.37M


The XEM/USD has lost the bullish momentum in the short term and now seems undecided. It has changed little since yesterday, but it maintains a bullish bias. Maybe the rate will make a minor consolidation before will move towards fresh new highs.

NEM Price

NEM (XEM) is trading much above the 0.30000000 psychological level and is somehow expected to resume the rebound in the upcoming period. NEM price has made a false breakout above the median line (ML) of the minor ascending pitchfork so that a minor decrease will be natural.

It should pressure the 50% Fibonacci line (ascending dotted line) of the minor ascending pitchfork and also the 0.35471335 static support. The perspective will remain bullish as long as the rate stays within the ascending pitchfork’s body. XEM/USD was expected to increase after the breakout above the downtrend line, but we still need a confirmation that we’ll have a broader upside movement.

Personally, I believe that only a valid breakdown below the lower median line (lml) could invalidate a further increase.

nem stock price

You can see on the H4 chart that the rate failed to reach and retest the median line (ml) signaling a minor exhaustion in the short term. It is still expected to increase further despite a minor drop. You can go long on this crypto if the rate will make a valid breakout above the median line (ml), or if will come back down to test and retest the lower median line (lml).

The next upside targets will be at the upper median line (uml) and higher at the Fibonacci retracement levels.

NEM Price Prediction Conclusion:

NEM (XEM) will become strongly bullish after a valid breakout above the median line (ml). NEM price prediction could consolidate the latest gains before will resume the upside movement. Personally, I really hope that we’ll have a fresh buying opportunity soon.

©Forex.Academy

Categories
Crypto Market Analysis

Litcoin Further Increase Still Possible

Litcoin (LTC)

Market Cap. $8.53B

Circulating Supply: 56.22M LTC

Max Supply: 84M LTC

Volume (24H) $390.80M


Will Litecoin Recover April 2018

The Litcoin increased more than 19% in the last 7-day and is fighting hard to stay above some very important broken resistance levels. It is trading above the 150.000 psychological level, but unfortunately, it has shown a minor exhaustion in this weekend.

litecoin price analysis

Price has found temporary resistance right above the second warning line (wl2) of the former ascending pitchfork. Litcoin is almost to reach this line again after the retest of the 50% Fibonacci line of the descending pitchfork. Actually, the rate has made a false breakout above the warning line (wl2), so a retest will send the price down a little.

Maybe we’ll have a minor consolidation before the rate tries to break out from the descending pitchfork’s body. An accumulation above the 136.61 level could give us a great chance to go long on this major crypto again.

Personally, I believe that only a drop below the third warning line (wl3) and below the 50% Fibonacci line will invalidate a further increase in the upcoming period.

We’ll have a very important upside target somewhere at the first warning line (WL1) of the major descending pitchfork. Only a valid breakout above this line will confirm a further increase.

Will Litecoin recover - Litecoin chart analysis

Will Litecoin recover? You should stay away for now, because we don’t have a great buying opportunity. An accumulation above the 136.61 could bring more bullish energy. Technically, we have a very strong resistance line at the inside sliding line (SL) of the descending pitchfork.

The perspective will remain bullish as long as the rate stays above the 136.61 static support (resistance turned into support).

Categories
Crypto Market Analysis

ICON (ICX) Buying Opportunity?

ICON (ICX)

Market Cap. $1.27B

Circulating Supply 387.23M ICX

Crypto Max Supply: 0 ICX

Volume (24h): $50.43M

ICX tradingview:

ICX/USD increased today as much as 3.544012 level but failed to stay above the 3.4807593 yesterday’s high and now is showing some exhaustion signs. The last hour’s drop could be natural after the impressive rally. It could test and retest the broken resistance level before will move towards new highs.

ICX tradingview

The ICX/USD has finally managed to break out above the minor downtrend line and to jump above the lower median line (LML) of the ascending pitchfork again. It remains to see if this will be a valid breakout. The breakout above the minor downtrend line has signaled that we may have a larger rebound. Personally, I want to see if the rate will stabilize above the lower median line (LML) of the ascending pitchfork before I go long again.

We’ll have a great buying opportunity if the rate comes back down trying to retest the outside sliding line (SL2) before will stabilize within the ascending pitchfork’s body. The first significant upside target will be at the inside sliding parallel line (SL1). A valid breakout above this dynamic obstacle will lead the rate towards the median line (ML) and the upper median line (UML) in the upcoming months if the technical factors continue to drive the crypto market.

ICON buying opportunity

I’ve drawn on the H4 chart a perfect bullish scenario. Right now is risky to go long as the rate is far away from the near-term support levels. You can go long now, but only if you place a large Stop Loss somewhere below the 2.3562634 level, or you could wait for a retreat towards the SL2 and only them to buy the ICX/USD with a minor Stop Loss below the sliding line (SL2).

© Forex.Academy

Categories
Crypto Market Analysis

Ethereum Long Setup

Ethereum (ETH)

Market Cap. $56.68B

Circulation Supply: 98.93M ETH

Max Supply: 0 ETH

Volume (24h)

Ethereum (ETH) is the second most important crypto after the Bitcoin, so all the investors and traders are watching it closely. The rate has managed to increase in the last days as expected and now is almost to make a crucial breakout.

Ethereum (ETH) - Forex Academy

Ethereum is trading at $584 now and seems determined to climb much higher. It has reached the upper median line (UML) of the descending pitchfork. The UML represents a strong dynamic resistance, so only a valid breakout above it will signal a further increase.

The rate has breakout above the 565.44 static resistance as well as the bulls are in full control. I’ve drawn an ascending pitchfork hoping that I’ll catch the next major upside movement. We had a great buying opportunity after the rate has retested the lower median line (lml), near the $400 level. Personally, I still believe that we may have another buying opportunity soon if the rate will make a valid breakout above the UML. The major upside targets are at the median line (ML) and the upper median line (UML) of the ascending pitchfork. It could approach and reach these levels as long as it is trading within the ascending pitchfork’s body.

ethereum setup

You can see on the H4 chart that the rate has jumped above the UML and approaches the next dynamic resistance represented by the downside 50% Fibonacci line (ascending dotted line). Technically, we could see a minor drop in the upcoming days after the impressive upside movement. A retest of the broken UML and a valid breakout above the 50% Fibonacci line will really confirm a further increase towards the median line (ml) and towards the upper median line (uml) in the upcoming weeks and months.

© Forex.Academy

Categories
Crypto Market Analysis

EOS Bullish Perspective

EOS/USD

Market Cap. $7.301.307.239 USD

Volume (24h) $568.861.000 USD

Circulating Supply: 802.920.263 EOS

Total Supply: 900.000.000 EOS

Max Supply: 1.000.000.000 EOS


EOS/USD is trading in the green and tries to stabilize above a broken dynamic resistance. Technically, it is somehow expected to climb much higher in the upcoming period.

EOS/USD is trading in the green

EOS/USD has retested the upper median line (UML) of the former descending pitchfork and now tries to reach new highs. Price climbed above the median line and should approach the 50% Fibonacci level and the sliding line (sl2).

You should know that only a valid breakout above the mentioned resistance levels will confirm a further increase. The false breakdown below the first sliding line (sl1) has signaled that the bulls could take the lead again.

A valid breakout above the sliding line (sl2) and above the 10.0000 psychological could send the rate towards the upper median line (uml) and towards the first warning line (WL1). Resistance can be found at the 150% Fibonacci line as well.

EOS Bullish Perspective

I’ve added an H4 chart to show you what could happen in the upcoming hours. A failure to stabilize above the median line (ml) could signal a minor drop. So, a drop below the sliding line (sl1) followed by a retest will send the rate towards the downside 50% Fibonacci line.

We may have several breakout attempts above the upside sliding line (sl2) and above the 50% Fibonacci level (see the daily chart). The perspective will remain bullish on the daily chart as long as the rate stays somewhere above the UML and within the ascending pitchfork’s body.

Categories
Forex Educational Library

Maximum Adverse Excursion

INTRODUCTION

What is the MAE

Maximum Adverse Excursion (MAE) is a method of analysis for automatic or discretionary trading systems that allow us to objectively improve the overall operating result by positioning stops based on the statistical analysis of the development of operations from its inception to its closure.

When we study a trading system, we often find losses. Sometimes these losses are recurrent and lead us to reject a system or some of its rules. Here, the proposal is that instead of doing this, we approach the problem in another way.

As a method of improving results, John Sweeney proposes a statistical system rather than a technical one. We will not rely on indicators or the behavior of complicated logarithms, but on the statistical study differentiated from winning and losing operations. If our entry method is good, the course of price in winning trades is different from the behavior of the price of losing trades. We will not rely on indicators or the behavior of complicated logarithms, but on the statistical study differentiated from winning and losing operations.

Let’s analyze the winning trades and, above all, those that ended in losses. Are there any common features in them? Can we detect any pattern that makes us think we are in front of something usable?

There is a truth that in any trading system we must accept inescapably. At some point, we have to cut our losses. Of the many methods used for this purpose, the most common of all is price action when it distances itself from the meaning of our trade.

THE METHOD

We will track the price path during positive trades and along those that end in losses. The idea is to check the typical route of each of them and in this way, find the best way to place the system stop to achieve a better risk to reward ratio.

We will call “excursion” to the price range traveled by the price from our entrance to its end. We will distinguish the two possible directions:

Maximum Favorable Excursion: (MFE) It is the biggest advance of the price from our entrance to the exit.

Maximum Adverse Excursion: (MAE) It is the maximum retreat of the price from our entrance until the closing.

Steps

  1. Define our input and output rules.
  2. Record how much the price has moved from our entry to our departure both for and against the trade.
  3. Separate the winning trader’s data from losers into a table.
  4. Order the losers for lost categories.
  5. Check which patterns follow the price on losing trades and learn to recognize it.
  6. Set the stop according to the recognized pattern. If it behaves like a loser trade, acknowledge that we have been wrong and assume the losses.

Let’s see an example of how this methodology works.

Graph of a system without stops that operates on the DAX

In the vertical axis, we can see the maximum gap of each trade before its closure (MFE). The horizontal displacement represents the maximum adverse excursion (MAE) produced before its closing.

Given the graph, it appears as relevant the level of 0.15% – 0.20% as a limit. This translates into losing trades less than 0.15% -0.20% before ending losses. We can then cut losses at 0.28% (X-axis). It is also appreciated that the vast majority of winning trades retraced less than 0.10%.

The statistics of this system before making changes are as follows.

Based on the above results, we set the stop at 0.105% of retraction, and now it looks like this.

The statistics are as follows:

Statistics have improved. First, the maximum loss has been reduced from -1425 € to -237 € as well as the average loss from -195.47 to -167.24, and the profit-loss ratio has improved from 1.81 to 2.13.

By applying a trailing stop to the system, we can improve some statistical data that will help in the general computation. The use of this type of stop is delicate because it is very easy to be touched by a momentary price retreat. However, its use at a sufficiently loose distance can prevent a trade that is very advanced from becoming lost. In our case, the average loss on the losing trades improve from 167 to 158, and the percentage of winning trades increases slightly in both the long and short sides. It would read as follows:

Now to advance the robustness of the system, let’s look at the Maximum Favorable Excursion (MFE) by looking at the following graph.

We see the effect of the Trailing Stop. The trades advance far beyond the point at which they finally close. This is normal using this type of stop. Adjusting them further usually leads to a worsening of the final result of the set.

In the following chart, we see the effect of setting the Trailing Stop 50% closer.

Although it seems better, the total gain is worse, and the drawdown increases.

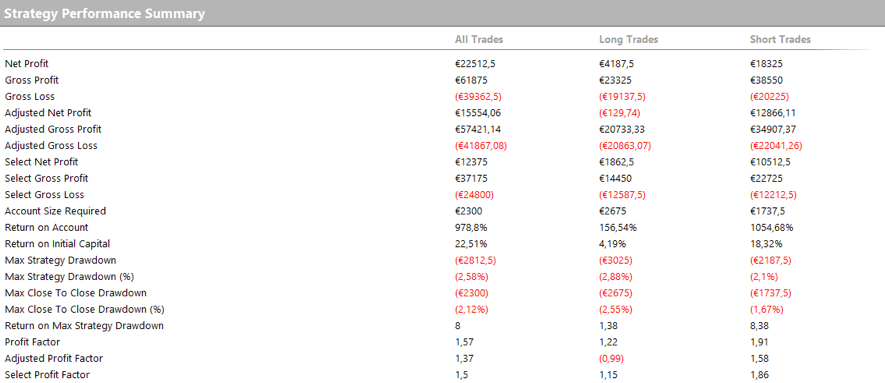
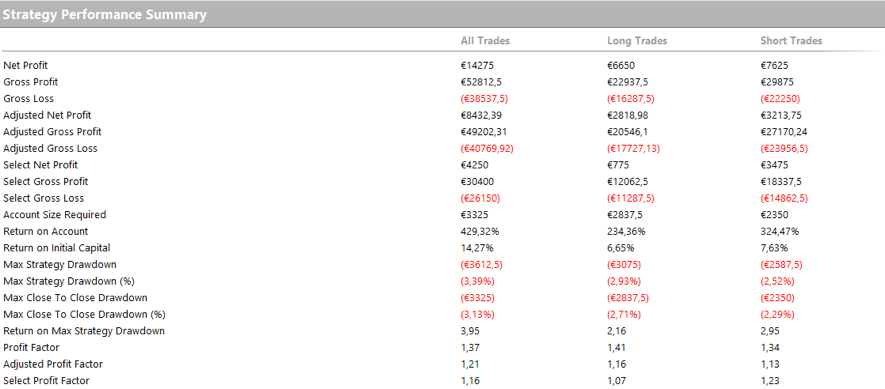
You can then compare the two options statistics, which leave no doubt.

Statistics with optimal Trailing stop:
Statistics with Trailing stop a 50% more adjusted
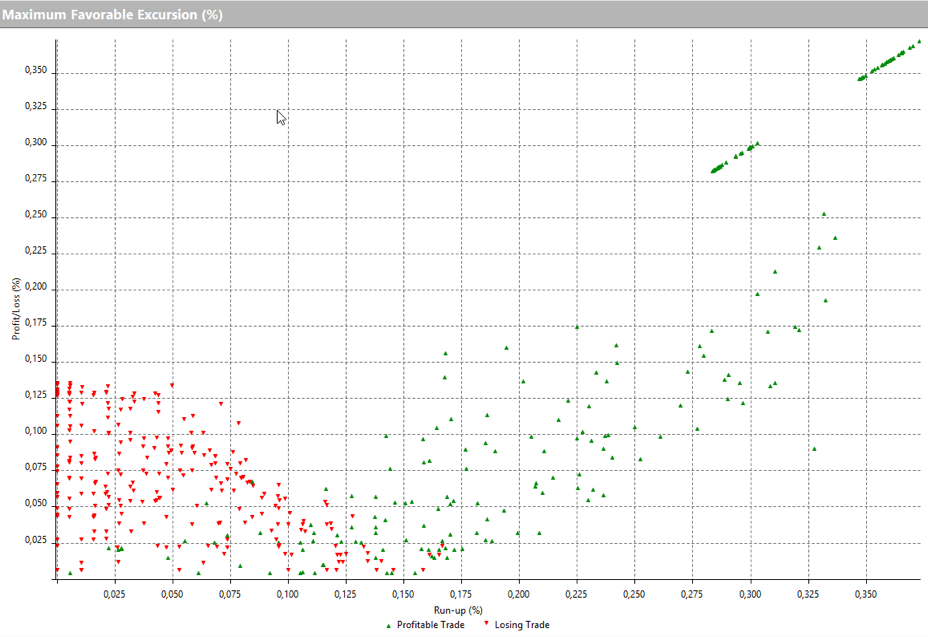
Maximum Favorable Excursion

The MFE is found by monitoring the maximum reached during positive operations. Often, we find that our trades end very far from this point. Obviously, our goal must be to get them to stop as close as possible to the MFE. In each particular case, we cannot expect to always close at the absolute maximum. In this case, the methods of traditional technical analysis based on indicators often betray us by getting us out of the market ahead of time or, on the contrary, keeping us while the point of maximum profit goes away.

By searching the MFE, we can detect the most likely area that the winning trades will reach. In this way, we should place our profit target at a point that’s the most probable, statistically speaking. This won’t make our system jump to an absolute possible maximum profit. However, it simplifies the system and makes it more robust by shortening the exposure time to the market.

Finally, a sample of the effect of adding a profit target, taking as reference the MFE. In this case, we separate the behavior of the MFE in the bearish bullish trades since, in the case of indexes and stocks, the market does not usually show symmetry. Experience tells us that there are different characteristics between bull markets and bear markets, although there are authors who question it.

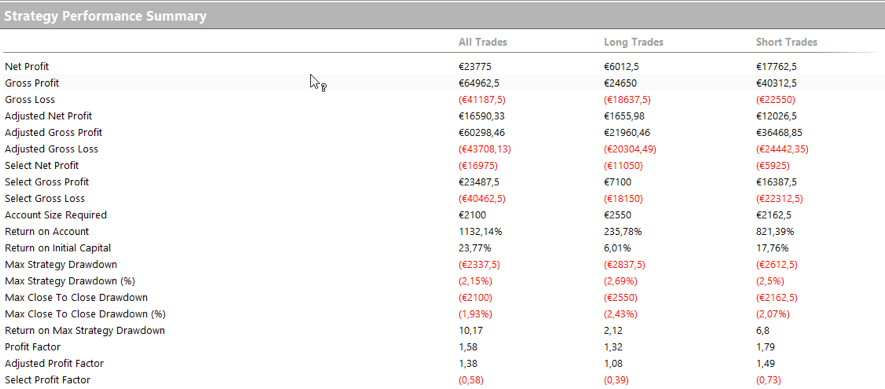
We put a TP (Take Profit) of 27 on bullish and 33 points for the bearish.
What you see is a performance improvement. Although the improvement in net profit does not seem too important, the maximum streak of losses decreases a lot. This procedure reduces the capital necessary for its implementation, and therefore, there is a substantial improvement in percentage profitability. It also increases the net profit and especially the Profit Factor.
Minimum Favorable Excursion

Another concept to evaluate is the Minimum Favorable Excursion. It is to detect the minimum point of advance from which it is unlikely that the price returns on our entrance. This will allow us to move our stops to break even, upon reaching this area and prevent it from ending up in losses.

Conclusion

The statistical method proposed by the MAE and MFE study is revealed as a fully valid system for the study and improvement of any trading system. The use of Maximum Favorable Excursion charts gives us a way to distinguish winning trades from losing trades since they behave differently.

We can see very quickly if there are exploitable behaviors. The behavior of losing trades has its own patterns. It just advances a tiny amount in favor of the entry and then moves against it, and this allows to act consequently by cutting the losses at the right spot where statistically winning trades didn’t reach.

On the other hand, the traditional use of pivots as a reference to locate stops usually leads to losses, since it is the first place where the market seeks liquidity as it minimally weakens a trend.

Finally, the MFE allows us to put the trade into break-even at the right time or even add positions in a favorable environment. It also facilitates the tracking of profit targets. In any case, it is a highly recommended study method to improve automatic or manual systems.

 ©Forex.Academy