The precious metal gold is trading dramatically bullish at 1,622 in the wake of boosted safe-haven appeal. The U.S. stocks advanced, buoyed by China’s stance in supporting local businesses amid the impact of the coronavirus outbreak. At the same time, minutes of the Federal Reserve’s last monetary policy meeting showed that officials were optimistic about the U.S. economy.

The U.S. official data showed that the number of housing starts increased to an annualized rate of 1.567 million units in January (1.428 million units expected), and the producer price index (PPI) rose 0.5% on month in January (+0.1% expected). Later today, initial jobless claims for the week ended Feb. 15 (210,000 expected), and the Conference Board Leading Index for January (+0.4% on month expected) will be reported.
European stocks rebounded, as the Stoxx Europe 600 Index rose 0.8%. Germany’s DAX increased by 0.8%, France’s CAC added 0.9%, and the U.K.’s FTSE 100 was up 1.0%. Despite that, the gold’s demand is still at the peak, which is driving its prices higher. Let’s take a look at the technical side of the market.
Support Resistance
1,604.59 1,615.98
1,597.42 1,620.2
1,586.03 1,631.59
Pivot Point 1,608.81
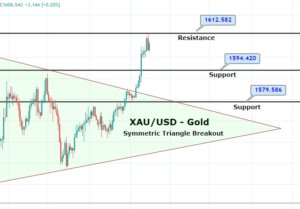
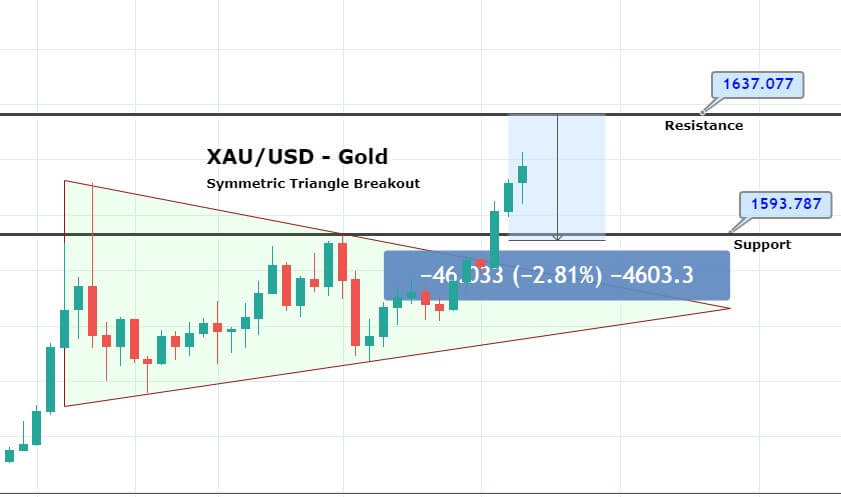
Technically, the precious metal gold has violated the symmetric triangle pattern, which was keeping it under pressure at 1,591. A bullish breakout of this level has opened further room for buying until 1,627 and 1,637. While the support can be found around 1,612 now, let’s take with a bullish bias above 1,612 level for the targets mentioned. Good luck!