In this analysis, we will look into endogenous economic factors that influence Australia and Switzerland’s growth. We will analyze factors that affect the fluctuation of the exchange rate of the AUD/CHF forex pair.
Ranking Scale
Both the endogenous and exogenous factors are ranked on a sliding scale from -10 to +10. The ranking depends on correlation analysis of the endogenous factors with domestic GDP growth, and exogenous factors with the AUD/CHF exchange rate.
Domestic currency increases in value when the endogenous factor has a positive score and depreciates if it is negative. Similarly, the AUD/CHF exchange rate rises if the exogenous score is positive and drops if negative.
Summary – CHF Endogenous Analysis
| Indicator | Score | Total | State | Comment |
| Switzerland Unemployed Persons | -6 | 10 | 153,270 in November 2020 | 2020 mean is 142,100 above the historic average of 59,003 |
| Switzerland Producer Prices Change | -3 | 10 | Decreased by 2.7% in November 2020 | Represents the 23rd consecutive month of a price decrease |
| Switzerland Capacity Utilisation | -6 | 10 | 78.11% in Q4 2020 | Q4 is the lowest recorded in 2020. It’s also lower than the historical average of 80.03% |
| Switzerland Household Saving Ratio | -5 | 10 | Expected to reach 15.4% in 2020 | This would be the highest level in Switzerland’s history |
| Switzerland House Price Index | 1 | 10 | 172.82 points in Q3 2020 | Throughout 2020, the Swiss Residential House Price Index has remained above the historic average of 106.48 points |
| Switzerland Fiscal Expenditure | 3 | 10 | Projected to hit 235 billion CHF in 2020 | This would be the highest level in Switzerland’s history. It’s a direct result of the unprecedented expansionary fiscal policy |
| Switzerland Bankruptcies | 1 | 10 | 14,800 companies in 2020 | Precipitated by the adverse operating and economic conditions due to the coronavirus pandemic |
| TOTAL SCORE | -15 |
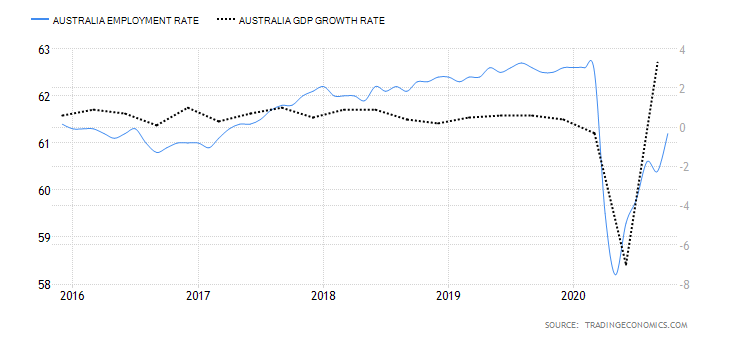
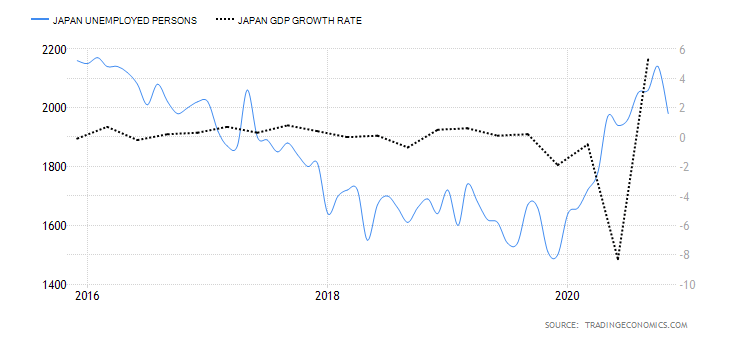
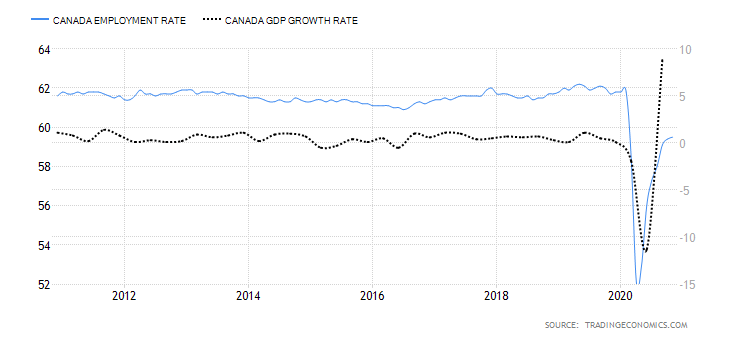
- Switzerland Unemployed Persons
In Switzerland, the labour market is made up of Swiss citizens aged 16 to 65 years. The number of unemployed persons includes those who are available for work but could not get employed during the survey period. Note that the number of unemployed persons does not cover those working temporarily and must include those who have made efforts to seek gainful employment within four weeks. This number shows the prevailing economic situation in Switzerland since employment levels correspond to economic growth.
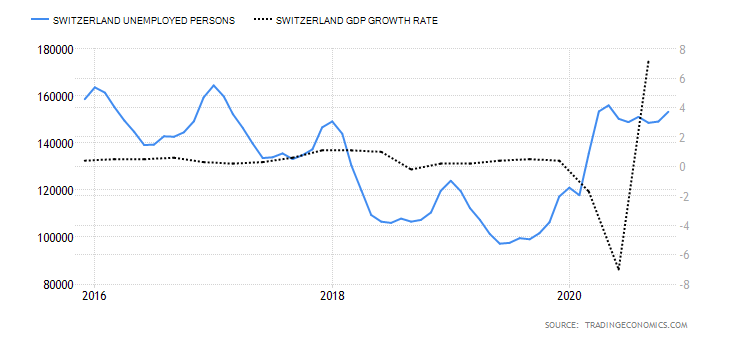
In November 2020, unemployed persons in Switzerland rose to 153,270 from 149,118 in October. In 2020, the mean of the unemployed persons in Switzerland is around 142,100 above the historic average of 59003. It has a score of -6
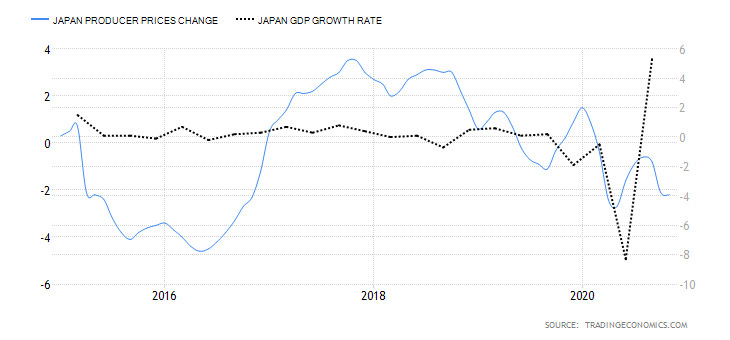
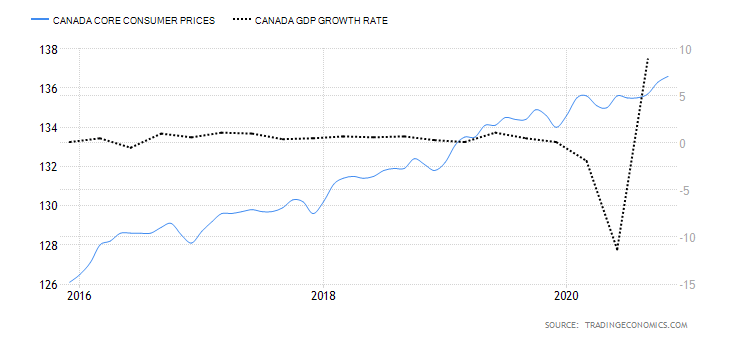
- Switzerland Producer and Import Prices
The Swiss PPI measures the change in the price of goods produced within the country and sold to wholesalers. It also includes the price changes of goods that are imported for resale in Switzerland. The PPI is a leading indicator of inflation in Switzerland since the change in the producer prices is passed to the final consumers of the products.
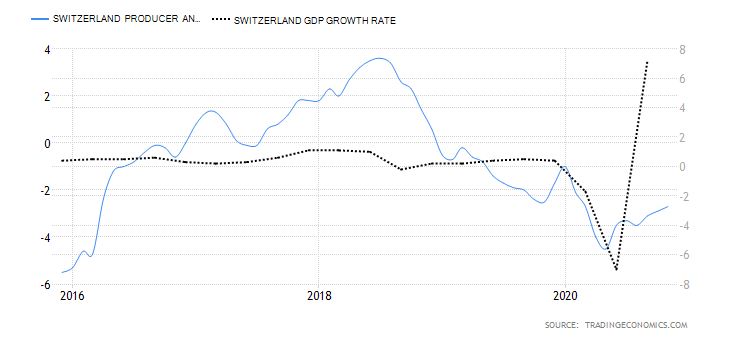
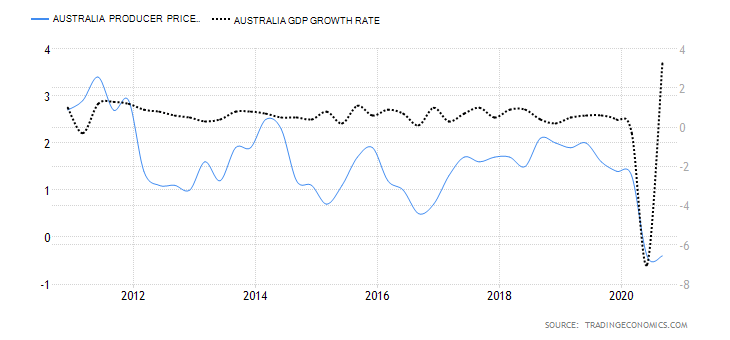
In November 2020, the YoY Swiss PPI dropped by 2.7% compared to a 2.9% drop recorded in October. This is the 23rd consecutive drop in the PPI. However, it was the slowest drop since March indicating that domestic demand is picking up. It has a score of -3.
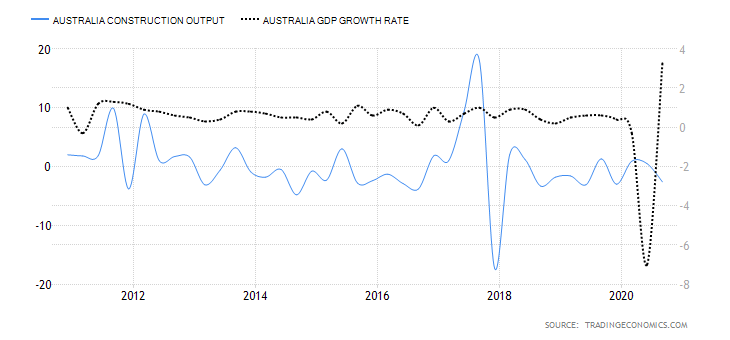
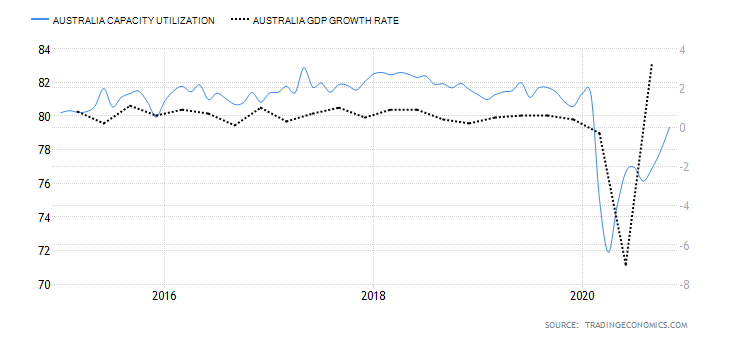
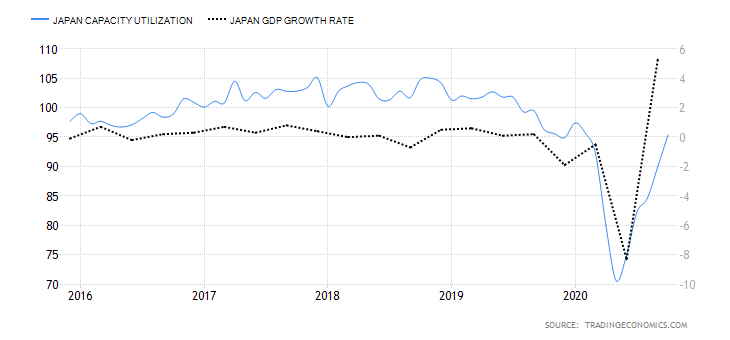
- Switzerland Capacity Utilisation
This tracks the percentage change in the ratio of actual industrial production in Switzerland and the maximum potential output. This ratio shows the rate at which the Swiss industries utilise the available resources. Typically, when the capacity utilisation rate increases, the output in the Swiss industrial sector also increases. This corresponds to economic expansion and improved living standards.
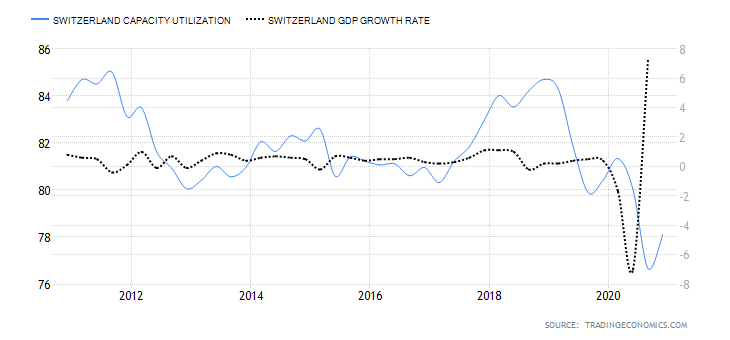
In Q4 2020, the Swiss capacity utilisation rose to 78.11% compared to 76.67% in Q3. However, the Q4 ratio is lower than the 81.34% in Q1, 80.03% in Q3, and the historical average of 83.45%. Consequently, it has a score of -6.
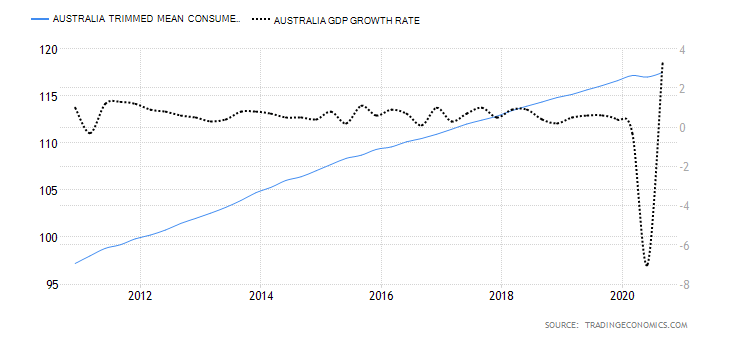
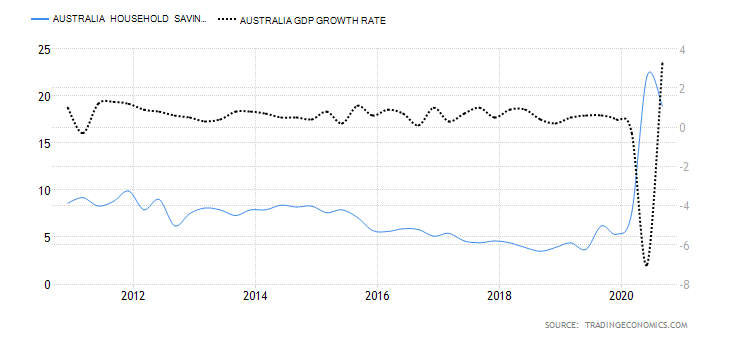
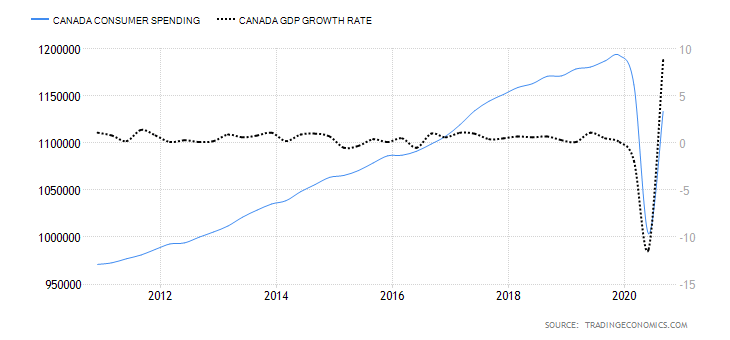
- Switzerland Household Saving Rate
This is the ratio between the amount that Swiss households save to their disposable income. In an economy, when the savings rate is high, domestic consumption takes a hit. Since a higher household savings rate corresponds to a drop in domestic demand, it leads to a decrease in GDP growth, and vice versa.
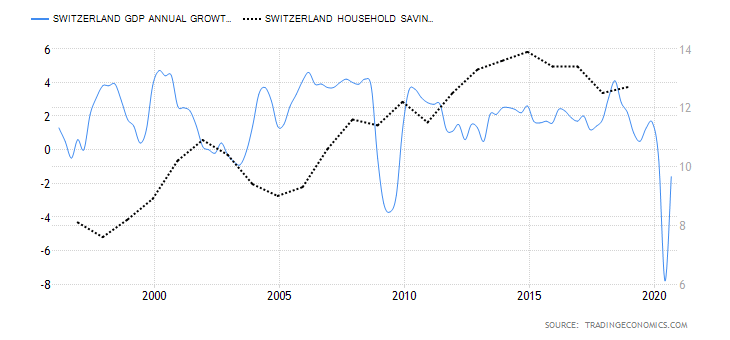
In 2020, Switzerland household saving rate is projected to hit 15.4%, which would mark the highest level in Switzerland’s history. It has a score of -5.
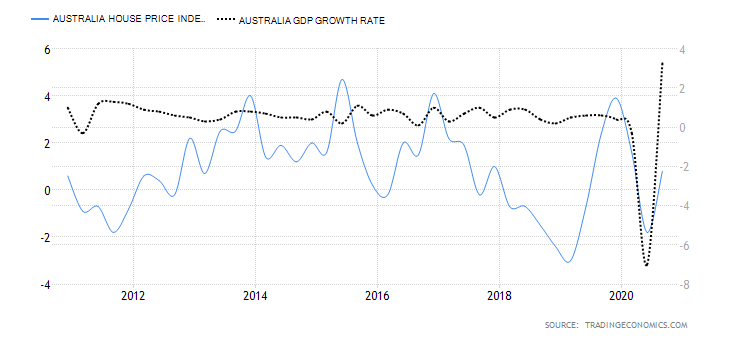
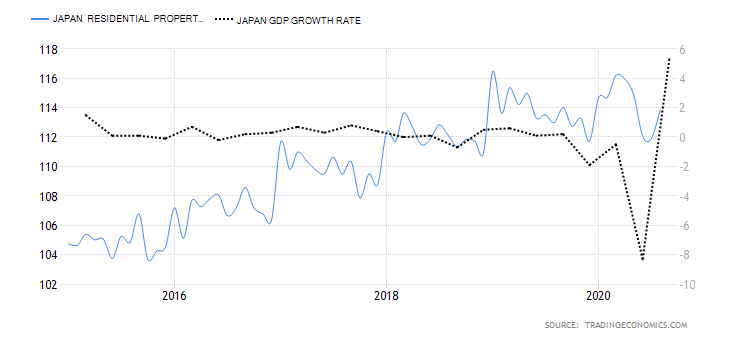
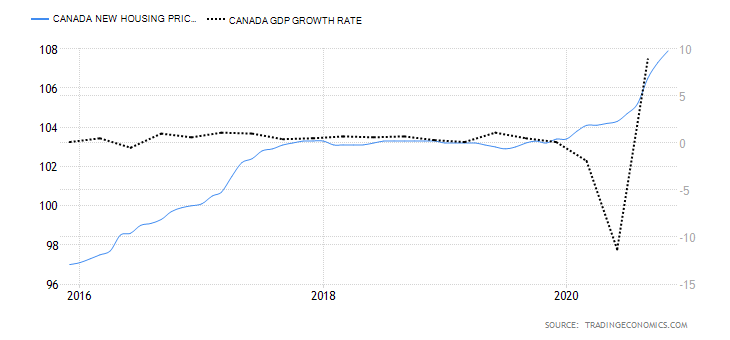
- Switzerland Residential House Price Index
This index tracks the change in the quarterly change of the price of single-family homes. Price change in the real estate sector is a leading indicator of overall economic growth. Residential property increases in price due to rising demand, which means there is access to affordable financing or increased disposable income.
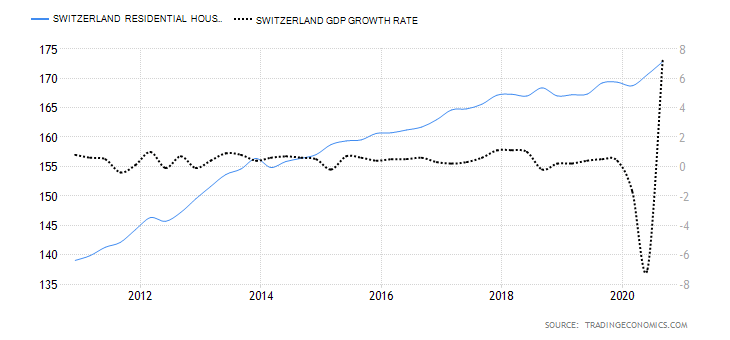
In Q3 of 2020, Swiss housing price index increased to 172.82 points from 169.22 points in Q2. Throughout 2020, the Swiss HPI has remained above the historic average of 106.48 points. This shows that domestic residential property did not take a hit as a result of the coronavirus pandemic. It has a score of 1.
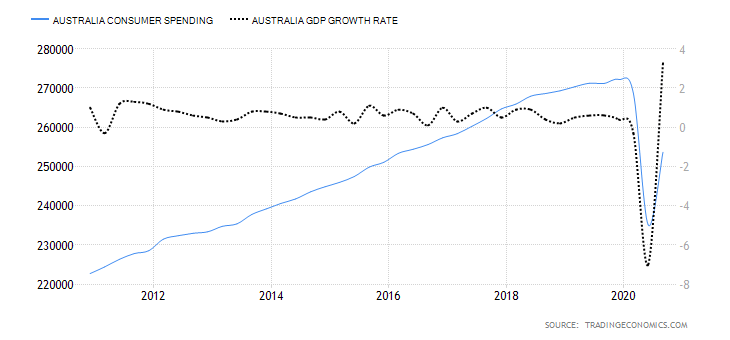
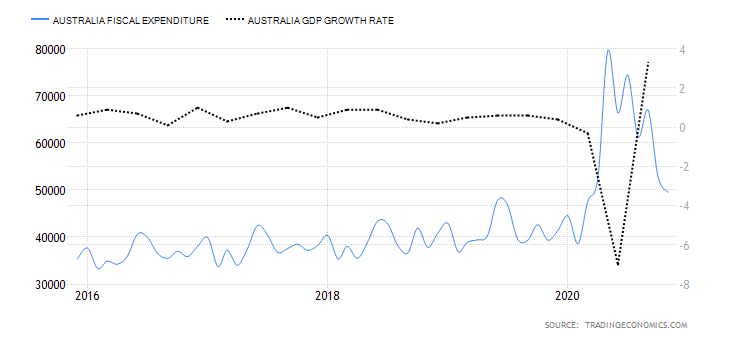
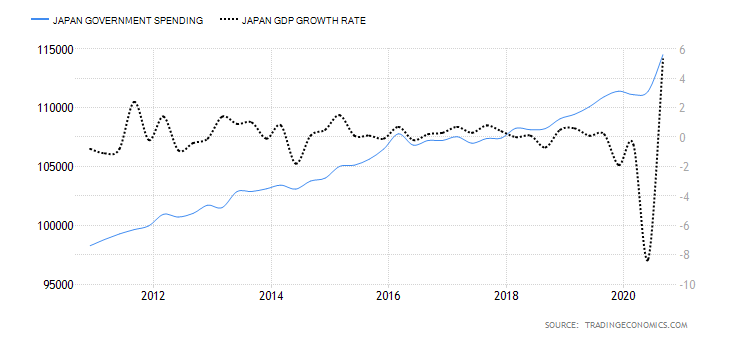
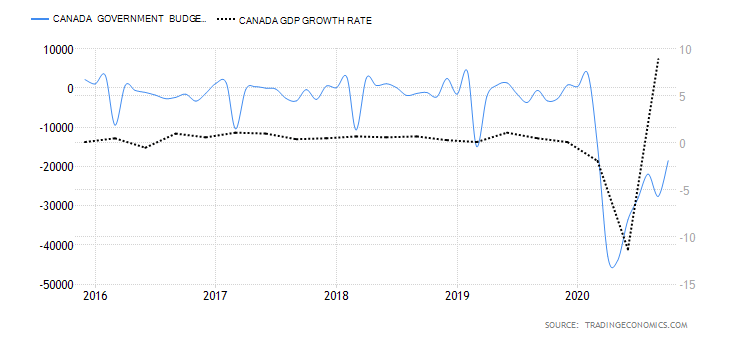
- Switzerland Fiscal Expenditure
This measures the totality of expenses by the Swiss government. They include expenditure on goods and services, public investment, and transfer payments. Note that fiscal expenditure is a primary method for the government to influence the economic growth rate.
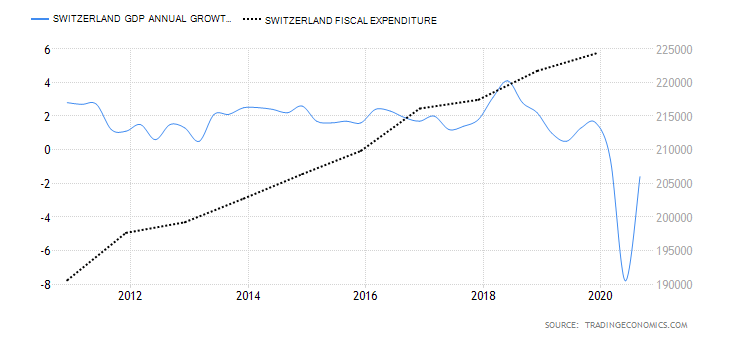
In 2019, the Swiss government’s fiscal expenditure increased to 224.309 billion CHF from 221.715 billion CHF. It is projected to hit an all-time high of 235 billion CHF in 2020 due to unprecedented fiscal expansionary measures to combat the pandemic. It has a score of 3.
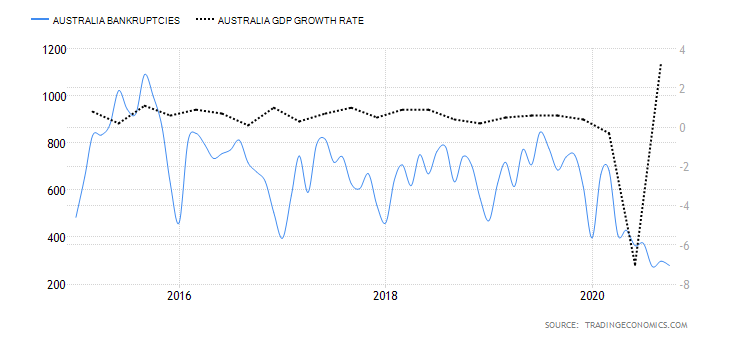
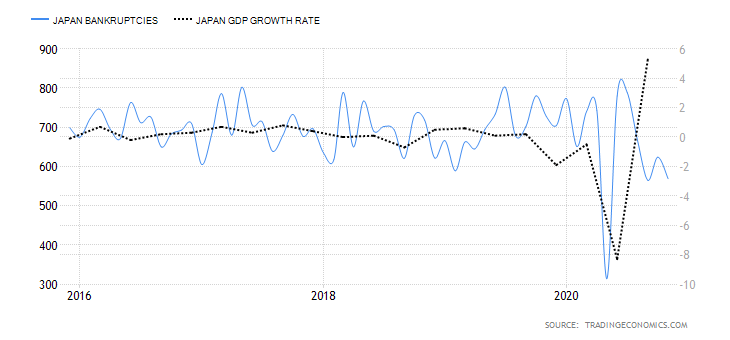
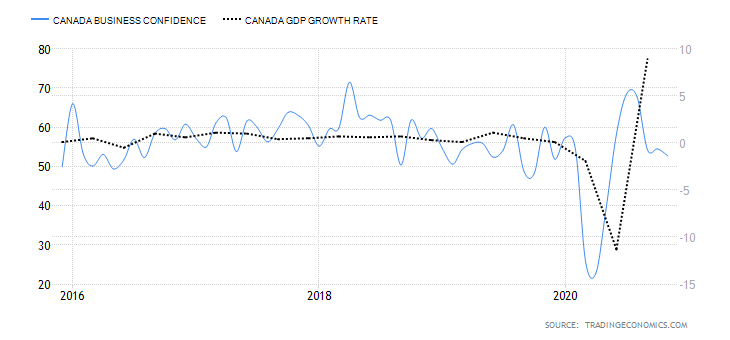
- Switzerland Bankruptcies
This measures the number of companies operating in Switzerland that are forced to close down due to the inability to service their debt obligations. Typically, the number of bankruptcies increases when the economy is performing poorly.
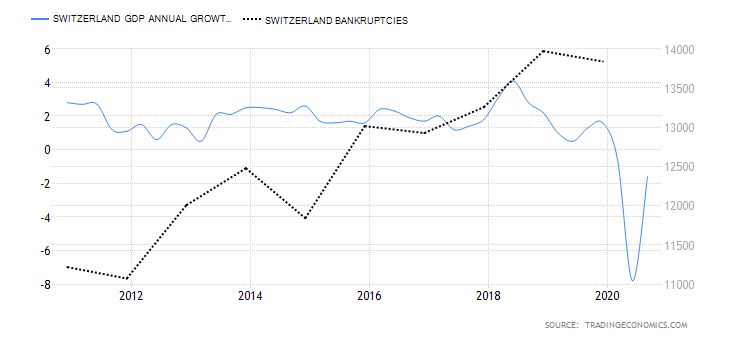
In 2020, the number of Swiss bankruptcies is projected to reach historic highs of about 14,800. It has a score of 1.
AUD/CHF Exogenous Analysis
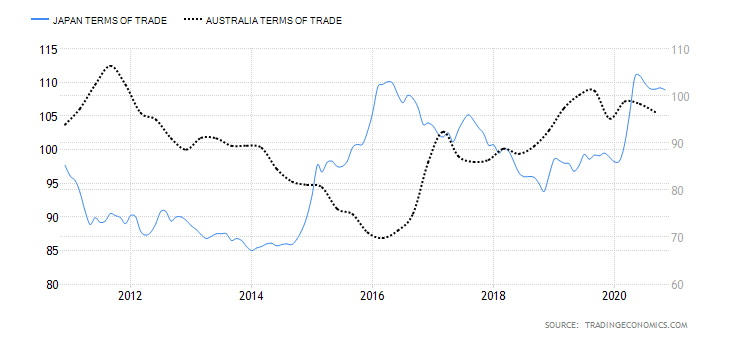
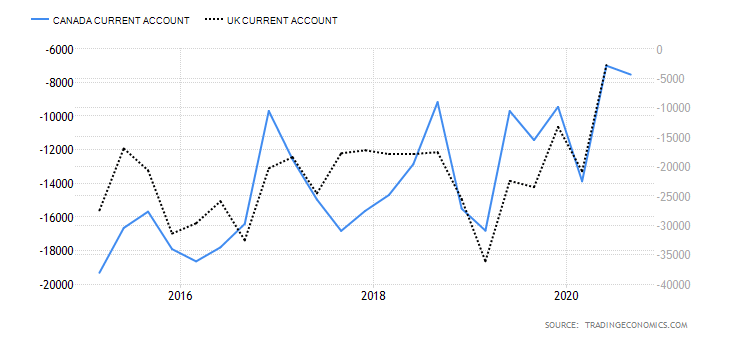
- Australia and Switzerland Terms of Trade Differential
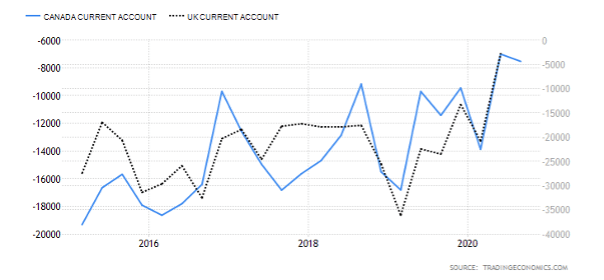
A country’s terms of trade are derived from dividing the value of its exports with its imports. Thus, a country with a surplus net current account balance has terms of trade above 100%. Conversely, when its balance of payments has a deficit, the terms of trade will be below 100%.
In international trade, the domestic currency appreciates when a country has favourable terms of trade, and depreciate when unfavourable. Thus, when the differential of the terms of trade between Australia and Switzerland is negative, the AUD/CHF pair is expected to be on a downtrend. If the differential is positive, we can expect an uptrend for the AUD/CHF pair.
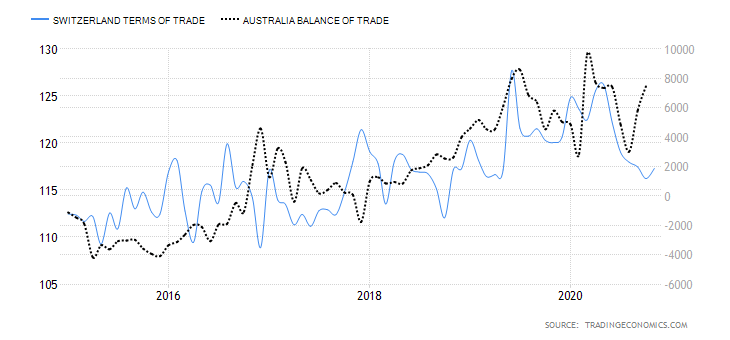
From January to October 2020, Australia’s average TOT was 97.9% while Switzerland had 121.15%. The differential is -23.25% and has a score of -4.
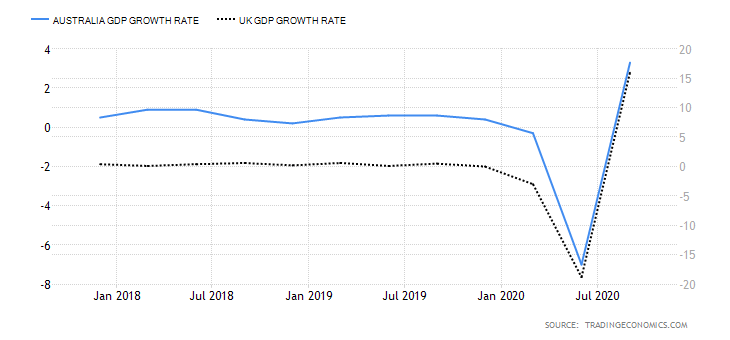
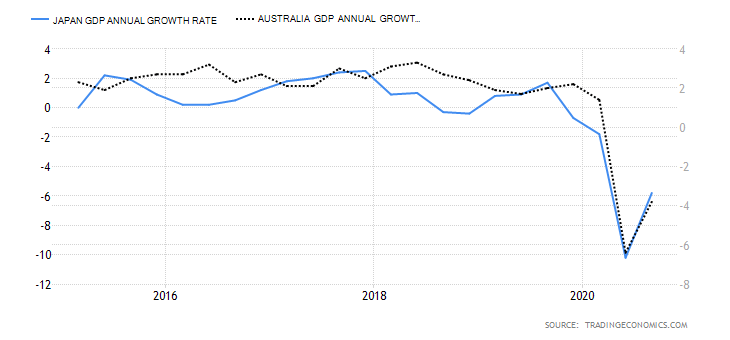
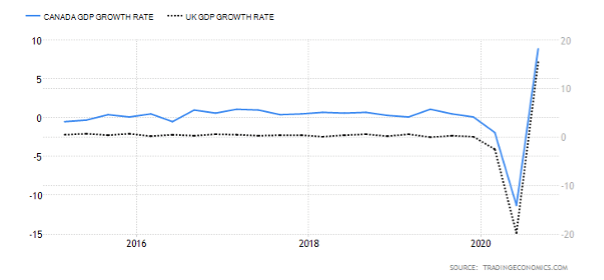
- Annual GDP Growth Rate Differential between Australia and Switzerland
The differential in the annual GDP growth rate is the difference between Australia’s and Swiss annualised GDP growth rate. Naturally, a country with a higher GDP growth rate tends to have a stronger currency than those with a slower GDP growth rate.
When this differential is positive, Australia has a higher annualised GDP rate than Switzerland. Since the AUD will subsequently appreciate more than the CHF, we can expect a bullish trend for the AUD/CHF pair. Conversely, if the Swiss economy has a higher annual GDP growth rate, then the differential will be negative. Consequently, the AUD/CHF pair has a bearish trend.
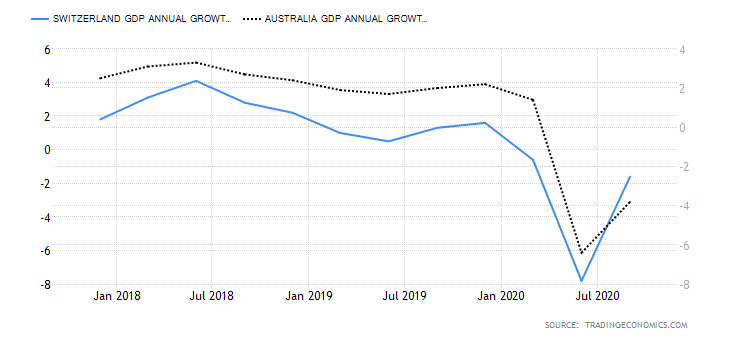
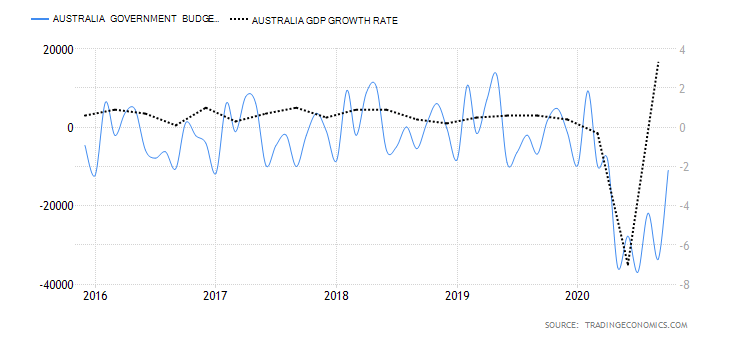
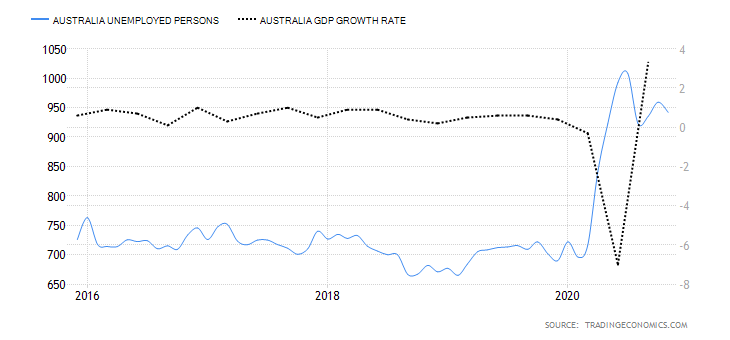
Australia had an annual GDP growth rate of -8.8% during the first three quarters of 2020, while the Swiss economy has an annual growth rate of -10%. The differential is 1.2%, and it has a score of 2.
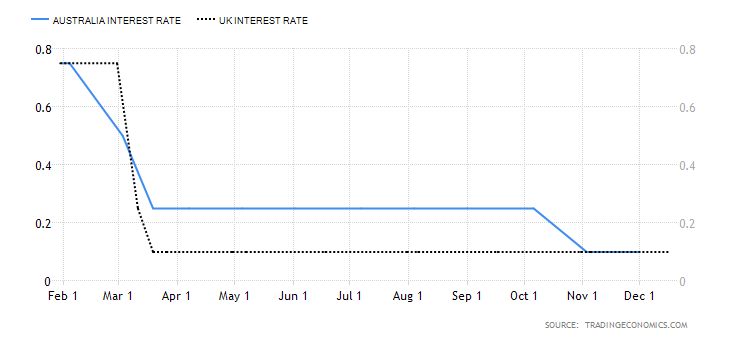
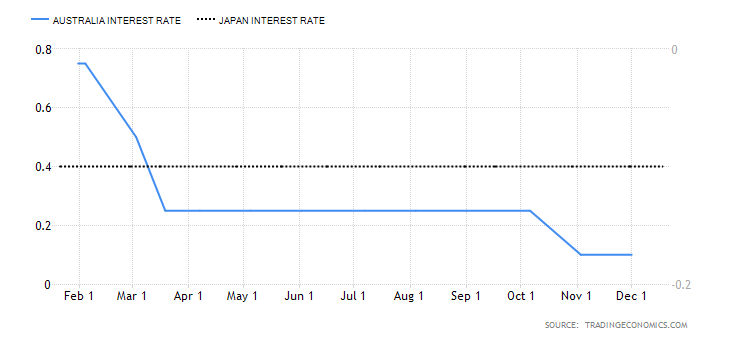
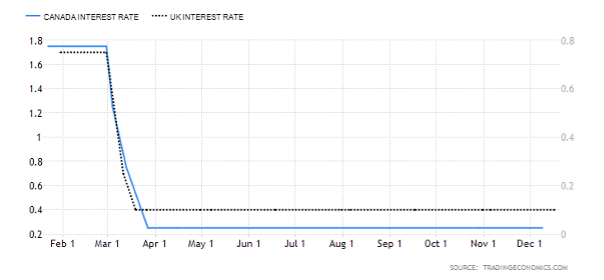
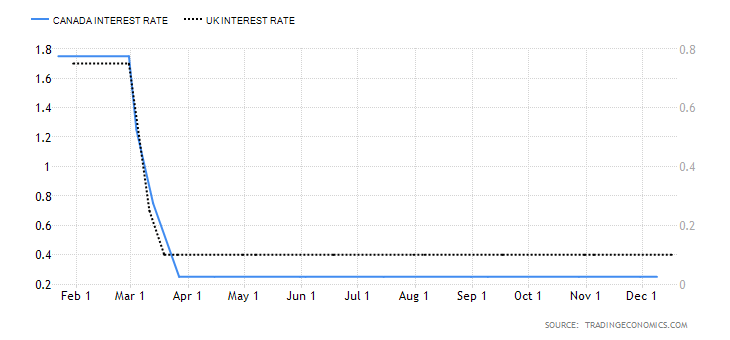
- The AUD/CHF interest rate differential
In the forex market, the interest rate differential determines the flow of capital between two currencies. For the AUD/CHF pair, the interest rate differential determines if traders and investors will go long or short the pair.
A positive interest rate differential means that Australia has higher interest rates than Switzerland; hence a bullish AUD/CHF pair. Negative differential means Switzerland has a higher interest rate than Australia; hence a bearish AUD/CHF.
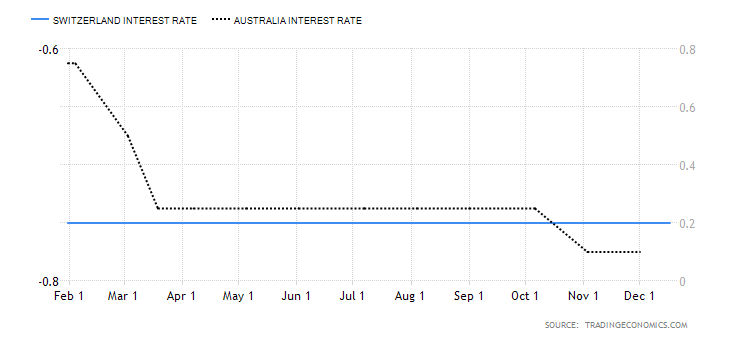
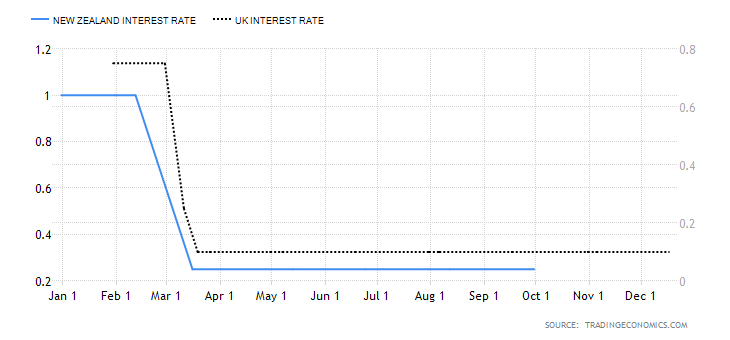
In 2020, the Reserve Bank of Australia cut interest rates from 0.75% to 0.1% while the Swiss National Bank maintained interest rate at -0.75%. Therefore, the interest rate differential for the AUD/CHF pair is 0.85%, and it has a score of 5.
Conclusion
| Indicator | Score | Total | State | Comment |
| Australia and Switzerland Terms of Trade Differential | -4 | 10 | A differential of -23.25% | Switzerland has a current account surplus hence better terms of trade than Australia |
| Annual GDP Growth Rate Differential between Australia and Switzerland | 2 | 10 | 1.20% | Australian economy marginally contracted at a slower pace than the Swiss economy |
| The AUD/CHF interest rate differential | 5 | 10 | 0.85% | The SNB has maintained interest rate at -0.75% and has no short-term prospects of changing the policy. A policy change from the RBA might trigger any changes in the differential |
| TOTAL SCORE | 3 |
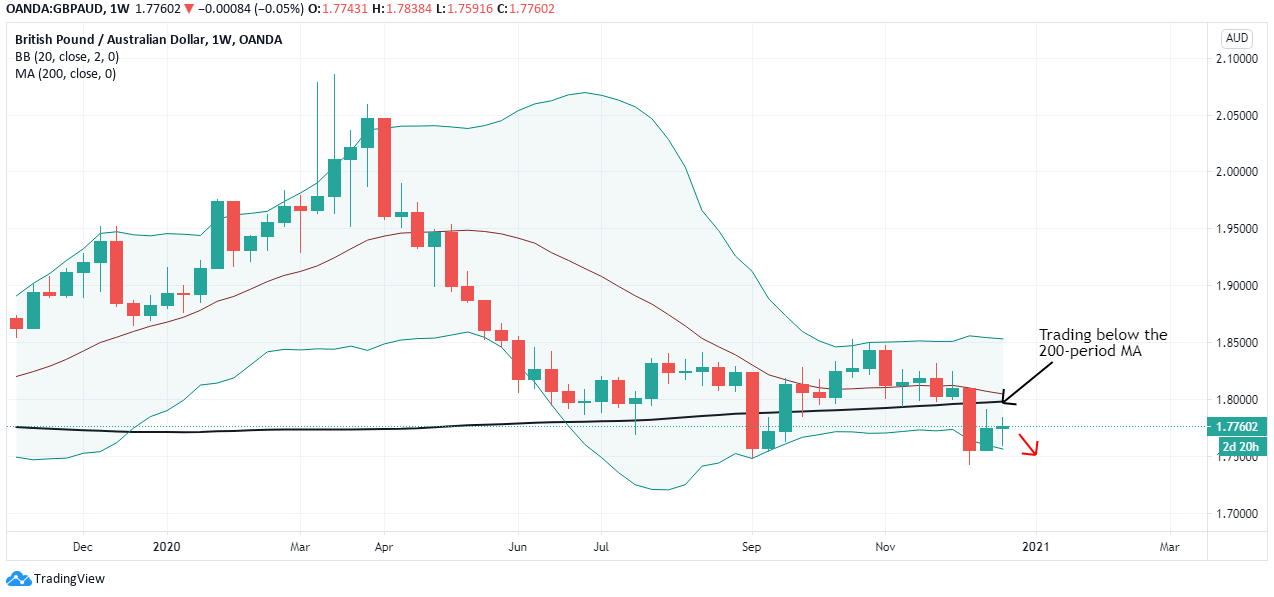
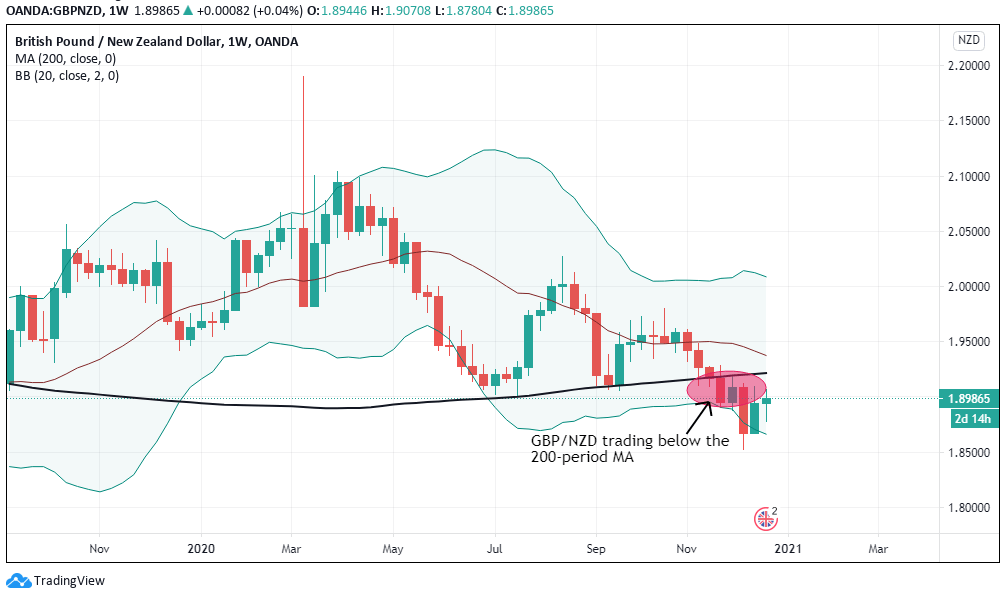
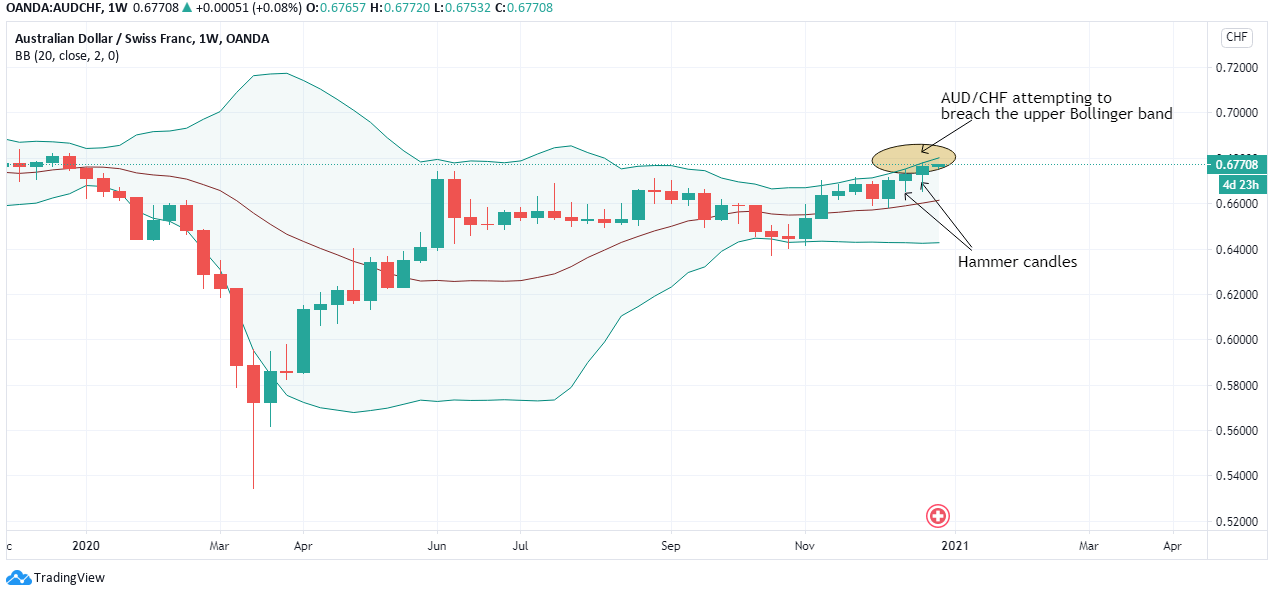
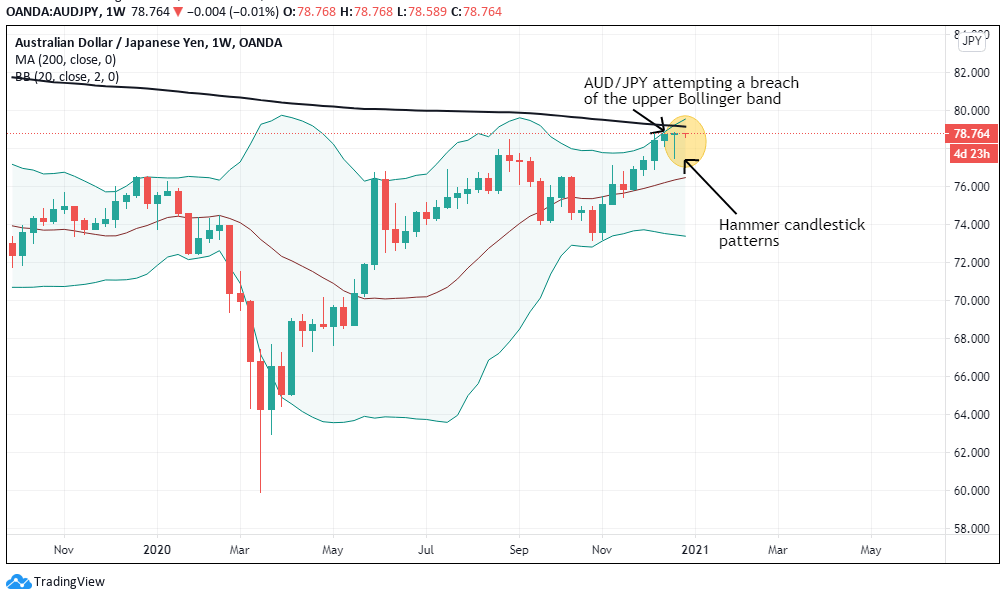
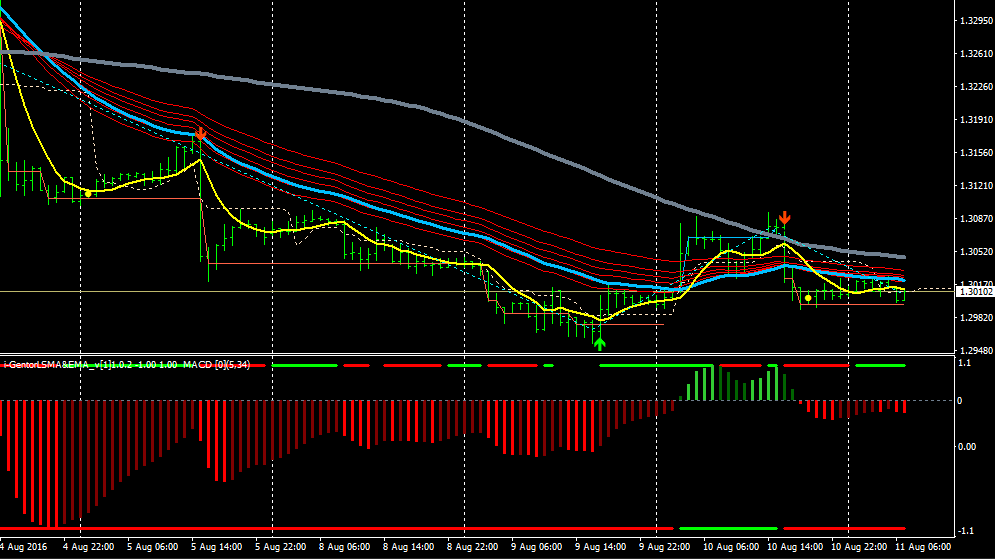
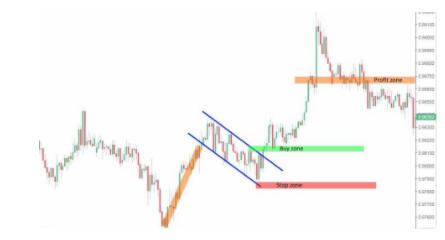
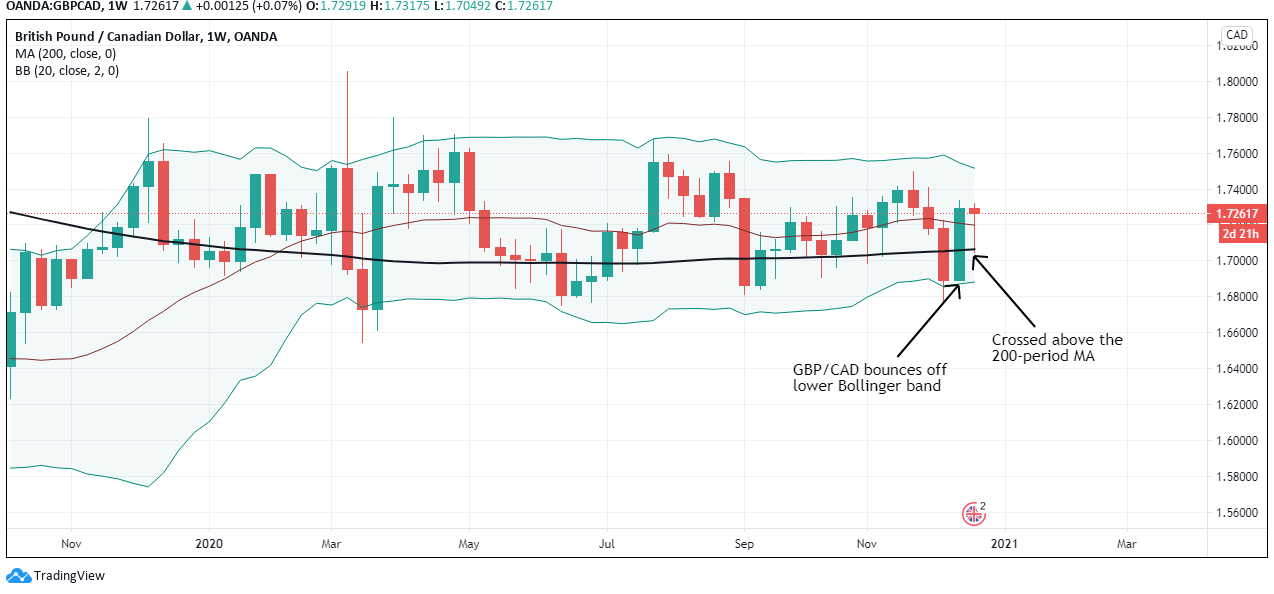
The cumulative exogenous score for the AUD/CHF pair is 3, which implies that we can expect the pair to continue trading on a bullish trend. The pair’s weekly chart’s technical analysis shows it is attempting to break through the upper Bollinger band. Furthermore, it has formed a series of bullish ‘hammer’ candles meaning that sellers have failed to drive down the exchange rate.


:max_bytes(150000):strip_icc():format(webp)/dotdash_Final_Four_Types_of_Forex_FX_Trend_Indicators_Nov_2020-01-df673b5bd0764b14bc7a6b2b6d53bb55.jpg)
:max_bytes(150000):strip_icc():format(webp)/dotdash_Final_Four_Types_of_Forex_FX_Trend_Indicators_Nov_2020-03-995620c669434f8c907032c46be7e891.jpg)
:max_bytes(150000):strip_icc():format(webp)/dotdash_Final_Four_Types_of_Forex_FX_Trend_Indicators_Nov_2020-05-0112d62d43b64703997192dad9f396e8.jpg)


 It is normal that you can think after all this when you open your trading platform “what if the flute sounds? what if it does?”. We’ve all read the typical news in the newspaper where it tells you that x person won an incredible amount of money with x event. Quick and easy. Here the survival bias is very high. Don’t tell you that that could be 0.0001%


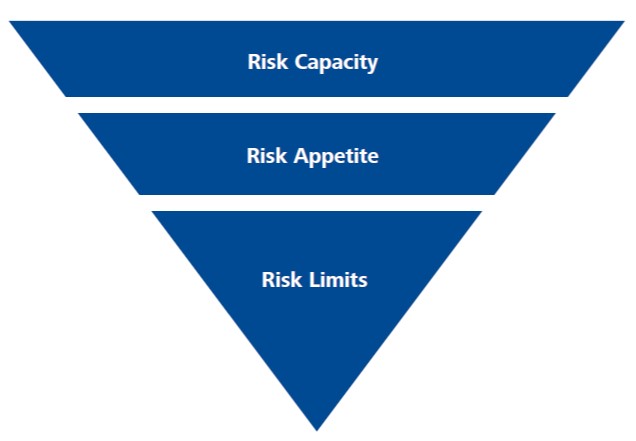 With that being said, how do you know whether your own appetite for risk is appropriate and reasonable? Firstly, if you are getting severe anxiety or stress from trading, you don’t really want to press that trade button due to worry that you may lose something then your risk tolerance and appetite is on the low side, if it is really bad, then this can be a sign that trading is simply not for you, there will be risks and to trade is to accept those risks. For some it is possible to work through it and to develop a better tolerance to the trades, for others it is simply not possible and so trading will simply be a stressful situation for you.
 So let’s assume that you are either high or low on the appetite level, what can we do to help? The first thing is to create a trading plan, within this plan you will have set out some rules, these rules are there for one important thing. They are there to ensure that you are in line with your plan and that your risks are limited. These rules will help someone with a low appetite for risk to understand that they are still in charge and that trading along these rules gives them the essence of safety, a way of controlling the risks that they are being put under.

 However, this change has not allowed us to detect “hidden changes” – those moments that Coates calls “the time between the dog and the wolf” – when people become very risky or very averse to the risk of the normal. Coates says statistical-based methods, which do not take into account biology or neuroscience, are not able to capture the behavioral changes in traders.
 In the tests conducted by Kerstin Preuschoff, a researcher at the Laboratory of Computational Neuroscience at the Swiss Federal Institute of Technology in Lausanne, and Steven Quartz, professor of philosophy and researcher of neuroscience at Caltech, subjects participating in the study were asked to play cards while observing the brain areas activated during risk management using fMRI. The collected data suggest that the anterior insula section of the brain, considered the seat of feelings and emotional awareness, transmits this information in a fairly precise way – essentially in the form of mathematical signals.
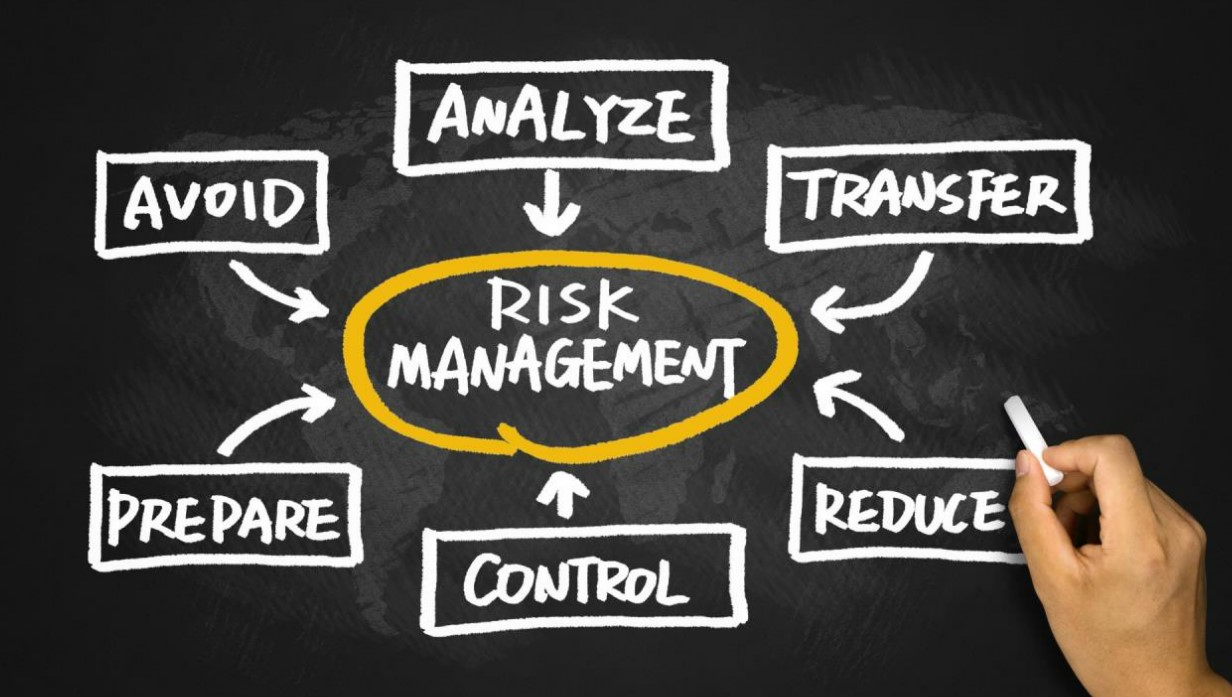
 Risk management is the cornerstone of any strategy, it is the foundation that is there to basically protect your account. It is there to ensure that you do not lose more than you want to with each trade and ensures that you do not blow your account. When you have it in place it can help to take out a lot of the stress from your trading. Of course, the opposite is also true, if you do not have proper risk management in place then every single trade that you make will have the chance of blowing your account. If You are in that situation every trade then you will be under constant stress every time that you trade. This is why you need things like trading rules, dictating how and when you trade, stop losses to help protect your accounts, and a proper
  At times it will be impossible to prevent any stress from building up, so then we will need to try and deal with it. One of the best ways to do this is to simply take a break, breaks are a fantastic way for us to reduce our stress levels. Getting away from what is causing the stress is the first step, it will prevent any new thoughts or new stresses from being added to the equation. Secondly, being away and doing something else will help to take our minds off of things that are already causing us stress. This way we think about something rose, something else that gives us enjoyment or at least doesn’t add to the stress. Doing this regularly can help you to regulate the stress that you are under. Do this regularly, multiple times a day, it is even a good idea to do it even if you aren’t currently experiencing stress. Just ensure that you are not sitting in front of the computer for hours and hours without any breaks. Coming back with a clear and calm mind can really help you to improve your productivity and trading results.
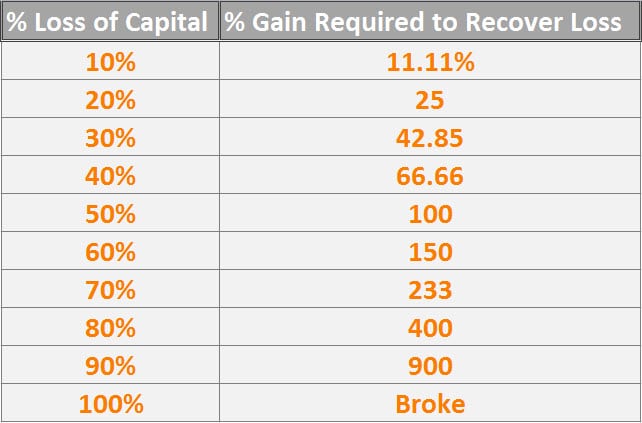
 Losses are a part of trading, a big part of them, every single person that has ever traded (apart from those that only do a single trade) will have experienced losses, all of the most successful traders in the world have experienced losses and a lot of them. In fact, they are so much a part of trading that we factor them into our trading through our trading strategies and risk management. Ever heard of the risk to reward ratio? This is where we decide how much we will risk with each trade and how much we want to win. Knowing this means that we know exactly how much we might lose with each trade and that each trade is actually a fantastic way for us to learn from what we have done and for us to improve. Look at why the trade lost and what we can do differently.


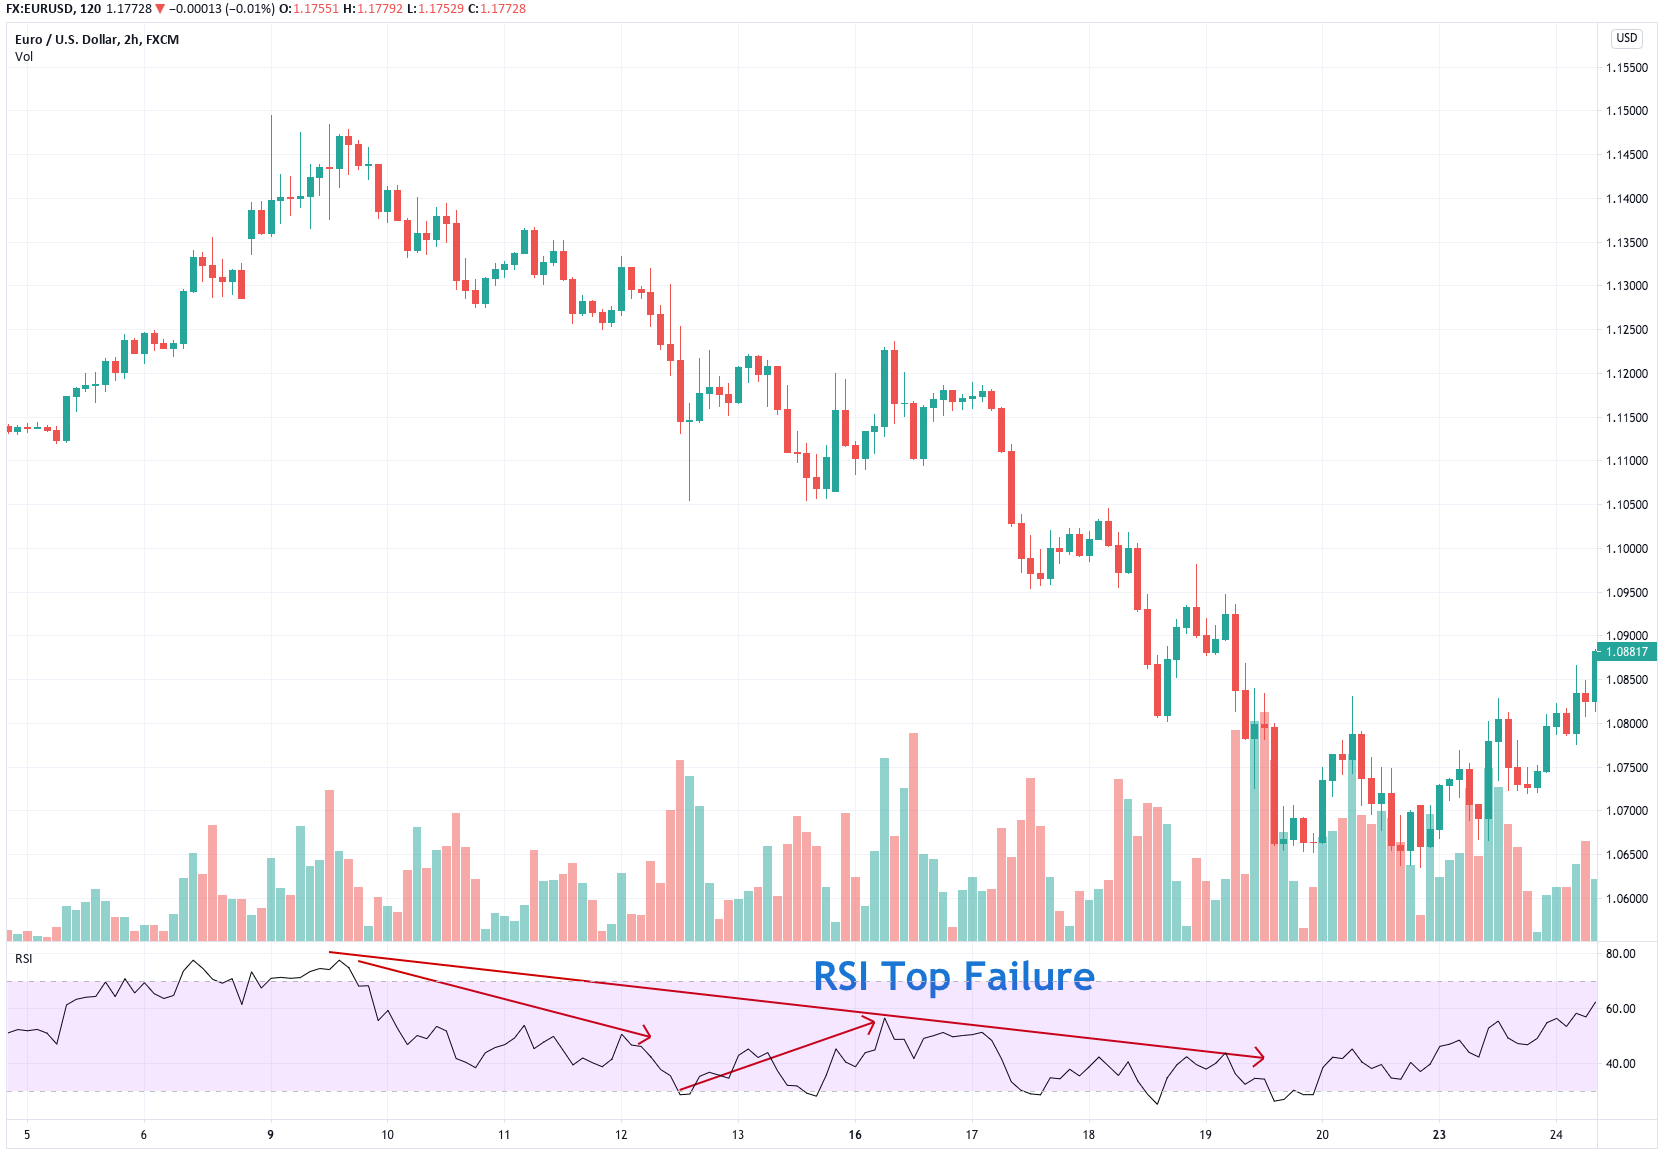
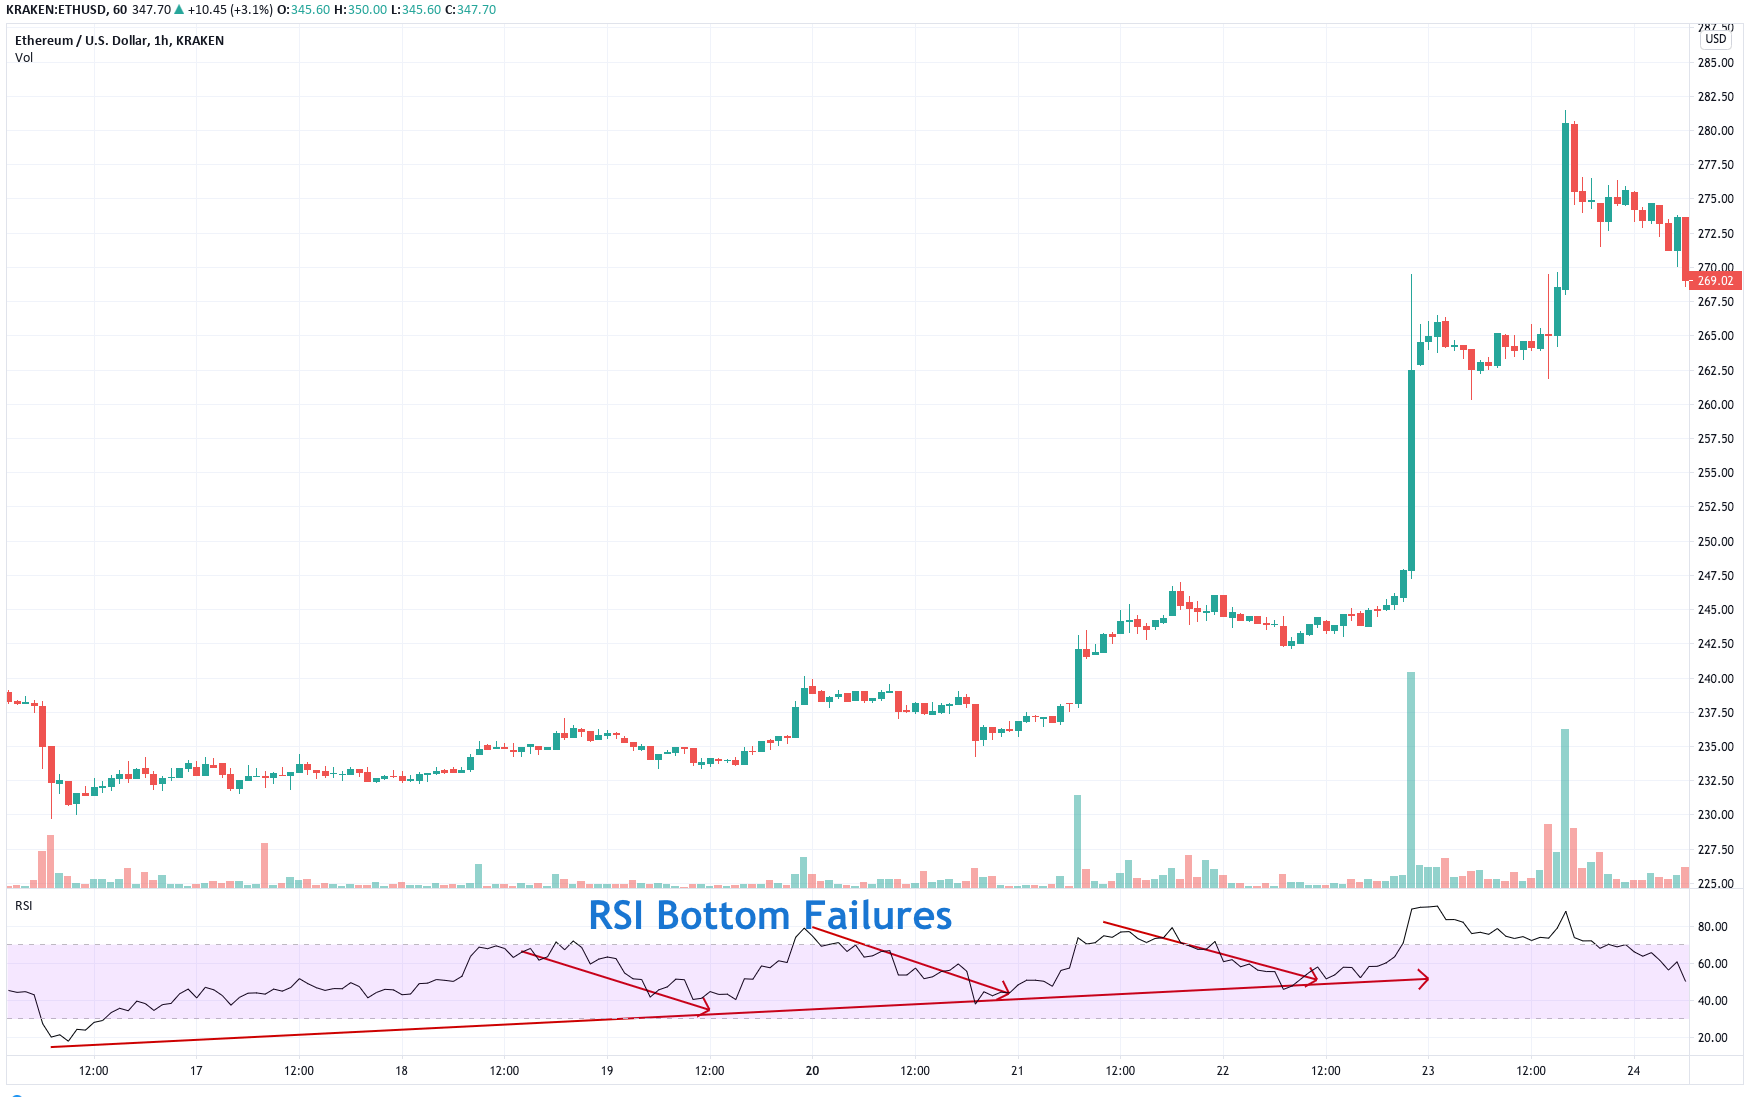


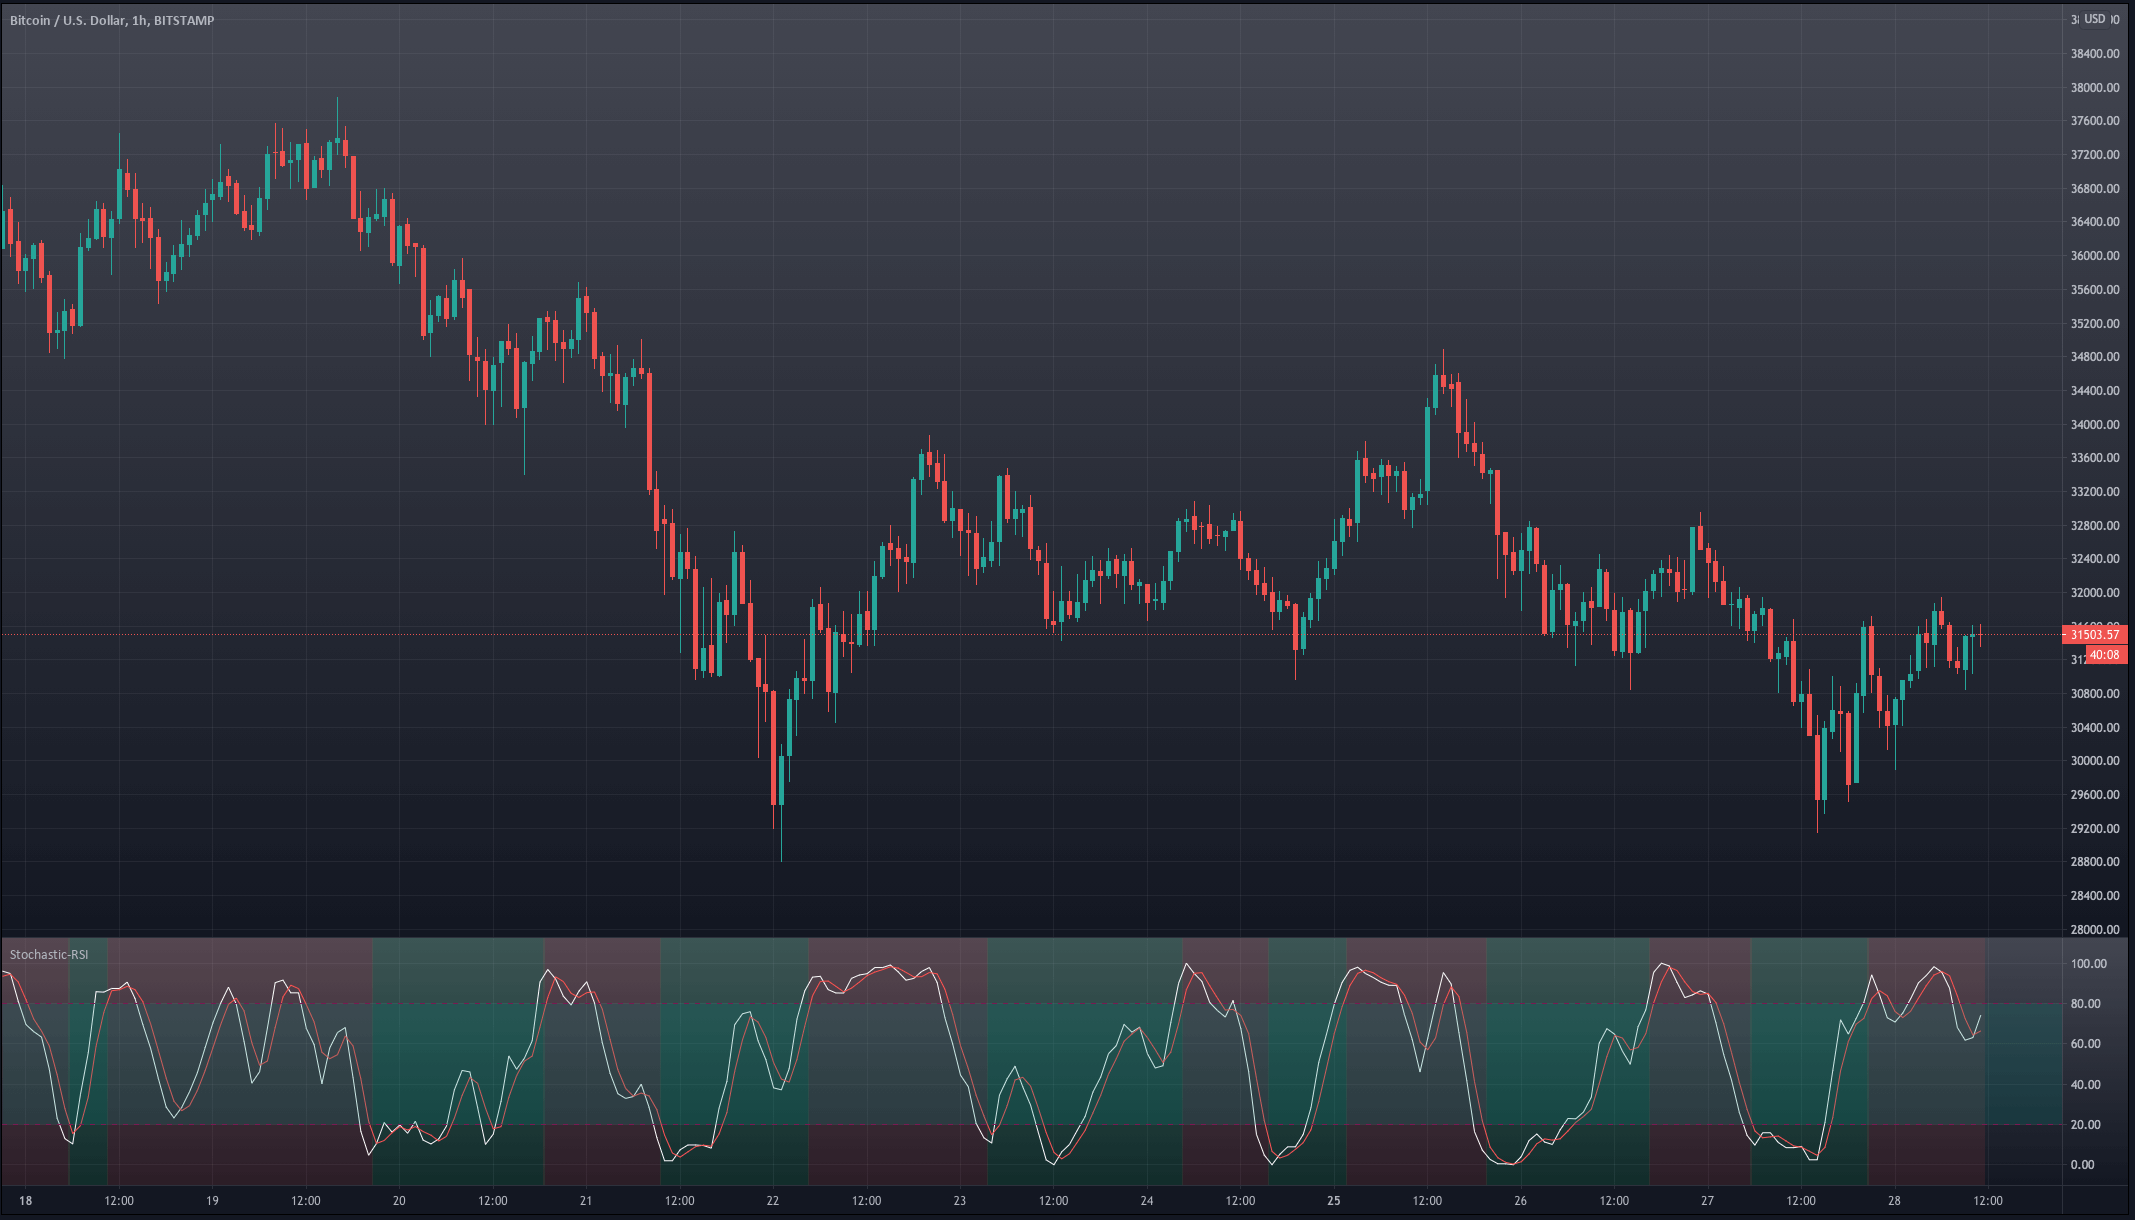
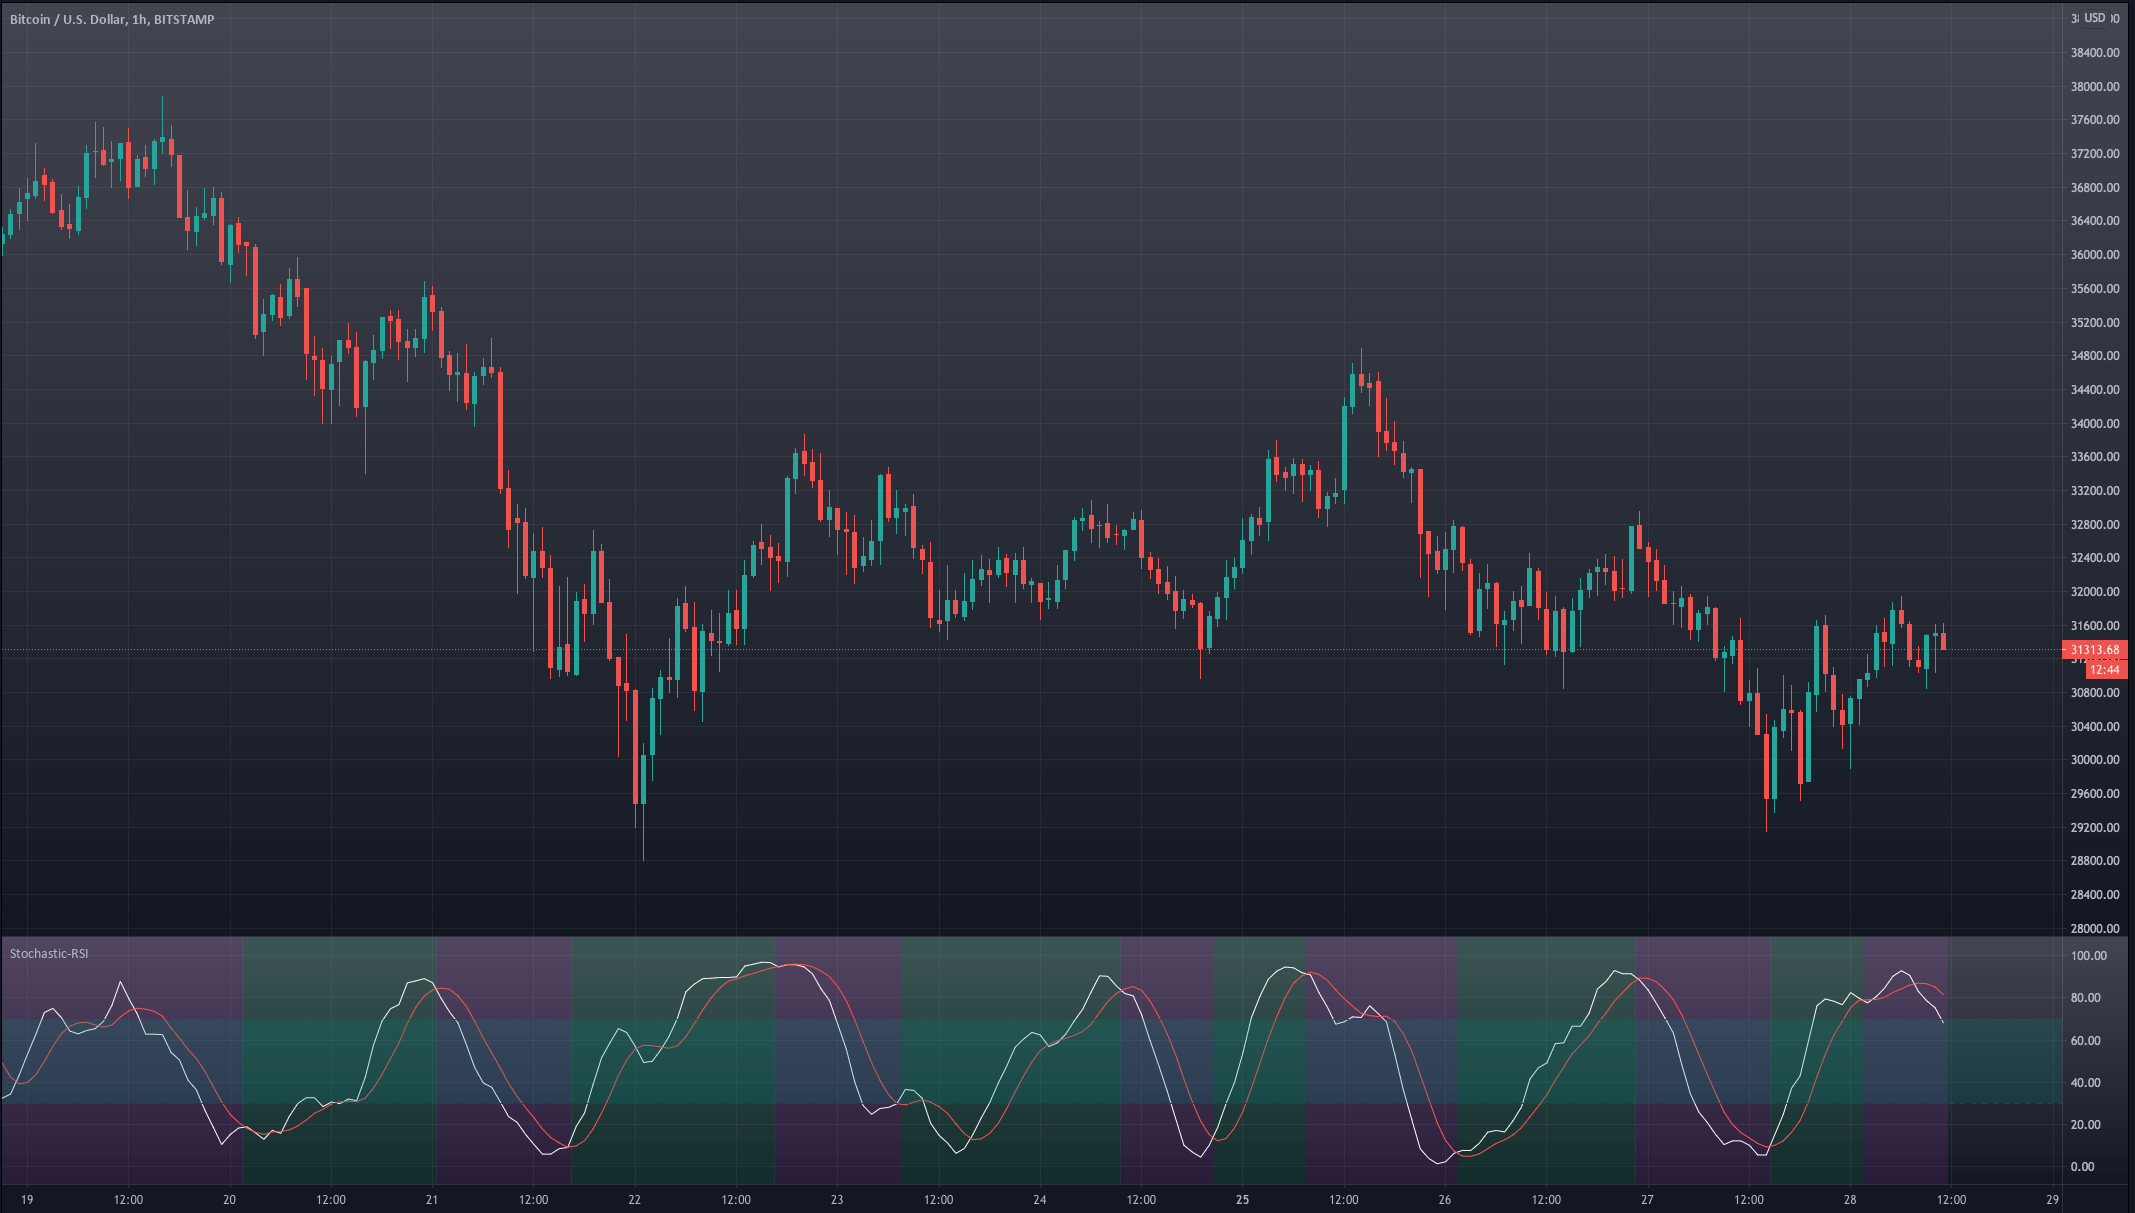
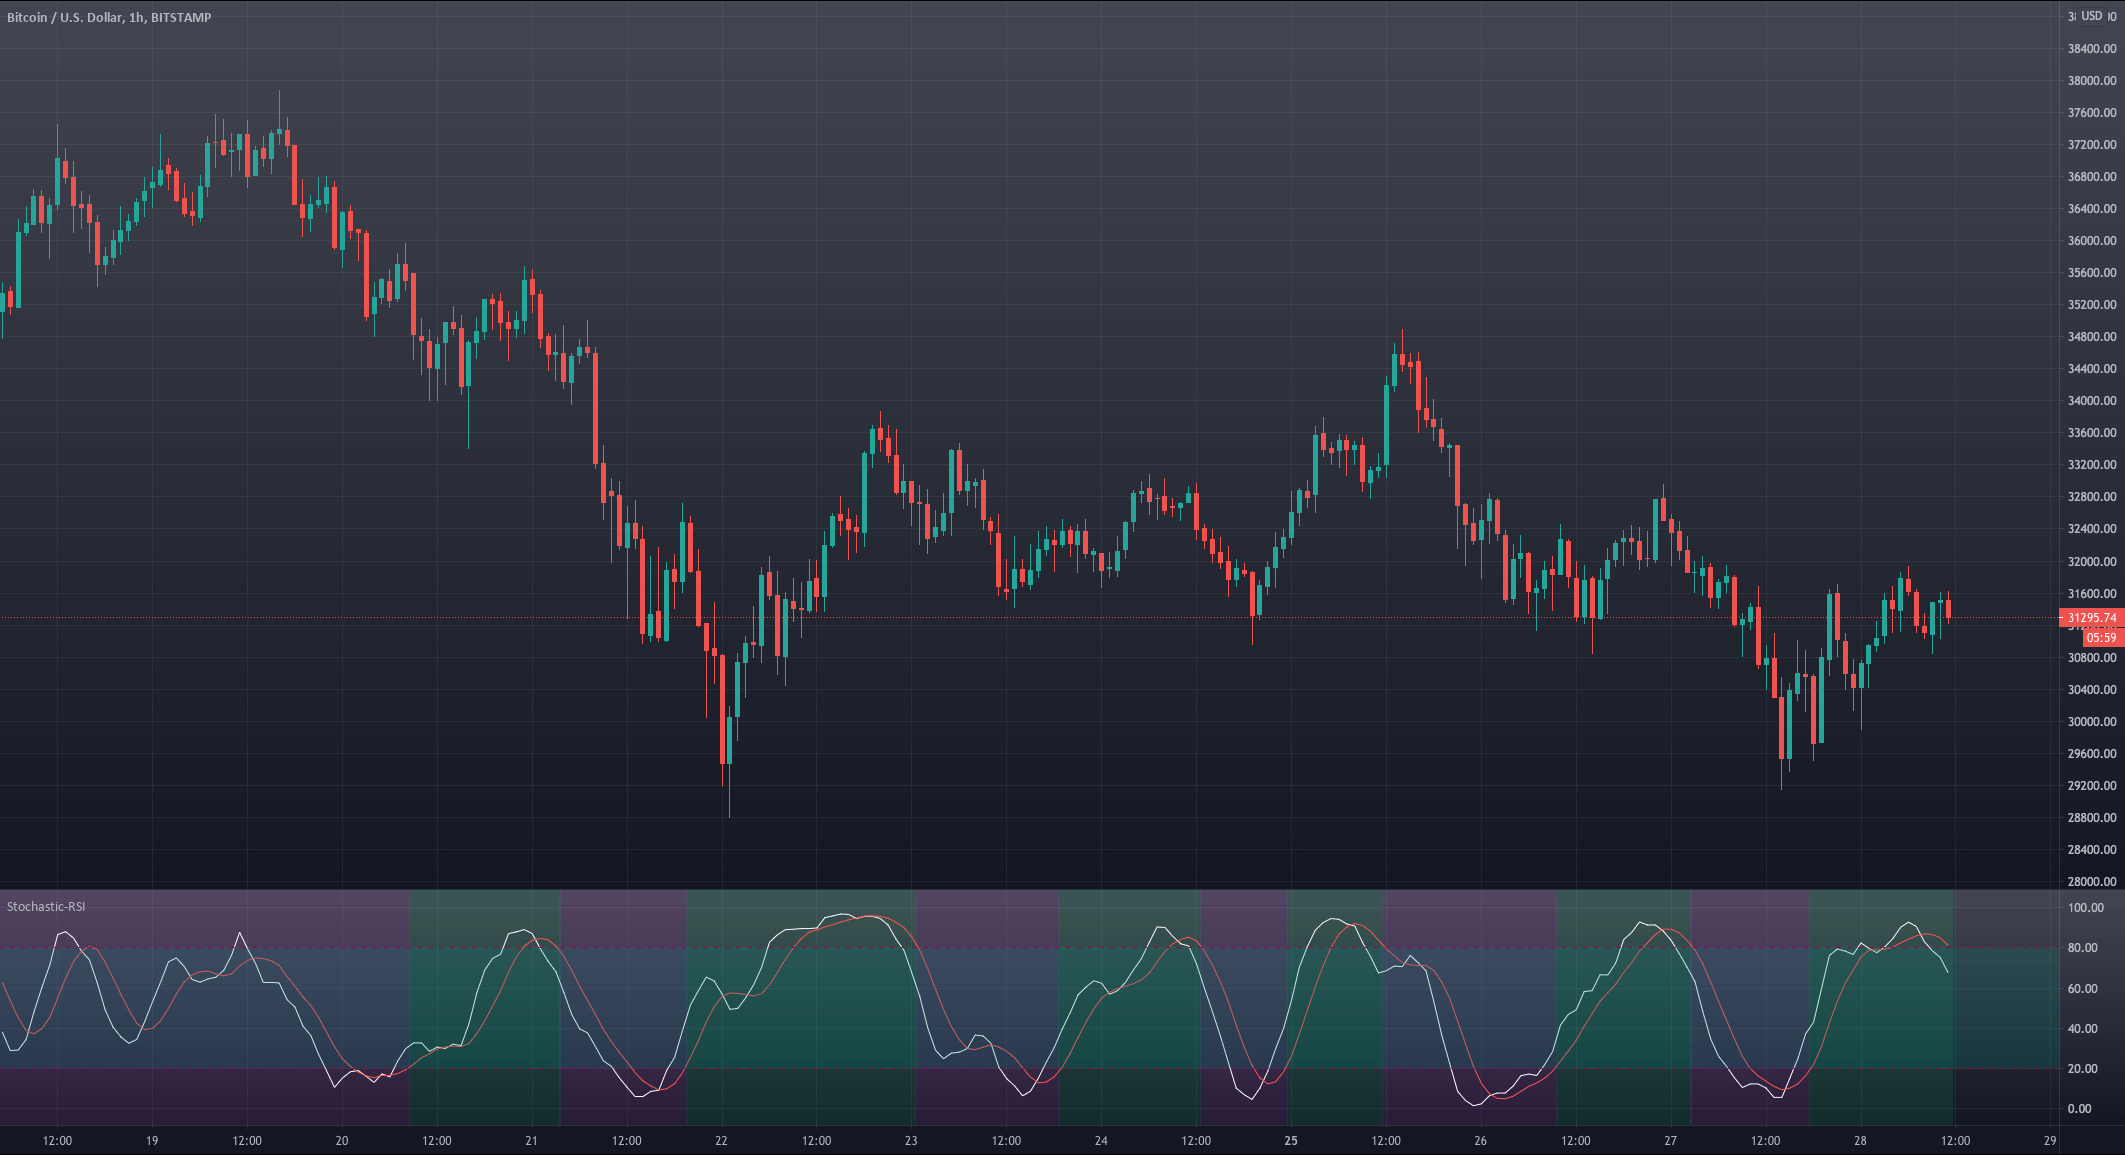


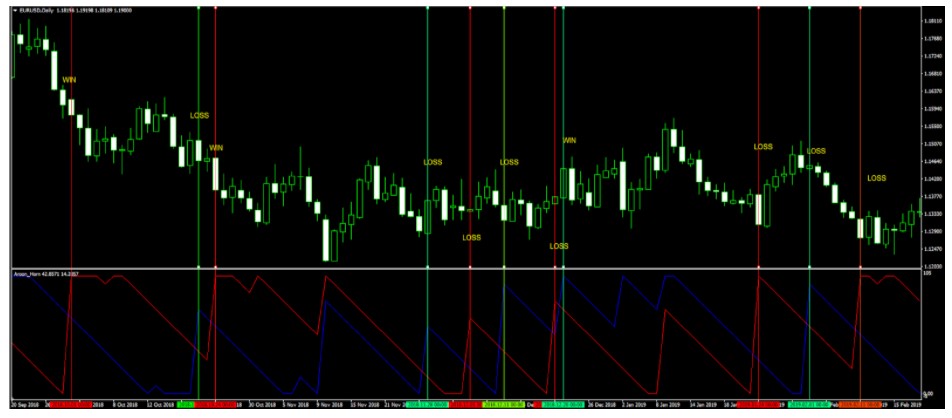
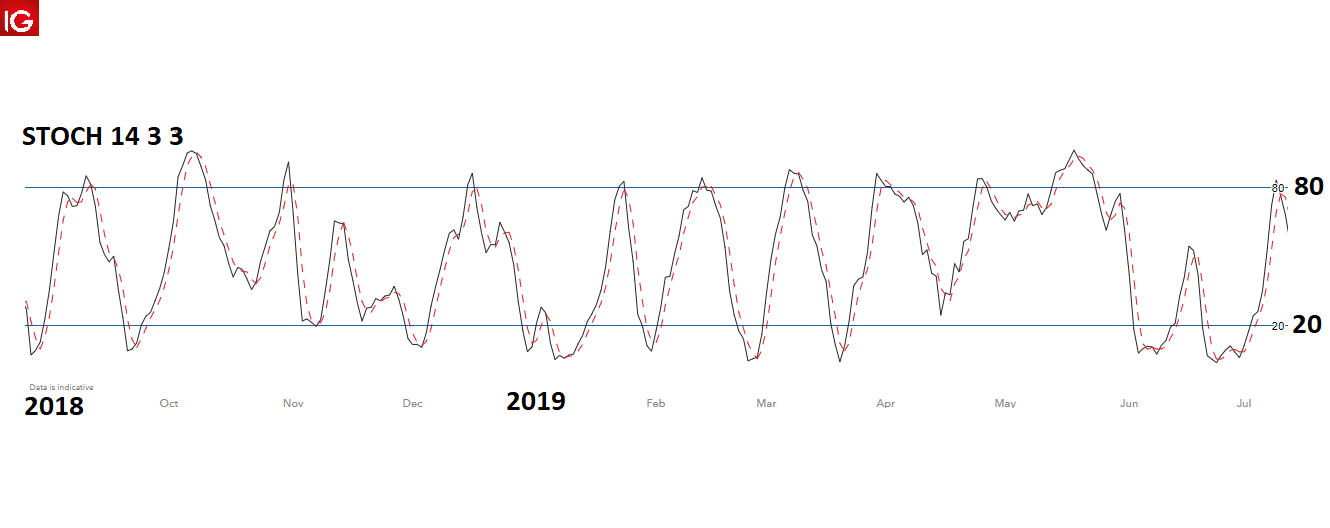
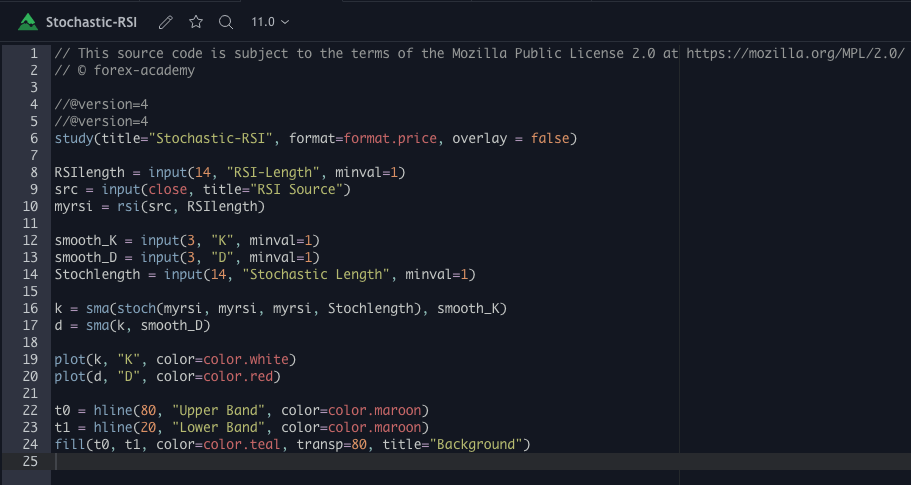
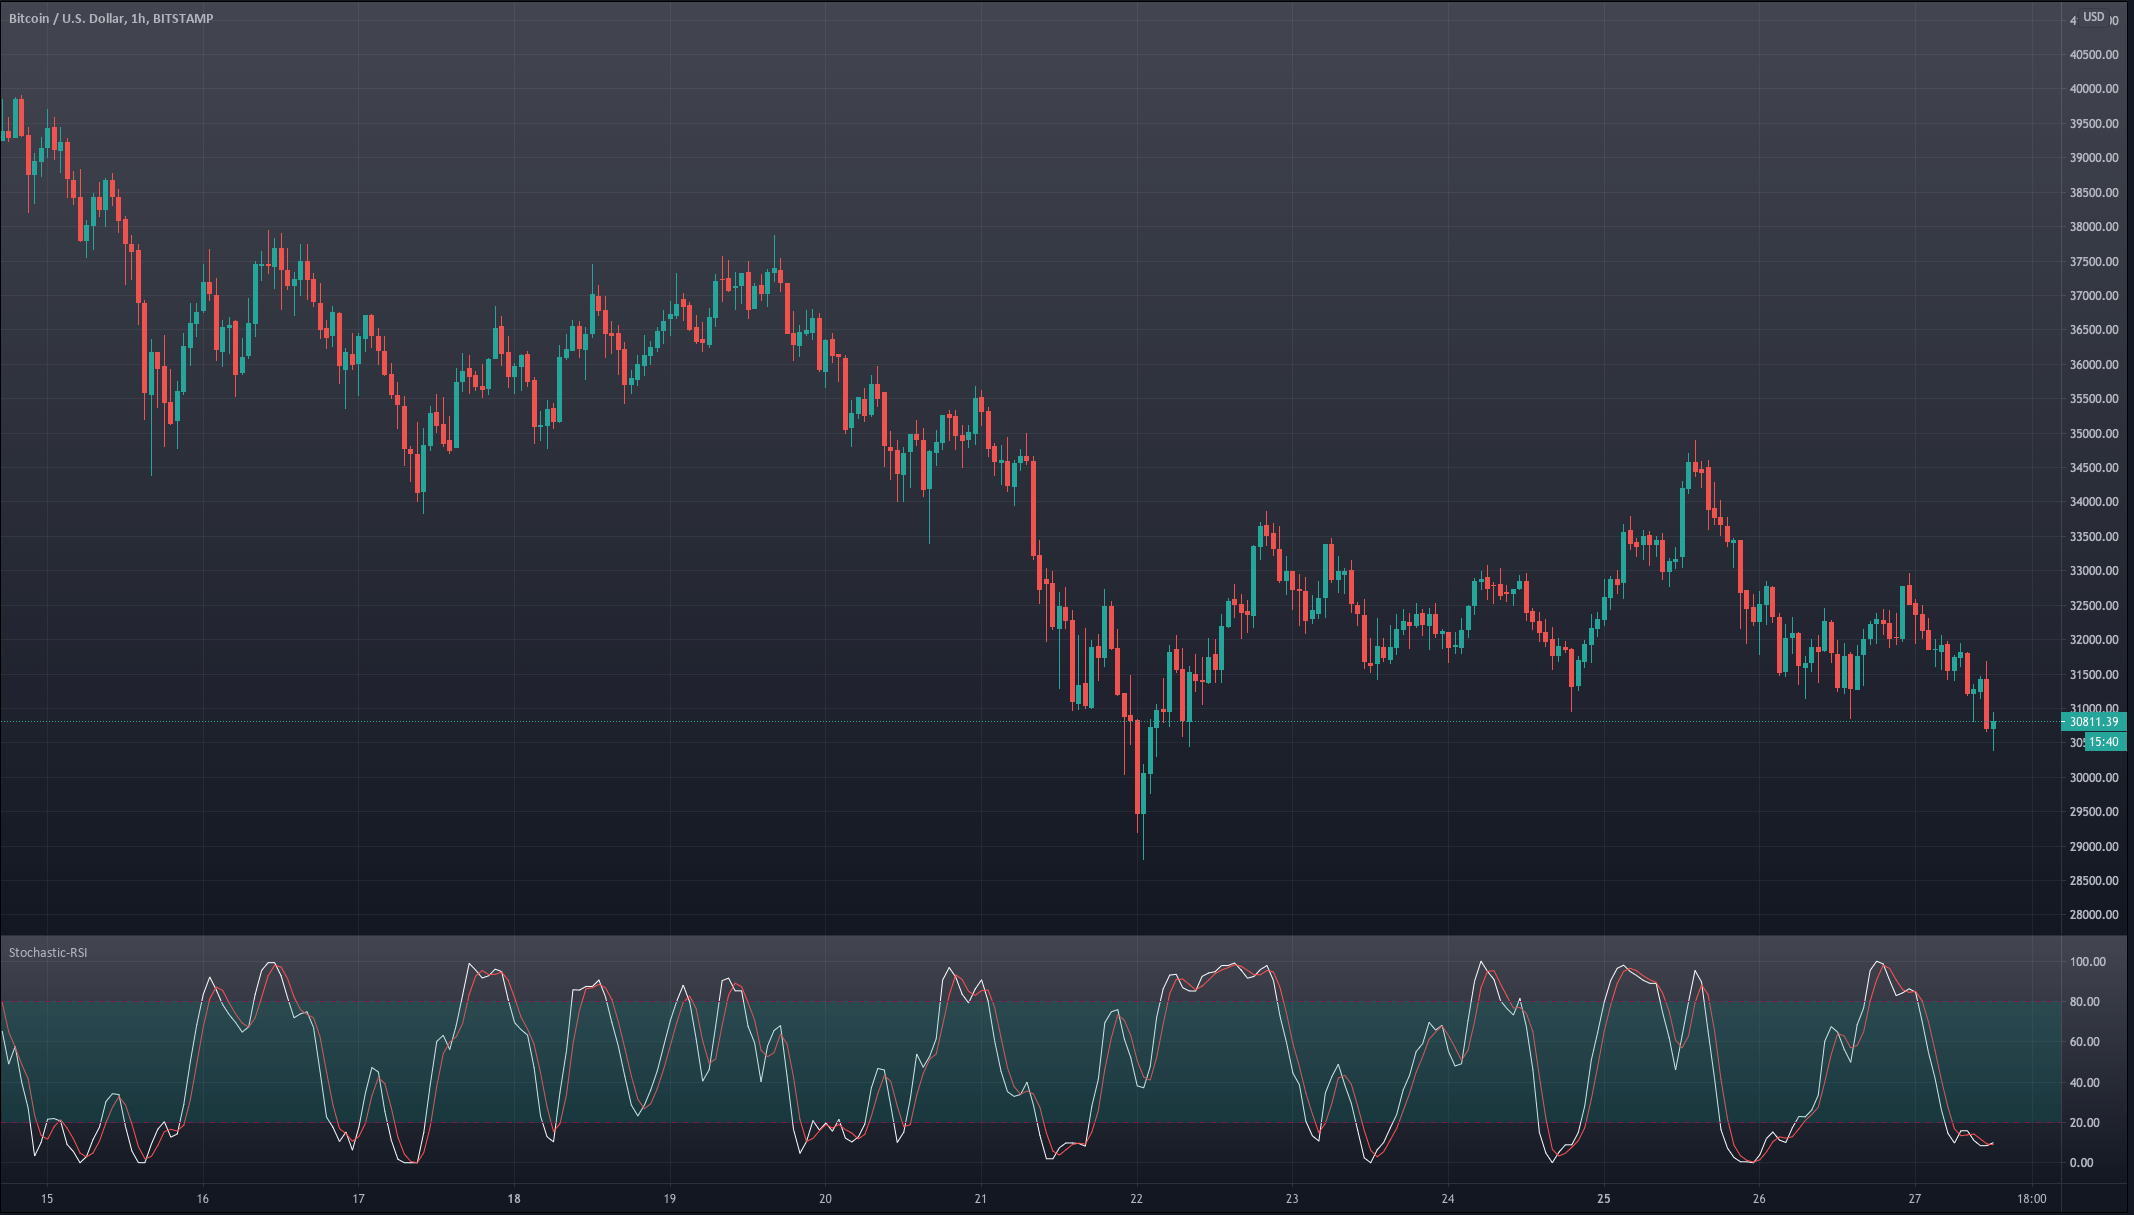
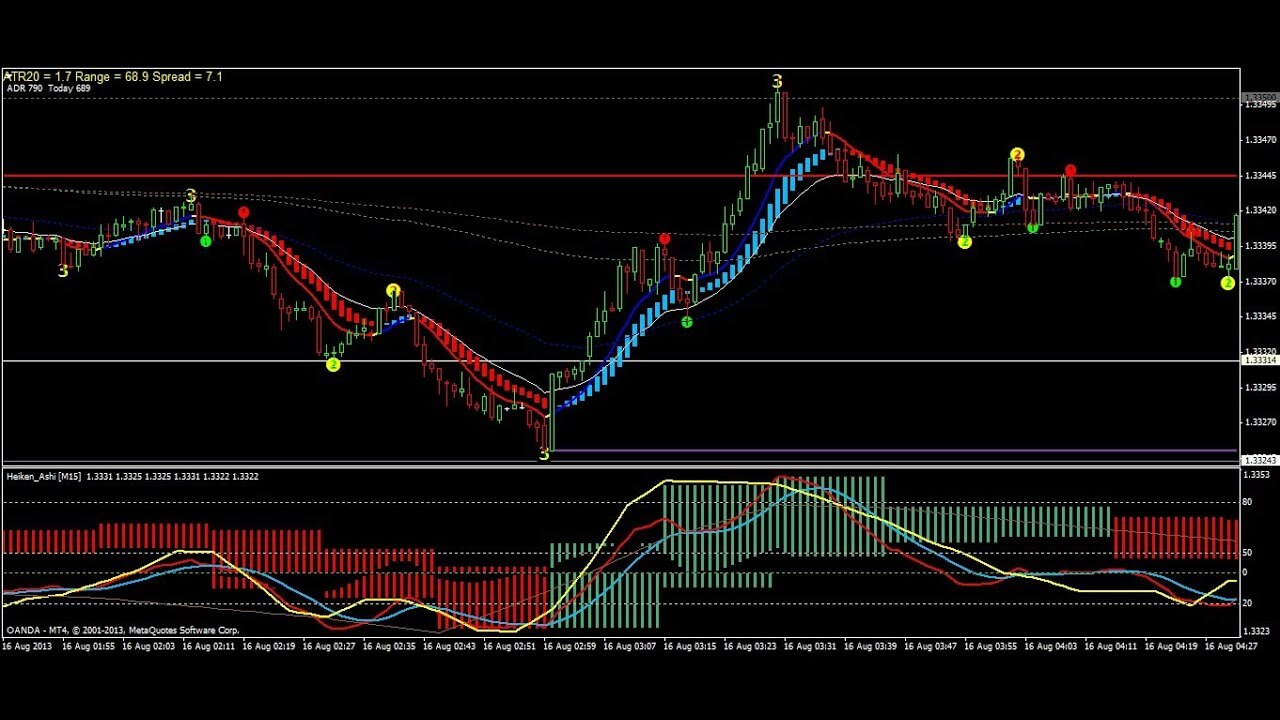
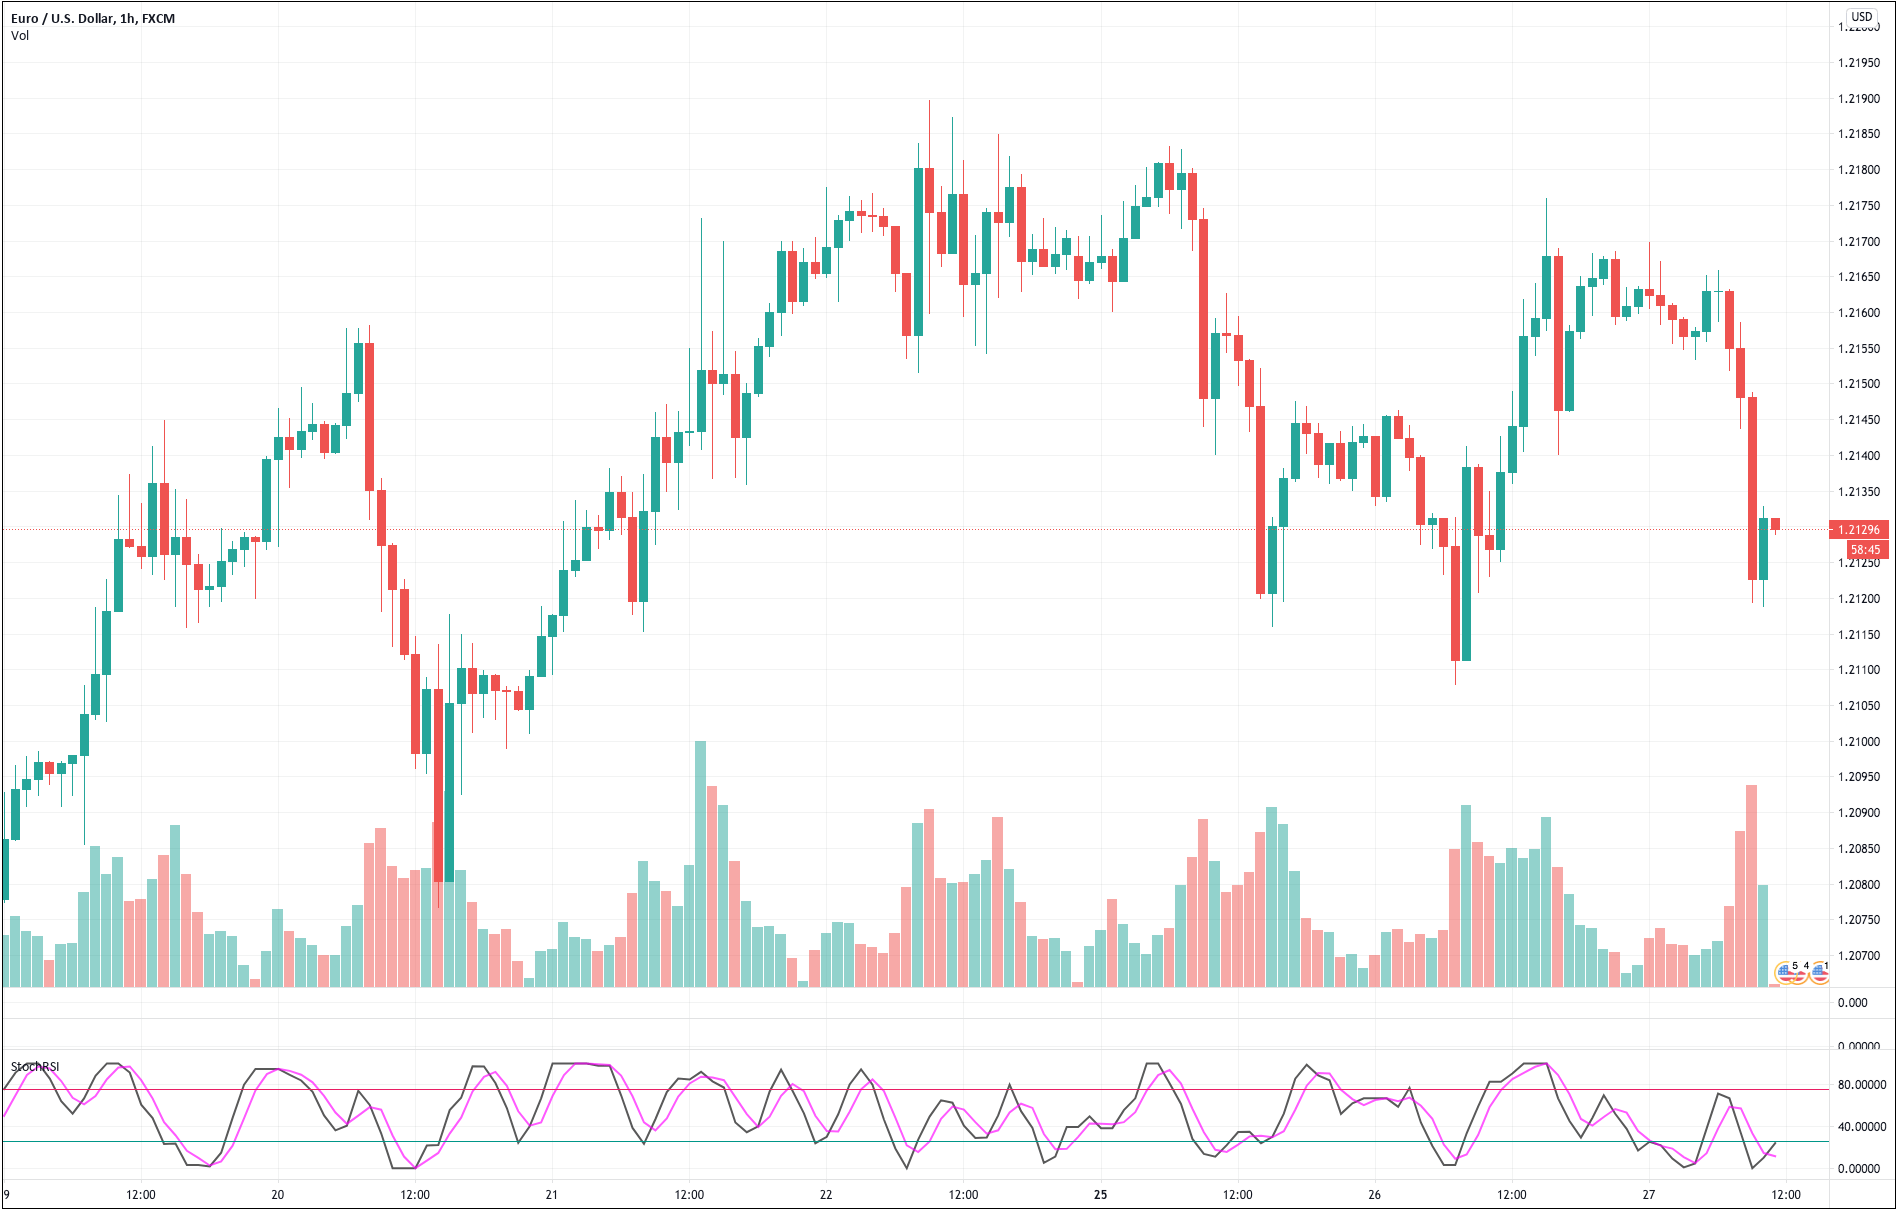 For our example, we will use a simple yet quite exciting indicator called Stochastic RSI, which applies the Stochastic study to the RSI values. This operation smoothes the RSI, and it reveals much better the turning points on mean-reverting markets, such as in Forex. Let’s see how it behaves as a naked strategy.
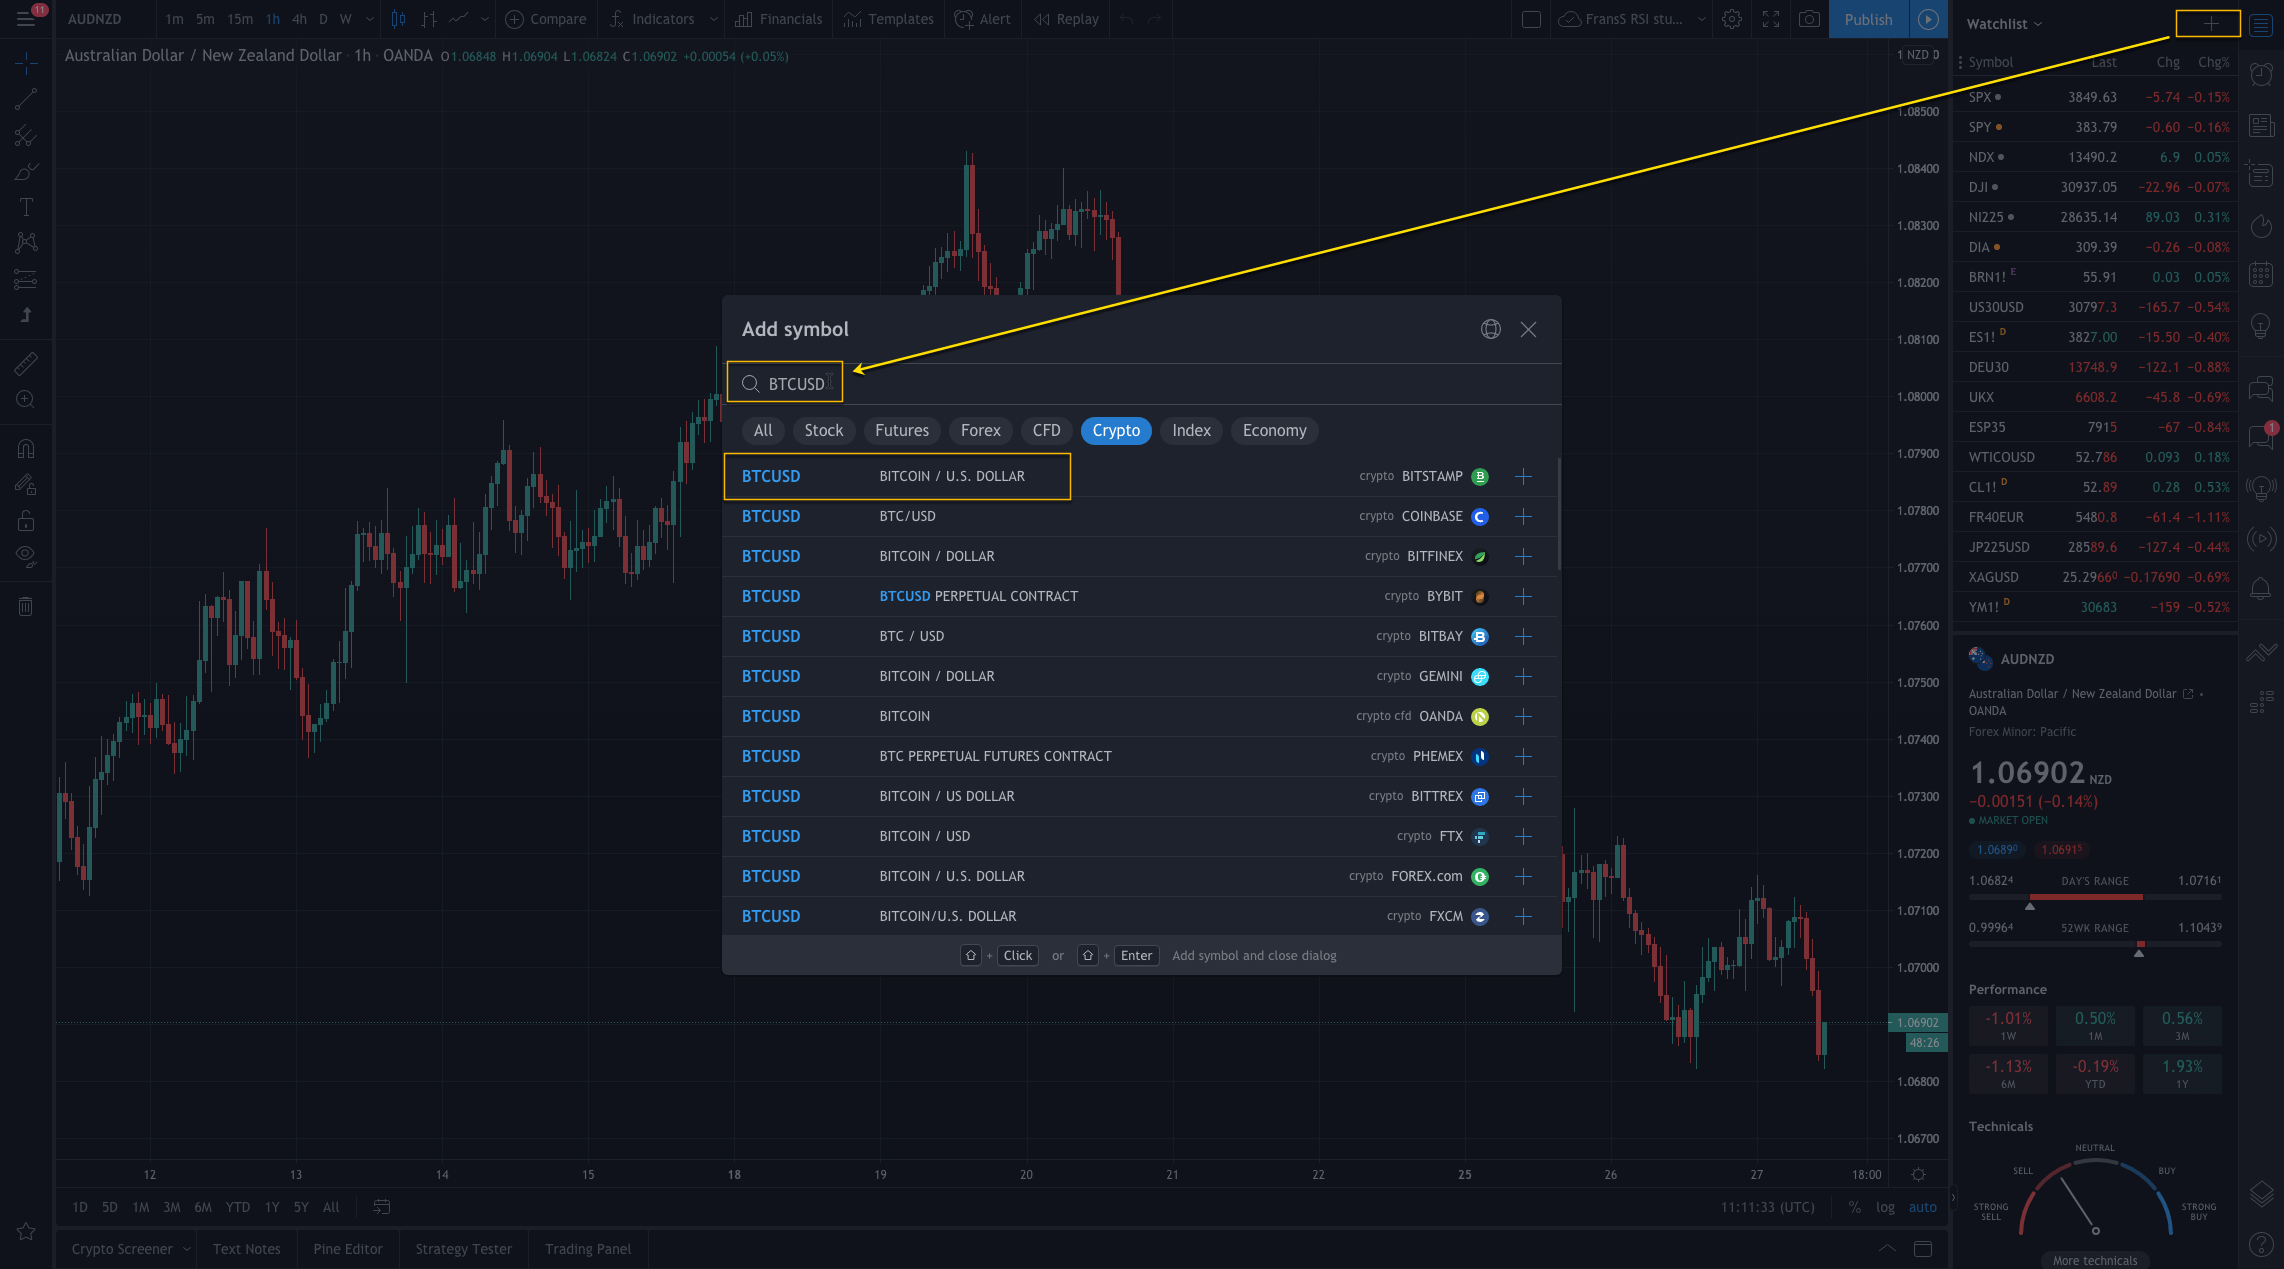
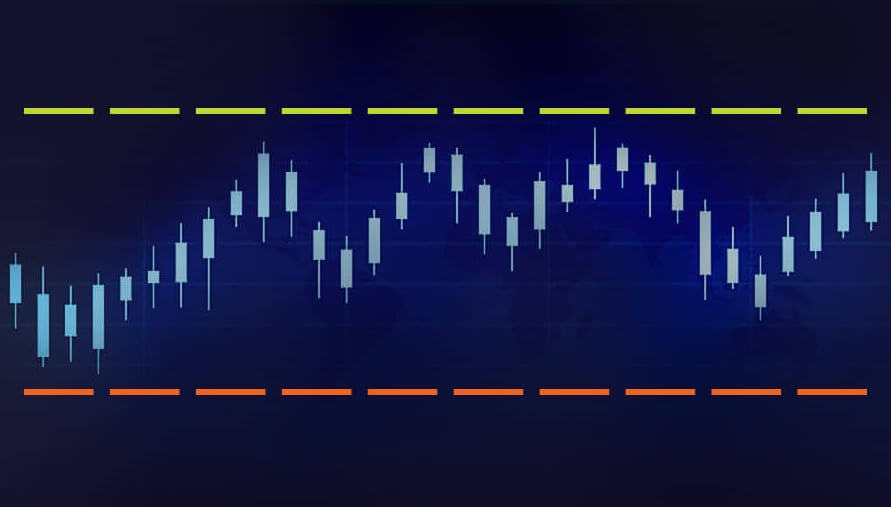
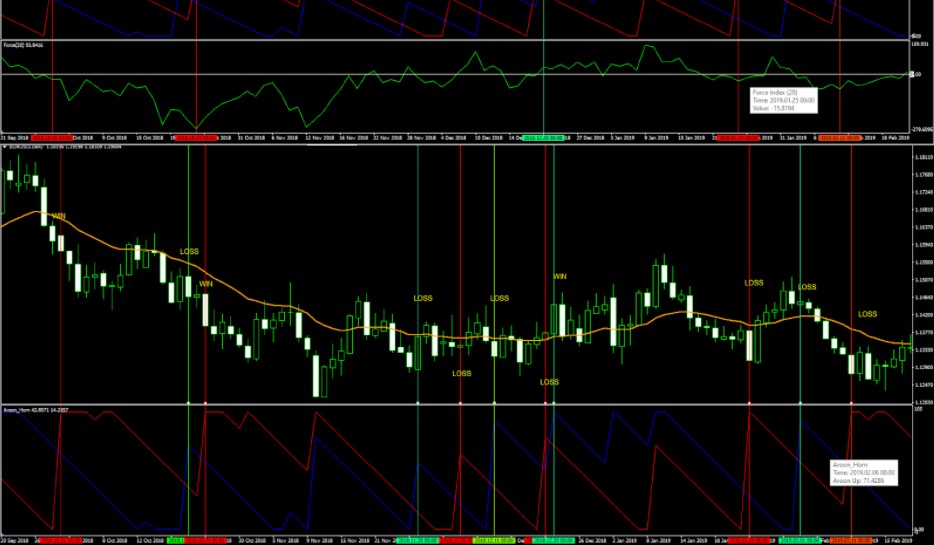
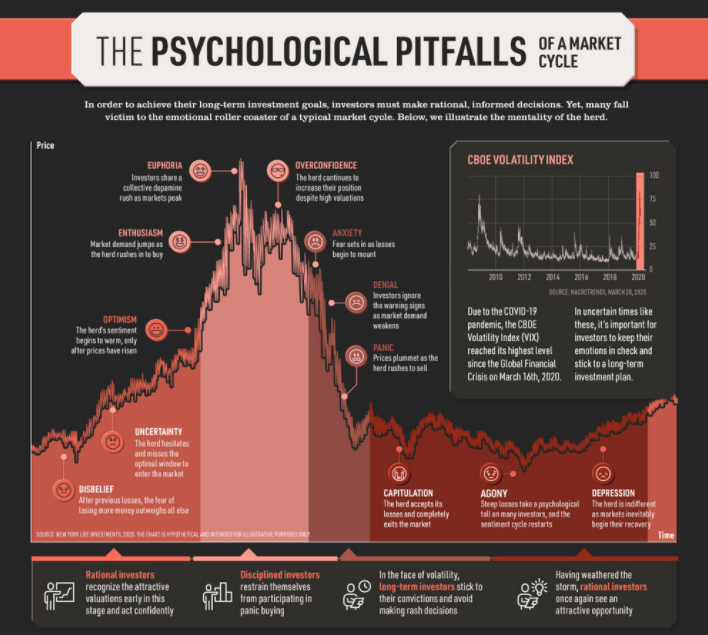
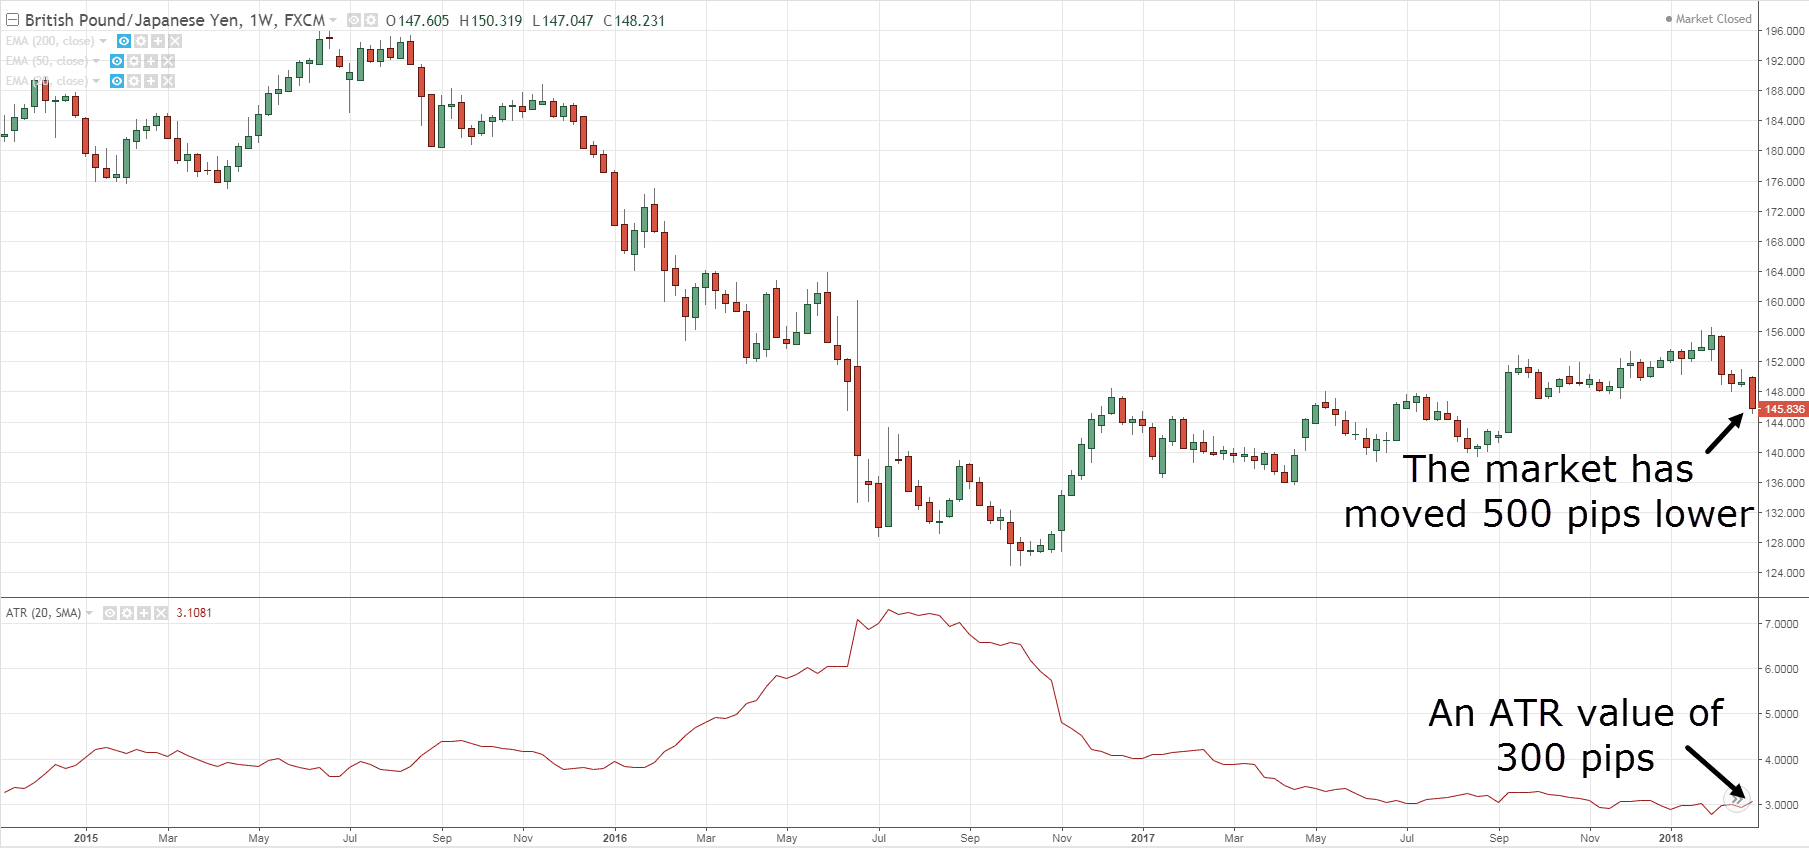
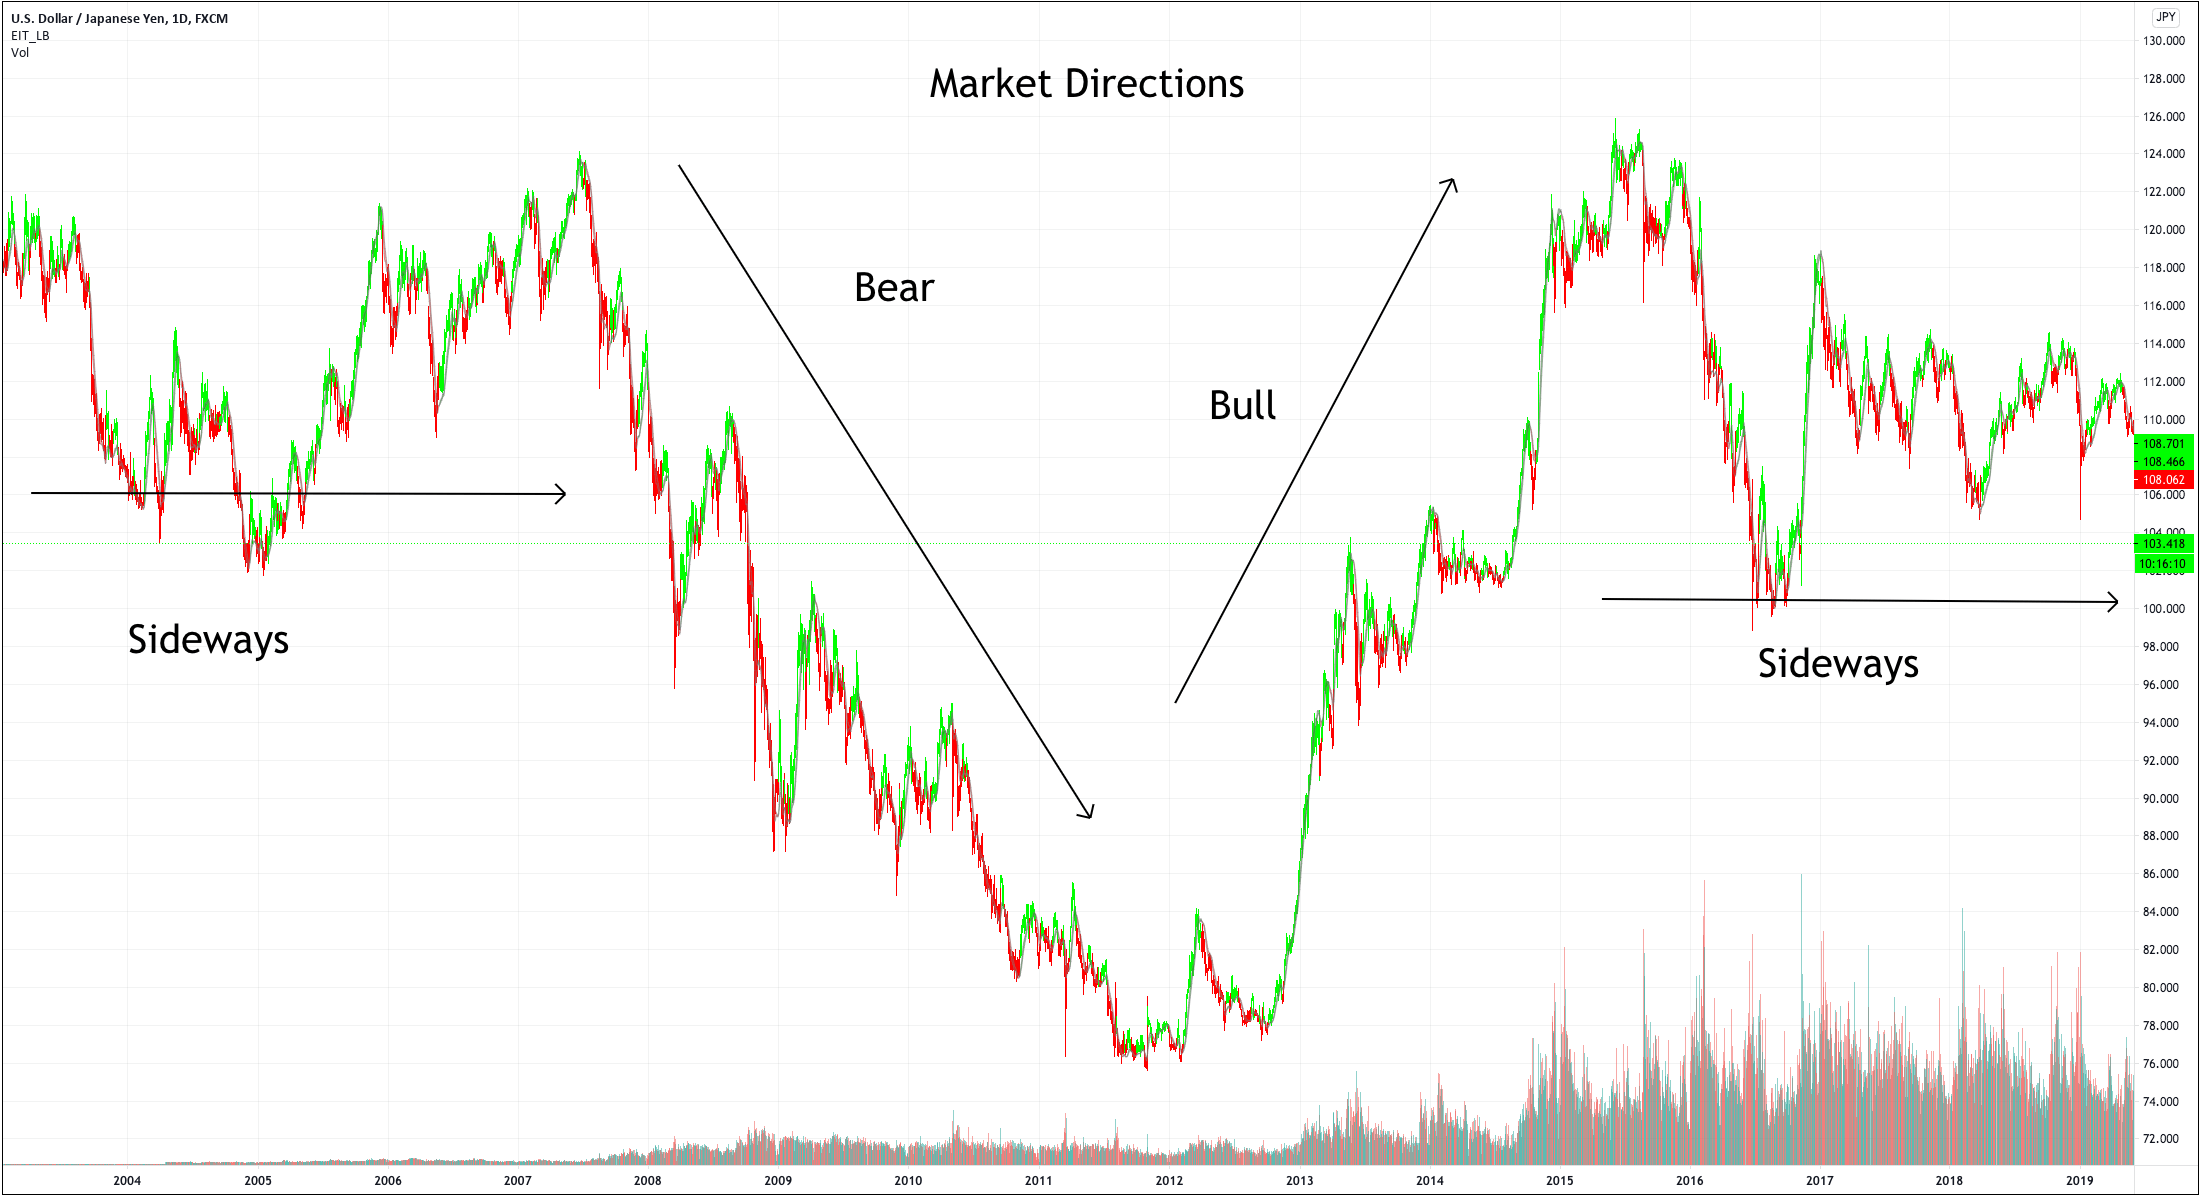
 From time to time, we will not be able to see any definitive upward or downward movement and the prices may not get to make your take profit targets, making traders insecure about the overall market direction.
 Even though we can determine market volume with the help of ATR, ADX, and Bollinger Bands, among other tools, the $EVZ volatility index has proved to be extremely useful and easy to use. When you open the full chart, you will be able to see a number under the heading “Euro FX VIX.”
  There are a few ways to deal with unfavorable markets.
  Still, low volume/volatility is a normal part of market oscillations, as these constantly fluctuate. Even if you are getting a lot of losing trades, do not get discouraged. Your time will come.
 You should not trade at this time because the price direction guesswork is extremely hard to get right and you can easily lose a lot of money. If you aren’t getting any signals, there is no reason for you to push it. Just stay put.
 We cannot scale out when the market is unresponsive. Therefore, we should in such cases take the entire trade-off at the first
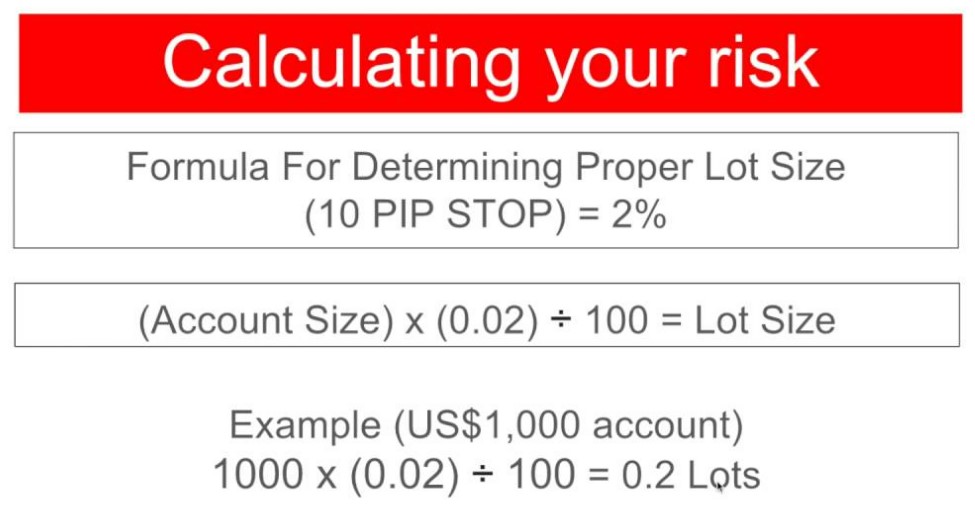
  We usually cannot have a standard 2% risk on trades encumbered by sideways market movement. Reduce your risk to 1%, for example, if you see that the $EVZ index is reaching incredible lows, like in 2019.
  If you are not prepared mentally or emotionally, your account will suffer no matter the conditions. If you start panicking the first moment you spot any sideways market movement, the likelihood of you making a good decision will start to decrease exponentially.
 Looking for an ideal trading scenario to start trading is as futile as is failing to recognize the potential of dead markets. When we are faced with the saturation of sideways market movements, we should perceive the market as our fertile land. It is those moments that give us perfect room for improving our systems. Reflect on your past trades and decisions, and see what you can do better. Focus your attention on your trading and test, test, test. If you find a strategy that is working well in these conditions, this is your plan B, switch to it.
 Unfavorable market conditions affect us all. Do not think that experts are making a ton of money under any circumstances. You may have even had plans to leave your current job and turn to trading only, but now is not the time. Make no rash decisions, keep all of your sources of income active, and just wait for everything to go back to normal. Even when it does, you may still need a few months or years for everything to work out as you planned.
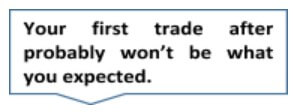 Well, no matter how well-developed your system is, most volume indicators cannot record the first big move as quickly as it occurs. So, now that you know that it isn’t your fault, do not give in to any doubts or regrets and just move on.


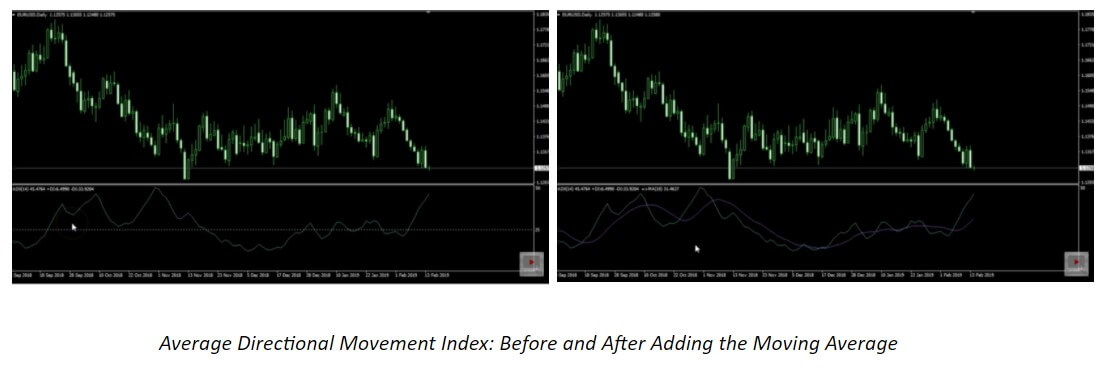


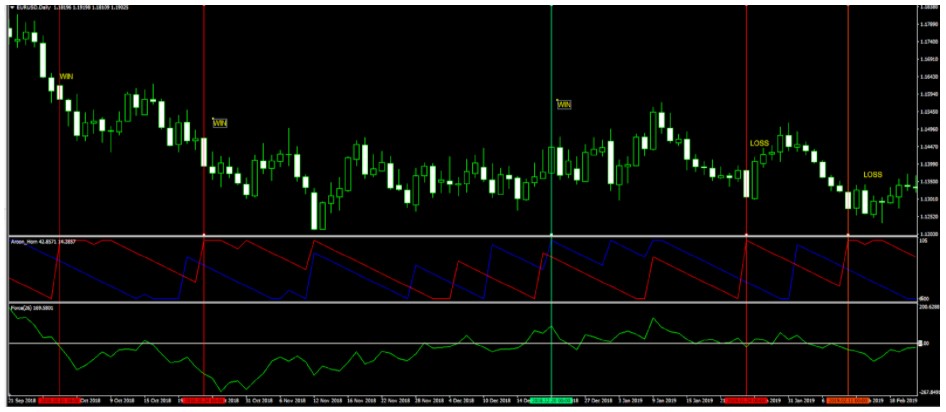
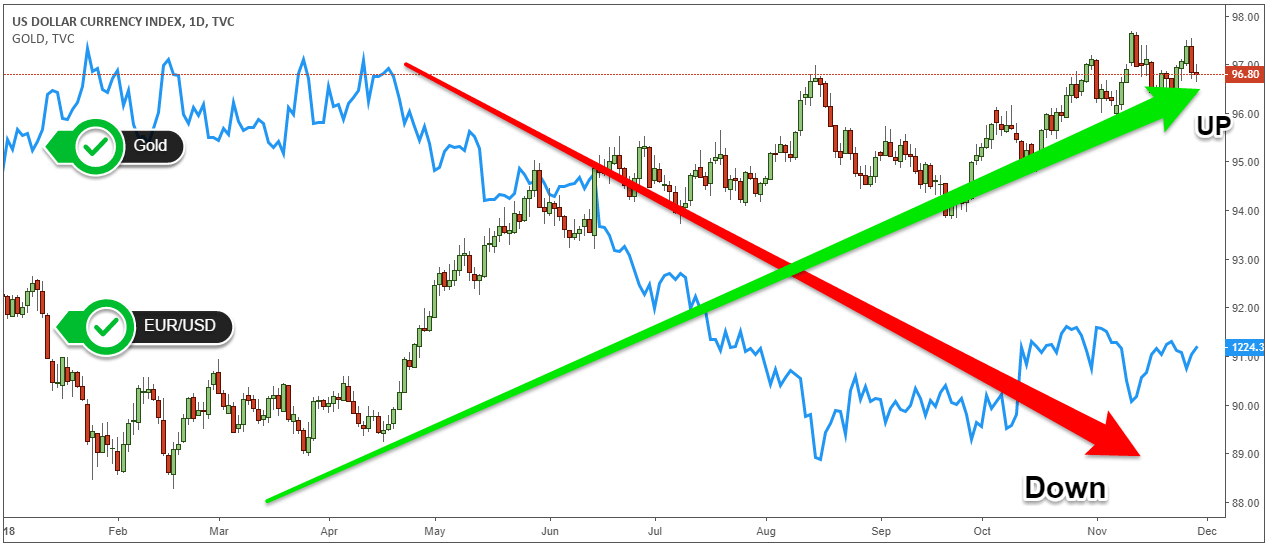
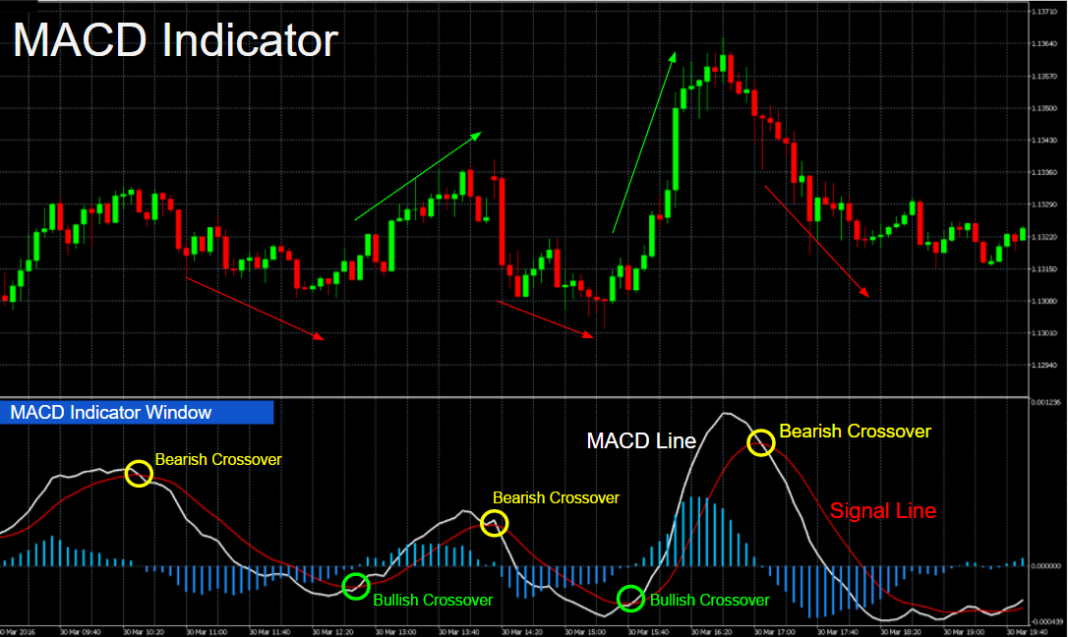
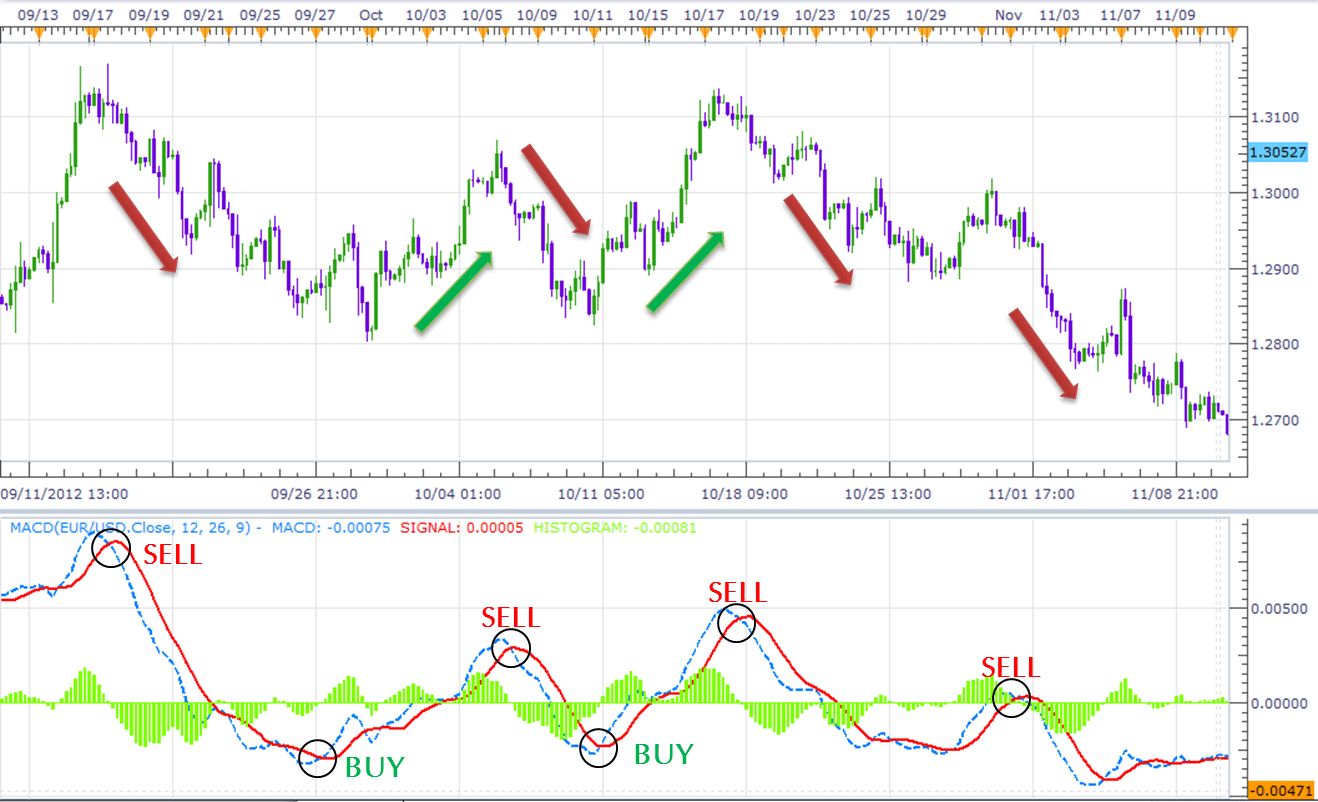
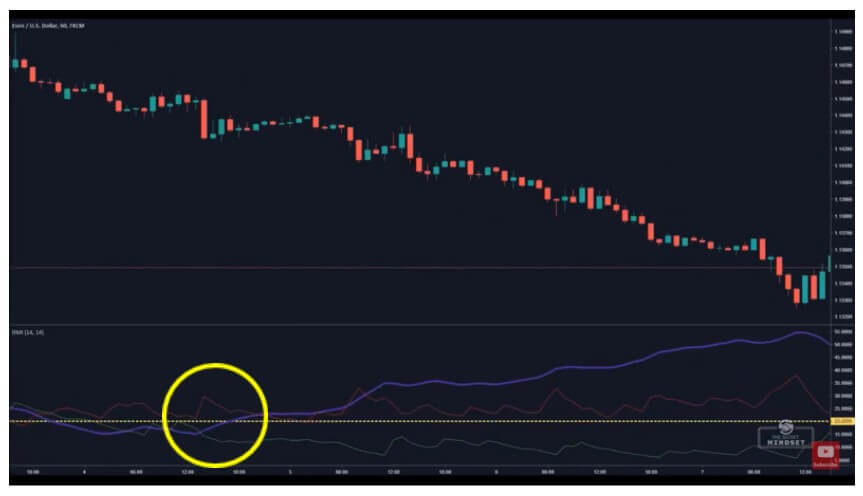
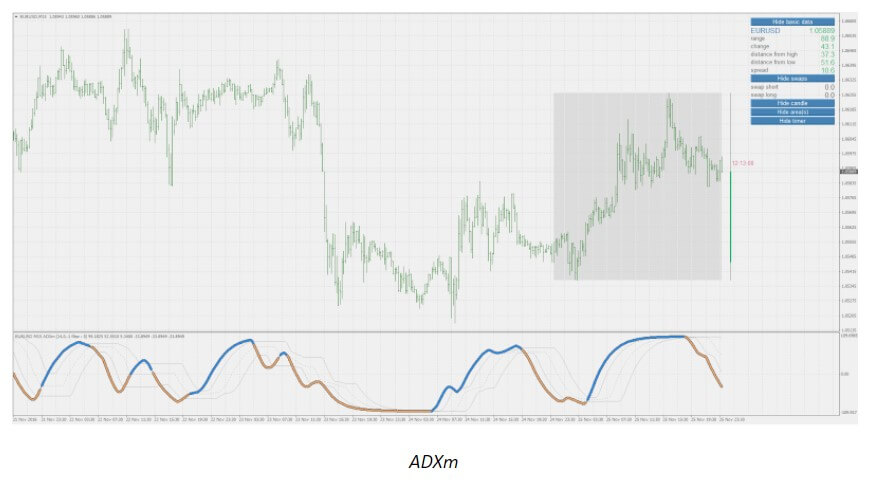
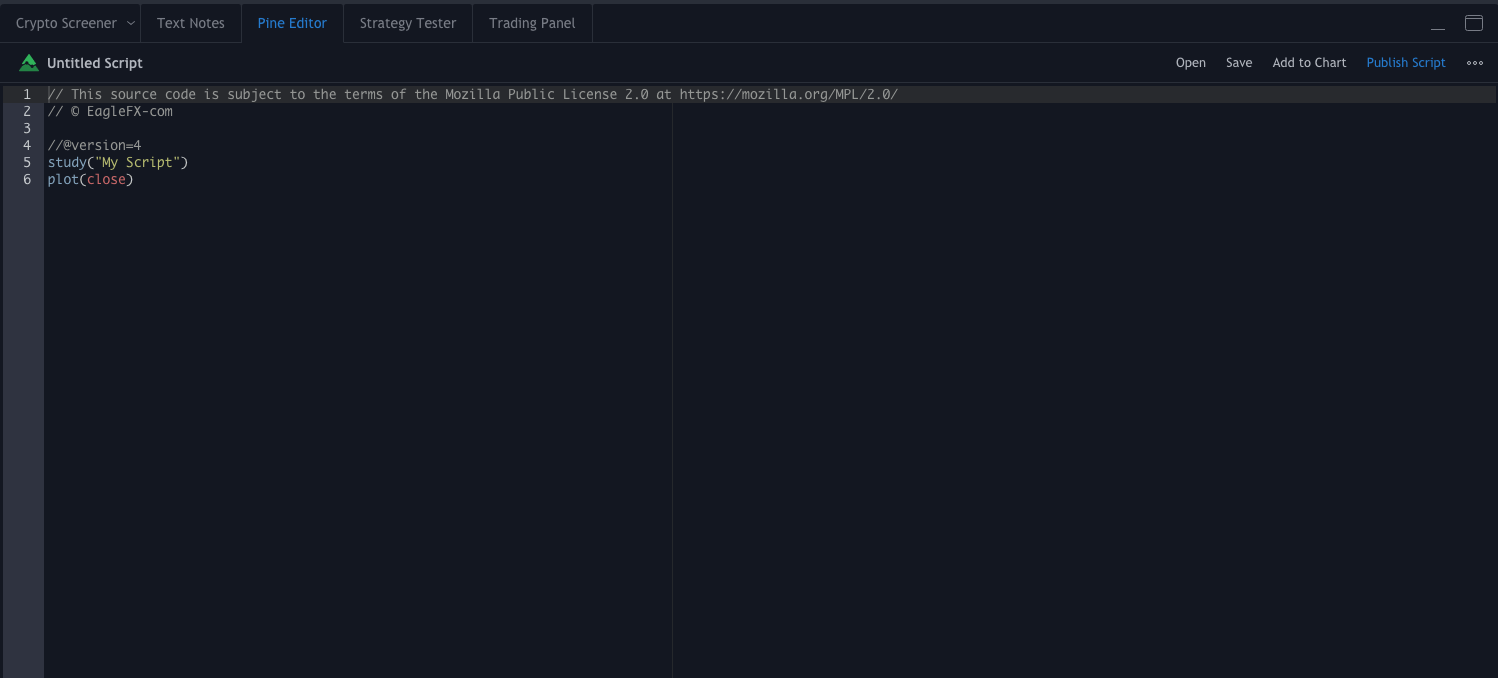
 Trend confirmation indicators can be categorized to make this process beginner-friendly. Starting with the Zero Cross indicators, they are generating signals based on a line crossing a horizontal zero value line. A typical example of this is the