Traders worldwide have shown interest in the Moving Average Convergence/Divergence indicator that we all know as MACD. Praised as a two-line indicator that has generated quite a few pips to many content creators, MACD can certainly point us toward the direction of discovering other amazing tools that we can incorporate into our trading systems. Since traders are constantly in search of the best components to help build their own algorithms, they inevitably come across a number of low-performing indicators from which their trades can hardly benefit. As a result, these traders immediately cast off the tools that they believe cannot make it to their favorites’ list, which may not be the approach that you will always want to take. Today, we are going to see how adding a moving average on various MT4 indicators can not only improve a tool’s performance but also prove to be the right move towards lucrative trades.
Many beginners fail to acknowledge the importance of adjusting settings and learning about the ways to make some changes to the existing indicators in order to gain more profit. While MACD indicators’ fame grew due to the diversity of its functions, few actually know how using the moving average on other indicators can truly generate new and unexpected possibilities in many cases. If you are keen on growing a unique system and testing different options, then the use of moving averages can really become one of your favored solutions down the line. By adding a moving average on some of the less efficient indicators, you can have an entirely different experience with tools that you once defined as utterly futile for trading. Naturally, in some cases this approach will not seem to be applicable or useful; however, by incorporating moving averages in your system, you are introducing an additional layer of protection, as all traders look forward to finding indicators to prevent them from making bad decisions while trading in the forex market.
Today’s selection of indicators is meant to serve as a lesson on how you can improve some of the tools which overall do not provide desired results, rather than tell you which tools you should use in your everyday trading. You can later go back to the indicators you saved on a flash after you had stopped using them, as we will show you how some of the indicators that are already built on MT4 miraculously change after the moving average has been added. You can also open the MT4 while you are reading this article and make the same adjustments as we do while you are reading. Be prepared to take notes on some specific settings as well as remember a few key pieces of advice you should follow when you are attempting to carry out this process yourself.
Accumulation
Accumulation is one of the indicators that are generally considered as bad in the forex trading community, especially due to the fact that traders cannot make any adjustments that could improve its performance. As you can see from the first image below, Accumulation is essentially a one-line indicator, which barely appears to be able to give any relevant information. However, once we apply the moving average, although you cannot expect drastic changes, the overall performance of this tool immediately improves.

In order to make the most of this, you will need to follow a few rules. Firstly, you should not alter the moving average of oscillators, yet expand the Trend tab in your Navigator window inside Indicators. Once you find the moving average there, you will need to drag it down to the indicator window you wish to apply it on. Then, a new window will pop out where you will be able to make further adjustments. What we did is we left the period where it was (10) and changed the settings from Close to First Indicator’s Data. If you, however, decide to apply the changes at Close, you will not see the line in the same place as in the right picture above, it will simply be applied to the price chart. Therefore, the two essential steps to take are to drag the moving average down and apply it to First Indicator’s Data.
The results these steps can deliver are much better than what you can hope to achieve without. The moving average is mostly going to tell you where the trend is, and after we applied this to Accumulation, we discovered five to six entry signals just by glancing over the chart. A better indicator would naturally offer more quality entry signals and, consequently, serve you better. However, the idea behind this is to change a one-line indicator to a two-line-cross one, which is believed to be one of the best confirmation indicators you can use. Even though these changes prevented you from quite a few problematic points, Accumulation is still not recommended to be used for everyday trading purposes. Some professional traders even claim to have tested this tool and every possible variation only to discover that it is not a viable, long-term option for them.
i-BandsPrice
Similar to the Accumulation indicator, i-BandsPrice is also a single line that does not perform very well in general. You can change this tool into a zero-cross indicator by following the steps we previously described. Although it does not truly get to zero, you can still see some benefits from these changes. What you should first do is alter the period and see the results this solution provides. Naturally, you will not go after every opportunity in the chart because you will want to avoid reversal trading. Nonetheless, what you do gain from making these adjustments, in this case, is the ability to discover when you can enter a trade. As with any other zero-cross indicator, i-BandsPrice can now also tell you to start trading when the indicator crosses over the zero line towards the negative or the positive.

Rate of Change (ROC)
In order to see more benefits from using the Rate of Change indicator, we first moved the period to 70. Then we added the zero line because it will tell us to go long if the line crosses the zero upward and vice versa. However, to make the most of it, you will need to add the moving average and look for the places when the lines are already both below zero: when the indicator crosses down again, you will have the opportunity to enter a continuation trade, which some experts see as their most lucrative trades. As ROC is one of the lower options on the performance spectrum, you will not be able to get many good trades despite the changes. Nevertheless, you can alter the period, moving it from 8 to 10 as we did, and see how it begins to resemble the MACD indicator is thought to successfully provide the greatest number of signals to enter continuation trades. Therefore, if you happen to come across a zero-line-cross indicator that seems to have a lot of potential, you can actually grant yourself more lucrative opportunities just by adding the moving average.

Average Directional Movement Index (ADX)
ADX can serve as an example of how you can apply the moving average to a volume indicator. Whenever the line goes above, trend traders receive the signal that they have enough volume to enter the trade. Likewise, whenever the line plunges, it is a signal to stay out of the market. In the example below, we kept the period of 14 and added another line (like we did before) at level 25. ADX has proved to be performing better once the changes have been applied, although it has also proved to give a lot of false signals as well. Another reason why professional traders typically dislike this tool is that it often lags. However, despite the opportunity to test how this tool performs after adding the moving average, we still have some other better options we can use to trade in this market.
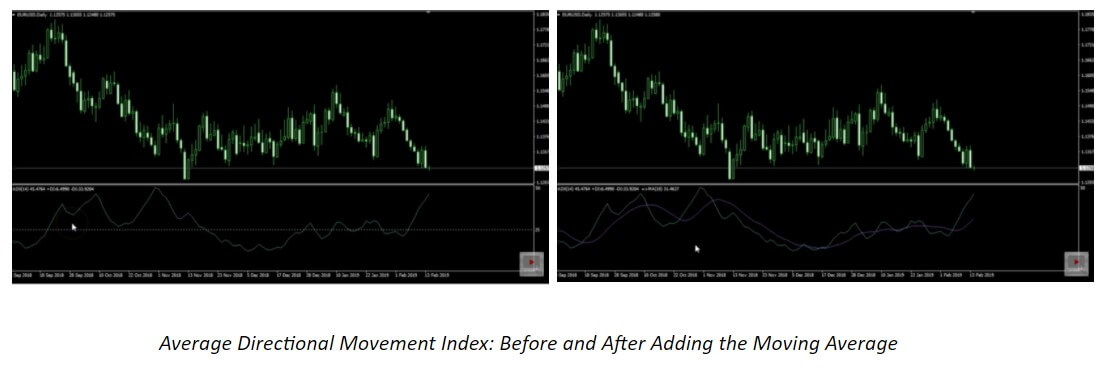
Once you remove the additional line and add the moving average, you will naturally not bring about some unforeseen, alchemical-like change, but you will be able to improve almost any volume or volatility indicator. Drag the moving average down as you did before and change the option from Close to First Indicator’s Data (we kept the period at 10), and you will see how fruitful the results your volume/volatility indicator gives are. If you kept the line we had before, you would have potentially taken a great number of losses because ADX would need too much time to go below. This way, however, you are improving the overall condition because the moving average always adjusts to the volume indicator. Therefore, you could get a signal to take a break at some point in the chart and another one to resume after a while, which is by far better than what the original, unchanged version of this indicator can provide.
As a forex trader, you will naturally be experiencing passing moments of consolidation and stagnation after trading for a period of time. You will then want your indicator to let you know when and how to avoid these troublesome points in the chart. Since the moving average can limit the negative effect a poorly performing tool can have on your trade and expand its functions in terms of quality, you can immediately start testing the indicators you discovered before but for which you could not find the right use. Now the indicators which could not help you seem to have a newfound potential to help you trade more successfully. What is more, the moving average can be applied in such a vast number of cases that it immediately increases the opportunity to win. You only need to take time to test and find a way to use a specific indicator after the changes have been made. Some indicators can only be improved to a certain degree with the MA, yet some others can truly illustrate a distinct difference in your trading.
Many traders are having a hard time finding the right exit indicator, for example. However, an exit indicator that a professional trader would find to be really good is typically a two-line-cross indicator. Luckily, with the help of the moving average, any one-line oscillator can become a two-line-cross indicator and, therefore, also an exit indicator that you can discover to be a really good solution for you. Improvement sometimes implies tweaking the settings, whereas it may also entail adding the moving average so as to give the tools that have not worked well in the past the chance to make a positive difference. The moving average can be applied to almost anything, as we said before, so it does bring a new sense of hope to traders who have had difficulty finding the right elements to complete their technical toolbox. This knowledge simply opens up a number of tremendous possibilities, as a single oscillator changed to a two-line-cross indicator is the proof that tools that were not very useful can be adjusted so that traders can actually make use of them. Whatsmore, indicators with two lines have first and second indicator data. In this case, you can apply MAs to both and have a kind of momentum gauge in an already established trend, for example, on line cross.
Go to your list of indicators that you considered as poor samples and start testing this solution to find out just how much the moving average can improve your trading. At least then you will know that you can write off a tool for good without having to go through periods of hesitation or doubt. Luckily, sometimes the improvement comes just after adding this second line, so you will never again need to question a decision you made with regard to indicators. According to professional traders, some of their most lucrative deals stemmed from continuation trades which these changes made possible. Hence, just by making these adjustments, you can turn a below-average indicator is a tool that is similar to MACD and experience numerous benefits long term. There are many variations and improved versions of MACD, RSI, and others, with a different type of calculations. Playing with MAs on these tools is a definitive winning combo. All you have to do is try it out.

