
Are you losing control of your trading? Do you feel lost in your own analysis and despair in the markets because your trading goes nowhere? You are not alone. Many other forex traders suffer from “analysis paralysis” because they use overly-complicated trading strategies. One of our problems is that almost everything we learn in our lives shows us how to survive at work and how to survive in the “real world”. The foreign exchange market is a different world for which you are unprepared and, of course, we apply what we know about the workforce to the forex markets.
As you have probably already discovered: the two worlds do not fit together very well. Forex requires a different approach, one of mental strength, one that forces us to show iron discipline. Sometimes “doing nothing” is the most cost-effective approach. Does it sound counter-intuitive? Most things in the forex market are like that. Based on my experience, most traders do not find success until they simplify their trading strategy.
Today, I will show you some simple steps you can follow to change your trading strategy to operate with a “simple forex” method of trading. Forex requires a completely different look, one of mental strength, one that forces us to teach iron discipline.
Remove All Unnecessary “Extras” From Your Graphics
It is normal that you want to take advantage of every possible advantage to try to put the odds of success at your side. For a trader initiated, it usually means to leave on the hunt for all the “shiny new objects” as indicators, other graphics tools, and anything that seems exotic enough to offer you a “selective view” of the financial market that not everyone is aware of.
Those who pursue trading strategies that use indicators are generally satisfied with the performance provided by the system in the longer term. The natural internal workings of most forex indicators respond very slowly to the movements of the organic market. The indicator can therefore offer a sign of purchase or sale only when most of the movement is finished, thus putting you at a very bad price to enter. Indicators also don’t work very well in the markets they are consolidating, generating bad commercial signals that can cause a decrease in their balance.
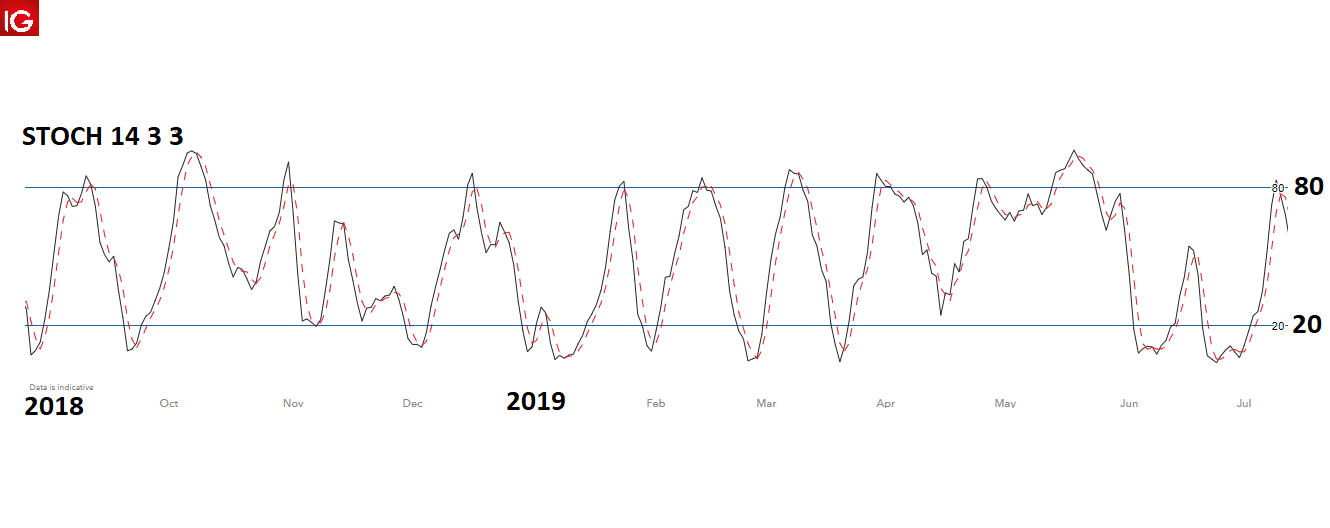
Take a look at the stochastic – a popular forex indicator that comes with most graphics programs. Stochastic is simply designed to operate under specific financial market conditions. Unfortunately, it does not work properly in trend markets – it is the main requirement to make money.
What traders do then is to look for another indicator that “fixes” the problem, one that “filters” the bad signals and gets the original indicator to work better. Despite having the best intentions, this only adds more problems to the chart. Rather than offering us an easier analysis, it makes it more frustrating, as the two indicators will probably offer contradictory signals and will never coincide to offer a clear trading opportunity.
The trader will then look for more “graphical aids” to remedy this, but the situation will escape his control and the graph will end up looking like something like a nuclear power plant control panel.
This is a very frustrating work environment to operate in because you can’t even see where the real price is and the price is the most important item on your chart. Once a trader reaches this point he usually ends up cleaning the chart and starts again. Most traders will find themselves back with the flat price chart and there is nothing wrong with it. At this point, you should have your moment of inspiration.
Trading with a flat price chart is the simplest, most effective, and most commonly used trading method in today’s trading industry. If you notice that the graphics are escaping your control, then do yourself a favor and remove all unnecessary data from your chart and start learning how to trade directly with price action.
Do Not Over-Complicate with Support and Resistance
Even with a flat price chart, the trader can still get carried away and get into a frustrating mess and that’s literally what happens most of the time. Marking support and endurance levels on the chart is one of the most basic and vital skills you need to succeed in any forex trading strategy. Even the core traders, who follow and operate according to the news, need to have a good understanding of how to draw supports and resistors to “complete” their market analysis.
Surprisingly, many traders – new and experienced alike-continually move the line of support and endurance and “defecate in their own nest” as they go crazy with the way they set levels on their chart.
Levels in the Chart
It is time to focus here again on the lesson and learn how to keep trading simple, which also applies to support and endurance levels. Do this and your Forex system will benefit quite a lot from it. At the time you are plotting markets in a price range, limit yourself to marking the top and bottom line of containment. You don’t need the lines to coincide fully, where all the shadows and bodies align perfectly, as this is very rarely going to happen.
Just mark the general area where the price is spinning. Everything you need to focus on the most important turning points, where the price is going to change course and create a decent price movement that you can take advantage of for profit. Operating in the center of the range is risky, the price can be very erratic, unpredictable, and volatile, as it is like a high rotation area that can make you lose a lot of money. But the traders still try to operate in that area: don’t be one of them.
Probably the best place to get into a price range is at the price range limits, so we just have to mark these limits. It’s as easy as that, if you can’t see a sign to buy or sell at these major turning points, then keep waiting. Sometimes, doing nothing is the most cost-effective strategy we can use and it is also one of the less easy decisions to take and follow.
Markets in a range are easy to negotiate, all you need is two levels. The markets in motion, however, are a little different. I work with turning levels in a trending environment.
As you can find out, even when we have good trends in the daily chart that look like they will last forever and offer clear buying/selling signals, many traders continue to lose money despite how obvious things are in that environment. Honestly, I think the main problem comes down to time. Losing traders are not getting into the trends at the right time and are being pushed out of the market by trend fixes.
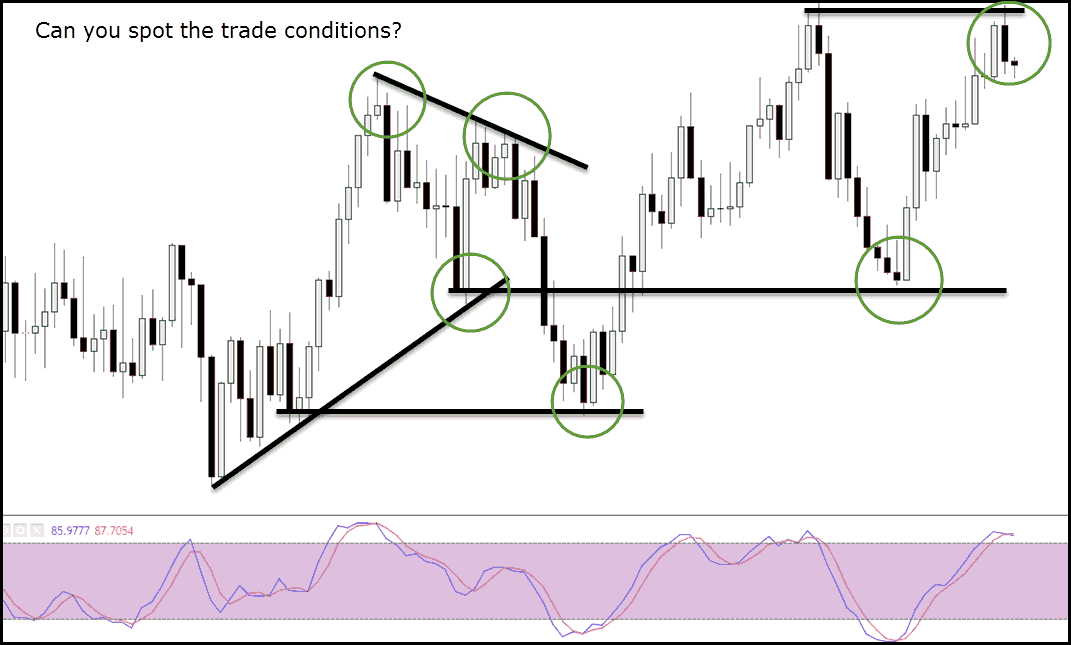
Marking simple strength and support levels can protect your trading account from these errors. During the trends, I frame and concentrate on turning points, where the old resistance becomes the new support and vice versa. Time and again, the turning points of the trend will end with the counter-trend movements. This is where we will most often see the trend shift and move towards new highs or lows again. Start looking for and marking these spin levels and check them for signs of purchase or sale that align with the trend.
It is the turn levels that you must watch for to catch signs of buying or selling in forex. In this case, we have some upward rejection candles that told the trader that the lowest prices were denied by the financial market at the giro level. Just keep in mind that, with a financial market that is on a trend, you really just need to worry about spin levels.
Remember what I said before: these levels will not always align perfectly, so just mark the overall area that you anticipate will act as a main turning point on the chart. Also don’t forget to mark the main weekly turning points, as they can stop strong trends and trigger big turns in price. The same must be done: analyze the weekly graph and mark the strong and clear turning points.
I hope you’ve begun to show him the power of simple trading. There was no need for any complicated indicators or complex graphics tools. It’s just about working with a flat price chart and being very minimalist in marking levels of support and stamina.
Once you simplify the way you mark levels, technical analysis will become much clearer, less frustrating, and you will begin to learn to anticipate future price movements on a flat price chart.
Learn A Simple Forex Strategy That Keeps Your Trading Simple
If you are using a trading strategy you need to use indicators, complex math, or even one that requires spending hours and hours in front of the computer screen. I would recommend that you have the psychiatric hospital in your speed dial numbers! There are many trading strategies that allow us to use our heads only as an external observer. Most of us have busy lives and we really can’t afford to spend hours in front of the graphics by scalping or day trading.
Swing trading can be a very good alternative for those traders who want to be able to trade easily and adapt it to their lifestyle. For example, you may want to operate “full-time”, while keeping your job or studying full-time. How best we can do this is using “end-of-day trading strategies”, where you only have to analyze the market once a day and spend about 20-30 minutes analyzing the financial markets to make your trading decisions.
I use price share trading strategies combined with swing trading as part of my end-of-day trading strategy. The use of some of the examples I’ve shown in today’s tutorial can be seen in the daily chart at the close of New York to identify low-risk and high-reward business opportunities within the daily time frame. This system only takes us about 15 minutes to set up operations and forget about it.
We have a good bullish tendency and we can see that a turning level has stopped a corrective movement against the trend. This is a classic sign of “buying” stock from the end-of-the-day price, right at the hot spot where we anticipate it will act as a turning point of the wider trend. The bullish rejection candle informs the spin trader of the price share that we will probably see higher prices from here.
Actually, it’s as easy as counting 1, 2, 3. You can set your purchase order, complete it with stop and take profit levels, and then let the market follow from here alone. The best conclusion we can draw from all this is that don’t have to stand in front of the screen for hours, as you are free to move on with your life while the financial markets take care of the rest.

I hope today’s tutorial helped you remove all the complicated elements from your chart and trading system, to seal something simple. If your trading system is too “complicated” or needs too much of your day, then you should consider switching to the end-of-day trading strategy that exploits the benefits of price share and swing trading.
Even if you like intraday trading, I strongly believe that you will benefit if you remove the indicators from your chart and learn to “read” a flat price chart to anticipate price movements directly from the same candles. Once you remove all of these complications and start working with plain price charts, your trading strategy will be less stressful, will offer more clarity, and will be a more profitable enterprise.
Just trading the few major currency pairs like EUR/USD, GBP/USD, and USD/JPY and following the long-term trends when the market moves comfortably in the direction of trends is a simple and cost-effective way of trading, and doesn’t need any support or resistance or indicators at all. Give yourself a break and at least give him a chance.
If you liked some of the graphic patterns we saw in today’s lesson and would like to learn more about keeping trading simple, minimalist, and profitable, then you can take a look at my Forex trading strategies.
In my experience, currency traders don’t usually succeed until they learn to read the markets by analyzing price action. Make things simple and logical and trade with a logic that you can understand. Don’t be greedy and chase money, use your energy to become the best possible trader and money will flow naturally to you.