As a trader, when you need to calculate the risk or consistency of your trading system you need to test your trading systems. The Monte Carlo test is a good tool for this. The Monte Carlo method is based on a simulation where all possibilities are evaluated by a random number generation and all possible scenarios are simulated.

What we want is to generate so many random numbers as possible, in order to simulate as many of our trading scenarios as possible. It is something like saying what would happen if some variables like spread, input, and output or the price itself are altered. You will see how each option evolves over time in our trading system, whether it is viable in the long and short term, and what other variables may influence its course.
In this article, I will show you how this test can help you in your trading, some practical examples, and we will also know how to use it in a practical way.
How Can Monte Carlo Simulation Be Used?
You probably don’t know what this method is used for. The Monte-Carlo simulation is about the economy, both in companies and in investment, the latter being where it is mostly seen in action. Some situations where this type of simulation is made in investment are to create, value, and analyze investment portfolios. It also serves to value complex financial products, such as financial options or risk management models.
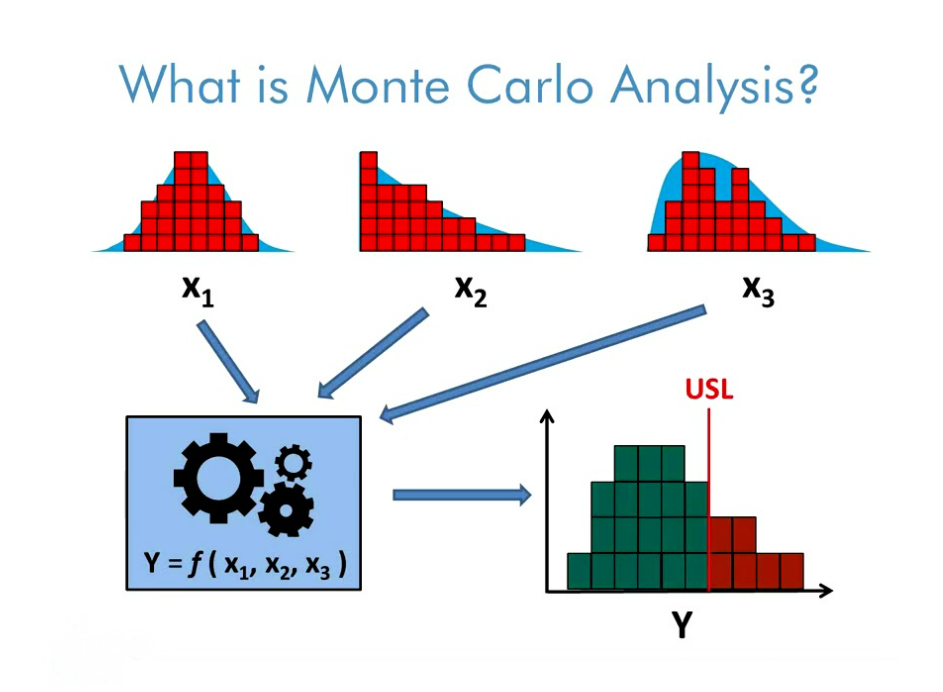
Since the return on investment is unpredictable, this type of method is used to assess different types of scenarios. A simple example is found in trading. As you know, movements in prices cannot be predicted. They can be approximated, but it is impossible to do so accurately. This is where the Monte Carlo simulation comes into play, where you try to mimic the behavior of a trading system or a set of them to analyze how these might evolve. Once the simulation is done, a very large number of possible scenarios are extracted.
Origin of the Name
Monte Carlo cites the name of a famous casino located in the Monaco Match. It is known to be the “gambling capital” as roulette is a simple random number generator. The system was first devised in 1946 when mathematician Stanislaw Ulam thought of an efficient method to improve his solo game.
It was on that occasion that he realized that would be easier to approximate the overall result of the solo match by making multiple tests with the cards and counting the proportions of the results than to calculate one by one all the combinations possibilities. He presented this idea to another mathematician, John Von Neumann, in its most rudimentary form. He was so impressed with the system that he put his efforts into refining the formula.
The technological advances, together with the computer and the theories of Alan Turing, allowed the advance of the investigation of this particular financial simulation to be facilitated. A letter from Neumann to the lab in Los Alamos was instrumental in spreading the formula to everyone. The use of the Monte Carlo model as a research tool comes from the work carried out in the development of the atomic bomb during the Second World War at the Los Alamos National Laboratory in the United States.
This work involved the simulation of probabilistic hydrodynamic problems concerning neutron diffusion in the fission material. This diffusion has an eminently random behavior. Today, it is a fundamental part of raytracing algorithms for the generation of 3D images. In principle, it was idealized by Neumann to evaluate multiple integrals. Today, it is used in the labour market for all kinds of statistics, and very curiously, for high-risk administrative decisions, where it would be difficult to verify the validity of a variant.
Understanding Monte Carlo
The most essential data to keep in mind when doing your calculation is that you have to generate a good amount of random numbers. How can you generate random numbers? While at the Monte Carlo casino, this is used with a roulette wheel, this could take you longer than you have. The right thing for you is to make use of Software.
If we want to generate 10,000 random numbers, to give you an example, imagine how much time we would need to calculate each probability. Computer programs that generate these numbers are used. They are not considered purely random numbers, as they are created by the program with a formula. However, they are very similar to the random variables of reality. They are called pseudo-random numbers. Having said all this, it only remains to see a correct application of the method.

A practical example:
Computer-aided design (CAD) programs can quickly determine the volume of very complex models. Such software, in general, is not capable of determining volume (for example, for a prism, base area multiplied by height). So one of the things we’ll be able to do is divide the model into a set of small sub-models with which the volume can be determined. However, this consumes many resources for the calculation of the volume of each of the elements.
For this, they use Monte-Carlo simulations, which are more robust and efficient. The software knows the analytic expression of the model geometry (position of nodes, edges, and surfaces) and can approximate a point that is inside the model or outside at a much lower cost.
First, the software places the model within a known volume (for example, within a 1 m3 volume cube). It then generates a random point inside the known volume and records whether the point “has fallen” inside or outside the model. This process is repeated several times (thousands or millions), getting a very large record of how many points have been left inside and how many outside.
The probability of it falling in is proportional to the volume of the model, so the proportion of points that have fallen in, with respect to the total of points generated, is the same proportion of volume that the model occupies within the cube of 1 m3. If 50% of the points have fallen within, the model occupies 50% of the total volume, i.e., 0.5 m3. Obviously, the more points the software generates, the smaller the volume estimation error will be.
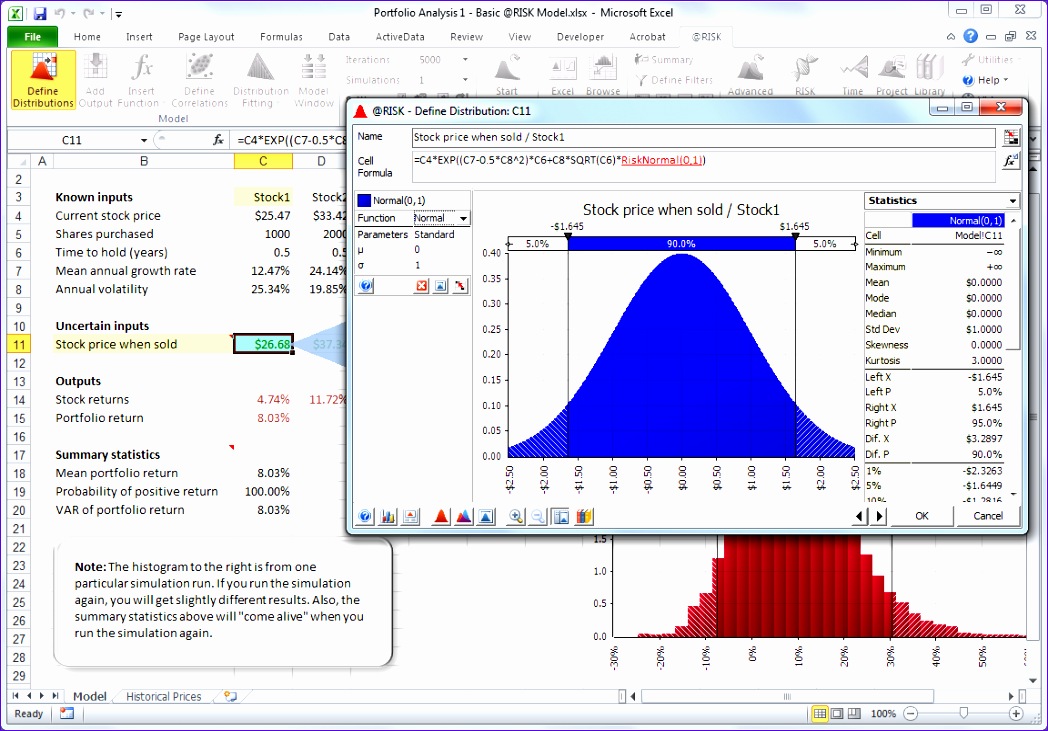
Excel Spreadsheet
One of the many ways to perform a Monte Carlo simulation is to make a random order of operations. For this, we can perform a simple simulation using a spreadsheet. First, start with the data from the next sample. They are trading operations, so you can make a list of the results of the backtest operations.
Now, assign the results to different ranges. Create result groups and attribute each result to your corresponding group. In LibreOffice, it can be done with:
Functions Category Frequency Matrix.
Continuing with the example, there is only one operation with a loss greater than -600, 3 operations with results between -300 and -200, and so on, until distributing the entire sample.
Calculate the relative frequency or probability with which each range is given (frequency is the equivalent of the total of operations). It also calculates the accumulated frequencies, then you can get the random number intervals associated with each operation.
So, the next thing to do is change the order of the random operations, we seek to generate random sequences of operations. How do you do this? Use the SEARCH function, where we select the array between groups and intervals as the RANDOM search criteria. (Between 0.9999). That’s what a Monte Carlo simulation would look like on a spreadsheet.
Each random number shall be linked to a range with a probability less than or equal to the random number obtained. Thus, if, for example, the generated number is 0.35, this will correspond to the range of 100. From the operating sequences, you can draw the different profit curves. By randomizing the order of operations, the capital curves yield completely different results. Based on the curves, you can calculate the trading system’s hope, scatter results, the maximum drawdown level you can expect, and any other ratio you need.
Applying Monte Carlo to Your Trading
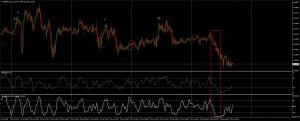
The Monte Carlo test is ideal for you to stress your trading systems and see how they behave in different scenarios. Remember that every day the market changes. As we’re not entirely sure what’s going to happen tomorrow, we change the variables that affect our trading such as volatility, spread, prices. and see how our trading strategies react.
Those that despite varying the whole scenario still yield good results are those that will surely remain profitable. If on the contrary, a strategy with each simulation varies considerably the best thing is to discard it since in practice it can result in losses with any variation in market circumstances.
Use With Darwins
It is possible to either use the method to choose between different traders. We already know that thanks to the formula explained, it is possible to make random operations to generate new scenarios equally likely in each of them.
With the analysis that concerns the article, we will be able to know if a strategy or a darwin works and is robust and in what degree of reliability. To calculate the different curves, we will first need a sequence of results generated by a certain darwin, that is, we will need that the darwin has performed as many operations as possible.
The more I’ve done and the longer I’ve been operating, the better. To get this data, access the risk profile of the darwin you want to analyze, there we will have a histogram of all its operations. Once you have the table, you will have to generate a series of random numbers between 0 and 100 (or between 0 and 1, depending on how you have it set up), and depending on the one that comes out, we will assign a result to each operation. So, if our spreadsheet makes the random number 55, the result of that operation will be +2%.
How do you know this? Because the cumulative frequency of the +2% result is 68.90% and the cumulative frequency of -2% is 30.53, so any random number that comes out between 30.53 and 68.9 will have a result of +2%. You generate this for each operation on each curve, so you can choose the number of operations and the number of curves you intend to simulate.
A darwin with a positive mean means that, in the long run, he has a good chance of winning. Also, the standard deviation gives us an idea of the variability of the possible results of this darwin, the smaller it is, the better. These parameters depend on the number of curves you are going to simulate (the number of curves we have taken as an example is not enough, we have to simulate more, usually 1000 capital curves are simulated) and the number of operations we want to simulate. To analyze data from different darwins, you can do so through the Darwinex website.
Analysis of Monte Carlo
Monte Carlo analysis is one of the largest methods of analysis. Currently, he is one of the major players in high-risk stock calculations. Implementing this model in your trading means having more objective knowledge than you do. Although it seems like a method that throws a coin into the air, the formula used leaves little margin for error and will increase the reality of any fact you make.
Multinational companies, such as Google, have shared their successes in using the Monte Carlo analytical method. They bet large amounts of money on buying social networks and other digital services and are now at the top of the internet world. This type of analysis avoids possible failures when performing operations. In the same way, thanks to it, you can have more robust and consistent trading strategies.