
Introduction
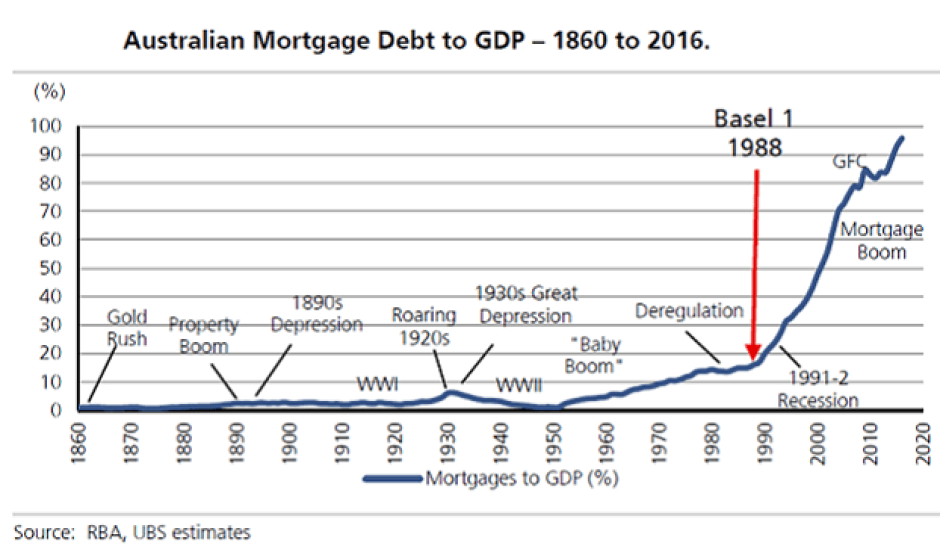
In the recent past, the real estate market has been a critical indicator of economic performance. As with any other aspect of the financial market that intertwines with consumer demand, the significance of the mortgage market cannot be overstated. Knowing if mortgage applications have increased or reduced can tell a lot about the demand in the housing market and households’ welfare. This index can be a leading indicator of demand in the economy.
Understanding the Mortgage Market Index
Primarily, the mortgage market index tracks the number of mortgage applications over a specific period. In the US, for example, the mortgage market index is compiled by the US Mortgage Bankers Association (MBA). The MBA mortgage market index is released weekly. MBA has an association of about 2200 members encompassing the entire real estate financing industry. The companies included in the association are deal originators, compliance officers, deal underwriters, servicers, and information technology personnel. These companies are active in residential, multi-family, and commercial real estate.
Owing to its vast network of real estate companies across the country, MBA is in the best position to provide comprehensive coverage of the mortgage applications made. The published data shows both seasonally adjusted and unadjusted changes in the US’s number of mortgage applications. Furthermore, the report also includes the Refinance Index, which shows the number of applications made by households wishing to refinance their mortgages. The report also includes seasonally adjusted and unadjusted ‘Purchase Index,’ which shows the number of outright purchases in the real estate sector during that week.
Furthermore, this weekly report analyses the change in the Adjustable-Rate Mortgage (ARM) applications. As the name suggests, the ARM is a mortgage in which the interest rate payable on the balance varies throughout its life. The number of the Federal Housing Administration (FHA) loans are also included in the report. It further analyses the average contract interest rate for 30-year fixed-rate mortgages with Jumbo loan balances and conforming loan balances. Jumbo loan balances are those above $510,400 while conforming loan balances are less than this amount. Finally, the MBA mortgage market weekly report analyses the change in the average contract interest rate for 15-year fixed-rate mortgages.
Using the Mortgage Market Index in Analysis
The change in the number of mortgages in an economy tells a lot about the prevailing economic conditions. These conditions range from demand in real estate to prevailing monetary policies. Both of these aspects are integral in the growth of an economy.
When the mortgage market index is rising, it means that the number of mortgage applications has increased. The increase in mortgage applications could imply that there is a growing demand for real estate. One thing you have to know, when people decide to invest in the housing market, it normally means that they have increased disposable income and have thus fulfilled all other intermediate needs.
An increase in disposable income in the economy means that more people are gainfully employed or that wages have increased. In both these circumstances, we can deduce that the economy is expanding. The reason for this deduction is because when demand in the real estate market expands, it means that demand in the consumer discretionary industry has also increased. Thus, the output in the economy is higher.
More so, when the mortgage market index rises, it could mean that households and investors in the economy have access to cheap finance. Either they are creditworthiness has improved, or the market interest rates are lower. When the interest rate is lower in the market, it is usually due to the central banks’ expansionary monetary policy.
Such expansionary policies are adopted when the central banks aim to stimulate the growth of the economy. It means that people have access to cheap money and can borrow more. When there is a growing money supply in the economy, households can increase their consumption, and investors can scale up their operations. Overall, the economy will experience an increase in output, thus in the GDP.
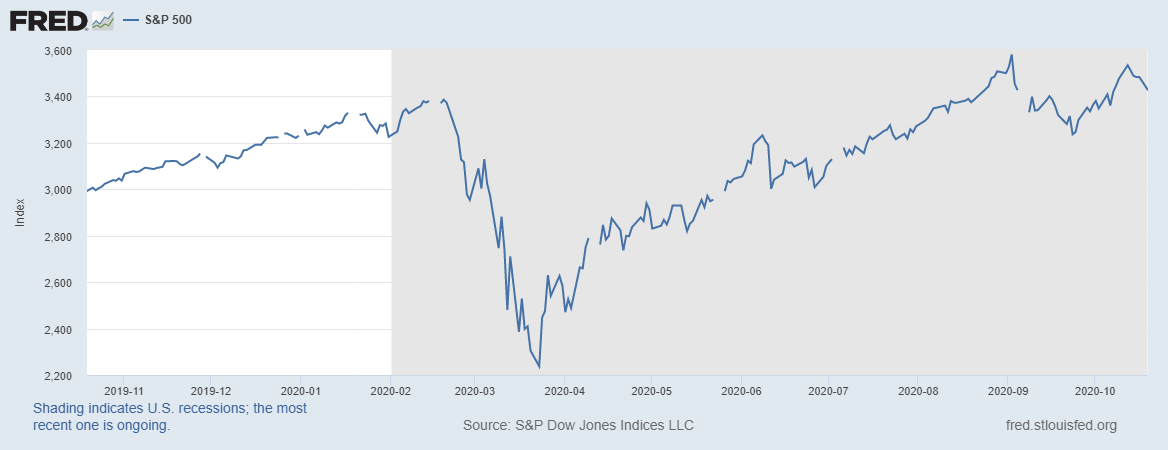
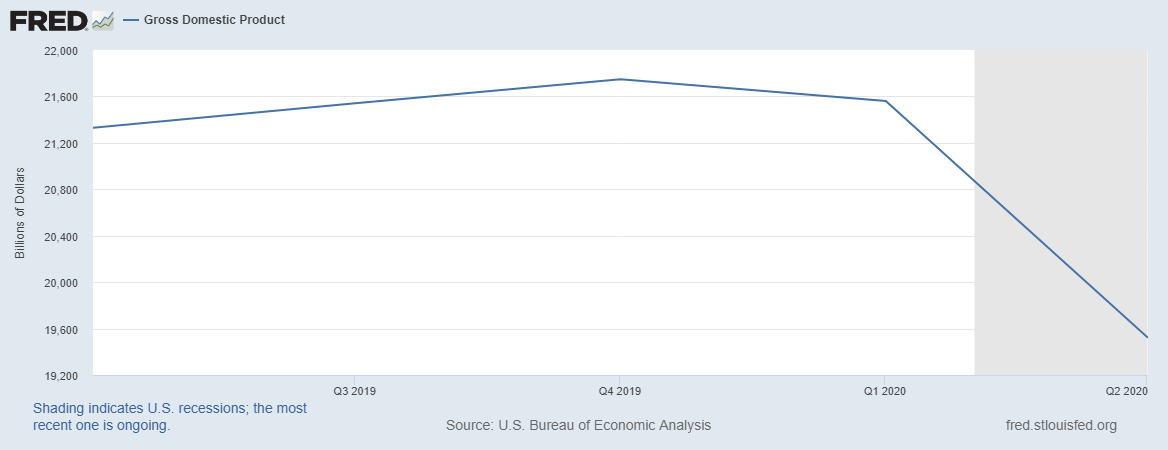
Furthermore, it could also mean that households who previously could not afford to service a mortgage can now be able to afford mortgages due to low-interest rates. This scenario played out towards the end of the first quarter of 2020 when the US Federal Reserve made a series of interest rate cuts. The MBA mortgage market index is seen to have hiked. This hike can be taken as a sign that households and investors were taking advantage of the expansionary policies by increasing their holding in the real estate sector.
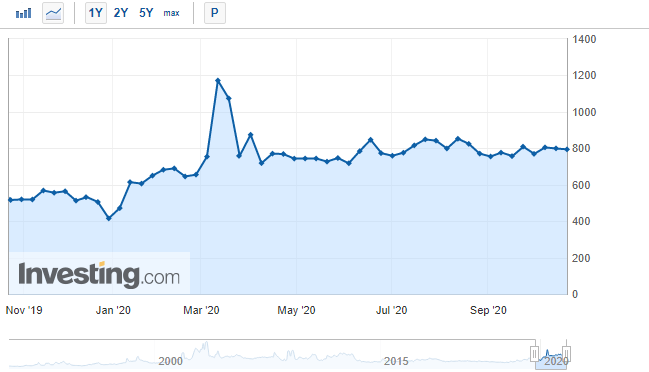
Source: Investing.com
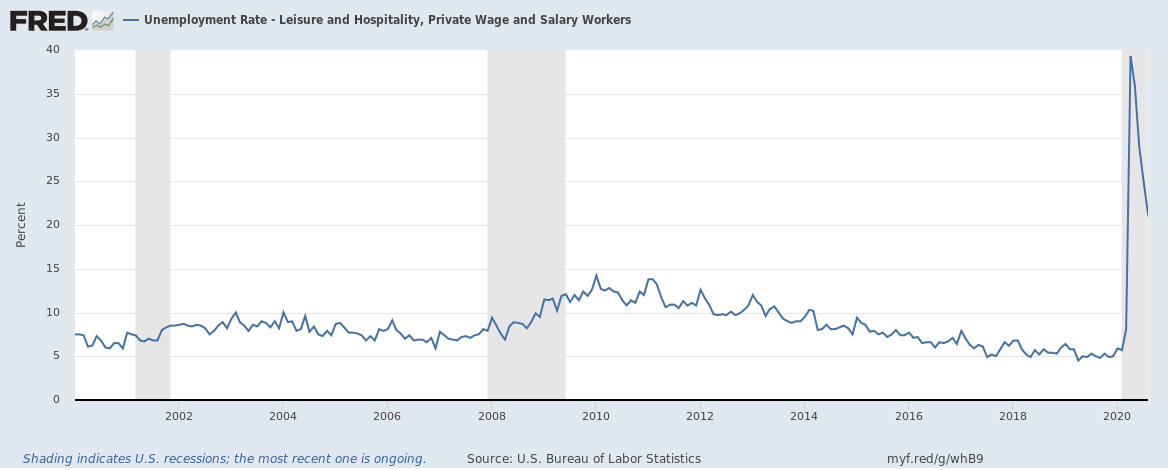
On the other hand, a drop in the MBA mortgage index means that the demand for demand in the housing market is waning. The decrease in demand could be synonymous with an overall contraction of demand in the economy. The contraction of aggregate demand can be taken as a sign that the overall economy is also contracting. Similarly, it can also be taken as a sign that the public has lost confidence in the housing market as during the 2007 – 2008 housing market crash.
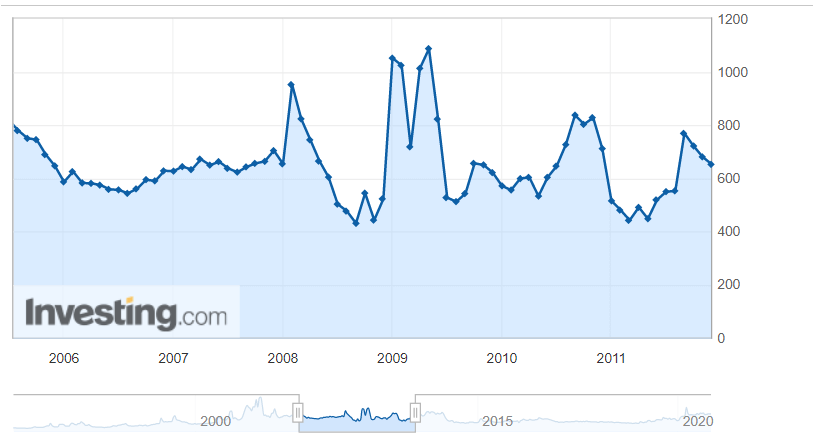
Source: Investing.com
Impact of the Mortgage Market Index on Currency
In theory, the domestic currency should be susceptible to fluctuations in the mortgage market index.
When the index increases, it can be taken as a sign that there is an increased money supply in the economy. Under such circumstances, contractionary monetary and fiscal policies might be implemented, such as hiking the interest rates. When such policies are adopted, the domestic currency tends to increase in value compared to other currencies in the forex market.
Conversely, when the index is continually dropping, it can be taken as an indicator of overall economic contraction. In this instance, expansionary policies might be implemented, like lowering interest rates to encourage consumption and prevent the economy from slipping into a recession. These policies make domestic currency depreciate.
Sources of Data
In the US, the mortgage market index is compiled and published weekly by the Mortgage Bankers Association. A historical time series of the data is available at Investing.com.
How the US Mortgage Market Index Affects The Forex Price Charts
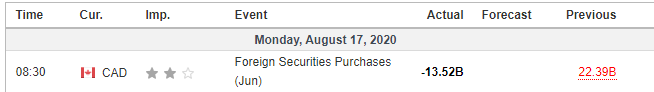
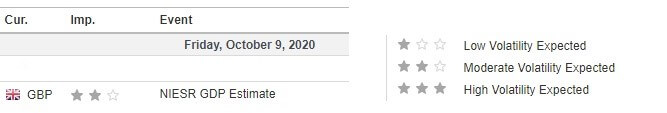
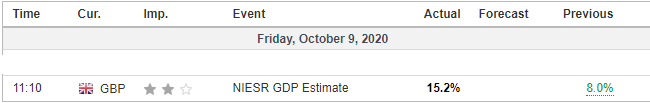
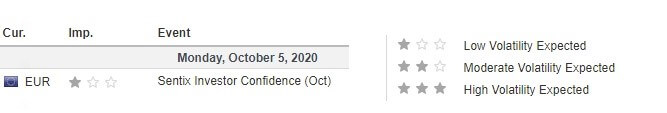
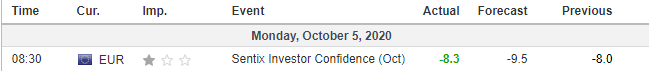
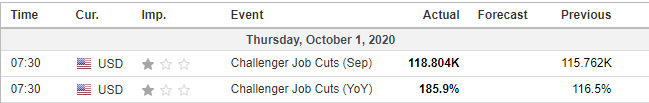
The latest publication by the MBA was on October 21, 2020, at 7.00 AM EST. As seen in the screengrab below, a low impact on the USD is expected when the index is published.
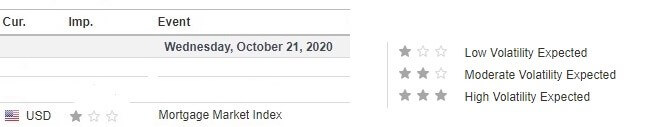
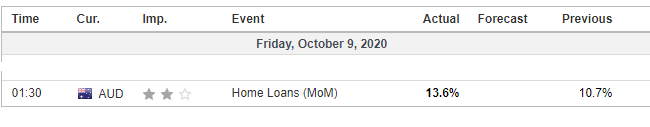
For the one week to October 21, 2020, the mortgage market index was 794.2 compared to 798.9 in the previous publication.

Let’s see how this publication impacted the USD.
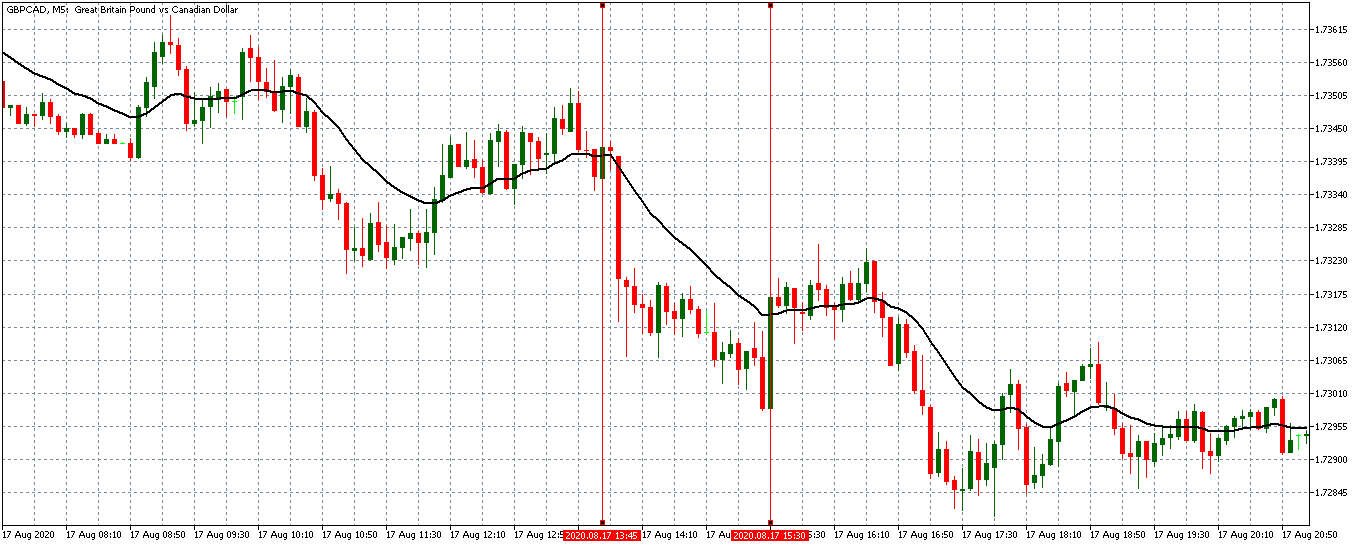
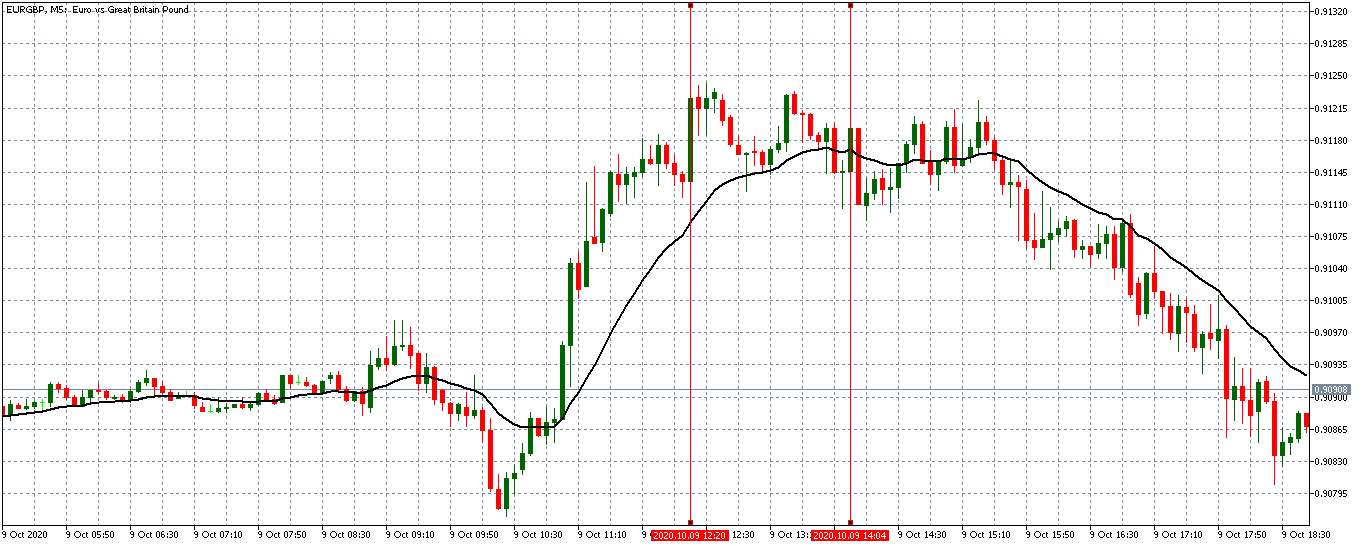
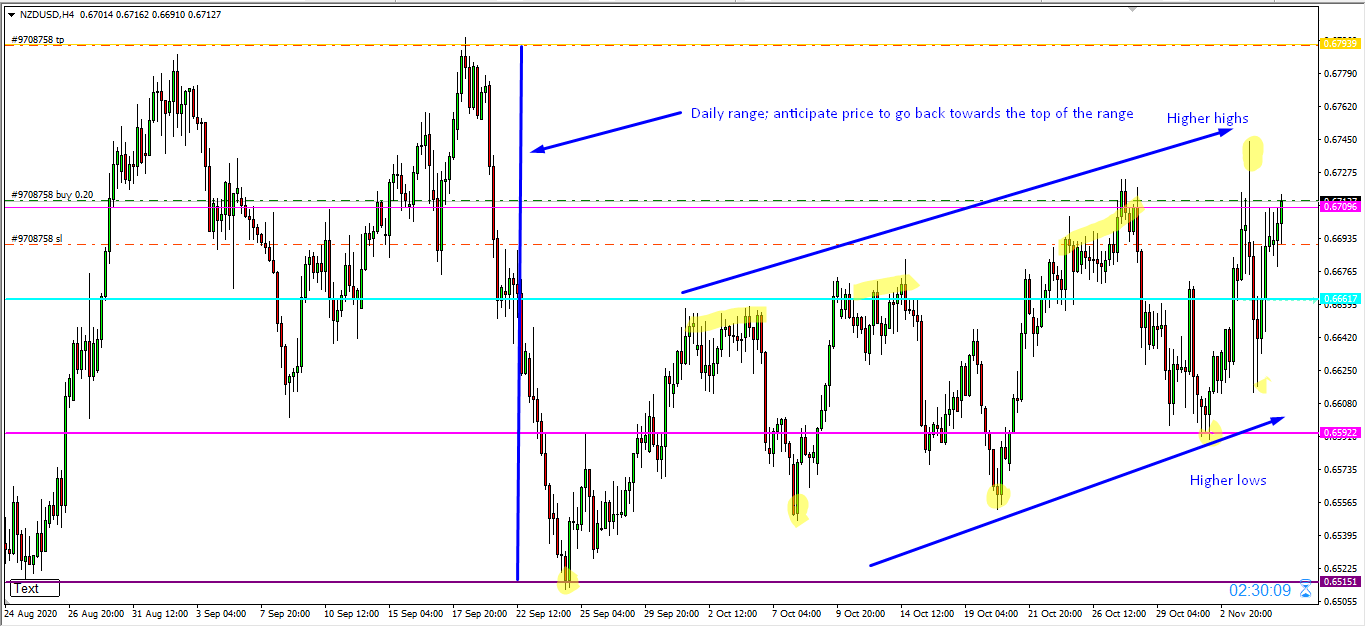
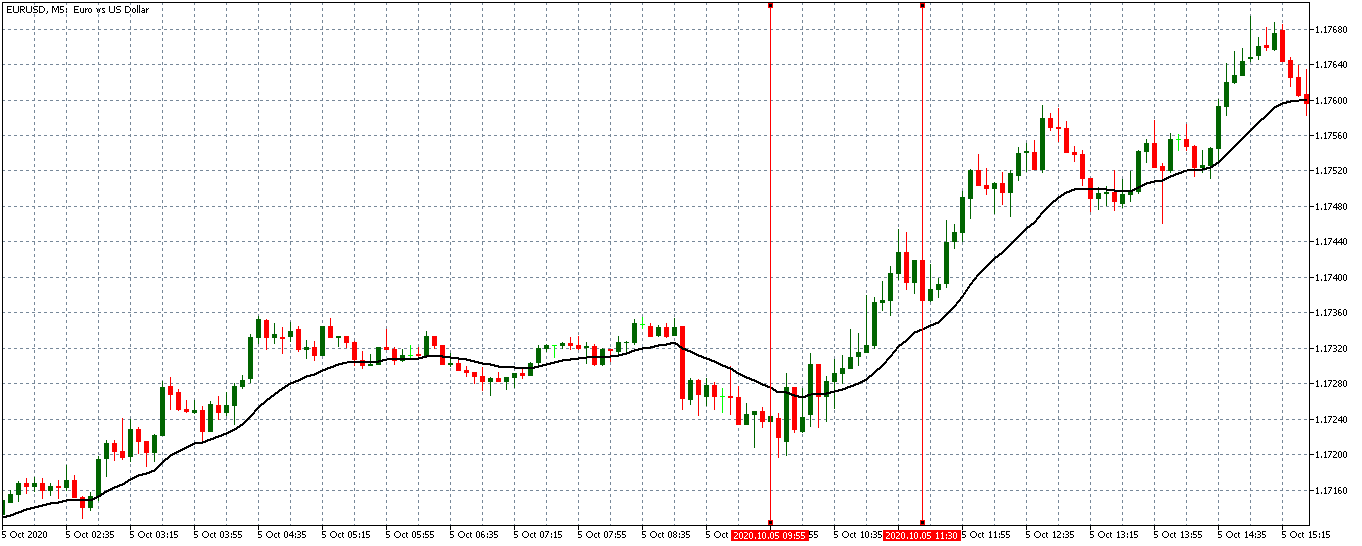
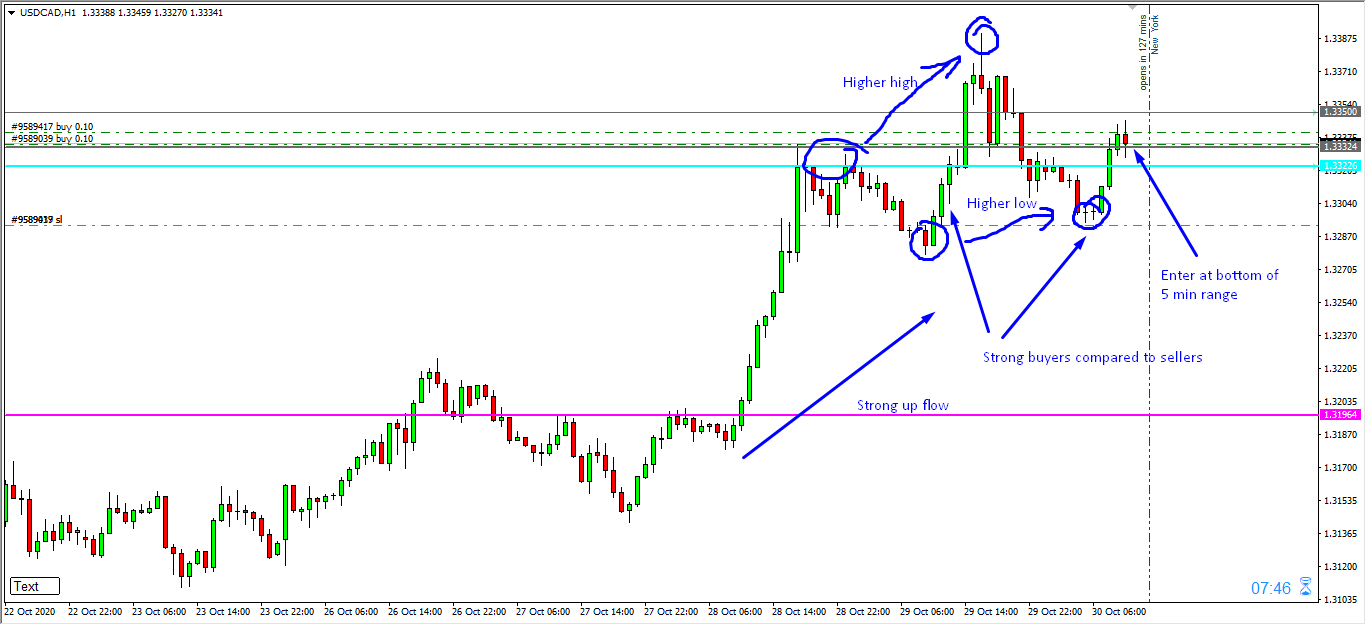
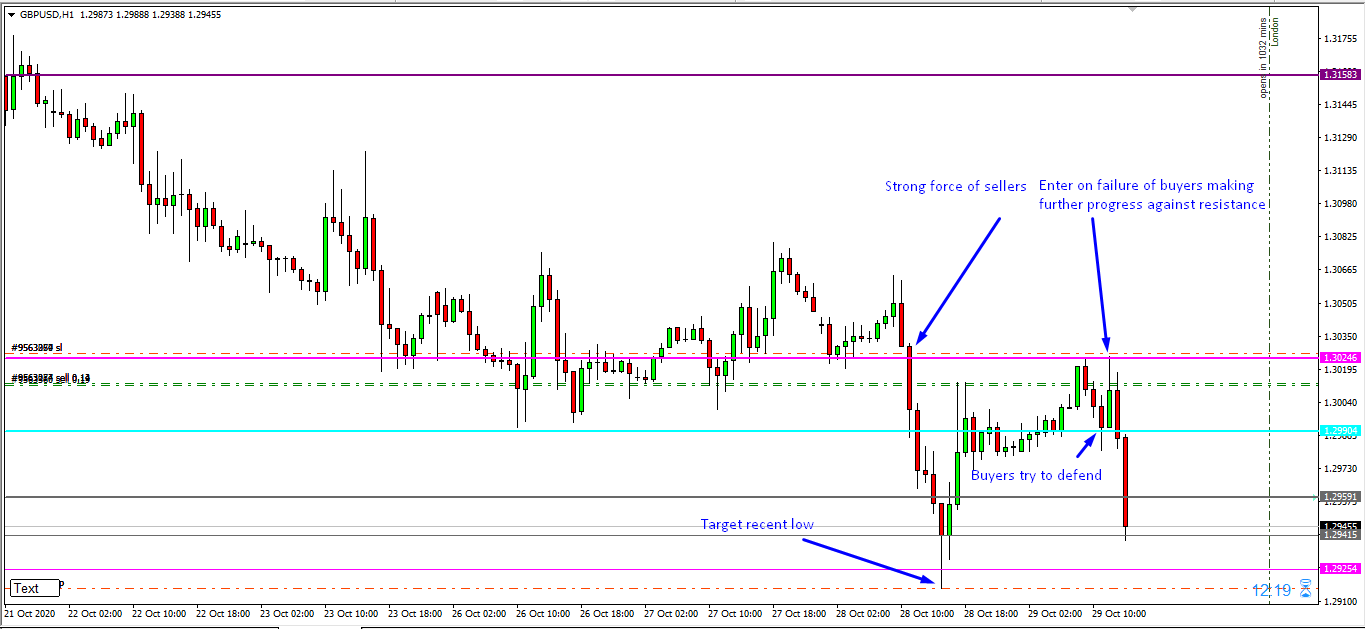
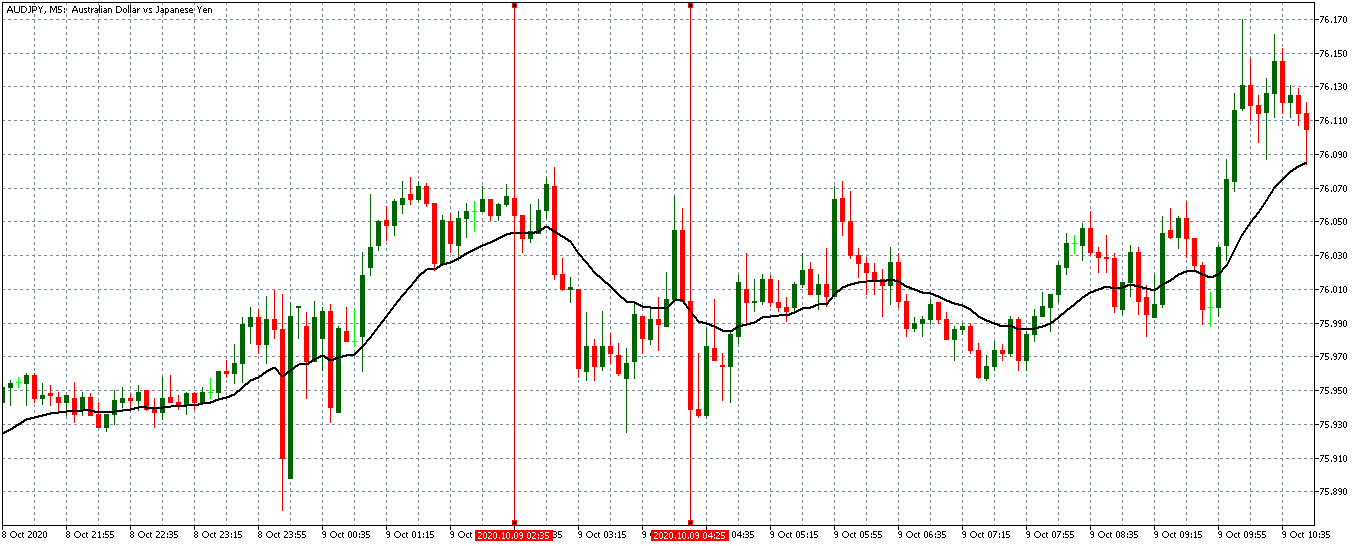
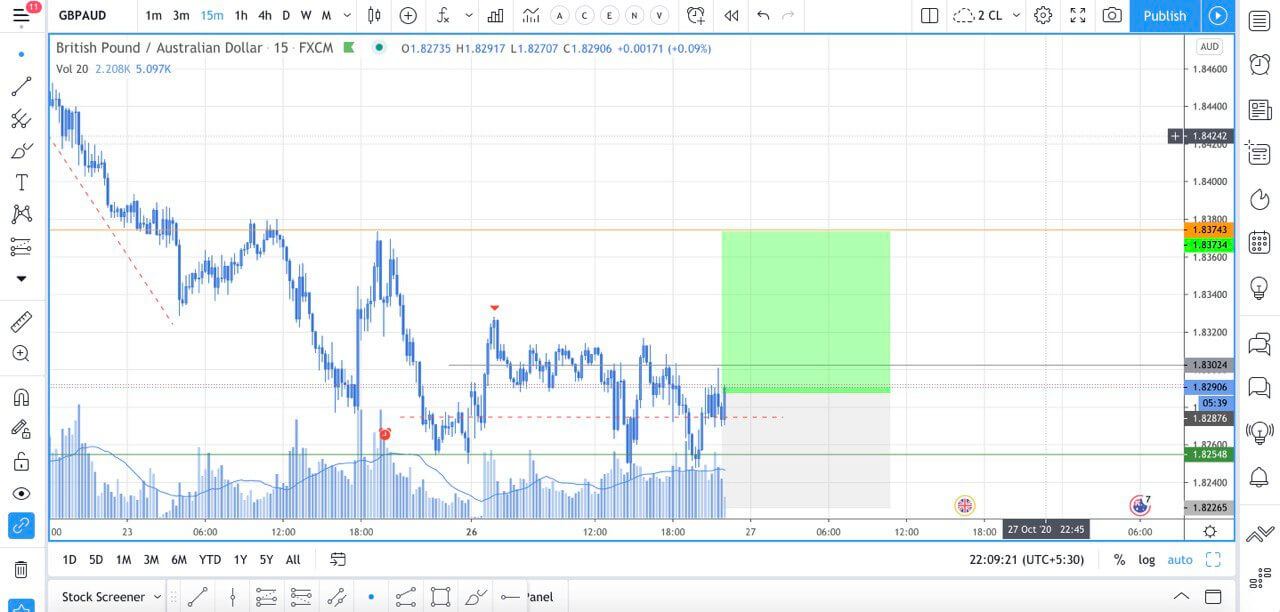
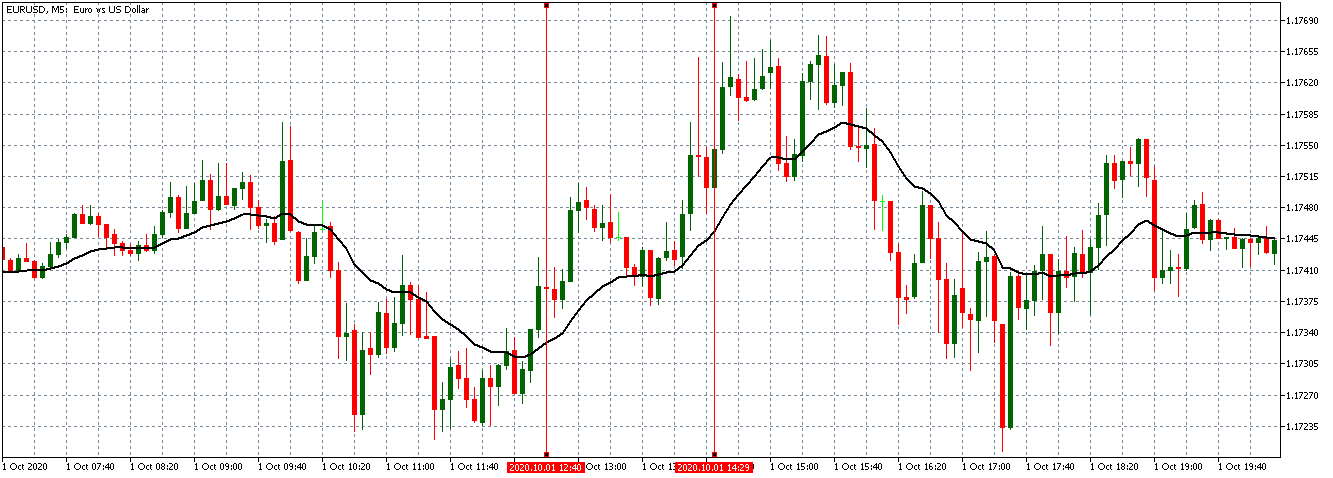
GBP/USD: Before US Mortgage Market Index Release on October 21, 2020,
just before 7.00 AM EST
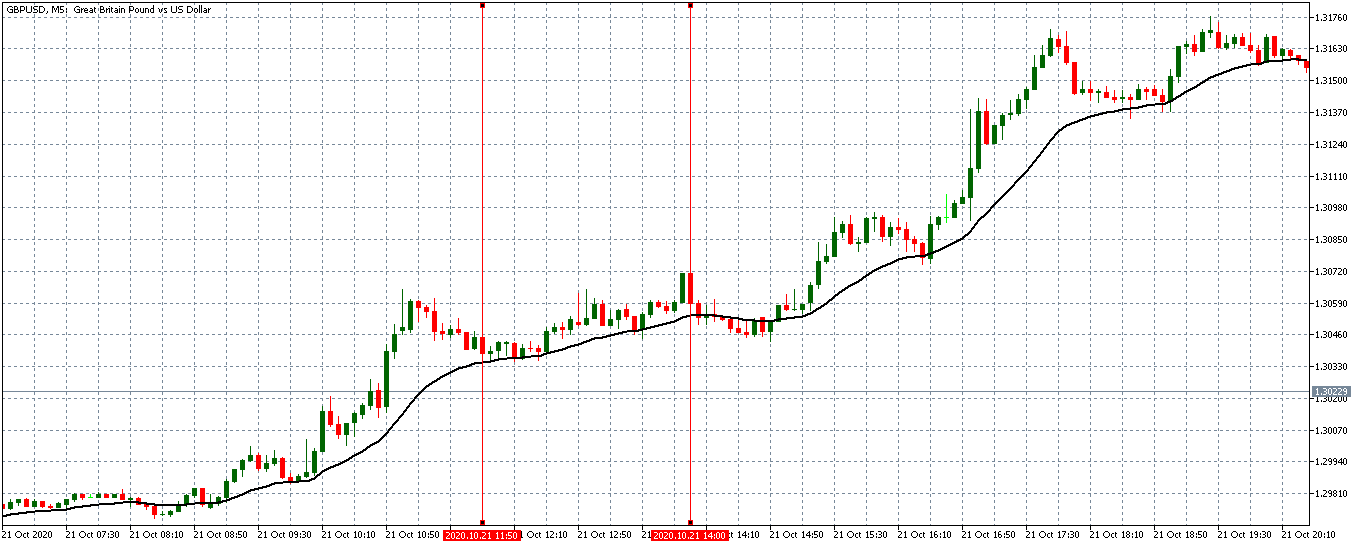
Before the publication of the US Mortgage Market Index, the EUR/USD pair was trading in a weak uptrend. In the above 5-minute chart, the 20-period MA is almost flattened with candles forming slightly above it.
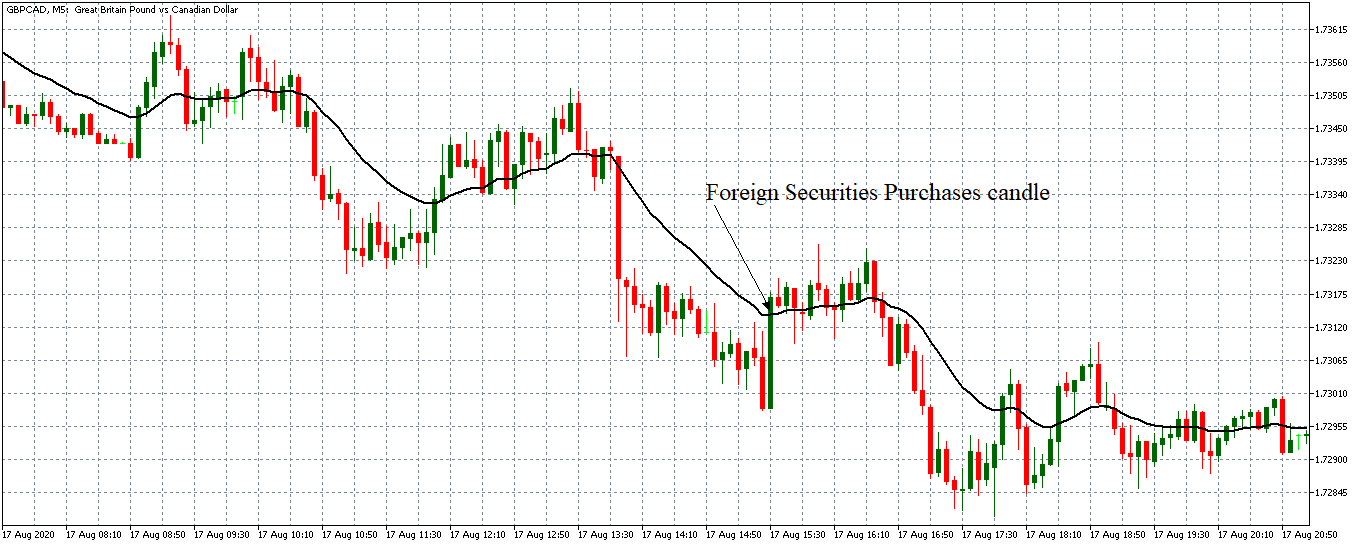
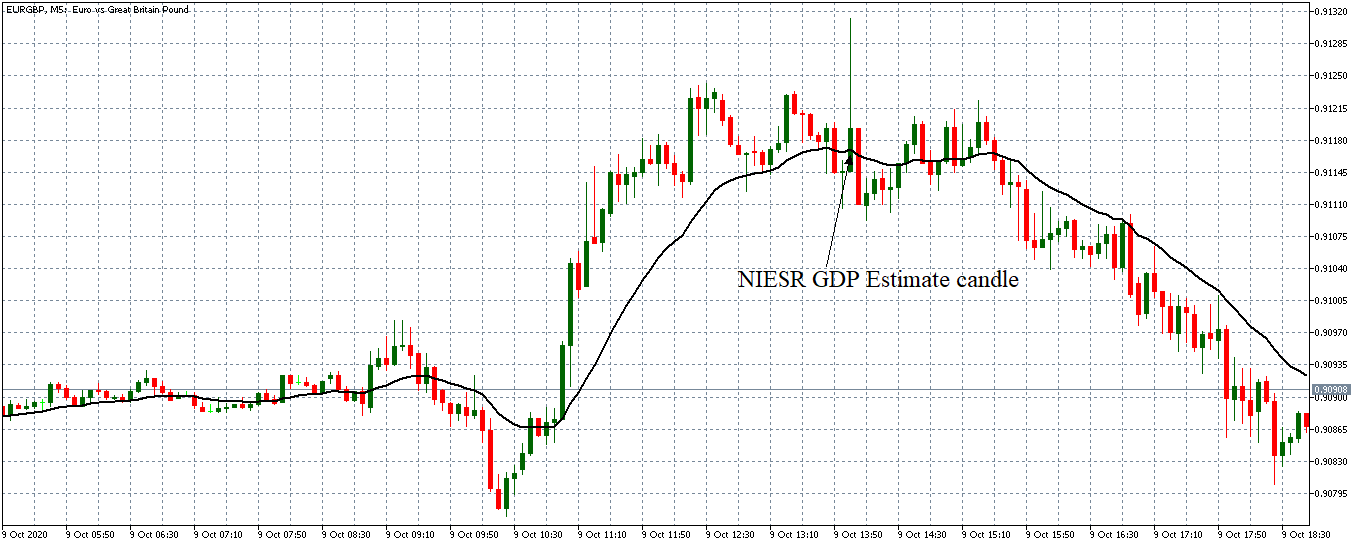
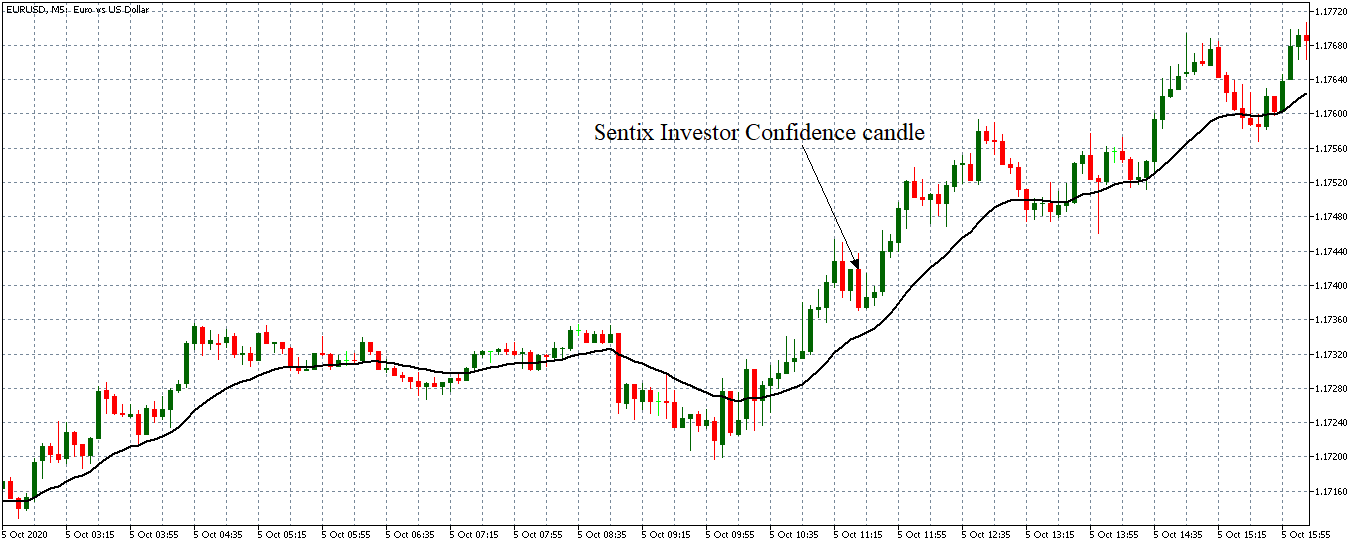
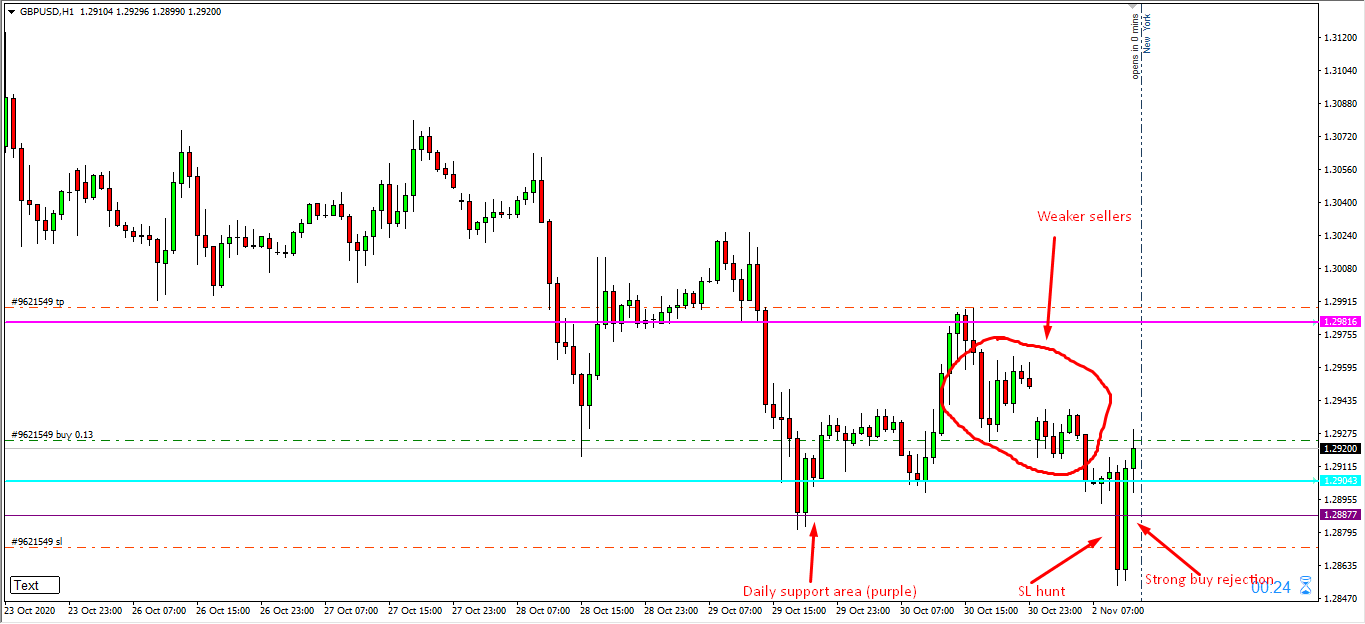
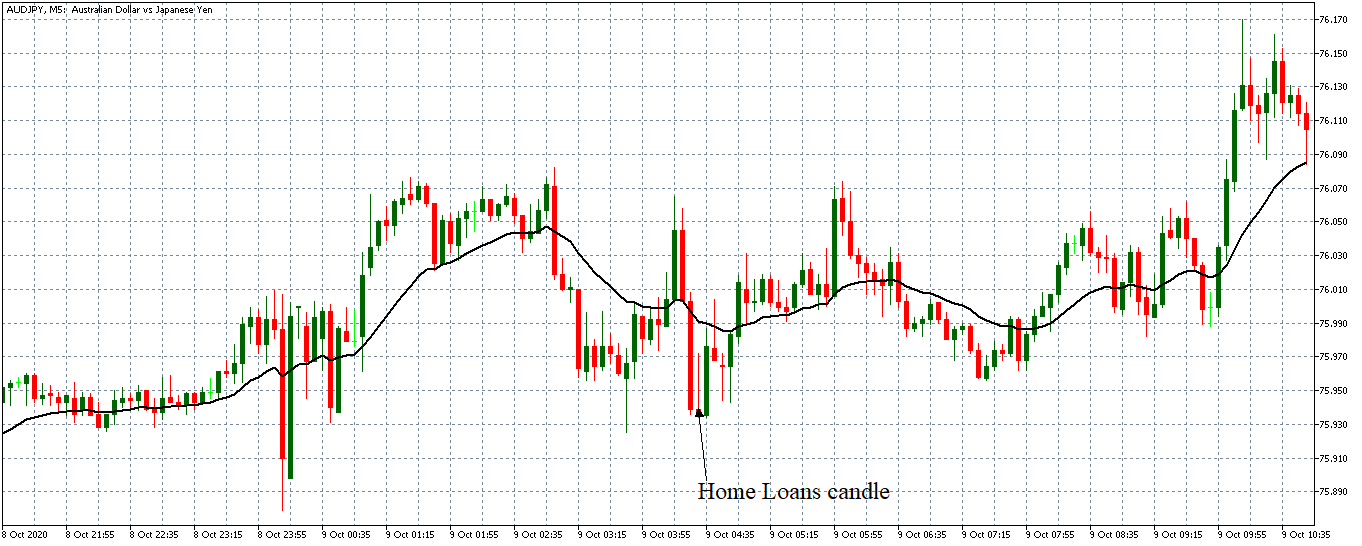
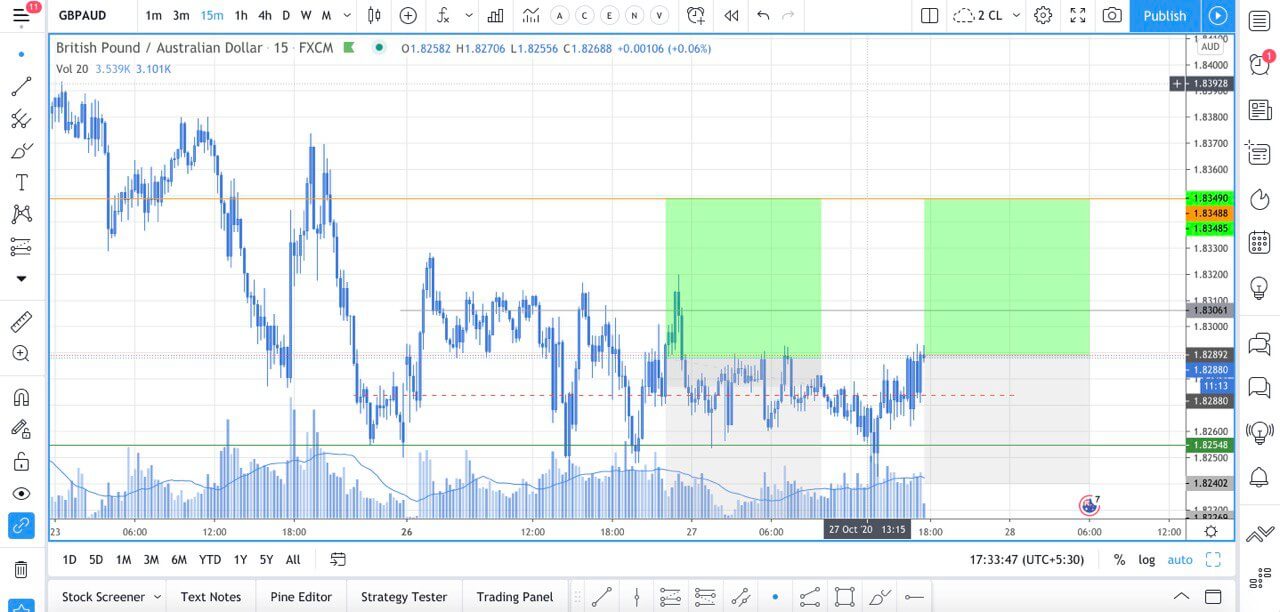
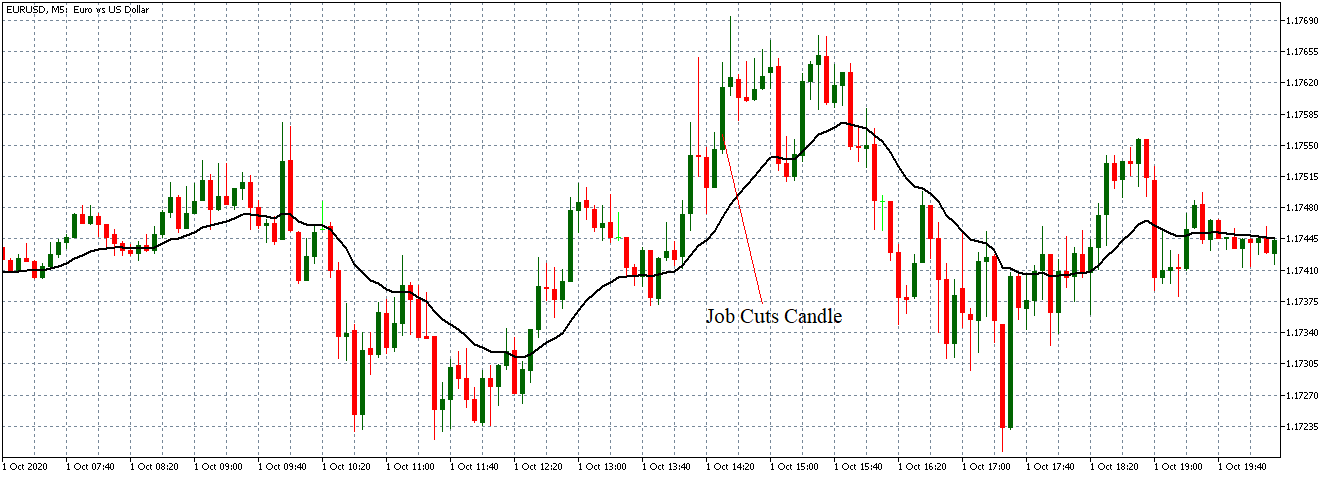
GBP/USD: After US Mortgage Market Index Release on October 21, 2020,
at 7.00 AM EST
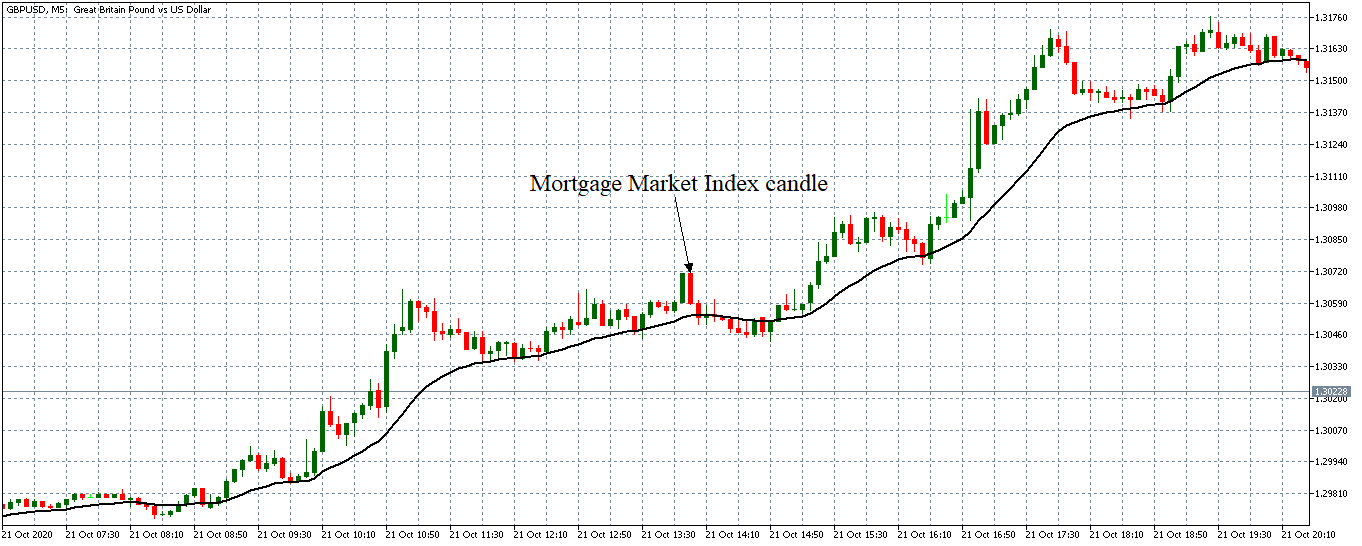
The pair formed a 5-minute bearish candle after the release of the index. It later traded in a neutral trend as the 20-period MA flattened, and candles formed around it.
Bottom Line
This article has shown that the US MBA Mortgage Market Index plays an essential role as an indicator of demand in the housing market. But as shown by the above analyses, this economic indicator has no significant impact on price action in the forex market.


