Categories
Forex Course

159. Understanding Forex Assets Classes

Introduction

The forex market is the world’s biggest financial market, where daily turnover is more than 6 trillion dollars. The most exciting feature of the forex market is that it has an enormous number of trading instruments that allow traders to diversify their portfolio. Besides significant currency pairs, cross pairs are very profitable as it can make e decent move.

What is the Currency Pair?

In the stock market, investors’ trade in a particular stock of a company. This is not similar to the currency market. In the forex market, traders usually trade on a currency pair instead of a single currency.

The combination of two currency indicates the economic condition of two separate countries. Therefore, if we want to trade on a currency pair, we should know at least two countries’ economic conditions. For example, if we want to buy EURJPY pair, our analysis should indicate that the European economy will be more durable than the Japanese economy.

Major vs. Cross Currency Pair

US Dollar is the most traded currency in the world. Therefore, any currency pair from the developed country with the US Dollars will represent the major currency pair.

A list of 6 major currency pairs are mentioned below:

  1. EURUSD
  2. GBPUSD
  3. USDJPY
  4. USDCAD
  5. USDCHF
  6. AUDUSD

If we eliminate the USD from these major pairs, we will find the cross currency pairs. Let’s say the value of EURUSD is 1.0850, and the value of AUDUSD is at 0.7150. Therefore, the value of EURAUD would be 1.39 (1/1.085X 1.085/0.7150).

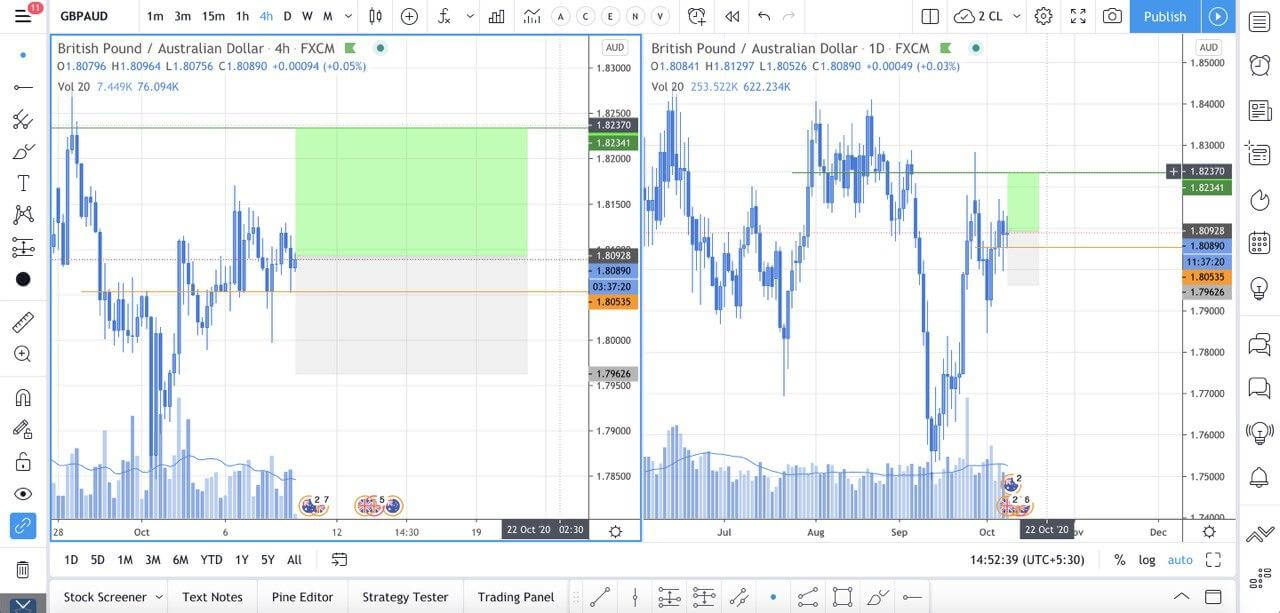
Other examples of Cross currency pairs are EURGBP, EURCAD, GBPCHF, GBPAUD, CADJPY, EURJPY, etc.

The condition for cross currency pairs are-

  • The currency should be from the major pairs.
  • The cross pair should eliminate the US dollar.

Is Cross Currency Pair Trading Profitable?

Trading cross currency pairs is similar to trading major currency pairs as both technical and fundamental analysis work well in cross currency pairs.

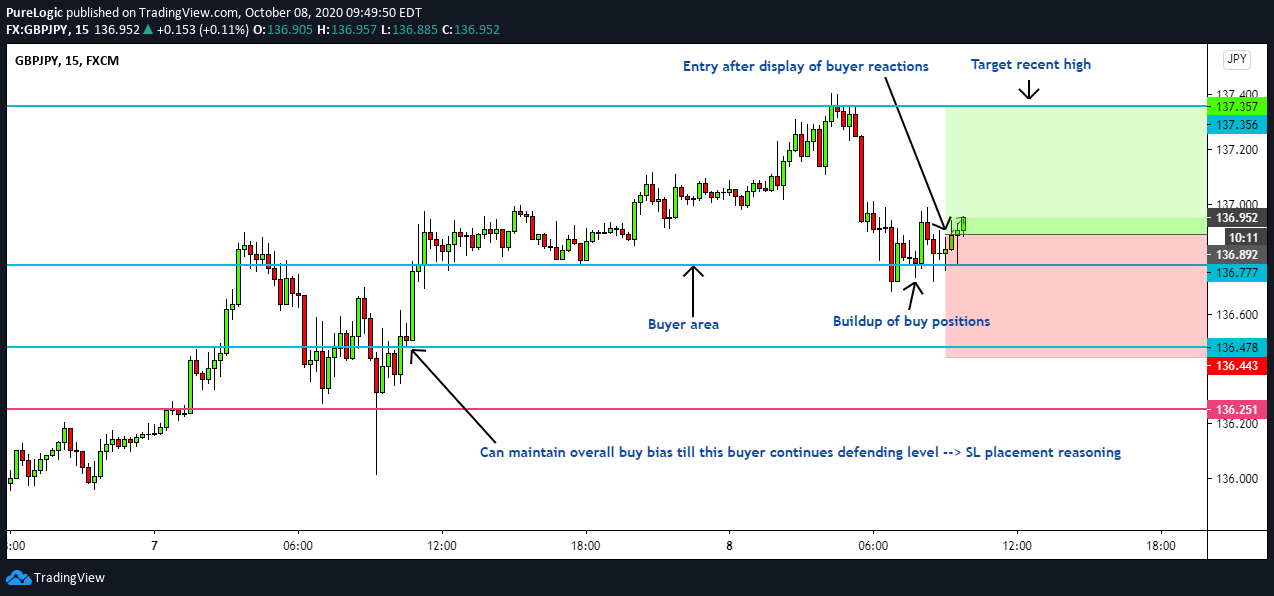
For example, we can make a decent profit from the GBPJPY pair if we can evaluate the UK and Japan’s economic condition.

Conclusion

Trading in a currency pairs means to anticipate the price based on the technical or fundamental analysis. Therefore, if we know the two countries’ economic conditions, we can make a decent profit from cross-currency pairs.

[wp_quiz id=”86447″]
Categories
Forex Signals

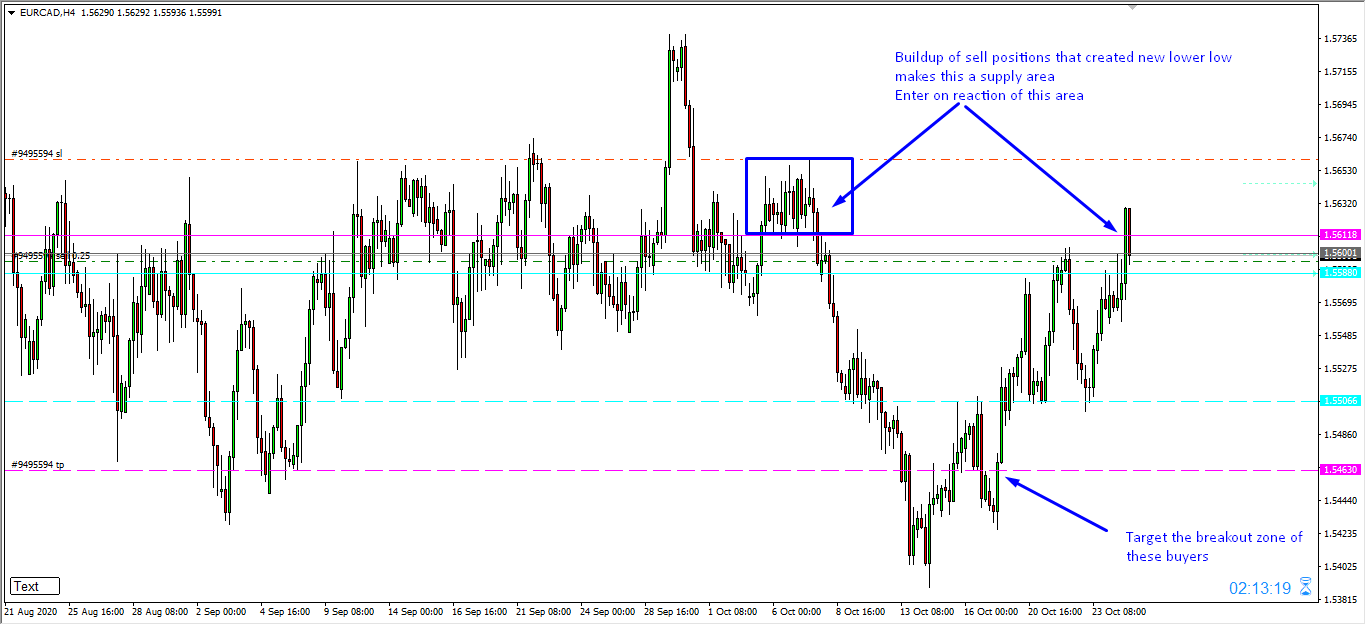
EURCAD Breakout Retest SELL

Categories
Forex Signals

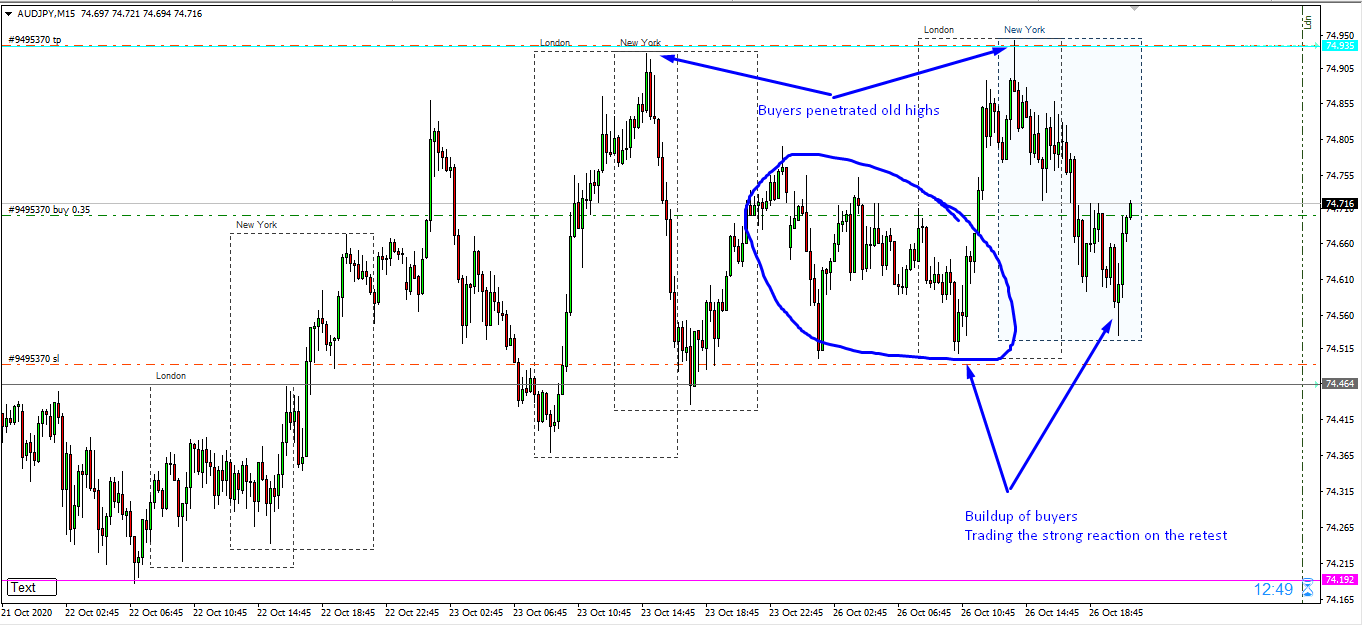
AUDJPY Breakout Retest BUY

Categories
Forex Signals

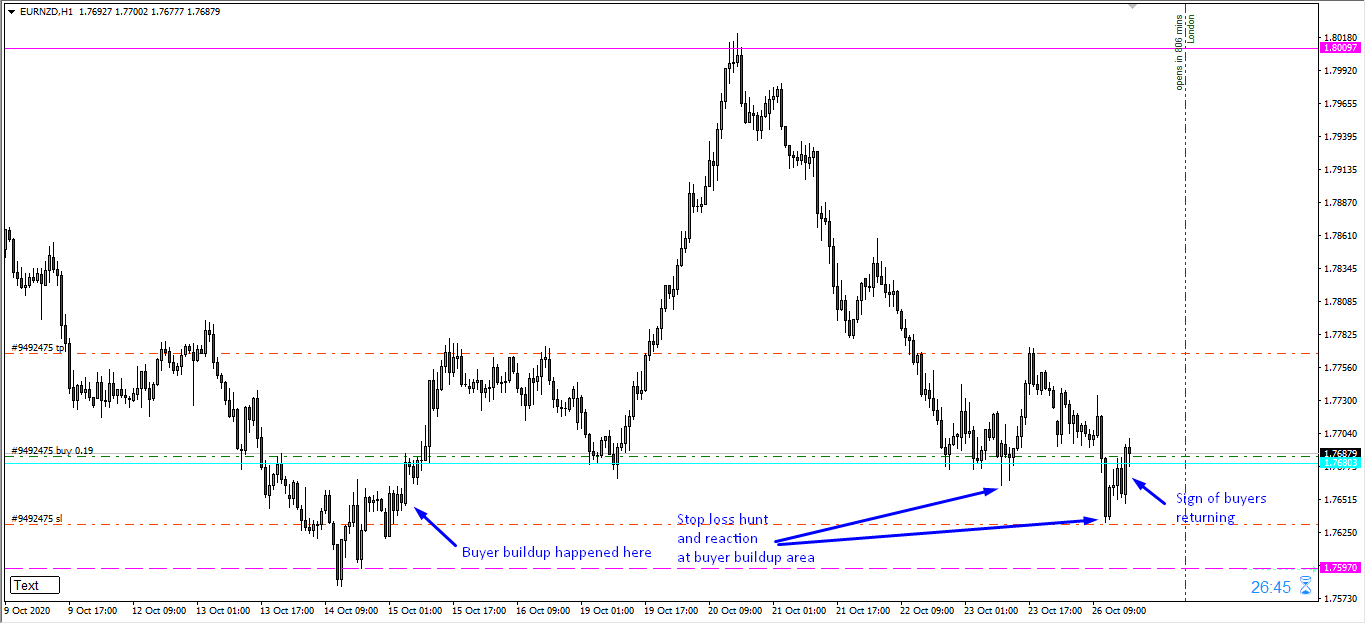
EURNZD Swing Failure BUY

Categories
Forex Signals

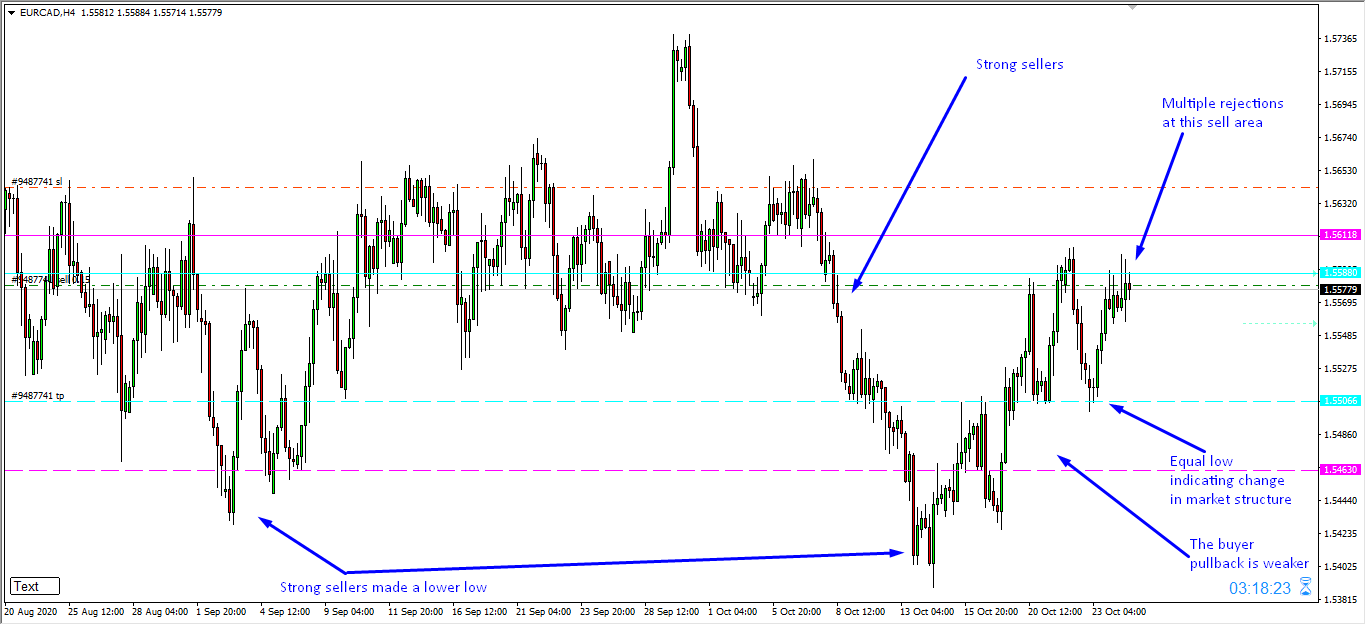
EURCAD Swing Failure SELL

Categories
Forex Course

158. Where to Find Authentic Forex News and Market Data?

Introduction

Fundamental analysis is an integrated part of forex trading. It provides an exact logic and reason behind the movement of a currency pair. However, the fundamental analysis depends on several fundamental releases and news. Therefore, it is evident for a trader to know the source of this news.

What is Forex News and Market Data?

Forex news is economic, geopolitical, and financial news that may directly affect the price of a currency pair. Moreover, fundamental data are economic releases that show the current and upcoming economic conditions of a country.

The price of currency pairs depends on many factors, and traders evaluate it to anticipate the market movement. For example, if a country achieved its targeted inflation rate, and the central bank raised the interest rate, it will indicate stronger economic conditions that may influence traders to take traders in a specific direction.

However, it is essential to find the source where the forex news and market data are available.

Where to Find Forex News and Market Data

Forex trading becomes very easy nowadays as most economic news and market data are available on the internet as soon as it releases. Therefore, forex trading becomes very attractive to retail traders as they can operate all their activities from home with a computer and a stable internet connection.

Let’s have a look where we can find this information:

Forex Brokers

Many forex brokers provide integrated market news and an economic calendar where the upcoming economic releases and events are scheduled. It will update as soon as the news comes and will provide historical data. Some brokers provide exclusive technical and fundamental analysis based on forex news and market data, which is also helpful for traders.

News Portal

Besides the forex broker, there are many websites where forex economic calendar and events are released. It also provides technical and fundamental analysis based on the available information. However, some trading portals offer live charts with economic data.

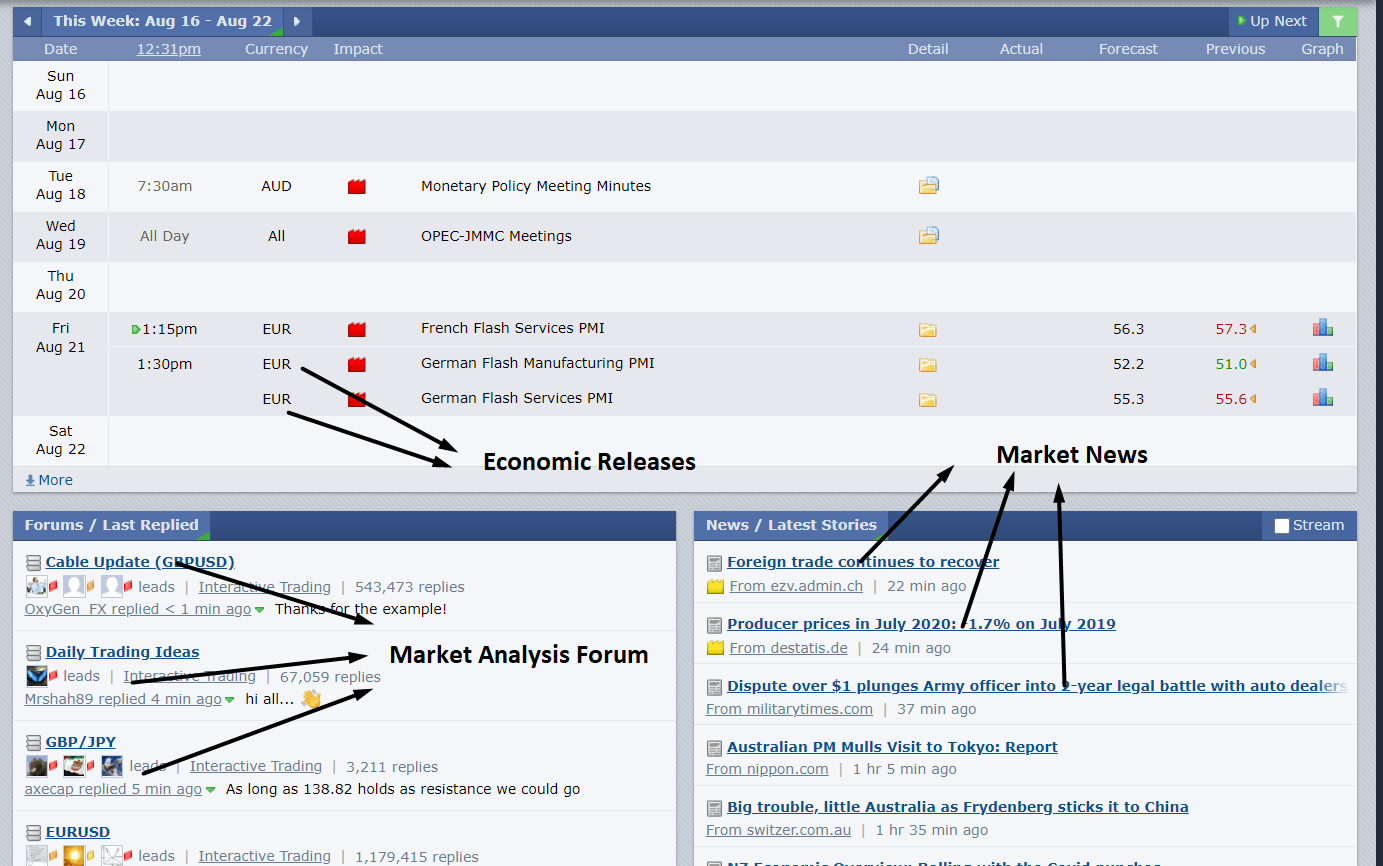
Image Source: www.forexfactory.com

Forex Indicator

Besides the MT4 and MT5 trading platform’s stock indicator, several custom-based indicators show the upcoming news in a box within the price chart. When the news comes, it shows the result immediately on the chart. On the other hand, MT4 and MT5 have a built-in economic and fundamental news service, which is very useful.

Conclusion

It is not very hard to find forex news and market data as it is available publicly, and anyone can access it. However, the challenging part is getting the news immediately after release. The news’s timing may differ based on the quality of the internet connection and execution speed of the news providing website.

[wp_quiz id=”86437″]
Categories
Forex Assets

Analysing The CAD/HUF Forex Currency Pair & Determining The Costs Involved

Introduction

The CAD/HUF is an exotic currency pair where CAD represents the Canadian Dollar, and HUF – the Hungarian Forint. In this article, let’s understand some of the basic concepts you should familiarise with before trading the CAD/HUF pair.

For this currency pair, the CAD is the base currency and the HUF the quote currency. In this case, the price associated with the CAD/HUF pair shows the amount of HUF that 1 CAD can buy. For example, if the price of CAD/HUF is 232.97, it means that 1 CAD can buy 232.97 HUF.

Spread

Spread in the forex market is the difference between buying price, i.e. ‘bid’ and the selling price, i.e. ‘ask.’ The spread for the CAD/HUF is – ECN: 50 pips | STP: 55 pips

Fees

The trading fees you are charged depends on the type of forex account you have. STP accounts carry no trading fee, while for the ECN accounts, the trading fees are determined by your forex broker.

Slippage

In highly volatile trading sessions, sometimes the price at which you trade is different than the price at which that trade will be executed. This difference is called slippage and is usually determined by your broker’s speed of execution.

Trading Range in the CAD/HUF Pair

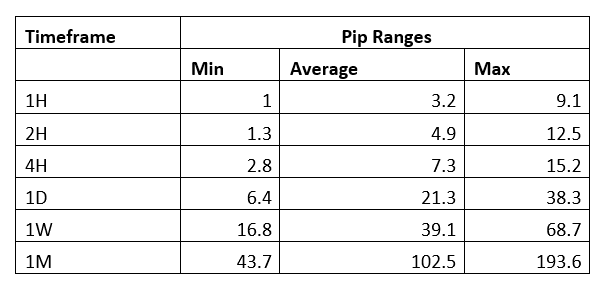
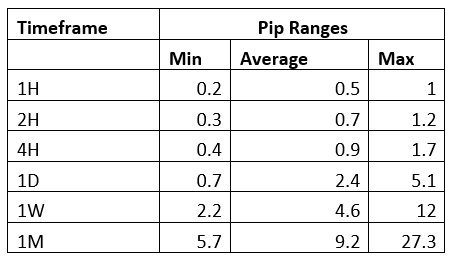
In the forex market, a currency pair will fluctuate differently across different timeframes. Trading range helps a forex trader analyze how a given pair moves (in terms of pips) over a given timeframe, which is an important risk management tool.

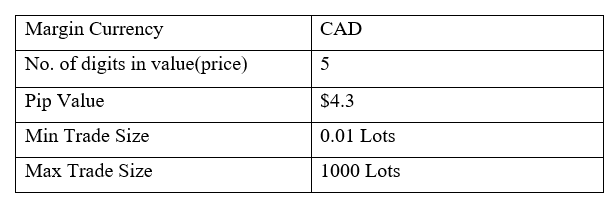
For example, let’s say that during a 1-hour timeframe, the CAD/HUF pair has a trading range of 10 pips. A forex trader trading this pair can expect to gain or lose $43 since the value of 1 pip is $4.3

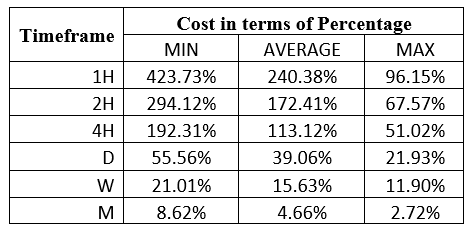
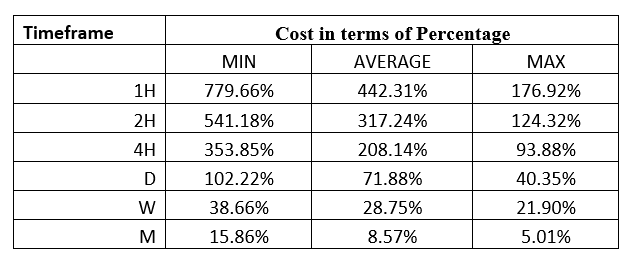
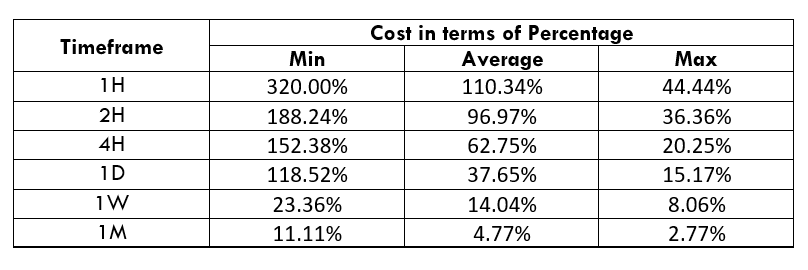
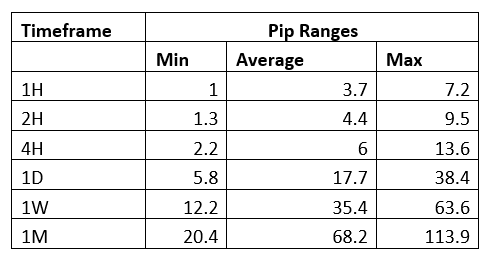
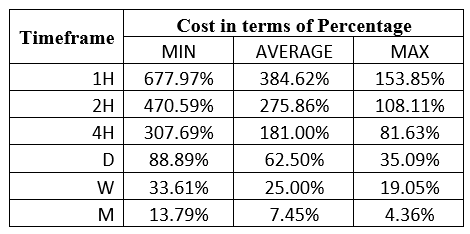
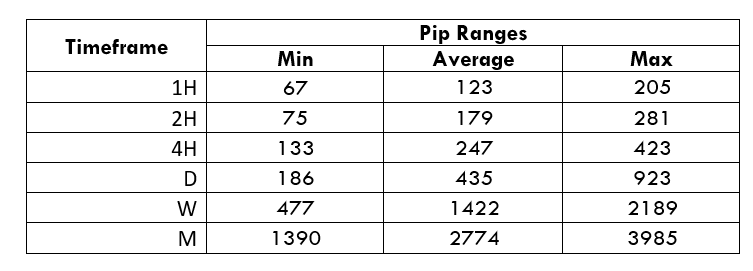
The table below shows the minimum, average, and maximum volatility of CAD/HUF across different timeframes.

The Procedure to assess Pip Ranges

  1. Add the ATR indicator to your chart.
  2. Set the period to 1
  3. Add a 200-period SMA to this indicator.
  4. Shrink the chart so you can determine a larger period
  5. Select your desired timeframe
  6. Measure the floor level and set this value as the min
  7. Measure the level of the 200-period SMA and set this as the average
  8. Measure the peak levels and set this as Max.

CAD/HUF Cost as a Percentage of the Trading Range

Trading costs that can be expected in forex include slippage, spread, and brokers’ fees. Thus, Total cost = Slippage + Spread + Trading Fee.

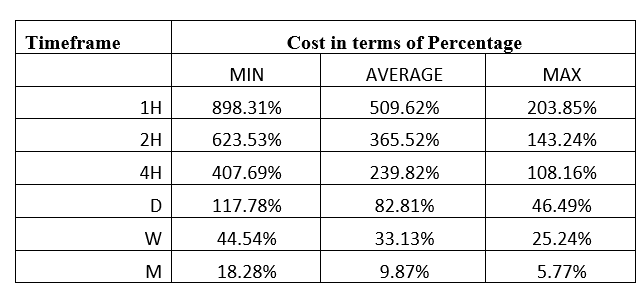
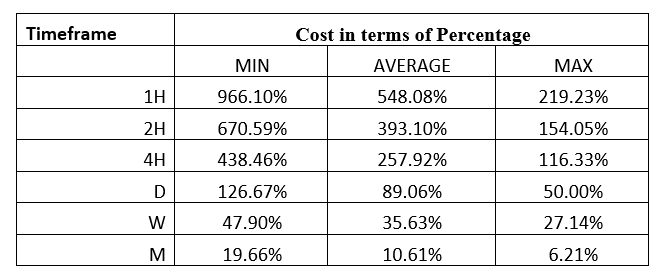
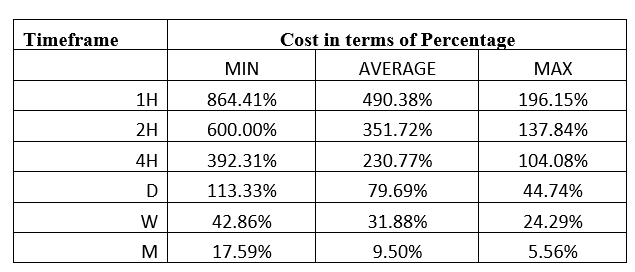
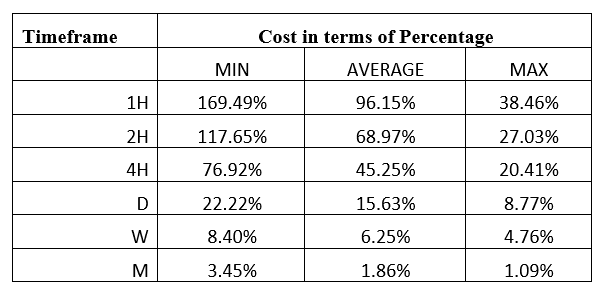
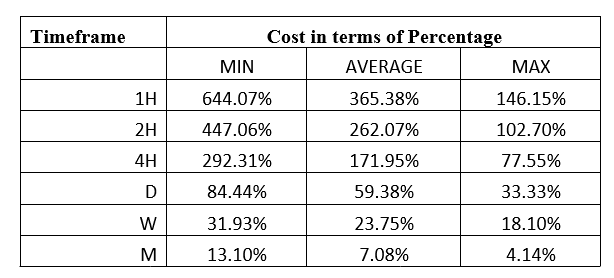
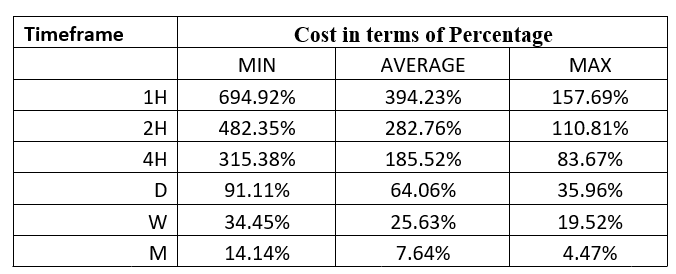
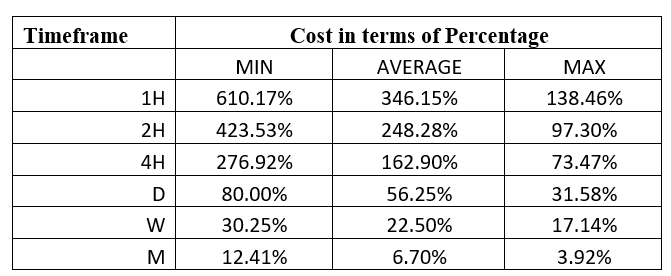
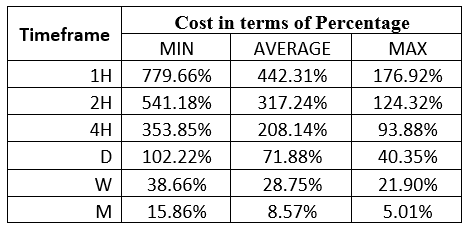
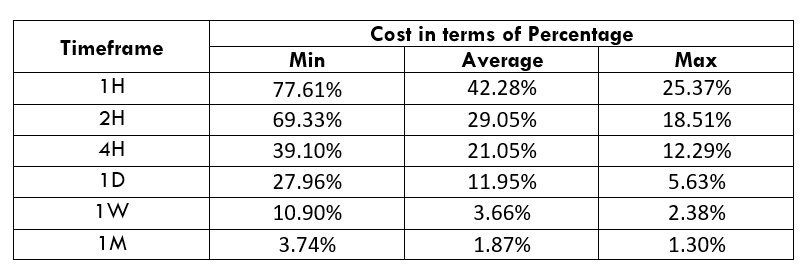
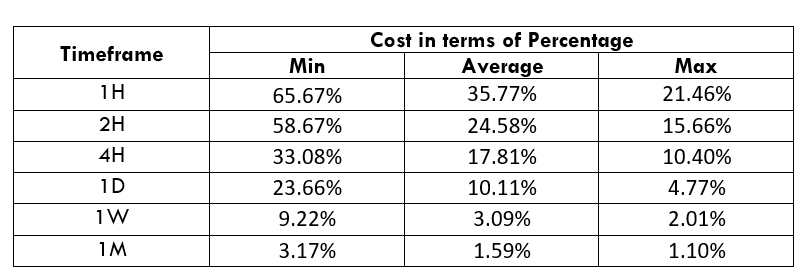
Forex traders should learn how these costs change across different timeframes as the currency pair price fluctuates. The tables below show the percentage costs (in pips) that can be expected when trading the CAD/HUF pair.

ECN Model Account

Spread = 50 | Slippage = 2 | Trading fee = 1

Total cost = 53

STP Model Account

Spread = 55 | Slippage = 2 | Trading fee = 0

Total cost = 57

The Ideal Timeframe to Trade CAD/HUF

With both the ECN and the STP forex trading accounts, the 1-hour timeframes have the highest costs. Therefore, for short-term traders, using the timeframes with minimum volatilities increases the trading costs they will incur. For the 1H, 2H, 4H, and the 1D timeframes, you will incur lower trading costs by trading the CAD/HUF pair when the volatility is above average.

For both types of trading accounts, longer time frames, i.e., the weekly and the 1-month, offer lesser trading costs for the pair. It is worth noting that forex traders can minimize their costs by using limit order types, which eradicate the risks of slippage. Here’s an example with the ECN account.

Total cost = Slippage + Spread + Trading fee

= 0 + 50 + 1 =51

You can notice that when the cost associated with slippage is removed, the overall costs for trading the CAD/HUF pair significantly drops. The highest cost reduces from 898.31% to 864.41%.

Categories
Forex Signals

USDJPY Swing Failure SELL

Categories
Forex Signals

EURNZD Breakout Retest BUY

Categories
Forex Assets

Understanding The Costs Involved While Trading The CAD/ILS Forex Exotic Pair

Introduction

CAD/ILS is an exotic currency cross. Here, CAD is the Canadian Dollar, and ILS is the Israeli Shekel. The CAD is the base currency, and the ILS is the quote currency. Therefore, the price of the CAD/ILS pair represents the quantity of the ILS that  CAD can buy. If the price of the pair is 2.6004, it means that 1 CAD can buy 2.6004 ILS.

CAD/ILS Specification

Spread

The buying price and the selling price of a currency pair tend to be different in forex. The difference between these two prices is the spread. The spread for the CAD/ILS pair is: ECN: 22 pips | STP: 27 pips

Fees

Forex brokers charge a commission on every trade made with the ECN account. The commission varies depending on the broker and the type of trade. Trades on STP accounts do not attract a trading fee.

Slippage

It is rare for a trader to get the exact price they request for a trade. Usually, there is a difference between the price requested and the execution price. This difference is the slippage, and it depends on market volatility and the speed of trade execution.

Trading Range in the CAD/ILS Pair

The trading range is the analysis of how currency fluctuates across different timeframes in terms of pips. The trading range is used to analyze a currency pair’s volatility and expected profit. For example, if on the 2-hour timeframe the trading range of the CAD/ILS pair is 10 pips, then a trader can expect to either gain or lose $38.5

Here’s the trading range for the CAD/ILS pair.

The Procedure to assess Pip Ranges

  1. Add the ATR indicator to your chart
  2. Set the period to 1
  3. Add a 200-period SMA to this indicator
  4. Shrink the chart so you can determine a larger period
  5. Select your desired timeframe
  6. Measure the floor level and set this value as the min
  7. Measure the level of the 200-period SMA and set this as the average
  8. Measure the peak levels and set this as Max.

CAD/ILS Cost as a Percentage of the Trading Range

The cost of trading any currency involves the slippage, fees, and the spread. These costs vary across different timeframes under different volatility conditions. For a forex trader, analyzing the cost as a percentage of the trading range helps implement informed risk management techniques.

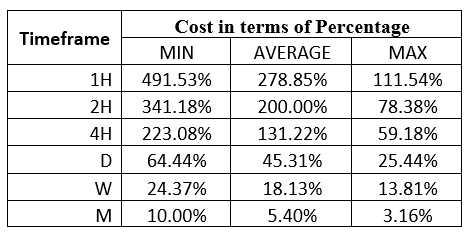
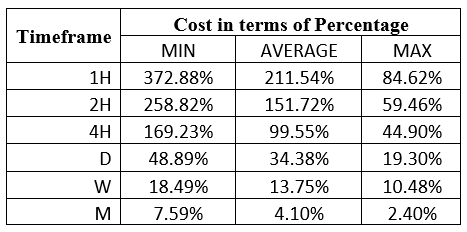
The tables below show the analyses of the trading costs for the CAD/ILS pair across different timeframes.

ECN Model Account

Spread = 22 | Slippage = 2 | Trading fee = 1

Total cost = 25

STP Model Account

Spread = 27 | Slippage = 2 | Trading fee = 0

Total cost = 29

The Ideal Timeframe to Trade CAD/ILS

We can see that the trading cost for the CAD/ILS pair is higher during shorter timeframes and low volatility in both the ECN and STP accounts. Longer-term traders trading on weekly and monthly timeframes enjoy relatively lesser trading costs than shorter timeframe traders.

It is worth noting that for every type of trader, initiating trades when volatility is above average reduces the trading costs. Furthermore, opting to use forex limit orders instead of market orders which are susceptible to slippage, can significantly reduce trading costs. With limit orders, the risk of slippage is removed hence lowering trading costs. Here are the trading costs when limit orders are used.

ECN Account Using Limit Model Account

Total cost = Slippage + Spread + Trading fee

= 0 + 22 + 1 = 23

We can see that trading costs for the CAD/ILS have reduced across all timeframes, with the highest cost dropping from 491.53% to 372.88% of the trading range.

Categories
Forex Fundamental Analysis

How ‘Pending Home Sales’ Data Can Be Used For Analysing The Forex Market?

Introduction

For any economy, the real estate sector plays a significant role in signaling consumer demand, credit situation, and economic sentiment. For this reason, policymakers track real estate data that can be used to inform their monetary and fiscal policies. Furthermore, economists, financial analysts, and consumers use this data for their varying needs. It is essential for a forex trader to understand how the trends of pending home sales affect the forex market.

Understanding Pending Home Sales

Pending home sales is defined as homes that are yet to be sold. The contracts for sales have been signed, but the transaction has not been completed yet.

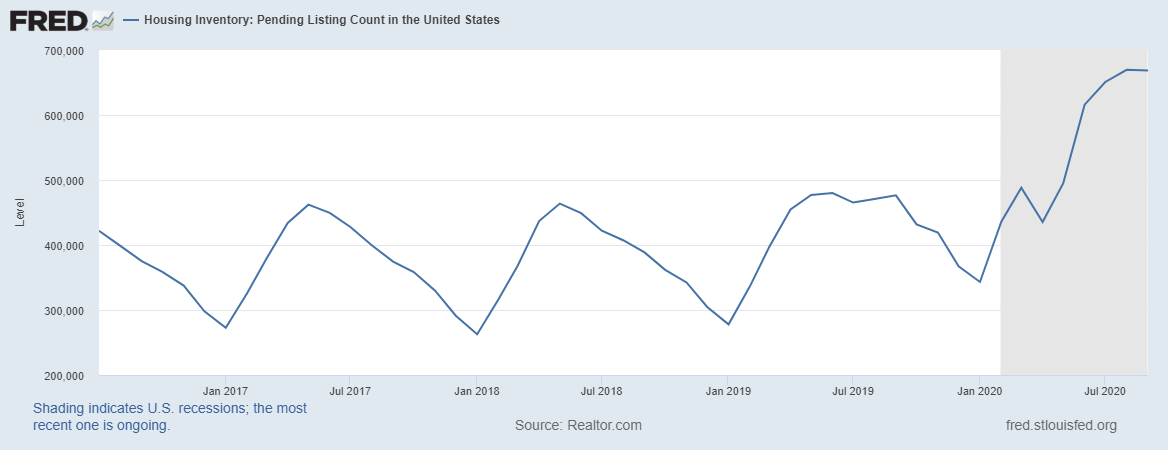
Note that the pending home sales can also be used as a leading indicator of existing home sales. It is leading the home sales because, generally, a real estate contract takes about a month or two to close. Thus, when the contracts are closed, pending home sales become existing home sales. It can be said to offer concrete data on future home sales and the trend in real estate. Broadly, it is a leading indicator for the real estate industry based on the fact that pending home sales data involves signed contracts in real estate.

Source: St, Louis FRED

The pending home sales data is calculated monthly. In the US, for example, pending home sales data is published by the National Association of Realtors (NAR). NAR surveys about 100 Multiple Listing Service (MLS) and large real estate brokers. The MLS is a database tracking property at different stages of the sales cycle. The sample size covers 20% of all transactions, covering up to 50% of the existing home sales. Thus, the pending home sales provide a highly accurate forecast of the existing home sales compared to other housing indicators with lower coverage.

It is important to note that not all pending home sales are closed. It is normal to have a few real estate contracts that fall through or get canceled. However, about 80% of all pending home sales are settled.

Pending home sales index (PHSI) is an index based on the pending home sales. This index is considered more accurate than the aggregate data of the pending home sales. It accounts for 20% of the home contracts that fall through. Its accuracy stems from the fact that it is based on aggregated trends in the pending home sales, thus not skewed by the fallout rate.

Using Pending Home Sales in Analysis

It is important to use the aggregate pending home sales data alongside the pending home sales index. In general, real estate data offers invaluable insight into economic growth. Let’s take an example of increasing the pending home sales index.

Since it typically takes about a month or two for the pending home sales to close, an increase in the numbers shows that households expect to have sufficient funds to complete the sale. An increasing PHSI shows that the number of sellers is increasing as well as the number of buyers. Buyers expect that in the coming months, they will be well-off enough financially to close. Similarly, sellers expecting the proceeds from the sale, are going to be better off financially. Furthermore, the process of selling a home involves realtors, lawyers, and financial advisors who get a commission on the sale for their professional services. Therefore, higher PHSI shows that the economy is expanding.

Home sales rarely involve an all-cash transaction. An increase in the pending home sales signals that households have access to cheaper financing. The cheaper home-purchase financing can only be made possible by the availability of lower interest rates. The presence of a lower interest rate in the economy generally means that more people can afford loans and lines of credit. For consumers, this increases the aggregate demand in the economy, which increases the aggregate demand. Overall, the availability of cheap loans results in economic expansion and the growth of consumer discretionary industries.

For those participating in real estate speculatively, buying and selling a property can be used as a gauge of their economic growth sentiment. When speculative buyers are increasing, they have a positive outlook for the economy and that their property’s value will increase thanks to a future increase in demand. Similarly, when a speculative seller is increasing, they can now fetch more in terms of the value of their property compared to when they bought them. Thus, the current economy is performing better than it was previously. Thus, the pending home sales data can be used to show economic prospects and compare the present economic conditions against the past.

Impact on Currency

As we have seen above, the pending home sales data and the pending home sales index can offer insights into the current economic climate compared to the past and give sentiment about the future. Although it is considered a leading indicator in the real estate sector, pending home sales is regarded as a medium-impact indicator in the forex market. Here are two ways this indicator can potentially impact the currency.

An increasing pending home sales show improving household welfare. It signals the presence of lower unemployment levels and increased aggregate demand in the economy. Furthermore, since people purchase property, expecting them to appreciate, increasing pending home sales gives a positive economic sentiment for the future, which makes the currency appreciate relative to others.

Conversely, it is negative for the currency when pending home sales are on a decline. The decline shows that macroeconomic fundamentals, such as employment, are declining. More so, it indicates a pessimistic economic outlook.

Sources of Data

In the US, the pending home sales data and the pending home sales index are published monthly by the National Association of Realtors. Trading Economics provides a detailed look into the historical pending home sales statistics in the US.

How Pending Home Sales Data Release Affects Forex Price Charts

The most recent data on pending home sales in the US was released on September 30, 2020, at 10.00 AM ET. The release can be accessed at Forex Factory. An in-depth look into the latest pending home sales and the PHSI can be accessed at the NAR website.

The screengrab below is of the monthly pending home sales from Forex Factory. To the right, is a legend that indicates the level of impact the fundamental indicator has on the USD.

As can be seen, the pending home sales data is expected to have a medium impact on the USD upon its release.

The screengrab below shows the most recent change in pending home sales. In August 2020, the US pending home sales increased by 8.8% compared to 5.9% in July. This change was better than the expected 3.1%.

Now, let’s see how this release made an impact on the Forex price charts.

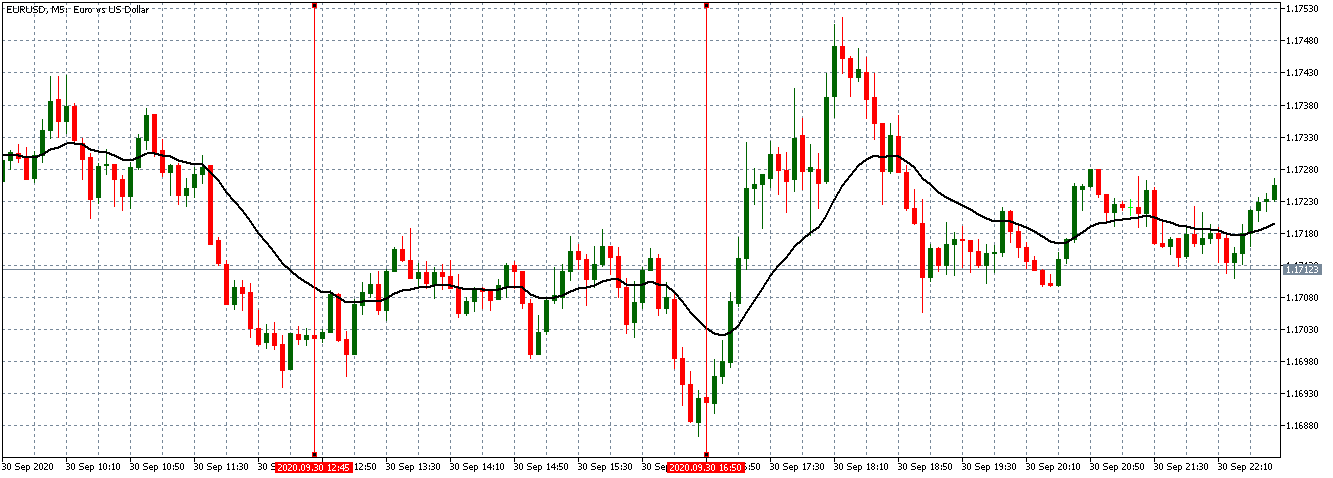
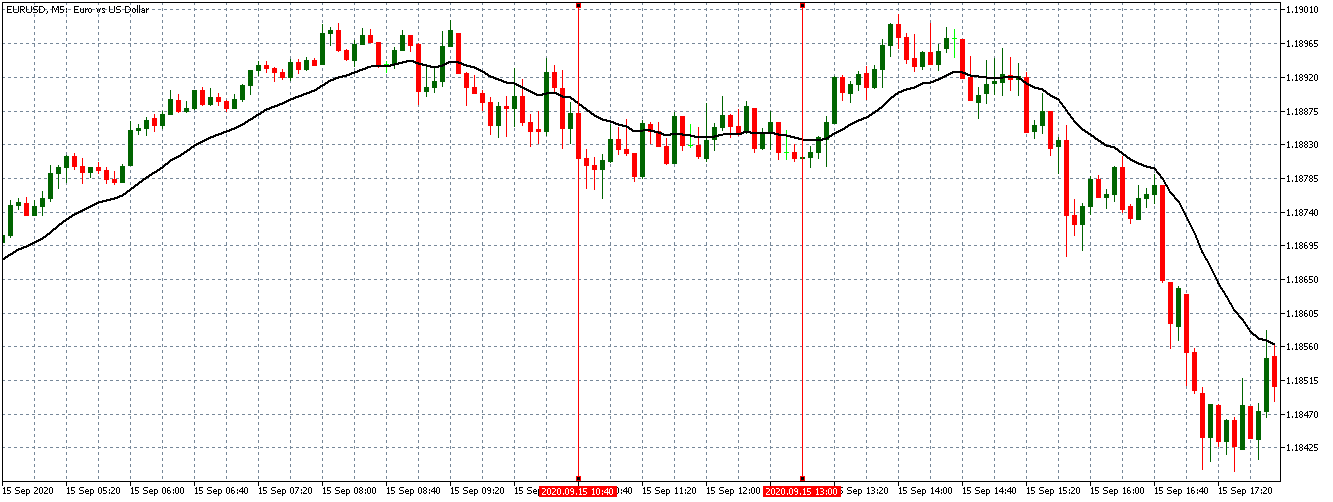
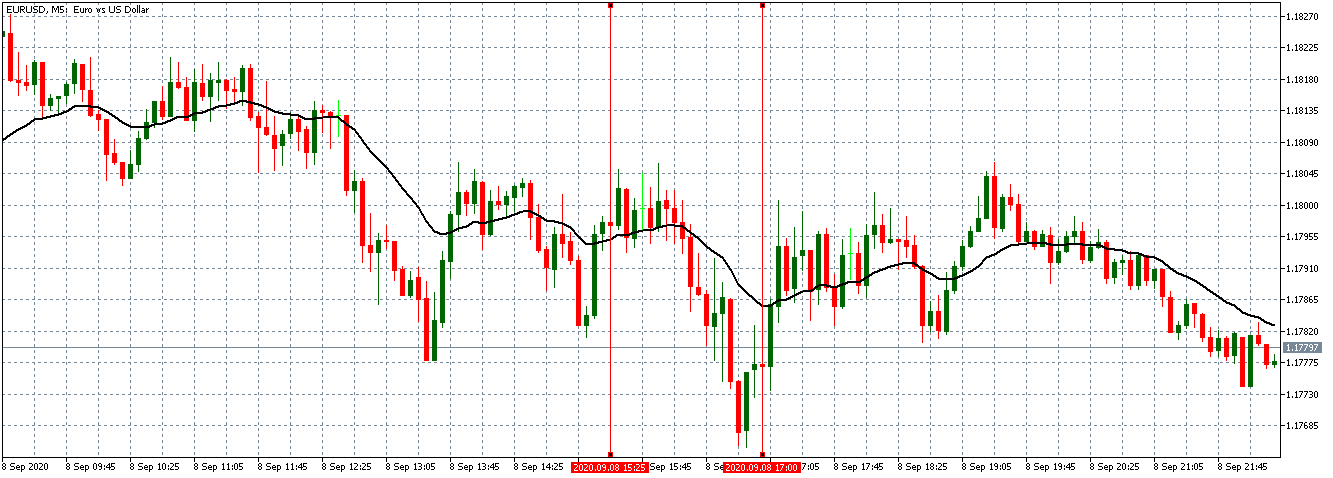
EUR/USD: Before Pending Home Sales Release on September 30, 2020, 
Just Before 10.00 AM ET

The above 5-minute EUR/USD chart shows the pair mostly trading in a neutral pattern before the news release. Twenty minutes before the announcement, the pair adopted a sharp downtrend with candles crossing below a dropping 20-period MA.

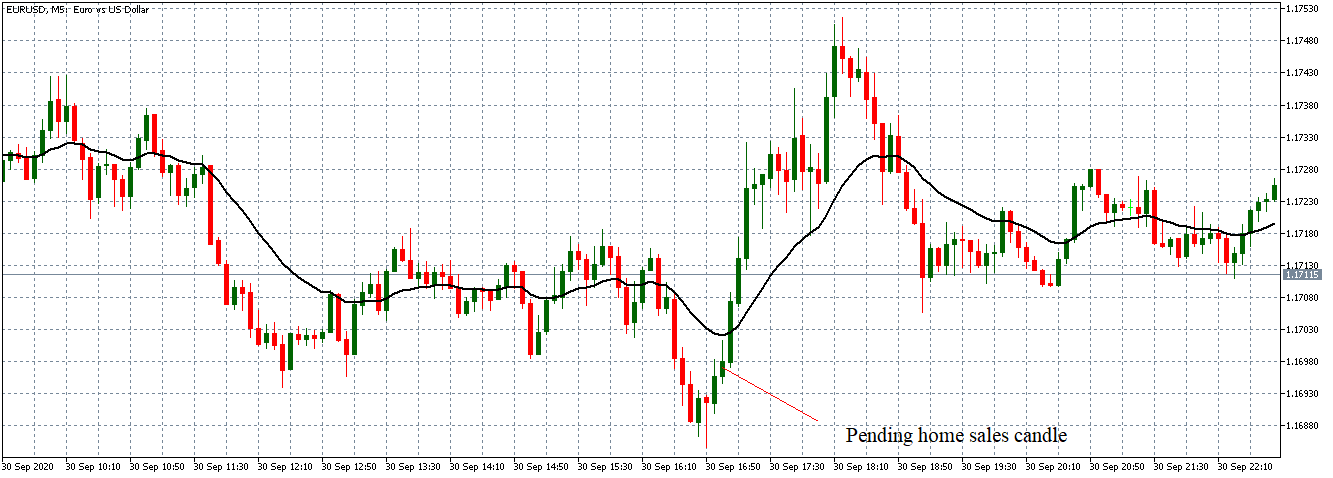
EUR/USD: After Pending Home Sales Release on September 30, 2020, at 10.00 AM ET

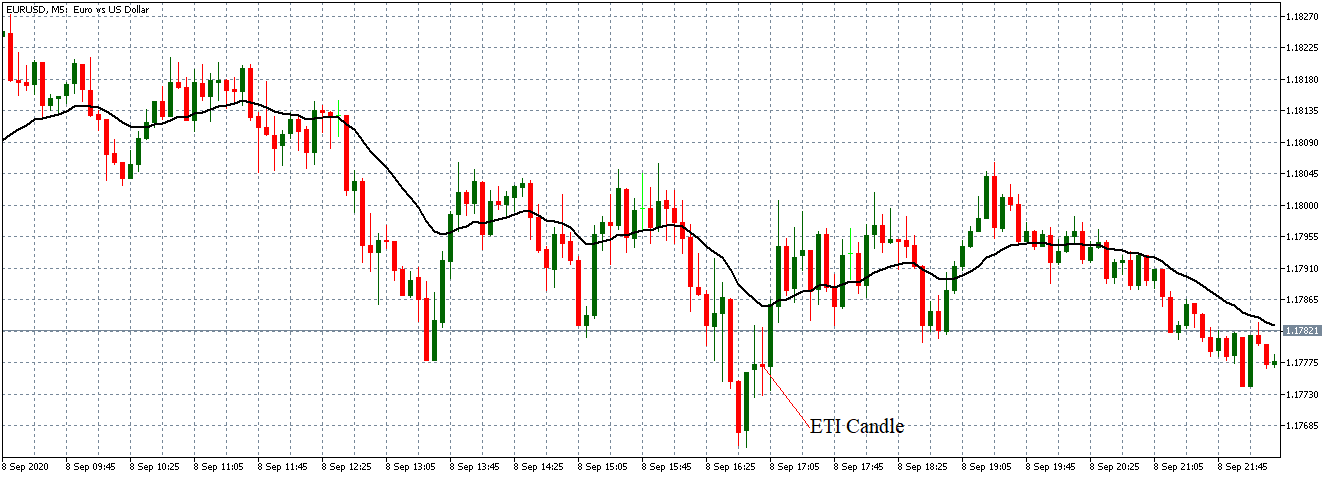
After the news release, the pair formed a 5-minute ‘inverted hammer’ candle. Subsequently, the pair adopted a bullish stance as the candles crossed and formed further above the 20-period MA.

Bottom Line

As seen above, the US’s release pending home sales data did not have any impact on the USD. Therefore, we can conclude that as a fundamental indicator, pending home sales has a negligible impact on the forex market.

Categories
Forex Course

157. What Expectations Do Forex Market Have On The Financial News?

Introduction

Economic releases and news are essential for traders who make trading decisions based on fundamental analysis. Economic news is publicly available as soon as it releases. Therefore, traders can access it from any internet connection enabled device. As economic releases directly affect the currency market, traders must understand how to use it.

Types of Economic News

There are three types of economic news for the currency market- low impact, medium impact, and high impact. Among these types, the high impact news is essential as it immediately impacts a currency pair. Some example of high impact economic news is-

  • Interest rate decision
  • Inflation report
  • Retail Sales
  • PMI
  • GDP
  • Export and Import
  • Foreign Currency Reserve

Besides, the high impact news, medium, and low impact news often create a good movement in the market, which is not very frequent. Therefore, we should stick to high and medium impact news only.

How Economic News Affect the Currency Pair?

There are three significant elements of the economic news that a trader should consider while doing analysis. They are:

  • Previous Release- Previous data is the most recent release used to compare with the current data.
  • Expectation- Before releasing every news, analysts project the data. If the news comes better than expected, it will be shown in green and indicate a positive effect on the currency.
  • Current Release- It is the most important part as trading decisions depend on it. The current release is the data that usually release on a particular day.

Let’s have a look at how to read the news:

  • The current release is better than the Previous release- Good for the currency
  • The current release is better than the expectation- good for the currency
  • The current release is worse than the previous release- bad for the currency
  • The current release is worse than the expectation- bad for the currency.

Image Source: www.forexfactory.com

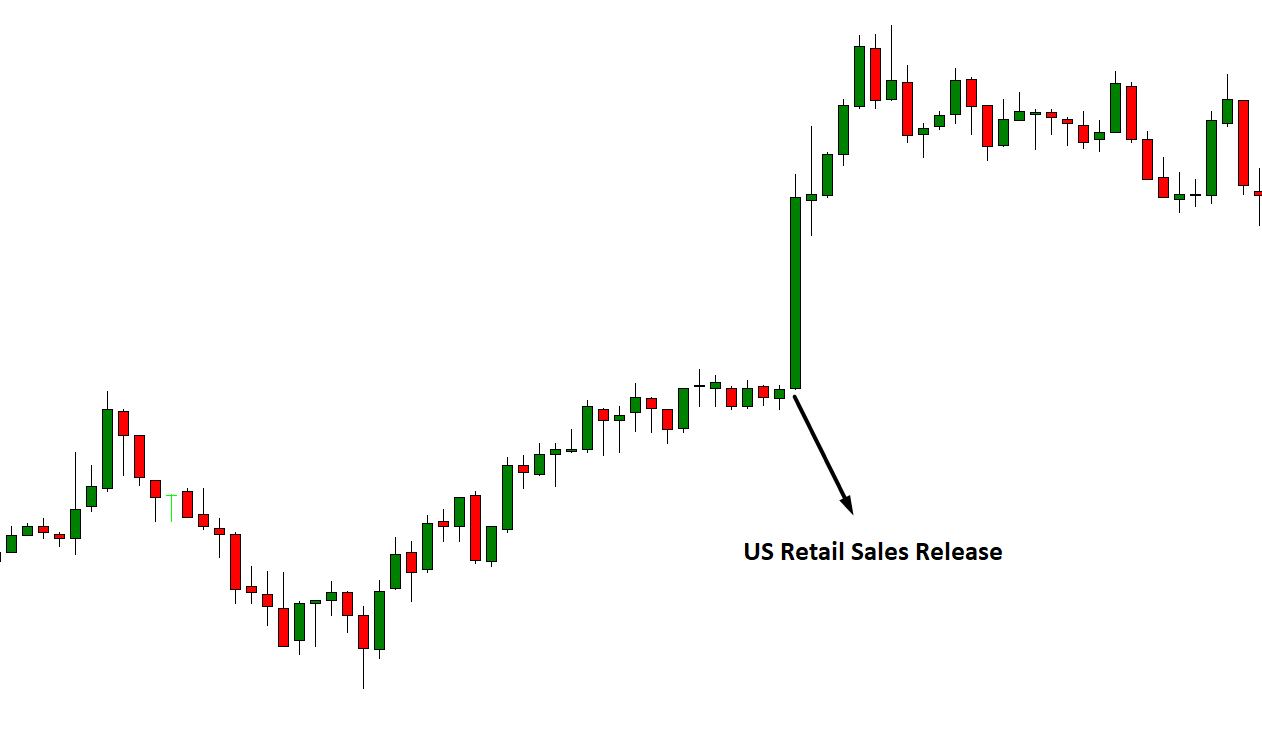
In the above image’s marked area, we can see that the US monthly retail sales came at 1.2%, where the previous data was 8.4%, and the expectation was 2%. As the news massively declined from 8.4% to 1.2%, the US Dollar became weaker than the Euro as indicated in the image below:

Conclusion

As of the above discussion, we can say that better than expected and previous data may positively impact the currency, and weaker than expected data will negatively impact a currency. However, we should consider the overall fundamental outlook of a country to take the ultimate trading decision.

[wp_quiz id=”86431″]
Categories
Forex Assets

Analysing The Costs Involved While Trading The CAD/INR Exotic Currency Pair

Introduction

The CAD/INR pair is considered an exotic currency pair where CAD is the Canadian Dollar, while the INR is the Indian Rupee. This article will cover the basic elements of the CAD/INR pair that you should know before you start trading the pair.

In this pair, the CAD is the base currency, while the INR is the quote currency. Therefore, the price attached to the CAD/INR pair is the amount of INR that can be bought by 1 CAD. For example, if the price of CAD/INR is 55.059, it means that for every 1 CAD, you can get 55.059 INR.

CAD/INR Specification

Spread

The price at which you can buy a currency pair is different from the price at which you can sell the same pair. This difference is the spread. The spread is considered a source of revenue for brokers and a trading cost for forex traders. The spread for the CAD/INR pair is as follows.

ECN: 39 pips | STP: 44 pips

Fees

The trading fee is the commission you pay your forex broker for every trade you make. STP accounts usually have no trading fees, while the fees charged on ECN accounts vary from broker to broker.

Slippage

Slippage represents the difference between the price at which you place a trade and the price at which your broker will execute the trade. Market volatility and the broker’s efficiency determine the amount of slippage.

Trading Range in the CAD/INR Pair

The trading range in forex helps a trader analyze the extent of a currency pair’s fluctuation during a specific timeframe. As measured in pips, this fluctuation can help determine the volatility of the pair and the expected gains or losses. For example, if in the 4-hour timeframe the CAD/INR pair has a volatility of 30 pips, a trader can expect to either gain or lose $54 since the value of 1 pip is $1.8

The table below shows the minimum, average, and maximum volatility of CAD/INR across different timeframes.

The Procedure to assess Pip Ranges

  1. Add the ATR indicator to your chart
  2. Set the period to 1
  3. Add a 200-period SMA to this indicator
  4. Shrink the chart so you can determine a larger period
  5. Select your desired timeframe
  6. Measure the floor level and set this value as the min
  7. Measure the level of the 200-period SMA and set this as the average
  8. Measure the peak levels and set this as Max.

CAD/INR Cost as a Percentage of the Trading Range

The knowledge of the potential costs when trading helps determine the trading strategies to be used. Cost as a percentage of the trading range will help us understand how trading costs vary with volatility under different timeframes.

Total cost = Slippage + Spread + Trading Fee

The tables below show the analyses of percentage costs in both ECN and STP accounts.

ECN Model Account

Spread = 39 | Slippage = 2 | Trading fee = 1

Total cost = 42

STP Model Account

Spread = 44 | Slippage = 2 | Trading fee = 0

Total cost = 46

The Ideal Timeframe to Trade CAD/INR

Depending on your forex trading style, you can use the above analysis to coincide with your trade of the CAD/INR pair with moments of lower trading costs. The 1-hour timeframe for the STP and the ECN accounts has the highest trading costs of 779.66% and 711.86% of the trading range, respectively. Also, notice that the highest costs coincide with the lowest volatility of 3.1 pips.

Trading longer timeframes like the 1-week and the 1-month timeframes are associated with lower costs. However, trading when the CAD/INR pair’s volatility is above average has a lower cost. Another way of reducing trading costs is by using the limit order types, which eliminates the slippage costs. Here’s how it works.

Total cost = Slippage + Spread + Trading fee

= 0 + 39 + 1 = 40

When limit orders are used, the slippage cost becomes zero. Consequently, the trading costs are significantly reduced, with the highest trading cost dropping from 711.86% to 677.97% of the trading range.

Categories
Forex Fundamental Analysis

Everything About ‘Durable Goods Orders’ Macro Economic Indicator

Introduction

Industrial production contributes to over 62% of the jobs in the goods production industry. Therefore, any changes in this sector’s production activity bring forth ripple effects into the overall economy. Owing to the significant role that industrial production plays in the economy, the investment goods bought for use in the industrial sector offer invaluable insights into the changes in the sector. Thus, durable goods orders as an economic indicator can be used to signal economic growth and businesses’ and consumers’ sentiment.

Understanding Durable Goods Orders

Durable goods are expensive and long-lasting items that have a lifespan of at least three years. These goods do not depreciate quickly. They include; heavy-duty machinery used for industrial purposes, computers and telecommunication equipment, raw steel, and transport equipment.

Core durable goods are the totality of durable goods, excluding data from transportation and military orders. The transportation equipment is excluded to ensure smoothening out the effects it would have on the durable goods data as a result of one-time large orders of new vehicles.

Durable goods orders data is, therefore, a monthly survey that tracks the purchase of durable goods. This data is used to assess the prevailing trend in industrial activity.

How to use Durable Goods Orders in Analysis

Since durable goods are expensive and long-lasting, their purchase is made on an occasional basis. For analysis reasons, the durable goods orders are treated as capital expenditure. The durable goods orders are used to signal near-term and future economic prospects. Let’s see what this data tells us about the economy.

Firstly, durable goods are heavy-duty machinery whose assembly and manufacture takes a long time. Therefore, the duration from when the assembly line of these goods begins to the time they are delivered to the buyers shows a period of sustained economic activity.

Capital expenditure in the industrial sector has a multiplier effect. The data on durable goods orders implicitly shows the level of activity in the industries along the supply chain of making and delivering these goods. Higher durable goods orders imply higher commercial activities in the relevant industries, while lower durable goods orders show reduced activities. So, what does this data tell us about the economy? Let’s take the example of increasing durable goods orders.

Higher durable goods orders imply that more jobs are created in the assembly lines, manufacturing, and mining. The resultant increase in employment levels leads to improved living standards and an increase in aggregate demand for consumer products in the economy. The increased aggregate demand for discretionary consumer products will force producers in these sectors to scale up their production, leading to more job creation and economic growth. Thus, the increase in durable goods orders can have both a direct and indirect impact on economic growth and the growth of other consumer industries.

Durable goods are used to further the process of production or service delivery. Therefore, the data on durable goods orders can gauge the sentiment of businesses and consumers. It is fair to say that businesses and consumers purchase durable goods when they are convinced that the economy is on an uptrend. Durable goods orders can thus be used as a testament to improving economic conditions and living standards. It follows the logic that businesses would not be scaling their productions or engaging in capital expenditure if they did not firmly believe that the economy is growing and a future increase in their products’ demand.

Due to their expensive nature, the purchase of durable goods heavily relies on credit financing. Thus, an increase in durable goods orders can be used to show that lending conditions are favorable. This willingness of lenders can be taken as a sign of improved liquidity in the banking sector, which in itself shows that the economy is performing well.

When capital expenditures are made, it is to replace the existing technology with a better one. Therefore, an increase in durable goods orders can be seen as businesses upgrading their current production means. Consequently, improved technology leads to efficiency in the production process and service delivery. This efficiency not only applies to improved quality and quantity of output but also in the allocation of factors of production.

Impact on Currency

In the forex market, the central banks’ perceived monetary policy is the primary mover of exchange rates. Forex traders pay close attention to economic indicators to gauge the health of the economy and speculate on the central banks’ policy decisions. Here’s how the durable goods orders can be used to this end.

Higher durable goods orders are associated with higher employment levels, increased wage growth, and steady growth in the aggregate demand and supply in the economy. When this trend is sustained for an extended period, governments and central banks may have to step in with contractionary monetary and fiscal policies to avoid an overly high inflation rate and an overheating economy. Therefore, sustained growth in the durable goods orders can be seen as a precursor to higher interest rates, which leads to the appreciation of the currency.

Conversely, a continuous decline in durable goods orders is an indication that businesses and consumers have a negative sentiment about the future. This sentiment could result from higher levels of unemployment, dropping levels of aggregate demand, or a stagnating economy. To spur economic growth, expansionary fiscal or monetary policies will be adopted. One such policy is lowering interest rates to encourage borrowing by making the cost of money cheap. Thus, a continuous drop in the durable goods orders can be seen to forestall a drop in the interest rates, which depreciates the currency relative to others.

Source of Information related to Durable Goods Orders

The US Census Bureau collates and publishes the data on the US durable goods orders. An in-depth and historical review of the US’s durable goods orders is found at St. Louis FREDTrading Economics publishes global data on durable goods orders.

We hope you got an understanding of what this Fundamental Indicator is all about. Please let us know if you have any questions in the comments below. Cheers!

Categories
Forex Course

156. Why Interest Rates Matter While Trading Forex Currency Pairs

Introduction

The interest rate is one of the major fundamental indicators of a currency pair. Any increase in interest rate is a positive sign for an economy. However, there are some other factors that a trader should know.

What is the Interest Rate?

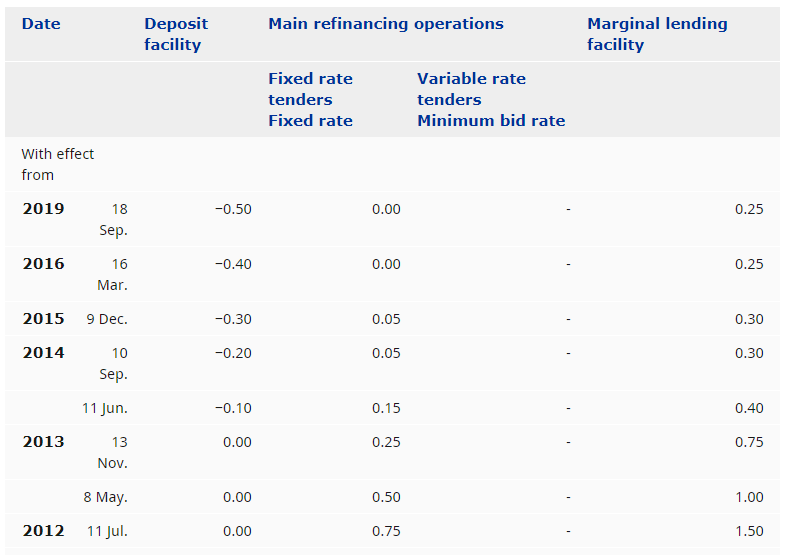
The interest rate is the charge that the Central Bank takes on loans and advances to control the money supply. The interest rate is usually revised quarterly based on the economic condition of a country.

The main aim of changing the interest rate is to control inflation and stabilize the country’s currency exchange rate. The interest rate is one of the most significant fundamental indicators for a country that directly affects the country’s economy both inside and outside.

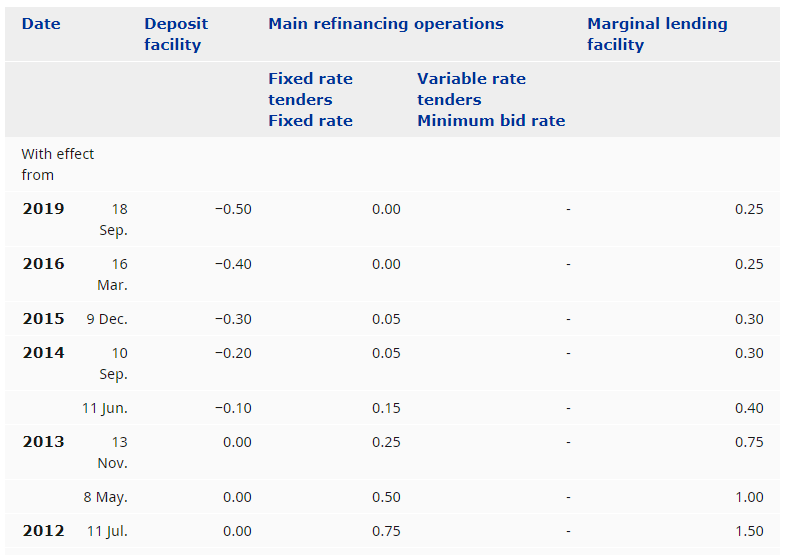
Image Source: https://www.ecb.europa.eu/

When the country’s economic condition is excellent, and the targeted inflation is achieved, the central bank tries to discourage people from taking loans from the Central by increasing the interest rate.

On the other hand, when the economic condition is not right, Central Bank tries to expand the country’s economic activity by attracting people to take more money from the bank with a cheaper interest rate.

How interest Rate Impact on a Currency Pair?

In the forex market, traders usually trade in currency pairs instead of a single currency. Therefore, they should evaluate two separate countries’ economic conditions to determine which country is more reliable. Based on this knowledge, we can say that increasing the country’s interest rate will influence the currency to be strong against other currencies.

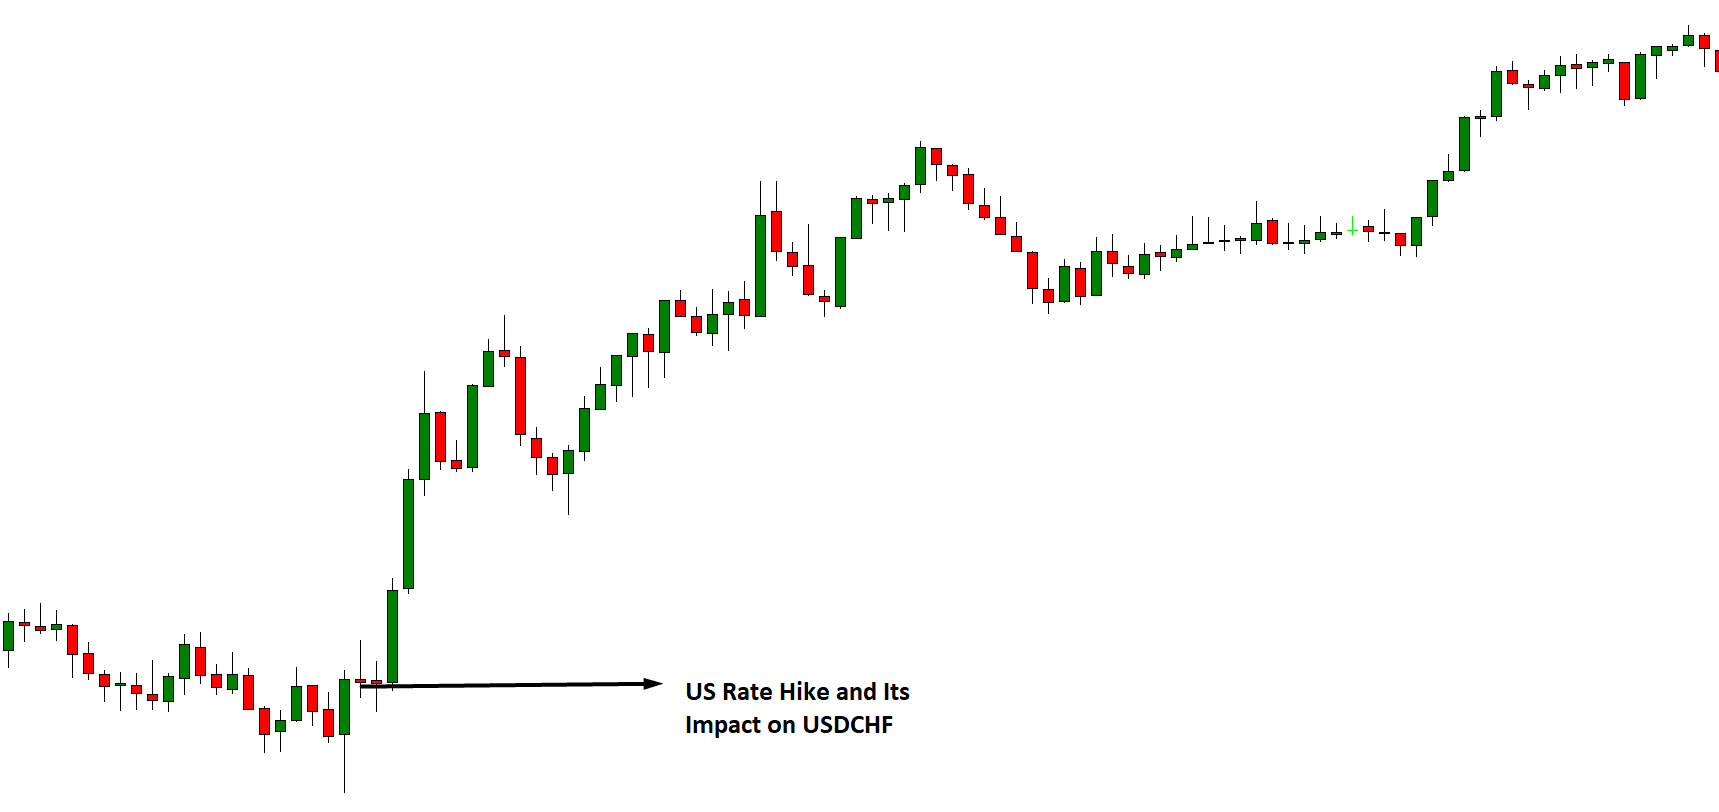
For example, we want to take a trade in the USDCHF pair, and we are waiting for the USD’s interest rate decision. When the news came, we saw that the Federal Reserve increased the interest rate from 2% to 2.5%. As a result, the USD became stronger immediately against the CHF, and the USDCHF goes up.

This is how the interest rate impacts on a currency. However, the opposite reaction might happen when the Federal Reserve decreases the interest rate from 2 % to 1.5% instead of increasing. In that case, the EURUSD might be stronger and move higher.

How to Make a Profit from the Interest Rate Change?

Making money from interest rates is an effective and solid way to trade based on the fundamental analysis. However, as a trader, we should focus on other fundamental releases and events to understand a currency pair’s overall structure. The significant economic releases of a country are interrelated. For example, if the inflation and GDP are good, an increase in interest rate is evident for the central bank.

Therefore, before taking a trade based on the interest, we should focus on what the other fundamental releases are telling about the currency.

Conclusion

After the above discussion, we can say that the interest rate is the most significant fundamental indicator of a currency pair. However, as the forex market consists of several uncertainties, we should focus on money management strongly. We may face some market conditions where the price might react against our expectations. So, the only way to make a consistent growth of our trading balance is to follow strong trade management.

[wp_quiz id=”86408″]
Categories
Forex Fundamental Analysis

Importance Of ‘Existing Home Sales’ Forex Fundamental Indicator

Introduction

In any economy, the real estate market provides insights about households’ sentiment of the future and their present welfare. Policymakers, central bankers, businesses, economic analysts, and individual consumers track real estate data. They do so, to deduce, in one form or another, information about the state of the economy. The Existing Home Sales figure is estimated to account for up to 90% of total home sales. For forex traders, existing-home sales data provides an invaluable insight into the economy.

Understanding Existing Home Sales

Existing homes are homes owned and occupied before being listed in the market. Therefore, existing home sales as an economic indicator show the data on the sale of homes pre-owned and pre-occupied before being listed in the market.

Existing home sales data captures the prices and sales volume of existing homes in a country. It is worth noting that the existing home sales data strictly records transactions that have been completed. This record is unlike the new home sales, which includes data on partial payments and agreements of sale.

Calculating Existing Home Sales

Each month, a survey is done to determine the volume of existing-home sales and their prices. In the US, for example, a survey is done by selecting a nationally representative sample of 160 Boards and Multiple Listing Services. This sample represents about 40% of the total existing-home sales.

A non-seasonally adjusted data on existing home sales is derived by aggregating the raw data from the sample. The aggregated data is then weighted to represent the national existing home sales accurately.

A seasonally adjusted existing home sales data is arrived at by annualizing. This adjustment helps to smoothen out the disparities that arise due to seasons. Here’s how the disparity comes along. Research has shown that home resales are higher during spring and summer and slows down during winter. Therefore, from November to February, the resale of homes is lower. Typically, it is assumed that people tend to search for homes when the weather conditions are more agreeable, thus increasing demand and, with it, prices of homes. This seasonal difference is removed with annualizing, creating a more realistic trend in the existing home sales.

Note that the annualized existing home sales for a particular month show the resales the month represents if the resale pace for that month were to be maintained for 12 consecutive months.

Using Existing Home Sales in Analysis

As an economic indicator, existing home sales are regarded as a lagging indicator. However, since the data shows the changes in the number of home resales and the prices, it can provide invaluable insight into the trend of households’ welfare and the general economic health.

Most of the transactions in real estate involve mortgages. Let’s take an example of an increase in existing home sales shows that more households can afford and service mortgages. This increase could be for a number of reasons.

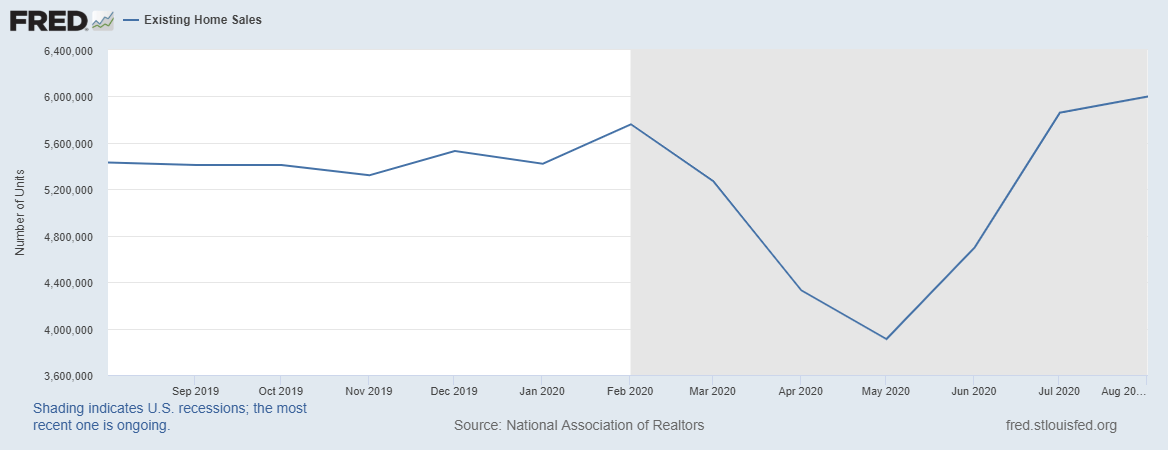
Source: St. Louis FRED

Firstly, it could show that the welfare of the households has improved. The improvement could result from an increase in disposable income or an increase in the rate of employment. Increasing disposable income means that households have more money to invest in the real estate market, whether speculatively or not. An increase in the employment levels, on the other hand, means that households who previously could not afford to buy a home are now eligible for mortgages. I both these instances, the existing home sales data shows that the economy is expanding and the welfare of households is improved.

Secondly, increasing home sales imply that interest rates are low, allowing more households to borrow cheaply. The availability of lower interest rates shows that the demand in the economy is bound to increase, which leads to economic growth.

Thirdly, since existing home sales involve the current homeowners selling their property, it means that they believe they can get better rates in the current market. This is especially true for speculative investors who participate in real estate to profit from price fluctuations over time. Now, a speculative homeowner buys a home at a lower price to resell when prices are higher. An increase in the price of homes means the economy is currently performing better than it previously did. Thus, an increase in the existing home sales shows economic improvement.

Similarly, current speculating home buyers offer the sentiment that they believe the economy is going to perform better in the near term. Therefore, existing-home sales data can be used to show periods of economic recoveries and forestall an impending recession.

Source: St. Louis FRED

Impact on Currency

As we have seen, existing home sales can be used to gauge how the economy is performing. Although it is lagging, it can be used as a leading indicator for the aggregate demand in the economy as well as the general economic health. Let’s see how this analysis affects the forex market.

An increase in the existing home sales shows that the economy has been performing well. It also indicates that households’ welfare is improving, with higher employment levels and increased disposable income, which can further influence the growth of the economy. Similarly, since an increase in the existing home sales offers the sentiment of a perceived economic improvement, it translates to the increasing value of the country’s currency.

Conversely, a country’s currency will depreciate as the existing home sales reduce. Continually dropping existing home sales imply worsening economic conditions for the households. These adverse conditions could result from increasing unemployment levels, higher income taxes, or general anticipation of challenging economic conditions that force households to cut back on discretionary expenditures.

Sources of Data

The National Association of Realtors is responsible for the survey and the publication of the US existing home sales data. An in-depth and historical review of the existing home sales data, both seasonally and non-seasonally adjusted, is published by St. Louis FRED. Trading Economics publishes global existing home sales data.

How the Monthly Existing Home Sales Data Release Affects Forex Price Charts

The most recent existing-home sales data in the US was released on September 22, 2020, at 10.00 AM ET and can be accessed at Forex Factory.

The screengrab below is of the monthly existing home sales from Forex Factory. To the right is a legend that indicates the level of impact the fundamental indicator has on the USD.

As can be seen, this is a low-impact indicator.

In August 2020, existing home sales were 6m compared to 5.86m in July. The sales were lower than analysts’ expectations of 6.05m.

Now, let’s see how this release made an impact on the Forex price charts.

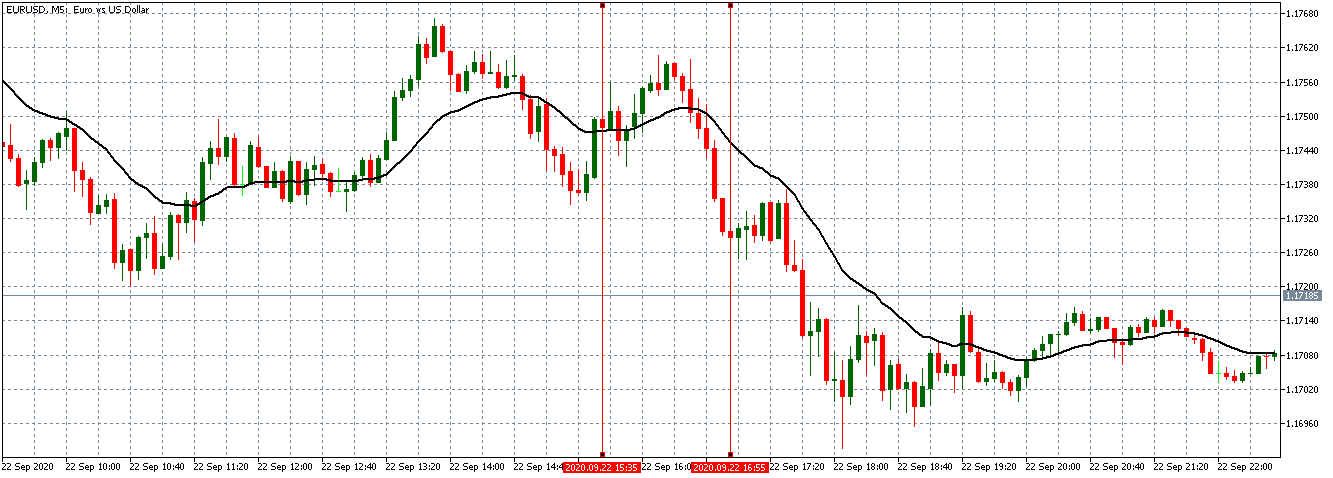
EUR/USD: Before Existing Home Sales Release on September 22, 2020, 
Just Before 10.00 AM ET

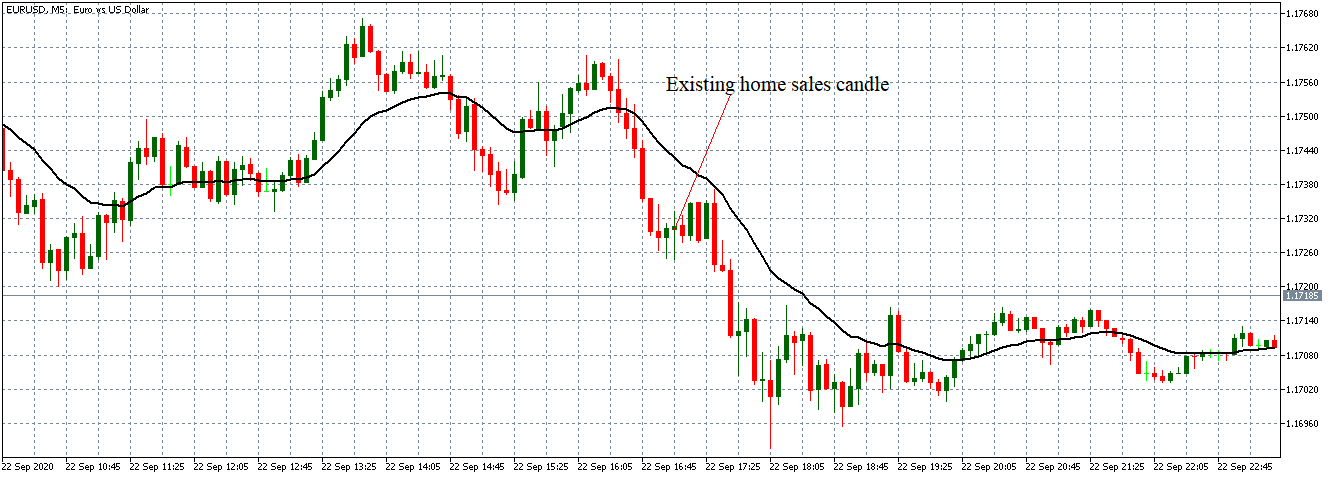
The pair was trading in a new-found steady downtrend. This trend can be seen with the 20-period MA steeply falling with candles forming further below it.

EUR/USD: After Existing Home Sales Release on September 22, 2020, at 10.00 AM ET

After the news release, the pair formed a 5-minute ‘Doji’ candle. Subsequently, the pair continued to trade in the earlier observed downtrend.

Bottom Line

As expected, the existing home sales release had a negligible effect on the EUR/USD pair. Therefore, we conclude that in the forex market, existing-home sales data is a negligible indicator.

Categories
Forex Assets

Asset Analysis – Trading The CAD/PHP Forex Currency Pair

Introduction

CAD/PHP is an exotic Forex currency pair where CAD is the Canadian Dollar while PHP is the Philippine Peso, the Philippines’ official currency. This article will cover fundamental aspects that you should know about CAD/PHP before you start trading the pair.

Understanding CAD/PHP

In this currency pair, the CAD is the base currency, and the PHP is the quote currency. The CAD/PHP pair price represents the quantity of the PHP that can be bought by 1 CAD. If the CAD/PHP price is 36.181, it means that for every 1 CAD you have, you can buy 36.181 PHP.

CAD/PHP Specification

Spread

In forex trading, the spread is the difference in the value at which a trader can buy a currency pair and the price at which they can sell it.

ECN: 10 pips | STP: 15 pips

Fees

There are no trading fees associated with STP accounts. However, for the ECN accounts, the trading fees that you will incur per transaction are determined by your forex broker.

Slippage

When trading forex, slippage occurs when there is a difference between the price at which you place your trade and the price at which your broker executes it. Slippage in forex frequently happens at times of higher volatility or when significantly larger orders are made.

Trading Range in the CAD/PHP Pair

Forex traders should know how a given currency pair changes within different timeframes. This change in terms of pips is referred to as the trading range. It is used to analyze the historical volatility of a given pair across different timeframes. Therefore, the trading range can be used to determine the amount of profit that a trader should expect to earn.

The Procedure to assess Pip Ranges

  1. Add the ATR indicator to your chart.
  2. Set the period to 1
  3. Add a 200-period SMA to this indicator.
  4. Shrink the chart so you can determine a larger period
  5. Select your desired timeframe
  6. Measure the floor level and set this value as the min
  7. Measure the level of the 200-period SMA and set this as the average
  8. Measure the peak levels and set this as Max.

CAD/PHP Cost as a Percentage of the Trading Range

Slippage, spread, and brokers’ fees amount to trading costs to a forex trader.

Total cost = Slippage + Spread + Trading Fee

Therefore, forex traders should be aware of how these costs vary during different timeframes depending on the pip change of the currency they trade.

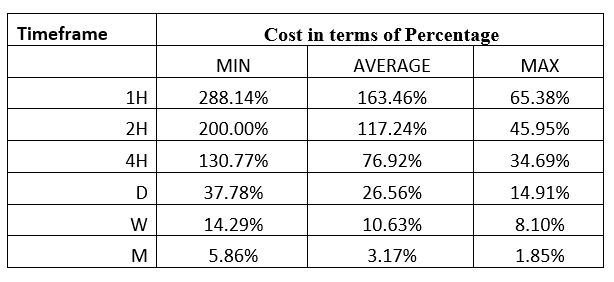
The tables below are of the percentage costs that can be expected when trading the CAD/PHP pair under the ECN and STP account types. The costs are expressed as pips.

ECN Model Account

Spread = 10 | Slippage = 2 | Trading fee = 1

Total cost = 13

STP Model Account

Spread = 15 | Slippage = 2 | Trading fee = 0

Total cost = 17

The Ideal Timeframe to Trade CAD/PHP

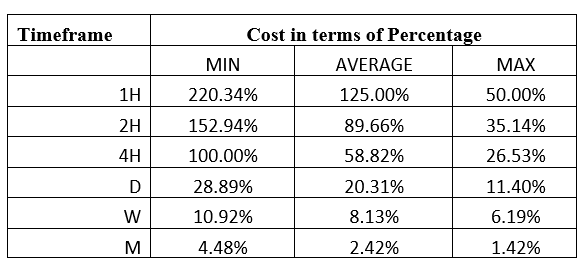
From the above trading range cost analysis, the most cost is incurred at the 1H timeframe at 220.34% for the ECN account and 288.14% for the STP account. These costs imply that it is not ideal to trade during times of low volatility of about 2.3 pips. However, the trading costs associated with the 1H, 2H, 4H, and the 1D timeframes are lower when the market volatility is above average. Intraday traders can time their entry when the volatility of the CAD/PHP is above average.

The longer timeframes for both types of accounts have lower trading costs associated with them. Thus, longer-term traders can get to enjoy lower costs.

Forex traders can also significantly reduce their trading costs by employing limit order types to ensure they do not experience slippage costs. Let’s look at the total costs when slippage is zero with the ECN account.

Total cost = Slippage + Spread + Trading fee

= 0 + 10 + 1 =11

With the ECN account, the highest trading cost reduces from 220.334% to 169.49%, showing that using the limit order types significantly reduces the trading costs.

Categories
Forex Course

155. Getting Started With Forex Fundamental Analysis

Introduction

Fundamental analysis and technical analysis are an essential part of Forex trading. A Forex trader cannot be a profitable trader unless he knows this analysis. Fundamental analysis provides a logical reason for the upcoming movement of a currency pair based on economic releases. Traders evaluate these releases to determine the exact movement of a currency pair.

What is Fundamental Analysis?

According to finance and accounting, Fundamental analysis is the process of analyzing the business’s financial statement, including the competitor and market analysis. Moreover, it considers the core feature of a country’s macroeconomic factor, including the interest rate, inflation, GDP, manufacturing index, export, import, etc.

However, in forex trading, the fundamental analysis focuses on macro-economic factors mostly. The currency pair in a forex market represents the economy of two separate countries. In fundamental analysis, traders usually focus on major economic events and releases and their impact on a currency pair. Moreover, most professional traders consider both technical and fundamental analysis to get the best output from the market.

Elements of Fundamental Analysis

The fundamental analysis has two major elements- the fundamental releases and the fundamental events.

The Fundamental Releases

Fundamental releases are economic news of releases of a country that is published at regular intervals. Among the fundamental releases, the primary 4 economic releases are most important as it creates an immediate impact on a currency pair. Let’s have a look at four major economic releases:

  • Interest rate: The interest rate is how much we have to pay to the central bank if we take any loan. Central banks raise the interest rate if the economic condition is excellent. On the other hand, the central bank reduces interest rates if the economic condition is terrible.

Image Source: https://www.ecb.europa.eu/

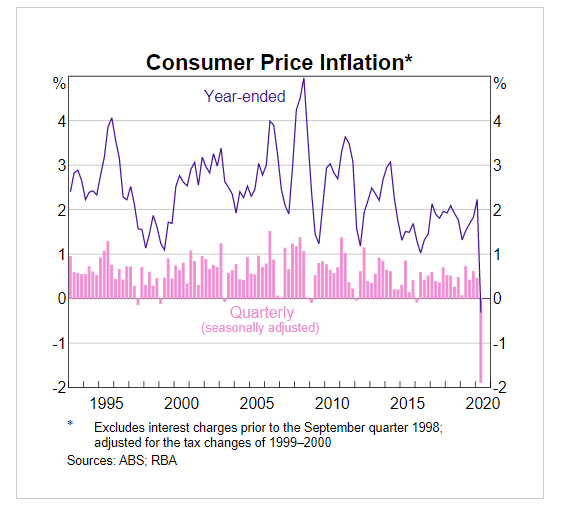
  • Inflation Rate: Inflation is the buying power of the money. The increase in inflation indicates a rise in the consumer product’s price that reduces the buying power of money. Any increase in the inflation rate is terrible for the economy.

Image Source: RBA

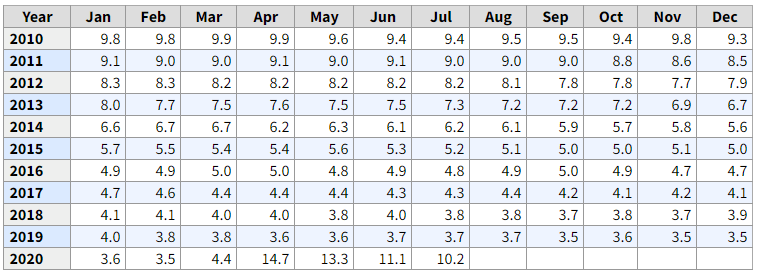
  • Gross Domestic Product: Gross Domestic Product or GDP refers to the country’s products and services’ total value. Any increase in GDP is positive for a particular currency.
  • Employment: The number of employed and unemployed persons for a country works as a crucial fundamental indicator. Any decrease in employment is bad for the economy, and any increase in employment is reasonable.

Image source: https://www.bankofcanada.ca/

Fundamental Events

Besides fundamental releases, some essential fundamental events put a significant impact on a currency pair as mentioned below:

  • Central Bank Meeting: Central of a country meets once a quarter and discusses its economic condition. Any dovish tone negatively impacts the currency, while a hawkish tone creates a positive impact.
  • Geopolitical Events: There is some condition when one country meets another country to discuss the trade deal or conflict. Any positive news from a country’s geopolitical event may create a bullish momentum of the country’s currency.

In fundamental analysis, traders usually evaluate these releases and events to measure the strength and weaknesses of a currency pair.

Conclusion 

Traders usually gather recent economic releases and compare the result with the previous result. Any better than expected result indicates a buying opportunity on a particular currency. On the other hand, traders often evaluate fundamental releases to measure the volatility of a currency pair.

[wp_quiz id=”86400″]
Categories
Forex Signals

GBPUSD Swing Failure Sell

Categories
Forex Course

154. Understanding Hawkish and Dovish Central Banks

Introduction

The movement in a currency pair depends on several factors. Hawkish and Dovish Central bank is one of them. Besides economic releases, there are some events where Central provides an outlook and projection of the economy. Therefore, if the projection is excellent, it will create a positive impact on the currency market. If the projection is terrible, it will create a negative impact on the currency market.

What is Hawkish Central Bank?

If the economic condition is good, the central bank will raise the interest rate to achieve the inflation target. The hawkish central bank means providing a positive statement regarding the country’s present and upcoming economic conditions, like the economy is getting stable or the inflation is under control.

Let’s say the US economy is getting stronger with a decreased unemployment rate and the controlled inflation target. In this situation, the central bank will provide an official statement saying that the economic condition is favorable, known as the hawkish tone.

What is the Dovish Central bank?

If the economic condition is wrong, the central bank will cut the interest rate and provide a dovish tone. The dovish central bank means providing an outlook of the economy, stating that the economy is facing difficulty to achieve the economic goal.

Let’s say that the European economy is struggling to achieve the targeted inflation level. Moreover, the unemployment rate is increasing. In this situation, the central bank is likely to provide a dovish tone starting that it is planning for a rate cut.

However, the dovish and hawkish tone might cover several factors, as mentioned in the table below:

Decision

Hawkish

Dovish

Objective Reduce inflation Stimulate the economy
Monetary Policy Tighten Loosen
Economic Growth Projection Strong Weak
Current Inflation increasing Decreasing
Interest Rate Increase Decrease
Currency Effect Strong Weak

How Hawkish and Dovish Tone Affect the Forex Market

The hawkish and dovish central bank has both long term and short term impact on the currency market. If the US Federal Reserve provides a hawkish tone, we might see the US Dollar become stronger against most currencies. Therefore, if we want to trade on a short term basis, we can move to the 5-minute chart and take trades based on a suitable trading strategy.

Moreover, the hawkish or dovish tone will indicate the overall outlook of a country’s economy that might help traders understand the upcoming market direction. For example, suppose the CPI, GDP, export-import, and other fundamental indicators are favorable. In that case, the central bank will provide a hawkish tone, and traders can take trades in a specific direction until there is a dovish tone.

Conclusion

Hawkish and dovish central banks directly affect the price of a currency pair; therefore, traders should keep an eye on the economic calendar to know when the event will happen. Moreover, during the central bank meeting and press conference, the market becomes volatile, affecting running trades. Moreover, the central bank releases a note after the website’s meeting where traders can read to know the dovish and hawkish tone.

[wp_quiz id=”86379″]
Categories
Forex Fundamental Analysis

What Should You Know About ‘Public Sector Net Borrowing’ Forex Fundamental Indicator

Introduction

Every government runs a budget. It is rare to find a scenario where a government has a balanced budget, i.e., its revenues match expenditures. Economists, policymakers, financial analysts, and consumers pay close attention to budget analysis figures. This interest in the budget is helpful to determine if the government is running a surplus or deficit. This information is vital in determining the country’s global credit rating, which will impact future investment decision-making, trade, and value of the currency.

Understanding Public Sector Net Borrowing

Public sector net borrowing refers to the government budget deficit. The budget deficit occurs when the income earned by the government is less than the public expenditures. Thus, the government can be said to be spending more than it collects in the form of taxes and trade. Governments fund their budgets, primarily using debt and taxation. While different governments have different lines of expenditures, they can all be summed up under three categories: current expenditures, capital expenditures, and transfer payments.

The budget deficits run by governments can tell us a lot about the health of the economy and possibly the cost of future funding. The budget report might be a complicated and tedious document for the average forex trader to analyze in its entirety. Thus, while there is a relationship between budget deficits and the economy’s health, it is advisable to compare the budget deficits with other economic indicators to get the full picture.

Increasing the budget deficit can tell us two things, either revenue collection is decreasing or the government expenditure is increasing rapidly. Here’s a look at how the budget deficit occurs. It starts with a decline in revenue. It is worth noting that exceedingly high budget deficits are connected to worsening economic conditions. When the economy is performing poorly, job losses become prevalent, leading to decreased aggregate demand forcing most companies to scale down while some discretionary consumer firms collapse entirely. Consequently, fewer people pay income tax, and corporate tax declines since most companies are making losses or bankrupt.

Naturally, most people will have to depend on social security programs to get essential needs. This overdependency forces the government to increase its expenditure on such programs. Furthermore, to bring the economy from recession, the government will be forced to increase capital expenditure to create more jobs and spur demand in the economy. Expansionary monetary policies, such as lowering interest rates, can also be used to make cheap loans available to the public.

Using Public Sector Net Borrowing in Analysis

Increasing budget deficit implies that the economy is slowing down, and the government is attempting to revive it. Budget deficits differ for different countries and may not necessarily give the entire picture of the economy’s health. Therefore, it is prudent to combine budget deficit analysis with the analysis of other fundamental economic indicators to determine if the expanding budget deficit is justifiable. For example, using a combination of unemployment levels and the aggressive government expenditure is creating the intended multiplier effect in the economy. More so, it can be used as a scorecard for the government’s fiscal policies’ efficiency and the public sector financial management.

With this strategy, we can spot if the budgetary allocations are going into viable capital expenditures or being spent on non-income generating activities such as paying for a bloated civil service wage. Furthermore, this approach can help stem out corruption in the public sector and seal any public monies’ leakages.

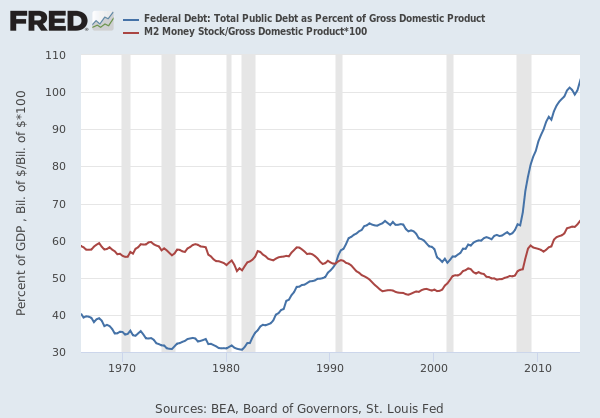
Source: St. Louis FRED

If the government employs expansionary fiscal policies year after year, it may result in a continually increasing inflation rate. Pumping more money into the economy continually increases the rate of inflation. In the flow of income, government spending is an injection. The resultant increase in the aggregate demand drives up prices since demand changes faster than producers can increase their production. It may be more challenging to keep the rising inflation in check if the central banks do not counter the expansionary policies. If the central banks do not implement contractionary monetary policies, the resultant inflation will distort the real wage and real interest rate levels in the economy.

Impact on Currency

As we mentioned earlier, forex traders should analyze the public sector net borrowing data along with other fundamental indicators to get a more comprehensive outlook of the economy. However, here is how the budget deficit affects the forex market.

An expanding public sector net borrowing is negative for the currency. An increasing budget deficit means that the government has to rely heavily on debt to fund its expenditure. With debt accumulation, repayment burden, especially the annual interest rates, weighs heavily on the revenues. If this trend persists, a significant portion of the government’s revenues will end up being used for debt servicing instead of development projects. The government may also be forced to restructure its debts, which come with increased costs. More so, if the growth of debt exceeds that of GDP, it would imply that the budget deficit is reaching unsustainable levels.

Source: St, Louis FRED

In the international markets, the country’s credit ratings will deteriorate. The country’s bonds may be downgraded from investment grade to junk bonds. Consequently, taking debt from the international markets will be more expensive since investors will demand a premium for taking higher risks. Borrowing from the domestic markets using treasury bills will be expensive since investors will demand higher discounts. Similarly, multilateral lenders will insist that the government implement a series of stringent austerity measures to qualify for loans and grants. All these factors come with severe economic and financial consequences for the country.

Sources of Data

In the United Kingdom, the Office for National Statistics (ONS) publishes the UK public sector net borrowing in its monthly Public Sector Finances reportTrading Economics publishes an in-depth review of the UK’s public sector net borrowing along with historical figures. A list of a country’s debt to GDP is also available at Trading Economics.

How Public Sector Net Borrowing Data Release Affects Forex Price Charts

The most recent release of the UK’s public sector net borrowing was on September 25, 2020, at 6.00 AM GMT and can be accessed at Investing.com.

The screengrab below is of the monthly UK public sector net borrowing from Investing.com. To the right, we can find a legend that indicates the level of impact this fundamental indicator has on the GBP.

As can be seen, this low volatility is expected.

In August 2020, UK’s public sector net borrowing worsened to 35.2B from 14.72B in July. This data was worse than analysts’ expectations of 35.05B.

Now, let’s see how this release made an impact on the Forex price charts.

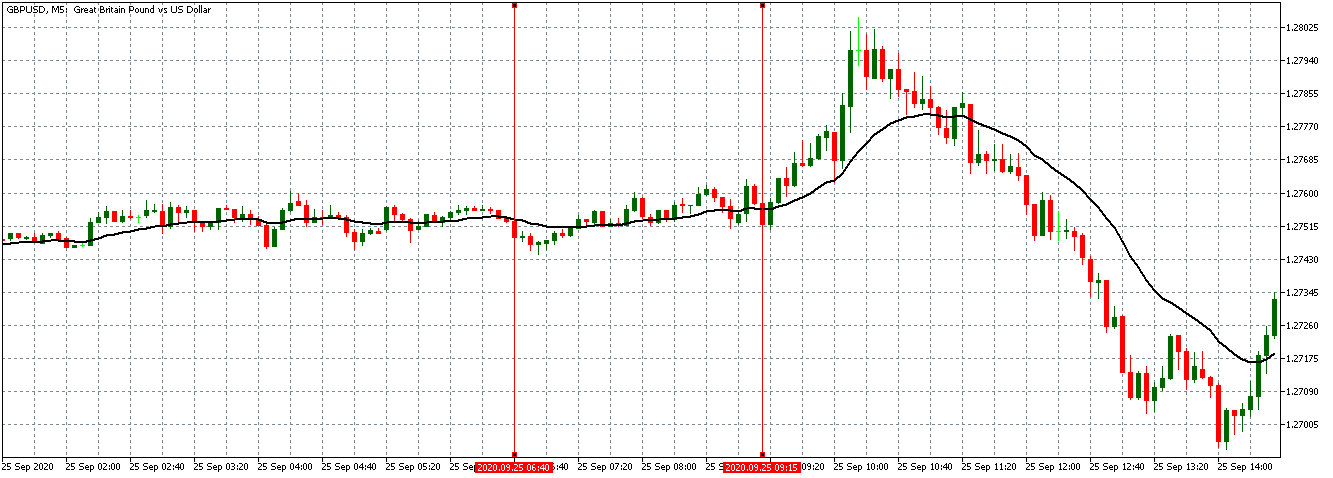
GBP/USD: Before Public Sector Net Borrowing Release on September 25, 2020,
Just Before 6.00 AM GMT

Before the news release, the pair was trading in a neutral trend as shown by the above 5-minute GBP/USD chart. The 20-period MA was flattened with candles forming just around it.

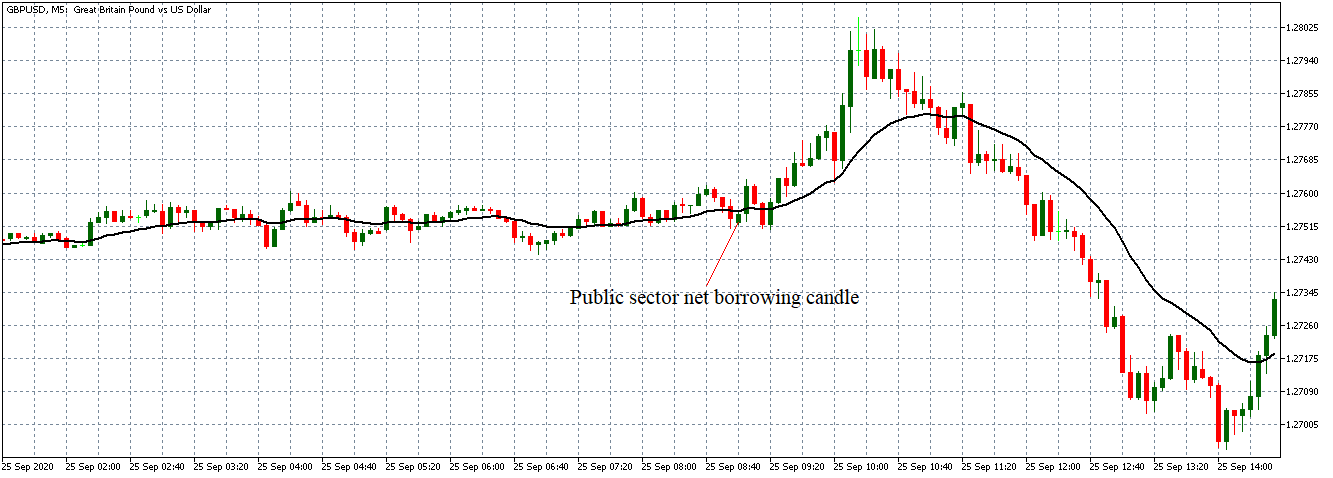
GBP/USD: After Public Sector Net Borrowing Release on September 25, 2020, 
at 6.00 AM GMT

The pair formed a 5-minute bullish candle after the data release. This trend is contrary to the expected negative impact on GBP. Consequently, the pair adopted a bullish stance as the 20-period MA started rising with candles forming above it.

Although the Public Sector Net Borrowing is considered a vital indicator of economic health, public sector net borrowing data has an insignificant impact on the forex price charts.

Categories
Forex Signals

USDCAD Breakout Retest Buy

Categories
Forex Course

153. The Affect Of Monetary Policy On the Forex Market

Introduction

Fundamental analysis is one of the most reliable forex trading strategies in the world that considers economic releases and events. In fundamental analysis, many indicators provide a possibility of upcoming movement in a currency pair. Besides the economic release, some events like monetary policy decisions create an immediate impact on a currency pair.

What is Monetary Policy?

Monetary policy is an action or decision taken by the central bank to control the money supply and achieve the economic sustainability and macroeconomic goal. Every country has a strategic goal based on the current performance and upcoming economic growth of the economy. Therefore, most of the central bank changes the interest rate based on the economic condition.

Usually, the central bank sits quarterly for a monetary policy meeting to discuss the following four core areas:

  • Guideline for the money market
  • Interest rate decision.
  • Monetary policy measurement.
  • The outlook of the economic and financial developments.

How Monetary Policy Affects the Forex Market?

In a monetary policy meeting, the central bank discusses the present economic condition of a country. Therefore, any hawkish tone may create an immediate bullish impact on a particular currency. On the other hand, a dovish tone may create an immediate negative impact on a particular currency in any trading pair.

Besides the immediate effect, there is a long-term impact on the price of a currency pair. We know that any strength in an economy indicates a stronger currency. For example, if the ECB (European Central Bank) provides some consecutive outlook of the European economy saying that the inflation is under control, and the interest rate increased, which is likely to increase again in the next quarter. In that case, the influential European economy may create a Bullish impact on EURUSD, EURAUD, or EURJPY pair.

Moreover, there is some case where the central bank cut the interest rate where traders and analysts were expecting a rate hike. In this scenario, investors may shock at the news, and the effect might be stronger than before.

How to Trade Based on Monetary Policy Statement?

There is two way to trade based on the monetary policy decision. The first one is based on the immediate market effect, which is known as news trading. On the other hand, traders can evaluate the economic condition based on the recent monetary policy statement and see how the economy is growing in the long run. Based on this market scenario, traders can find a long term direction in the market based on economic performance as per the monetary policy statement.

Another way of trading based on the monetary policy decision is the fundamental divergence. If one fundamental indicator does not support another fundamental indicator, it creates fundamental divergence. For example, the US interest rate is increasing based on the strong employment report, but inflation does not support the rate hike. In this situation, traders can take trades with the possibility that the rate hike’s effect will not sustain.

Summary

Let’s summarize the effect of monetary policy in the forex market:

  • Monetary policy meeting happens quarterly where the central bank takes interest rate decision.
  • In the monetary policy meeting, the central bank provides an outlook of the economic and financial developments.
  • A hawkish tone makes the currency stronger, while the dovish tone makes the currency weaker.
  • Traders can identify the fundamental divergence based on the decision on monetary policy meeting.
[wp_quiz id=”86369″]
Categories
Forex Signals

USDJPY Swing Failure Buy

Categories
Forex Course

152. Knowing The Fundamental Factors That Affect The Currency Values

Introduction

Many fundamental factors affect currency value. Therefore, whether we trade based on technical analysis fundamental analysis, we should know these factors to understand the currency markets.

Important Fundamental Factors That Affect Currency Values

Fundamental factors are economic releases and events that have a direct impact on currency value. If we want to trade based on fundamental analysis, we should focus on these releases and make a decision based on the result. Let’s have a look at the important fundamental factors that affect currency values

Interest Rate

Interest rate is the amount that a central bank charges if anyone takes loans from the bank. Central banks change the interest rate to control the country’s money supply; therefore, it directly affects the currency value.

Inflation Rate

Inflation is the buying power of money. Lower inflation means higher buying power, and higher inflation, the lower buying power.

Consumer Price Index (CPI)

CPI or CPI inflation is the price of consumer needs. Any increase in CPI is bad for the currency, while a decrease in CPI is good for the currency.

Producer Price Index (PPI)

PPI is the price of products or elements of businesses. An increase in PPI means businesses need additional money to buy raw materials that may increase the finish product rate.

Retail Sales

Retail sales indicate the number of products and services bought by consumers. An increase in retail sales indicates higher consumer activity in the market that is good for the currency value.

Foreign Exchange reserve

Foreign exchange reserve is the amount of money that is reserved in the central bank. An increase in foreign reserves is positive for a country’s economy and currency value.

Non-Farm Payroll (NFP)

On the first Friday of every month, US Labor Statistics releases the number of unemployed persons in the USA. As the US dollar is the most used currency globally, any change in NFP affects the overall forex market.

Central Bank Meets

In every quarter, central banks of every country provide an outlook of the domestic and international economy. In this meeting, any hawkish tone creates a positive impact on the currency value, while any dovish tone creates a negative impact on the currency value. We should keep an eye on how central banks are reacting to the central banks meeting to get an outlook of the currency value.

Conclusion

Besides the above-mentioned fundamental factors, there is a political movement, trade natural disaster, etc. also impacts the currency market. Moreover, in an uncertain market condition, no trading strategy works well, whether based on technical or fundamental analysis. Let’s dig deeper into each of these fundamental factors and more interesting aspects in the upcoming lessons. Cheers.

[wp_quiz id=”86366″]
Categories
Forex Fundamental Analysis

Understanding The Importance Of ‘New Home Sales’ Macro Economic Indicator

Introduction

In any economy, demand is one of the primary leading indicators of economic growth and inflation. Therefore, the aggregate demand data plays a vital role in predicting economic growth and possible monetary and fiscal policies. Although considered a lagging indicator, the data on new home sales provides insight into households’ changing demand and their income situation.

Understanding New Home Sales

As the name suggests, new home sales provide data on the newly built single-family that were sold or are for sale during a given period. New home sales data is also referred to as new residential sales. Sales mean that a deposit for the house has been taken or a sales agreement has been signed.

The data on new home sales is derived from a survey of a sample of houses from the building permits register. Since the data obtained is from a sample survey, it is bound to be subject to sampling variability as well as non-sampling error. Response bias, nonreporting, and under-coverage factors also influence this data. Nonetheless, the data is nationally representative.

The new home sales report shows data for the new privately-owned houses and new houses by construction stage. The report presents data that are both seasonally adjusted and those not seasonally adjusted.

  • The number of units sold during the period
  • The number of units for sale at the end of that period
  • The ratio between the houses sold and those for sale
  • The median and average sale price

How to use New Home Sales Data for Analysis

Although the new home sales data is generally regarded as a lagging economic indicator of demand in real estate, there is no dispute that broader macroeconomic trends influence new home sales. Here are some of the factors that influence new home sales.

Household income: Significant changes in the households’ disposable income will change their demand for new homes. Disposable income is the residual amount after paying taxes. These income changes could be brought about by an increase in wages, reduction in taxes, or investment windfall. If there is an increase in disposable income, households’ demand for new homes will increase. They could right away purchase already completed units or get into sale agreements for houses ongoing construction. Therefore, new home sales can be expected to increase during the period of increased household income. Conversely, a decrease in disposable income will make households cut back on non-essential expenditure, such as buying new homes. Consequently, new home sales will be expected to decline.

Unemployment: The rate of unemployment in the economy is directly linked to the households’ welfare. A lower unemployment rate implies that more households have income and can thus afford to put down deposits for a new home. Similarly, the unemployment rate reduction signifies that more people can afford to service a mortgage loan. Therefore, a low unemployment rate can be correlated to an increase in the demand for new houses, hence increasing new home sales.

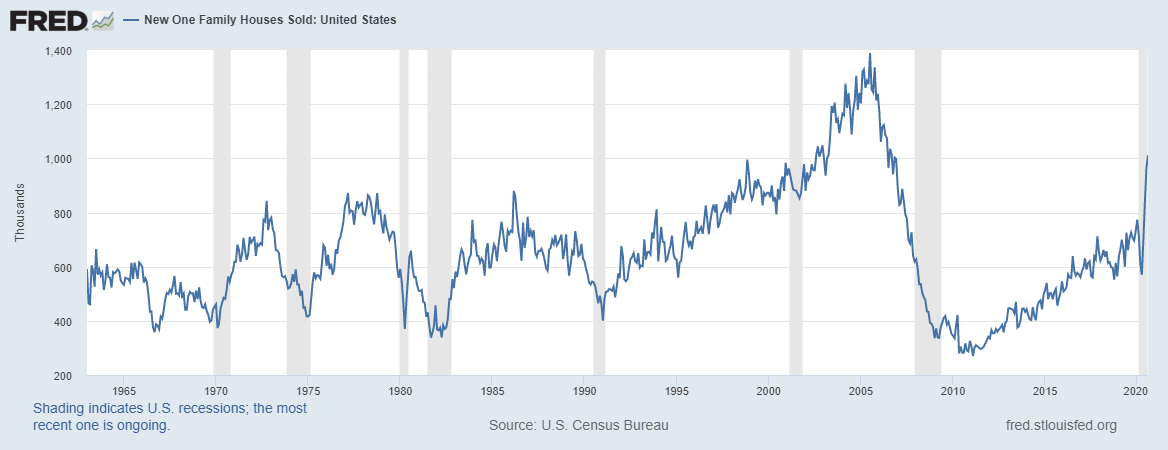
Source: St. Louis FRED

Conversely, higher rates of unemployment mean that more people are out of gainful employment. This instance forces households to prioritize their expenditures to cater to the essential items. Furthermore, higher unemployment could mean that more households do not qualify for a mortgage. Thus, a reduction in the new home sales can be expected with increasing unemployment.

Interest rate: In the financial markets, the prevailing interest rate determines the cost of borrowing – especially home mortgages. When interest rates are low, it means that more households can afford to borrow cheaply. It becomes easier for households to service debt without digging too much into their income, thus ensuring no significant changes in their welfare. Since most households can afford to borrow cheaply when interest rates are low, the demand for new homes can be expected to increase.

When interest rates are high, the cost of borrowing increases, and with it, the cost of a mortgage. Higher rates would restrict some households from servicing expensive debt without significantly impacting their welfare. Thus, with an increasing interest rate, it can be expected that new home sales will decline.

Impact on Currency

The new home sales data can impact a country’s currency in several ways. Here is how.

The new home sales can be used to show economic recoveries. Buyers of new homes could be speculative buyers – those who expect these homes’ prices to increase in the future then resell. To them, to them, new homes are an investment. Thus, the new home sales data can be taken as a sentiment about the economy. An increase in the new home sales could imply that the future economy is expected to improve. Similarly, in times of recessions, like the current coronavirus-inflicted recession, the new home sales data can be used to show market recovery. Therefore, an increase in the new home sales can be seen as a sign of economic recovery, which increases the value of the currency relative to others.

The new home sales can also be used to show when an economy is headed for a recession. Typically, recessions are punctuated with declining economic conditions, such as an increasing unemployment rate. Continually declining new home sales could indicate a looming recession as economic welfare of households is deteriorating. Furthermore, in these circumstances, expansionary monetary and fiscal policies tend to be implemented. These policies are designed to prevent the worst-case scenario from playing out. In the first quarter of 2020, such expansionary policies were witnessed globally. They were meant to prevent extreme economic shocks from the coronavirus pandemic. These policies result in the depreciating of the currency relative to other currencies.

Sources of Data

In the US, for example, the US Census Bureau conducts the survey and publishes the new home sales data for the US. An in-depth and historical review of the US’s new home sales is available at St. Louis FREDTrading Economics publishes new home sales data for countries globally. Furthermore, you can access the forecast of the new home sales globally up to 2022.

How New Home Sales Data Release Affects Forex Price Charts

The most recent release of the US’s new home sales was on September 24, 2020, at 10.00 AM ET. The news release can be accessed at Investing.com.

The screengrab below is of the monthly new home sales from Investing.com. On the right, we can see a legend that indicates the level of impact this fundamental indicator has on the USD.

As can be seen, high volatility is to be expected.

In August 2020, the new home sales were 1011K compared to 965K in July. The sales were higher than the anticipated 895K. Thus, a strong USD is expected.

Now, let’s see how this release made an impact on the Forex price charts.

EUR/USD: Before New Home Sales Release on September 24, 2020, 
Just Before 10.00 AM ET

Before the news release, the EUR/USD pair was trading in a neutral pattern as the 5-minute candles formed just around a flattening 20-MA.

EUR/USD: After New Home Sales Release on September 24, 2020, at 10.00 AM ET

After the news release, the pair formed a 5-minute ‘hammer’ candle, indicating that the USD weakened. Subsequently, the pair adopted a bullish stance with the 20-period MA rising.

As shown by the above analyses, the US new home sales data release failed to produce significant volatility. Therefore, we can conclude that new home sales are insignificant in the forex market as an economic indicator.

Categories
Forex Assets

Costs Involved While Trading The CAD/RON Forex Exotic Pair

Introduction

The CAD/RON is an exotic currency pair where CAD is the Canadian Dollar, and RON is the Romanian Leu. This article will explain some basic elements about the CAD/RON you ought to know before you start trading this pair. The CAD is the base currency, and RON is the quote currency in the CAD/RON exotic pair.

Thus, the CAD/RON pair’s price represents the amount of RON that you can buy using 1 CAD. If the pair’s current price is 3.1292, it means that you can use 1CAD to purchase 3.1292 RON.

CAD/RON Specification 

Spread

When trading forex, the spread represents the difference between the price at which a currency pair can be bought (bid price) and the price it can be sold at (ask price).

The spread for the CAD/RON pair is: ECN: 35 pips | STP: 39 pips

Fees

The STP accounts have no trading fees attached. Trading fees for the ECN accounts vary depending on your choice of forex broker.

Slippage

When trading in the forex market, sometimes the price you request on an order tends to be different from the price your broker executes the trade. This difference is known as slippage, and it depends on the broker’s speed of execution and market volatility.

Trading Range in the CAD/RON Pair

To ensure that proper risk management measures are taken, forex traders should know how much a currency pair fluctuates within a given timeframe. Trading range analysis can help forex traders to determine the volatility associated with trading a particular currency pair. This volatility is measured in terms of pips. If the CAD/RON pair has a volatility of 10 pips within the 1-hour timeframe, then a forex trader can be expected to gain or lose $32 since the value of 1 pip of CAD/RON is $3.2

Below is a table showing the minimum, average, and maximum volatility of CAD/RON across different timeframes.

The Procedure to assess Pip Ranges

  1. Add the ATR indicator to your chart
  2. Set the period to 1
  3. Add a 200-period SMA to this indicator
  4. Shrink the chart so you can determine a larger period
  5. Select your desired timeframe
  6. Measure the floor level and set this value as the min
  7. Measure the level of the 200-period SMA and set this as the average
  8. Measure the peak levels and set this as Max.

CAD/RON Cost as a Percentage of the Trading Range

When trading forex, the costs you can expect to incur include; brokers’ fees, slippage, and spread.

Total cost = Slippage + Spread + Trading Fee

The tables below show the analyses of percentage costs in both ECN and STP accounts.

ECN Model Account

Spread = 35 | Slippage = 2 | Trading fee = 1

Total cost = 38

STP Model Account

Spread = 39 | Slippage = 2 | Trading fee = 0

Total cost = 41

The Ideal Timeframe to Trade CAD/RON

From the above cost analysis, we can observe that the cost of trading the CAD/RON pair varies across different timeframes depending on the volatility. For both the STP and the ECN accounts, the 1-hour timeframe carries the highest costs at 694.92% and 644.07%, respectively. These higher costs are associated with the low volatility of 0.1 pips observed during the 1-hour timeframe.

We can also notice that the trading costs drop significantly when the volatility across all timeframes is above average. Therefore, for intraday forex traders, placing trades when the volatility is above average might be a better way of reducing the trading costs associated with the CAD/RON pair. On the other hand, longer-term traders of the pair enjoy lesser trading costs.

One way for traders to reduce their trading costs is to use limit order types. These forex order types eliminate the effects of slippage, thus make the associated slippage costs zero. Below are costs for a trader using limit orders.

ECN Model Account (Using Limit Orders)

Total cost = Slippage + Spread + Trading fee

= 0 + 35 + 1 = 36

As you can see, the trading costs are significantly reduced when limit orders are employed. The highest trading costs dropped from 644.07% to 610.17% of the trading range.

Categories
Forex Signals

USDCAD Breakout Retest Buy

Categories
Forex Signals

USDJPY Swing Failure Buy

Categories
Forex Signals

EUR/CAD Forex Pair’s Breakout Retest

Categories
Forex Signals

CADJPY Swing Failure Sell

Categories
Forex Assets

Costs Involved While Trading The JPY/LKR Forex Exotic Pair

Introduction

JPYLKR is a forex exotic currency pair, where JPY is Japan’s currency, and LKR is the currency of Sri Lanka. In this currency pair, JPY is the first currency, and the LKR is the second currency. The JPYLKR shows how much LKR is needed to have one JPY. It is quoted as 1 JPY per X LKR. For example, if the value of this currency pair is at 1.7686, then almost 1.7686 LKR is required to purchase one JPY.

JPYLKR Specification

Spread

The spread comes from the difference between the Ask and Bid price that a broker take as a charge. This value is set by the broker. However, it varies on the type of execution model used for executing the trades. Below are the ECN and STP values of JPY/LKR forex exotic pair.

Spread on ECN: 19 pips | Spread on STP: 24 pips

Fees

Every broker takes fees from trading, which is similar to the stock market. However, there is no fee on STP accounts, but a few pips on ECN accounts.

Slippage

Sometimes the entry price and execution price does not match, which is known as Slippage. The reason for slippage is the market volatility and the broker’s execution speed.

Trading Range in JPY/LKR

Procedure to assess Pip Ranges

  1. Add the ATR indicator to your chart
  2. Set the period to 1
  3. Add a 200-period SMA to this indicator
  4. Shrink the chart so you can assess a large time period
  5. Select your desired timeframe
  6. Measure the floor level and set this value as the min
  7. Measure the level of the 200-period SMA and set this as the average
  8. Measure the peak levels and set this as Max.

JPYLKR Cost as a Percent of the Trading Range

With the volatility values from the above table, we can determine the chance of cost with volatility changes. We have got the ratio between total cost and volatility and converted into percentages.

ECN Model Account 

Spread = 19 | Slippage = 5 | Trading fee = 8

Total cost = Spread + Slippage + Trading Fee

= 19 + 5 + 8

Total cost = 32

STP Model Account

Spread = 24 | Slippage = 3 | Trading fee = 0

Total cost = Spread + Slippage + Trading Fee

= 19 + 5 + 0

Total cost = 27 

The Ideal way to trade the JPYLKR

The JPYLKR has enough volatility and liquidity. Hence, trading in this currency pair is straightforward and profitable. The above table’s percentage values are within 300%, which is an indication of stable volatility. Therefore, the costs are low irrespective of the timeframe and volatility you trade.

Digging it a little deeper, there is an inverse relationship between the cost and volatility. In a lower timeframe, the volatility is higher, and the cost is lower. However, in a higher timeframe, the volatility is lower, but the cost is higher. In this situation, traders should focus on trading when the volatility is on the average value. Therefore, it will be cost-efficient for all traders.

Furthermore, traders can quickly reduce costs by placing ‘limit’ and ‘stop’ orders. Because by using limit orders, the Slippage can be totally avoided, and the total costs get reduced. In our example, the total cost will be reduced by five pips, as shown below.

Using Limit Orders

Spread = 19 | Slippage = 0 | Trading fee = 0

Total cost = Spread + Slippage + Trading Fee

= 19 + 0 + 0

Total cost = 19

Categories
Forex Fundamental Analysis

The Impact Of ‘Money Supply’ Fundamental Indicator On the Forex Price Charts

Introduction

Inflation plays an undeniable role in influencing the fiscal and monetary policies implemented within an economy. These policies’ role is to either mop up money from the economy or inject more money into the economy. Primarily, the rate of inflation tends to fluctuate depending on the amount of money in circulation. When the money in circulation is high, so is the rate of inflation, and when it’s low, the rate of inflation lowers. For this reason, the money supply statistics are vital and can be used as a leading indicator of inflation.

Understanding Money Supply

The money supply is the totality of the cash in circulation within an economy, bank deposits, and other liquid assets that can quickly be converted to cash. Note that the money supply is measured over a specific period, and it excludes any form of a physical asset that must be sold to convert to cash, lines of credit, and credit cards.

There are three commonly used measures of the money supply in an economy. They are M1, M2, and M3.

M1 Money Supply

This measure of money involves the entirety of the cash in circulation, i.e., the amount of money held by the public. This measure includes travelers’ checks, checkable deposits, and demand deposits with commercial banks. The money held by central banks and depository vaults is excluded from this measure. The M1 money supply is also known as the narrow measure of the money supply and can be referred to as the M0 money supply in other countries.

Source: St. Louis FRED

M2 Money Supply

This measure of the money supply is the intermediate measure. It includes the M1 money supply as well as time deposits in commercial banks, savings deposits, and the balance in the retail money market funds.

Source: St. Louis FRED

M3 Money Supply

This measure of the money supply is broad. It includes the M2 money supply as well as larger time deposits depending on the country, shorter-term repurchase agreements, institutional money market funds’ balance, and larger liquid assets. Note that this measure of money mainly focuses on the money within an economy used as a store of value.

Source: St. Louis FRED

Monetary Base

As a measure of money supply, the monetary base measures the entirety of the money in circulation and those held by the central banks as deposits by the commercial banks.

How to use Money Supply in Analysis

As we noted earlier, both fiscal and monetary policies are influenced by the economy’s money supply. For companies and households, the analysis of money supply not only helps predict the interest rates but also to determine business cycles, expected changes in the price levels and inflation.

Money supply in an economy can be used to analyze and identify seasonal business cycles. When the economy is going through a period of recovery and expansion to the peak, the economy’s money supply will increase steadily. During recovery, there is an increase in aggregate demand, unemployment levels reduce, and households’ welfare improves. At this point, the money supply in the economy begins to increase. The supply rapidly increases during the expansion cycle than during recovery. At the peak, the money supply in the economy stagnates, and the increase is lower than the previous two stages.

Similarly, the money supply begins to drop when the economy is going through a recession to depression. These periods are characterized by a decrease in the GDP levels signaling a shrinking economy, accompanied by higher unemployment levels and diminished aggregate demand in the economy.

Furthermore, an increase in money supply in an economy leads to lower interest rates, which means that businesses and households can invest more in the economy. More so, increased money supply stimulates increased demand by consumers, which leads to increased production and demand for labor. The rise in aggregate demand is followed by increased aggregate supply, which leads to economic expansion and growth of consumer discretionary industries.

Impact on Currency

The most notable impact of the money supply is inflation. Inflation is the increase in the prices of goods and services over time.

When the money supply is increasing, it shows that households have more money to spend, which increases the aggregate demand. Since the supply doesn’t change at the same pace as demand, the resulting scenario is an increase in the prices of goods and services. In most countries, the central banks have a target rate of inflation.

Therefore, when inflation is increasing, the central banks will employ deflationary monetary policies, such as increasing interest rates. The deflationary policies are designed to increase the cost of money and discourage consumption. Therefore, in the forex market, an increase in money supply can be seen as a signal of a future hike in the interest rates, which makes the local currency appreciate relative to others.

Conversely, a decrease in the money supply signals an economic recession, loss of jobs, and a shrinking economy. For governments, preventing economic recessions is paramount. Thus, a constant decrease in the money supply will trigger the implementation of expansionary fiscal policies. The fiscal policies can be accompanied by expansionary monetary policies by the central banks. These policies aim to spur economic growth and are negative for the currency. Therefore, a decrease in the money supply implies a possible interest rate cut in the future, which makes the local currency depreciate relative to others.

Sources of Data

In the US, the Federal Reserve publishes the money supply data and releases it monthly in the Money Stock Measures – H.6 Release. An in-depth review of the US’s total money supply can be accessed at St. Louis FRED, along with the historical data on M1 money supply, M2 money supply, and M3 money supply. Trading Economics publishes data on global M1 money supply, global M2 money supply, and global M3 money supply. In the EU, the data on the money supply can be accessed from the European Central Bank.

How the Money Supply Data Release Affects Forex Price Charts

The most recent release of the EU’s money supply data was on September 25, 2020, at 8.00 AM GMT and can be accessed at Investing.com.

The screengrab below is of the monthly M3 money supply from Investing.com. To the right is a clear legend that indicates the impact level of the FI has on the EUR.

As can be seen, this low volatility is expected upon the release of the M3 money supply data.

In August 2020, the M3 money supply in Europe grew by 9.5% compared to the 10.1% increase in July. The August increase was lower than analysts’ expectations of 10.2%.

Now, let’s see how this release made an impact on the Forex price charts.

EUR/USD: Before the M3 Money Supply Data Release on September 25, 2020, 
Just Before 8.00 AM GMT

Before the publication of the M3 money supply, the EUR/USD pair was trading in a subdued uptrend. Candles were forming just above a slightly rising 20-period MA.

EUR/USD: After the M3 Money Supply Data Release on September 25, 2020, 
at 8.00 AM GMT

The pair formed a 5-minute bearish candle after the release of the data. Subsequently, the pair adopted a strong downtrend as the 20-period MA fell steeply with candles forming further below it.

Bottom Line

The money supply data is generally expected to a mild impact on the forex price action. For this release, however, the worse than expected data was more pronounced in the markets. This effect could be attributed to the fact that the markets expected that the ECB’s pandemic stimulus program would have a visible impact on the money supply.

Categories
Forex Course Forex Daily Topic

150. The Easiest Way To Measure Market Volatility

Introduction

Measuring volatility enables traders to accurately identifying the significant trading opportunities in the currency pairs. An increase in the volatility of a currency pair occurs due to any of the major changes in the economy of that country. Market volatility measures the overall price fluctuations over a specific period, and this information is used to identify the potential breakouts.

In the Forex market, the higher the volatility, the riskier is the currency pair to trade. A higher volatility means that the asset value can be spread out over a larger range of values. A lower volatility means that an asset does not fluctuate dramatically and tends to be more steady. A few indicators help us in measuring the volatility of the currency. Using these indicators will show us the accurate representation of the market’s volatility when looking for trading opportunities.

Bollinger Bands

We have discussed a lot about Bollinger Bands in our previous course lessons. This indicator is specially designed to measure the volatility of an asset. In this case, any currency pair in the Forex market. This indicator consists of two lines (bands) plotted above and below the middle line, a moving average. The volatility representation is based on the standard deviation, which changes as an asset’s volatility increases and decreases. Both these bands contract and expand according to market volatility. When the bands’ contract, it tells us that the volatility is low, and when the bands widen, it represents an increase in volatility.

Moving Average

Moving Average is the most common indicator used by traders across the globe. It measures the average amount of market movement over a specific period. If we set the moving average to 30 periods, it shows us the last 30 days’ average movement. In short, any Moving average tells us the average price movement over a specific period. If the MA line is above the actual price, that implies the market is in a downtrend and vice versa.

Average True Range (ATR)

The ATR (Average True Range) is another reliable indicator used to measure market volatility. This indicator takes the currency price range, which is the distance between the high and low in the time frame, and then plots that measurement as a moving average.

If we set the ATR to 40 range, it will tell us the average trading range of the last 40 days. The lower the ATR reading means, the volatility is falling, and we can expect fewer trades. On the other hand, the higher the volatility means the ATR reading is rising. It is an indication that the volatility is on the rise, and by using any directional indicator, we can gauge the potential trading opportunities.

These are the three best tools you need in your arsenal to measure the market’s volatility accurately. Make sure to take the below quiz before you go. Cheers!

[wp_quiz id=”92111″]
Categories
Forex Signals

AUDNZD Breakout Retest Buy

Categories
Forex Assets

Trading The CAD/ZAR Forex Cross Currency Pair & Analyzing The Costs Involved

Introduction

The CAD/ZAR is an Exotic forex currency cross. CAD represents the Canadian Dollar, and the ZAR corresponds to the South African Rand. CAD is the base currency in this pair, while the ZAR is the quote currency. This pair’s exchange rate shows the value of the ZAR, which is equivalent to 1 CAD. If the pair’s exchange rate is 12.7969, it means that 12.7969 ZAR is equivalent to 1 CAD.

CAD/ZAR Specification

Spread

The spread in forex is calculated by subtracting the bid price from the asking price. Brokers determine the spread since it’s their primary source of revenue. Below is the spread charges for ECN and STP brokers for CAD/ZAR pair.

ECN: 39 pips | STP: 44 pips

Fees

Forex traders with the ECN type accounts have to pay a commission to their brokers for every position they open. Brokers do not charge any trading fees on STP accounts.

Slippage

The difference between the trade price preferred by a trader and the broker’s execution price is the slippage. In forex, slippage depends on market volatility and the speed at which the broker executes the trade.

Trading Range in the CAD/ZAR Pair

The trading range is best described as the analysis of how the exchange rate of a currency fluctuates across different timeframes. This analysis will help to estimate the expected returns from trading a particular currency pair. If, for example, on the 1-hour timeframe, the volatility of the CAD/ZAR is ten pips, a trader can expect to gain or lose $78. The trading range for the CAD/ZAR pair is shown below.

The Procedure to assess Pip Ranges

  1. Add the ATR indicator to your chart
  2. Set the period to 1
  3. Add a 200-period SMA to this indicator
  4. Shrink the chart so you can determine a larger period
  5. Select your desired timeframe
  6. Measure the floor level and set this value as the min
  7. Measure the level of the 200-period SMA and set this as the average
  8. Measure the peak levels and set this as Max.

CAD/ZAR Cost as a Percentage of the Trading Range

To make an informed risk management decision when trading the CAD/ZAR pair, we can analyze how the trading costs vary across different timeframes with different volatilities. Here are the cost analyses for the CAD/ZAR pair for both ECN and STP accounts.

ECN Model Account

Spread = 39 | Slippage = 2 | Trading fee = 1

Total cost = 42

STP Model Account

Spread = 44 | Slippage = 2 | Trading fee = 0

Total cost = 46

The Ideal Timeframe to Trade CAD/ZAR

We can notice that shorter timeframes have higher trading costs than the longer timeframes for both the ECN and the STP accounts. Also, across all timeframes, the trading costs reduce as the trading range of the CADZAR pair increases from minimum to maximum.

Although longer-term traders enjoy lesser trading costs, intraday traders can reduce their trading costs by trading when the volatility ranges between medium to the maximum. We can also further reduce the trading costs by implementing forex limit orders, which ensures that slippage does not affect your prices. Here is how trading costs can be reduced using forex limit orders.

ECN Account Using Limit Model Account

Total cost = Slippage + Spread + Trading fee

= 0 + 39 + 1 = 40

Using limit orders has significantly reduced trading costs. For the CAD/ZAR pair, the highest cost has been reduced from 711.86% of the trading range to 677.97%.

Categories
Forex Fundamental Analysis

Everything You Should Know About ‘Reserve Assets’ As A Macro Economic Indicator

Introduction

In the current age of globalization and increasing international trade, every country strives to have a favorable balance of payment and a stable currency in the international market. As is with any other market, a currency’s exchange rate is majorly determined by the forces of demand and supply. For stability of its exchange rate, a country might opt to purchase its currencies from the international market to reduce its supply, using its reserve assets.

Understanding Reserve Assets

In finance, reserve assets refer to foreign currencies held and controlled by a country’s central bank. The central banks are mandated to use the reserve currency as they deem fit to benefit the local economy. A reserve currency is supposed to be a universally accepted currency whose value is relatively stable over time. The US dollar is the most preferred reserve currency. Other major currencies include the Euro and GBP.

Purposes of the Reserve Assets

A country’s central bank can use the reserve assets it controls in several ways.

The reserve assets can be used to influence the exchange rate of the local currency against international currencies. Countries can do this whether their exchange rate is fixed or floating. For a fixed exchange rate, a country will peg the exchange rate of its currency against a reserve currency. Pegging the local currency against another one means that the local currency’s value will adjust at the same rate as the other currency.

In this case, when the local government wants to increase its currency value, it uses the reserve assets to buy its currency from the international market. In turn, the demand for the local currency goes up along with its value. The main goal for currency pegging is to remove inflation or changes in the interest rates from impacting the trade between two economies.

Source: St. Louis FRED

For countries whose exchange rate is floating, the central banks use the reserve assets to adjust their currencies relative to that of the reserve currency. If a country wants to weaken its currency to make its exports competitive in the international market, it will sell its currency to buy reserve assets. Conversely, if it wants to increase its currency value, it will use the reserve assets to purchase its currency from the international market.

Another function of the is to shore up the economy in case of natural or human-made disasters. In such disasters, economic activities in the country may be crippled, which significantly lowers the exports. Consequently, the foreign exchange earned in the international market. The central banks use the reserve assets to ensure there is enough liquidity of foreign currency for importation.

Furthermore, in such disasters, investors may flee the country by withdrawing from the local banks. The resultant shortage of foreign currency will reduce the value of the local currency. The central banks can use the reserve assets to buy the local currency to prevent over-inflation and keep the local currency stable.

The country’s reserve assets are also used to meet its financial obligations, such as debt repayment. When a country borrows from the international markets, the interest payments are usually demanded to be paid in the reserve currency. Debtors prefer the reserve currency since it guarantees them that their cash flow is protected from rapid inflation. Therefore, having adequate reserve assets gives investors and creditors confidence that their capital is protected.

Using the reserve assets data for analysis

There is a minimum limit of reserve assets that a country is recommended to hold. This minimum threshold is meant to ensure that in case of any economic shocks, the country can fund essential imports in the short term. Furthermore, the minimum reserves should cover all the country’s debt obligations for about a year.

Therefore, when the reserve assets held by a country are dropping, it could indicate that the economy is experiencing shocks, and the central banks have stepped in to mitigate. When these levels are continually dropping, it means that the economic shocks being experienced are not reducing.

Source: St. Louis FRED

Considering that the reserve assets increase when the balance of payments accounts is improving, a drop in the reserve assets signals that a country in exceedingly becoming a net importer. A reduction in the number of exports or a drop in the value of exports results in net imports. Either way, it implies that the country’s living standards have deteriorated, and unemployment is on the rise.

All these factors point towards a shrinking economy. Conversely, a constant increase in reserve assets implies that the country is a net exporter, which could increase the quantity of exports or quality through value addition. These two factors signal a growing economy with possibly improving labor market conditions.

Impact on Currency

Apart from the direct influence of the exchange rate by buying and selling the reserve assets, here are some of the ways changing levels of a country’s reserve assets impact its currency. Higher reserve assets levels show that the country is well prepared to deal with any unforeseen economic shocks. For investors, this is a sign of stability and encourages them to invest in the country, which leads to lower unemployment and economic growth. Thus, increasing levels of reserve assets lead to a currency’s appreciation.

Conversely, a persistent drop in the reserve assets is negative for the currency. Dropping reserve assets is an indicator that the local currency is under pressure, and the central banks are selling reserve assets to stabilize the currency. Similarly, it could mean that exports in the economy have been reducing over time. Both these instances point towards an adversely affected economy.

Sources of Data

In the US, the data on reserve assets is published monthly by the US Federal Reserve Board, while in the EU, it is published by the European Central BankThe IMF publishes data on global reserve assets balances.

How Reserve Assets Data Release Affects Forex Price Charts

The most recent release of the EU’s reserve assets data was on September 15, 2020, at 10.00 AM GMT. The release can be accessed at Investing.com. The screengrab below is of the monthly reserve assets from Investing.com. To the right is a legend that indicates the level of impact the FI has on the EUR.

As can be seen, this low volatility is expected upon the release of the reserve assets data.

In August 2020, the EU’s total reserve assets were 915.08 billion compared to 923.07 billion in July 2020.

EUR/USD: Before the Reserve Assets Data Release on September 15, 2020, 
Just Before 10.00 AM GMT

Before the publication of the reserve assets data by the ECB, the EUR/USD pair was trading in a neutral trend. The 20-period MA was flattening with candles forming just around it.

EUR/USD: After the Reserve Assets Data Release on September 15, 2020, 
at 10.00 AM GMT

After the news release, the pair formed a 5-minute “Doji” candle. Subsequently, the pair adopted a bullish trend with candles crossing and forming above the rising 20-period MA.

Bottom Line

The total reserve assets that a country holds is a crucial indicator of its economic health and balance of payments condition. But as can be seen in the above analyses, this indicator has no significant impact on the forex price action. We hope you found this article informative. Let us know if you have any questions in the comments below. Cheers!

Categories
Forex Course Forex Daily Topic

149. Trading The Fakeouts In The Most Conservative Way

Introduction

Breakout trading is prevalent among all types of traders. Professional traders make a lot of cash by trading these breakouts, while some novice traders fail to effectively trade them. While trading these breakouts, the pretty basic strategy is to pull the trigger when the price breaks above or below any significant level. But many times, the price tends to reverse its direction and cause immediate losses. This is one of the most frustrating experiences breakout traders go through.

Did this ever happen to you, and did you wonder why this happens? The reason is that you have no pre-planned entries. You are just reacting to the price action and chasing the markets purely based on your feelings, but you must accept that the market has no feelings.

How to Trade the fakeouts?

❶ Primarily, find the confluence level on the price chart. This is a place where most of the indicators point towards one direction.

❷ Avoid trading range breakouts as both the parties hold equal power when the market is ranging. In this state of the market, the chance of spikes is very high. So it is always advisable to trade breakouts only in a trending market.

❸ Wait for the price to break above any significant level in an uptrend and break below any major level in a downtrend.

❹ Right after the breakout, wait for the price to test above or below any major level to confirm the breakout’s authenticity.

Trading Strategies

Buy Example

The image below represents a breakout in the EUR/CHF Forex pair.

As you can see in the below chart, we waited for the price action to holds above the breakout line. We have only entered the market after we confirmed the breakout. If the price action fails to hold, it simply means that it was a fakeout, and we can ignore it completely.

In this example, prices held above the breakout, which confirms the validity of the breakout. We took entry at the breakout line and chose to go for a brand new higher high. The exit was purely based on the higher timeframe’s significant resistance area, and the stop loss was just below our entry.

Sell Example

The image below represents a sell breakout in the GBP/NZD forex pair.

In the below image, we can see the price holding below the significant resistance level, which confirms the breakout. Our entry was at the red candle at the significant resistance level. The price sharply rejects to go any higher. Now we can see a brand new lower low forming after our entry.

The stop-loss is placed just above the entry as the seller response was quite aggressive. When the price started to struggle and failed to go down further, we chose to close our trade.

This is one of the best ways to trade the fakeouts in the most conservative way. We hope you got a clear understanding of this concept. Please let us know if you have any questions in the comments below. Cheers!

[wp_quiz id=”92087″]
Categories
Forex Assets

Trading The CAD/SEK Forex Exotic Currency Pair & Analyzing The Costs Involved

Introduction

CAD/SEK is a Forex exotic currency pair, where CAD is the primary currency of Canada, and SEK (Swedish Krona) is the currency of Sweden. In this exotic currency pair, CAD is considered the base currency, and SEK as the quote currency. This pair’s price determines the value of SEK, which is equivalent to one CAD. We can quote it as 1 CAD per X numbers of SEK. For example, if the CADSEK pair’s value is at 6.5877, we would need almost 6.5877 SEK to buy one CAD.

CAD/SEK Specification

Spread

In all the financial markets, the spread represents the difference between the Bid and Ask prices. It is typically a charge that is deducted by the Forex broker. These spread values vary on the type of execution model used for trade execution.

The spread of the CAD/SEK pair on ECN is 39 pips, and on the STP model account is 44 pips.

Fees

The trading fees that forex brokers are similar to the stock market. It is deducted from the traders’ accounts as soon as they open a new position. There is no fee charged on STP accounts, but a few pips are charged on ECN accounts.

Slippage

Slippage occurs when a trader opens a trade at a price, but it opens at another price by expanding the spread. The main reason for the slippage to occur is the market volatility and the broker’s execution speed.

Trading Range in CAD/SEK

Procedure to assess Pip Ranges

  1. Add the ATR indicator to your chart
  2. Set the period to 1
  3. Add a 200-period SMA to this indicator
  4. Shrink the chart so you can assess a large time period
  5. Select your desired timeframe
  6. Measure the floor level and set this value as the min
  7. Measure the level of the 200-period SMA and set this as the average
  8. Measure the peak levels and set this as Max.

CAD/SEK Cost as a Percent of the Trading Range

The below tables represent the percentage values of trading costs involved while trading this particular Forex asset in various time frames. Please note that these values must be used for directional purposes only. So, for instance, if the percentage of costs involved is high in the one-hour time frame, it implies that this pair is expensive to trade in that particular time frame.

ECN Model Account 

Spread = 39 | Slippage = 5 | Trading fee = 8

Total cost = Spread + Slippage + Trading Fee

= 39 + 5 + 8 = 52

STP Model Account

Spread = 44 | Slippage = 5 | Trading fee = 0

Total cost = Spread + Slippage + Trading Fee

= 39 + 5 + 0 = 49

The Ideal way to trade the CADSEK

The CAD/SEK is an exotic cross currency pair with sufficient liquidity. As a result, traders may find it easy to trade in this pair. If we look at the table, we would see that the percentage values did not move above 65%, representing a lower trading fee even in the lower timeframe. Therefore, trading in this currency pair is suitable for intraday, swing, and even scalping. However, the best decision is to trade when the cost of trading is at the average value.

There is another way to reduce the cost while trading this pair, and it is to place a pending order. We can either place a limit or stop order instead of the market order. In that case, the slippage won’t be considered while calculating the total costs. Therefore, in our example, the overall cost will be reduced by five pips, as shown below.

STP Model Account (Using Limit Orders)

Spread = 44 | Slippage = 0 | Trading fee = 0

Total cost = Spread + Slippage + Trading Fee

= 44 + 0 + 0 = 44

Categories
Crypto Guides

Is Tezos The Most Robust Cryptocurrency?

Introduction

Tezos is a decentralized, highly secure, transparent, and smart contract enabled blockchain governed by itself. It is a blockchain network associated with a digital token known as Tez or Tezzie (XTZ). Tezos doesn’t mine Tez. Instead, the token holder is rewarded under the consensus mechanism for participating in the proof-of-stake system.

A digital commonwealth group, sharing common interests and goals, is linked together to govern the Tezos platform. Tezos aims to become the most robust cryptocurrency blockchain by working together with its token holders to build more democratic protocol with the time. 

What is Tezos Attempting to Achieve? 

Tezos team wants to develop the most adaptable cryptocurrency project. It provides a token holder with equal governing power and is trying to avoid a hard fork situation. In which a community splits and starts competing with each other like in Bitcoin cash and Ethereum DAO. Tezos is implementing soft forks in which the community regularly updates the blockchain for constant growth. They are using (DAO) Decentralised Autonomous Organization system where every decision is taken after community discussion. This will make this more self amendable and upgradeable system.  

How Tezos Works? 

Tezos uses a proof of stake algorithm, and it can support 40 transactions/second on the network. It uses the Michelson coding language, which proceeds with formal verification to avoid any bugs in the network. To create error fee smart contracts, they use a mathematically provable code. In this network, the stakers are known as bakers.

To make delegate changes, you need to have 10,000 Tezos tokens and a bond. Most probably to make the system more democratic, Tezos has removed the miners to reduce their control power in the network. It is absorbing good elements from different blockchains to make it self-governing, self-evolving, and adaptable. If you notice anything appealing in any other blockchain, you can propose it to the community that approves the change for the Tezos network. 

Tezos Architecture

The protocol is divided into layers:

Network Protocol  – Here, the peer-to-peer communication is done to broadcast the decisions between the nodes.

Transaction Protocol – Here, the blockchain accounting model is implemented. 

Consensus Protocol – This consensus protocol verifies the agreement to confirm transactions. 

The Tezos Accounts

Implicit Account – It’s the most commonly used account. It has a public key and private key held by the account owner to secure the account balance. 

Originated Account – The formally verified smart contract account with the implicit account is known as an originated account.

Tezos Unique Capabilities

  • Self-amending and on-chain governance
  • Formal verification of smart contracts
  • Liquid proof of stake system 

Is Tezos a Good Investment?

Tezos is the youngest of all existing cryptocurrencies and focused upon the chain governance system. They claim to become a future-proof platform through on-chain governance that attracts a huge number of investors. Thus, Tezos seems to be a good investment. The good news is that most of the popular cryptocurrency investors are getting involved in Tezos. We should also consider that they don’t have a clear road map for the future, but the other dominating cryptocurrencies community is working in a specific direction. To conclude, despite Tezos being one of the most robust cryptos out there, its success or failure depends on active community decisions. 

Categories
Forex Fundamental Analysis

What Should you Know About Commitments of Traders (COT) Report?

Introduction

One of the most significant uncertainties for policymakers is the future economic performance. All the policies adopted by governments and central banks are geared towards influencing the future’s economic performance. Economists, financial analysts, and forex traders alike use models and economic indicators to predict future economic performance. The commitment of traders (COT) report gives some insight into future economic performance.

Understanding the Commitments of Traders Report

In the US, the COT report is published by the Commodities Futures Trading Commission (CFTC). The COT report shows participation in the future market.

The COT report is comprised of four different types of reports. They are:

Legacy reports: This report breaks down the open interest positions of commercial, noncommercial, and retail traders into long, short, and spread positions. The report shows the total interest positions that are open along with the changes from the previous reporting period. This report is broken down into the long and short versions of ‘Futures Only’ and ‘Futures-and-Options-Combined’ segments. The Legacy COT report shows the open interests for 17 exchanges.

Supplemental reports: This report document contracts 13 agricultural commodities. These contracts are of both futures and options positions for noncommercial, commercial, and index traders together with nonreportable positions.

Disaggregated reports: This report covers the following five sectors; agriculture, petroleum, and its products, natural gas and its products, electricity, and metal. This report’s market participants are categorized into; producers, swap dealers, managed money, and ‘Others.’
Producers are entities whose core business activities involve the production, processing, and handling of physical commodities. These producers use the futures market to manage or hedge against risks potential to their core operations.

Swap dealer is one who enters into an agreement to exchange cash flows of a given commodity over a specific period. They use the futures market to manage and hedge against risks inherent in their swaps.

Money manager, as used in this report, means a registered commodity pool operator, an unregistered fund, or a registered commodity trading advisor identified by CFTC. They participate in the futures markets on behalf of their clients.

Others represent all other participants in the futures markets who cannot be placed in the above categories.

Traders in Financial Futures (TFF) report: This report shows the participants in the futures market for currencies, stocks, US Treasury securities, VIX, and Bloomberg commodity index. It categorizes market participants into; dealers, asset managers, leveraged funds, and others.

Dealer/ Intermediary is a participant on the ‘sell-side’ of a trade. Although they do not exclusively participate in the futures market, they have matched books meant to offset their risks. They are made up of large banks.

An asset manager is an institutional investor such as pension funds and insurance companies whose clients are predominantly institutional.

Leveraged funds hedge funds, registered commodity pool operator, an unregistered fund, or registered commodity trading advisors. Their activities in the futures market involve arbitrage across and within markets and taking outright positions.

Others include all reportable traders who cannot be placed in the above categories.

Using the Commitments of Traders (COT) Report in analysis

The COT report can be used to show whether investors are going long or short in the futures market. The CFTC collects the data used in making the COT report from reporting firms such as Futures Commission Merchants, foreign brokers, exchanges, and clearing members. Individual traders can also self-report by filling out the CFTC Form 40.

The COT report shows the open interests in the futures and options market as of Tuesday of each week. Since the COT report also shows the changes in the open positions, it can be used to show the sentiment about the economy over time. It is worth noting that the market positioning of the commercial traders and the noncommercial (speculative) traders is always the opposite of each other.

Commercial traders handle physical commodities. For them, it is natural to expect that the future price of their commodities will rise. In the futures and options market, commercial traders are hedging against risk; thus, they go short just in case prices fall. The noncommercial traders do not handle the underlying physical commodities, and thus, they are participating in the futures market speculatively and can either be long or short. Therefore, by looking at the behavior of noncommercial traders in the futures markets, we can gain insight into future price trends and the economy.
Take the above example of wheat futures, when the noncommercial traders are net short positioned in the futures market, the prices of wheat falls. Consequently, the wheat farmers and traders receive lesser pay for their products. In this case, their purchasing power is lowered, which decreases the aggregate demand in the general economy.

Impact on Currency

Forex traders pay close attention to the noncommercial traders in the financial futures. These speculative buyers tend to lead the market. When they are net long in a particular currency, it means that the demand for that currency will increase and, with it, its value relative to others. For most forex traders, the best way to trade forex using the COT report is by establishing the overbought and the oversold regions. These are the regions where trend reversal is imminent – when the noncommercial traders are at the lowest point could indicate a period of sustained short selling, and a reversal could follow.

The COT report can also be used to show a trend. For example, let’s take an instance where noncommercial traders are continuously net long on a particular currency in the futures market while the price for that currency steadily increases. With this strategy, forex traders can use noncommercial traders’ market positioning as confirmation of a trend.

Sources of Data

The US CFTC publishes the COT report.

How the publication of the COT Report Affects Forex Price Charts

The latest publication of the COT report was on October 2, 2020, at 3.30 PM ET. The release of this publication can be accessed at Investing.com.

The screengrab below is of the weekly CFTC speculative net positions of the AUD from Investing.com. To the right is a legend that indicates the level of impact the fundamental indicator has on the AUD.

As can be seen, moderate volatility is to be expected.

As of Tuesday, September 29, 2020, the AUD’s speculative net positions was 8.9K compared to the previous Tuesday’s of 16.3K. Noncommercial traders are net-long in the AUD futures, which should be positive for the AUD.

Now, let’s see how this release made an impact on the Forex price charts.

AUD/USD: Before the COT Report Release on October 2, 2020, Just Before 3.30 PM ET
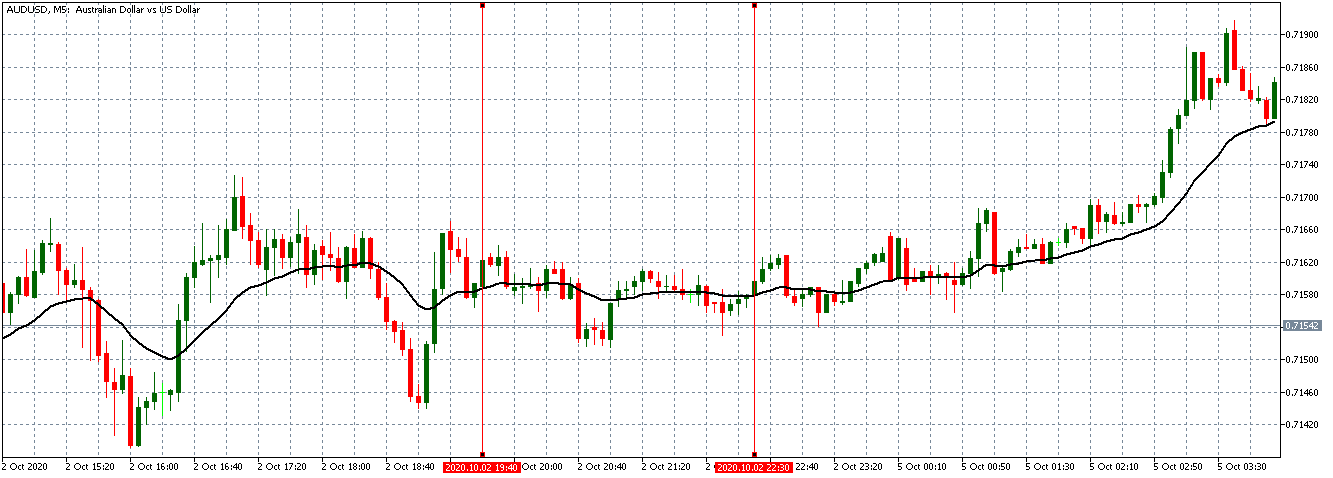
The AUD/USD pair was trading in a neutral position before the release of the COT report. The 20-period MA was flattened with candles forming just around it.

AUD/USD: After the COT Report Release on October 2, 2020, at 3.30 PM ET
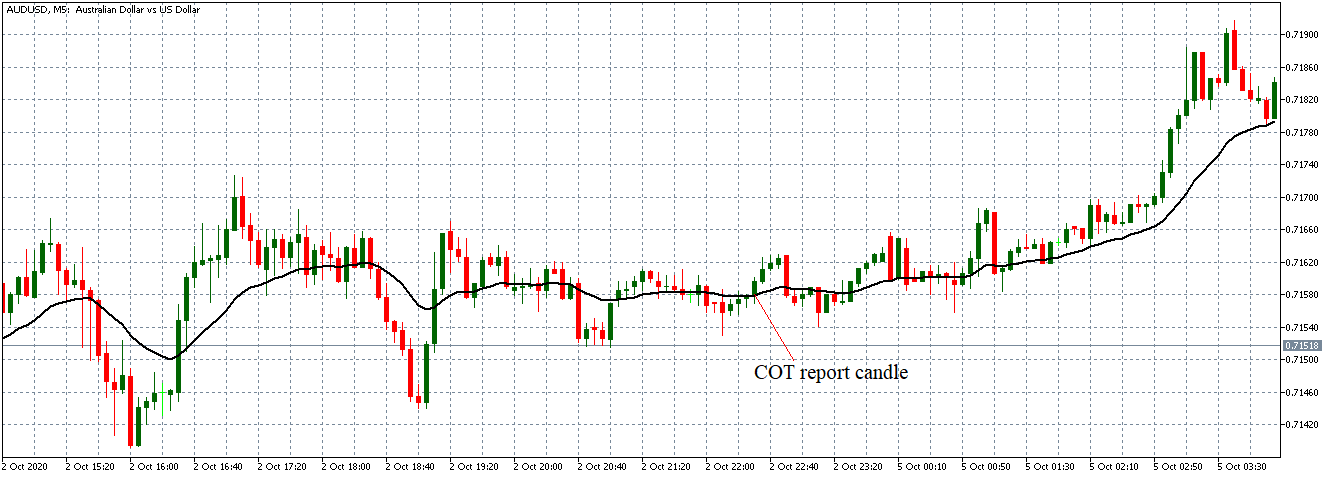
The AUD/USD pair formed a -minute bullish candle after the COT report’s release indicating that the AUD had appreciated relative to the USD. However, the pair could not sustain a bullish trend since it later continued trading in a neutral trend.

The effects of the COT report are long-term. For this reason, the weekly publication of the report has little impact on the short-term forex market.

Categories
Forex Signals

GBPJPY Breakout Retest Buy

Flow Assessment

Price is in an up-flow and the seller momentum has slowed down.

Location Assessment

Price is at a key buyer area, which is showing reactions.

Momentum Assessment

Price has held near the buyers area and making smaller higher lows, suggesting buildup of positions.

Entry Price – Buy 136.892

Stop Loss – 136.443

Take Profit – 137.357

Risk to Reward – 1:1.04

Profit & Loss Per Standard Lot = -$425/ +$440

Profit & Loss Per Micro Lot = -$42.5/ +$44

Fellas, now you can check out forex trading signals via Forex Academy mobile app. Follow the links below.

iPhone Users: https://apps.apple.com/es/app/fasignals/id1521281368

Andriod Users: https://play.google.com/store/apps/details?id=academy.forex.thesignal&hl=en_US

Categories
Forex Signals

GBP/AUD Displaying A Break of Structure

Categories
Forex Basic Strategies

Understanding The Higher Time Frame Reversal Strategy That Is Based On Market Volatility

Introduction

Volatility tends to run in cycles where we usually witness a period of high volatility that is followed by periods of low volatility. This cycle can be observed in almost any market. Let us consider the Forex market, where when a currency pair is strongly trending in one direction, the traders tend to show a strong preference for that currency over another.

During such trends, the market is volatile because the price is on the move. After a point of time, the currency pair will reach a point where the participants feel the exchange rate is fairly overvalued. At this point, the trend pauses and enters into a consolidation. Eventually, when this period of consolidation ends, the market reverses and may start to trend in the other direction. In today’s article, we discuss a trading strategy that will help us grabbing this reversal.

Time Frame

The volatility strategy is best suited for trading on higher time frames, such as the 4 hours and Daily time frame.

Indicators

The indicators that will be used in this strategy include 20-period EMA, Average True Range (ATR) and Bollinger Band Width, with their default settings.

Currency Pairs

The strategy can be used on all currency pairs listed on the broker’s platform. However, we still would recommend applying the strategy on major currency pairs due to higher volatility.

Strategy Concept

Many traders use the exponential moving average (EMA) for identification of the trend and as an indication of volatility. If the price is above the 20-period EMA, the market is said to be in an uptrend. Whereas if price below the 20-period EMA, the market is said to be in a downtrend. As the pair starts to consolidate, the 20-day EMA becomes relatively flat and starts moves in a sideways manner.

The flat 20-period EMA is an indication that the trend has paused and that the market could reverse in direction. In order to confirm that this consolidation is a potential trade setup, we’ll refer to two indicators. The first of these is ATR, which is a measurement of the average trading range of a currency pair, using the default parameter of 14 periods. If we see the ATR indicator falling, it means the ‘range’ is shrinking, and volatility is decreasing.

Bollinger bands are also used to measure volatility. Bollinger bands split open when volatility is high and converge when volatility falls. Instead of using the Bollinger bands themselves, we use the Bollinger band width indicator, which is nothing but a measurement of the space between Bollinger bands. When we see the Bollinger band width indicator dropping, it confirms that the currency pair is in a period of consolidation and that the volatility is falling.

The reduced volatility does not necessarily mean a reversal or a breakout on the other side. We confirm this by adding a trend line and using the EMA for entering the trade. Let us discuss in detail about implementing the above concept in the form of steps.

Trade Setup

In order to explain the strategy, we have considered the Daily chart of USD/CAD where we will be illustrating a ‘long’ trade. Here are the steps to execute the strategy.

Step 1: First, we identify the trend of the market on the trading time frame using the 20-period EMA. This should be easy as it only requires us to see where the price has been trading with respect to the 20-period EMA. Longer, the price stays below or above the moving average, stronger is the trend.

As we can see in the below image, the price stays below the 20-period EMA for a very long period of time; hence, the market is in a strong downtrend.

Step 2: Next, we wait until the trend pauses and starts to consolidate. This is confirmed when both ATR and Bollinger band width starts moving in the same direction. That means, in an uptrend if ATR and Bollinger band width starts rising together, the market has entered into a phase of consolidation. Likewise, in a downtrend, if ATR and Bollinger band width starts falling together, the market has entered into a phase of consolidation. These are the early signs of reversal and that we should pay attention to the market from here on.

The below image shows how the market moves sideways when ATR and Bollinger band width start falling. Let us proceed to the next step.

Step 3: Here, we need to wait for the market to turn on the other side and start moving in the opposite direction. Once that happens, we plot a trendline in the direction of the reversal. The reversal is confirmed when the market respects the trendline and makes a ‘higher low’ or ‘lower high.’ When the market reverses from an uptrend, it should make a lower high at the trendline and in a reversal of a downtrend, it should make a ‘higher low’.

However, we enter the market only when the price closes beyond the moving average, i.e. above the EMA for a ‘long’ and below the EMA for a ‘short.’

In the case of USD/CAD, we can see in the below that the market makes a higher low and respects the trendline confirming a reversal. We have entered ‘long’ right at the close of the price above the EMA.

Step 4: Now, let us determine the stop-loss and take-profit levels of the trade. The stop-loss is placed just below the lowest or above highest point from where the market reverses. In a ‘long’ trade, it will be below the ‘lower low’ while in a ‘short’ trade, it will be above the ‘higher high.’ ‘Take-profit’ is set at a price where the resultant risk-to-reward (RR) of the trade is 1:2.

Strategy Roundup

The ‘Volatility’ strategy occurs over and over again and works well because of the recurring cycle of volatility. Although the above example shows a trade setup on the daily time frame chart, similar setups occur in other time frames as well. Note that the logic behind the setup and the market’s tendency to break out after a consolidation holds true in both long and short time frames.

Categories
Forex Signals

EURAUD Breakout Retest Buy

Flow Assessment

Overall buy flow, sellers are reacting off this area, but buys are holding.

Location Assessment

Price is at a buyers area and is being defended.

Momentum Assessment

There was a buildup of buyer positions and now price seems like it is retesting the area

Entry Price – Buy 1.68645

Stop Loss – 1.64283

Take Profit – 1.65866

Risk to Reward – 1:1.82

Profit & Loss Per Standard Lot = -$406/ +$738

Profit & Loss Per Micro Lot = -$40.6/ +$73.8

Fellas, now you can check out forex trading signals via Forex Academy mobile app. Follow the links below.

iPhone Users: https://apps.apple.com/es/app/fasignals/id1521281368

Andriod Users: https://play.google.com/store/apps/details?id=academy.forex.thesignal&hl=en_US

Categories
Forex Signals

Swing Reversal On EUR/CAD Currency Pair

Categories
Forex Signals

GBPNZD Breakout Anticipation Buy

Flow Assessment

Price is in a range, but it got to this range from an up-flow

Location Assessment

Price is near the buy-side of the range

Momentum Assessment

Buyers have built up positions and there has been an SL hunt, so the buys are ready

Entry Price – Buy 1.95324

Stop Loss – 1.95096

Take Profit – 1.95665

Risk to Reward – 1:1.46

Profit & Loss Per Standard Lot = -$154.4/ +$225.6

Profit & Loss Per Micro Lot = -$15.44/ +$22.56

Fellas, now you can check out forex trading signals via Forex Academy mobile app. Follow the links below.

iPhone Users: https://apps.apple.com/es/app/fasignals/id1521281368

Andriod Users: https://play.google.com/store/apps/details?id=academy.forex.thesignal&hl=en_USF

Categories
Forex Signals

GBPNZD Swing Failure Sell

Categories
Forex Fundamental Analysis

Understanding ‘Employment Trends Index’ and The Impact Of Its News Release On The Forex Market

Introduction

In any economy, the employment rate can be said to be the primary driver of economic growth. Due to its importance, several fundamental indicators track the labor market changes and many more attempting to predict the future of the labour market. Government and central banks’ policymakers may feel comfortable poring through all these economic indicators for the labour market, but for regular forex traders and households, keeping track of all these labour market indicators can be tiresome and even confusing. The Employment Trends Index (ETI), one of the most relevant labour market indicators, is making it easier to understand the labor market trends.
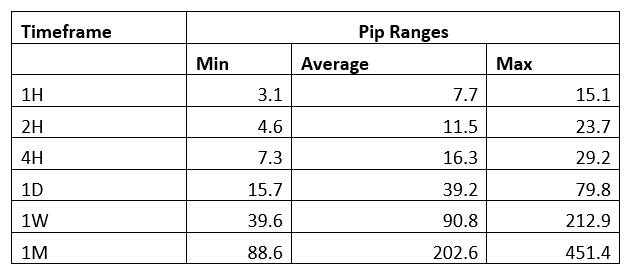
Understanding the Employment Trends Index

The Employment Trends Index is made by aggregating eight labour market economic indicators. The ETI report breaks down which labour market indicators positively impact the ETI and ranks them from the most positive to the least. Through the aggregation of these indicators, the “noise” in the labor market trend is filtered out. It is worth noting that these labour market indicators have shown to be accurate in their areas. These indicators are explained below.

Initial unemployment claims: This labour market indicator is collated and published by the U.S. Department of Labor. The indicator is published the Thursday of every week, and it shows the number of people who filed for the unemployment benefits for the first time. It is thus considered the latest indicator of unemployment.

Job openings: The U.S. Bureau of Labor and Statistics publishes this economic indicator. These job vacancies show the gap in the labour market that needs to be filled. It indicates the unfulfilled demand in the labour market and the desirable skills sought by employers. It further shows the potential of households to be gainfully employed in the short term.

Number of Employees Hired by the Temporary-Help Industry: The U.S. Bureau of Labor Statistics publishes this statistic. It shows the relationship between the labour market and business cycles since most businesses hire more temporary workers during peak periods and expansion phases.
The ratio of Involuntarily Part-time to All Part-time Workers: Published by the U.S. Bureau of Labor Statistics, this indicator shows the number of employees who are forced to work part-time. The indicator can be correlated to sub-optimal economic conditions, which would make filling positions full time uneconomical. An increasing ratio indicates worsening economic conditions.
Industrial Production: This indicator shows the level of output in sectors such as mining, manufacturing, and energy. The U.S. Federal Reserve Board publishes it. An increasing industrial production indicates that the employment levels are increasing while dropping industrial production levels signals higher levels of job loss.

Source: St. Louis FRED

Percentage of Respondents Who Say They Find “Jobs Hard to Get”: This indicator shows the scarcity of employment opportunities in the economy. Higher percentage signals either a stagnating or a shrinking economy. The Conference Board Consumer Confidence Survey publishes it.
Percentage of Firms With Positions Not Able to Fill Right Now: This statistic shows the lack of particular expertise in the labour market. It is published by the National Federation of Independent Business Research Foundation.
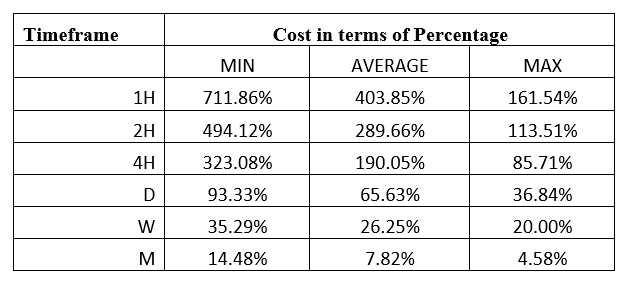
Real Manufacturing and Trade Sales: This indicator shows the level of engagement in the labour market, and the U.S. Bureau of Economic Analysis publishes it.
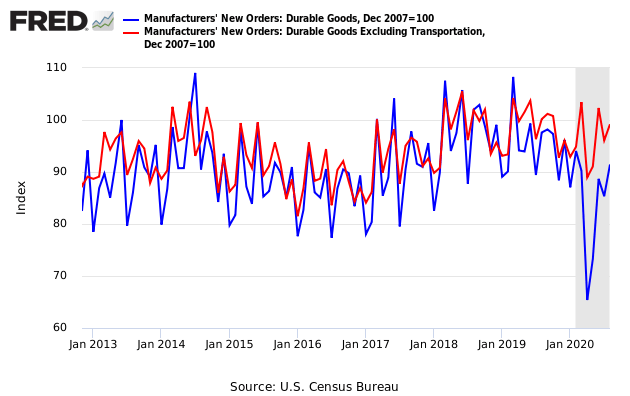
How to use the Employment Trends Index an analysis

The fact that the ETI aggregates most of the crucial labour market indicators makes it an ideal tool for analyzing the economy.
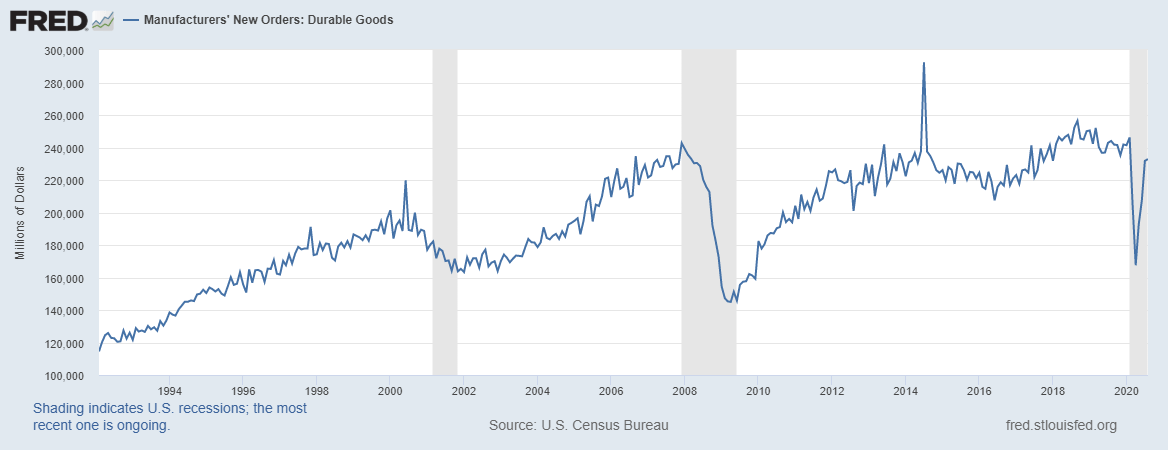
Since the labour market is considered one of the primary drivers of the economy, monitoring its trend can be used to detect the onset of recessions or recoveries. Here’s how. When the ETI is continually dropping, it indicates that the labor market conditions are worsening progressively. This condition is accompanied by a constant drop in the aggregate demand and supply, most consumer discretionary industries will go out of business, and the economy will progressively contract. Conversely, during a period of economic recession, an increase in the ETI signifies that the economy is on a recovery path.
An increase in the ETI does not necessarily mean that each of the underlying eight labour maker indicators improved. A higher ETI could mean that most of these indicators were positive, or they all were. In either of these instances, it means that the overall labour market is improving – it shows that labour conditions are improving. One of the most notable impacts of an improving labour market is the improvement of households’ welfare, which increases the aggregate demand and supply in the economy.

Source: St. Louis FRED

Conversely, a dropping ETI could be caused by a majority of the underlying labour market indicators being negative or all of them being negative. In either of these instances, the labor markets’ conditions are deteriorating, a condition usually punctuated with higher unemployment levels.

Impact on Currency

The ETI could be associated with contractionary and expansionary monetary and fiscal policies. Here are some of the ways that the ETI could impact a country’s currency. A continually increasing ETI means that the labour market has been enjoying a long period of constant growth. Such an instance signifies that the economy has been expanding, the welfare of households improving, and the unemployment levels low.

In any economy, if these conditions are not sustainable, an overheating economy with unsustainable levels of inflation becomes prevalent. In this case, the governments and central banks may be induced to implement contractionary monetary and fiscal policies. Thus, in the forex market, an increasing ETI can be a precursor for higher interest rates, which makes the currency appreciate relative to others.

A constantly dropping ETI is negative for the currency. The dropping ETI means that the overall labour market has been performing poorly. It means that more people are losing their jobs, wages are low, overall aggregate demand is dropping, and the economy is shrinking. With higher unemployment levels, governments and central banks tend to implement expansionary fiscal and monetary policies to stimulate demand and prevent the economy from sinking into a recession. These expansionary policies, such as lowering interest rates, makes the currency drop in value relative to others. In the U.S., the ETI data is published monthly by The Conference Board.

How the Employment Trends Index Report Release Affects Forex Price Charts

The latest release of the ETI report was on September 8, 2020, at 10.00 AM ET and accessed at Investing.com. The screengrab below is of the monthly ETI from Investing.com. To the right is a legend that indicates the level of impact the fundamental indicator has on the USD.

As can be seen, low volatility is to be expected.

In August 2020, the ETI was 52.55 and increase from 51.37 in July 2020.

Now, let’s see how this release made an impact on the Forex price charts.

EUR/USD: Before the ETI Report Release | September 8, 2020. Before 10.00 AM ET

As seen in the above EUR/USD chart, the pair went from trading in a neutral trend to a steady downtrend. The 20-period M.A. is steeply falling with candles forming further below it.

EUR/USD: After the ETI Report Release on September 8, 2020, at 10.00 AM ET

After the ETI report release, the pair formed a bearish 5-minute “Doji” candle. Subsequently, the pair adopted a weak bullish trend with candles forming just above the 20-period M.A.

Bottom Line

In the forex market, traders rarely pay close attention to the ETI. Most traders prefer gauging the underlying aggregated indicators separately, which explains the lack of impact by releasing the ETI report since the index shows what traders already know. It only serves to show the trend.

Categories
Forex Signals

USDJPY Swing Failure Sell

Flow Assessment

Buyers slowing down at a key sell area on H4.

Location Assessment

Price is close to H4 sellers area and buyers are not breaking through.

Momentum Assessment

Buyers are showing signs of failure on the 2nd try to make a higher high.

Entry Price – Sell 105.611

Stop Loss – 105.945

Take Profit – 104.400

Risk to Reward – 1:3.63

Profit & Loss Per Standard Lot = -$315.7/ +$1145

Profit & Loss Per Micro Lot = -$31.57/ +$114.50

Fellas, now you can check out forex trading signals via Forex Academy mobile app. Follow the links below.

iPhone Users: https://apps.apple.com/es/app/fasignals/id1521281368

Andriod Users: https://play.google.com/store/apps/details?id=academy.forex.thesignal&hl=en_US