The Sniper’s trading strategy is recommended by dozens of bloggers and mentioned within informative resources. Even simple web pages (landing pages) are created for it. The strategy has at least five different versions. It represents a commercial system based on the analysis of the price of an asset without using indicators (Price Action) and the definition of local and global levels in different time intervals. The question is: Is it worth buying it and spending your time studying the system? The answer is found in this article.
Sniper Strategy: Everything New is Old?
Tell me, please, how do you evaluate the effectiveness of the indicators of technical analysis that almost at every step are criticized for delays, need for constant optimization, inability to react to force majeure, etc.? Even applying several oscillators on a chart, indicators are likely to give radically opposite signals. And if of the hundreds of existing indicators none are accurate, does it make sense to use them?
«. One of them is the commercial system of «Sniper», which is considered one of the most popular in the commercial sector of the years 2012-2018.
In this article you will learn:
- What is Price Action technology and what are its strengths?
- What does the commercial system of «Sniper» represent being one of the options of Price Action? Concept and rules of use.
- The main tenets of the Sniper strategy, examples, and rules of placement of orders. Advantages and disadvantages of the strategy.
- A brief analysis of the updated strategy of Sniper X.
Price Action is «price action». The founder of the analysis Charles Dow considered that price contains all the necessary information. Political, economic, and psychological factors are already considered in the action of the price (or movement of price). Everything is already included in the price, which means that you just have to analyze its “behavior”, and so here the technical indicators are impotent due to its lack of flexibility (rapid reaction to market changes).
Price Action’s theory of analysis considers the following moments:
-It is always said that the market is chaotic in the short term, therefore the method is effective in long-term trading in the daily interval.
-The theoretical basis is the formation of behavioral models that take into account the mood of the majority. Here more attention is paid to the psychology of traders who in most cases act in the same way.
-The system operates in the trend market where the trader is offered the possibility to follow the flow of the majority. No point in trading at long flat intervals including swaps
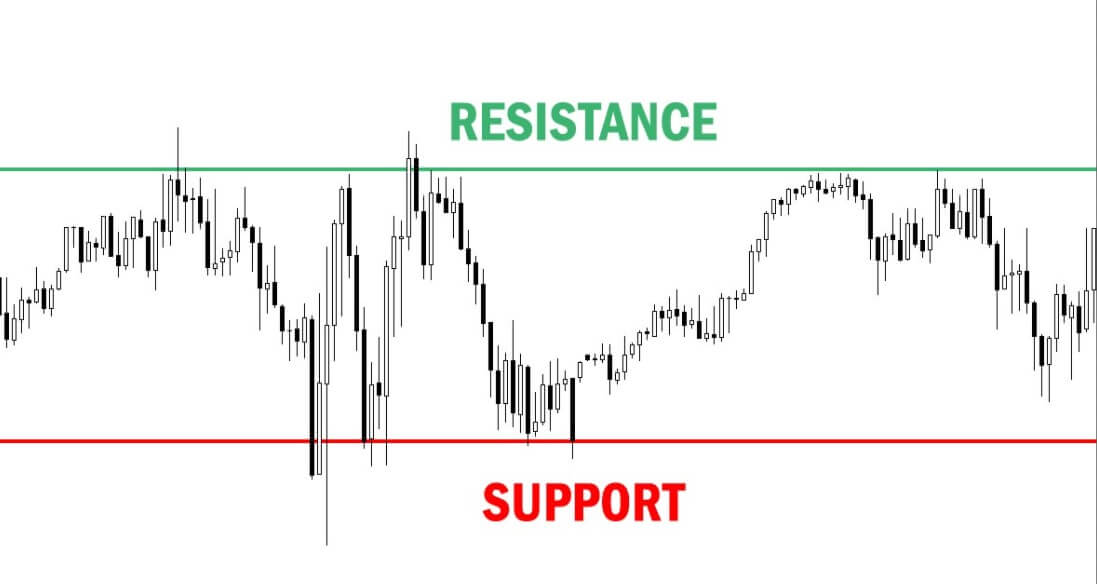
-Price Action instruments are patterns (shapes that are formed in a stable way), resistance, and support levels that have different construction variations (Fibonacci, round levels and etc.). Price Action’s comparative analysis and indicator analysis are described here:
Advantages of Price Action
It allows the combining analysis without indicators with any other commercial system. The patterns can serve as a confirmatory signal for the indicator strategy; through the levels, you can place pending orders. It also takes into account market psychology (collective group behaviour).
Advantages of trade with indicators:
-Gives a relatively precise signal to the opening of operations (the coincidence of several factors).
-Allows the forming of algorithmic commerce.
Disadvantages of Price Action:
-Subjective method of determining patterns and levels.
-It is almost impossible to automate trade, trade advisers are not operable.
Trade disadvantages with indicators:
-There are difficulties with defining the point of closure of operations
-There are problems with combining various commercial systems. For example, the application of several different indicators only increases the number of false signals.
A logical question arises: Will it be possible to apply this strategy to the Price Action system by using the pattern and level building indicators? Share your opinion in the comments.
Forex Sniper Strategy: Trade Principles, Their Advantages, and Disadvantages
Sniper’s trading system is based on the principle of Price Action technique. The idea of the strategy belongs to Pavel Dmitriev who proposed it almost 10 years ago. In the reviews, you can find the comments that it is just another elaborated version of such tactics as «Meat», «Meat-2, and «Alive System». Those interested in these systems can find more information about them and share them in the comments.
Curious fact.
When this strategy came to light, Pavel Dmitriev’s name was little known. But everything changed when dozens of groups were created on social networks, accounts on trading forums, where a massive discussion about tactics began. In the main phase, the cost of the strategy was $300-500. To attract beginners the runners-kitchens and «business coaches» proposed a course on strategy for free or with a big discount, which aroused more interest and caused disturbance. The course was really necessary. The classical trade of levels was so tangled that at first glance it was difficult to understand it. And, perhaps, the best question you can ask yourself would be, what is the reason you need a tactic where there are a multitude of differences in readings and you have to “kill” so long to learn the basics if there are a lot of much simpler technologies? The answer is simple: a well-organized marketing campaign.
Sniper’s tactic partially breaks Action Price’s thesis. It is designed for short intervals of 5 minutes intraday with a short range of earnings in a transaction, therefore to some extent, it can be scalped.
To cast a veil over the classical theory of technical analysis in this strategy, the author made the decision to elaborate his own terms:
-Banking level (BU) is the level at which the previous day’s daily sail is closed. The schedule is GMT (21.00 Moscow time).
-Levels obtained at the minimum and maximum price points of the previous trading day.
-Total impulse (TIU) levels are resistance and support levels that are formed at the upper intervals (М30 – Н4).
-Trends levels of rapid change (URST) are a candle with a long tail in the direction of the trend in a short interval (М5 – М15). In a word, a candle that evidences the breaking of key level and the beginning of reversion.
-Impulse levels (UI) are resistance and support levels that prevent flat in the М5 range.
-Insurance is the closing of a take-profit (profit taking) transaction of 50% equal to stop-loss.
Sniper principles with author terms:
-Trade takes place only in the course of the trend.
-The transaction opens only in short intervals. The main ones are M1 and M5.
-Entry points are searched at the closing ends of the previous trading day, therefore for analysis two graphs are used at once.
-To evaluate the entry points are used bank levels, levels of the end of the previous trading day, where large players perform the maximum amount of transactions.
-The Total Impulse Levels formed in the hour graph are used as a confirmation instrument.
A transaction is closed according to the «Insurance» rule (it is opened with two orders). After receiving winnings of a few points, 50% of the transaction is closed. The size of the winnings until partial closure is equal to stop-loss. If after the partial profit-taking the price turns and the transaction closes at the stop-loss, the trader will end up at the break-even point (breakeven). The target level of winnings is 30-50 points per day from 1-3 transactions.
Step 1. Classical technical analysis imposes a preliminary analysis of the high interval to define the direction of the trend and the area of a conglomeration of sellers /buyers. The author proposes to begin the determination of levels by taking as default the so-called Banking Level, which implies a shift of the schedule for 3 hours until the end of the day regarding 00.00 MSK (since the author is from Russia). According to him, the 21.00 level (MSK) is the critical point at which banking transactions are closed (in order to avoid swap). Since banks are the main market makers and liquidity providers, their transactions can mark a solid price level.
In the pages of an investment forum, I found the results of interesting research. According to her, commercial systems that operate in the intervals from Hi and above are not sensitive to GMT of brokers. In addition, the pattern of formation of the reversion pattern based on the closing price of the previous trading day had already been studied previously in the theory of technical analysis, so the author did not contribute anything new in the analysis:
The rationale of this step is questionable.
Step 2. The banking level is only a baseline while the main limiting levels serve as extremes of the previous trading day.
Here too we must add that there is another term of the strategy – Consolidation Zone. Before you close the trading day to a large part of transactions is closed to save on the swap, the Asian session begins which is characterized by relatively small transaction volumes. Because of the liquidity appears a night zone of consolidation that in reality is flat.
Step 3. Definition of UTI at the upper and UI intervals at the lower. With the impulse level, the author understands a certain range of the price range in a short interval, which is the horizontal movement zone of the price or an ordinary flat.
In the forums they are constantly discussing the definition of consolidation zones and UIs. Many simply do not see the difference between them, and you can understand them in some way. Please note that screenshots are just examples of how the author understands the strategy. The determination of all these zones is subjective!
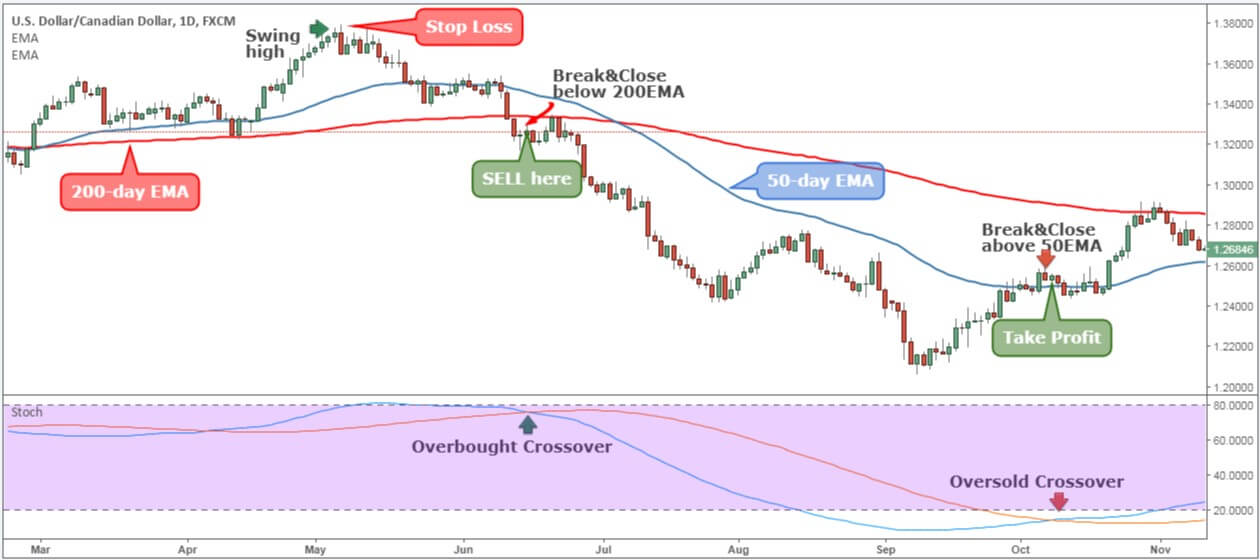
With the trend level of fast price change, the author understands the classic pattern «pin bar» which represents a candle with a relatively long shadow with respect to other candles in the direction of the trend.
Principle of opening transactions. Sniper’s strategy proposes to take as a starting point the strong limiting levels of the previous trading day that are determined in the upper time intervals. After the extremes of the previous day projected for the next day have been determined on both sides, the consolidation and flat zones are defined in the short intervals, the local impulse levels within the daily extremes are determined.
Options for Opening Transactions
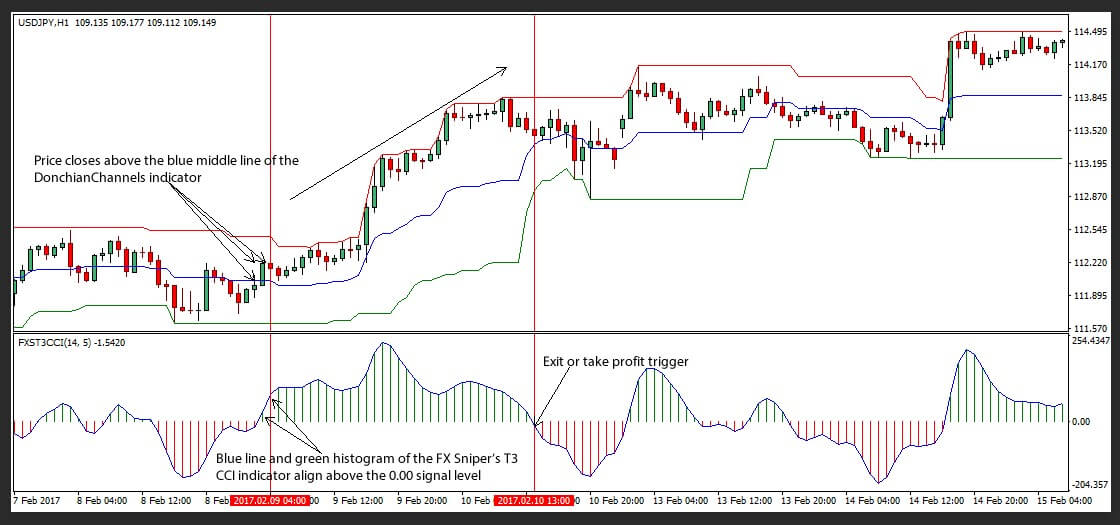
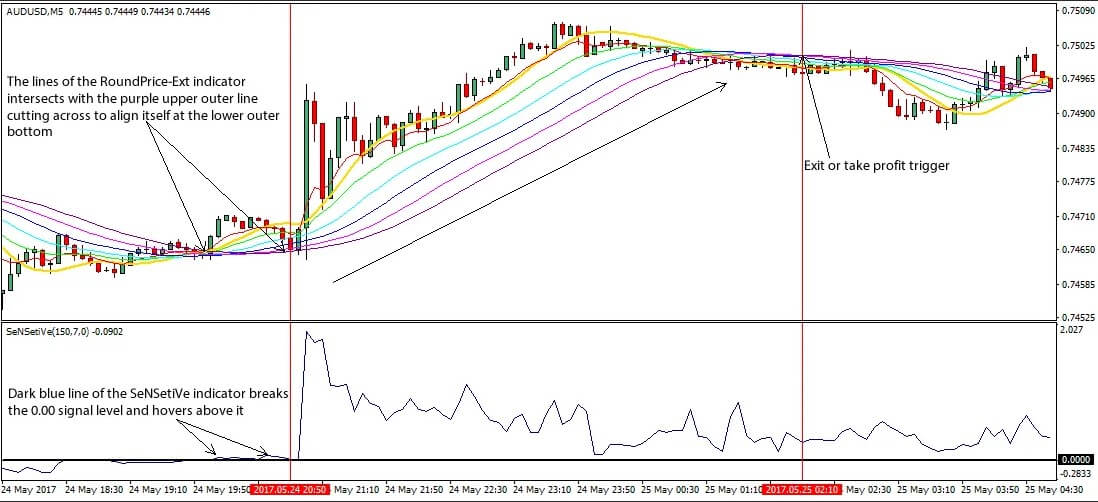
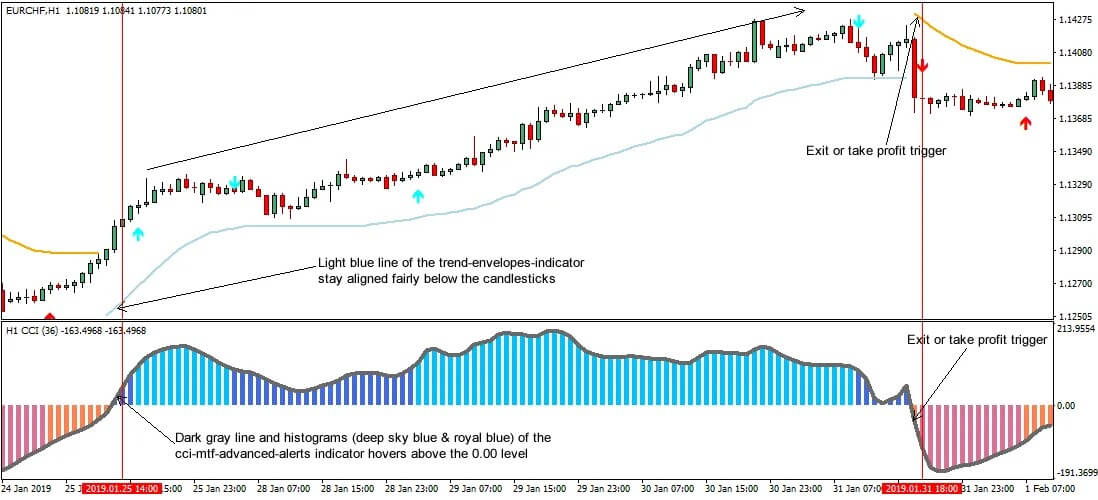
Trend opening. Each transaction is opened in the pin bar at the moment of breaking the impulse levels formed in the consolidation zones in the M1-M5 range in the direction of the daily channel boundaries. This example is in the screenshot above: as soon as the bar pin appears, a short-term transaction has to be opened.
Opening of counter-trend. The transactions are opened in setbacks from the banking or UTI levels, that is, in setbacks from the global daily limits or levels formed by the market makers.
As for the conditions of determining the actual break, there are plenty of options. According to one of the options, the actual break is a bar pin that exceeds the local range (UI) by 4 points. According to another option, a transaction can be opened if the recoil from the upper or lower limit has been more than 15 points (the flat range in the M1-M5 is usually less, therefore this recoil may show the break of the range).
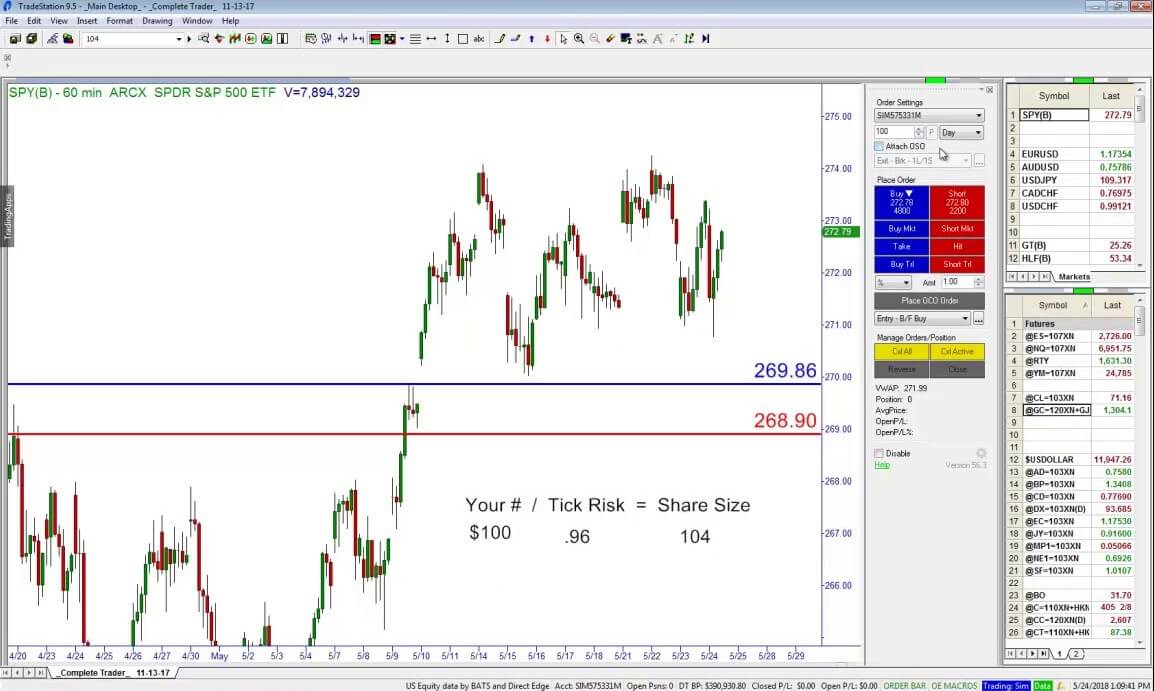
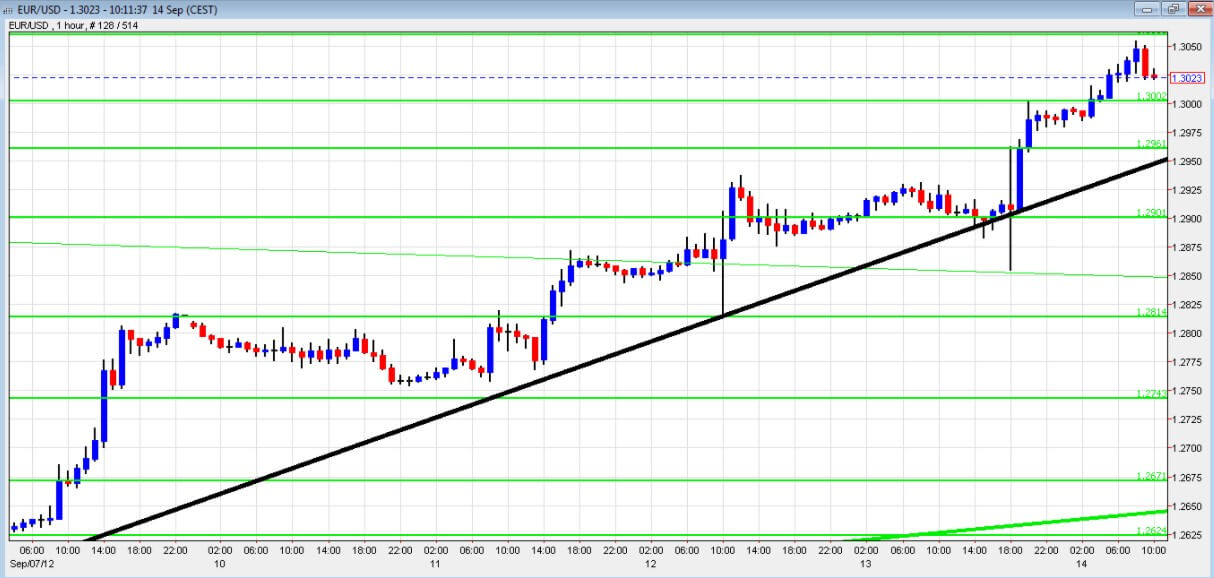
Terms of the transaction closure. The transaction is closed with two orders. The first command closes in the take-profit, which is set from the opening point at the same distance as the stop-loss. In the case of the trend opening (when the local impulse levels of M1 are exceeded) the stop is placed at the level of the ends (shadows) of the range (10-20 points).
In the interval М1 a narrow range is formed (I do not take into account long intervals). The length of the stop (red line) is about 10 points. As soon as the lower limit of the range is broken, a short transaction is opened with two commands (yellow line). The take-profit is equal to the length of the stop (green line).
In the case of counter-trend opening of the transaction (if there is a setback from the UTIs in the long intervals). The exit from the market is similar, the only difference is that when establishing the take-profit it makes sense to orient in the potential flat formations in a short interval.
My observations are as follows:
-The strategy does not work during news publications, that is, at a time when the market is virtually unpredictable and chaotic.
-You must not open transactions within the impulse range.
-You should not trade multiple currency pairs at the same time. Focus on a currency pair.
It’s good to know the theory, but in practice, it’s not easy to monitor all these models without a trained eye. Therefore, I consider this strategy more useful for beginners than for professionals, who already operate successfully with patterns and levels.
It can be said that it is more a successful marketing product, wrapped in a «beautiful packaging» than a «grail». The creators of the system simply copied the classic concepts of technical analysis, combined them with the rules of risk management, and added new terms in the descriptive part (actually, it’s the alphabet of trading but with more complicated and intelligent terms). This gave beginners hope that a really good product would appear on the Fórex market. Then the digital distribution of the strategy with enthusiastic reviews was enough to turn it into a commercial success.
Advantages of Sniper Strategy
Sniper is an excellent simulator for demo accounts that will help you learn how to detect the emerging sailing figures, levels and etc., and follow the rules of risk management (ie, discipline).
This is where your advantages end.
I would not recommend targeting profit only by following the rules of this strategy. Rather, it makes sense to use some principles of the strategy and combine them with indicators.
Disadvantages of Sniper Strategy
This strategy is difficult to understand. The classical theory of trading with levels (it is more often applied as additional) here is so extremely confusing that, logically, it is very difficult to understand it even after having read it several times. Different online resources have their own interpretation of the strategy.
It is virtually impossible to automate the strategy. Manual trading is exceptionally accepted, and since no indicators are used in the strategy it is also not possible to test it in historical charts.
The effectiveness of the strategy grows only in the case of strict compliance with the rules of its operation. The initiative here is sanctioned. However, the same rules are so confusing that each is interpreted in its own way. Therefore, here much depends on the skills and intuition of the merchant.
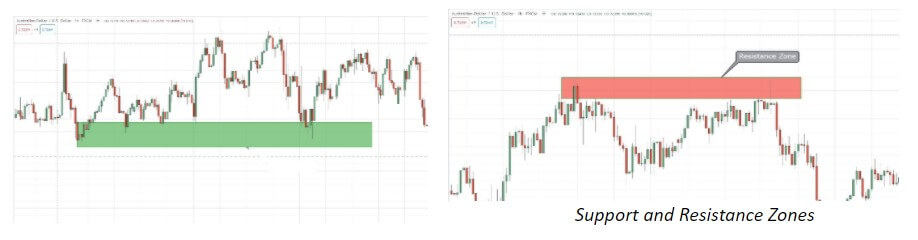
During the analysis the determination of resistance and support levels, the flat area causes many discrepancies.
The commercial system of «Sniper» is the classic technical analysis with changed terms. They were repeatedly modified by the creators (there are at least 4 elaborated versions of the strategy), although they did not change them in a radical way since all those manipulations were meant to provoke the interest of beginners and maintain the marketing background created. One of these examples is Sniper X.
Sniper Х: Even the Best is Perfectible
It may seem that one can still «extract more» from classical technical analyses, which can also be interpreted in any way. But the creators are not yet ready to sleep on their laurels. In 2018 on the Internet appeared another version called “Sniper X”, which has the following differences:
Medium- and short-term trade tactics were added (the previous version of the trading system had only short-term opening of transactions).
A new algorithm was developed to work with correctional movement to determine the limits of correction zones.
There is possibility to increase the volume of open positions in a strong trend (in the terminology of the creators, it is the entry point of cascade).
Instead of the NI and NTI new term was implemented – the local and global level of imbalance, and the algorithm of its creation was also revised.
The creators assure that in the system is solved the problem of detection of local micro-trends (estimation of price direction in M1-M5). Guidelines for possible price behaviour were also developed when approaching resistance and support levels. Personally, I have not found out if they correspond to reality and if they are about to become the «Grail» or not. Those who have more patience to study them better, please leave comments on their results. I thank you in advance!
Conclusion
Do you propose to buy the Sniper strategy as a unique product? Don’t let them fool you! All of its versions can be found freely accessible and believe me, however well the Sniper system is camouflaged, it’s just one of the versions of the Price Action strategy, where no one can guarantee a successful outcome. Be aware and don’t be in a rush to buy what professional marketers are insistently and convincingly trying to sell you.
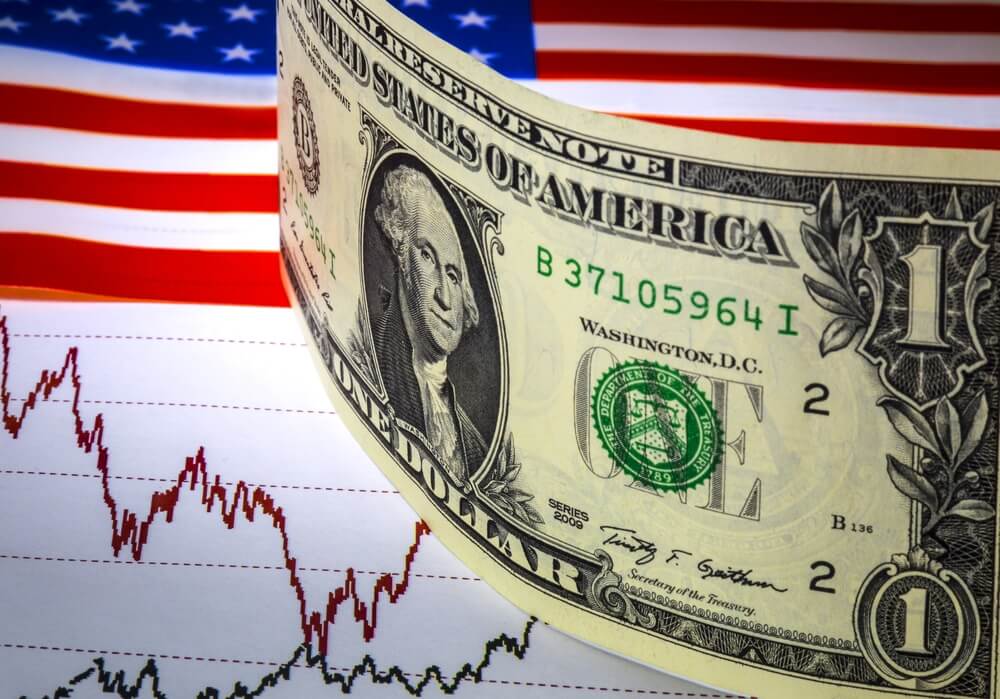


 Having left the gold standard in the 1960s, most currencies across the globe are no longer backed up by equivalent amounts of hard assets. This left much room for the governments and banks to manipulate the circulation of currencies, increasing the overall money supply. As more money is printed, consumers demand more goods, which results in increased prices. The overall volume of money in the market does not only refer to the cash that circulates in the economy, but the digital money as well (bank accounts), and any changes will have an impact on both. Forceful printing can have terrible consequences like what happened to Zimbabwe, which kept printing more money to the point of its official currency becoming entirely worthless.
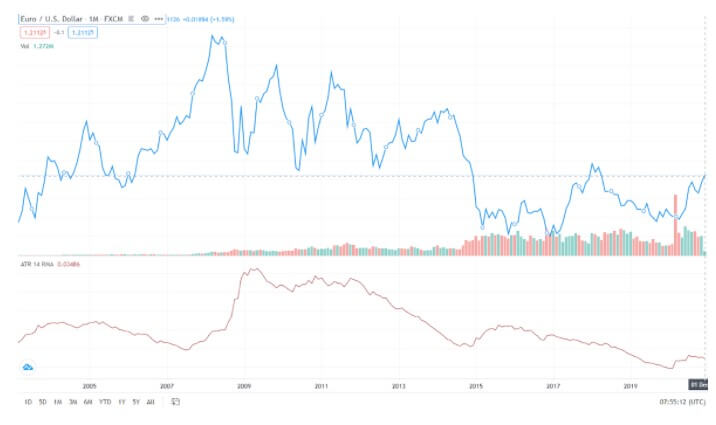
  Market volume always changes and, sometimes, the volume can be really
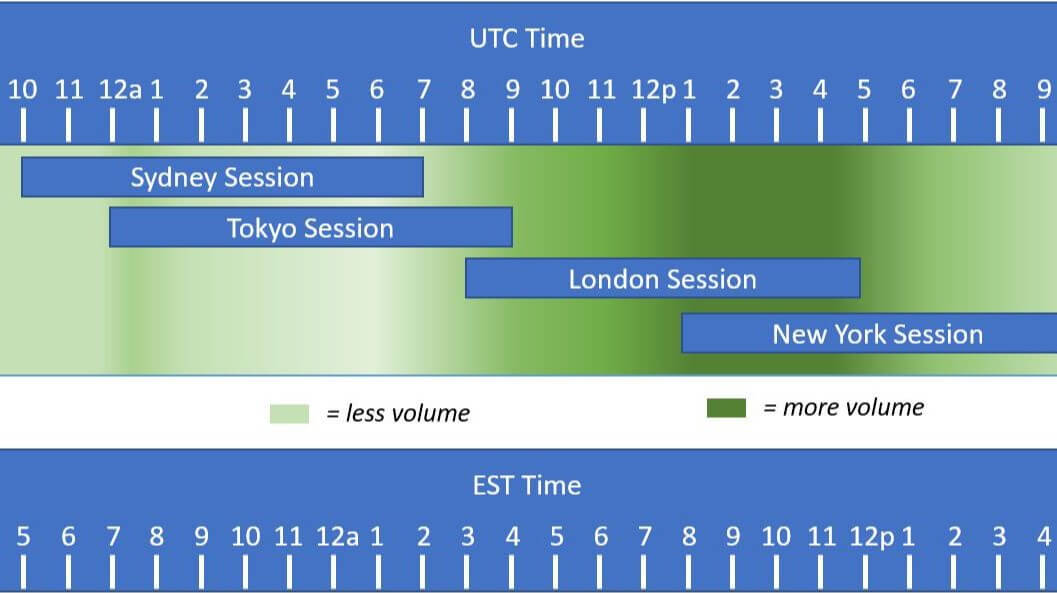
  Volume indicators are believed to be one of the most important constituents of professional traders’ algorithms. Not only do they increase the chance of winning in each trade but they also serve to prevent losses, which is a prerequisite for sustainable success. However, it is important to distinguish between
  The
The  Volume indicators are
  Volume will