Categories
Forex Basics Forex Daily Topic

The Trading Log: Key Component for a Pro Trader

At forex.academy, we understand that a trading record is a decisive component to be successful in Forex. That’s why we took the time to create a free trading log on an Excel Spreadsheet. It was designed to present all the needed information at a glance. Here we present its guide.

The Stats Section

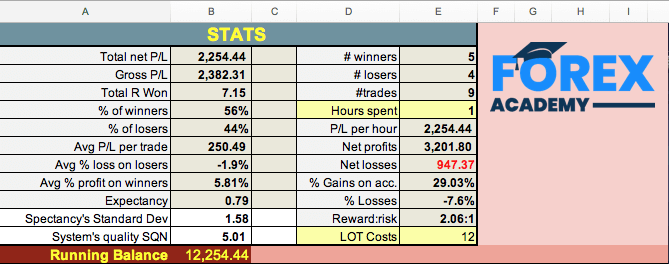
The top of the spreadsheet shows the Main statistics of your trading record. 

Total net P/L: The net profits after the trading costs. You can set an average cost in the bottom right cell named “LOT Costs”. If you enter the lot cost, the sheet will compute every trade cost by multiplying it by the actual lots of the trade. Of course, you can set it manually on every trade with the exact costs your broker charged.

Gross P/L: The total profit without costs.

Total R won. R is the measure of your risk. The “R multiple” column converts the net profit into a ratio Net Profit/$Risk. R is a measure of the profit/loss for every dollar risked.  This helps you plan your objectives and calculate the risk needed to achieve them. For example, if you find that you are making 20R per month and plan to earn 3000$ monthly, you will need to risk $3000/20 = $150 on every trade.

% Winners: The winner percent figure.

% Losers: The percent of losers

AVG P/L per Trade: The average dollar won/lost. It is the Total net won/lost divided by the number of trades.

Avg % loss on losers: The average percent capital lost on losing trades.

Avg % profit on winners: The average percent capital won on winning trades.

Expectancy: A measure of what you can expect to gain in the next trade for every dollar risked. The example shown is 0.79, which means you can expect to earn $79 every time you trade if your risk is $100.

Expectancy’s Standard Dev: A statistical measure of the variability of the expectancy figure. You can expect that 95% of  Expectancy’s values are plus and minus two stdev from 0.79.

#winners: The number of winners.

#losers: the number of losers.

Hours Spent: this is a manual input of your time spent in trading.

P/L per hour: It will compute your profit per hour spent in trading.

Net Profits: These are the net profits on winning trades.

Net Losses: The losses on losing trades.

% Gains on account: The total sum of the percent gained on winning trades.

% Losses: The sum of the percent lost on losing trades.

Reward:risk: The average reward/risk of your trades.

LOT Costs: This is a manual entry for the average costs per lot your broker charges you.

Running Balance: The initial capital ( Cell B17) plus the total net P/L amount (on closed trades).  Please note that this balance does not take into account open trades.

Total costs: The sum of the cost of spreads and commissions of your trades. This parameter will help you understand how much of your money goes to your broker. It could be handy if you want to negotiate rebates or shift your business to another cheaper broker.

The trades

The cells in columns with a yellow heading are for you to enter manually. The rest were filled with the needed formulas to get the stats figures, so there is no need to touch them when trading.

The exception is The Trade Cost column. This column is also filled with the formula to approximate your costs if you supply the average cost per lot in the B12 cell. But you can also manually enter your true cost.

Entering a Trade

We have designed the sheet so that you have total control over your risk on every trade. Therefore, we should begin to enter the desired percent risk for the coming trade. Let’s say 1%.  With this figure, the sheet computes the dollar-risk based on your current account balance.

After entering the entry price and stop-loss level, it will also compute the recommended trade size in lots. You should then input the real lot number in the following column, “Real lots.” It was designed that way because we must take into account several open trades at the same time.

How the sheet computes the risk of the next trade?

When allowing several simultaneous trades, the model chosen to compute risk is to subtract the risk of the previous open trades to the available capital. That way, you risk a percent of the money not currently at risk.  But when you close a trade and record it, the sheet recalculates all cells. Thus, the sheet needs the “Real Lots” column, so the record does not get modified every time an open trade is closed.

After the trader decides the percent of his account to risk on a trade, the real lot size, and the entry and stop-loss point are set, the sheet also shows the leverage of that trade. That way, all the risk information is displayed. Please, beware that a risk of 3 percent corresponds with a leverage of 10, and that leverages over 10:1 should be avoided, especially when several trades are open on major currency pairs.

JPY pairs

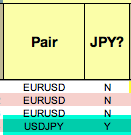
The column JPY? was added for the right calculation of JPY pairs’ values, as these pairs’ pip value is in the second decimal place instead of in the fourth decimal. You should input Y on these pairs to get the right trade size, profit, and leverage. Please, note that pip values on non-USD quote currencies are approximate.

Entry and exit date and time

These are optional entries, but it is advisable to register these values to get observations about the average time on a trade and the average time for a trade to hit stop-loss and take-profit levels.

Trading results

Once the Exit price has been entered, the sheet displays the profit/loss (P/L), Net P/L, %P/L and R multiple of the trade. This will help assess essential parameters, such as the average Trade profit, the usual percent obtained, and the real reward/risk values (R), which is also the profit on a one-dollar risk.

Trade quality

Alexander Elder recommends traders value the quality of the trade based on one objective parameter: The percentage of the available profit you could obtain from the trade.

One possible scale is 0: less than 10%, 1: from 10 to 25%, 2: from 25, to 50%, 3: from 50 to 75% 4: from 75 to 90%  5: over 90%. This will help you see if, over time, you’re improving, maintain, or decrease the quality of your trades. It will reveal the best times of the session to trade.

MAE/MFE

These are to annotate the Maximum adverse excursion and Maximum Favorable excursion. These two parameters are important clues to improve stop-loss and take-profit levels. It will help you also analyze if your entries are too early or too late and take measures to correct them. For more on this subject, please read an MAE/MFE explanation here.

Summarizing

We hope this spreadsheet will help you be a better trader. Please modify and complete it at will for your purposes.  This trading log is not perfect, but it is a starting point.

Categories
Forex Course

205. How Global Equity Markets Affect The Forex Market?

Introduction

The equity market is also referred to as the stock or share markets. This is an extensive marketplace where traders and investors purchase and sell shares of the publicly listed organizations. The company’s share, stock, or equity is an important financial instrument that denotes the company’s ownership. Contrary to the market, when you buy a share in the stock market, you own a percentage of the company’s overall shares.

Global equity markets have a direct impact on the Forex market. A stable equity market reflects a good currency. Generally, when the country’s equity market is performing well, it attracts higher foreign investors. Therefore, it increases the demand for the local currency, resulting in a boost in a positive trade balance as well as currency appreciation.

Contrarily, when the equity market is not performing well, the investors begin to pull out their money and invest in safer securities. This results in a decrease in the demand for a particular currency.

Impact Of Global Equity Markets On The Forex Market

Forex and equity markets trades center on the currency exchanges of various countries. In case there is a rise in the equity market, more international investors will want to put their money in that particular stock.

However, to do the same, they need to transfer their local currency to the currency of a particular country. This increases the currency demand for the nation. So when there is a huge demand for the currency, its value naturally increases in the market.

Example Of How The Equity Markets Impact Forex Market

If you are looking to invest in the UK’s stock market and your local currency is US dollars. So you need first to change the USD to GBP. This way, you are selling the US dollar while purchasing the GBP.

When more people sell the USD to buy GBP, it increases the demand for pounds, thereby boosting the value of the GBP. Additionally, it also contributes to a positive trade balance. On the other hand, since more US dollars are being sold, it increases the supply of USD, which results in a fall in the value of the dollar.

So when the demand for the currency rises, its value appreciates. This makes the forex market more bullish. Similarly, if the currency demand falls, its value will also fall. It will make the forex market more bearish.

We hope you got the gist of what we are talking about. In the upcoming course lessons, we will be learning more about various equity markets and how their movement can be used to predict the Forex price charts. Cheers.

[wp_quiz id=”101514″]
Categories
Crypto Daily Topic Forex Daily Topic Forex Videos

Forex Trading Algorithms Part 7 Elements Of Computer Languages For EA Design!


Trading Algorithms VII – Liberal sequences and exact sequences

Translating ideas into a trading algorithm is not always easy. When examining a particular trade idea, we could find two cases: 

  • the signal can be described precisely in a consecutive sequence of trading facts, or 
  • Several conditions with variable steps among each condition need to be spotted.

The first class is easier to program. To this class belong any kind of crossovers: 

  • price to MA: 

  • MA to MA :

Similar conditions can be created with indicator crossovers and level breakouts.


Trading Signals Using Pivots

But what if the idea is more complex?. Let’s consider we want to catch pivot points in the direction of the trend. Let’s say we want to open a buy trade in the second pivot reversal. Let’s follow Pruitt’s example:

Buy on the second pivot pullback if

1.- The second pivot high is higher than the first pivot

2.- The pullback is larger than 2%

3.- The sequence takes less than 30 bars


The Flag Model

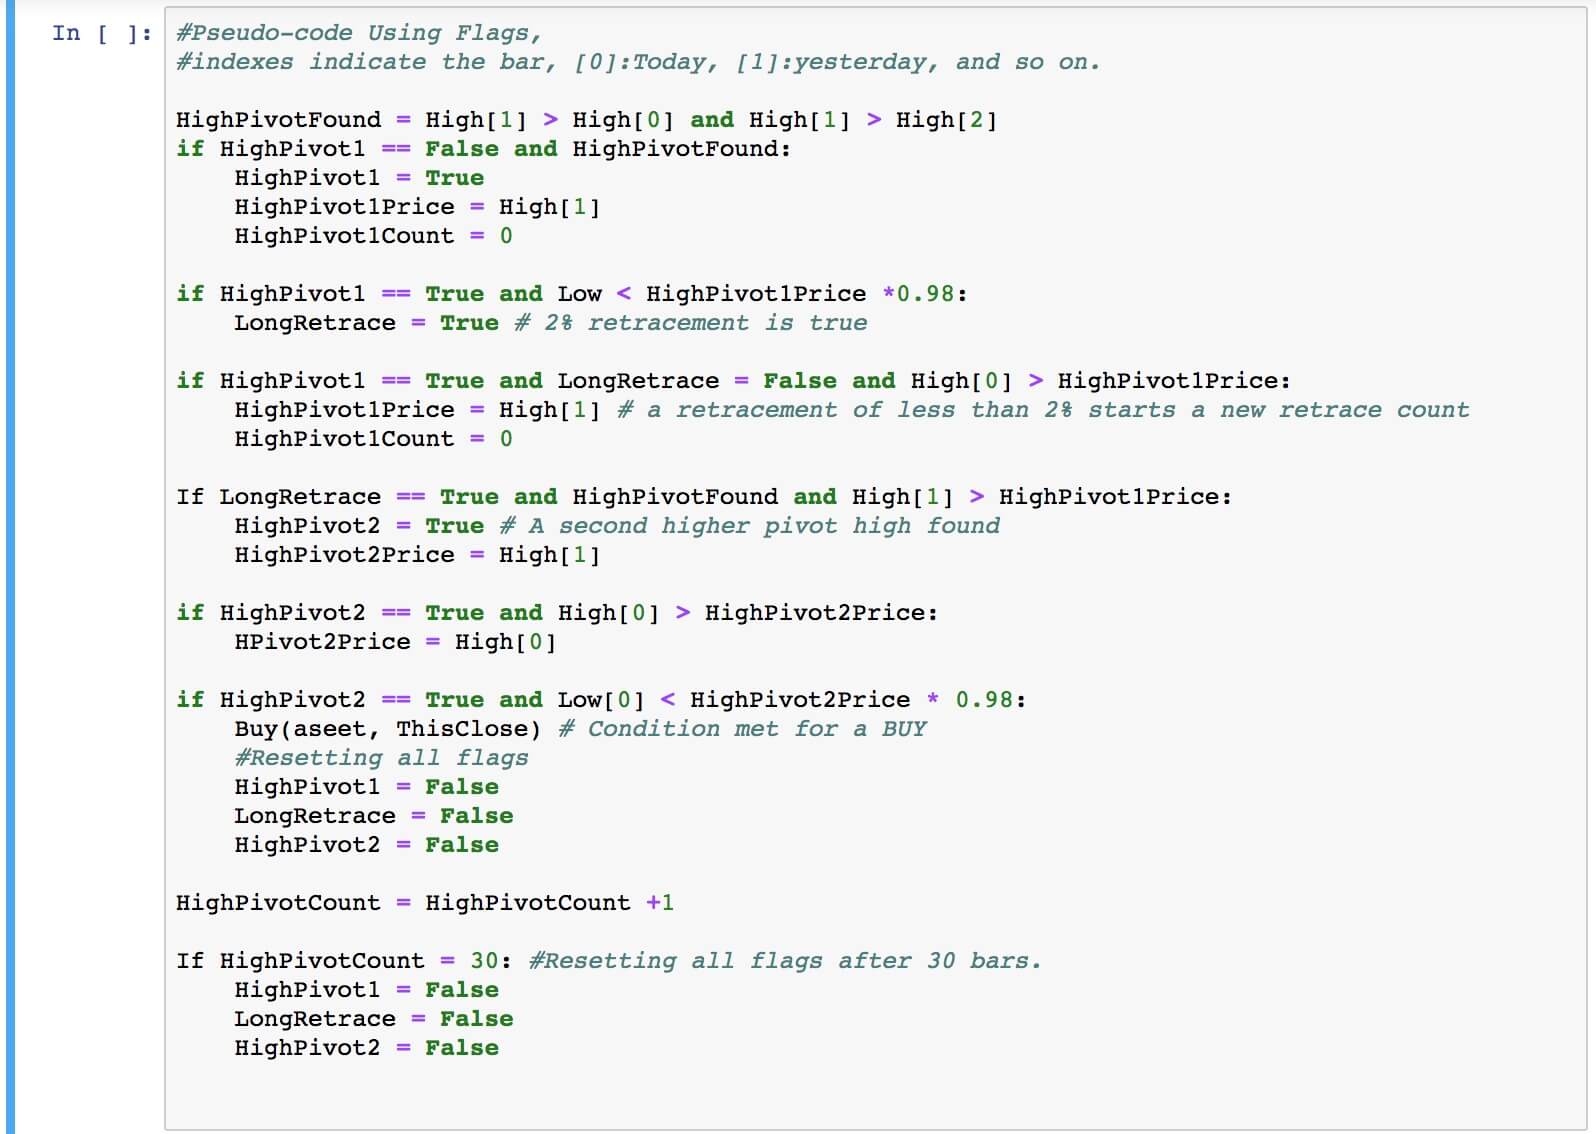
Since these conditions happen with variable price-action sequences programming, this kind of entry is much more difficult if we employ just If-then-else statements. The employment of flags to signal that a specific condition was met helps in the logic but is not the best solution.


As we see, the flag model is awkward and not too flexible. Also, this method is prone to errors.


The Finite State Machine

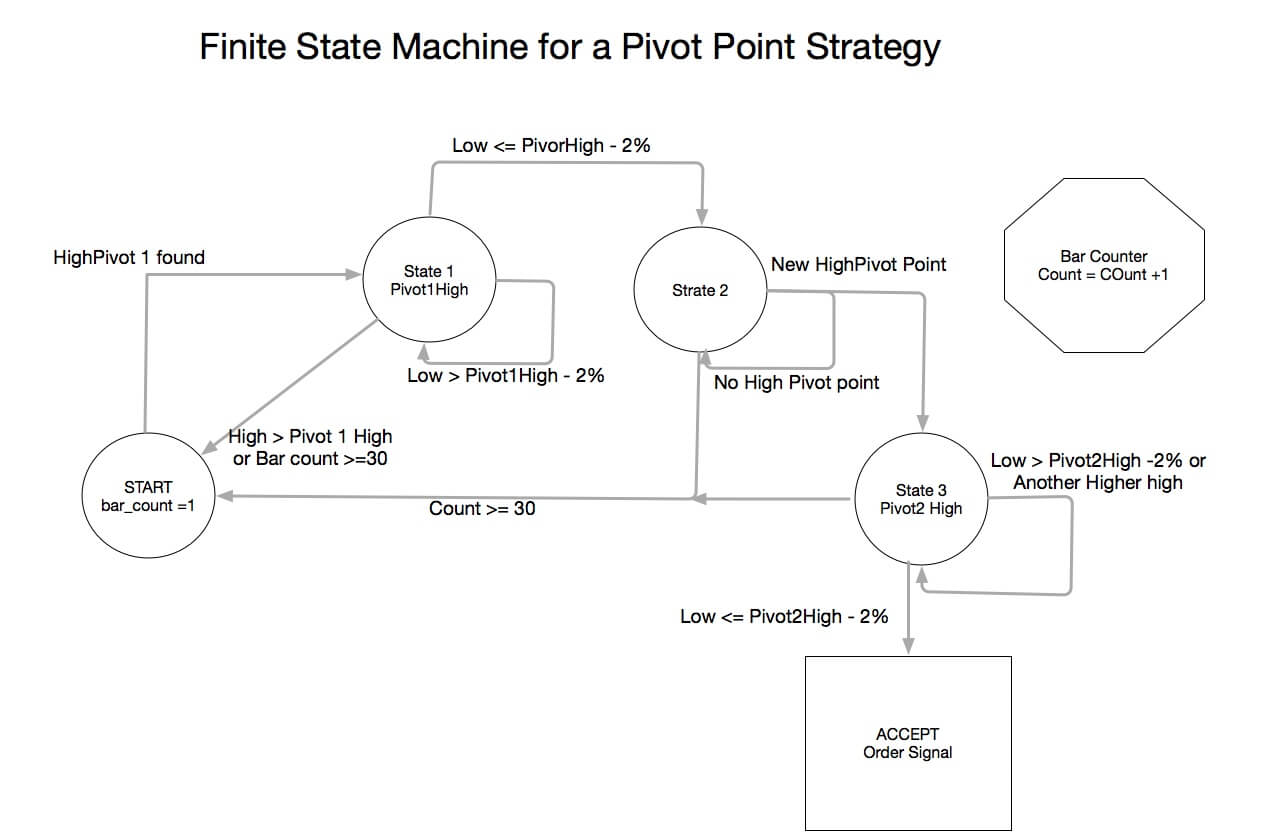
The second method to this kind of problem is the Finite State Machine (FSM). Basically, we want to detect certain states following others, defining a state when the needed condition is met. An FSM is a machine with finite states. The machine moves from state zero or START through several states until a final one, which defines the ACCEPT state. 

We can imagine a state machine as a combination lock. We need to supply the lock with a combination of numbers until its final digit, which triggers its opening.

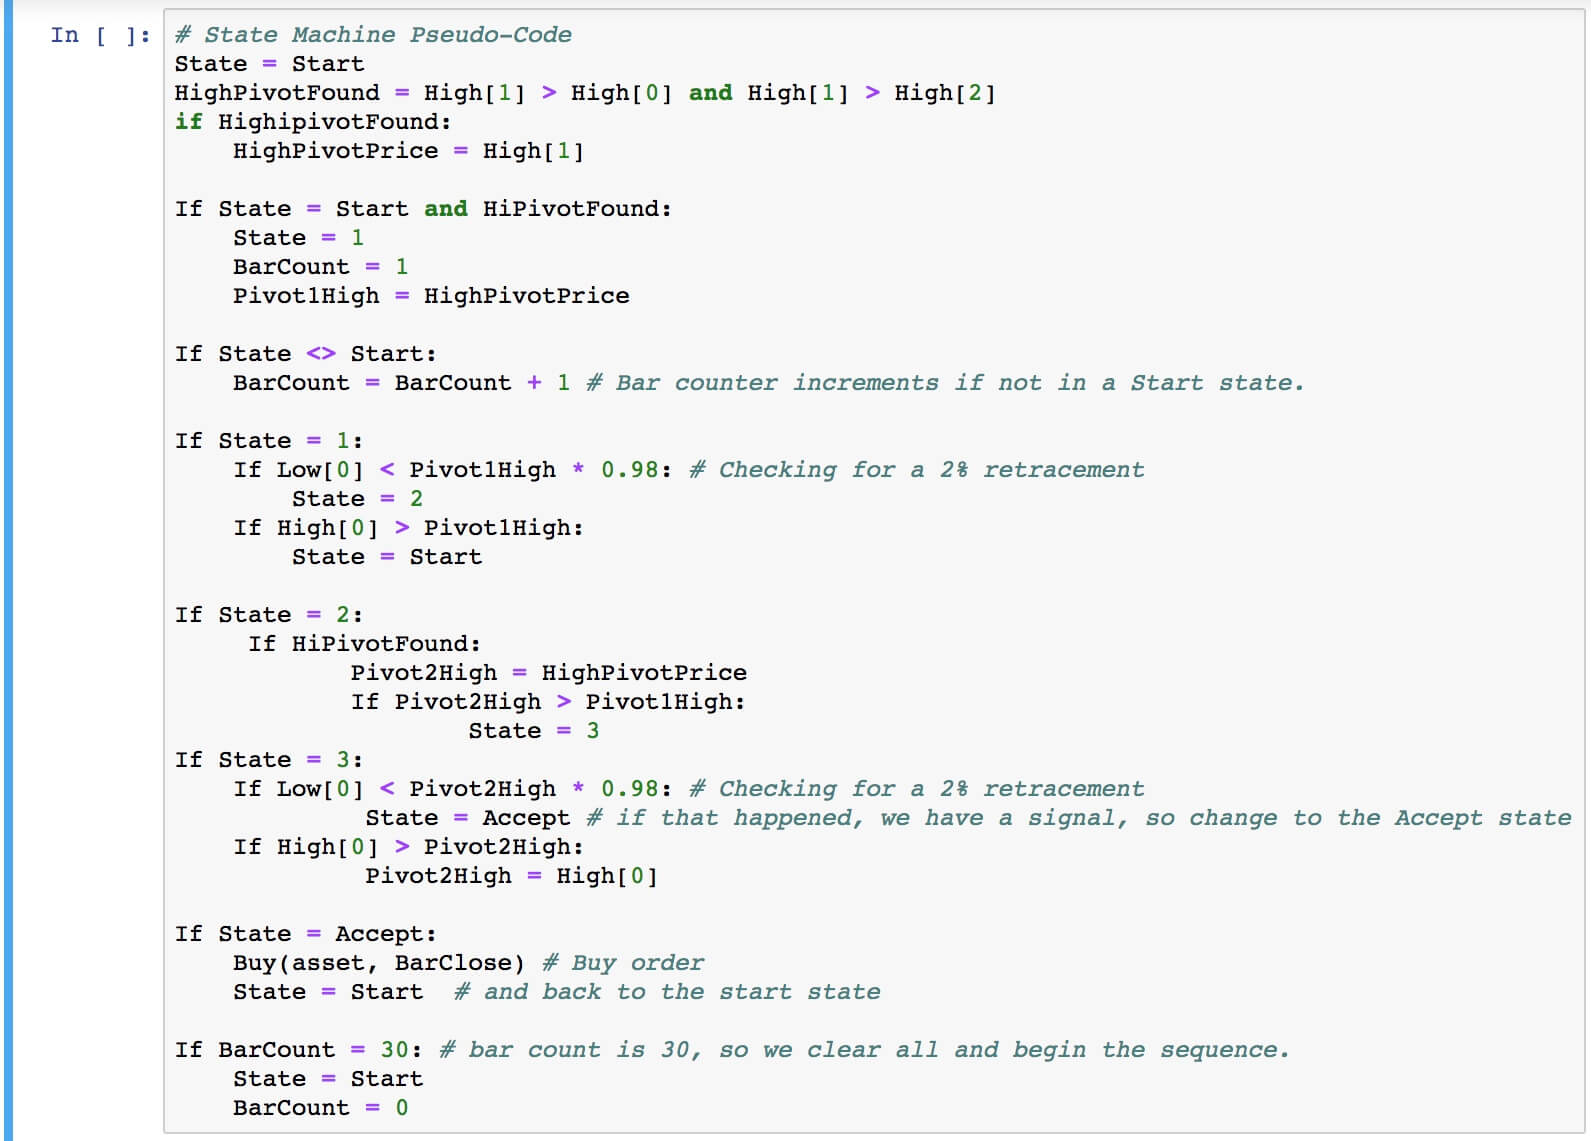
The first step is to create the states needed. Next, we create the conditions for the change from one state to other states. Once satisfied with the diagram, we can easily write the pseudo-code, or, even, the actual code directly.

As we can see here, the code is precisely subdivided into states, each state with the precise instructions to move to the next state or back to the start state. We can see also that this algorithm is executed from top to bottom on each new bar. We hope that this example will help you better understand how an entry algorithm can be created.

Stay tuned for more interesting videos on trading algos!

Categories
Forex Basic Strategies Forex Indicators Forex Service Review Forex Services Reviews-2

Market Profile Singles Indicator Review

Today we will examine the Market Profile Singles Indicator (we could also call it a single print indicator or gap indicator), which is available on the mql5.com market in metatrader4 and metatrader5 versions.

The developer of this indicator is Tomas Papp, who is located in Slovakia, and currently has 7 products available on the MQL5 market.

It is fair to point out that four of his products are completely FREE and are in a full-working version. These are: Close partially, Close partially MT5, Display Spread meter, Display Spread meter MT5. So it’s definitely worth a try.

Overview of the Market Profile Singles 

This indicator is based on market profile theory. It was designed to show “singles areas.” But, what exactly is a singles area?

Theory of the Market Profile Singles

Singles, or single prints, or gaps of the profile are placed inside a profile structure, not at the upper or lower edge. They are represented with single TPOs printed on the Market profile. Singles draw our attention to places where the price moved very fast (impulse movements). They leave low-volume nodes with liquidity gaps and, therefore, the market imbalance. Thus, Singles show us an area of imbalance. Singles are usually created when the market reacts to unexpected news. These reports can generate extreme imbalances and prepare the spawn for the extreme emotional reactions of buyers and sellers.

The market will usually revisit this area to examine as these price levels are attractive for forex traders, as support or resistance zones. Why should these traders be there? Because the market literally flew through the area, and only a small number of traders got a chance to trade there. For this reason, these areas are likely to be filled in the future.

The author also adds: “These inefficient moves tend to get filled, and we can seek trading opportunities once they get filled, or we can also enter before they get filled and use these single prints as targets.”

The author points out: Used as support/resistance zones, but be careful not always. Usually, it works very well on trendy days. See market profile days: trend day (Strategy 1 – BUY – third picture) and trend day with double distribution (Strategy 1 – SELL- third picture).

Practical use of the Market Profile Singles Indicator

So let’s imagine the strategies that the author himself recommends. Of course, it’s up to you whether you use these strategies or whether you trade other strategies for the singles area. Here we will review the following ones:

  • Strategy 1: The trend is your friend
  • Strategy 2: Test the nearest level
  • Strategy3: Close singles and continuing the trend

The author comments that these three strategies are common and repeated in the market, so it is profitable to trade them all.

The recommended time frame is M30, especially when using Strategy 2.

It is good to start the trend day and increase the profit, but be aware that trendy days happen only 15 – 20% of the time. Therefore, the author recommends mainly strategy 2, which is precise 75-80% of the time.


Strategy 1 – BUY :

  1. A bullish trend has begun.
  2. The singles area has been created.
  3. The prize moves sideways and stays above the singles area.
  4. We buy above the singles area and place the stop loss under the singles area.
  5. We place the profit target either according to the nearest market profile POC or resistance or under the nearest singles area. We try to keep this trade as long as possible because there is a high probability that the trend will continue for more days.

Strategy 1 – SELL :

  1. The bear trend has begun.
  2. The singles area has been created.
  3. The prize goes to the side and stays under the singles area.
  4. We sell below the singles area and place the stop loss above the singles area.
  5. We will place the target profit either according to the nearest market profile POC or support or above the nearest singles area. We try to keep this trade as long as possible because there is a high probability that the trend will continue for more days.


Before we start with Strategy 2, let’s explain the Initial Balance(IB) concept. IB is the price range of (usually) of the first two 30-minute bars of the session of the Market Profile. Therefore, Initial Balance may help define the context for the trading day.

The IBH (Initial Balance High) is also seen as an area of resistance, and the IBL (Initial Balance Low) as an area of support until it is broken.

Strategy 2 – one day – BUY:

This strategy will take place on a given day.

  1. There is a singles area near IB. (a singles area was created on a given day)
  2. The price goes sideways or creates a V-shape
  3. We expect to return to the singles area or IB. We buy low and place the stop loss below the daily low (preferably a little lower) and place the target profit below the IBL (preferably a little lower).


Strategy 2 – one day – SELL:

This strategy will take place on a given day.

  1. There is a singles area near IB. (a singles area was created on a given day)
  2. The price goes sideways or creates a reversed font V
  3. We expect to return to the singles area or IB. We sell high and place the stop loss above the daily high (preferably a little higher) and place the target profit above the IBH (preferably a little higher).


Strategy 2- more days- BUY:

This strategy takes more than one day to complete (Singles were created one or more days ago)

  1. After the trend, the price goes sideways and does not create a new low (or only minimal but with big problems)
  2. Nearby is a singles area (Since the price cannot go to one side, there is a high probability that these singles will close).
  3. We buy at a low, placing a stop-loss order a bit lower. We will place the target profile under the singles area.


Strategy 2- more days- SELL:

This strategy takes longer than one day (Singles were created one or more days ago)

  1. After the trend, the price goes to the side and does not create a new high (or only minimal but with big problems)
  2. Nearby is a singles area ( Since the price cannot go to one side, there is a high probability that these singles will close ).
  3. We sell at a high, and we place a stop-loss a bit higher. We will place the target profile above the singles area.

Strategy 3 – BUY:

  1. The current candle closes singles.
  2. Add a pending order above the singles area and place the stop-loss under the singles area or the candle’s low. (whichever is lower)
  3. Another candle must occur above the singles area. (If this does not happen, we will delete the pending order) .
  4. We will place the profit-target either according to the nearest market profile POC or resistance or under the nearest singles area.


Strategy 3 – SELL:

  1. The current candle closes singles.
  2. Add a pending order under the singles area and place the stop-loss above the singles area or candle’s high (whichever is higher).
  3. Another candle must occur under the singles area. (If this does not happen, we will delete the pending order) .
  4. We will place the profit-target either according to the nearest market profile POC or support or above the nearest singles area.

Discussion

These strategies look really interesting.  As the author himself says:

It’s not just a strategy. There is more to it in profitable trading. For me personally, they are most important when trading: Probability of profit, patience, quality signals with a good risk reward ratio (minimum 3: 1) and my head. I think this is the most important.

In this, we must agree with the author.


Service Cost

The current cost of this indicator is $50. You are also able to rent the indicator. For a one-month rental, it is $30 per month. There is also a demo version available it is always worth testing out the demos before purchasing. Though.

After purchasing the indicator, the author sends two more indicators to his customers as a gift: Market Profile Indicator and Support and Resistance Indicator.

Conclusion: There are only 2 reviews for the indicator so far, but they have 5 stars and are very positive.

For us, this indicator is interesting, and it is a big plus that the author shares his strategies. The price is also acceptable since the indicator costs 50 USD = 5 copies (10-USD / 1 piece), and since the author sends another 2 indicators as a gift, this price is really worthwhile.

The author added:

By studying the market profile and monitoring the market, I came up with an indicator and strategies we would like to present to you. Here you can try it for free :


MT4: https://www.mql5.com/en/market/product/52715

MT5: https://www.mql5.com/en/market/product/53385


And here you can watch the video:


Also, a complete description of the strategies and all the pictures can be seen HERE :

Other completely free of charge tools:

https://www.mql5.com/en/users/tomo007/seller#products


Categories
Beginners Forex Education Forex Assets

The Connection Between Crude Oil and the Climate Emergency

About ten thousand years ago in the world, there were about five million people; 9,000 years later, the figure was over 300 million. And just as we started consuming large amounts of oil, the world’s population increased by 5 billion people in 80 years.

We can easily see that the population increase, the eradication of a large percentage of global poverty, the increase in life expectancy, the reduction in hours worked, and the increase in the quality of life with the consequent increase in per capita energy consumption, It has only been possible to achieve this by burning huge quantities of oil.

At the present moment, humanity is at a crossroads and has to choose between two paths that seem very different, but, curiously, the end result will be the same in both cases.

Let’s look at the two possibilities:

1 – We believe Greta’s grace of the climate emergency. We start shutting down coal-fired power plants, of course, nuclear power plants, we reduce CO2 emissions a lot, we put an expiration date on fossil fuels and we increase the prices wildly for the rights to pollute.

2 – Or, on the contrary, in a short time Greta goes out of fashion and nobody does anything of everything proposed (most likely option). Even if the subject is still on TV, people are likely to talk a lot and do nothing. It may become a fashion very similar to slimming: everyone says that when the holidays are over they will take the diet seriously, but obesity figures are increasing every year.

As I said before, whether option 1 or option 2 occurs, the result is that the world’s population will collapse in the next 30 or, at most, 50 years. If fossil fuel consumption is drastically reduced and CO2 is severely reduced, the world’s population will plummet. Then we will talk about the possibility that renewable energies can replace fossil fuels. If the climate emergency fails to reduce crude oil consumption (the most likely option), the result will be the same, as crude oil will reduce itself anyway.

Look at the Problems of Renewables

Given that sooner or later the decline of oil will come, we will have to analyze whether renewables will be able to sustain the current model of society with the world population growing at a rate of 80 million consumers per year.

Hydropower is the best renewable energy of all, but it suffers from an unsolvable problem: at present, there is almost no increase in production, because you cannot put reservoirs where there is no abundant water. We cannot, therefore, trust that this type of energy can greatly increase its production and will solve our problems of scarcity.

Solar energy has several problems that I will list below:

1 – It is an economically unviable energy. This serious problem is now solved with subsidies; increase in the price of electricity; budget allocations from taxes to make this energy viable; cheap credits for facilities; negative interest for those investing in solar farms to settle for a miserable return; bad loans for the manufacturing industry, which is also happening with the debt of shale oil companies, that will result in the largest debt default since the subprime.

People do not relate that, to pay for everything said in the previous paragraph, you have to consume abundant and cheap energy that creates wealth with which to pay for the losses produced by renewable energy. Nor does anyone think how and where the wealth will be obtained to pay those subsidies when there is no oil to burn.

Logically, the manufacture of solar panels and the machinery that makes solar panels is done by burning oil. Can they still be produced when there is no oil? People have assumed as a dogma of faith that science advances that it is barbarity and that soon they will invent something that is able to circumvent the laws of thermodynamics. 

2 – The permanent supply of renewable energy (except for hydropower) cannot be assured. To cover the cuts in the supply of renewable energy, there is no choice but to double the installed power with fossil fuels. How will this problem be solved when the only fossils left are the usual politicians and do not produce energy?

Doubling the facilities doubles the investment, and when you double the investment with the same profits, the return drops by half.

We return to the same vicious circle: the State subsidizes electricity companies to invest in unprofitable facilities. Subsidies are paid from taxes. Taxes are a part of the benefits or wages of individuals or businesses. And those benefits come from burning a lot of cheap, abundant oil. At a time when oil is neither abundant nor cheap, the circle is broken and all the lies of politicians (who even believe themselves) clash head-on with the bitter and crude reality.

3 – Battery safety is another difficult problem to solve. When it comes to increasing the energy density of batteries, the danger of fire or explosion increases too much.

4 – Who will invest in solar gardens when interest returns to 5%? And if the cost of electricity increases exponentially, will it be possible to generate wealth by producing products with such a high cost of electricity? Look, I’m talking about wealth, not paper money.

5 – Agricultural tractors and heavy machinery are currently not powered by electricity. So, is there a possibility of trading in the future? After reading point 3, I am not clear.

Most of these points are for windmills.

It is unlikely that the current standard of living can be maintained; the welfare state, which is another way of saying the welfare of the State; the 80 million annual increase in the world’s population, in addition to the increase in life expectancy. All that without oil is unsustainable.

Oil has enabled an increase of 5 billion people in 80 years. Without oil, the world’s population will fall to at least half of what there is now. The sharp decline in the world’s population brings us good news and bad news: the bad news is that future pensioners will be paid just enough not to go hungry but without whims. The good news is that the climate emergency will have cured itself. If there are only half the people consuming energy and polluting, everything goes back to its natural course.

Once we admit that the world’s population is going to be in the middle, we still have two options to choose how we want the population reduction to happen. We can choose to reduce the population to good or bad. As I know the human species, I have not in vain related to bipeds since I was born, my prognosis is that they will not choose either option, and reality will lead us to the bad option.

The bad option is to do nothing, to continue living in an unreal world of dream fantasies, and when the reality of the oil shortage is imposed and everyone exclaims stupefied who would imagine it? It’ll be too late to plan anything. The population will shrink with an exponential increase in resource wars, violence, looting, vandalism, hunger, misery, and deforestation from the cutting of wood for cooking and heating.

The good option is planning. It’s not about killing people, it’s about encouraging people to have fewer than 2 children. What happens is that no politician ever accept or propose to lower the birth rate, because of the following:

“People have been embarked on the pyramid scheme of pensions, also called the Ponzi scheme. All pyramid scams are based on the shape of the pyramid: there has to be a large base of people paying and a small peak of people collecting.”

Categories
Forex Basic Strategies

Optimization Vs. Over Optimization

Today we discover the dangers of optimization: over-optimization. That’s the secret to making our system robust, consistent, and quite durable over time, or a quick way to lose your capital. It’s a fine line we shouldn’t cross. Let us then see what requirements we must take into account and what precautions we must take during the creation of a system, either automatic or 100% manual. At what point does optimization appear?

When we are creating our trading robot, the first thing we do is determine how it starts making market entries, when it will come out with its corresponding motives (crossover, RSI, MACD, different timeframes, etc). Once this is done, we start with optimization.

Right now we are going to adjust the robot to each market, as it is quite difficult for them to behave in similar ways. Therefore, if hypothetically our robot enters by moving averages when we are optimizing, the program will tell us that moving averages have gone better and which ones have gone worse. It’s just in that instant that we’ll have to be very careful, because it is when the joys of seeing a system that has multiplied our capital by 4 in 6 months come, forgetting the rest of optimizations. Error.

What do we have to look at in optimization?

In the graph of the evolution of our capital. Capital should not have any operation that excelled from the rest notably. Trading is a work of constancy; we must never seek the ball, the trade of your life… if it comes, it will come. Imagine that our profit after a year (500 operations) amounts to 1,800€, but we see that with a trade or two we have made 2,000€. We are in front of a system that will rarely get super trades, but that for the rest of the time, will be a negative or near-zero profit system.

Another point that can help us identify whether or not we are over-optimizing will be to look at the values of nearby means and see what results there are. If the results are very uneven, be careful, it is very possible that we have over-optimized. It may be that the means 10 and 20 go very well and that the means 12 and 25, fail miserably. A good system has to keep these values quite similar, the more subsystems (system configurations), the better the overall result.

It is necessary to be careful that when we decide to optimize a variable, it must be directly related to the market, that is, that it is something measurable, some numerical value.

As an example of this point, we could optimize our trading system by the hour. The market does not know what time it is, nor is it sleepy, the market is there. We must draw a pattern of behavior from indicators, or whatever, that depends directly on the market. Not because it’s 9:00 in the morning the market is going to move or the other way around; not because it’s 10:00 at night, the market is going to be flat. There are trends day and night, although it is true that there are more during the day. If we decide to optimize by eliminating certain hours of the day, the days that for some unknown reason there is no trend, our system, if it is tendential, will probably suffer.

Time for backtesting and subsequent optimization. If our strategy is long-term, we must have at least 200 trades, at least. With less, it is impossible to get reliability from that system. It is estimated that the robot continues to operate for a period of approximately 1/3 to 1/8 of the total simulation. If we do a test of 8 months, at least the system should work from one month to almost 3.

If after optimizing the system does not work, nothing happens. I know, it’s nice to see how your system in the past could have made a killing, but now it’s no good. It was a combination of trades that might happen again, but maybe 20 years from now. Are you going to be losing money for that long?

The last thing, I was looking for images to illustrate the post and I remembered the most over-optimized systems that exist, the trading robots that are sold online. 95% are scams. With phrases like this: “I doubled the capital, in 6 months” and a guy smiling with money, people go crazy. The final part of the advertisement says: “For only 29,95€”… If the programmer had a system that doubled the capital in 6 months, it would be cheaper for him to go and ask for money in the bank or wherever. I put the photo here, so you can see the graphic they show on their websites. Good and functioning robots make money in the long run, but they are not exponential and perfect trend lines, without any failed trade.

Categories
Forex Elliott Wave Forex Market Analysis

USDCAD Bullish Divergence in a Complex Corrective Formation; What’s next?

The big picture of the USDCAD pair shows a bullish divergence suggesting the exhaustion of the current bearish trend that remains active since past March 2020 when the price topped at 1.46674 and began to decline in a complex corrective pattern. Follow with us what’s next for Lonnie.

Technical Overview

The long-term Elliott wave view of the USDCAD pair unfolded in its 2-day chart and log-scale, illustrates a downward movement that began on the second half of March 2020 when the price found fresh sellers at level 1.46674. Once the price topped, the Lonnie started to decline in a complex corrective formation identified as a double-three pattern (3-3-3) of Minor degree labeled in green.

According to the textbook, the double-three pattern characterizes itself by following an internal sequence subdivided into 3-3-3, each “three” a complete corrective formation. In this regard, the previous figure shows the price action moving in the third segment of the double-tree pattern corresponding to its wave Y. Also, the lower degree structural sequence reveals the progress in its wave ((c)) of Minute degree identified in black.

On the other hand, the technical indicators support the bearish bias that dominates the downtrend, persisting since March 2020. Both the trend and the momentum oscillators confirm the downtrend in progress. Nevertheless, the timing oscillator shows a bullish divergence plotted in green. This reading suggests the exhaustion of the bearish trend. In this context, the candlesticks formations observed in the last chart remains weighting declines over rallies.

Technical Outlook

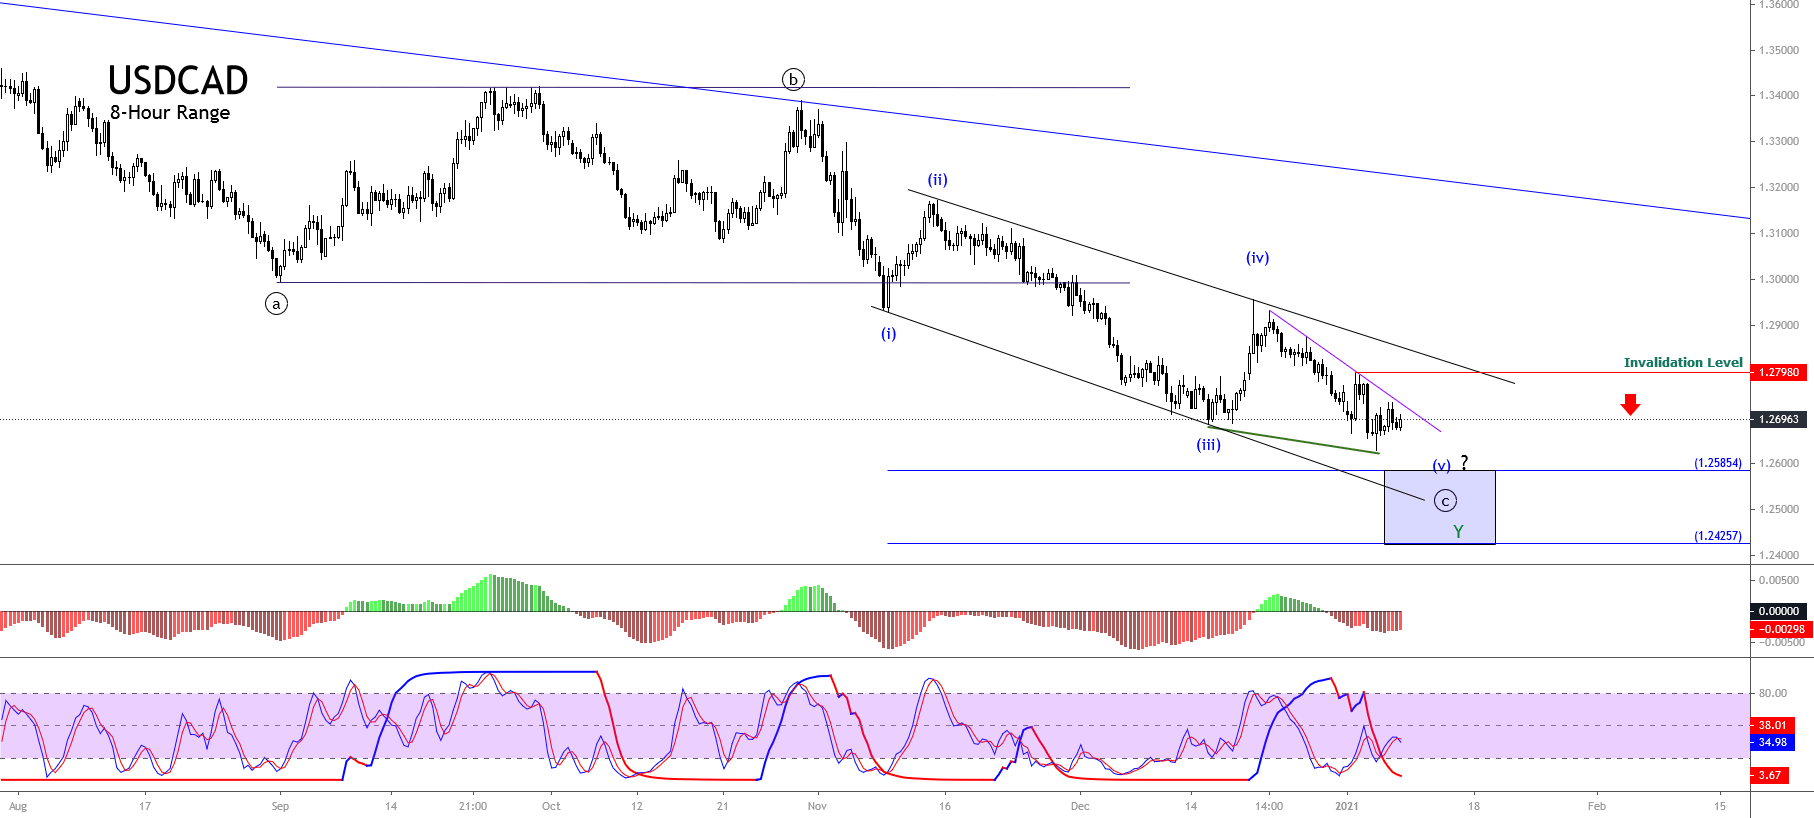
The short-term outlook for USDCAD exposed in the next 8-hour chart reveals the incomplete downward advance corresponding to wave ((c)) of Minute degree identified in black, suggesting a potential new decline.

The figure illustrates the downward channel in play that connects the extremes of waves (i)-(iii) and (ii)-(iv) Minuette degree identified in blue. The Elliott Wave theory suggests that the penetration below the base-line between waves (i) and (iii) could reveal the end of wave (v). In this regard, a potential new decline could strike the area bounded between 1.2585 and 1.2425. Likewise, the gap between momentum and timing oscillators supports the likely additional downward move in the USDCAD pair. 

In summary, the USDCAD advances in a downward complex corrective sequence identified as a double-three pattern of Minor degree, which looks running in its wave Y. Simultaneously, the internal structure reveals the progress in its wave ((c)) of Minute degree, which could see a new drop to the potential target area between 1.2585 and 1.2425. Finally, the bearish scenario will invalidate if the price soars and closes above 1.27980.

Categories
Beginners Forex Education Forex Basics

Myfxbook: The Definitive Guide

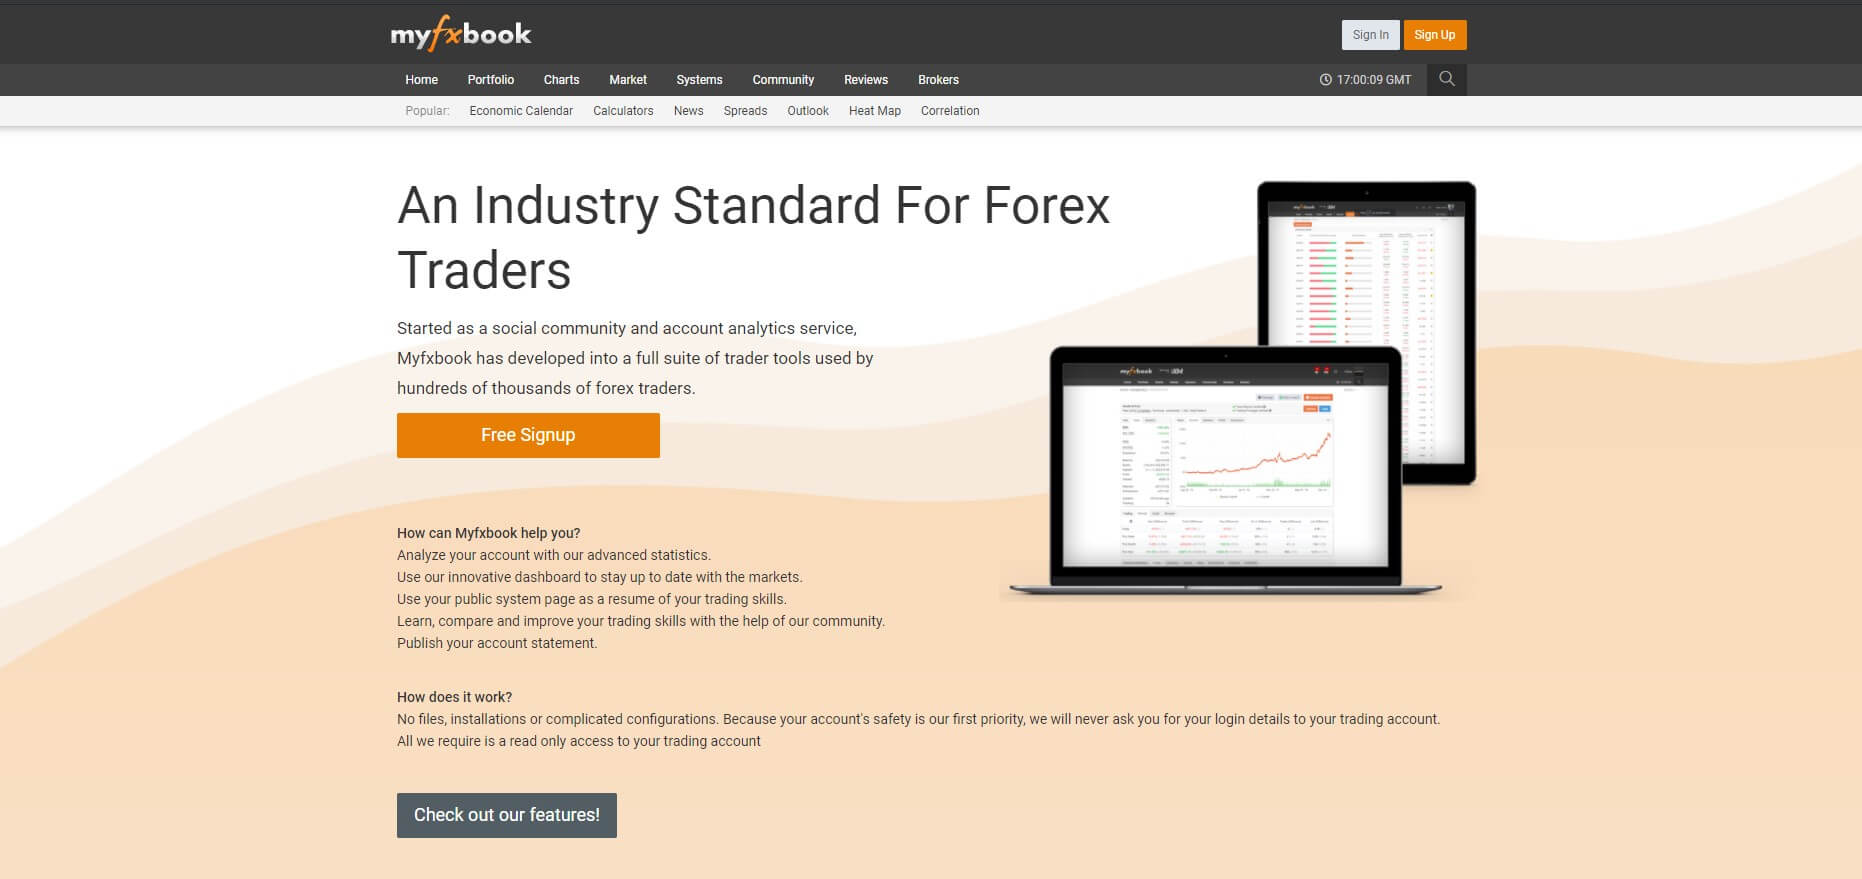
What is Myfxbook? How do I create an account? What can I find on this platform? What should I do if I want to be a provider of trading signals? In this guide, you will find everything relative to how to handle Myfxbook, a platform that has given a turn to social trading.

More than 100 online Forex brokers offer the services of the Myfxbook platform. It is a tool that has gone beyond social trading to become a provider of services related to the world of world-class short-term financial investments.

But what is the novelty of this platform? Until now, social trading communities had simply been confined to a particular broker. Thanks to Myfxbook, the community is growing. It is a multi-broker platform, with which signal services, Experts Advisors, programmers, PAMM accounts, copy trading, and more.

This feature, together with the number of parallel services it offers and the reliability it provides to copy traders, has made Myfxbook one of the reference trading pages. Through these paragraphs, you will discover how this platform works and what it can do for you.

What is Myfxbook?

This website was born as a trading account analysis system, a community created for traders in which transparency in the operation of those service providers took precedence. In turn, making the learning process easier for other less-experienced traders. Myfxbook is one of the first websites dedicated to social trading.

As we can see, everyone wins: expert traders can make profits by being followed (in the form of commissions) and novice traders can develop their knowledge thanks to the monitoring of other traders. A collaborative project where ideas are shared.

The main difference between Myfxbook and other platforms, also dedicated to social trading, is its ability to work with different intermediaries and the security it brings by showing real and verified results.

Myfxbook puts at your disposal the following benefits:

-Analyze your trading systems automatically and in one place, without the need for manual calculations.

-You can observe (and copy) other traders to discover how they do their trading and, in this way, develop your skills.

-You can share your system and your results to find customers and become a fund manager.

-Likewise, you will also have access to the audited results of other traders in cases where you need to hire some social trading service (copy trader, signal system, PAMM accounts, etc.).

-You will have the possibility to buy and sell trading systems.

-You will be part of a community, Myfxbook is a great social network dedicated to trading.

-You’ll access a wealth of news and market information services to make trading decisions.

How Do I Access Myfxbook?

The first step is to register in Myfxbook (in myfxbook.com), this page is available in Spanish. To be able to use the platform you need to have a trading account with one of the more than 100 brokers that are compatible with its use and allow you to participate in its program. The trading platforms supported are:

The process is very easy, what you should do is fill out the form that you will find on the left side of the home screen, after accessing the page (myfxbook.com). You must define:

  • Your username
  • A password
  • Provide an email address

They’ll send you an email from which you must confirm the newly created account and you can now access Myfxbook by logging in (i.e., entering your username and password).

After this first step, the next step is to connect your trading account with Myfxbook. This option is available in the “Portfolio” menu, by pressing the “Add Account” button. You can also do this task in “Settings” in the user menu (where your username appears).

With MetaTrader, you can link your account through Publisher or by downloading an Expert Advisor (EA) specially designed for this purpose. After that, you will have to install the app, after it is downloaded. It will ask you to select a specific account from the chosen platform (it is advisable to select an account that already has a history).

The following steps are done from the trading platform itself, we can anticipate that, in MetaTrader 4, these tasks are performed from the “Options” command, within the “Tools” menu.

In the “Activity” menu of Myfxbook (top of the screen), you will be notified that your trading account has been linked to your Myfxbook account.

Once your trading account is linked to the platform, in the “Portfolio” menu you can get a view of your trading statistics and associated account information. This will be of great use to carry out a thorough analysis of your profitability, your percentage of winning trades, drawdown, and other variables that you will have to take care of as a trader. Especially if you have multiple accounts, so you can monitor your entire operation.

Prepare Your Profile

On the right side of the screen, at the top, at the aforementioned user menu, you have everything to leave your profile ready in this new social network of which you are already part.

Your profile is your cover letter to other traders and will be essential if you intend to initiate or participate in any conversation, debate, ask questions, or market any social trading service.

To fill your profile you must select the “Edit Profile” submenu or enter “Settings” and select the “Profile” tab (both options are located within your user menu at the top right of the screen, where your name appears).

What Can You Find in Myfxbook?

It is necessary to say that some of these services are available without the need to create an account in Myfxbook, that is, without the need for previous registration on the page. However, once created, you will have full access to all the utilities that this platform has. As we have seen, the process of creating an account is simple and fast: it is worth taking this step. Among the menus of Myfxbook, you will find all this amount of tools that we show you below, menu to menu.

This first menu is related to the latest market news, very useful to keep you up to date. The menu is composed of:

News: access to the latest news related to the Forex market.

Economic Calendar: economic publications that move currencies.
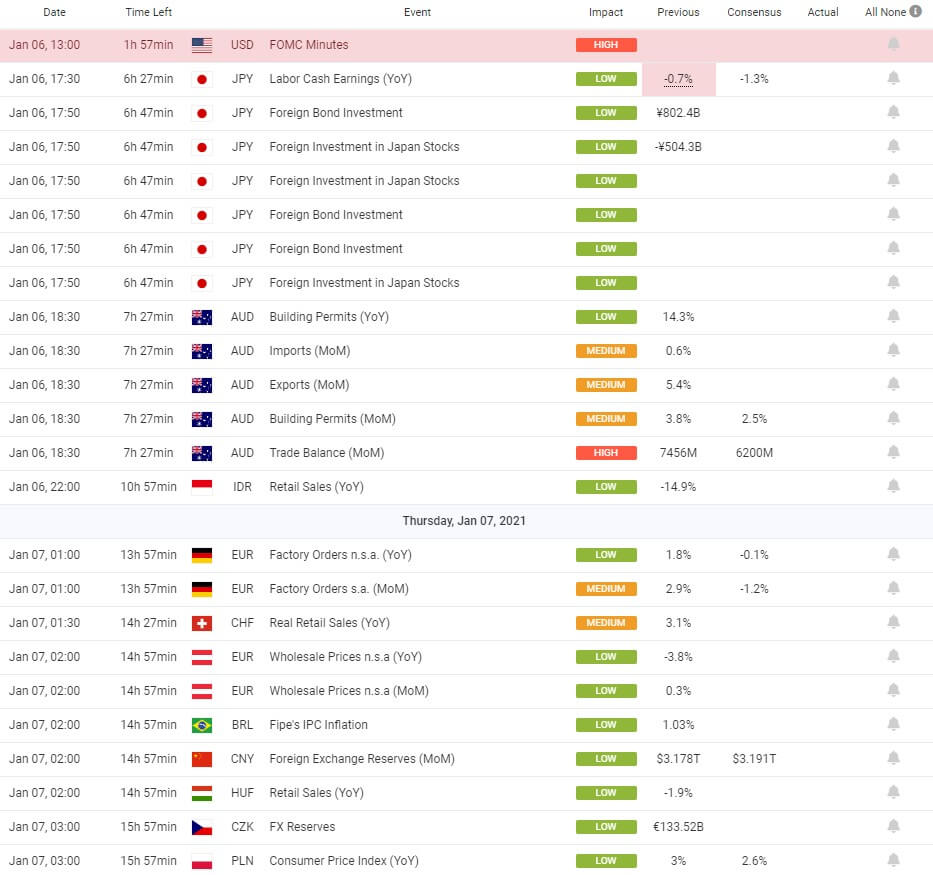
Recent Posts: Last threads in the Myfxbook forum.

Forex Calculators: In this command, you have available a series of calculators designed to make your trading easier (for example, pips calculator, margin calculator, Fibonacci, etc.).

Portfolio: From this menu, you can link your accounts and access their statistics. In short, you can analyze your trading to improve it.

Then we’ll see how we can perform this data public so that other traders can assess if it is advisable to contract some product or service that is intended to offer.

Autotrade: The Autotrade menu is the corresponding menu for replicating operations. When a trader is a signal provider and carries out a trade, Myfxbook sends a signal to all those trading accounts that follow it (that is, the accounts of its customers). In this way, the same position as the aforementioned supplier is opened or closed.

The menu consists of a submenu with the frequently asked questions of this service (FAQs), the help submenu, and a simulator that we can test the strategy of any provider before making the decision to follow it.

Soon we will see the requirements to be able to be a signal provider in Myfxbook.

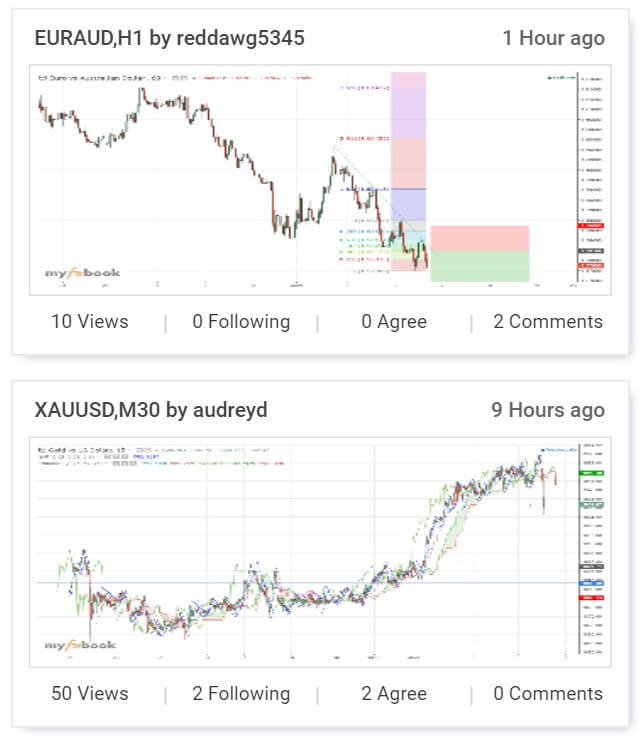
Charts: Charts are one of the tools that Myfxbook provides to members of its community. Any user can create an analysis and post it so that other traders can view and comment on it. It is possible to see the most followed, the most recent, or the most commented charts (among others). Everything depends on the specific option you choose in the submenu.

You also have the opportunity to create your own analyses and share them in this social network, in this way analysis is shared and learned through shared opinions. It will also help you boost your personal brand as a trader.
Markets: In this section, we will find several sub-menus with information about the Forex market useful for making trading decisions:

Technical Analysis Patterns: shows the different Japanese candle patterns that follow each other in major currency pairs. The temporality in which they appear and the implications they have (bullish or bearish) can be defined. You can also comment (and see the corresponding comments).

Volatility: you can visualize the volatility, in pips, of the main currency pairs (in several seasons).

Heat Map: Do you want to know which are the hottest currencies? Here you are indicated the strongest and weakest in different time periods.

Correlation: The relationship between currency pairs is important to avoid overexposure to the risk of a particular currency pair. There are also trading strategies based on correlation. In this command, you can have it under control.

COT (Traders’ Commitments) Data: data obtained from Commodity Futures Trading and in which you can read the positions of the participants of the forex futures market, to get an idea of what they think.

Liquidity: You can look at the estimates of trading activity in the market in this subsection.

Systems: This menu is only visible to all users who have created an account in Myfxbook. In it, you will have the opportunity to visualize the different trading systems and strategies of those users who have made this information public, in order to be followed. Through the statistics provided by the platform (and that we have already seen in a previous image).

Also, you have the option to follow any of them that you find interesting, by clicking on the button “Autotrade”. You can have direct access to the most popular ones by selecting the corresponding submenu. You can also compare different trading systems.

Remember that one of the advantages that Myfxbook provides is the transparency and reliability in the statistics of the different historical data, the accounts are audited at the time they are linked to this platform.

Community: This is a communication space, where you will be able to ask, share, debate, and learn about any topic of trading in the Forex market.
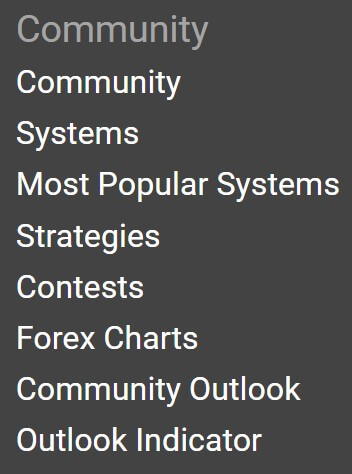
Beyond the general forum, this section is composed of several sub-menus, in which you can see conversations regarding:

  • New traders
  • Experienced traders
  • Investment systems
  • Strategies
  • Programmers
  • Suggestion box
  • Contests
  • Technical patterns
  • A feeling of community

Any user can open a new discussion thread. Being proactive in this aspect improves our visibility within the platform and, therefore, we will be more transparent and reliable traders. In addition, it is a good meeting point to share ideas and market products and/or services related to currency trading.

Comments: In this section, you can access, in addition to participating directly, various comments, reviews, ratings, etc. about:

  • Brokers
  • Automatic systems
  • Signal providers
  • VPS services
  • Programming services of EAs
  • PAMM services
  • Reimbursement programs
  • Trading platforms

As we can see, once again, Myfxbook stands out for the transparency it offers. On this occasion, the users of the platform are the judges of any service offered. There is nothing like seeing the ratings and reviews to check the reliability of any product or service.

Competitive examinations: As its name suggests, this menu will help us to be aware of the different trading contests organized by different sponsors. We will be able to see, also, the contests that at that time may be active.

If we access the menu, we will have the relevant data to decide whether or not we are interested in participating in a trading contest. Data such as:

  • Sponsor
  • Number of competitors
  • Whether it’s a demo or real
  • Awards
  • Winners (if the contest is over)
  • Start and end dates of the competition
  • Statistical analysis of the operations carried out

Without a doubt, it is another advantage of Myfxbook: to have under control the trading contests and all the information about them.

Brokers: This section is a comparative table of the different online financial intermediaries trading in the currency market. From it, we can see, compare, analyze, and decide which broker is the most interesting for our operation, depending on our trading style and our preferences. We will be able to undertake a follow-up of the spreads they offer, swap commissions, as well as other costs and promotions they can offer us.

Hiring a broker adapted to your needs is essential to develop a good trade. Through this menu you can see all the information of interest in this sense: one more reason to have Myfxbook among your favorite trading pages.

How Can I Become a Trading Service Provider in Myfxbook?

As mentioned above, Myfxbook gives you the opportunity to promote yourself as a trader, offer a range of services, and develop all your skills in the currency market. However, to market any social trading service you need to make public the statistics of at least one of the accounts you have linked to this platform.

Myfxbook stands out for offering a real, verified, and transparent information of the different traders, so, to have the opportunity to be a top trader, you must make a good operation and this contributes to the professionalization and regulation of this professional activity.

To make your trading account data public, simply click on the “Invitations” tab (in the “Settings” or “Portfolio” menu) and mark all options as public.

Trading providers earn a 0.5 pip commission on each account subscribed for each winning trade. If you are content to be a successful trader, you must first learn and take experience in the markets. In this respect, Myfxbook will also be of great help to you thanks to the information and possibility of communication it offers.

To access the Autotrade service and to be a signal provider, the following requirements must be met:

-Only real accounts with MetaTrader 4, verified and connected to Myfxbook, are accepted.

-The account must credit a minimum balance of USD 1,000.

-You must have a history of at least three months and at least 100 operations.

-The historical drawdown must be less than 50%.

-The historical return should be greater than 10% and greater than the historical drawdown.

-You must have earned an average of 3 pips per operation.

-As for the duration of operations, the average will be more than 5 minutes.

-The system should not use any martingale technique.

In other words, it is necessary to demonstrate some value in trading in order to be a provider of social trading services. It is another feature that defines Myfxbook as a secure and reliable platform.

The Reality of Myfxbook

The reality of this platform is that you will find many martingale systems and hidden scams. Most of them may look very promising but then they have a big fall and they get out of the way. In the end, most are hidden under a username.

So, all that being said, in my case I take advantage of this tool to get statistics from my accounts and little else. You can access profitable systems and they can give you an idea of how they work if you’re smart looking at some of their statistics, but remember that it’s a mine of martingale and grid systems, which we already know ends up blowing up accounts. So far all this guidance on this well-known tool within currency trading and trading systems, forex brokers.

Categories
Forex Psychology

Psychology and Mathematics in Forex: Control and Calculations

Obsession with control is an exceptional feature in the animal world. Humans develop more or less complex systems to direct each and every facet of our lives, or so we try. The illusion of being in charge reassures us, and when it comes to handling our money, much more. Is that why professional traders are so upset that Forex trading is compared to casinos?

In part, yes; but what really irritates us is that equating gambling with trading is the same as saying: Hey, you don’t control the situation, everything is a product of chance! Certainly, there are factors that cannot be assumed in a casino’s bets, as much or more than in trading. Obviously, there are subtle differences. The first is that, in gambling, we call that uncontrollable factor ‘luck’. In Forex, we call it ‘strong hands.

Without euphemisms, the reality is that there is a degree of uncertainty that is impossible to calculate accurately. And its weight is of such magnitude that it can destroy any trading strategy, no matter how elaborate. You can’t predict the movement of the market, just as you can’t guess at what number the roulette will drop the ball. Of course, when it comes to decision-making, Forex offers us a much more attractive illusion of control.

Forex: A Matter of Psychology

Certainly, a lot of decisions have to be made when we talk about investing in currencies, many more than putting a lot of chips on a number or a color. The problem is that most novice traders focus on building extremely elaborate systems, thinking that the important decisions are those that have to do with the application of indicators. It is clear that technical analysis is important, but it is not the control of the chart that should worry a good trader.

The real challenge of the initiative is self-control. In fact, psychological decisions often determine the future of small investors. The reason is obvious: when you enter the jungle, you will live hard times for which you have to prepare mentally. When you dive into the market, no matter which one, you have to go with a lesson learned: you’re going to lose money and a lot. If you’re not psyched for that, stick to something else.

Forex isn’t built to make easy money. What’s more, to make a profit by trading in foreign currency, you have to go through a tortuous path of profit and loss that can undermine anyone’s mood in a few months. It sounds exactly like what happens in casinos, so why are we still determined to put a dividing line between bookmakers and Forex? Surely, because once the psychological work phase is over, luck is a negligible element in the equation.

Forex and Probability Calculation

In reality, rather than luck, the risk that can be assumed is the variable that defines bets and investments. In both cases, and greatly simplifying the matter, there is a chance of losing and a chance of winning. Just take as an example a short transaction with CFDs: the price can go down (profits) or up (losses). The difference is that decisions are made based on in-depth market analysis, the development of a strategy, and certain probabilistic calculations.

This is not to say that, in general terms, it is not possible to operate with CFDs following the same philosophy as the bookmakers. Trading with a casino mentality means adopting one of the fundamental premises of trading: minimize losses and maximize profits, increasing the probability of success above 50%. Casinos get it by adapting their games; experienced traders, choosing strategic zones on trend lines, resistance, and support.

Finding these points is not easy. It requires a study of the market and an exhaustive search for patterns; but, in addition, it implies not being carried away by emotions, enduring astronomical losses, and cutting profits early because of anxiety. Anyway, trading in the currency market may not be the same as playing roulette; but, as Mr.Khoo says, you can (and should) do trading thinking like a casino.

Categories
Forex Basic Strategies

How to Measure Your Trading Strategy with “R Square”

Chances are if this is the first time you’ve heard that square R, you have no idea what exactly I mean or where the thing is going. It is normal, there is much written about supports, resistances, chartist figures. but not so much about more objective indicators. The subject is a bit technical, based on mathematics and statistics, but I’m going to (try) explain it in a practical and straightforward way. In the end, everything is easier than it looks.

What is the R Square?

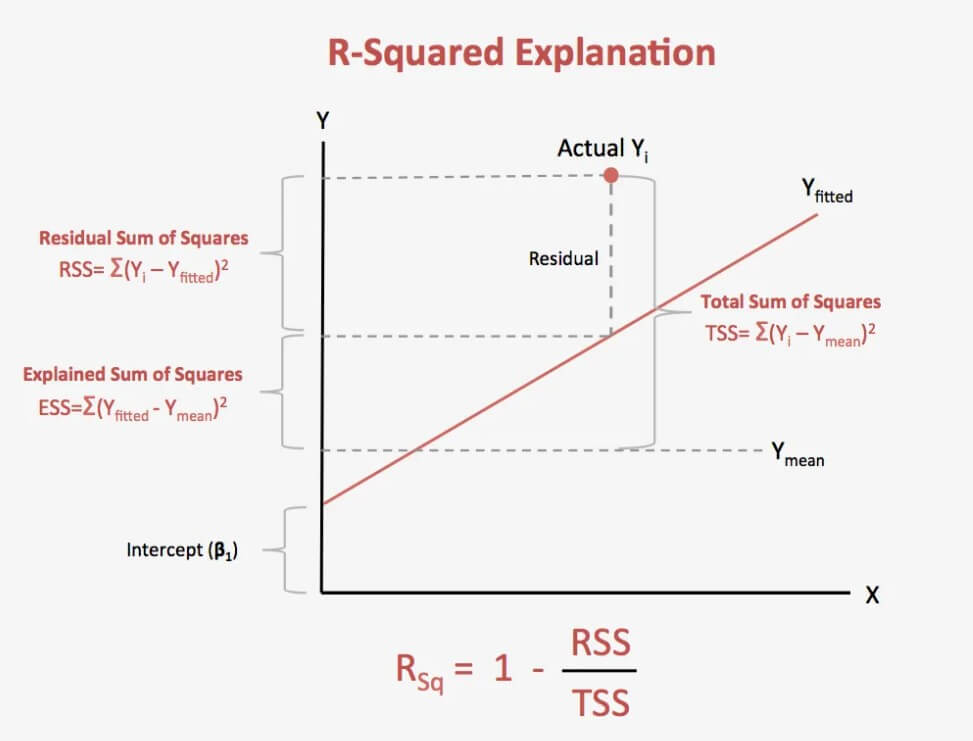
First, let’s start by defining and understanding the concept of R Square. R Square is a coefficient of statistical determination, also represented as R2, which allows us to predict some results or test a hypothesis. In other words, when we analyze a statistical model, the square coefficient R determines the efficacy of the model (which is so good) and also expresses the percentage or proportion of variation results that are explained by this model.

With this definition clear, in order to use this coefficient R square in practice, it is necessary to understand two important concepts:

Linear Regression: In statistics, a linear regression, also known as linear dependency, is a mathematical model used to approximate the dependency relationship between a dependent variable (for example Y), independent variables (X1,X2,X3,ǐ.Xn) and a random term ɛ (associated with any process whose outcome is only foreseeable in the intervention of chance).

Pearson correlation coefficient: Speaking of statistics, the Pearson correlation coefficient is a linear measure of the degree of relationship between two quantitative random variables, that is, two variables that can be measured or observed and also represented by numerical quantities.

Now, defined these concepts, you may be wondering: How to use this to evaluate my trading system? Step by step.

Each trading strategy or system needs an objective assessment of its effectiveness. In order to achieve this goal, we could get to use an extensive range of ratios, some more complex than others, both in their calculation process and in their interpretation. Despite all this variety, there are very few quality metrics to evaluate something very important: the regularity of the system’s balance line or trading strategy.

To do this, let’s manage the coefficient of determination, R square, to calculate the quantitative estimate of that ascending straight line that all traders want to see in our results.

Characteristics of an Assessment Criterion for Trading Systems

Each criterion or ratio used to evaluate the effectiveness or robustness of a trading system has its limitations in application. There are no ideal or pre-established criteria that allow us to determine with absolute certainty the robustness of a trading system. However, some properties or characteristics may be formulated that must have:

Independence in relation to the duration of the probationary period: Many parameters of the trading strategy or system depend on the duration of the trial period, for example: the longer the trial period for a profitable strategy, the greater your net profit. Independence from the time period is necessary and essential to compare the effectiveness of different strategies in different trial periods.

Independence of the end point of the test: For example, if the strategy «plays» with which simply exceeds the losses, the end point of the test can considerably change the final balance. The criterion or indicator should be immune to such machinations and provide a clear picture of the trading system’s work.

Simplicity of interpretation: All indicators of a trading system must be quantitative, that is, they must be represented by a certain number. It is important that this number is intuitively understandable. The simpler the interpretation of the value obtained, the easier the parameter to understand. It is also desirable that the value of the indicator is within a set range or a defined range, as it is more difficult to understand the meaning of extremely large numbers.

Representative results with few transactions: This is probably the most complicated requirement to meet in the list of features for a good metric because all statistical methods depend on the number of measurements. The higher the measurements, the more stable the statistics obtained. It is virtually impossible to fully solve this problem in a small sample, but you can soften the effects that arise due to a lack of data.

Linear Regression Application

To calculate the coefficient of determination R square, we must calculate or determine the linear regression. As explained above, there may be several independent variables, however, for a better understanding we will use the simplest case: A single independent variable.

In the case of an independent variable, the linear regression or dependence of a dependent variable (Y) on an independent variable (X) can be expressed by the formula Y=aX+b. This formula graphically represents a line in the XY plane, hence the name linear regression.

Now we will choose on our trading platform a chart of a currency pair, of our preference, with a clear upward trend in a given period of time. We download and save this data, then build a chart in Excel with closing prices. On the Y-axis we will have the closing prices and on the X-axis the dates that we will replace by order numbers (for convenience: 1, 2, 3, A). In doing so, we’re going to get a chart with a clearly bullish trend, but we’re interested in a quantitative interpretation of that trend.

The easiest way to reach the target is draw a line that will be more precisely adjusted to the trend obtained in the chart. This line is linear regression. If the graphic is fairly uniform one or more straight lines can be drawn that fit or describe our bullish graphic. Then a question arises: which of these lines is correct? The correct line shall be that straight line where the sum of the distance of the existing points to the line is the minimum distance.

It is also important to note that the regression line must always pass through the center of gravity of all the data that make up the point cloud. The coordinate of this point of gravity would be on the x-axis, the mean of the x-variable, and on the y-axis, the mean of the y-variable. Knowing a point of the line we can use the slope point equation to determine the line equation. By getting the correct line we can calculate the coefficients of the linear regression.

Pearson Correlation Coefficient

Once the linear regression is calculated, we have to calculate the correlation between the line obtained above and the data on which the line was calculated. Let us remember that correlation is the statistical relationship between two random variables. The correlation can take values ranging from -1 to +1. A value close to zero means that there is no relation between the measured values, a value of +1 (or very close to it) means a direct relation of the variables and a value of -1 (or very close to it) means an inverse relation of the variables.

The Pearson correlation coefficient could be calculated by means of the following formula:

Where: XY – is the covariance of (X, Y)

X: is the standard deviation of the variable X

Y: is the standard deviation of the variable Y

Covariance is a value that indicates the degree of joint variation of two random variables with respect to their means. In other words, it is the common variance between the variables and the standard deviation is the square root of the variance.

The Pearson correlation coefficient shows how far the line describes the data. If the data points are at a large distance from the line, the dispersion is high and the correlation is low and conversely, if the data points are at a small distance from the line, the dispersion is low and the correlation is high. A value of zero says there is no relationship between linear regression and data.

Importantly, in Metatrader there is a metric called LR Correlation and shows the correlation between the balance line and the linear regression found for that line. However, in the statistics, they do not usually directly compare the data and the regression that describes them.

Calculation of the Coefficient R Square

In the case of linear regression, to calculate the coefficient of determination R squared is sufficient by squaring the Pearson correlation coefficient that we calculated in the previous step.

This coefficient can take values ranging from 0 to +1, being a result equal to zero or very close to zero pure random unpredictable and a result equal to or very close to one a market in which all quotes are placed on the line. R square shows us what percentage of the price movement follows a definite trend, while the rest of the percentage will be due to random movements.

Limitations On Use

Each statistical metric has its advantages and disadvantages and the coefficient of determination is no exception. Some disadvantages are:

  • They depend on the number of trades. Exaggerate indices with few trades.
  • For calculation, complex mathematical computations are required.
  • It is applicable exclusively for the estimation of linear processes, or systems trading with a fixed lot.

Application in Trading Systems

In trading systems you can see this ratio represented in percentage, which the closer to 100% the better (in theory) is the quality of our system. In my experience, a system with a score above 65 usually has a fairly stable performance over time. It’s one of my favorite filters.

Conclusions

After analyzing and studying the process of calculation of the coefficient of determination R square I can tell you that this coefficient is one of the few measures that calculate the regularity of the curve both of the line of the balance sheet, and of the unrecorded benefit of the strategy (among others).

R² is easy to use because its range of values is fixed and is within the limits of -1 to +1. Values close to -1 alert us or warn us of the negative trend of the balance of the strategy. A value close to zero warns us of the lack of trend in the balance sheet of the strategy. Values close to +1 warn a positive trend.

As I have told you, the square R, like any other ratio, has its limitations that you must take into account. In my case I use it as a top 3 ratios to measure if I have a valid trading strategy or if instead it goes to the trash.

Categories
Forex Risk Management

Measuring Trade Risk Levels with VaR and CVaR

Quantifying risk when trading has become one of the biggest concerns (or at least should be) as traders. The volatility, volatility of exchange rates, interest rates, etc. have made the study of risk increasingly important. In this article, we will show you how to use VaR and CVaR to assess your risk levels with a high degree of accuracy. 

Another important issue that has enabled us to improve the study of risk, among those associated with our operation, has been the exponential increase in the computing capacity we currently have. Currently, as a trader, you have at your fingertips, from your laptop or smartphone, databases with all the necessary price history information for almost any financial asset you want to trade.

When developing a trading strategy or system we should not only focus on clearly establishing the rules for entering and leaving the market, but we should also objectively analyze the results of our trading system.

To achieve an objective analysis, a wide variety of metrics have been developed that evaluate different aspects of our operation. In this article, we will teach you to use two metrics based on risk control: Value at Risk (VaR) and Value at Risk (CVaR). These risk assessment measures have different methodologies and techniques for their estimation.

Before entering directly into the study of them, it is important that we have some basic concepts, such as what is financial risk and what are the types of risk.

What is Financial Risk?

In the investment context, the risk is the probability of loss due to events that can produce significant changes, and that affect a financial asset. Therefore, it is important that when we decide to make an investment, we identify and quantify the various types of risks to which we will be exposed when making the investment.

All investments carry an associated risk, but when we manage risk well we can find great opportunities for significant returns. Surely you’ve heard of “risk aversion”. Risk aversion refers to an investor’s attitude or preference to avoid financial uncertainty or risk. This leads him to invest in safer financial assets, even if they are less profitable.

Types of Financial Risk

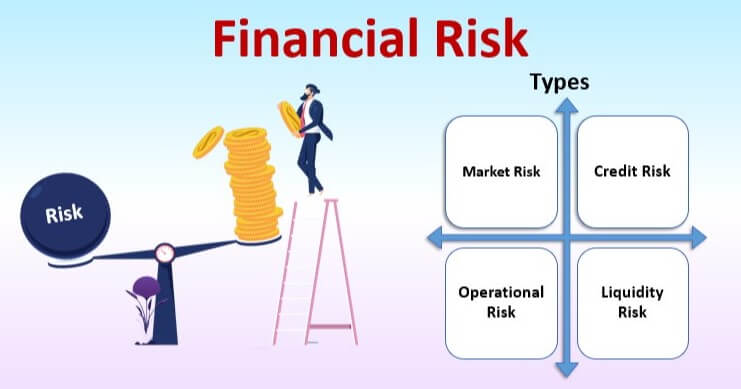
Although there are many risks in the investment world, financial risk can be classified into three main categories:

Market risk: this type of risk refers to loss risk arising from price movements of a financial asset or the market in general.

Credit risk: the inability of a party to respond with the obligations of an issue or with the strict terms of the issue (amount, interest, etc.), thus producing a loss for the counterparty.

Operational risk: This type of risk is defined as loss risk due to insufficiencies or failures of processes, personnel, and internal systems.

Now that we have clarified these basic concepts, let’s see what VaR and CVaR are all about.

Value at Risk (VaR)

Value at Risk is a statistical metric used to assess the risk of a given asset position or portfolio. VaR is the maximum expected loss, under normal market conditions, in a portfolio or trading system, with a probability (usually 1% or 5%) and a known time interval (usually a day, a week, or a month).

The VaR is measured through three variables: amount of loss, probability of such loss occurring (confidence level), and the time interval of occurrence. It is important to note that VaR does not seek to describe or predict worst-case scenarios, but rather to provide an estimate of the range of potential gains or losses.

Ways to calculate VaR

There are three main methodologies or approaches to calculating VaR:

Parametric method: when we calculate the VaR using the parametric method, we assume that profitability has a normal distribution and the portfolio is a linear function of the factors. For the parametric calculation, it is necessary to have the main statistical parameters (mean, variances, covariance, standard deviations, etc.) of the financial asset or portfolio that we are analyzing.

The formula for calculating VaR using the parametric method is as follows:

VaR = F * S * σ *

Where:

F = Value determined by the confidence level (also known as Z value).

S = Amount of portfolio or financial asset at current market prices.

σ = Standard deviation of asset returns.

t = Time horizon in which the VaR is to be calculated.

Historical simulation method: uses a large amount of historical data to estimate VaR, but makes no assumptions about probability distribution. One of the greatest limitations of this approach is that it assumes that all possible future changes in asset prices have already been observed in the past. The value of the VaR will depend on the source of the data and the size of the series (time frame of the data).

Monte-Carlo VaR Model: The calculation of VaR using the Monte-Carlo method is based on generating hundreds or thousands of hypothetical scenarios based on the series of initial data entered by the user. The accuracy of the VaR will depend on the number of scenarios we simulate, the higher the accuracy. The validation of the model is fundamental, for this it is recommended to carry out backtest tests to verify that the estimated VaR is verified with the historical series.

A practical example of how to calculate VaR:

I will do this by setting an example to calculate in VaR in actions to simplify calculations of pips and lots:

Suppose we have a portfolio composed of 1000 shares of the company ABC and the current price per share is 12$, the daily standard deviation is 1.8%. How can we calculate VaR with a 95% confidence level for a day?

The formula for calculating VaR is:

VaR = F * S * σ *

To calculate the value of F, we use the “DISTR.NORM.ESTAND.INV (probability)” function of the Excel spreadsheet.

F = DISTR.NORM.ESTAND.INV (confidence level) = DISTR.NORM.ESTAND.INV (95%) = 1.6448

S is the total amount invested in the portfolio and is calculated as follows:

S = share amount * market price = 1,000 shares * 12$ = 12,000$

The standard deviation σ is equal to 1.8%.

As we want to calculate the VaR for a day, then t = 1.

We replace the values in the VaR formula and have:

VaR = 1.6448 * $12

This VaR value tells us that the investor has a 95% confidence level that their investment will not lose more than $355.28 in a day.

What if we increase the level of confidence to 99%? In this case, the VaR would be:

VaR = 2.3263 * $12,000* 1.8% * = $502.48

This VaR value tells us that the investor has a 99% confidence level that their investment will not lose more than $502.48 in a day, or what’s the same, the probability of suffering losses greater than $502.48 during a day, is only 1%.

Advantages of VaR

Some very significant benefits of using VaR for the quantification of financial risk without the following:

-The VaR is a highly recognized standardized risk measure among traders and regulators. It has become a standard in the financial industry.

-It adds all the risk of an investment into a single number, making it very easy to assess the risk.

-It is probabilistic and provides us with useful information about the probabilities associated (confidence level) with a specific amount of losses (maximum loss).

-It can be applied to any kind of management and also allows you to compare risks of different portfolios regardless of their composition, whether fixed income or equities.

-The VaR allows you to add risks from different positions taking into account the way in which they correlate with each other, the different risk factors.

-It takes into account multiple risk factors and can focus not only on individual components but also on the overall risk of the entire portfolio.

-Because it is expressed in the loss of money (base currency; dollar, euro, etc.) it is simpler and easier to understand than other indicators that measure financial risk.

Disadvantages of VaR

But VaR, like any other metric used for trading systems, has its disadvantages:

-Generally depends on the quality of the historical data used for its calculation. If the data included is not accurate or correct, the VaR will be of little use.

-Although the interpretation of the values of VaR is very simple, some methods to calculate it can be very complicated and expensive, for example, the Monte Carlo method.

-It can generate a false sense of security in traders. Any measure of probability should not be construed as a certainty of what will happen. Remember that as traders, we only handle uncertainty scenarios never certainty scenarios, we do not make predictions.

-It does not calculate the amount of the expected loss remaining in the probability percentage.

Conditional Value at Risk (CVaR)

The conditional risk value (CVaR) is the mean of observations in the distribution queue, that is, below the VaR at the specified confidence level. Therefore CVaR is also known as expected deficit (Expected Shortfall, ES), AVaR (Average Value at Risk), or ETL (Expected Tail Loss).

The CVaR is the result of taking the weighted average of observations for which the loss exceeds the VaR. Therefore, the CVaR exceeds the VaR estimate, as it can quantify riskier situations, thus complementing the information provided by the VaR.

CVaR is used for the optimization of portfolios because it quantifies losses that exceed VaR and acts as an upper bound for VaR.

Properties of CVaR

CVaR stands out for having better mathematical properties than VaR, being a consistent measure of risk because it meets the criteria of:

Mono tonicity: If one financial asset performs better than another in any time horizon its risk is also lower.

Positive homogeneity: Refers to the proportionality between position size and risk.

Invariance to Transfers: By adding capital to a position your risk decreases in direct proportion to the capital added.

Sub-additivity: Asset diversification decreases the risk of a global position.

In summary, the most important message that CVaR is a consistent measure of risk is the following: the risk of two or more assets that make up a portfolio is less than the sum of the individual risks.

Interpretation of the conditional value at risk (CVaR)

The choice between CVaR and VaR is not always straightforward, since the conditional value at risk (CVaR) is derived from the value at risk (VaR). Generally, the use of CVaR rather than just VaR tends to lead to a more conservative approach in terms of risk exposure.

While VaR represents a maximum loss associated with a defined probability and time horizon, CVaR is the expected loss if you cross that worst-case threshold (maximum loss). In other words, CVaR quantifies the expected losses that occur beyond the VaR breakpoint.

As a rule, if an investment has maintained stability over time, the risk value could be sufficient for risk management in a portfolio that keeps the investment active. However, we must bear in mind that the less stable the investment, the greater the chances VaR will never display a complete image of the risk. In practice, trading systems rarely exceed VaR by a significant amount. However, more volatile systems may exhibit a CVaR many times larger than the VaR.

Finally, if we create a trading system and calculate your VaR, this VaR tells us what the maximum loss is with a certain level of confidence and time horizon. But if the loss is greater than VaR, how much should we expect to lose? This is where the conditional-at-risk value (CVaR) comes into play, which will tell us what the conditional average expected loss is if more is lost than the VaR.

Categories
Forex Basics

The Most Interesting Myths and Truths About Forex Trading

There are many myths about Forex that need to be left behind well in the past and here we will tell you exactly what these are because in reality there are many more myths than truths. In this article, we tell you everything! So let’s dive into the good, the bad, and the ugly. 

The myths about Forex that circulate in the network do damage to this type of investment. Currency speculation has always been, especially in recent years, the victim of false news and rumors. In order to succeed in speculating or investing with this trade, investors need to leave behind these myths that affect the image of Forex and its expectations.

Forex gives monthly returns or interest.

Another false myth. As in the equity market, the return generated by the person investing in this product depends on the movements of the currencies the investor buys. In other words, profitability only depends on the fluctuation of prices, something that also happens with other investments (raw materials or stock markets, for example).

Forex is a pyramid.

Forex is an electronically controlled market where all foreign exchange transactions are carried out worldwide. Its usefulness is incalculable for international trade since it is in this place where the currency needed to pay or collect money from import or export products is bought or sold.

Forex makes you rich in a few hours.

Another falsehood. While it is true that anyone can access this market and accumulate strong profits in a short period of time, to invest in Forex and accumulate profits it is recommended to form in markets. That is, it is advisable to take a course to invest in a stock. With this course, we will be able to strengthen the knowledge we have and, on the other hand, learn more about Forex techniques.

Giving up our job to invest in Forex.

Investing in Forex does not mean giving up our job. We can test trading as a part-time job, at least entry, but never leave other sources of income and always learning from investment or currency speculation and receiving continuous training.

The intermediaries only want to con you.

From a few illegal experiences, many people think that the brokers who allow us to speculate on Forex are scammers. We must be clear that there are corrupt companies, but they are a clear minority. Forex is the largest market in the world, which has existed for many years.

There are two fundamental points that show why intermediaries don’t want to rip you off:

-Current licensing and regulation make it impossible for intermediaries to commit fraudulent activities. If you have opened an account with an authorized broker, the current regulations will protect your capital.

-Brokers earn money with the buy or sell spread. That is, they do not need to steal the investor’s capital to make a profit.

On Forex, you bet.

Forex trading is speculative, but to a certain extent: it is not a casino. The strategies and tools in this market are like those in the stock market. Forex traders have different trades, but they don’t work randomly. If an operation is carried out as if in a casino, this is the responsibility of each investor only.

I can make profits whenever I want if the Forex market is open 24 hours a day.

Again, you will not be sitting in front of your computer throughout the day to be able to operate for 24-hours. I would need automated trading software to take advantage of the 24-hour trading market.

I need to accurately predict the outcome of the market to succeed in Forex.

Unfortunately, there is no scientific method for us to have the knowledge of what is going to happen in advance on the market with 100% certainty. There would be no foreign exchange market if the exact exchange rates could be known in advance. Trading will never be an activity of certainties, but of probabilities. New traders tend to think in terms of odds, and this is one of the first things they learn and risk-reward relationships.

Many times you tend to think that you need to use an extremely complex strategy in order to succeed in Forex trading. It’s a popular myth that many online marketers want to create. The main requirement for success in Forex is self-discipline and money management. There are many traders who make profits consistently with simpler and older strategies.

A large amount of initial capital is required for Forex earnings.

A large capital investment will not help you with Forex. You don’t need much money to diversify into currencies and you can’t move exchange rates with your orders (you would need billions of dollars to do that). You can actually trade in forex with very little capital because forex trades are almost always leveraged with the money of the broker.

It’s a risky market.

One could say that it is a market with a lot of risks. The ability to leverage, or buy up to 100 times as much money as you have for investment and high volatility, or the sheer speed with which prices change every minute, can mean big losses to the investor.

The advice for those who decide to enter this market is to know the market before entering it, look for a broker’s platform, if someone will advise you to look well at the experience and set and respect the limits of loss per operation, by day, by week and by month.

Is completely legal.

Although it is not regulated, anyone can legally access Forex through a simple mechanism, looking for a broker. The recommendation, in this case, is to invest in a recognized broker, with trajectory, and use the formal channels to deposit the money to the account in which you will trade.

There Is No need to fear the Forex market.

Once we have established that it is possible to predict the market, why are there so many traders who, understanding and agreeing with this point, have trouble exploiting the market profitably? It is here that psychology is most useful. The trader should not be scared or afraid of not being able to win the market, as the market is changing, nor should he fall into despair because the trade he is waiting for right now seems unworkable, etc. The list of psychological problems that can be identified is quite long, and almost everyone identifies with fear or fear.

“Don’t be afraid of financial markets, just respect.”

The experience and knowledge of how they work will gradually turn us into traders with better mental control and more prepared to face any eventuality in our operation with total normality.

You can earn a lot, YES, but can you lose a lot? YES.

For example, if you open a new account with $10,000 in a broker that allows you to buy currency for 30 times more than you have in your account. Now buy 200.000 euros at a price of US$1.20 per euro, which is investing in total is US$240,000.

In this situation two possible scenarios may occur:

  1. The price of the euro grows to US$1.30. In that scenario, it would earn US$10,000, because it obtained a profit of US$0.1 for each euro it bought.
  2. The price of the euro drops to US$1.15. This is the side of history that no investor likes, but that usually happens to starters. In this scenario, I’d lose $5,000. And if you do this several times in the day, trying to make up for what you lost, chances are your account will be zero at the end.

The scenario that is illustrated, is something that usually happens on a daily basis in the Forex market. Then we already know the importance of learning and knowing how to choose an appropriate strategy to limit losses once a trade has taken place.

Categories
Forex Course

204. The Impact Of ‘Fixed Income Securities’ On The Forex Price Charts

Introduction

Fixed income securities are investments that offer returns in terms of fixed periodic interest payments and the return of principal at the end of the security period. Contrary to variable income securities, in which the payments vary depending on the underlying measure, the payment obtained in fixed income securities are recognized in advance.

What are the Types of Fixed Income Securities?

Following are the types of fixed income securities:

Bonds: They are among the common forms of fixed income securities issued by organizations to fund the daily operations to make sure smoother and efficient production. Granted that fixed-income bonds act as a liability for the missing company, it must be redeemed as soon as the company makes sufficient revenue.

Debt Mutual Funds: These funds leverage the collected corpus for investments in different variations of fixed income securities like commercial papers, government bonds, corporate bonds, money market instruments, etc. The main benefit of these investments is that you get higher returns in comparison to the convention.

Exchange-Traded Funds: Exchange-traded funds primarily function by investing in different types of debt securities present in the market. This produces regular as well as fixed returns. This way, they offer assured stability as returns are offered periodically at a particular rate of interest. These are popular among risk-averse investors who look for stability over market advantage.

Money Markets Instruments: Certain types of money market instruments like treasury bills, commercial papers, certificates of deposits, etc., are provided as investment opportunities at a fixed interest rate and therefore are categories under the fixed income securities. Moreover, these instruments are provided for a short duration where the maturity period stands less than a year.

The Effect of Fixed Income Securities on the Movement of Currency

Understanding the relationship between fixed-income securities and currency movement is quite straightforward. Economies that provide higher rates of returns on fixed income securities are likely to attract more investments.

This makes the currency more attractive than economies that provide lower returns on the fixed income market. To determine the yields derived by the securities, you can check the official government website of a specific country.

[wp_quiz id=”97508″]
Categories
Forex Market

Purchasing Power Parity Theory

Traders, who operate in the foreign exchange market, read such news every day as: “the consolidation of the dollar led to the fall in the price of gold” or “the price of the euro backed the price of oil”. Although this news is usually published after an event, the relationship between the goods market and the foreign exchange market is felt independently whether we trade in the foreign exchange market or have nothing to do with it.

Theoretically, inflation serves as a correlation between the value of money and the prices of goods, and in this case, the currency does not matter (whether dollars, euros, rubles, British pounds, or Indian rupees). If a week ago the price of gasoline cost 40 rubles per liter and now it is 50 rubles, this means that the ruble in a week was lowered by 25% and the gasoline, on the contrary, increased in price. If gold cost $ 30 per gram in June 2009 and in June 2019 was $ 43, this shows that in 10 years the value of gold in US dollars increased 43% and the dollar, the other way around, fell in price.

Correlation between the goods market and the foreign exchange market. How does it work? They are simple and easy to understand (and also applicable to trading) examples of how money and goods are related and why the correlation between the goods market and the foreign exchange market is a fundamental rule that determines the price of a currency. Let’s try to decipher this theory.

Purchasing Power Parity Theory

Purchasing power parity theory states that the cost of goods in one country should not exceed the cost of goods in another country more than the price of the transport of goods between the two countries. The price of transportation also includes the profit margin of the trader and the change of the standards of one country by the standards of the other. It is also theoretically assumed that there are no artificial trade barriers.

When most of Europe and Asia, back in 1944, were in ruins, a conference was held at the Bretton Woods spa where, for the next twenty-five years, the fate of all the world’s currencies was determined, among which the United States was chosen as the international reference currency. The currencies of other countries were beginning to be traded in dollars, the same dollar was convertible into gold and the troy ounce was worth $ 35. That agreement at that time seemed fair, as the US had 70% of all world reserves and, thanks to the Second World War, it had an international advantage.

The Bretton Woods monetary system existed until 1971 when United States President Richard Nixon unilaterally terminated the agreement, and on 16 March 1973, the treaty is known as the “Jamaica agreement” was signed, which formed the Forex currency market. According to the “Jamaica agreement”, exchange rates would be set in the market on the basis of supply and demand. Since then and to this day the dollar is the main reserve currency, occupies a leading position in the calculation of energy, goods, and gold, and is the main currency used in many financial instruments.

At present, the US dollar position is well described with the word “petrodollar”, and the main volumes of trade in goods, including oil and gold, take place on US exchanges such as NYMEX, COMEX, CME, and ICE. The United States leads in the trade of oil, gold, grains, and many other goods, and the quotations of productive resources are valued in US dollars: gold/dollar (GOLD/$), oil/dollar (WTI/$), corn/dollar (Corn/$), wheat/dollar (Wheat/$), coffee/dollar (Coffee/$), etc.

For the determination of the value of the market of goods or a group of goods there are different indices of raw materials. The best known among them are: Thomson Reuters/CoreCommodity CRB Index (CRY) and Deutsche Bank Commodity Index, which are calculated based on parameters of futures traded on the exchanges indicated above. The exception is for aluminum and nickel prices, which are based on quotations from the London Metal Exchange, calculated in US dollars. Gold prices are also valued in US dollars.

The quotations of foreign currencies are also translated through the value of the dollar: pound/dollar (GBP/USD), euro/dollar (EUR/USD), dollar/ruble (USD/RUB), dollar/franc (USD/CHF), dollar/yen (USD/JPY), etc.

The best known of these is the US dollar index (USDX) measured in relation to the value of a basket of six currencies: the euro (57.6%), the Japanese yen (13.6%), the pound sterling (11.9%), the Canadian dollar (9.1%), the Swiss franc (3.6%) and the Swedish krona (4.2%). The index began in 1971 with a base of 100, and values since then are relative to this base. Therefore, the current rate of index 97 indicates that the exchange rate of the US dollar, relative to the basket of previous currencies, represents 97% of the level of 1971. ¡ A completely insignificant change in 48 years!. But the reality is that it hasn’t always been like this, and in recent years the index has changed considerably from the level of 70 percent in 2009 to the level of 128 percent in 1985.

Do we say “oil,” but do we really mean “dollar”?

As we have already mentioned, the US dollar is used in goods and currencies; the exception is inverse currency pairs, but it is only a mathematical casuistry for the ease of quotation of these currencies. It is very logical to think that at the moment when the dollar rises, the exchange rate of goods decreases, and vice versa, the depreciation of the dollar leads to the rise of currencies and goods markets.

Between July 2014 and July 2017, oil and the dollar correlated with each other with a coefficient of -0.75, that is, they were inversely correlated. Thus, at that time the linear correlation between EUR/USD pair and Brent-type oil in certain periods of time can reach the coefficient of 0.9, that is, it can be very high.

In the preceding paragraph, I purposely emphasized the phrase “in certain periods of time”. The ability to detect periods, in which one or the other factor impacts on quotes, depends on the competition between traders and the level of his training. In this case, there are no clear examples and schemes, everyone has to take this path on their own. But what we do have to warn about is the effects of oil prices on foreign exchange rates increases over time, when the difference in interest rates is small, as in the years 2014-2017, and decreases, when interest rate potential increases, as in the years 2018-2019.

Analysing the correlation between the prices of goods, oil, and the foreign exchange market, it should be noted that the study of the correlation between these assets has a low efficiency. It is better that traders, who ultimately decide to study the issue on their own, focus on monitoring quotes by oscillators, for example, the stochastic indicator or RSI that allows absolute values to be left by the percentage change of some assets compared to others.

We live in the era of hydrocarbons, and oil and its derivatives are the main product whose price affects all other sectors of the economy, which is reflected in the indices. Energy carriers account for 33% of the composition of the Thomson Reuters/CoreCommodity CRB index, regardless of natural gas. As a major part of the Deutsche Bank’s commodity index, petroleum products, and oil amount to 50 percent.

In this way, the change in the price of oil leads to changes in the entire market of goods, from which some dependencies can be deduced: the decline of the dollar leads to the growth of the price of oil and foreign currencies; and vice versa, the rise of the US Dollar contributes to the depreciation of the price of oil and foreign currencies.

It is impossible to predict the beginning and the end of this correlation. For example, the price of the euro may fall, causing the rise of the US dollar, which in turn will contribute to the fall in the price of oil; or if the price of oil begins to rise, the price of the dollar begins to fall, which in turn causes the growth of the euro.

Purchasing Power Parity Assumptions

Purchasing power parity theory takes into account a world in which there is no single reserve currency, assuming many world trade points, which is not in keeping with the current situation. However, the crisis of the world’s dollar-based currency and the trade wars that have been unleashed as a result of Donald Trump’s presidency have forced the governments of major emerging power centers to try to find a gradual replacement of the US dollar as a universal equivalent value.

Thus, for example, in the calculations of Asian goods, the Chinese yuan has already left the Japanese yen behind and is gradually displacing the US dollar from trade. At the St Petersburg Economic Forum in early June, China and Russia agreed to eliminate the US dollar from reciprocal payments and arrangements; Iran and Turkey take the same path.

The tendency to renounce the dollar is barely growing, but it already seems impossible to stop it. The more trade tariffs the US applies, the more the dollar will shift in financial calculations and the faster the US currency will lose its position as the dominant global currency. Trade wars will inevitably lead to the fragmentation of the world economy in several monetary and customs zones, where the theory of purchasing power parity will be in force in a forceful manner, avoiding the intermediate link that is the US dollar. Of course, there is no one who knows for sure when it will happen, but there is no doubt that one day it will happen.

Purchasing power parity theory, like interest rate parity theory, is the fundamental basis of the currency market. In turn, the study of the relationship between the goods market and the foreign exchange market is an important element in the “authentic” fundamental analysis, unlike the studies of different “relevant” economic indicators or informative, which are very often difficult for private traders to analyse due to a lack of their knowledge and resources. However, knowing how it works and thinking nimbly, we will always find a way to apply the basic rules of the currency market to make a profit, even in complicated situations. He who seeks finds!

Categories
Forex Psychology

Why Do We Sabotage Ourselves Emotionally in Trading?

We spend our entire childhood and adolescence learning to control and develop appropriate responses to our emotions. We learn from our teachers, from our parents, from society, and from our idols through observation and comparison. Therefore, we might think that most people have some control mechanism when they start trading. However, in practice many of us when we operate find ourselves struggling with our own emotions and losing control. While there are a wide variety of reasons that depend on each trader, these are the most common.

Unresolved Personal Problems

This is one of the main reasons why we always say that trading is a way by which we know ourselves. If there is a past problem that we have not solved or that we are not even aware of because the conditions have not been met for it to emerge, I can guarantee that by operating in the markets that problem will appear. In fact, until you identify him and confront him, the problem will resurface again and again. I’m sure you will. A fairly common situation that indicates the presence of a problem is that of a trader who wins consistently over a period of time and then returns everything to the market in a matter of minutes.

Self Reprobation

Simple but dangerous, self-deprecation puts us into a vicious circle that often begins with the mistake of not preparing properly to operate every day. You don’t prepare, you do something stupid and possibly avoidable, you’re angry at the time of surgery, you get depressed, you lose confidence in your abilities, and you make the mistake of not preparing for the next time. In trading, constant effort and results are everything, not just a single trade or a session. Negative emotions can not only be demoralizing and demoralizing but can also physically and mentally exhaust us.

Immediate Effect

When we are operating and need to perform some kind of action, it is often the strongest emotions that come into action just before executing our entry or exit order. This is perhaps the least easy aspect of overcoming without effective strategies to deal with it. When we suddenly have an emotion of any kind, we are inclined to act on it. The problem is that markets don’t care and, in fact, they move in a way that often aggravates the problem. Emotions distort the reality of what is happening and drive us to act in a way that is often counterproductive.

Based on these reasons we can find in our trade situations like the following (sure to sound to more than one!):

Greed leads us to risk more than we should, leveraging ourselves excessively and ruining the account quickly after a streak of winning operations that has led us to trust too much. It confirms a pattern we have studied but we are afraid to enter the operation and we end up joining the movement too late, buying or selling at the end of the movement.

When a trade goes against us, we decide not to assume the loss and expand or remove the stop loss thinking that the position will return to our favor, thus breaking with our trading plan. The reasons behind all these behaviors are the biases of the mind, some of which we have already seen in other articles on Psychology and Trading. In the case of emotional sabotage, three are the biases that fundamentally affect us:

Bias of Confirmation: This is the tendency to favour, seek, interpret, and recall information that confirms one’s beliefs or hypotheses, giving disproportionately less consideration to possible alternatives. Applied to trading, it would be the tendency to ignore the evidence that our strategies will make us money or the opposite: trust patterns not properly analyzed thinking that we will win when they are actually losers.

Bias of Recent Experience: It is a bias of our mind that comes to keep a sharper and more intense memory of the information we have received more recently, which implies that the context that we apply to our way of thinking at a given moment assumes the sum of memories or previous experiences weighted according to the closeness in time of such experiences or memories. This bias clearly explains why traders rely on excess if they have a winning streak, They hesitate to open a new position if they have had a bad streak or make bad decisions when they are not focused enough and chain several mistakes.

Media Bias: It is the tendency of the media to select the news and information with which it is intended to distort, distort, or lie about a certain fact. Applied to trading, the consequence would be to get carried away by the news published by the media, buying the trendy values, or following the new guru who appeared on television.

How to Overcome Emotional Sabotage?

I’m sure you’re tired of hearing it, but apart from the fact that this is a highly recommended practice to overcome emotional sabotage, it’s absolutely necessary: KEEP A TRADING JOURNAL! In that diary, you will have to tell things as they happened, which requires an important exercise of honesty with ourselves. Don’t blame the market and those who move it. Document what really went wrong and whether we were responsible for it.

The exercise of keeping such a diary honest with ourselves may involve encountering uncomfortable revelations but without a doubt, it is the best (and fastest) way to improve our trading since if we identify and correct the problem we detect (before we merge our account!), this could be a real change in our career as traders.

Additionally, an excellent idea is to create a checklist of our trading plan and make sure you have it in front of you all the time. It’s certainly hard to break the rules if we have them in front of us. By doing this we have another powerful tool to identify the root of the problem that causes emotional sabotage and allows us to correct it in real-time before we go ahead and make more mistakes that ruin our account.

Finally, another important recommendation is to learn to know yourself and how we act as traders. If we tend to make certain mistakes, are prone to be victims of certain biases, are confused by the excess of information, or let fear and greed cloud our judgment, then it will be necessary, to be honest with us and admit how we are, for better or for worse. Surely there will be some traits of our character that we will have to learn to correct if we want to succeed in trading but knowing who we are will allow us to make the most of our capabilities and minimize the impact of our weaknesses, thus minimizing the impact of emotional sabotage on our account.

Conclusion

In trading and in life, many times the key to success is knowing what is not to be done, so if bad habits and mistakes are costing us money, then like many traders you are struggling with emotional sabotage. And as if it were a disease, the sooner we detect emotional sabotage, the sooner it will be treated and we will avoid further damage.

A properly studied and analyzed strategy is our best weapon on the market, so once we have one we must let it work. Use your trading journal to detect emotional sabotage and be honest with yourself. Remember: just because the market does things that defy reason, doesn’t mean we have to do them too!

Categories
Forex Indicators

RSI: The Best Forex Indicator?

Far from being something that will help you operate profitably, the usual use of Forex indicators really causes more losses than gains among inexperienced traders. However, if you are going to use them, then you should know that the best Forex indicator is the RSI (Relative Strength Index).

What is the RSI (Relative Strength Index)?

The RSI reflects the momentum and it is well known that following the momentum in the foreign exchange market increases the chances of profits. The RSI is an indicator of momentum in the Forex market and, in fact, it is the best indicator of momentum. If you are willing to use the RSI, probably the best way to use it is to go long when it is above 50 in all time frames, and operate short if it is below 50 in all time frames. It is best to always operate with the trend of the last 10 weeks or so. The formula of the relative strength index was created in the 70s, as were many other concepts of technical analysis. 

Relative Strength Index – Forex Indicators

The calculation of the relative force is performed by calculating the ratio of upward changes per unit of time to downward changes per unit of time during the review period. The actual calculation of the indicator, however, is more complex than we need to know here. What is important to know is that if we look back over a period of, say, 10 units of time and each of those 10 candles closed upwards, the RSI will show a number very close to 100. If each and every one of those 10 closed candles, the number will always be very close to 0. If the financial asset is fairly balanced between drops and raises, the RSI will show 50. The relative force index is defined as a pulse oscillator. Shows whether bulls or bears are winning in the review period, and this period can be adjusted by the trader.

Technical Analysis of the Relative Force Index

The RSI indicator is normally used in forex trading strategies in the following ways:

  1. When the RSI is above 70, a price drop should be expected. A drop below 70 after having been above 70 is taken as confirmation that the price is starting a downward movement.
  2. When the RSI is below 30, a price increase should be expected. A rise above the level of 30 after having been below 30 is taken as confirmation that the price is starting an upward movement.
  3. When the RSI crosses above 50 after being below 50, it is taken as a sign that the price is beginning a bullish movement.
  4. When the RSI crosses below 50 after being above 50, it is taken as a sign that the price is beginning a bearish movement.

Methods 3 and 4 described above in relation to crossing the level of 50 are generally higher than the first and second methods concerning 30 and 70. That’s because more long-term Forex earnings can be achieved by following trends instead of always expecting prices to bounce back to where they were: just be careful not to move the stop loss to the break-even point too quickly.

Forex Indicators

This is a point where we will pay more attention – if it is better to follow trends, or “diminish” them by doing trades against them. There are many outdated tips on this subject, most of which were in the years prior to 1971, at a time when exchange rates, although they were fixed at the price of gold or other currencies. In this era, trading was mainly in shares or, to a lesser extent, in raw materials. It is a reality that commodities and stocks tend to show markedly different pricing behaviour from the exchange rates of Forex currency pairs – stocks and commodities show trends more often, are more volatile, and follow longer and stronger trends than Forex currency pairs, which show a stronger tendency to return to average.

This means that when making Forex trades, most of the time, using the RSI to trades against directional moves using methods 1 and 2 described above, will work more often, but it will generate less utility than the use of Methods 3 and 4 to track trading trends in the direction of the strong prevailing trend, where such a trend exists. Although it may seem attractive to try to earn smaller amounts more often and use money management to increase profits quickly, It is much more difficult to build a cost-effective medium-reversion model than to build a cost-effective trend tracking model, even when trading with Forex currency pairs. The best way to operate at RSI 50 level crossings is to use the indicator in multiple time frames for the same currency pair.

Crossing The 50 Level In Various Time Frames

Open several charts of the same currency pair in several time frames: weekly, daily, H4, up to the minute. Open the RSI flag in all charts and make sure the 50 level is checked. Virtually all forex graphics programs or software include the RSI, so it should not be difficult to use it. A good period to use in this indicator is 10. It is also important that the market review period is the same in all different time frames.

If you can find a currency pair that in all the higher time frames is above or below 50, and in the lower time frames is on the other side of 50, then you can expect the lower time frame to cross again above 50 and should accordingly open an operation in the direction of the long-term trend.

The higher or lower the RSI, the better the operation. In the forex markets, it is a universal law: strong trends are more likely to continue and a reversal that then turns tends to move very well in the direction of the trend. This method is a smart way to use a forex indicator because it identifies setbacks within strong trends and tells you when the setback is likely to end.

Categories
Forex Technical Analysis

Quantitative Trading and Its Differences with Technical Analysis

Today’s article is about definitions. Maybe for those who read us regularly, it is not necessary, but every day new readers approach for whom all this subject of quantitative trading, technical analysis, backtesting, chartismo… etc sounds more or less Chinese. Quantitative trading is my way of understanding trading today. It’s what I do and what I work with. So today I will provide my definition on the subject.

Quantitative Analysis: Talk of Numbers

When we refer to quantitative analysis we are talking about examining numerical variables. In the case of investment or speculation on the stock exchange, we are talking about quotes, volume, indicators, correlations, etc. Other aspects that cannot be reliably quantified, such as the change of the CEO of a company or the results of the presidential elections, are not taken into account. Working on the basis of these numerical variables, quantitative analysis uses mathematical and statistical methods to establish models for developing trading systems.

A quantitative trading system can be very sophisticated and trades highly complex derivative instruments, or it can be a simple system that trades shares. The asset type does not qualify for the type of trading. You need to work with models. I don’t know if you’ve ever heard the phrase: “All models are wrong, but some are useful.” When we refer to quantitative analysis, this is the case. So, indeed, you need to work with models. Why?

I personally have several reasons:

-On the one hand, the models are more accurate than our discretionary judgments. The psychological aspect has an important weight in our decisions.

-We are human and cognitive biases affect our perception of reality. Finding ways to master them is always positive

-They streamline decision-making. Using systems allows you to have a much faster reaction.

-It allows several approaches to be addressed.

-Models or systems give you the framework to work with.

But remember that models are simplifications. In order for a system to be efficient, it needs to cover only part of reality. There is no all-terrain system that never fails and is perfect. Hence, the plan to follow is the use of a portfolio of systems combining different strategies: pairs trading, arbitrations, mean-reverting until even tracking trends.

Working With Odds

In a quantitative trading strategy, you work with probabilities. There are no certainties but probabilistic models to explain the behavior of the market. In algorithmic trading, everything is written. There’s no algorithmic trading without computers.

Quantitative trading, also called algorithmic trading, is a systematic way of trading. It is said that a system does not exist unless its rules are written. Well, in algorithmic trading all rules are written in the computer code of the system. Metrics are used when quantitative trading systems are developed. These metrics and ratios help in the development and use of the system to make decisions.

HFT (high-frequency trading) is quantitative trading, but not all quantitative trading is HFT. It’s understood, right? Quantitative trading is not synonymous with high-frequency trading, nor does it necessarily mean intraday trading. Quantitative analysis can be used perfectly in larger time frames such as daily or even weekly.

What happens is that trading systems that operate in very short periods of time are automatic systems. It is an algorithm that sends the orders to the market and hence the association with algorithmic trading /quantitative.

A trader using a quantitative system may or may not transmit orders automatically to the broker. Transmitting orders automatically is the norm, but it is not mandatory. An automatic system retrieves quotes in real-time directly from the broker or other data provider, executes an algorithm leading to trading signals, and sends orders directly to the broker for execution.

A semi-automatic system, for example, can run the algorithm and generate the input or output signals, but it is you as a trader who is responsible for sending the orders to the broker. The advantage of the automatic system is the reduction of human error. Especially, that kind of human error that causes you as a trader to break the rules of the system. Does it sound like you have made this kind of mistake? It’s impossible to break the rules here. In addition, the obvious advantage is the increase in execution speed, so for systems that work in short time frames, a fully automated system is indispensable.

Quantitative Versus Technical Analysis

Quantitative analysis and technical analysis have commonalities, but also fundamental differences in their principles. To clarify the terms, we start by defining what is the technical analysis

The main idea of the technical analysis is that “the price discounts everything”. All the information you need to make your trading decisions is based on quotes, and in some cases also on volume. From quotes, the technical analyst tries to look for recurring patterns that can predict future price behavior.

This is a common point with quantitative analysis, which can also be based (but not necessarily exclusively) on quotations and look for patterns in them. But what differs is the method and the form.

In technical analysis, one way of identifying patterns is chartism. By chartism, we mean figures such as shoulder-head-shoulder, triangles, Elliot waves, etc. Well, chartist analysis based on graphs has a subjective component incompatible with quantitative analysis.

Technical analysis is mainly based on visual examination of charts or charts. By looking at the graphs, trends are established, the points of support and resistance, the crossings of indicators, etc. The technical trader makes his decisions, usually discretionary, looking at the charts and trading according to what he sees.

On the other hand, quantitative trading is not based on what you see in the chart. If you want, you can illustrate your system by plotting the signals on a chart, but it is not essential to generate the input and output signals to the market. Your signals come from the trading system you’ve programmed, not from what your eyes see.

Discretionary or Non-Discretionary

Quantitative trading is not discretionary. Trades are taken according to pre-established rules. The trader who operates on the basis of technical analysis does make discretionary decisions. I’ll tell you about my experience when I only operated by following technical analysis. Perhaps you are familiar with it.

1- You’re in front of the screen.

2- You are convinced that now is a good time to do a trade.

3- You look for any sign on the chart. You look, you look and you look.

4- In the end, you end up performing an operation, but based on the emotion and your previous belief that conditions you.

5- Evidently, then you try to justify the operation by arguing technical reasons: that if it looked like a certain figure, that if the resistance X would break, all this only to justify a decision not 100% rational and influenced by your cognitive biases.

Down Theory

The second idea on which technical analysis is based is Down theory. According to this theory, prices are driven by trends. The trader that operates on the basis of technical analysis tries to take advantage of these trends to obtain profitable trades.

Quantitative analysis is not based on this theory. It does not blindly accept that prices follow trends. What you are looking for is to analyze for each asset and time frame how its behavior is. From the results of the analysis, look for the best way to take advantage of the behavior studied.

Backtesting is something that distinguishes quantitative trading from discretionary trading. When you operate a quantitative trading system it’s because you’ve done a backtest before. Discretionary trading cannot backtest because the entry and exit conditions are not the same over time.

Conclusion

Remember that we already said at the beginning of this article, the main characteristic of quantitative trading is that it is based on mathematical and statistical models. Chartist figures, Elliot waves, and hunches are not incorporated here. It is not worth it if in the graph I see a flag or a bat, if I am in wave 4 of the extended third or if it is an ABC. There is no place at all for a subjective opinion. Only data matters. Then we can already say that it is the opposite of discretionary trading.

In quantitative trading, decisions to buy and sell assets, whether shares, ETFs, futures, forex, etc- are based on a computer algorithm. Hence quantitative trading is also known as algorithmic trading. The starting point of a quantitative trading system is data. What types of data? The system can incorporate quotation data such as price and volume, global economic data such as interest rates or inflation, asset financial ratios such as cash flow, income, DTE, EPS, etc.

A technical analysis strategy can be part of a quantitative system if it can be coded. However, not all technical analysis can be included in the quantitative, for example, some chartist techniques are subjective, cannot be quantified, and need candles in the future for the confirmation of the figure. Let’s say one of the differences is in the quality of the analysis. Many technical analysts look for patterns that they say repeat themselves, but cannot prove how often statistics these patterns precede certain price movements.

Categories
Forex Fundamental Analysis

EUR/JPY Global Macro Analysis – Part 3

EUR/JPY Exogenous Analysis

  • The EU and Japan Current Account to GDP differential

The current accounts have three basic components: net exports, the difference in incomes that countries pay each other, and transfer payments that countries make to each other. A country that has a surplus in international trade has a higher current account to GDP ratio. Since its domestic currency is in higher demand, it tends to appreciate. Conversely, a country with current account deficits will need to buy more foreign currencies to finance its imports – which weakens the domestic currency in the forex market.

In 2020, the Japanese currency account to GDP ratio was expected to drop to 3.5% while that of the EU 3.4%. This means that the 2020 current account to GDP differential between the EU and Japan is -0.1%. In this case, we expect a bullish JPY; hence, we assign a score of -2.

The interest rate differential between the EUR/JPY pair is used to determine whether traders are bullish or bearish. If the interest rate differential is positive, it means that traders can receive higher returns by selling the JPY and buying the EUR since the EUR offers higher returns. Thus, they are bullish on the pair. Conversely, if the interest rate differential is negative, it means that traders can receive higher returns by selling the EUR and buying the JPY, which means they will be bearish on the EUR/JPY pair.

In 2020, the Bank of Japan maintained the interest rates at -0.1% while the ECB maintained at 0%. Therefore, the interest rate differential for the EUR/JPY pair is 0.1%. We assign a score of 2.

  • The EU and Japan GDP Growth Rate differential

The rate at which an economy is growing impacts the strength of the domestic currency in the forex market. Since it is impractical to compare countries’ economic performance using absolute GDP numbers, we will use their growth rate. In this case, if the GDP growth rate differential is positive, it means that the EU economy has been growing at a faster pace than that of Japan hence a bullish outlook for the EUR/JPY pair. Conversely, when negative, it implies a bearish outlook for the pair.

The Japanese economy contracted by 3.5% in the first three quarters of 2020, while the EU economy contracted by 2.9. Thus, the GDP growth rate differential is 0.6%. Thus, we assign a score of 2.

Conclusion

The exogenous factors have a cumulative score of 2. That means we can expect a short-lived bullish trend for the EUR/JPY pair. The weekly EUR/JPY chart shows that the pair has crossed the 200-period MA for the first time since August and attempting a breach of the upper Bollinger band.

We hope you find this article informative. In case of any questions, please let us know in the comments below. Cheers.

Categories
Forex Fundamental Analysis

EUR/JPY Global Macro Analysis – Part 1 & 2

Introduction

The global macro analysis of the EUR/JPY forex pair will involve the analysis of endogenous and exogenous economic factors. The endogenous analysis will cover indicators that drive economic growth in the EU and Japan. Exogenous factors will cover the analysis of factors that impact the exchange rate between the Euro and the Japanese Yen.

Ranking Scale

We will use a scale of -10 to +10 to rank the impact of these factors. When the endogenous factors are negative, it implies that they resulted in the depreciation of the local currency. a positive ranking implies that they led to an increase in the value of the domestic currency. The ranking of the endogenous factors is determined by their correlation with the domestic GDP growth.

When the exogenous factors get a negative score, it means they have a bearish impact on the EUR/JPY pair. A positive score implies they’ve had a bullish impact. The ranking of the exogenous factors is determined by their correlation to the exchange rate of the EUR/JPY pair.

EUR Endogenous Analysis – Summary

The endogenous analysis of the EUR has an overall score of -3. Based on the factors we have analyzed, we can expect that the Euro had marginally depreciated in 2020.

JPY Endogenous Analysis – Summary 

A score of -12 implies a strong deflationary effect on the JPY currency pair, and we can conclude that this currency has depreciated this year.

  • Japan Employed Persons

This indicator measures the changes in the number of workers over a particular period. It only tracks the section of the labor force that has attained the minimum working age. Changes in the labor market are seen as leading indicators of economic development.

In October 2020, the number of employed persons in Japan increased to 66.58 million from 66.55 million in September. The number of employed persons in Japan is still lower than the 67.4 million recorded in January. We assign a score of -5.

  • Japan GDP Deflator

The GDP deflator is used to measure the comprehensive changes in the overall inflation of the Japanese economy. Since it measures the price changes of the entire economic output, it is used as a key predictor of future monetary and fiscal policies. An increase in GDP deflator means that the economy is expanding, which may lead to the appreciation of the JPY.

In Q3 of 2020, the Japan GDP deflator dropped to 100.4 from 103.5 in Q2. Up to Q3, the Japan GDP deflator has marginally increased by 0.2 points. We assign a score of 1.

  • Japan Industrial Production

This indicator covers the changes in the output value of mining, manufacturing, and utility sectors. The Japanese economy is highly industrialized. The industrial sector contributes approximately 33% of the GDP. That means the GDP growth rate in Japan is sensitive to the changes in industrial production.

The MoM industrial production in Japan increased by 3.8% in October 2020 while the YoY dropped by 3.2% – the slowest since February 2020. On average, the MoM industrial production in Japan is -0.15%. We assign a score of -5.

  • Japan Manufacturing PMI

About 400 large manufacturers are surveyed monthly by The Jibun Bank. These manufacturers are classified according to the sector of operations, their workforce size, and contribution to GDP. The overall manufacturing PMI is an aggregate of employment, new orders, inventory, output, and suppliers’ deliveries. The Japanese manufacturing sector is seen to be expanding when the PMI is above 50 and contracting when below 50.

In November 2020, the Japan Manufacturing PMI was 49 compared to 48.7 in October. The November reading is almost at par with the January levels. We assign a score of 1.

  • Japan Retail Sales

The retail sales measure the change in the monthly purchase of goods and services by Japanese households. Since it is a leading indicator of consumer demand and expenditure, it is best suited to gauge possible economic contractions and expansions.

In October 2020, Japan retail sales rose by 0.4% from 0.1% recorded in September. YoY retail sales increased by 6.4%, which marks the first month of increase since February 2020. The growth of retail sales is mainly attributed to an increase in motor vehicle sales, machinery and equipment, and medicine & toiletry. On average, the first ten months of 2020 have had a 0.4% increase in MoM retail sales. Thus, we assign a score of 2.

  • Japan Consumer Confidence

This is a monthly survey of about 4700 Japanese households with more than two people. The survey covers the households’ opinion on the overall economic growth, personal income, employment, and purchase of durable goods. An index of above 50 shows that the households are optimistic, while below 50 shows that they are pessimistic.

In November 2020, Japan’s consumer confidence was 33.7 – the highest recorded since March. It is, however, still lower than the pre-pandemic levels of 39.1. We assign a score of -3.

  • Japan General Government Gross Debt to GDP

Prospective domestic and international lenders use the government debt to GDP ratio to determine the ability of an economy to sustain more debt. Among the developed nations, Japan has the highest government debt to GDP ratio. However, it has minimal risk of default since most of the debt is domestic and denominated in Japanese Yen, which poses a low risk of inflating the domestic currency in the international market.

In 2019, the general government gross debt to GDP in Japan was 238%, up from 236.6% in 2018. In 2020, it was projected to hit a maximum of 250%. We assign a score of -3.

In our upcoming article, we have performed an Exogenous analysis of the EUR/JPY Forex pair and gave our optimal forecast. Make sure to check that out. Cheers.

Categories
Forex Course

203. Bond Spreads Between Two Economies and Their Exchange Rate

Introduction

Bond spreads play a vital role in the movement of currencies. The difference between the bond yield of two countries is called interest rate differential. It is more impactful on the currency direction as opposed to the actual bond spreads. The difference between the interest rate between the bond yield of two countries typically moves together with the corresponding currency pair.

Understanding The Impact

The prices of different currencies can influence the monetary policy decision by the central banks across the globe. However, monetary policy decisions, as well as interest rates, can also contribute to the price movement of the currencies. For example, a stronger currency will help control the inflation rate, whereas the weaker currency will contribute to inflation.

Additionally, the central banks harness this relationship as a means to manage the monetary policies in the respective countries. By comprehending as well as assessing these relationships and the patterns, people get a window into the currency market, thereby getting a means to forecast and capitalize on the currency movements.

An Example of This Relationship

In 2000, post the tech bubble burst, traders who were earlier looking for the highest returns shifted their focus on capital preservation. However, the U.S. was provided with below 2% interest rate, a lot of hedge funds, and those who had access to the international market moved abroad looking for higher yields.

Moreover, Australia has similar risk factors as the U.S. extended interest rate of 5%. Consequentially, this attracted a lot of investment money within the country, creating asset domination. This significant difference in interest rate resulted in the growth of the carry trade. In this, the investors bought currency from low yielding countries and invested in high yielding countries, and benefited from the difference in the interest rate.

Bond Spreads and Movement Of Currency

Bong spreads differential typically move together with currency pairs. This notion emerges as the capital flows move towards high yielding currencies. When there is an increase in one currency rate with respect to another currency, the investors move towards the higher-yielding currency.

Furthermore, the cost of acquiring lower-yielding currencies rises as the bond spread differential moves in favor of selling currency.

[wp_quiz id=”97499″]
Categories
Forex Course

202. The Effects Of Bond Yields On The Forex Asset Classes

Introduction

Bonds are referred to as loans provided to big organizations, including national governments, corporations, and cities. Each bond includes a substantial amount of loan. This is because the massive operational scale of the units requires them to take money from multiple sources. Bonds are a form of fixed-income investments.

Bond Yields

Bond yield is defined as the measure of profit that you will make by investing in a bog. The less you pay for the particular bond, the more will be your profit, and the higher your yield will be. Similarly, the more money you invest in a bond, the lesser will be the profit, and subsequently, the lower will be your yield.

Bonds are traded within the foreign exchange market known as the currency pairs. It is defined as the relative rate between the currency of one country and the currency of another one. When a currency pair is traded, the traders are also acquiring one currency and selling the other.

A majority of the currency exchange transacted in the spot market. In this currency market, each participant is required to deliver their respective currency within two business days. Moreover, currency trade that involves the delivery of a currency over two days is executed on the forward market.

This market includes the costs of owning a currency relative to owing the other. And the costs are displayed in the forward’s points that are added or subtracted to the spot rate in order to produce the forward rate. Furthermore, the forward points are measured by subtracting one bond yield from the other.

How Bond Yield Impacts The Currency Movement?

Experienced foreign exchange traders will be able to identify the relationship between the value of the currency, stock prices, and bond yield. The movement in the currency value reflects the actions of foreign investors between stocks and bonds.

Additionally, the relationship between bond yields makes government bond yield serve as a valuable indicator for assessing the opinion on the effectiveness of the U.S. Federal Reserve in inflation control.

Considering that inflation is an imperative aspect that determines currency values, the data extended by the treasury is very important. Granted, the bond yield centres on inflation, as it is associated with growth.

[wp_quiz id=”97495″]
Categories
Forex Course

201. The Relationship Between The US Dollar & Crude Oil

Introduction

There is a strong and rather undiscovered string that brings together currencies and crude oil. Price actions in one area, it forces opposing or sympathetic reactions in the other. Such a correlation persists for different reasons that include the balance of trade, resource distribution, market psychology, etc.

Additionally, crude oil makes a considerable contribution to deflationary and inflationary pressures that reinforces the inter-relationships amidst the trending periods, to downside and upside.

The Relationship Between The U.S. Dollar and Oil

Oil is quoted in U.S. dollars; therefore, each downtick, as well as an uptick in the currency or in the communities price, create a direct realignment between the numerous forex crosses and greenbacks. Such movements are not that correlated in countries without major crude oil reserve.

The Changing Scenario Of Oil Correlations

Many countries harnessed the crude oil reserved amidst the historical rise of the energy market between the 1990s and 2000s. Borrowings were made excessively to develop infrastructure, execute social programs, and expand military operations.

Post the economic collapse of 2008; the bills came to sue wherein some nations delivered whereas the others decided to double down by borrowing more against the reserved in order to rebuild the trust among their impacted economies.

The substantial burden of debt assisted in keeping high growth rates until the price of the global crude oil collapses in the year 2014. This also threw commodity-sensitive countries in a recession zone. Brazil, Canada, Russian, etc. experienced a struggling period for a couple of years while they adjusted to the plummeting values of their currencies. However, they did make a comeback between 2016 and 2017.

The pressure to sell more has spread across different groups of commodities, increasing concerns related to global deflation. Subsequently, it strengthened the correlation between commodities that were affected that include economic centres without major commodity reserves and crude oil.

Moreover, currencies in countries that have major mining reserves but inadequate energy reserves witness reduced currency value in comparison to oil-rich countries.

The U.S dollar has benefited from the decline of crude oil because the U.S economic growth is for some odd reasons compared to the trading partners, maintaining the right balance.

[wp_quiz id=”97491″]
Categories
Forex Fundamental Analysis

EUR/CAD Global Macro Analysis Part 3

EUR/CAD Exogenous Analysis

  • The EU and Canada Current Account to GDP differential

When a country has a high current account to GDP ratio, it means that it is running a current account surplus. That implies that the country is highly competitive in international trade as the value of its exports is higher than its imports. Conversely, a country with a low or negative current account to GDP ratio, is running a current account deficit. It means that the value of its imports is higher than exports.

In 2020, Canada’s current account to GDP is expected to hit -2.7% while that of the EU 3.4%. Thus, the current account to GDP differential between the EU and Canada is  6.1%. This means that the EUR is in higher demand in the international market than the CAD. We assign a score of 5.

In the forex market, interest rate differential helps to show investors and traders which currency will earn them higher returns. In a carry trade, forex traders tend to be bullish on the currency that offers a higher interest rate differential. This means that the currency with the higher interest rate will have a higher demand than the lower interest rate.

The European Central Bank has maintained interest rates at 0% throughout 2020, while in Canada, interest rates were cut from 1.75% to 0.25%. Thus, the interest rate differential for the EUR/CAD pair is -0.25%. We assign a score of -2.

  • The EU and Canada GDP Growth Rate differential

Since countries vary in the economy’s size, it makes it hard to compare them based on absolute GDP. However, the GDP growth rate helps filter out the effects of the economy size and instead compares countries based on their growth.

From January to September 2020, the Canadian economy has contracted by 4.3% while the EU economy has contracted by 2.9%. That means that the GDP growth rate differential between the EU and Canada is 1.4%. i.e., the Canadian economy has contracted more than the EU economy. We assign a score of 4.

Conclusion

The exogenous analysis of the EUR/CAD pair has a score of 8, which means we can expect a bullish trend for the pair in the short-term. This is supported by our technical analysis, which shows the weekly chart bouncing off the lower Bollinger band, implying that an uptrend is looming.

We hope you find this article informative. In case of any queries, please let us know in the comments below. All the best.

Categories
Forex Fundamental Analysis

EUR/CAD Global Macro Analysis Part 1 & 2

Introduction

The global macro analysis of the EUR/CAD pair will analyze endogenous factors that drive the domestic GDP in the EU and Canada. We’ll also analyze exogenous factors that affect the dynamics of the EU and Canada economies, hence affecting the EUR/CAD exchange rate.

Ranking Scale

We’ll rank both endogenous and exogenous factors on a sliding scale from -10 to +10. When the endogenous factors are negative, it means they caused the domestic currency to depreciate. A positive ranking means they resulted in an appreciation of the currency during the period under review. The endogenous scores are based on correlation with the domestic GDP growth.

Similarly, when the exogenous factors get a negative score, they resulted in a drop in the exchange rate. A positive exogenous score means it increased the exchange rate of the EUR/CAD pair. The exogenous scores are based on a correlation with the price of the EUR/CAD pair.

EUR Endogenous Analysis – Summary

The endogenous analysis of the EUR has presented a score of -3. Based on the indicators that we have analyzed, we can conclude that the Euro has depreciated marginally this year.

CAD Endogenous Analysis – Summary

This economic indicator shows the monthly change in the number of Canadians who are employed. It covers both full-time and part-time employment. Normally, employment changes correspond to an increased business activity, which corresponds to changes in the GDP.

In November 2020, employment in Canada increased by 62,000, down from the 83,600 increase registered in October. The November employment change was the lowest since May 2020, when economic recovery from the effects of the coronavirus began. Up to November 2020, the Canadian economy has shed about half a million jobs. We assign a score of -6.

  • Canada GDP Deflator

The GDP inflator is a comprehensive measure of the change in the inflation rate in Canada. It is comprehensive since it reflects the changes in the prices of all goods and services produced within the economy. This contrasts with other measures of inflation like the CPI, which only measures changes in the price of a select basket of goods and services.

In Q3 of 2020, the GD deflator in Canada rose to 111.6 from 108.8 in Q2. Q3 reading is the highest ever in the history of Canada. This shows that the Canadian economy is bouncing back from the economic downturn brought about by the pandemic. We assign a score of 2.

  • Canada Industrial Production

This indicator measures the total output from businesses operating in the industrial sector. Canadian industrial production comprises mining, manufacturing, and utilities. It is the backbone of the Canadian economy, with crude oil production alone accounting for almost 10% of the GDP.

In September 2020, the YoY Canadian industrial production dropped by 7.9%, while the MoM increased by 1.41%, up from the 0.13% drop in August. Up to September, the overall industrial production is down 5.54%. We assign a score of -5.

  • Canada Manufacturing PMI

This indicator measures the Canadian manufacturing sector’s performance from the perspective of firms’ purchasing managers in the sector. The PMI aggregates the following indexes; inventories, employment, new orders, output, and suppliers’ deliveries. The sector is expanding if the index is above 50, while a reading below 50 shows contraction.

In November 2020, the Canada Manufacturing PMI rose to 55.8 from 55.5 in October. This marked the fifth consecutive expansion in the manufacturing sector from July 2020. Thus, we assign a score of 4.

  • Canada Retail Sales

The Canada retail sales data measures the changes in the value of final goods and services purchased by households over a particular period. It is a critical leading indicator of the overall economic growth since households’ consumption is considered the primary driver of GDP growth.

In September 2020, the MoM retail sales in Canada increased by 1.1%  compared to a 0.5% increase in August. YoY retail sales rose by 4.6% compared to 3.7% in August 2020. Up to September 2020, the retail sales figure has risen by an average of 1.38%. We assign a score of 3.

  • Canada Consumer Confidence

Canada consumer confidence is calculated from an aggregate of 11 questions from the survey of households. This survey estimated the current situation to that expected by households in about six months. The questions touch on the areas of the economy, personal finances, job security, household purchases, and savings vs. expenditure goals. Their confidence is measured on a scale from 0 to 100.

In November 2020, consumer confidence in Canada rose to 44.5 from 42.08 in October. It is, however, still lower than during the pre-pandemic period. We assign a score of -5.

  • Canada Government Gross Debt to GDP

In 2019, Canada had a government debt to GDP ratio of 88.6%, down from 89.7% in 2018. The 2019 ratio was the fourth consecutive year since 2016, when the government debt to GDP ratio dropped.

In 2020, it is projected that the Canadian government debt to GDP ratio will increase to 97%. This increase is due to the increased expenditure to alleviate the economy during the coronavirus pandemic. Over the long term, Canada’s government debt to GDP ratio is expected to stabilize around 90%. We assign a score of -2.

In the next article, you can find the exogenous analysis of the EUR/CAD forex pair where we have qualitatively forecasted the future price movement of this pair. Cheers.

Categories
Forex Course

200. The Correlation Between USD/CAD Pair & Crude Oil

Introduction

Crude oil, also known as black gold, is the major energy source that runs the economy. Canada is among the top oil producers in the world. It is one of the major oil exporters to the USA. Canada exports more than 3 million barrels of petroleum and oil products, a figure that is sufficient to impact USD/CAD’s movement.

USD/CAD and Crude Oil – The Correlation

The volume of crude oil that Canada exports to the US generate massive demand for the CAD. Moreover, Canada’s economy depends a lot on its exports, and approximately 85% of the country’s exports go to the US.

Therefore, the value of USD/CAD is significantly impacted by how the consumers in the United States reach oil prices. If the US’s demand increases, manufacturers have to order more oil to cater to the rising demand. This can result in rising oil prices, thereby resulting in reducing the value of USD/CAD.

Conversely, if the US’s demand falls, the manufacturer will not need to order in more oil to make goods. Subsequently, the oil prices might fall, which would be bad from the CAD value. So essentially, USD/CAD has a negative correlation.

It’s all about Supply and Demand

Supply and demand are the prominent influencers of the correlation between USD/CAD and crude oil, impacting the demand and supply of US dollars and Canadian dollars.

Export of cruise oil covers a significant percentage of the US currency acquired by Canada. This means that a shift in the price and volume of crude oil will have a considerable impact on the flow of the Greenback into the Canadian dollar.

Furthermore, high crude oil prices also imply a higher flow of USD into Canada due to its exports. This implies that there will be a strong supply of the USD into the Canadian dollar, thereby increasing the value of the Canadian dollar.

Similarly, when the crude price falls, the US dollar supply will be lowered as opposed to the Canadian dollar, leading to a decreasing value of the Canadian dollar.

[wp_quiz id=”97486″]
Categories
Forex Basic Strategies

What Is the Best Strategy for Forex Trading in 2021?

2020 is over and we must prepare our best Forex strategy to start the year 2021 in the best possible way. Undoubtedly, to define the future of our Forex operation we must take into account the most relevant events and news that we will encounter. Let’s define below some of those we think will most influence when designing the best strategy for Forex next year 2021.

What should we pay attention to? Highly effective news about Covid vaccines can lead to a decrease in the extreme levels of market volatility we saw in 2020 and a return to normality faster than expected. Investors should also consider the need for fiscal stimulus to save the economy before the global availability of vaccines, the increase in cybercrime, the relationship between the United States and China, and the risks to market leadership. Many investors may want to diversify to find high-return assets that can provide a stable source of income. There is broad consensus that the infrastructure sector will be one of the main beneficiaries after potential economic stimuli.

Then, looking at the market outlook for 2021, following the pandemic and the global crisis, next year will present both opportunities and risks for investors, as markets and sectors will rebound unevenly. This has been an unprecedented crisis, with winners and losers, that has entrenched current market trends, accelerating Internet disruption, and worsening the disinflation of the service industry. Therefore, it will be advisable for investors to diversify into different assets to search for their income.

In the year 2020, we have experienced a deep recession and the consequent bearish market, but it has not affected all sectors in the same way. Many companies are at their worst, and others have never really been better. This situation has led to an incredible dispersion in equity yields and credit spreads. In addition, the rebounds of different assets should remind us all that their valuations have as much to do with the discount rate as with the benefits.

The Current Economic Recovery Will Continue

In 2021 we see that the economic recovery will continue, as the latest sanitary innovations allow the normalization of private sector activity. However, with negative real interest rates in all advanced economies and likely to remain so for 2021 and several more years, investors will have to do more to find attractive returns.

The attractiveness of opportunities in alternative assets could increase in this low-return environment for longer. And as we have already mentioned, the infrastructure sector will be one of the main beneficiaries of the global economic stimulus packages and, within the universe of the instruments listed, the low level of return on a fixed income in developed markets will mean that investors will have to have a more global view. For example, dollar-denominated emerging market debt, including Chinese government bonds, can be particularly attractive.

What to Look for In 2021

The COVID-19 pandemic shocked us all during this year 2020, so investors need to consider what surprises the year 2021 could bring and what this will mean for their investment decisions.

1- The rise of cybercrime: the virus and the associated economic shutdowns have led to significant adjustments in telecommuting, which can make some sectors or businesses more vulnerable to the negative effects of a cyber attack.

2- 2021 will be the year of vaccines: highly effective and rapidly distributed vaccines would allow a return to normality sooner than expected. This, coupled with monetary stimuli, can trigger a strong rally in the markets.

3- Fiscal paralysis: Despite low interest rates and economic needs, paralysis in Washington, D.C., and reduced fiscal appetite in Europe mean a bridge to the vaccine is missing in the coming months. This could lead to a double-dip in the economy and markets.

4- Threat to monopoly: A possible change in the tax code and stricter regulation for large technology companies can bring about a major shift in market leadership towards small caps.

5- Improving US-China relations: the new US leadership lays the groundwork for a new engagement with China, including a reduction in tariffs and a reduction in restrictions on technology exports. Reducing uncertainty and improving the business landscape catalyse a significant shift in the flow of assets from developed to emerging markets.

Best Strategy for 2021?

The search for the “best strategy” in Forex is eternal. Most new “traders”, even some of the most experienced spend their whole lives looking, unsuccessfully, either in forums, books, and seminars, for the superior strategy to all the others.

We think what you should know about “the best” strategy is this:

It doesn’t exist!

Not only is there a way to do that, but there are many ways. This applies to successful strategies or methods of trading currencies as well. The different negotiating styles used by professionals specializing in making money consistently in the market are countless; just as each individual has his own type of DNA. That makes a lot of sense, as trade numbers and indicators, oscillators, and concepts are infinite as well as how these can be combined. Therefore, long searches for perfection in the buying and selling of currency sooner or later lead to disappointment.

Have you ever heard the saying “the best attack is sometimes a good defense”? This is a great truth that applies not only in the legal field but also in the currency market. Even an excellent entry strategy (what would be the offense) becomes weak if it does not have a good exit plan (what would be the defense). All traders employing strategies such as Martingale (a strategy that continues to increase losing transactions, thereby anticipating a setback) or other flawed exit methodology that keeps large open losses waiting for the market to return, are doomed to failure.

The best strategy can quickly become the worst if traders’ minds are not attuned to success. You will have heard experts say over and over again: “Trading is mostly mental”, this is a universal truth based on the law of attraction (which has become a buzzword because of the movie “The Secret”).

In Conclusion… 

The search for “the best” strategy to trade on Forex is useless. Instead, the trader should focus on the above three points to maximize their success in buying and selling currency. The best Forex strategy is a personal decision for each trader, but we must always understand it perfectly and we must identify with it. It should be consistent with our resources, and, speaking of resources, it should be cost-effective. And most importantly, we should feel comfortable with the strategy.

It becomes obvious because it is important to practice on a demo account, the possibilities are many and the more options, the greater the indecision. When testing on demo accounts, it’s time for the truth, and that’s where we can find our best Forex strategy. In a demo account, we have total freedom to experiment and test with many different strategies. Then, we can circumvent any limiting aspect and make attempts with everything we desire. It is now that we can make mistakes, refine small details, polish what is needed, and learn as much as possible.

Categories
Forex Money Management

What Are SWAPS in Forex?

I see many people, even those who already invest in the foreign exchange market, who don’t know what forex swap is. Also known as swap points, swap commissions, or rollover on forex. Although it is true that it does not affect scalping or intraday operations, it is a charge to account when a position stays open overnight. A charge that can be both in your favor (you get paid) and against you (you get paid).

I’m a person who likes to always count all my expenses. That’s why I’m going to explain to you what a swap is, how it affects you, how you can benefit or hurt yourself, and most importantly, how a swap is calculated in forex.

What is the Swap?

There are those who call it currency rollover. Swap is the difference between the interest rates of two countries. It would therefore be correct to say that this is the difference between countries’ interest rates. However, since «currency pairs» are played on forex, it is best to say that the difference is between two countries. The two countries involved in a particular currency pair.

This annual interest must be paid on every operation we keep open from one day to the next and every day. And it exists because the interest rates to finance a country are not the same among them. We have areas with very low and even negative rates, such as the Euro area (EUR currency), Switzerland (div. CHF) or Japan (div. JPY), and higher ones, such as Russia (div. RUB). There are isolated cases of countries with huge interest rates, such as Argentina, which for example in 2019 had an interest rate of 50%.

Where Does the Swap Come From?

The difference in the central bank interest rate to which each currency corresponds. So that we can understand it, let us look at the example of the Australian Dollar (AUD) and the Swiss Franc (CHF). Among others, because the AUD/CHF pair is very interesting for trading.

Remember that the first currency of the currency crossing is the base currency, in this case, AUD. The second, is the quoted currency, in this case, CHF.

AUD is subject to an interest rate of 1.50%, and CHF has the rate at -1.25%. Its total spread is 1.50-(-1.25)=2.75%. This would be an interest in our favor if our position is bought. If, on the contrary, we sell, this interest must be paid.

If we take the crossing backward (CHF/AUD) we would have a difference of (-1’25)-1’50=-2’75%. So, in a purchased position, we would pay for that swap, and in case of a sale, we would receive it.

Remember that from the first currency if you buy it you receive its interest, and from the second when you detach it you pay. On the contrary, if you sell, from the first currency you pay the interest, and from the second you receive it. Interest rates tend to vary over time. There are very stable interest rates, to very unstable ones.

So far, you can see the logic behind the swap. If you take as reference the interest rates of the currencies involved in each crossing, you will see how in your broker you are paid or charged depending on the ones you have looked at.

The Swap/Rollover at the Broker

This is important. The broker does not express a percentage but does it in pips (for or against you). And besides, you’ll see that it’s not proportional, a long position is not the same as a short position. Shouldn’t it be the same? Yes, it is indeed. What happens in this case, is that the broker charges a commission on each and its liquidity providers. And it is understandable because it is your business and we benefit from your services.

In my case, my broker pays me for a long position (Swap Long) in AUD/CHF, 0’44 pips per day. Then, in case I opened a short position (Swap Short) I would pay -0’71 pips per day. If we did not charge a commission, we would see perhaps more accurate pip figures, such as 0.55 and -0’55 for example, depending on whether it was purchase or sale.

I explain. The first time I had any notion of the swap, my first impulse was to look for the currency that paid me the most pips to keep an open position. «I will leave my position open… Every day I will get more pips… And I will be the master of the universe». Don’t even think like that!

You can search for yourself how the quotes of these foreign exchange crossings have been with high long-term swaps. If you look for them, which I encourage you to do, you will see some graphics that are scary. Does that mean that we should forget about the swap? No, far from it! But it’s a double-edged sword, and I have to warn you. Interests don’t vary because they do, but that’s another story.

A swap can benefit you, or help you, without being a guarantee of total success, in making decisions for long-term forex trades.

How Do I Benefit from Swap Points?

I don’t like «complicating» my life. I start from a very simple base, I can’t anticipate the short term. For me, the short-term market is irrational. I don’t know what something will do in less than 1 month, and although I am suggested in forex by my way of investing in value, I do not flee this market, but I do not analyze it with more depth than I think it deserves.

There are those who can tell me: «Try this indicator», or, «Look, I have discovered that such a thing works and you can get a good monthly performance». No way, I tried a lot of things back in the day, and I wasn’t convinced by any of them. That’s why I use the swap to my advantage, only in trades I know I can have open for the long term.

To do this, I don’t buy large amounts, my forex investments are minimal but multiple. Looking for pairs without strong oscillations and that in case of having them can support them, and are in points that I consider, are favorable. Always analyzing, in the long term. And when I say long-term, I mean years and even decades.

Long term + Small multiple trades + Swap + Market oscillations = I have generated a satisfactory return. I could even say, on a regular basis.

How to Calculate Swaps

We imagine that we want to trade a purchase with the EUR/USD, and to make the numbers simple, let’s imagine that we buy a mini-lot, which is equivalent to 10,000 USD. Each pip, or what is the same, every 0’0001 EUR/USD quote, is equivalent to 1 $. U.S.A. interest rates tend to be higher than in the euro area.

Imagine this example, in the United States, for example, they are 2.25%, and in the Euro Zone 0% (As an example, I am not saying that these are now). When we buy EUR we will receive 0%, and as we part from USD we will pay 2.25%. This means we will pay 2.25% per year of 10.000$. Equivalent to $225. $225 a year, that’s $0.62 a day, which in pips would translate to -0.62 pips. Negative because in this case, that’s what we should pay. And adding, that the broker will add us commissions, can come up with a higher value of 0’9 or 1 pips.

In order for the pips/swap points to be in our favor, we would have to make a sale instead of a purchase, in this case. In case you use another currency pair, pips will always be paid for the quoted currency. Then just do the conversion to your currency, to know the exact amount you will receive.

Final Conclusions

We have seen that swaps are not a complicated issue, beyond the relevant calculation to know how it affects us. That can benefit us as well as hurt, depending on our decisions. And that is something to keep in mind, especially in long-term forex trading.

Categories
Forex Market

WARNING: The Economy Has Become a Zombie!

A year after the repo explosion, Cantillon Effect, Minsky Moment, the economy has become a zombie.

A year ago there was one of the greatest events of liquidity scarcity in history, for a moment the world economy was on the verge of collapsing fatally, forcing the Central Banks, especially the FED to print money in an accelerated manner, since the Eurodollar or reserve currency system, the dollar, had dried up and there was a demand for dollars above normal, everything was triggered by a shortage of liquidity, by excessive leverage of companies and Banks. 

This shortfall in liquidity caused enormous volatility in the US Treasury bond market, which acts as a basis and liquidity for the other markets, leading to real phases of extreme volatility in the equity markets. With extreme volatility and falling rates, all brought about by the Fed’s decision to reverse QE and the printing of currency the market was collapsing like a house of cards, this shows a fragility never before seen. This could prove that we are dealing with a zombie economy.

This was just the symptom that the economy is not going well and in fact still not going well, the virus is still the perfect excuse to lead the economy and societies to a new feudal system, where a transfer of wealth from the less affluent classes to an elite that uses the virus for social engineering experiments occurs, plus the greatest monetary experiment in history with record prints of paper money or credit money as I call fiat money, to impose a series of reforms leading to a less free and more docile society, in a new regime of semi-slavery.

And as we see to build a new world order you have to do a hard reset or a great reset, you can only get it by destroying the old system and that is why the Fed has kicked ahead and prints as if there was no tomorrow. And before the minimal reduction of its balance sheet the markets are staggering and staggering because we are; we were a year ago in Minsky with an economy in a Ponzi debtor state, which defines Minsky.

The Ponzi debtor, that before any fall will not be able to pay even the interest and this is the consequence that it is based almost mainly on the increase of the prices of the assets to continue refinancing the debt.

We have zombie companies that only survive if the stock price keeps going up, as they are still without liquidity. The Fed has to print so that the Ponzi scheme in which the world economy has become collapsed, thanks to the MMT and its idea that you can have deficits unlimited and that you can print without consequences when it is false. This is when we come across the Cantillion effect and how the economy is directed towards a feudal system.

It is precisely what describes the monetary speed, which is neither more nor less the times when money changes hands, and which has a very strong influence on the real economy, say when there is a collapse of the times when money changes hands, It is telling us directly that the real economy is freezing, and therefore inflation in the real economy is cooling, that is, apparent deflation. But when you print so much money, you get a drop in purchasing power, so you don’t directly have inflation from price hikes, you have inflation from currency devaluation, even if prices fall and technically there’s deflation, the reality that the value of credit currency falls faster than prices fall and we actually have an inflation rate for loss of purchasing value. This is what is known as the Cantillon effect.

As defined by Economipedia: The Cantillon effect explains the uneven effect that monetary policies can have on the economy. For example, if a central bank injects money into the economy, the resulting inflation (the price increase)  is not reflected uniformly. Richard Cantillon (1680-1734) became the first economist to assert that any change in the money supply distorts the structure of an economy.

This is because newly created money is not distributed simultaneously or uniformly throughout the population. The process of monetary expansion therefore involves a transfer of wealth. This basically means that those closest to the central banks take advantage of this new money and buy consumer goods or capital at a better price, that is, elites and governments. While the rest of us mortals are at a disadvantage because with less purchasing power and without access to that new credit we cannot acquire assets and when we can the asset prices have already skyrocketed, showing that the money supply is not neutral, is harmful, and produces a transfer of purchasing power from the less affluent to the wealthier classes, a reverse Robin Hood. A neo-feudal system or as they call it a new world order.

A new world order where puppet elites and governments do not allow the less affluent classes to enter the markets as they cause hyperinflation of shares, and a fall in the purchasing power of the less affluent classes, that the elites compensate by having before anyone access to the newly created credit currency. This means that the chances of the poorest people escaping are diminishing, we are facing a slave system. And it is not because of the (non-existent) free market, but because of ideas closer to the Marxism of the MMT.

And this is how the economy and the free market dies, it becomes a great Ponzi scheme, where a privileged few turn into a casino the world economy, full of zombie companies living on the cost of issuing new debt and stealing purchasing power from citizens. The Cantillon effect is the weapon that these elites use to maintain the status quo and that the great reset is the new neo-feudal system that they have prepared for us.

Categories
Forex Basics

Let’s Discuss the Ethics of the Modern Investor

I recently read in a forum an interesting debate about whether there are more speculators or citizens in the economic forums, that just by the way of putting it as if the speculators were not also citizens already makes clear certain prejudices that many people have… and this gives rise to a small article to clarify many prejudices, and also apparent contradictions and other very interesting topics.

Ethical Investments

This is a tremendously difficult concept to start with, as we each have our ethics, and I could consider as unethical investments companies like McDonald’s (unhealthy food), Mediaset (TV-trash) or Bankia (preferential and others), whereas for you it may be Inditex (for its factories in Asia) or Shell (pollution), and for another, it may be Uber (management more than doubtful) or Indra (armament)… and in the same way, several companies also have programs such as the university scholarships of Santander or programs to help children with autism of Inditex that are “the other side of the coin”, and that we can not forget when valuing ethically a company.

But even if we agree that a certain “X” company is morally reprehensible, should we avoid investing in unethical companies? As a general rule, NO.

Our money goes to the company itself only when it sells us the shares: when it goes public, or when it makes a capital increase. In these cases, it IS justified not to invest in unethical companies, so as not to finance things that are bad for society. But when you buy shares on the stock exchange, your money does not go to the company, but to another investor who sells them to you, and refusing to buy them will not put any pressure on the company to act properly.

And in fact, in general, I’m in favor of investing in unpleasant companies… let’s say you’re going to set up a business, what do you prefer, a bar, a funeral home or a children’s ballpark? Very few people prefer the funeral home, so it is to be expected that there is less competition and is, therefore, a more profitable business… don’t you think that more bars and ballparks close than funeral homes? Well… and for the same reason, as a disgruntled investor, I know it’s probably going to be more profitable to invest in oil than in renewables.

Does This Mean I Have No Ethics?

No, what it means is that I believe that wanting to make “ethical investments” is of no use, and it is also unprofitable. And since it will not serve to improve society to choose one stock or another, it would be foolish not to look for the most profitable!

However, we do have it in our hands to put pressure on companies to be socially responsible, but not as investors, but as consumers and customers of such companies. If I don’t like the brainwashing they do on certain TV networks, I don’t go through them zapping and I stay half an hour watching it and then in the bar I comment with colleagues everything they said there “although I don’t normally see it”, but I limit zapping to the ones I like or I put on movies or series… which will not prevent me from buying shares in that chain: the flies eat shit, and in Europe, the flies are not in danger of extinction! If I invest in it and others are giving them an audience, who is the culprit here that they emit garbage? It’s certainly not me…

What Comes First? Ethics or Investment?

We can focus the debate a little more with a very good question:

“Those of you who run banks, for example, would you approve the introduction of a bank fee for every empty floor they have on Balance?”

This starts from the premise that a tax on banks for empty flats is good for society and bad for the bank… and this is a very interesting issue because again people assume certain things that are worth thinking about before stating them simply:

It is good for society that banks rent or sell their empty flats: They would certainly lower the prices of both flats and rents; and I think this is good, in general, although those who have been saving to have a flat with whose rent to supplement retirement might not agree…

Harming the banks will not harm society: If, for example, there were talk of asking for compensation from the banks that issued preferential loans, I would agree that this would not harm society, but quite the contrary: the message is sent that the payer, And it keeps them from being tempted to rip off their clients again. But what we are talking about here is a measure that will make it more difficult to recover delinquent credit, just like “stop evictions” and so on… and if the bank has difficulty recovering delinquent credit, what will it do? For the same thing that anyone would do: 1.- give less credits, and 2.- give them more expensive, with what the average citizen will have much more difficult to have in property a decent housing. And frankly, I think that’s bad for society.

Applying penalties retroactively will not harm society: If something characterizes a banana republic is that where I said one thing now I say the other; in Argentina or Venezuela, this is our daily bread. In truly democratic and serious countries, when a standard has been set, it is, and so it must be, here too; creating instability by changing the rules of the game on the fly causes far greater harm than applying a bad rule. If we think it is good to penalize empty foreclosed flats, let us apply a tax, but let it apply to new mortgages that are given and not to old ones, and let us respect the law… or we will have a better law but it will be wet paper.

And after this huge detour, I go back to the essence of the question: I think that banning advertising for unhealthy foods would be good for society, and I would be glad that such a measure would apply even if I had shares in McDonald’s and Mediaset, who would be harmed by it. So I guess I count as a citizen…

Categories
Forex Economic Indicators

What Are Forex Boost/Impulse Indicators?

Impulse indicators measure the rate of change in closing prices and are used to detect weakness in trends and potential points of turn. Often not taken into account for their simplicity, but the importance of the boost in the forex market should not be overlooked. They can be a great way to make a profit by identifying a strong movement that is already underway.

In this lesson we will learn some valuable additional tips that will be useful when using impulse indicators: momentum trading can be as profitable as S/R trading (support and resistance).

What Are Impulse Indicators Used For?

Impulse indicators are useful to solve the following types of common traders dilemmas that S/R indicators cannot answer. For example:

A currency pair has broken past all previous S/R points and is making new historical highs or lows, so there are no S/R levels telling us if it is a good time to place or withdraw a position. Is it worth getting on the ride, or would it be better to get out of the way?

He didn’t place positions in time on a trend that’s been working for a while. How can you tell if there is still time to follow the trend? How can you reduce or eliminate the risk of buying at maximum or selling at the minimum? It could expect a setback, but while it waits, it risks losing even more of the movement. This is a natural human error, to assume that one is too late when in fact some of the safest benefits you can take on the market are at this time of apparent “over-buying”.

You have a winning operation open and want to keep it as long as possible, but you don’t want to risk staying too long and losing part of your winnings. Or it’s approaching the resistance and its intended point of exit. Do you take profits or leave part or all of the position in the hope of letting the profits run with a trailing stop?

If we look at what happened to gold from May 2009 to August 2011, from May 2009 to August 2011 it was making new historical highs and showed only 8 months down from a total of 27, rarely regressing to anything but very short-term levels of support.

Those who expected significant setbacks never saw them arrive and missed the biggest trend of the year, while gold consistently reached new historical highs. Expecting a setback in the upward trend here was not a good idea!

We, traders and investors, earn our living by correctly predicting what will happen in the future, even though we don’t have to be exactly right to make money – we just have to be roughly right. However, the S/R indicators we have covered so far tell us about what happened in the past. While that’s helpful in predicting the future price action, S/R indicators can only tell us about the strength of S/R levels. The other half of the image is lost as they cannot tell us if a trend is strong enough to break beyond a certain level of S/R. In addition, cannot tell us anything about future price movements when a currency pair or other assets have broken beyond all levels of S/R to new historical highs or lows. Fortunately, there is a way around this, apparently, very difficult problem.

What should traders do? Employ a style of impulse trading using impulse indicators.

The Advantages of Impulse Indicators

These indicators can give us a better idea of future price movements because:

  • Show whether a trend is strengthening or weakening.
  • They can tell you if an asset is overbought or oversold according to the price range for a certain prior period.

That helps us decide whether the trend is likely to continue or change direction. Knowing this can help us predict changes and have greater profitability. In short, impulse trading with impulse indicators can offer additional clues to assess the odds of hitting even more in your favor.

There are many indicators of momentum, but at the moment we will present you with only a few of the most effective and easiest to use indicators:

  • Double Bollinger Bands.
  • Mobile Stocking Crosses (MA).
  • Three types of basic oscillators: Convergence/Divergence of Moving Mean (MACD), Relative Force Index (RSI), and Stochastics.

Why the Gold Chart? Brief Introduction to Market Relations

Are you wondering why we use a gold chart in a foreign exchange article? The reason for this is that, for a number of reasons, currencies and raw materials are often related to each other and are therefore sometimes traded as substitutes for each other.

For example, because Canada is a major oil producer, the DAC often moves with the price of oil. Under certain conditions, it’s more sensible to negotiate a DAC currency pair than oil and vice versa.

Although different types of goods, such as stocks, commodities, and currencies have some notable differences in their behaviour – for example, Forex currency pairs tend to fluctuate in value in relatively small amounts compared to commodities, that tend to be more volatile – can illustrate truths about successful trading methods by using them all interchangeably.

Gold is a special case because it is considered the main hedge against currency devaluation. When investors are concerned about the decline in the value of one of the most widely held currencies (especially the USD and the EUR), gold can rise.

Therefore, at a time when the fundamentals for both the EUR and the USD are not good, but it is not clear whether to go long or short with the USD, the traders play it safe and just have to go long with the gold. We will see that happen at a time when there is a great deal of anxiety about the stability of large parts of the global financial system. For example, gold has tended to rise during episodes of great concern over the EU’s sovereign and bank debt crisis. At times like these, traders often buy gold en masse because:

  • It seems that the EUR might not even survive.
  • The Fed may be printing massive dollars in order to help Europe and steer the US economy away from the possible consequences of an economic crisis in the EU.

In fact, if you compare a timeline of the EU crisis and a weekly gold chart covering those years, you will notice that gold often rose to new highs. Later we will cover this and other relationships between markets and know how to use them.

How Do Impulse Indicators Work?

As its name indicates, the impulse indicators focus on the price exchange rate, that is, if the price goes up or down by more than it used to. While exact mathematical calculations and emphasis vary between different impulse indicators, they all attempt to provide some perspective on:

  • If the price is changing at a faster or slower pace
  • If the exchange rate indicates the strength or weakness of the trend

For example:

  • A steady increase in the speed at which price goes up or down suggests trend strength
  • However, too rapid acceleration is often interpreted as a sign of “trend exhaustion” or a maximum turn (or minimum turn in bearish trends) suggesting a final drastic increase in optimism (or pessimism in bearish tendencies) that drains the remaining buyers (or sellers in the downward trends) and prepares the end of a trend and turn of it.

When this happens, you will hear analysts saying that the pair is:

  • “Overdrawn”, if the price has gone up too fast or for too long, and therefore is expected to turn and start to fall.
  • “Overwritten” if the price has fallen too fast or for too long, so it is expected to rise.

It is important to be careful, however, because sometimes these terms are used too easily. ” Over-buying” and “over-buying” are sometimes used when the price has just gone up or down a lot, when it is really the speed with which the movement has occurred that is the crucial factor.

Categories
Forex Risk Management

A Risk Management Model to Forecast the Margin Level

Margin call and Stop Out are some of the trading conditions that are infallibly indicated in the trading account conditions. Margin call is a warning sign, which the broker sends to the trader to deposit new funds into the account when losses on open transactions have approached a critical level. If the trader does not make a new deposit into his account and the losses continue to increase, the broker may affect a forced closure of the trader’s transactions.

Stop out is a notice of auto-close of transactions, which occurs when there is an insufficient margin level to keep account positions open. Brokers indicate in their agreements the percentage of this level, which may be different in each case.

Control of the margin level is one of the essential rules of risk management. In order to make this process very optimal, professional traders often create models, which allow estimating the level of the minimum margin required with specified leverage and volume of transactions. For more information on how to create models, how to calculate the margin level, and how to manage leverage, read this article.

Margin Call and Stop Out: Concepts and Calculation Rules

Terminology is the first thing the trader has to study before testing his strengths in Fórex. Without it, it is impossible both successful trade and collaboration with your broker. For some reason, in most cases, beginners believe that it is enough to download a strategy from the Internet, follow the recommendation point by point in the demo account to be able to start earning “a goose paste”.

Boxes such as “I have read and accept the terms” are automatically marked. It is that the merchants ignore the concept “offer”, where they have described all the conditions of the trade in mole type of accounts. In the end, this can lead to losses and disputes between the trader and the broker. Today, you will know two important concepts, Margin call and Stop out, whose parameters brokers always indicate in the commercial terms of each account.

In this article I will explain:

  • What are Margin call (margin call) and Stop out with practical examples (already defined above).
  • How to create a model to control the required minimum margin level and how to apply it in trading.
  • How to avoid stop-out (forced closure of open positions).
  • Stop Out and Margin Call: how not to run out of deposit at an inconvenient time.

This story happened on December 30, 2015, when miracles occur and one can ask for new magical desires. On that day Denís Grómov, a private merchant, also expected miracles. If we want to explain otherwise it would be impossible how in just 4 and a half hours and with the deposit of 5.6 million roubles (approximately € 64,400) he made more than 5,000 transactions of purchase and sale of currency for a total value of 42 billion roubles (about € 483,000). Later the 38-year-old merchant will say that he did not understand what happened. It’s just that the price of the dollar was growing and winning on the stock market was the best option if you looked at it from the point of view of spending on the margin. The result was sad: having lost all his deposit, the trader was left in debt to the broker and now owes him 9.5 billion roubles (about 110,000 euros).

The trader operated with a specific asset USDRUB_TOM, whose exchange rate today is set as the official tomorrow by the Central Bank of Russia (TOM – tomorrow). Grómov noted that compared to USDRUB_TOD (today) the US currency cost a little more. In 38 minutes he made more than 2,500 operations buying the US currency with the official rate for today (today) and selling it with the official rate for tomorrow (tomorrow). As it seemed to Gromov, the deposit was insufficient, so he applied the broker’s leverage. The general purchase/sale position of the asset did not exceed the margin requirement (the sum of the deposit retained by the broker as a guarantee for the opening of commercial operations), but at that time the volume of operations was already about 23.7 billion roubles (about € 2,724,000).

At that time he was called the manager of the broker, warned him of so-called “margin call” and proposed “reducing leverage (borrowed funds) by opening up opposite positions”. The trader’s mistake was simple: he did not take into account the price for arbitration (carrying out complementary transactions at the same time in the price difference between different markets on the same financial asset). Any leverage increases the volume of the transaction for which an interest charge (swap) is charged when a trading day is terminated for keeping the transaction open for more than one day. The operations with the asset USDRUB_TOD were executed on December 31 while the operations with the USDRUB_TOM, only on January 11. For all those days a swap was charged from the merchant’s account, which was larger than his deposit. This was what the broker manager told the unfortunate trader, who had only to close the open-to-loss transactions.

The merchant tried to solve the problem through the court, but without success. However, this story serves as a compelling example of how relevant it is to know the terms “margin call”, “stop out” and “swap”.

What are Margin and Margin Call Operations?

Margin operations are leveraged or leveraged operations offered by the broker. The margin allows opening positions for a total amount of ten, one hundred, and even one thousand times larger than that of the entire merchant deposit on condition that this amount is returned.

Each broker has its own leverage: 1:1 (the broker does not have it); 1:10 (the trader can open trades with a volume ten times larger than his deposit), 1:100, and even 1:2000. According to the recommendations of European regulators, before the permitted minimum limit of leverage was 1:200 and now, from 1:50 with the prospect of decline to 1:30, although this does not stop offshore licensed brokers. Therefore there is still leverage of 1:1000 and even 1:2000.

No one from the company representatives will tell you where the broker gets so-called leverage, on the pretext that they protect trade secrets.

There may be several options:

Aid to liquidity providers. Liquidity providers are investment banks whose liquidity depends on the deposit of investors through which the merchant’s deposit can be increased. Although there is one question: what do liquidity providers gain? Perhaps, brokers share the spread with them. But if, in fact, it’s so obvious, what is the reason why providers hide the leverage mechanism?

Technical multiplier. Regardless of the leverage offered the trade is done with merchant funds. The merchant, who buys a currency, will sooner or later sell it to regain balance. Broker leverage is only a digital instrument that is offset in opposite trades. The total volume of transactions with this type of digital instrument is much larger than the amount of the real currency in the broker’s accounts. But the system maintains the balance since after each purchase transaction there is a sale transaction and vice versa. If one merchant wins, the other loses.

Broker – “kitchen”. The manipulation of figures is carried out within the same company. The aim of the broker is to offer the trader the largest leveling so that he can lose his funds as quickly as possible.

In theory, they very often say that leveraged transactions are “a virtual loan with a deposit guarantee from the trader” or “bilateral transactions in which the trader who bought the asset with borrowed money is forced to sell it later”. Actually, it’s not entirely true. In any credit transaction, the lender also runs the risk of not getting the loan back. In margin transactions, the broker does not assume this risk.

Leverage Examples

No leverage – The trader has $1000, of which $600 wants to invest in oil. Oil volatility is small: – 0.1-0.3% per day. Suppose the trader performs intraday trade and in the oil market, a force majeure is produced and, as a result, instantly the oil price drops by 5%, that is, from $ 60 to $ 57 per barrel. If the merchant has opened a long position with his $ 600, the losses will be 600*0.05=$ 30. The deposit of $1000 is a small amount.

With leverage – Suppose the trader is confident that oil prices will rise and makes the decision to apply the 1:1000 leverage. The broker retains $600 of your deposit as collateral and $400 of the free margin (uncommitted balance) will serve as insurance. Thus, the trader opens a position worth 600*100 = $60,000. Force majeure spoils the investor’s plans and the loss of $30 becomes $3000. The merchant does not have this money in his account, so all his transactions will be closed by force before oil prices drop to the level of $57. It is easy to calculate that the guarantee of $ 600 with the indicated leverage is able to withstand just a 1% decrease in price ($ 0.60), the unencumbered balance ($ 400) – $ 0.40 more.

Margin Call (margin call) is a situation in which the broker informs the trader of the need to deposit new funds into the account in the event of a reduction of the sum below the established level. It is a kind of warning that the merchant’s deposit under the current conditions will soon end.

Stop Out is a forced closure of the trader’s open transactions at the current market price when the proportion of the deposit amount and the current loss to the amount of the guarantee for the positions opened at this time (margin level) is lower than the corridor has established. Open operations are closed one after the other until the free margin exceeds the established limit.

Example: The runner places the margin call in Fórex at the level of 20% and the stop out, at 10%. The merchant deposits $300 and applies the leverage of 1:100 by opening a deal worth $20,000. The amount of own funds needed to open this type of operation is 1/100 out of 20,000, or $200. The 20% of the guarantee amount is $40 and 10% is $20. Then when the trader loss is $260 a warning signal will be sent; when the trader’s account drops to $20, the forced closure of open trades will be generated.

Important! By setting limits on maximum leverage, European regulators are struggling not with brokers, but with the psychology of traders. The size of the leverage on Fórex carries no risk. Since there is no difference if the merchant with a deposit of $ 300 will open a position with leverage of 1:100 (the guarantee is $ 200) or with leverage of 1:200 (the guarantee of $ 100). It will continue to operate with available funds of $300. The volume of the position matters! If in this case, the volume is the target ($20,000), then in practice the emotions push operators to open large volume operations with greater leverage, which can lead to losses.

On the MT4 platform, the data on available funds and the margin level are indicated in the menu below in the “Trade” tab.

Specific Terms

Deposit is the amount of funds deposited into the trading account.

Balance is the amount of funds of the merchant at the present time, which remains in the account after the transactions have been executed. It is equal to the current adjusted profit or loss balance. If the amount of loss on unprofitable open transactions exceeds the profit on profitable transactions, in this column the figure will be less than the amount of loss. For example, the deposit is $100. One of the two trades was profitable and reported a gain of $32. The second operation has been closed to losses: $ 43. 100+32-43=89.

Margin (also known as “guarantee”) is a short-term loan service provided by the broker while his position is open. If the merchant buys the euro for a value of $10,000 and with leverage of 1:100, the loan will be $100.

Free margin is the capital not involved in the trade that the trader can use at his discretion. It is calculated as “balance”-“margin”.

Margin level serves as the indicator that reflects the account balance and is expressed as a percentage. For the trader, you will have something to look at. If its value falls below the stop out set by the broker, the closing of operations begins. The following formula will help us to do the calculation: “Funds”/”Margin” * 100%.

Example: The merchant deposits $100 into the account and is about to open a position with a volume of 0.01 lots at the price of 1.4500 with the leverage of 1:100. 1 lot is 100,000 units of a conditional currency, therefore, to buy 0.01 lots you need $14.5. (Total: $1,450). “Deposit”: $100. “Balance”: before the opening of operations is also $ 100. “Margin”: $ 14.5. “Free margin”: $ 85.5. “Margin level”: (100/14.5)*100 = 689%.

How to Calculate the Approximate Margin Level?

Any theory is necessary not only to be able to apply it in practice but also to be able to make forecasts with your help. The risk management system shall involve the development of several risk management models that allow current amendments to the table in a matter of minutes according to the market situation, and to see how the future outcome changes.

The management of the level of deposit allows to foresee in which quotes of the pair with the established volume of a lot can occur the stop out in Fórex. With averaged volatility data, an individual strategy can be created to increase (decrease) the volume of positions according to the rate of change in price and the level of leverage.

Peculiarities of Margin Operations in Forex

Unlike other types of loans, the merchant does not pay a percentage for the use of the loan on a regular basis. Any broker has swap, a commission that is charged for keeping a position open at the end of the day. The swap is charged against all open positions, including those in which the loan funds are involved, and deducted from the trader’s own funds, thus accelerating the reduction of the balance.

In most cases, margin operations are short-term. The trader takes advantage of leverage only when he is completely confident that the trend will not change. After making a profit from short-term positions, the trader again operates on their own funds only. In most cases the trader will not lose more than what he has deposited in his trading account, that is, the account balance will not be negative.

A clarification on the last point. The broker who lends his money for one day is not at risk, as in the event of a sudden price reversal he will have time to automatically close all the trader’s transactions. The situation is different if the transactions are transferred to the next day or in the case of serious force majeure.

Example: In mid-January 2015, the Swiss Central Bank allowed its national currency to fluctuate. In one night the franc shot up against the dollar and the euro at 30%.

That decision was unexpected to many. On the first day, due to the existence of high volatility trading conditions were amended: some suspended operations, some changed the margin requirement. Almost all brokers suffered losses on the illiquid market, and the British department of Alpari (UK) even went bankrupt, whose official version is that. “due to the volatility the company lacked liquidity. The losses of the clients exceeded the funds deposited, and the broker was forced to reward them on his own”. It’s a perfect example of how the exception confirms the rule.

How to Avoid Margin Call and Stop Out?

  1. Read the offer where the trading conditions of each trading account are indicated in detail.
  2. Comply with comprehensive risk management standards. The theory is that the sum of simultaneously opened positions should not exceed 10% (rarely 15%) of the deposit amount.
  3. Use the example of the table given in the article.
  4. Be cautious when using leverage. Set a target in the volume of positions and do not try to open the maximum position possible.
  5. Estimate the share of leverage and volatility. The higher the volatility, the lower the leverage in margin operations.
  6. Set the stops.

Conclusion

You should not be afraid of leverage, any instrument in the hands of professionals is capable of delivering benefits. Leverage is the individual choice of each, so in this article, I do not give a uniform recommendation applicable to all traders. Strict observation of risk management and control of unprofitable positions is one of the most effective methods of avoiding stop-out.

Categories
Beginners Forex Education Forex Basics

Why We Love Forex Trading (And Think You Should, Too!)

Forex and trading are becoming an ever-popular activity. For many, it is just about making a little extra money on the side, while for others, it is about the enjoyment that they get out of it. There are a lot of ups and downs when it comes to trading, but overall, those that trade it for a hobby seem to love it. There are plenty of reasons to love it too, from the ups, the profits, the thrills, and more, so we are going to be going through some of the reasons why we love trading and the reasons why you probably will too.

The Incredible Highs

For many people, anything to do with money can give you some serious highs when you win. This is exactly the same when it comes to Forex. When you are winning, or on a winning streak, you feel like you’re on top of the world, you feel like you are on cloud nine and pretty much everything is great. If You have been trading forex for a long time, you will have experienced this a number of times, there isn’t a feeling like it and that is one of the reasons why we love it so much, that feeling is created by something that you have done, which makes it all the better.

The Adrenaline

There are many things in life that can fill us with adrenaline. When we are in charge of our money, and that money is actually doing something, that is one of those situations. When you see the markets moving up and down and your balance moving with it, you will gain a huge boost of adrenaline. This is true for when the markets are going both up and down, you want to win, you don’t want to lose. Whichever way it is moving, it will be playing with your emotions and filling you with adrenaline. It is basically what keeps bringing us back. There are, of course, some traders that are more methodical. They don’t get the emotions that the majority of us do. Instead, they are there simply for the money, but the majority, when things are going really well or really badly, will be filled with this emotion and the feeling of adrenaline going through their veins.

The Money

Let’s be completely honest, we are only trading because we can make some extra money, and the majority of other people are in the same boat. In fact, we have not yet met a single trader that is not taking part in trading for anything other than the money that can be made. Each month we withdraw a little bit of money that we can use to help us live a better life, to pay off debts, or to simply be a little better off. If the money was not there and you did not get any benefit, we certainly would not be trading. So we love trading for the simple fact that it allows us to make a bit of extra money each month.

You Don’t Need A Lot to Start

When I first started out with my trading, we started with about $100, which was great. It meant that we didn’t need to break the bank in order to start our trading journey, this made it very accessible for us. These days you can start with even less, some going as low as $10 or even $1. Of course, you will find it hard to be profitable with such a small amount, but it just shows that anyone can get started as you do not need thousands in order to join in. That is such a great thing for forex when you compare it to other things like stocks where you need a lot more in order to make any sort of decent money.

It’s Highly Accessible

Trading forex can be done from pretty much anywhere. We use our desktop computers, our laptops, and even our mobile phones to do it. The fact that you can use pretty much any platform that you want to access your accounts and the markets means that no matter where we are, we will be able to trade and potentially make money. It also means that far more people can get involved, many do not have a computer or a laptop, but they do have a mobile phone that is compatible with the trading platforms, meaning that they can now trade. A few years back when these platforms were not as easily accessible and so many people just couldn’t trade, that is simply not the fact now and those that missed out can quite easily get involved.

You Can Do It From Home

Normally, when we want to make a little bit of extra money, it will mean that you need to go out and get a second job, and you need to leave the house to do it. This is thankfully not the case with trading forex, you can do that from home, from in your underwear with no need to leave the house at all. This means that there is no commuting, no traffic, no other people annoying you on the way to work.

There Is No Boss

When we trade, we trade for ourselves, we are in charge of what we are doing and there is no one to tell us what to do. We have no boss, something that so many people strive for and something that a lot of people get into trading for. It will take a while to get to this stage, you need to be consistently profitable before you even think about leaving your job, but once you do, you will have all the freedom to trade when you want rather than when you are told to, freedom to choose.

Helps Us Manage Our Risks

When it comes to money, a lot of people are worried about losing it, this is why we use so much risk management when we trade and for good reasons too. The good thing is, that the cautious approach that we put into our trading we can take out into the real world too. Looking at more information before investing any money, before making decisions that will affect our lives. It helps us to better analyse the decisions that we are going to be taking.

It’s Always Changing

The forex markets are always changing, and due to that, we are very rarely bored. There are, of course, slow times when the markets are not really doing anything and our strategy is not relevant, those are times to take breaks. The rest of the time it is always evolving, due to this there are always things for us to do and for that reason, we simply do not get bored with it. We can always develop our own knowledge, we can always try and trade something else, either way, we are simply not bored by the forex and trading markets.

Those are some of the reasons why we simply love trading and the forex markets. It gives us so much freedom, teaches us a lot, and allows us to take part in it pretty much anywhere in the world. There is nothing quite like it, we love it and we are sure that you most likely will too.

Categories
Beginners Forex Education Forex Basics

The Most Pervasive Problems in Forex (#2 Might Surprise You)

From the outside, trading and forex look like a pretty green field, full of people getting rich, and everything going really well. When we delve deeper into it though and actually start trading ourselves, we find that there are a number of different problems, problems that a lot of traders experience on a daily basis, problems that pretty much every trader goes through. These problems are easy to get into and easy to fall into their pitfalls, but there are ways to avoid them or to at least reduce the effects that they have on your trading and your accounts. Today we are going to be looking at some of the most common problems that many traders go through.

1) A Lack of Training

Anyone that trades without knowledge and experience can easily blow an account, or even multiple accounts if they do not learn from their experiences. Trading without the required knowledge and without any idea of what it is that you are doing is a recipe for disaster, yet it is something that a lot of people do and will continue to do so. When we trade without proper learning we are pretty much just guessing at what the markets may do. In fact, it could even be compared to simple gambling.

If you are planning on trading, then you need to put in the time and effort that it takes to learn the basics. Learn about different strategies, learn about risk management, and learn about how the markets move and are affected by things like the news. If you do these basic things, you will have a much better understanding of what it is that you are doing which will help you to develop a  better trading ability and also to keep your accounts and capital safe from silly mistakes of simply not knowing what you are doing.

2) Using Emotions

We all have emotions. They are powerful things, they can make us happy, sad, or even do stupid things, and when we trade without our motions we are often doing just that, stupid things. Two of the most powerful yet damaging emotions that we can have when trading are greed and overconfidence. They often come from different events, greed when we lose and overconfidence when we profit. They both, however, have the same effect on us, as they cause us to throw out our trading strategies and our risk management and then they cause us to place trades that we know we shouldn’t. Either too large for our account or without doing the proper analysis, this can lead to larger losses or even a completely blown account.

If we get to a point where we can feel our emotions coming up or even getting the better of us, it is important that we do something about it. It can be as simple as walking away, taking a step back from your trading terminal, and going out, having something to eat, just doing something that has nothing to do with trading at all. This is the best way to clear your mind. You could even try talking to someone about it, often we can get more rational by talking to someone else rather than just thinking about it ourselves. Once you have cleared your mind you will come back refreshed, with a clear view of what is going on, allowing you to better follow your plans and to place much better trades again.

3) News Events

News events happen. There are calendars out there that will tell you what news events are coming up as well as the potential impact that they could have on the markets and which currencies it may affect. What they do not tell you though, is about the sneaky news events that are not on there. They come out of the blue, maybe something has just been developed or announced or there is a natural disaster somewhere in the world. These sorts of events cannot be predicted, they cannot be on any calendar and when they do happen, they often cause the markets to jump about in very unpredictable ways. They can be a real pain, as you could have just done a lot of analysis, put on the perfect trade, and then BANG, an unknown news event comes out and the markets fly in the wrong direction. We have all experienced it and most traders will in the future too, there is nothing we can do about it but to manage the trades that are affected.

4) Unpredictable Results

We mentioned the news events just above, but there is another side to them, even the news events on the economic calendars can play with us. If there is a positive result then the expected movement in the markets would be up. However, there are times when the markets just do not see to follow what the results would expect. Even things like the Non-Farms Payroll news events, which is historically one of the ones that can influence the markets the most can go a bit funny. There have been times where it is very positive, yet the markets moved down. For those following the news, a buy would have been placed but then the markets went down which would cause a loss as well as a lot of confusion, so the markets simply cannot be predicted even when all the indicators are there.

5) Dodgy Brokers

Unfortunately, when it comes to money, any form of money, there will be people out there that will do what they can to get as much money out of you as they can. From the outside they look like any other broker, offering some great features and trading conditions, but once you have deposited your money, it is very unlikely that you will be able to take any of it out. They will take it and even try and convince you to put more in, either way, your money will be gone. You can try and avoid this happening to you by checking reviews, going for the bigger named brokers, or by using brokers that you know people who already use them and have successfully withdrawn money from them. Choosing the right broker is important, so make sure you take your time to choose the right one for you.

Those are just some of the issues that many traders experience. In fact, many of them every single trader will experience at one point or another in their trading career. We can do what we can to try and reduce the effects that they are going to have on us and our accounts, but for many of them they are out of cour control and we will experience them at one point or another. There are of course a lot of other problems out there, but with every single problem, there will be solutions, or at least a way of reducing the impact that they are having on our trades and accounts.

Categories
Forex Basics

Tips For Keeping A Truly Helpful Forex Trading Journal

This is being written with the assumption you have looked into forex trading before, and in doing so have come across the term ‘trading journal’ previously. There is no way that you wouldn’t have because any website that you go to that is related to FX trading would have told you to get one, and to get one right from the start. That is just how important these diaries of sorts actually are. 

They may have told you to ensure that you have one, but they may not have actually explained to you what a trading journal actually is or what the best practices are when keeping one. So that is what we are going to do now. We are going to look at the purpose of the journal, reasons why you should keep one, and then a few tips to help you keep one properly to ensure that you have included all the important bits of information that could help you improve and analyse yourself as a trader.

What Is a Trading Journal? 

What exactly is a trading journal? A trading journal is basically what it sounds like, it is something where you are writing down everything that you are doing. It is full of your trading activities. You can then use it to learn quite a bit about how you are trading, the things that you are doing right, the things that you are doing wrong, what you need to work on and how you can make your strategies better.

Many people feel that there is actually no need for a trading journal, yet 99% of all successful traders will certainly have one in one form or another. The main point behind having a journal is the idea that you are never perfect, there is always room for improvement within all aspects of your trading. If you do not feel that you can still improve, then a journal will not help you, but you will also stagnate in your trading results. Keeping a journal can be one of the best and most beneficial decisions you can make as a trader.

The first reason to keep trading journals is that it will help you to find the trading style that suits you the most. When first starting out you are probably not aware of the majority of trading styles, you most likely would have seen one or two, or seen multiple different ones but not recognised them as different trading styles. It is a good idea to try out each one, but simply trying them will not really help you, unless of course, you are keeping a journal.

There are a few different things to think about. Try to jot down the reason you entered the market, the time you entered it, the price at which you entered it, how long you held the position open, the reason you exited the market, and how much you made or lost. With just those bits of information, you will be able to work out which style of trading you are naturally accustomed to. If you hold trades for days or weeks, then maybe swing trading is right for you. If you hold them for an hour and take small profits, then scalping may be the style for you. Include as much information that is right for you, at this stage we are trying to work out the right style for you.

The trading journal can be used to find your trading style, it can also be used to help improve the style that you are currently using. You need to remember that trading and learning to trade is a never ending process, you will never know everything, even the most successful traders are still learning new things, they are still keeping their journal as it is that journal that lets them know what it is that they need to learn next or that they are slacking behind in. One of the things that a trading journal is best at is letting you know exactly how consistent you are. It will tell you whether you are following your rules, whether you are entering and exiting the markets at the right times in line with the style that you are using. 

Having said that, even if you are keeping a trading journal, it will be completely useless if you are not analysing it properly. Set yourself a bit of time out from trading where you can properly go over the journal. Do this at least once a month, as this timeframe seems to work for a lot of traders. Many traders find it beneficial to put their trades into a spreadsheet, this way you can easily see the similarities between those trades that have been successful and those that have not been.

The trading journal is there to let you know whether your strategy is working, which parts are and which parts are not. By looking through your results, you are able to see which variables within our trading are causing you issues, they may even be habits. These are the things that you can then work on getting rid of and you can also see the variables that are working well, allowing you to enhance them further. If you are not tracking your trades with a trading journal, you will have no idea what it is that you are doing well or not well. You won’t even be able to work out your overall pips and profit and losses. It will also help you to hone your risk management.

So we now know how to use the journal and what it is that we are looking for when using it, but simply having one is not always enough, so we are going to be looking at some tips that you can use when creating your journal, different things that you should be doing to ensure that your journal will actually help you and that you are putting in the right sort of information.

Be Honest

It’s human nature to try and make yourself look as good as possible, but you need to remember that the only person that is going to be seeing your trading journal is you. So you need to be honest when putting your data in, this is the only way that it is going to be at all beneficial to you. What this means is that you need to ensure that you are recording your data completely accurately, down to the pip, do not fool yourself by making it look like you did better than you did. Having said that, you should also not underestimate what you are doing or what you have achieved, you may actually be doing slightly better than you think. By being honest, it is the only way that you can actually be sure of what you are doing well and what you need to work on. Don’t forget that it is not only about the numbers, you also need to be looking at the reasons behind your trades, both entering and exiting them. Each trader is different which is why you need to be honest with yourself, as you will certainly need to improve on aspects that others do not and vise versa.

Don’t Worry If You Miss and Entry

You won’t always remember to use your journal. There will be times when you are so excited to trade or simply do not have time, so there will be times that you forget to use it entirely. Don’t punish yourself simply because you forgot it, it happens to everyone at one point or another. Just try to move on and try to remind yourself to use it next time. If you do forget, there is still some information that you can jot down, things like the entry and exit prices. Of course, the info won’t be as accurate as doing it at the time, but it will still be better than simply having a blank trade. Whatever you do, do not consider leaving the journal entirely simply because you forgot to put in a trade or two, you still need the journal if you want to carry on improving.

Track Your Emotions

Emotions are a huge thing when it comes to trading and they can actually make and break a strategy in certain situations. Many people though do not feel the need to record them, but they actually have quite a large role in how successful you will become. Knowing whether you are successful or not during different motions could help you to decide in the future when to trade or not. If when you are feeling a bit down you constantly lose trades, then try not to trade in the future when feeling that same way. The same goes for when you are successful. Try and trade more during times when you feel the same way.

Remember to Analyse the Markets

Most people when filling in their journal will only put down what it is that they have done and the decisions that they have made. The markets sometimes behave in quite strange ways, you may have done everything exactly right but then the markets decide to go a little crazy. This isn’t your fault, but your journal will make it look like you did something wrong, so be sure to jot down when it is the markets behaving badly rather than yourself. This would also mean including any important or major events that could have caused the markets to move, things like political speeches or natural disasters should be included within your journal.

So those are some of the hints that should help you complete your journal. It seems like a lot of work, and when you are just starting out it will be, but you will get used to doing it, it will end up taking seconds to fill out instead of minutes. Get used to making one, get used to analysis and referring back to it and it will make your trading journey a much smoother and a much more successful one.

Categories
Forex Course

199. Effects Of Gold On AUD/USD & USD/CHF Currency Pairs

Introduction

Gold is among the most traded commodities globally due to the good intrinsic value of this asset. Considering that Gold is less impacted by uncertain conditions, its prices rise when other economies perform badly and fall when there is an economic boom.

Gold impacts AUD/USD and USD/CHF in opposite manners. Price fluctuations in Gold primarily impact three major currencies that include AUD, USD, and CHF. Let’s discuss how Gold affects AUD/USD and USD/CHF.

The Effect of Gold in AUD/USD

When the price of gold rises, the AUD/USD will move upwards. These two aspects share a positive correlation; most of the time, they move together. An increase in the U.S. dollar generally contributes to the gold prices to fall and vice versa. The price of Gold perfectly depicts the economic health of the country.

During an economic crisis in the country, investors purchase Gold as protection from inflation or an economic crisis. But the inner value of the Gold does not change whether or not there is a crisis. Furthermore, gold value is displayed in the dollar, meaning every gold transaction, you spend/receive a dollar.

Australia’s Economy and its Impact on Gold Prices

AUD and Gold share a positive relationship and are inversely related to the USD. If the gold price rises, the Australian exports will increase, resulting in the expansion of the economy and foreign investment. When the gold price increases, the AUD/USD will move upwards because of the increasing demand for the AUD.

Impact on the USD/CHF

The Switzerland currency holds a positive correlation with Gold. This is because 25% of CHF is supported by the gold reserves. The refineries in Switzerland also process 70% unrefined gold every year. Additionally, Gold and CHF are inflation hedging during uncertain times.

Therefore, when the price of gold increases, the CHF value also appreciates or increases, vice-versa. Gold has a positive relationship with CHF and an inverse relationship with USD/CHF. When the price of gold rises, the value of USD/CHF falls down and vice-versa.

[wp_quiz id=”97481″]
Categories
Forex Fundamental Analysis

EUR/AUD Global Macro Analysis – Part 3

EUR/AUD Exogenous Analysis

  • The EU and Australia Current Account to GDP differential

The current account to GDP shows the percentage of a country’s international trade that makes up the GDP. Countries with higher current account surplus have a higher current account to GDP ratio while those running deficits have a negative current account to GDP ratio.

In this case, if the GDP differential is positive, it means that the exchange rate for the EUR/AUD pair will increase. But if the differential is negative, then the exchange rate for the pair will drop.

In 2020, the current account to GDP ratio in the EU is expected to hit 3.4% and -1.5% in Australia. Thus, the current account to GDP differential is 4.9%. We assign a score of 3.

Typically, investors put their money into financial instruments that offer higher interest rates. Therefore, the country with a higher interest rate should be expected to have more inflow of funds than that with a lower interest rate. Note that when foreign investors invest in the local economy, they have to convert their money into the domestic currency. This conversion increases the demand for the domestic currency in the forex market hence increasing its value.

In forex trading, if the EUR/AUD pair has a positive interest rate differential, it means that the exchange rate of the pair will increase. Conversely, a negative interest rate differential implies that the pair has a bearish outlook.

In 2020, the Reserve Bank of Australia cut the cash rate from 0.75% to 0.1%, while the ECB has maintained interest rates at 0%. Therefore, the interest rate differential for the EUR/AUD pair is -0.1%. We assign a score of -3.

  • The EU and Australia Growth Rate differential

In any economy, the value of the domestic currency is mostly determined by the growth of the local economy. Therefore, a country whose economy is growing faster will see its domestic currency appreciate faster.

If the growth rate differential is negative for the EUR/AUD pair, we can expect a bearish outlook. If it is positive, it implies that the exchange rate for the pair will rise.

For the first three quarters of 2020, the Australian economy contracted by 4% and the EU economy by 2.9%. The GDP growth differential is 1.1%. We assign a score of 2.

Conclusion

The EUR/AUD exogenous factors have a score of 2. If the conditions observed in the exogenous factors persist, we can expect that the pair will adopt a bullish trend in the short-term.

The technical analysis of the EUR/AUD shows the weekly price chart bouncing off the oversold region of the lower Bollinger bands. More so, the pair is still trading above the 200-period MA. All the best.

Categories
Forex Fundamental Analysis

EUR/AUD Global Macro Analysis – Part 1 & 2

Introduction

Global macro analysis of the EUR/AUD pair will focus on the endogenous analysis of fundamental factors driving economic growth in the EU and Australia. It will also involve exogenous analysis that will focus on factors that influence the EUR/AUD pair’s exchange rate.

Ranking Scale

This analysis will assign a score between -10 and +10, depending on the endogenous and exogenous factors’ impact.

A negative score for the endogenous factors means that the local currency shed some value. When positive, it means that the domestic currency has appreciated. The endogenous score is determined through correlation analysis between the endogenous factors and the GDP growth rate.

On the other hand, when the exogenous factors have a negative score, it means that the exchange rate between the EUR and the AUD will drop. A positive score means that the exchange rate will rise. The exogenous score is determined via a correlation analysis between the exogenous factors and the EUR/AUD pair’s exchange rate.

EUR Endogenous Analysis – Summary

The endogenous analysis of the EUR has an overall score of -3. Based on the factors we have analyzed, we can expect that the Euro has marginally depreciated in 2020.

AUD Endogenous Analysis – Summary

As you can see in the below image, according to the Endogenous Indicators of AUD, we can conclude that this currency has depreciated as well in 2020.

The employment change in Australia tracks the monthly number of people who are gainfully employed or engaged in unpaid work. The fluctuation in the number of those employed on a full-time or parttime basis helps to show economic growth.

Between September and October 2020, the number of those employed in Australia increased by 178,800. This shows that the economy is recovering and adding more jobs to the labor market. However, from January to October, the Australian labor market has lost about 190,100 jobs. Hence, we assign a score of -6.

  • Australia GDP Deflator

The GDP deflator measures the overall inflation for the economy. It is a comprehensive measure of inflation rate compared to other measures since it accounts for the changes in the prices of all goods and services produced within Australia. Changes in the prices often correspond to changes in economic growth.

In the third quarter of 2020, the Australia GDP deflator rose to 102.03 points from 101.64 in Q2. Up to Q3, the GDP deflator in Australia has dropped by 0.07 points. We assign a score of -2.

  • Australia Industrial Production

Industrial production measures the quarterly changes in output from the manufacturing sector, utilities, and mining. Note that the Australian economy is heavily dependent on commodity exports, which means that industrial production changes significantly impact economic growth.

In Q2, the industrial production in Australia dropped by 3.3%, while the YoY Q3 industrial production dropped by 2.02%. The drop in Q2 is the largest quarterly drop in over 25 years. We assign a score of -6.

  • Australia Manufacturing PMI

This PMI is from a survey of companies operating in the industrial sector. The index shows whether the manufacturing sector in Australia is expanding or contracting. In Australia, the Ai Group surveys the changes in new orders, employment, inventory, output prices, and production levels. When the index is above 50, it means that the manufacturing sector is expanding and contracting when it’s below 50.

In November 2020, the AIG Australian manufacturing PMI dropped to 52.1 from 56.3 in October. Despite the drop, the Australian manufacturing PMI points to growth in the industrial sector. Hence, we assign a score of 6.

  • Australia Retail Sales

The retail sales data in Australia tracks the monthly change of the consumer expenditure on goods and services. Consumer goods include items of clothing and footwear, food, and household items. Purchases made in restaurants, departmental stores, and hotel services and deliveries are also included as retail sales.

In October 2020, the MoM retail sales increased by 1.4% from a 1.1% drop in September. In 2020, the average MoM retail sales have grown by 0.97%. We assign a score of 2.

  • Australia Consumer Confidence

The Melbourne Institute and Westpac Bank survey about 1200 households in Australia and constructs the consumer confidence index. The index is based on households’ evaluation of their financial condition for the preceding year and in the next 12 months. It also includes their economic expectations in the next one and five years. When the index is above 100, it shows that households are optimistic and pessimistic if the index is below 100. Note that consumer confidence about their finances and the economy determines their level of expenditure; hence, it drives the rate of GDP growth.

In December 2020, consumer confidence in Australia rose to 112 from 107.7 in November, which is the highest in over ten years. We assign a score of 5.

  • Australia Government Debt to GDP

The government debt to GDP determines the ability of the economy to service its debts. It also impacts the ability of the government to take on more debt to advance an economic agenda. A debt level of below 60% of the GDP is preferable since it ensures that the government can take on more debt without over-leveraging the economy.

In 2019, the Australian government debt to GDP rose to 45.1% from 41.5% in 2018. In 2020, it is expected to reach 50% on account of increased government expenditure during the coronavirus pandemic. We assign a score of -3.

Please check our following article where we discuss the Exogenous analysis of the EUR/AUD Forex pair. Cheers.

Categories
Forex Course

198. The ‘Dollar Smile Theory’

Introduction

The U.S. Dollar Smile Theory is a popular notion that illustrates that the U.S. Dollar stays positive in good as well as bad market conditions. This theory was created by a former economist and strategist Morgan Stanley, and it became popular in 2007.

This was the time when the U.S. dollar witnessed a significant boost amidst the global recession. Many times, looking at the market conditions, people would think the U.S. dollar would fall, but surprisingly it continues to grow.


Source: here.

Why does that happen?

The Dollar Smile Theory answers this question.

Following are the three scenarios that Morgan Stanley put forward to explain the positive growth of the U.S. Dollar.

  • The Strength Due To Risk Aversion

The first reason that the U.S. dollar rise is due to risk aversion. This is a situation where investors rely more on safe-haven currencies such as the dollar, yen, etc. During this period, investors consider the global economy in an unstable position. Hence, they are less likely to invest in the risky asset; instead, they put their cash on U.S. dollars.

  • The Dollar Weakens to New Low – Economic Recession and Slowdown

Under this scenario, the US dollar falls to a new low. The bottom of the smile indicates the dull performance of the currency as the economy struggles with weak fundamentals. Additionally, the possibility of falling interest rates also impacts the position of the U.S. Dollar. This results in the market participants steering clear from the dollar.

Subsequently, the primary motto of the U.S. Dollar becomes to Sell. Investors move from buying the currency to selling it and moving towards currencies that are providing higher yields.

  • The Strength Of The U.S. Economy Helps

The U.S. dollar continues to grow because of the strong economy of the country. After the low, a new smile emerges as the economy sees its light at the end of the tunnel. With the signs of the recovery of the economy, a sense of optimism spreads through the market.

This increases the sentiments towards the dollar again. With the US economy enjoying higher GDP growth, the greenback continues to appreciate. This increases the interest rate in the international market.

Though the theory is quite relevant and backed by some logic, the economy is extremely volatile. So only time will tell how definite the Dollar Smile theory is in the future.

[wp_quiz id=”97467″]
Categories
Forex Market

What Can FX Traders Learn From Alexander Kearns’ Death

Many of you may have heard of Alexander Kearns, but for those that have not, it is a sad situation where a young man, just 20-years old took his own life due to an error in a trading system which showed him in approximated $730,000 debt with a broker.

When the Covid-19 pandemic hit, Alexander Kearns decided to take up trading. He took advantage of the fact that many brokers are offering their clients leverage, which is basically the act of lending you money in order to make larger trades than your account would otherwise be able to make. It was due to this leverage on offer that this mistake took place. His account showed a negative balance of $730,000, something that he believed he would have had to pay back in one way or another. Due to the immense stress of the situation, Alexander sadly took his own life. Of course, this was totally avoidable. Even worse, the balance was a mistake by the app, and the account wasn’t actually in the negative.

For those active in the trading community, they know that this sort of tragedy could have been easily avoided. Alexander came into trading with very little knowledge of how certain areas work, which is why it was so avoidable. Had he known that accumulating this sort of debt so quickly would be extremely hard to do, even for the worst traders out there, it would have helped him to understand the fact that many brokers now offer negative balance protection, preventing you from owning anything should you lose your account.

It is important that we learn from this tragedy in order to help ensure that nothing similar happens again in the future. In order to do this there are a few things that we can take away from this which could help prevent any further tragedies, so let’s take a look at some of the things we have learned.

Understand Leverage

Leverage is a wonderful thing, as it can give you the opportunity to make a lot of extra money. It basically increases the trading power of your account, but it also has its downside. While it increases profits, it can also increase potential losses. Remember you are now trading with larger trade sizes, so if things go the wrong way, you will ultimately lose more. You need to have an understanding of how this works before you begin to trade. Learn the ups and downs and ensure that you are not trading with leverage that is simply too high. Some brokers offer 2000:1 leverage, this is simply too high and very dangerous for a new trader.

Negative Balance Protection

One of the most important things for a new trader is negative balance protection. This is simply where a broker does not allow you to go into a negative balance. Instead, as things go the wrong way and your account equity lowers, the broker will automatically close all trades that you have open in order to prevent you from going into a negative balance. Of course, those trades will be closed at a loss and you will have lost the majority of money in your account, but at least you do not owe anything extra on top of that. The majority of brokers now offer this service, so be sure that when signing up for a broker you make sure that this is on offer. While we hope you will never have to use it, if you do, it could save you a lot of money and also help to avoid any situations similar to Alexander Kearns.

Understand the Risks

It is not only about understanding what the risks are, but also how you can manage them and potentially reduce them. There are a lot of different risks involved when it comes to trading, things like leverage, the markets going the wrong way, different risk to reward ratio, no stop losses or taking profits, and more. What we need to do is to get a good understanding of how to reduce them. Stop losses are a great way to prevent risk, so is using the appropriate lot size and trade size. When you create your strategy you also need to create a set of rules for entering trades as well as exiting them, you also need to decide on the trade size and anything else like this. Having all of this predetermined is a great way of ensuring that you stick to them.

Use Stop Losses

Stop losses are there to protect you and to prevent you from losing too much. Without them, a single trade could potentially make you lose your entire account. Instead, having a stop loss in place will mean that your loss for each trade will be fixed, this will help you to prevent huge losses with each trade and ultimately save your account. Ensure that with every single trade, you have a stop loss in place to help protect you, you should never be trading without one, under any circumstance.

Only Trade What You Can Afford

This is one of the big ones. You have probably seen this warning out there as you look through forex and trading related sites. You should only trade what you can afford to lose. If you think about the money that you are putting in, if you were to lose that money, would it hurt you? Would it prevent you from paying rent or anything like that? If the answer is yes to any sort of question like that then you should not be trading with it. You need to only trade with your expendable income and not any funds that you need.

Avoid Volatility

Volatility can be a trader’s best friend, but as a newer trader, you should try and avoid it. When there are big news events coming out or the markets are simply jumping up and down, you should try and avoid trading in this situation. Yes, it can increase your profit potential, but it can also increase your loss potential, which as a new trader, is far more likely to get you at one point or another. It is far better to simply avoid these situations rather than to risk trading.

Choose The Right Instrument

As a new trader, you need to be careful which assets you decide to trade. Some of them are far more volatile than some of the others. In fact, some should be avoided at all costs. As a new trader, you should probably try trading the major currency pairs rather than anything else, at least until you are used to trading and how it all works. Going for something different will simply mean that you are trading higher volatility which can be more dangerous.

So those are some of the things that we have learned from the tragedy of Alexander Kearns. It is important that we do what we can to try and avoid anything similar happening again in the future. Using what we have learned can make it safer for us to trade. As a new trader, learn from what we have written above and understand the risks before you put any money into your trading account.

Categories
Beginners Forex Education Forex Basics

Forex Pros Do These Things (And You Should Too!)

We forex traders like to look up to those that have come before us and been successful. We do this for a number of reasons. These individuals have been successful, so they clearly know what they are doing. This means that they are great people to learn from. They also have the experience to know what is a good thing to do and what is a not so good thing to do. They are the people that we wish to copy, to learn from, and to be just like. So we are going to be looking at some of the things that professional traders do in order to be successful, and why you should be doing the same things.

Sticking to the Plan

One of the things that any professional or even successful trader will tell you is that you need to stick to the plan. There is no point in having a trading plan in place if you are not going to be following it. Even breaking the plan in a tiny way is basically meaning that you are placing bad trades. They will tell you that you need to stick to it and you need to stay disciplined. That is one of the most important steps to becoming a successful trader.

Don’t Be Afraid to Take Risks

Contrary to the above, a lot of traders will tell you that if you want to be successful then you will need to take risks. This does not, however, mean that you should be placing more trades or placing larger trades. Those are bad risks and will put your account in danger each time you do it. Instead, the sort of risks that they are referring to are things like taking trades on an asset that you do not usually trade. So if you are an avid EURUSD trader but a great trade opportunity comes up on the GBPUSD pair, then there is no harm in trading that pair, as long as the entry requirements and all other aspects of your trading plan are still being met. Do not limit yourself to that one pair.

Remove Your Limits

We mentioned this briefly in the above point, but you need to be able to remove or at least expand your limits. Sticking to a single currency pair or asset will greatly limit your opportunities to trade and to be profitable. It is, of course, not a good idea to expand too much. Going from one pair to 100 will put your account in danger as you cannot monitor or fully understand all 100 currencies. Instead, expand slowly, moving from one to two, then two to three, and so forth. You are still expanding your limits, giving yourself more opportunities, but you are doing it in a controlled manner which is exactly what you need to be doing.

Get Into the Right Mindset

Being in the right mindset is vital. In fact, it can make or break a trader. If you believe that you can trade, if you are able to control your emotions, if you know when to take breaks then you can keep your mind in the right place and remain free from the distractions that are around you. If you have the right attitude towards your trading then things like sticking to your trading plan and staying disciplined will be a lot more straightforward and easier to maintain. Those that are not in it with the right attitude will soon find themselves making bad trades or making losses, so it is important that you get the right mindset and then try to remain there.

Know When to Take Breaks

A good trader will not spend all day everyday in front of the monitor. If they did, they would simply burn out and start to make losses. A good trader will know when they need to take breaks. This can be a break when your emotions are starting to build up, or you are simply getting a little tired. There is no wrong time to take a break. Getting out and clearing your mind is paramount to being a successful trader. If you don’t take breaks you will burnout and make losses. So learn when to take them, and even set designated times for breaks if you need to.

Risk Control

Risk control is the foundation of any forex trading strategy. If you do not have a risk management plan in place then you’re setting yourself up for failure. You need to create a risk management plan that has a number of different elements to it. These will include your risk to reward ratio, your stop loss size, take profit sizes, trade sizes and more. These are the foundation of your trading plan, you need to have them in place before you make a trade. Any professional trader will simply laugh at you if you are trading without a plan in place.

Not Always Trading

You do not always need to trade. You do not need to trade every minute or even every day. In fact, some professional traders will go a whole week without putting on a trade. This is often due to the fact that the markets are not in the right condition for the strategy that they wish to trade. They will only trade when the conditions are right and this is something that you should be doing. Do not trade just for the sake of trading. Trade when the setup is actually there. If you trade outside of your strategy it is considered a bad trade, so having patience is key to sticking to this rule. Have patience and wait for the right trade to come and certainly don’t try to force it.

Not Focusing on Wins and Losses

Advertised all over the internet are those strategies that are promising you a 99% win rate. These are just not realistic and are playing on the strings of those that are there to simply make money, yet do not fully understand how forex or the markets actually work. Professional traders do not care about how many they win or how many they lose. They are simply interested in the returns. With a proper risk to reward ratio in place, you can be profitable with a 25% win rate. This is what the professionals focus on, being profitable no matter whether they win or lose. Due to this, they do not focus on whether their last time won or lost, and neither should you. Trust your strategy, trust your risk management and you will have a far less stressful time.

Professional forex traders are people that we look up to, yet they do not do anything different to what we should be doing. If we want to be successful traders then we need to mimic some of the things that the professionals are doing. It is easy to do, as they aren’t doing anything magical. There really isn’t an excuse that we can use that will make it acceptable to avoid following them. Stick to some of the actions that we have mentioned above and you will be on your own path to becoming a professional trader at some point in your career.

Categories
Forex Trade Types

What is the Difference Between Orders, Trades and Positions in Forex?

For someone with very little knowledge of forex or trading as a whole, the terms order, trade, and position all probably sound quite similar and may seem to pretty much be the same thing. However, for those of us that have actually traded before, we know that there are a few differences between them. They are, of course, all related to actually putting in a trade, but we are going to be looking at the subtle differences between the three terms in order to ensure that you know exactly what people are talking about when they mention these terms.

Orders

Let’s start with orders. By definition, the term order simply means an authoritative command or instruction, and it is very similar when it comes to trading, as we are simply telling the broker what we want. Simple right? Well not quite, as there are actually a number of different orders that you can make, quite a few in fact and some are a little more complicated than others.

The first type of order is simply a market order. This is basically you telling the broker that you want to put in a trade. For the majority of brokers, this order would then be executed immediately and the trade would be put in at the current market price. This works for both buys and sells.

Then there are pending orders. These are orders that you are putting in but asking the broker to place the trade when it gets to a specific price. There are a number of different order types that fall into the category of pending orders, let’s take a brief look at what they are.

Limit orders are pending orders that can be both sell limits and buy limits. The way that this order works is that we, for example, are wanting to buy but the price is moving downwards. We would put in an order for a price that is below the current value. Once the price reduced down to the level that we have set, a buy trade will be placed. The same works for a sell. We place our order at a price higher than the current value, and the price rises and reaches our order price a sell trade will be placed. These work well when placing them on resistance or support levels where you expect the price to reverse.

To recap: A limit order set as a buy will be at a price lower than the current market price will be executed by the broker at a price equal to or lower than the specified price in the order. A limit order set as a sell will be at a price higher than the current market price and will be executed by the broker at a price equal to or higher than the specified price in the order. 

We then have stop entry pending orders. These work in the same way yet the opposite way at the same time. The stop order is basically a stop on the market. A trade won’t be opened until the price reaches that price and once it does a trade will be opened. So it works in a similar way to the limits, but this time when the markets are moving upwards and they reach the stop entry level, a buy trade will be opened in h hope that the price continues to move in the upwards direction. The same for a sell, you place it below the current price with the hope that it will continue to fall once it reaches the stop limit and the trade opens.

To recap: You would place a buy stop at a price above the current market price. When the price reaches the set level, a buy trade will open. For a sell it is exactly the same, you place a sell stop below the current market value and when the price reaches this level a sell trade will be placed.

Trades

Now let’s look at trades. This is quite a simple one to explain. A trade is simply the act of putting on a buy or sell order and executing it. As soon as the order has been executed, it is now a trade. Trades comprise of both buy and sell trades, but buying when you are expecting the markets to rise and selling when you are expecting the market price to fall. You can place multiple trades at the same time, and depending on the regulation, you can place both buy and sell trades on the same pair at the same time. So in short, a trade is simply an order that has been executed by the broker and is now live.

Positions

Positions are a little more complicated to explain, but they are basically an accumulation of all the open trades at any moment in time. Your position is based on the exposure that you have with any given currency within a market. So let’s assume that we are trading the EUR USD currency pair, and we have a trade of 0.01 lots as a buy trade. That is the equivalent of $1,000 on a buy. We place another 0.01 lot trade which makes out a total 0.02 lots or $2,000. Our position is now $2,000 going long. If we were to place a 0.05 lot sell for $5,000 this would give us 0.02 long and 0.05 short, or a total 0.03 lots short, our position would then be $3,000 short.

Your position is basically an indication of how exposed you are to market movements. The more trades that you have going in one direction the larger your position is on that currency pair and so the more open you are to risk and exposure when the markets move.

That is a little overview of what orders, trades, and positions are when it comes to forex trading. Hopefully, this has given you a little insight into their meaning and may have also cleared up any potential confusion that there may have been regarding these terms. 

Categories
Beginners Forex Education Forex Basics

Even More Frequently Asked Forex Trading Questions Answered!
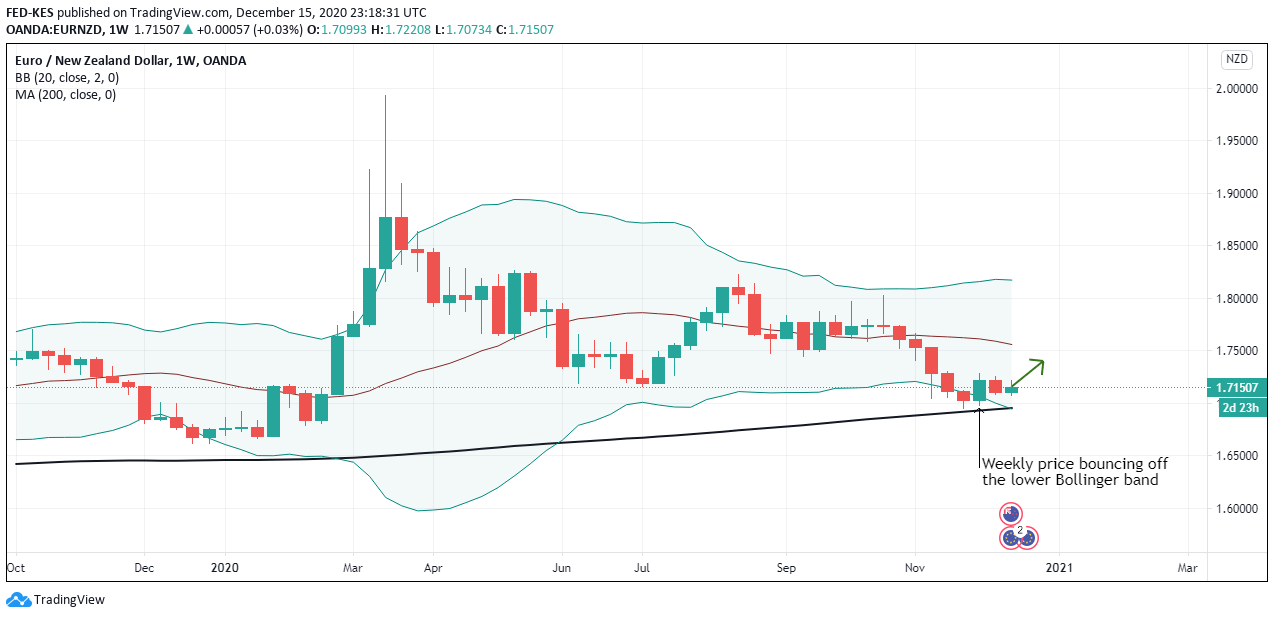
Our previous question and answer article was so popular that we decided to add another round! What follows are some of the most popular questions (and answers, of course) as asked by novice Forex traders. Education is the key to success, so read on!

Question #1: Why is Forex a Bad Idea?

There are some statistics out there that suggest that 70% or more of first-time traders fail. Those that come across these statistics are often scared away from trading because it seems like it just isn’t worth it. In reality, many of these traders walk away over simple problems that could have been avoided, like opening a trading account with zero knowledge of the market, not using risk-management precautions, and so on. As long as you start well-prepared, you’ll be among the traders that succeed. 

Question #2: Is Forex a Good Career?

There are certainly several benefits to becoming a trader, including flexible work hours, the ability to work from home, and being your own boss, just to name a few. Of course, you would need to invest a good chunk of money to make enough profit to be able to trade full-time. Those that still need another source of income often trade part-time. 

Question #3: Is Forex Trading Difficult to Learn?

While there is a lot of information you’ll need to know before you get started trading, we wouldn’t consider it to be difficult. You will need to invest some time into learning, but the good news is that all of this can be found on the internet for free. You can also avoid strategies or indicators that seem overly complicated and stick with things you understand. 

Question #4: How Do I Start Trading Forex with $100?

If you have at least $100 to invest, you’ll find a lot of brokers that are willing to let you open an account. Some brokers even waive a deposit requirement altogether or ask for as little as $10. You’ll simply need to shop around to find an option that offers an account with a $100 (or less) deposit minimum. 

Question #5: Can a Beginner Make Money Trading Forex?

Yes, but your chances of success depend on a few factors, most importantly that you start prepared and choose a trustworthy broker. Beginners are more prone to avoidable mistakes because they simply haven’t had the chance to learn from them. One of the best things you can do to avoid this is to spend time reading articles that provide tips and tricks specifically for beginners. You can also read about common beginner mistakes to ensure that you don’t follow the same path.

Question #6: Can you Start Trading Forex with No Money? 

Sort of. You could start out with a demo account, which is like a practice account that allows you to trade without using real money. If you’re a beginner, you should start with a demo anyways while you work on saving up an initial investment. If you want to open a live account with no money, it is possible if you can find a broker offering a bonus to new traders. However, it may be difficult to find such a bonus that doesn’t require you to deposit anything at all, and these offers often come and go periodically.

Question #7: What is the Best Currency to Invest in?

This depends on the times, but currently, many traders would recommend the British pound. In particular, the GBP/USD and EUR/GBP. Of course, you’ll want to ensure that this is still a smart investment in case the recommendation goes out of date. 


Categories
Forex Market

The Economic Calendar and Why It’s So Darn Interesting

Today we’ll go with an entry about a tool that interests a lot of you, the economic calendar, and its impact on Forex trading. It is constantly updated so that you have access depending on the day you are looking at it. To get started, let’s see what this tool is and why I tell you that it is a tool that should interest you a lot if you trade in currencies (or any other type of asset).

Index

  • What is the economic calendar?
  • Is a Forex calendar important?
  • When should I look at the economic agenda?
  • What is important in a macroeconomic calendar?
  • Trading based on macroeconomic data.
  • Technical analysis, fundamental analysis, and the economic agenda.
  • Where to look for Forex news data
  • Publication of macroeconomic data
  • Global indices and commodities
  • How do I use the economic calendar?
  1. What is the economic calendar?

An economic calendar, as its very name indicates, reflects when and what economic issues will be published globally. It can be the decision of interest rates on the part of a country, indices production prices, balance of trade, economic events. In short, it shows you any event that could affect the economy and the financial markets.

  1. Is a Forex calendar important?

As you know, in the Forex market (as in all) price movements are impacted by the news, macroeconomic data, government decisions, and more. Therefore to follow an economic agenda allows us to know when the greatest movements in the market will take place. We can even use this to not do trading or even as some traders do, do news trading.

  1. When should I look at the economic agenda?

Depending on the frequency of your trading, if you do swing trading (trades that last several days) it may have little relevance in your trade and just look at it once or twice a week. If on the contrary, your operation is more aggressive, reviewing the economic calendar each day can give you an optimal point of view of the market. You know, more day trading, more focus, which is something that doesn’t sell much but that’s there.

  1. What is important in a macroeconomic calendar?

If you take a look at the agenda above you will see that many days have published enough data and many of them are not very important. This you can set to stay only with those that are really important. Even sometimes, those that are a priori important generate little movement in the market. Still, don’t trust yourself.

  1. Trading based on macroeconomic data.

It is very popular to read or listen to some traders say they trade forex with news. What they look for with it when there is high volatility is to gain a lot in a very short time. Careful, the message sounds very nice but the reality is not so much. High risk is also something to calibrate well, in addition, to stop loss sweeps, landslides when entering the market. You must keep these issues in mind.

  1. Technical analysis, fundamental analysis, and the economic agenda.

Whether you do technical analysis or fundamental analysis, the economic agenda really matters. You might think that since you do technical analysis, you don’t care about this whole macroeconomic news thing. You can really do that in part, but to follow the market keep them present or you can get some upset. If you’re in a pretty big position within the pound and there’s news about the UK Brexit referendum, this may annoy you, to put it mildly.

If you focus or are focused on fundamental analysis to make buying and selling decisions you will know the importance of following the macro calendar and will work with economic data as a source to make your decisions. 

  1. Where to look for Forex news data

On this very page, up. In addition, there are other well-known ones such as Investing, FXstreet, and different portals where you can see these types of calendars, each with a different style. In the end, it’s a matter of taste, choose the one you like the most and where you feel comfortable. The source of the data is usually the same.

  1. Publication of macroeconomic data

Some people are obsessed with when this data is published to buy or sell based on how good or bad this data has been. Error. Two points:

In free portals the publication of the data is done with some delay and to avoid this we should hire platforms like Bloomberg (it is a paste to keep them for the independent investor and do not make much sense). But even so, today the execution of orders mostly goes by algorithms. In the time it takes to observe the data, you open the broker and place an order, the algorithm may even have already closed the position. Focus your goal on other more profitable patterns.

Another thing, do you think that just because a piece of data is better than expected, it’s gonna benefit an asset that goes up or vice versa? The answer is no. Sometimes this is discounted on the price already or the data is good but worse than expected. If you are a retail trader, I recommend that you do not enter this war unless you are very clear about it.

  1. Global indices and commodities

You may wonder if this agenda is only for the Forex market or has any use in the case of trading in indices or commodities. Macro data from China without going any further are moving most of the world indices. Events in the United States cause major markets, including European indices, to be affected both positively and negatively.

Another example is oil, which in turn has a direct relationship in some currency pairs due to the countries where it is traded and where there are large reserves. The publication of oil inventories is very important data that is taken into account by investors and traders. In the end, they affect the asset or country in question, either directly or indirectly, and it is important to have control of its publication so that you do not get caught out of play.

  1. How do I use the economic calendar?

I’ll tell you how I use the economic calendar and how you can use it yourself. If you do algorithmic trading as is my case, that is, you have automated in and out of market operations, you can carry out different actions:

-Create strategies that avoid operating at times where high-impact news is published for markets (for example, on Fridays at midday).

-Adjust systems to market volatility. We can calibrate the amount and distance to stop loss based on price variability. If it is high, it is advisable to leave more distant stops so that you do not jump at the first change with strong movements. Indicators like the ATR (Average True Range) for example can help you in this.

-Disconnect systems when there are Brexit events or important government decisions at any given time.

Beyond that you can design them yourself according to your preferences, here are some ideas. In a habitual way, apart from this type of facts, I use the economic agenda like this: the weekend where I usually look at what publications there will be in the next days and every morning when I wake up where I review only the data and the next hours (of that day).

Don’t worry if you can’t stay on the screen because you work or are busy. In addition to the Internet browser you normally use, there are mobile apps that allow you to view them. In fact, you can already do it from your smartwatch. It’s not that you’re obsessed with constantly refreshing the page or app to see what’s going on, just remember that it’s all about having control.

Categories
Beginners Forex Education Forex Basics

What Sports Can Teach Us About Success In Forex

The forex world can seem very isolated as if it is something that you can do with skills that are only used with trading. However, there are a lot of other things that we do within our lives that can help us to be better traders and can even teach us a little about it. Some of these things are sports. These sports can help to give us an edge when it comes to trading, either through the development of much needed skills or to give us a better understanding of what we need to do as traders. Today we are going to be looking at some of the sports that could benefit us as traders and can give us a better understanding or skill set when it comes to being a forex trader.

Patience Is Key

When it comes to sports, it may not seem like patience plays an important role, but it certainly does. You cannot simply force a play if you are on the football field, a boxing ring, a hockey pitch, or even a tennis court. You cannot simply force a play, your opponent simply won’t allow it, otherwise it would be a pretty boring and one-sided affair. So instead you need to show patience, you need to be able to sit back, to observe what is going on in the game and to then strike only when the time is right, only when the opposition presents you with an opening. The same thing happens with trading and forex, you cannot force a trade. If you try to do this, the markets will simply punish you, it will take your trade and throw a large loss out at you. You need to wait for the right moment in sport, just as you need to wait for the right trading opportunity and conditions when it comes to putting on a trade. Simply don’t try to force a trade, just like you wouldn’t force a play in sport.

Accept Losses

Losses are a major part of trading, just like they are in sports. You won’t go through your career as a sportsman without a loss (apart from the very few in things like MMA) just like you won’t go through your trading career without a loss, so it is important that you learn to accept them. A loss is not the end of the world. The majority of sports teams that win their leagues or seasons, will suffer losses along the way, but those losses did not hold them back, and those losses did not stop them from being successful. We need to look at trading the same way. When we have a loss, as long as it is controlled and we only lose what we expected to lose, it will not prevent us from being successful. In fact, all the successful trades that you see out there regularly take losses. They are a small step back yes, but they are certainly not anything that you should be incredibly worried about or that will prevent you from being profitable and successful.

You Won’t Win All the Time

This is kind of in line with our previous points. A sports team needs to go into the next game with the idea that they can be beaten, as they cannot win every single game. If they go in with this mentality then they will be going in with their guard down and this is more often than not when they experience their losses. The same has to go for us with trading too. We need to know that the next trade is not a guaranteed win, and due to this we need to make sure that our risk management plans are in palace and that we are prepared for the possible loss. This will allow us to limit the damage that it will do. Sports teams cannot win every single game, it would be boring if they could, the same way that we cannot win every single trade. If we could, we wouldn’t need to trade as we would already have everything that we could ever want.

Look At Your Own Performance

More often than not you get sports people and teams looking at the wrong thing. They focus so much on the opposition that they completely forget to look at their own performances and neglect to work on what they need for themselves. The same thing can go for forex traders. They focus too much on what is happening in the markets or what other forex traders are doing rather than looking at their own trading performance. To look at what they have done and to analyse what they have done right and wrong, that is how you improve. However, if you are solely looking at the markets or other traders, you will not be able to work out what you need to work on or what you need to improve in order to be a better trader. So while looking at the opposition is important, you need to be able to look at your own performances from the start in order to become a better trader overall.

Work Smarter, Not Harder

When you watch your favourite sports team, what is one of the things that you notice when they do well and win? They may be working hard, but there is something else. They are most likely outsmarting the opposition. You can work as hard as you want, but if you are doing it in such a manner that also uses your brain, you will be able to pick the pockets and to make a difference. Both teams can work hard, but the one working smarter will have the advantage. This works the same for trading too. You can put as much time and effort in a you want, but if you do not put it in the right places or do not also think rather than just work, you will not make good trades and won’t be as profitable as you should be. Analyse what you are doing, work on your strengths, and take time to look at your performances to make sure that you can adapt things to get better results. Work hard, but also work smart, just like the most successful sports teams and players do.

Those are some of the things that are very similar between your favourite sports team or athletes and trading forex. You can learn a lot as they often do a lot of the same things or have the same things. Whether you want to be a successful trader or a successful sportsman, you will need to put in the effort. To have the right mindset, you analyse yourself and the opposition and play the game the way it is want to be played. Next time you watch your favourite sport, look at what the team is doing, you will most likely be able to take something away from it that you can then implement into your trading on the forex markets.

Categories
Beginners Forex Education Forex Basics

The Truth About Why You’re Failing at Forex

There are a lot of traders out there. A lot of them are experienced and a lot of them are completely new. The one thing that the majority of them have with forex is that they are simply losing. Yes, they are losing money. You have probably seen the warning signs from pretty much any forex related site, stating that the majority of people that trade forex or any sort of CFD will lose money. So why do we still trade? It is because of the potential, but in order to achieve that potential, we are going to need to work out why it is that so many traders are failing when it comes to forex trading.

Some reasons are based on the individual, some through inexperienced and some through simply making mistakes, common mistakes that a lot of people make. We are going to be looking at some of the main reasons why people fail at forex trading.

Lack of Risk Management

Something that should have been cemented into your mind when you read any sort of trading course or help site is that you need to have a risk management plan in place. Yet it is something that a lot of traders still fail to do, and when you fail to do this, you are failing to trade properly. The risk management plan outlines a number of different things including trade sizes, stop loss distances, your risk to reward ratio, and more. It is paramount that this is in place, its sole purpose is to protect your account and to help you prevent yourself from making large losses. So we really don’t understand why people trade without one, either through lack of understanding or simply being too lazy to follow one. Get a risk management plan and stick to it, you simply cannot be successful without one and will fail if you don’t use it.

Not Using Stop Losses

Part of the risk management plan that we mentioned above is your stop losses. These are basically automatic stops that you can place on your trades. When the price of the markets move up or down and hit these levels then your account will automatically close. They are there to help protect you from bigger losses than you planned for, yet so many people refuse to use them. Again, this may be through simply not understanding their use, but for many. It is simply the fact that they do not want to and for this reason, they often lose their accounts. You need to have them set, every single trade needs to have one, no matter what your strategy is. If you are the sort of person that doesn’t set them and instead wants to manually watch your trades then we would suggest you rethink, these are hard stops, they protect you, use them. Otherwise, a single trade could be enough to blow an account, and it has happened many times in the past.

Trade Sizes Too Large

The size of the trade that you place relies on a number of things. It is decided based on your strategy as well as your current account size. If you place trades that are too large, then you are placing your account under an increased amount of risk, not something that you want to be doing. If you have an account size of $1,000 and place a trade size of 0.01 lots then you have a lot of room for movement. However, if you use your leverage to place a 1 lot trade, then it won’t take much movement in the markets to simply blow your account. You need to place your trade sizes responsibly, yes the larger the trade size the larger the potential profits, but the losses are also potentially larger. Stick to appropriate trade sizes and do not try to push them too far.

Overleveraging Your Account

Leverage is a wonderful thing. The brokers are basically lending you money to place trades larger than your account would otherwise be able to place. It is something that you should take advantage of, but unfortunately, a lot of people do not understand the darker side of leverage, the side that can cause you to simply blow your account. When you leverage your account, you will be placing larger trade sizes, and these give more profit potential but also more loss potential. We see $100 accounts with a leverage of 2000:1 placing 1 lot trade sizes. The markets only need to move a few points before the account will blow. You need to use your leverage appropriately, even with a leverage of 2000:1, you do not need to use it all with every single trade. Remember to follow your strategy and do not place trades too large just because you have the leverage to do it.

Quitting Too Early

People don’t like to lose, and that is understandable, but people also should not quit at the first hurdle. Many people from many walks of life have tried things, but do you think that any of the successful ones have quit after their first lesson or two? When you leave after your loss, you are basically accepting that you have lost that money and have walked away. It should be that you were never serious about trading and never serious about wanting to make the money that you are upset that you lost. You cannot quit too early, losses are a part of trading, just because you experienced one does not mean you are a failure or that you should give up. You need to keep going, even the best forex traders fail, but they are the best because they did not quit, and neither should you.

Being Distracted

Let’s be honest, it is easy to be distracted, and far easier in these modern days than it was before with all the different devices that we have to entertain us. Yet when we trade, we need to try and get rid of everything that we do not consider essential. Get rid of the TV in your trading room, get rid of your phone, get rid of anything that can distract you. We have made losses through distractions in the past, we are sure that the majority of traders have, but it is something that we can very easily deal with. Distractions will take your mind off your trading, placing wrong stop losses or take profits, trades too large, and so forth. You need to be focused when you trade, if not, mistakes will happen and you could ultimately fail if you experience too many of those mistakes.

Those are some of the reasons why people fail. If you make a loss to begin with, do not panic, that is pretty much expected of all new traders. In fact, if you are profitable in your first few months, either you are amazing or simply lucky. However each time you make a loss, take a look at the trade, try and work out why you lose, some you will be able to make adjustments, others may have just been unlucky, but use it as a learning experience. Doing this with each trade will enable you to be better, and the better you are, the less likely you are to fail.

Categories
Forex Fundamental Analysis

EUR/NZD Global Macro Analysis – Part 3

EUR/NZD Exogenous Analysis

  • The EU and New Zealand Current Account to GDP differential

An economy’s current account comprises the balance of trade, net transfer payments, and net factor income. In international trade, a country with a higher current account surplus experiences higher demand for its domestic currency. That means the value of its currency will be higher. Typically, a higher current account to GDP means that the country has more current account surplus.

For the EUR/NZD pair, if the differential of the current account to GDP is negative, it means that the pair’s exchange rate will fall. If it’s positive, we can expect the pair’s exchange rate to increase.

In 2020, New Zealand’s current account to GDP is forecasted to reach -0.8% while that of the EU 3.4%. Thus, the current account to GDP differential between the EU and New Zealand is 4.2%. We assign a score of 4.

The prevailing interest rate in a country determines the flow of capital from foreign investors. Naturally, the country that offers a higher interest rate will attract more foreign investors who seek higher returns. Similarly, a country with lower interest rates will experience an outflow of capital by foreign investors. In the forex market, a currency pair with a positive interest rate differential tends to be bullish since traders are buying the base currency – which offers a higher interest rate and sell the quote currency – which has a lower interest rate. Conversely, a currency pair is expected to be bearish if the interest rate differential is negative since investors will sell the base currency and buy the quote currency.

In 2020, the Reserve Bank of New Zealand cut the official cash rate to 0.25%, while the ECB maintained the interest rate at 0%. Hence, the interest rate differential for the EUR/NZD pair is -0.25%. We assign a score of -3.

  • The EU and New Zealand GDP Growth Rate differential

The value of a country’s domestic currency is impacted by the growth rate of the local economy. Thus, comparing the growth rate between countries’ GDP growth rates helps determine which currency appreciated or depreciated more than the other.

The New Zealand economy contracted by 3.2% in the first three quarters of 2020 and that of the EU by 2.9%. The GDP growth rate differential is 0.3%. We assign a score of 2.

Conclusion

The EUR/NZD exogenous analysis has a cumulative rank of 3. This means that the pair is expected to trade in a bullish trend in the short-term.

The bullish trend can also be observed from the technical analysis of the weekly price charts. The pair is trading above the 200-period MA and the weekly price rebounding from the lower Bollinger Band.

We hope you found this analysis informative. If you have any questions, please let us know in the comments below. Cheers!

Categories
Forex Fundamental Analysis

EUR/NZD Global Macro Analysis – Part 1 & 2

Introduction

In conducting the global macro analysis for the EUR/NZD pair, we will analyze the endogenous factors that impact the EU and New Zealand economic growth. We’ll also analyze exogenous economic factors that affect the EUR/NZD pair’s exchange rate in the forex market.

Ranking Scale

We will rank the effects of the endogenous and exogenous factors on a sliding scale of -10 to +10. The endogenous factors will be ranked based on correlation analysis with the GDP growth rate. When the endogenous ranking is negative, it means that the domestic currency will depreciate and appreciate when positive.

Similarly, the exogenous factors are scored based on correlation analysis with the EUR/NZD pair’s exchange rate. A positive score means that the EUR/NZD pair’s price will rise and drop if the score is negative.

Summary – EUR Endogenous Analysis

Based on the factors we have analyzed, we have got a score of -3, and we can expect the Euro to be marginally depreciating in 2020.

Summary – NZD Endogenous Analysis

A score of -4 on NZD Endogenous Analysis implies that in 2020, the NZD has depreciated as well.

Employment change measures the quarterly change in the number of people who are gainfully employed. It can be used as a comprehensive measure of the labor market changes, which corresponds to economic growth.

In Q3 of 2020, Employment in New Zealand dropped by 0.8%, from a 0.3% drop in Q2 to 2.709 million. The Q3 reading is the largest drop in QoQ employment since Q1 of 2009. We assign a score of  -6.

  • New Zealand GDP Deflator

This indicator measures the quarterly changes in the price of all economic output in New Zealand. It is regarded as the most specific inflation measure since it covers price changes for every good and service produced.

In Q2 of 2020, the New Zealand GDP deflator dropped to 1238 points from 1242 in Q1. This shows that the economy contracted in Q2. Hence, we assign a score of -3.

  • New Zealand Manufacturing Sales

New Zealand manufacturing sales track the change in the volume of total sales made in the manufacturing sector. The indicator tracks the sales in 13 industries, which comprehensively represents New Zealand’s economy. The changes in the volume of sales are directly correlated to the growth of the economy.

In Q3 of 2020, the YoY manufacturing sales in New Zealand increased by 3.1% after dropping by 12.1% in Q2 and 1.9% in Q1. The increase in Q3 is the largest recorded since January 2017. However, since the overall industrial production is still at multi-year lows, we assign a score of -6.

  • New Zealand Manufacturing PMI

This index is aggregated from a survey of purchasing managers in the manufacturing sector. It is a composite of scores regarding output in the sector, prices, expected output, employment, new orders, and inventory. When the PMI is above 50, it means that the manufacturing sector is expanding. A PMI score below 50 shows that the sector is contracting. Naturally, these periods of expansions and contractions are leading indicators of changes in the GDP growth rate.

In November 2020, the New Zealand manufacturing PMI rose to 55.3 from 51.7 in October. The rise was due to increased new orders, inventory, production, and deliveries, as uncertainties surrounding COVID-19 decreased. We assign a score of 4.

  • New Zealand Retail Sales

The retail sales track the changes in the quarterly purchase of final goods and services by households in New Zealand. Although retail sales are often affected by seasonality and tend to be highly volatile, it is a significant measure of the overall economic growth since consumer expenditure is one of the primary drivers of GDP growth.

In Q3 of 2020, New Zealand retail sales increased by 28% from 14.8% recorded in Q2. Historically, the Q3 retail sales increase is the largest rise recorded in New Zealand since 1995. The increase was driven by increased expenditure on groceries, vehicles, and household goods. On average, the QoQ New Zealand retail sales figure has grown by 4.1%. We assign a score of 4.

  • New Zealand Consumer Confidence

The New Zealand consumer confidence is also called the Westpac McDermott Miller Consumer Confidence Index. The index measures the quarterly change in consumers’ pessimism or optimism about the performance of the economy. When the index is above 100, it shows increased optimism by households, and that below 100 shows pessimism.

In the fourth quarter of 2020, New Zealand consumer confidence rose to 106 from 95.1 in Q3. The increased optimism was driven by higher readings in both the current and expected financial situation. We assign a score of 2.

  • New Zealand Government Net Debt to GDP

Investors use this ratio to determine if the economy is capable of servicing its debt obligations. Consequently, the government’s net debt to GDP affects the government securities yield and determines a country’s borrowing costs. Typically, levels below 60% are deemed favorable.

In 2019, the New Zealand Government Net Debt to GDP dropped to 19% from 19.6% in 2018. In 2020, it is projected to range between 27% to 32%, which would be the highest since 1998. We assign a score of 1.

In the next article, we have done the exogenous analysis of both EUR and NZD pairs to accurately forecast this currency pair’s future trend. Please check that out. Cheers.

Categories
Forex Course

197. Using The USDX Numbers To Trade The Forex Market

Introduction

The U.S. Dollar Index is one of the most reckoned currency indexes and trades on exchanges with the DXY ticker or the USDX ticker. This index has been around in the market since 1973, when the base value was kept at 100,000.00, which is now 100.00.

It is a very prominent factor that facilitates Greenback. And the basket used to measure the U.S. dollar index value has only been changed once post-Euro replaced many other European currencies in 1999.

Formula To Calculate USDX

USDX = 50.14348112 * the EUR/USD exchange rate ^ (-0.576) * the USD/JPY exchange rate ^ (0.136) * the GBP/USD exchange rate ^ (-0.119) X the USD/CAD exchange rate ^ (0.091) × the USD/SEK exchange rate ^ (0.042) * the USD/CHF exchange rate ^ (0.036).

Implementing The US Dollar Index to Trade Forex

The movement determined in the U.S. currency index, such as the USDX, offers traders a sense of how the currency is experiencing a change in its value against other currencies in the index. For instance, if there is a rise in the USDX level, this indicates the rise in the U.S. dollar. Similarly, when the level of USDX is falling, so is the dollar in the foreign exchange market.

Many financial reporters leverage the changes witnessed in the U.S. Dollar Index’s value to offer their viewers and audiences an idea of how the U.S. dollar performed in the foreign exchange market. This works as an alternative to analyzing how each currency increased or decreased against the dollar.

Moreover, the USDX can also act as an inverse indicator that reflects the strength of the consolidated Euro currency of the European Union, considering that the weight of Euro (57.6%) is the most in the index.

Another prominent aspect that the forex trader should consider is how the movements of the USDX is associated with the other currencies that are put against the U.S. Dollar.

For instance, when the currency pair is measured as USD/JPY, it is likely to be positively correlated, and both the currencies should rise and fall at the same time.

Contrarily, when the currency pair is measured like EUR/USD, then the currency pair and USDX are inversely correlated. This implies that they are likely to move in the opposite direction, where one will fall when the other rises.

[wp_quiz id=”97457″]
Categories
Forex Elliott Wave Forex Market Analysis

GBPCAD Triangle Pattern Completion. What’s Next?

The GBPCAD cross shows the completion of an Elliott wave triangle developed in its wave ((b)) of Minute degree, which moves inside the incomplete wave 2 of Minor degree. 

Technical Overview

The big picture of GBPCAD cross under the Elliott Wave view exposed in the following daily chart shows the progress of a corrective structure that began on March 09th when the price found fresh sellers at 1.80531. Once the cross topped at 180531, the cross completed an impulsive wave identified as wave 1 of Minor degree labeled in green and began to develop its wave 2 of the same degree, which remains incomplete.

The previous chart also shows the price developed its wave ((a)) of Minute degree in black as a sharp decline, making its next path corresponding to wave ((b)) as a triangle pattern. This price context carries us to verify the alternation principle between waves inside a corrective pattern. In fact,  the speedy first corrective leg gave way to an elapsed second move in an extended time range compared with wave ((a)). Likewise, the next decline corresponding to wave ((c)) shouldn’t be as quick as wave ((a)).

On the other hand, the piercing below the base-line of the triangle that connects the end of waves (b) and (d) of Minuette degree labeled in blue suggests that the cross could see further declines in the following weeks. Additionally, considering that the price action didn’t surpass the end of wave (e), the likelihood of further drops increases.

Technical Outlook

The next daily chart exposes the time segment of the corrective sequence corresponding to wave 2 of Minor degree, in which waves ((a)) and ((b)) in black were moving for 259 days, starting when the cross topped at 1.80531 and till the end of wave (e) in blue. Additionally, the piercing of the base-line that connects the end of waves (b) and (b) suggests that wave (c) should be in progress.

In this context, the incomplete bearish sequence in progress corresponding to wave ((c)) could extend in a fraction of 259 days, for example, 50 percent of that time or approximately 130 days, which carries us to foresee a downward correction in the GBPCAD cross till early April 2021. Likewise, the potential bearish target zone can be found between 1.65562 and 1.63042.

In summary, the GBPCAD cross advances in an incomplete corrective sequence corresponding to wave 2 of Minor degree. Simultaneously, its internal structure reveals the progress in its wave ((c)). The potential bearish target for this segment extends between 165562 and 1.63042. Also, the downward sequence could elapse until early April 2021. Finally, the invalidation level of the current bearish scenario is located at 1.75549.

Categories
Forex Course

196. Ever Wondered What ‘Trade-Weighted Dollar Index’ Is All About?

Introduction

The trade-weighted dollar is a prominent index developed by the FED in order to measure the value of the U.S. dollar spending on its competitiveness against the trading partners. It is used to determine the purchasing value of the U.S. dollar and to summarize the impact of appreciation and depreciation of the currency against foreign currencies.

The Importance Of Trade-Weighted Dollar Index

When the value of the U.S. dollar rises, the import to the country becomes less expensive, whereas exports become expensive. A Trade-Weighted Dollar Index is used to measure the value of the foreign exchange of the U.S. dollar in comparison to specific foreign currencies.

It offers weightage or importance to currencies that are most popularly used in international trade, instead of comparing the dollar value to every foreign currency. As the currencies are weighted distinctively, the modifications in each currency will have a different effect on the trade-weighted dollar as well as corresponding indexes.

After the U.S. Dollar Index, Trade-Weighted Dollar Index is the primary tool used to measure the strength of the U.S. dollar. It is also reckoned as the Broad Index was introduced in 1998 by the U.S. Federal Reserve Board.

It was created after the integration of the Euro and to reflect the trade patterns of the U.S. more precisely. The Federal Reserve picked 26 currencies for this broad index, envisioning the acceptance of the Euro by 11 countries belonging to the European Union.

Countries Included In The Trade-Weighted Dollar

Index

Here are the countries with the weight on the index –

  • Eurozone – 18.947
  • China – 15.835
  • Canada – 13.384
  • Mexico – 13.524
  • Japan – 6.272
  • United Kingdom – 5.306
  • Korea – 3.322
  • Taiwan – 1.95
  • Singapore – 1.848
  • Brazil – 1.979
  • Malaysia – 1.246
  • Hong Kong – 1.41
  • India – 2.874
  • Switzerland – 2.554
  • Thailand -1.096
  • Australia – 1.395
  • Russia – 0.526
  • Israel – 1.053
  • Sweden – 0.52
  • Indonesia – 0.675
  • Saudi Arabia – 0.499
  • Chile – 0.625
  • Philippines – 0.687
  • Colombia – 0.604
  • Argentina – 0.507

Final Thoughts

Trade-Weighted US Dollar is a broad index that includes countries from all across the world. Traders will also find some developing countries in the broad index list, which makes it a better reflection of the value of the U.S. dollar worldwide.

[wp_quiz id=”97448″]