Today’s article is about definitions. Maybe for those who read us regularly, it is not necessary, but every day new readers approach for whom all this subject of quantitative trading, technical analysis, backtesting, chartismo… etc sounds more or less Chinese. Quantitative trading is my way of understanding trading today. It’s what I do and what I work with. So today I will provide my definition on the subject.
Quantitative Analysis: Talk of Numbers
When we refer to quantitative analysis we are talking about examining numerical variables. In the case of investment or speculation on the stock exchange, we are talking about quotes, volume, indicators, correlations, etc. Other aspects that cannot be reliably quantified, such as the change of the CEO of a company or the results of the presidential elections, are not taken into account. Working on the basis of these numerical variables, quantitative analysis uses mathematical and statistical methods to establish models for developing trading systems.
A quantitative trading system can be very sophisticated and trades highly complex derivative instruments, or it can be a simple system that trades shares. The asset type does not qualify for the type of trading. You need to work with models. I don’t know if you’ve ever heard the phrase: “All models are wrong, but some are useful.” When we refer to quantitative analysis, this is the case. So, indeed, you need to work with models. Why?
I personally have several reasons:
-On the one hand, the models are more accurate than our discretionary judgments. The psychological aspect has an important weight in our decisions.
-We are human and cognitive biases affect our perception of reality. Finding ways to master them is always positive
-They streamline decision-making. Using systems allows you to have a much faster reaction.
-It allows several approaches to be addressed.
-Models or systems give you the framework to work with.
But remember that models are simplifications. In order for a system to be efficient, it needs to cover only part of reality. There is no all-terrain system that never fails and is perfect. Hence, the plan to follow is the use of a portfolio of systems combining different strategies: pairs trading, arbitrations, mean-reverting until even tracking trends.
Working With Odds
In a quantitative trading strategy, you work with probabilities. There are no certainties but probabilistic models to explain the behavior of the market. In algorithmic trading, everything is written. There’s no algorithmic trading without computers.
Quantitative trading, also called algorithmic trading, is a systematic way of trading. It is said that a system does not exist unless its rules are written. Well, in algorithmic trading all rules are written in the computer code of the system. Metrics are used when quantitative trading systems are developed. These metrics and ratios help in the development and use of the system to make decisions.
HFT (high-frequency trading) is quantitative trading, but not all quantitative trading is HFT. It’s understood, right? Quantitative trading is not synonymous with high-frequency trading, nor does it necessarily mean intraday trading. Quantitative analysis can be used perfectly in larger time frames such as daily or even weekly.
What happens is that trading systems that operate in very short periods of time are automatic systems. It is an algorithm that sends the orders to the market and hence the association with algorithmic trading /quantitative.
A trader using a quantitative system may or may not transmit orders automatically to the broker. Transmitting orders automatically is the norm, but it is not mandatory. An automatic system retrieves quotes in real-time directly from the broker or other data provider, executes an algorithm leading to trading signals, and sends orders directly to the broker for execution.
A semi-automatic system, for example, can run the algorithm and generate the input or output signals, but it is you as a trader who is responsible for sending the orders to the broker. The advantage of the automatic system is the reduction of human error. Especially, that kind of human error that causes you as a trader to break the rules of the system. Does it sound like you have made this kind of mistake? It’s impossible to break the rules here. In addition, the obvious advantage is the increase in execution speed, so for systems that work in short time frames, a fully automated system is indispensable.
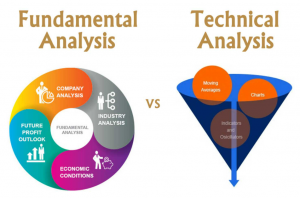
Quantitative Versus Technical Analysis
Quantitative analysis and technical analysis have commonalities, but also fundamental differences in their principles. To clarify the terms, we start by defining what is the technical analysis
The main idea of the technical analysis is that “the price discounts everything”. All the information you need to make your trading decisions is based on quotes, and in some cases also on volume. From quotes, the technical analyst tries to look for recurring patterns that can predict future price behavior.
This is a common point with quantitative analysis, which can also be based (but not necessarily exclusively) on quotations and look for patterns in them. But what differs is the method and the form.
In technical analysis, one way of identifying patterns is chartism. By chartism, we mean figures such as shoulder-head-shoulder, triangles, Elliot waves, etc. Well, chartist analysis based on graphs has a subjective component incompatible with quantitative analysis.
Technical analysis is mainly based on visual examination of charts or charts. By looking at the graphs, trends are established, the points of support and resistance, the crossings of indicators, etc. The technical trader makes his decisions, usually discretionary, looking at the charts and trading according to what he sees.
On the other hand, quantitative trading is not based on what you see in the chart. If you want, you can illustrate your system by plotting the signals on a chart, but it is not essential to generate the input and output signals to the market. Your signals come from the trading system you’ve programmed, not from what your eyes see.
Discretionary or Non-Discretionary
Quantitative trading is not discretionary. Trades are taken according to pre-established rules. The trader who operates on the basis of technical analysis does make discretionary decisions. I’ll tell you about my experience when I only operated by following technical analysis. Perhaps you are familiar with it.
1- You’re in front of the screen.
2- You are convinced that now is a good time to do a trade.
3- You look for any sign on the chart. You look, you look and you look.
4- In the end, you end up performing an operation, but based on the emotion and your previous belief that conditions you.
5- Evidently, then you try to justify the operation by arguing technical reasons: that if it looked like a certain figure, that if the resistance X would break, all this only to justify a decision not 100% rational and influenced by your cognitive biases.
Down Theory
The second idea on which technical analysis is based is Down theory. According to this theory, prices are driven by trends. The trader that operates on the basis of technical analysis tries to take advantage of these trends to obtain profitable trades.
Quantitative analysis is not based on this theory. It does not blindly accept that prices follow trends. What you are looking for is to analyze for each asset and time frame how its behavior is. From the results of the analysis, look for the best way to take advantage of the behavior studied.
Backtesting is something that distinguishes quantitative trading from discretionary trading. When you operate a quantitative trading system it’s because you’ve done a backtest before. Discretionary trading cannot backtest because the entry and exit conditions are not the same over time.
Conclusion
Remember that we already said at the beginning of this article, the main characteristic of quantitative trading is that it is based on mathematical and statistical models. Chartist figures, Elliot waves, and hunches are not incorporated here. It is not worth it if in the graph I see a flag or a bat, if I am in wave 4 of the extended third or if it is an ABC. There is no place at all for a subjective opinion. Only data matters. Then we can already say that it is the opposite of discretionary trading.
In quantitative trading, decisions to buy and sell assets, whether shares, ETFs, futures, forex, etc- are based on a computer algorithm. Hence quantitative trading is also known as algorithmic trading. The starting point of a quantitative trading system is data. What types of data? The system can incorporate quotation data such as price and volume, global economic data such as interest rates or inflation, asset financial ratios such as cash flow, income, DTE, EPS, etc.
A technical analysis strategy can be part of a quantitative system if it can be coded. However, not all technical analysis can be included in the quantitative, for example, some chartist techniques are subjective, cannot be quantified, and need candles in the future for the confirmation of the figure. Let’s say one of the differences is in the quality of the analysis. Many technical analysts look for patterns that they say repeat themselves, but cannot prove how often statistics these patterns precede certain price movements.

