Categories
Forex Signals

EUR/GBP Violates Descending Triangle Pattern – Sell Signal In Play! 

The EUR/GBP pair is trading with a bearish bias at a 0.8930 level, having violated the support level of 0.8940. The Euro seems to get weaker as the European countries have tightened measures to fight coronavirus after a brief relaxation over the Christmas and New Year period. They have re-imposed lockdowns, closed shops and offices, and introduced laws to make it easier for governments to impose further restrictions to battle the pandemic. 

These new lockdown measures across Europe to fight the second wave of coronavirus raised the fears of a double-dip recession in the Eurozone that added weight on the single currency Euro and capped further upside in the EUR/USD pair on Tuesday.

The Sterling is gaining strength as Bailey said that there were many issues with cutting interest rates below zero, and such a move could hurt banks. After these comments from Bailey, the British Pound gained traction and raised that ultimately pushed the EUR/GBP pair lower.

Meanwhile, The Deputy Governor of Bank of England, Ben Broadbent, said on Tuesday that Britain’s coronavirus pandemic was likely to have a limited long-run impact on inflation and has led to less short-term downward pressure on prices than might have been expected from the slump in headline economic output.

On the technical side, the EUR/GBP has violated the support level of 0.8940, and now it’s likely to extend the selling trend until it reaches 0.8873. The MACD and RSI are in support of selling; thus, we have entered the selling trade in the EUR/GBP pair. Here’s a trading plan…


Entry Price – Sell 0.89138

Stop Loss – 0.89538

Take Profit – 0.88738

Risk to Reward – 1:1

Profit & Loss Per Standard Lot = -$400/ +$400

Profit & Loss Per Micro Lot = -$40/ +$40

Fellas, now you can check out forex trading signals via Forex Academy mobile app. Follow the links below.

iPhone Users: https://apps.apple.com/es/app/fasignals/id1521281368

Andriod Users: https://play.google.com/store/apps/details?id=academy.forex.thesignal&hl=en_US


Categories
Forex Market Analysis

Daily F.X. Analysis, January 13 – Top Trade Setups In Forex – U.S. Inflation Report in Focus! 

On the news front, eyes will remain on the ECB President Lagarde Speaks as she may discuss the upcoming monetary policy event; however, the major focus will remain on the U.S. Inflation rates, which may help determine the further direction of the U.S. dollar.

Economic Events to Watch Today  


EUR/USD – Daily Analysis

The EUR/USD closed at 1.22077 after placing a high of 1.22095 and a low of 1.21369. After falling for three consecutive sessions, the EUR/USD pair rose on Tuesday as the U.S. dollar eased and U.S. Treasury declined. The U.S. Dollar had hit a more than two and half year lowest level in January after sliding for months as the U.S. Federal Reserve cut its interest rates and speculation of heavy rounds of fiscal stimulus under President-elect Joe Biden’s tenure. However, after Democrats won the Georgia runoff elections, the hopes for massive stimulus packages increased, and the U.S. Treasury yields started to rise that ultimately lifted the U.S. dollar.

This rise in the U.S. dollar weighed heavily on EUR/USD pair during last week; however, the recent rally in U.S. Treasury yields ran out of the stream, and the dollar came back to its previous levels. The U.S. Treasury yield on a 10-year note reached a 10-month high on Tuesday but ultimately had a reverse effect and weighed on the U.S. dollar. This slide-in U.S. dollar added gains in EUR/USD pair on Tuesday as the investors started taking profits. Meanwhile, on Tuesday, the Turkish President Recep Tayyip Erdogan said that country was ready to settle its frayed relationship with the European Union back on track and called on the 27 nation bloc to display the same determination. 

These new lockdown measures across Europe to fight the second wave of coronavirus raised the fears of a double-dip recession in the Eurozone that added weight on the single currency Euro and capped further upside in the EUR/USD pair on Tuesday.

On the data front, there was no macroeconomic data to be released from Europe while from the U.S., at 16:00 GMT, the NFIB Small Business Index for December dropped to 95.9 against the expected 100.1 and weighed on the U.S. dollar that ultimately added in the gains of EUR/USD pair. At 20:00 GMT, the JOLTS Job Openings for November rose to 6.53M against the expected 6.42M and supported the U.S. dollar that capped further gains in EUR/USD pair. At 20:02 GMT, the IBD/TIPP Economic Optimism came in line with the forecasts of 50.1.

Daily Technical Levels

Support   Resistance

1.2159     1.2234

1.2111     1.2259

1.2085     1.2308

Pivot point: 1.2185

EUR/USD– Trading Tip

The EUR/USD is gaining support at the 1.2200 level, and below this, it can dip further until the 1.2189 level. On the higher side, the pair may face resistance at the 1.2226 level, and a bullish breakout of this level can extend the buying trend until 1.2260. The RSI and MACD support a bullish trend, but there’s a chance of bearish correction upon the violation of 1.2190. On the 4 hour timeframe, the EUR/USD pair may face resistance at the 1.2220 level, which is extended by a downward trendline.


GBP/USD – Daily Analysis

The GBP/USD closed at 1.36645 after placing a high of 1.36702 and a low of 1.34932. After falling for four consecutive sessions, the GBP/USD pair raised on Tuesday after Sterling strengthened amid the Bank of England’s positive comments. The Pound Sterling jumped against the U.S. dollar and the Euro on Tuesday as comments from the Bank of England’s governor Andrew Bailey on the viability of negative interest rates dampened some sub-zero rates’ expectations in the U.K. 

Bailey said that there were many issues with cutting interest rates below zero, and such a move could hurt banks. After these comments from Bailey, the British Pound gained traction and raised that ultimately pushed the GBP/USD pair higher on Tuesday.

Meanwhile, The Deputy Governor of Bank of England, Ben Broadbent, said on Tuesday that Britain’s coronavirus pandemic was likely to have a limited long-run impact on inflation and has led to less short-term downward pressure on prices than might have been expected from the slump in headline economic output. Broadbent said that a smaller slowdown in inflation reflected shifts in consumer demand during the pandemic that had led to temporary capacity constraints in businesses, as well as support to household incomes from government furlough schemes.

On the data front, at 05:01 GMT, the BRC Retail Sales Monitor for the year for December dropped to 4.8% against the expected 5.9% and weighed on British Pound and capped further upside in GBP/USD pair. From the U.S. side, at 16:00 GMT, the NFIB Small Business Index for December declined to 95.9 against the projected 100.1 and weighed on the U.S. dollar that ultimately added the gains of the GBP/USD pair. At 20:00 GMT, the JOLTS Job Openings for November surged to 6.53M against the projected 6.42M and supported the U.S. dollar that capped further GBP/USD pair gains. At 20:02 GMT, the IBD/TIPP Economic Optimism came in line with the projections of 50.1.

On the other hand, the U.S. dollar was also weak on Tuesday as the U.S. Dollar Index dropped as investors kept an eye on U.S. politics while pressure continued to grow to impeach President Donald Trump. Furthermore, the U.S. dollar was also weak as the prospects of massive stimulus packages from Joe Biden’s government raised as he has shown a willingness to add trillions in new relief bills that ultimately supported the upward momentum of the GBP/USD pair.

Daily Technical Levels

Support   Resistance

1.3555     1.3722

1.3445     1.3781

1.3387     1.3890

Pivot point: 1.3613

GBP/USD– Trading Tip

The GBP/USD is trading at 1.3692, and it has closed a doji candle on the four hourly timeframes, and it may extend a bearish correction in the GBP/USD pair. On the lower side, the support stays at 1.3636 and resistance at 1.3692 and 1.3720 today. The GBP/USD pair’s 10 & 20 periods EMA is supporting bullish bias in the Sterling. The MACD and RSI thesupport bullish bias; therefore, bullish bias dominates over the 1.3646 level today.


USD/JPY – Daily Analysis

The USD/JPY pair closed at 103.749 after placing a high of 104.333 and a low of 103.718. After rising for four consecutive days, the USD/JPY pair dropped on Tuesday amid the slide in the U.S. dollar. The U.S. dollar index dropped to fresh weekly lows in the 90.20 level as hopes for additional fiscal stimulus raised and provided support to high yielding equities. The House of Representatives introduced an impeachment article against U.S. President Donald Trump that weighed on the U.S. dollar and dragged the pair USD/JPY on the downside.

The U.S. Dollar Index (DXY) fell almost 0.3% on Tuesday against its rivals, while the 10-year U.S. Treasury yields dropped to a session’s low of 1.146%. The U.S. stocks opened higher on Tuesday and recovered from the previous session’s losses, with investors looking for additional fiscal stimulus amid continued political turmoil. The Dow Jones Industrial Average was down by 0.3%, and the S&P 500 was down by 0.6% lower while NASDAQ was low by 1.2%.

On the data front, at 04:50 GMT, the Bank Lending for the year from Japan dropped to 6.2% against the forecasted 6.5% and weighed on the Japanese Yen that capped further losses in the USD/JPY pair. The Current Account Balance from Japan for November raised to 2.34T against the forecasted 2.00T and supported the Japanese Yen that ultimately added the USD/JPY pair’s losses. At 10:00 GMT, the Economic Watchers Sentiment dropped to 35.5 against the expected 36.9 and weighed on the Japanese Yen, which capped further losses in the USD/JPY pair.

From the U.S. side, at 16:00 GMT, the NFIB Small Business Index for December decreased to 95.9 against the anticipated 100.1 and weighed on the U.S. dollar that ultimately added further losses in the USD/JPY pair. At 20:00 GMT, the JOLTS Job Openings for November increased to 6.53M against the anticipated 6.42M and supported the U.S. dollar that capped further losses in the USD/JPY pair. At 20:02 GMT, the IBD/TIPP Economic Optimism came in line with the anticipations of 50.1.

Meanwhile, the safe-haven appeal rose on Tuesday after fears rose that there could be further disruptions in the days leading up to Biden’s inauguration on January 20. FBI has said that it has received information specifying that armed protests were being planned at all 50 state capitols and Washington. The FBI’s comments raised the safe-haven appeal and supported the safe-haven Japanese Yen that ultimately added the USD/JPY pair’s losses on Tuesday.

On Tuesday, Federal Reserve Governor Lael Brainard said that the federal banking agencies were in the process of enlisting requests for information on the risk management of artificial intelligence applications in financial services. Whereas, the Boston Federal Reserve Bank President Eric Rosengren said that the U.S. economy could see a strong rebound in the second half of this year as vaccinations became widely available and that monetary policy will remain accommodative. However, the virus was still driving the economy. The losses in USD/JPY pair were also capped on Tuesday after the Donald Trump administration said that it was releasing millions of coronavirus vaccine doses and urged states to offer them to all Americans over age 65 or with chronic health conditions.

Daily Technical Levels

Support   Resistance

103.53     104.16

103.31     104.56

102.91     104.78

Pivot point: 103.94

USD/JPY – Trading Tips

The safe-haven currency pair USD/JPY slipped to trade at 103.623 level amid increased demand for safe-haven assets. On the lower side, the USD/JPY pair has completed 38.2% Fibonacci retracement at 103.611 level, and on the further lower side, the USD/JPY pair may find support at 50% Fibonacci level of 103.400 level. The MACD and RSI support selling bias; therefore, we may find support at the 103.283 level. Let’s consider taking the buying trade over the 103.283 level and selling below the same. Good luck! 

Categories
Crypto Market Analysis

Daily Crypto Review, Jan 12 – XLM Back in the top10 Cryptos by Market Cap; Crypto Sector in the Green

The crypto sector has experienced a rally that brought the market to its feed after yesterday’s dip. One of the best daily performers was Stellar Lumens (XLM), which shot up in the past week on great fundamentals (and once again today), gaining over 30% just a couple of hours, reentering the top10 cryptocurrencies by market cap.

Bitcoin is currently trading for $35,887, representing an increase of 1.28% compared to yesterday’s value. Meanwhile, Ethereum’s price has increased by 1.89% on the day, while LTC lost 1.85% of its value.

Daily Crypto Sector Heat Map

Amun Bitcoin 3x Daily Short gained 1186.87% in the past 24 hours, making it the most prominent daily crypto gainer by far. It is followed by PengolinCoin’s 366.58% and Firdaos’s 330.42% gain. On the other hand, Zugacoin lost 94.92%, making it the most prominent daily loser. It is followed by the True Segniorage Dollar’s loss of 85.08% and Zero Collateral Dai’s loss of 62.33%.

Top 10 24-hour Performers (Click to enlarge)

Bottom 10 24-hour Performers (Click to enlarge)

Bitcoin’s market dominance has moved up very slightly since our last report, with its value currently being 68.7%. This value represents a 0.1% difference to the upside than the value it had when we last reported.

Daily Crypto Market Cap Chart

The cryptocurrency sector’s capitalization has increased since we last reported, with its current value being $964.21 trillion. This represents a $58.14 billion increase when compared to our previous report.

_______________________________________________________________________

What happened in the past 24 hours?

_______________________________________________________________________

_______________________________________________________________________

Technical analysis

_______________________________________________________________________

Bitcoin

Bitcoin managed to stop its descending move and push up slightly after pulling back to the $30,000 mark. The largest cryptocurrency by market cap has (on decreasing volume) seen a price increase to just below the $36,640 level. Many speculate that, while the drop was considered very healthy overall, the institutions bought even more BTC, which brought its price up without affecting the volume as much.

However, BTC/USD doesn’t seem like it currently has the strength to pass the $36,640 level, which may cause another downturn.

BTC/USD 1-hour chart

Bitcoin’s technicals on the daily and weekly time-frame are completely bullish. However, its monthly overview shows slightly less bullishness, while its 4-hour chart is completely bearish.

BTC/USD 1-day Technicals

Technical factors (1-hour Chart):

  • Price is between its 50-period EMA and its 21-period EMA
  • Price is near its middle Bollinger band
  • RSI is neutral (54.63)
  • Volume is descending to average

Key levels to the upside:          Key levels to the downside:

1: $36,640                             1: $33,200

2: $40,000                             2: $30,640

3: $42,000                             3: $27,960

Ethereum

Ethereum has once again matched Bitcoin in direction after hitting the $907 support level, and changed its price direction by pushing to the upside. The second-largest cryptocurrency by market cap is back at its peak from yesterday and seems like it cannot pass $1,129 with conviction at the moment.

Ethereum’s 21-hour and 50-hour moving averages play a major role and should be taken into account when looking for support or resistance levels.

ETH/USD 1-hour Chart

Ethereum’s technicals on the daily and weekly time-frame are completely bullish. However, its monthly overview shows slightly less bullishness, while its 4-hour chart is completely bearish.

ETH/USD 1-day Technicals

Technical Factors (1-hour Chart):

  • Price is between its 50-period and its 21-period EMA
  • Price is between its middle and top Bollinger band
  • RSI is neutral (53.69)
  • Volume is descending to average

Key levels to the upside:          Key levels to the downside:

1: $1,129                               1: $1,060.5

2: $1,211                               2: $1,047.5

3: $1,226.5                             3: $992

Litecoin

Even though Litecoin did follow Bitcoin’s price direction, it did so with less intensity, causing it to ultimately be in the red for the day. Its price is now at a major crossroads, as it is fighting for the $142.1 level. This pivot point will decide whether the price will immediately push towards the upside or downside.

Litecoin has created a strong resistance level near the $150 mark, and traders should pay great attention to it when trading.


LTC/USD 1-hour Chart

Litecoin’s technicals on the daily and monthly time-frame are completely bullish. However, its weekly overview shows slightly less bullishness, while its 4-hour chart is completely bearish.

LTC/USD 1-day Technicals

Technical factors (1-hour Chart):

  • Its price is between its 50-period EMA and its 21-period EMA
  • Price between its middle and bottom Bollinger band
  • RSI is neutral (50.33)
  • Volume is descending to average levels

Key levels to the upside:          Key levels to the downside:

1: $161.5                               1: $142.1

2: $181.3                               2: $128.42

3: $186.3                               3: $114.75

Categories
Forex Market Analysis

Daily F.X. Analysis, January 12 – Top Trade Setups In Forex – Stronger Dollar In Play! 

On the fundamental side, the economic calendar is likely to offer a thin trading volume, and it may offer thin volatility to the market. However, the focus can remain on the MPC Member Broadbent Speaks due to the European session today.

Economic Events to Watch Today  


EUR/USD – Daily Analysis

The EUR/USD closed at 1.21499 after placing a high of 1.22258 and a low of 1.21320. The currency pair extended its losses on Monday and dropped for the third consecutive day amid the broad-based U.S. dollar strength. On Monday, the rising risk-off market mood strengthened the U.S. dollar following the news that China was intensifying coronavirus measures to limit the nation’s rising infection rate. Whereas, greenback investors were also optimistic that President-elect Joe Biden would push for a multi-trillion-dollar stimulus package.

The growing concerns over an increasing number of coronavirus cases throughout Europe and China increased the demand for safe-haven, weighing on the risk perceived EUR/USD pair on Monday. The World Health Organization (WHO) has announced on European countries to curb a new variant of coronavirus that was first detected in the U.K.

The WHO Europe director Hans Kluge has said that coronavirus’s new variant has hit almost 22 European nations, and it was an alarming situation. Many countries have imposed a full national lockdown to stop it from spreading further. However, Hans said that tougher measures were needed to flatten the steep vertical line of rising cases in some countries. These warnings by WHO also raised safe-haven appeal and added losses in the risk-sensitive EUR/USD pair on Monday.

There was no data to be released from the U.S. side on the data front, while from Europe, at 14:30 GMT, the Sentix Investor Confidence dropped to 1.3 against the forecasted 2.0 and weighed on Euro that ultimately added further losses in EUR/USD currency pair. 

On the U.S. front, the recent hike in the greenback was largely a result of higher U.S. Treasury yields that has resulted in a U.S. dollar short squeeze and pushed the greenback to higher levels. The U.S. Dollar Index continued to move higher and has climbed to 90.67, up by 0.67% on the day that added more weight on EUR/USD pair on Monday. 

The greenback was also strong on Monday amid the optimism regarding the prospects of massive stimulus packages from the president-elect Joe Biden. The incoming President has vowed to deliver two major stimulus packages in 2021. He has also said that his first order after joining the office on January 20 will be to increase the number of direct payments to $2000. This has also supported the U.S. dollar and weighed on EUR/USD pair on Monday.

Daily Technical Levels

Support   Resistance

1.2171      1.2215

1.2155      1.2243

1.2127      1.2259

Pivot Point: 1.2199

EUR/USD– Trading Tip

The EUR/USD is obtaining support at the 1.2144 level, and below this, it can dip further until the 1.2100 level. On the higher side, the pair may face resistance at the 1.2216 level. The RSI and MACD support bullish correction and may prompt a bounce off in the EUR/USD pair until the 1.2216 level. Beneath 1.2216, we can again see a dip in EUR/USD. On the hourly timeframe, the EUR/USD pair may find resistance at 1.2170, but the bullish crossover may offer us a quick buy position as the MACD supports the buying trend in the EUR/USD pair today. 


GBP/USD – Daily Analysis

The GBP/USD closed at 1.35100 after placing a high of 1.35679 and a low of 1.34507. The GBP/USD pair lost ground on Monday and dropped to a fresh 2-weeks lowest level amid the broad-based U.S. dollar strength. The pair GBP/USD witnessed some selling for the fourth consecutive session on Monday and extended its retracement slide from 33-months highs. The momentum drew the GBP/USD pair further below as the strong rally in the U.S. Treasury bond yields supported the U.S. dollar. The greenback recovered from nearly three-year lowest level after the treasury yields rally amid the hopes of additional U.S. fiscal stimulus measures. Investors started pricing in the prospects for a more aggressive U.S. fiscal spending in 2021 after the Democratic sweep in the U.S. Senate runoff elections in Georgia.

Meanwhile, the concerns about the surge in new coronavirus cases and the new tougher restrictions in Europe and China to fight against the new variant also weighed on the market sentiment as the safe-haven appeal emerged and contributed to the GBP/USD pair’s decline on Monday.

On Monday, England’s chief medical officer Chris Whitty said that the United Kingdom was enrolling its most challenging weeks since the start of the coronavirus pandemic as hospitals were overrun. He said that the U.K. was now at the worst point of the pandemic, and although they will have the vaccine in the future, the numbers were higher than they were in the previous peak. 

The U.K. has already suffered more deaths due to the new variant than any European nation and recently became the fifth nation on earth to reach the grim milestone of three million cases. Whitty said that there were currently more than 30,000 patients in the hospital than 18,000 during the first peek of the virus in April. Despite the nationwide lockdown, the rising number of coronavirus cases in the U.K. also weighed on the British Pound that ultimately added losses in the GBP/USD pair.

Moreover, the Bank of England policymaker Silvana Tenreyro announced on Monday that skipping British interest rates beneath zero could promote the economy by more than increasing bond purchases. The Bank of England was currently looking at Britain’s financial system’s negative rates’ technical feasibility. She said that she was pushing back against arguments that negative interest rates would be ineffective in boosting demand or would cause significant damage to the bank’s profitability. 

These dovish comments from Tenreyro weighed on British Pound that added losses in the GBP/USD currency pair on Monday.

Daily Technical Levels

Support   Resistance

1.3496      1.3553

1.3475      1.3589

1.3439      1.3611

Pivot Point: 1.3532

GBP/USD– Trading Tip

The GBP/USD has disrupted the sideways trading range of 1.3531- 1.3505 range on the higher side. Closing of candles above this area can trigger buying until the next resistance level of 1.3585 level. On the higher side, the resistance continues to stay at the 1.3605 mark. The 10 & 20 periods moving averages are suggesting odds of bullish trend continuation today. 


USD/JPY – Daily Analysis

The USD/JPY pair was closed at 104.239 after placing a high of 104.396 and a low of 103.848. The currency pair USD/JPY rose for the fourth consecutive session on Monday and reached its highest level since December 10. The gains in USD/JPY were due to the stronger greenback as the U.S. Dollar Index was at weekly highs above 90.50 level on Monday. Wall Street’s main indexes were down on Monday, with Dow Jones down by 0.37% and the NASDAQ by 0.85%. The U.S. Treasury yield on a 10-year note hit the 1.136% level, which was the highest level since the March spike.

The rising treasury yields were due to the rising hopes of additional stimulus measures from the incoming Democratic President Joe Biden. He has promised to deliver two massive stimulus packages to aid the economy through the coronavirus pandemic in 2021. He also has said that his first order after joining the office on January 20 will be to increase the number of stimulus checks to $2000 from $600, which will be given to most Americans affected by the coronavirus pandemic.

Other than that, the USD/JPY pair continued to rise despite the rising risk-off market sentiment in the market. Mainland China saw its most significant daily rise in coronavirus cases in over five months. China’s health authority said on Monday that the new infections in Hebei province surrounding Beijing were continuously rising.

China saw almost 18 new imported infections from overseas, and on Monday, the country in northeastern Heilongjiang province moved into lockdown after reporting new coronavirus infections. These developments in the world’s second-largest economy added weight to risk sentiment that ultimately supported the safe-haven greenback and pushed the USD/JPY pair higher.

Meanwhile, the calls for Trump’s impeachment raised after he encouraged his supporters’ riots on Capitol Hill during the previous week that also kept the market sentiment soar. In Washington, the speaker of House of Representatives, Nancy Pelosi, called for Vice President Mike Pence and the cabinet to remove Donald Trump from office before moving to impeachment. This also helped raised the risk-off market sentiment and supported the USD/JPY pair’s upward momentum.

Furthermore, on Monday, the President and chief executive officer of the Federal Reserve Bank of Atlanta, Raphael Bostic, said that interest rates could rise sooner than anticipated as the economy was recovering more quickly than projected from the coronavirus damage. 

Fed had previously hoped that rates would remain unchanged until at least 2023, whereas Bostic believes that the Fed’s emergency measures to fight the pandemic can start to be rolled back within the next two years, if not sooner. These comments from Bostic supported the U.S. dollar and added gains in the USD/JPY pair. However, the Federal Reserve Chairman Jerome Powell will deliver a speech on Thursday and reaffirm interest rates to stay around zero through at least 2023.

Daily Technical Levels

Support   Resistance

103.90      104.17

103.74      104.26

103.64      104.43

Pivot Point: 104.00

USD/JPY – Trading Tips

On Tuesday, the safe-haven currency pair USD/JPY is trading at 104.123 level, facing resistance at 104.400. On the 4 hour timeframe, the USD/JPY pair implies bullish bias, and as the 10 and 20 EMA are in support of upward trend whereas the MACD stays over 0, suggesting a bullish trend in the safe-haven USD/JPY pair. An upward breakout of the 104.223 level can extend the buying trend until the 104.610 level today. Let’s consider taking the buying trade over the 104.223 level and selling below the same. Good luck! 

Categories
Forex Elliott Wave Forex Market Analysis

Is US Dollar Index Ready for a Rally?

The US Dollar Index reveals exhaustion signals of its bearish trend. A trend that remains in progress since the currency basket topped at 102.992 pm mid-March 2020. Follow with us what signs show the Greenback to expect a rally during the first quarter of the year.

Technical Overview

The big picture of the US Dollar Index (DXY) illustrated in the next weekly chart reveals the downtrend that remains active since the price found fresh sellers at 102.992 in mid-March 2020. The following figure also exposes the market participants’ sentiment represented by the 52-week high and low range.

The previous figure shows the extreme bearish sentiment dominating the big participants’ bias since mid-March 2020. Nevertheless, the long-tailed candlestick corresponding to the last trading week that was closed above the yearly opening, suggests the bearish trend’s exhaustion in progress.

On the other hand, the reading -4.26 observed in the EMA(52) to Close Index suggests the currency basket is oversold; thus, a potential corrective rally could occur in the coming weeks.

The mid-term Elliott wave view of the US Dollar Index exposed in the next 8-hour chart suggests completing an extended third wave of Minute degree labeled in black, when the price found support at 89.209 on January 06th.

Once the price found support, the price started to bounce, developing an incomplete wave (a) of Minuette degree identified in blue, which belongs to wave ((iv)) in black. Finally, the momentum and timing oscillator suggests that the bearish pressure persists, and the current upward movement could correspond to a corrective rally.

Technical Outlook

The mid-term outlook for the US Dollar Index unfolded in the next 8-hour chart shows the incomplete wave ((iv)) in black, which advances in wave (a) identified in blue. In this context, the current climb experienced by the Greenback could be a corrective rally.

According to Elliott Wave theory, the fourth wave in progress could retrace to 50% of wave ((iii)),  and reach 91.205. Likewise, considering that the second wave was a simple correction in terms of price and time, the current fourth wave should be complex in terms of price, time, or both. 

On the other hand, if the price extends beyond 50%, this could indicate weakness in the bearish pressure. If the price action advances above 92.107, the bearish scenario will be invalidated leading us to expect more upward movement.

In summary

The US Dollar Index completed a bearish third wave of Minute degree at 89.209 on January 06th, when it began to bounce, starting an upward corrective rally that remains in progress. The current intraday movement could reach 91.206 where the price could complete its wave (a) of Minuette degree labeled in blue. On the other hand, considering the alternation principle, the current corrective formation, the structure should be complex in terms of price, time, or both. Finally, the bearish scenario’s invalidation level locates at 92.107, corresponding to the end of wave ((i)) in black.

Categories
Forex Signals

AUD/USD Violates Ascending Triangle – Double Bottom Support! 

The AUD/USD closed at 0.77665 after placing a high of 0.77984 and a low of 0.77280. The currency pair AUD/USD remained flat throughout the day on Friday and closed its day at the same level it began its day with as the risk rally pushed the pair higher and the US dollar strength dragged the pair AUD/USD lower at the same time. 

The risk-sensitive Aussie just went with the flow and boosted by rallying equities and persistent hopes that the economic chaos triggered by the coronavirus pandemic was on its final stage. The risk sentiment in the market was also supported by the latest announcement from the UK on Friday. The UK announced that it’s medical regulatory has approved a third vaccine for coronavirus made by Moderna for emergency use authorization. 

The rising risk sentiment was also supported by the decreasing political risk in Washington related to power transition. The US President Donald Trump has agreed to a transition of power, and this has raised the risk sentiment in the market and supported the upward momentum in AUD/USD pair in the early trading session. However, the AUD/USD pair’s gains were lost in the late trading hours on Friday after the US Dollar became strong across the board. The greenback was high on Friday, with the US Dollar Index above the 90.00 level for the first time this week. The US treasury yields on the 10-year note were also high on Friday, with 3% up for the day and 21% up for the week. All these factors added to the US dollar demand that ultimately weighed on AUD/USD pair and forced the pair to lose its early daily gains.

On the data front, from the US side, at 18:30 GMT, the Average Hourly Earnings for December raised to 0.8% against the predicted 0.2% and supported the US dollar that added further weight to AUD/USD pair. In December, the Non-Farm Employment Change plunged to -140K against the predicted 60K and weighed on the US dollar. During December, the Unemployment Rate plunged to 6.7% against the predicted 6.8% and supported the US dollar that added further AUD/USD pair losses. At 20:00 GMT, the Final Wholesales Inventories for November came in as 0.0% against the predicted -0.1% and weighed on the US dollar.

The AUD/USD pair remained flat throughout Friday amid the mixed market sentiment and left the investors to await the publication of the final reading of November Retail Sales from Australia while China will provide an update on inflation that will also remain under close observation by AUD/USD investors. 

On Thursday, China will release its December Trade Balance that may also impact AUD/USD pair. The US’s CPI data on Wednesday and Retail Sales on Thursday will also affect the AUD/USD pair’s momentum in upcoming days.


Daily Technical Levels

Support Resistance

0.7700 0.7755

0.7679 0.7789

0.7645 0.7811

Pivot point: 0.7734

The AUD/USD pair has bounced off over the 0.7690 level, forming a bullish engulfing candle on the 2-hour timeframe. It may bounce off to trade until the 0.7740 level, where 10 & 20 periods EMA are likely to extend resistance at 0.7740. On the lower side, the AUD/USD may find support at the 0.7690 level. A bearish breakout of 0.7690 level can extend the selling trend until the next support area of 0.765 level today. Good luck! 

Categories
Crypto Market Analysis

Daily Crypto Review, Jan 11 – Crypto Sector Plummets as BTC Drops to $32k

The crypto sector experienced dipped over $100 billion in market cap as Bitcoin, and the rest of the market plummeted. Bitcoin is currently trading for $35,165, representing a decrease of 13.31% compared to yesterday’s value. Meanwhile, Ethereum’s price has dropped up to 20.64% on the day, while LTC lost 23.04% of its value.

Daily Crypto Sector Heat Map

Foglory Coin gained 589.61% in the past 24 hours, making it the most prominent daily crypto gainer by far. It is followed by NewsToken’s 175.33% and BELIEVER’s 166.3% gain. On the other hand, True Seigniorage Dollar lost 78.35%, making it the most prominent daily loser. It is followed by the 3x Long Bitcoin SV Token’s loss of 76.74% and 3x long EOS Token’s loss of 69.18%.

Top 10 24-hour Performers (Click to enlarge)

Bottom 10 24-hour Performers (Click to enlarge)

Bitcoin’s market dominance has moved down over a percent since our last report, with its value currently being 68.6%. This value represents a 1.2% difference to the upside than the value it had when we last reported.

Daily Crypto Market Cap Chart

The cryptocurrency sector capitalization has decreased slightly since we last reported, with its current value being $906.07 1,03 trillion. This represents a $2 billion decrease when compared to our previous report.

_______________________________________________________________________

What happened in the past 24 hours?

_______________________________________________________________________

_______________________________________________________________________

Technical analysis

_______________________________________________________________________

Bitcoin

Bitcoin has had an interesting weekend, with its price plummeting in recent hours. Its price dipped to the lows of $32,330 just a few hours ago as major buy positions got liquidated. The largest cryptocurrency by market cap slowly fell below the 21 and 50 moving averages, confirmed its position below then, and then headed straight to the downside with almost no pushback.

However, bulls picked up the pace and are currently fighting for the $35,000 level. Investors used this as a buying/accumulation opportunity, while most traders got liquidated (both short and long positions due to the sudden volatility).

BTC/USD 1-hour chart

Bitcoin’s technicals on the daily, weekly, and monthly time-frame show a tilt towards the buy-side with no or slight signs of neutrality, while its 4-hour overview shows a slight tilt towards the sell-side.

BTC/USD 1-day Technicals

Technical factors (1-hour Chart):

  • Price is below both its 50-period EMA and its 21-period EMA
  • Price is near its bottom Bollinger band
  • RSI is near the oversold territory (37.28)
  • Volume is above average

Key levels to the upside:          Key levels to the downside:

1: $36,640                             1: $33,200

2: $40,000                             2: $30,640

3: $42,000                             3: $27,960

Ethereum

Ethereum matched Bitcoin in direction, but did so with increased intensity. The second-largest cryptocurrency by market cap dipped over 20% on the day as its price fell to just above $1,000. This level seems to have held quite nicely, creating space for Ether to recover.

Ethereum is now trading above the $1,060.5 support level and shows no signs of falling again. However, Bitcoin’s movement will greatly affect the future price direction of ETH.


ETH/USD 1-hour Chart

Ethereum’s technicals on the daily, weekly, and monthly time-frame show a tilt towards the buy-side with no or slight signs of neutrality, while its 4-hour overview shows a slight tilt towards the sell-side.

ETH/USD 1-day Technicals

Technical Factors (1-hour Chart):

  • Price is below both its 50-period and its 21-period EMA
  • Price is near its bottom Bollinger band
  • RSI is near the oversold (31.12)
  • Volume is significantly above-average

Key levels to the upside:          Key levels to the downside:

1: $1,129                               1: $1,060.5

2: $1,211                               2: $1,047.5

3: $1,226.5                             3: $992

Litecoin

Litecoin was one of the major gainers today as well, with its price dropping from $172 all the way down to $124. While bulls did pick up the pace and returned its price to the ~$140 zone, Litecoin is still fighting to maintain its position and tackle the $142.1 level.

Litecoin seemingly got hit the hardest out of the three cryptocurrencies, with its price position still being fairly uncertain. This could prove to be a trading opportunity as the cryptocurrency might make a move independent of Bitcoin’s move in the short future (if Bitcoin itself doesn’t move first).


LTC/USD 1-hour Chart

Litecoin’s technicals on the daily, weekly, and monthly time-frame show a tilt towards the buy-side with slight signs of neutrality, while its 4-hour overview shows a strong tilt towards the sell-side.

LTC/USD 1-day Technicals

Technical factors (1-hour Chart):

  • Its price is currently below both its 50-period EMA and its 21-period EMA
  • Price near its bottom Bollinger band
  • RSI is in the oversold territory (29.68)
  • Volume is on above-average levels

Key levels to the upside:          Key levels to the downside:

1: $161.5                               1: $142.1

2: $181.3                               2: $128.42

3: $186.3                               3: $114.75

Categories
Forex Market Analysis

Daily F.X. Analysis, January 11 – Top Trade Setups In Forex – Stronger Dollar In Play! 

On the news side, the European Sentix Investor Confidence will be in focus, along with speeches from UK MPC Member Tenreyro, and the U.S. FOMC Member Bostic will remain in highlights. The U.S. dollar was also strong on the board, mainly because of the rising U.S. treasury yields that rose more than 3% on the day. The unemployment rate and average hourly earnings data from the U.S. support the greenback. 

Economic Events to Watch Today  


EUR/USD – Daily Analysis

The EUR/USD pair was closed at 1.22122 after placing a high of 1.22844 and a low of 1.21928. The EUR/USD pair dropped on Friday and extended its losses amid the broad-based strength of the U.S. dollar on the day amid the rising U.S. Treasury yields.

The U.S. dollar was also strong on the board, mainly because of the rising U.S. treasury yields that rose more than 3% on the day. The unemployment rate and Average Hourly earnings data from the U.S. also supported the greenback that ultimately added further losses in the currency pair EUR/USD. From the U.S. side, at 18:30 GMT, the Average Hourly Earnings for December rose to 0.8% against the forecasted 0.2% and supported the U.S. dollar and weighed on EUR/USD prices. In December, the Non-Farm Employment Change fell to -140K against the forecasted 60K and weighed on the U.S. dollar and capped further losses in EUR/USD pair. 

During December, the Unemployment Rate fell to 6.7% against the forecasted 6.8% and supported the U.S. dollar that added further EUR/USD pair losses. At 20:00 GMT, the Final Wholesales Inventories for November came in as 0.0% against the forecasted -0.1% and weighed on the U.S. dollar that limited the losses in EUR/USD pair on Friday.

Meanwhile, the fact that Democratic leader and incoming President Joe Biden will have complete control over all three legislative houses included the White House, the House of Representatives, and the Senate, also supported the U.S. dollar as it suggested a stable government ahead. The U.S. President Donald Trump also agreed to an orderly transition of power that also lifted the lingering political risk from the local currency and gave further strength to the U.S. dollar that ultimately added further pressure on the EUR/USD pair on Friday.

Daily Technical Levels

Support   Resistance

1.2228     1.2330

1.2186     1.2388

1.2127     1.2431

Pivot Point: 1.2287

EUR/USD– Trading Tip

The strength in the U.S. dollar also dragged the EUR/USD pair lower to the 1.2175 level. For the moment, the EUR/USD is gaining support at the 1.2175 level, and below this, it can dip further until the 1.2130 level. On the higher side, the pair may face resistance at the 1.2216 level. The RSI and MACD support bullish correction, and these may cause a bounce off in the EUR/USD pair until the 1.2216 level. Below 1.2216, we can again see a dip in EUR/USD.


GBP/USD – Daily Analysis

The GBP/USD pair was closed at 1.35606 after placing a high of 1.36356 and a low of 1.35382. The currency pair GBP/USD remained flat throughout Friday as it showed no movement and closed the day at the same level it started its day with. The pair GBP/USD raised during the early trading session on the day but faced some heavy pressure during the second half of the day and closed the trading week at the same level it started its day on Friday. The rise in the early trading session was caused after the U.K. announced the approval to use its third coronavirus vaccine. However, the downward pressure on the currency pair was caused by the relative strength of the U.S. dollar amid the rising U.S. Treasury yields on the day.

After the coronavirus press conference of the British Prime Minister Boris Johnson on Friday, the PM announced that the army would be brought in to help aid the vaccination rollout. On Friday, Britain’s medical regulatory approved Moderna’s coronavirus vaccine for emergency use. The U.K. also agreed to purchase an additional 10 million doses; however, the Moderna vaccine will not play a part in the first stage of Britain’s vaccine rollout.

The Health Minister of Britain, Matt Hancock, said that about 1.5 million people have already been vaccinated across the U.K. and Moderna’ ‘s vaccine will allow them to accelerate their vaccination program even further once doses become available in spring. These comments from the U.K. added optimism and supported the GBP/USD pair to rise in the early trading session on Friday.

However, the gains in GBP/USD currency pair could not live for long as the pair faced heavy pressure from the U.S. dollar’s strength and the rising number of coronavirus cases and deaths across the U.K. despite vaccine rollout. The U.S. Dollar was strong across the board after the U.S. Treasury yields rose on Friday to more than 3% amid the full sweep victory of Democrats over the Senate. The incoming President Joe Biden is expected to have full control over the White House, Senate, and House of Representatives added in the local currency as the incoming government will have more stability in rules.

In the capital, London’s mayor declared a major incident on Friday and issued a warning that hospitals in the city were close to being overrun. London’s situation was critical with the spread of the virus out of control as the city was declared to be at a crisis point. These developments in the U.K. also added pressure on British Pound and dragged the pair lower on Friday.

Daily Technical Levels

Support   Resistance

1.3496     1.3553

1.3475     1.3589

1.3439     1.3611

Pivot Point: 1.3532

GBP/USD– Trading Tip

The GBP/USD has violated the sideways trading range of 1.3625 – 1.3530 level, and closing of candles below this area can trigger selling until the next support level of 1.3452 level. On the higher side, the resistance continues to stay at the 1.3530 mark. On the hourly timeframe, the GBP/USD pair has violated the descending triangle pattern at the 1.3547 level, and now this level is likely to provide selling in the pair. Violation of the triangle pattern can extend selling bias today.


USD/JPY – Daily Analysis

The USD/JPY pair was closed at 103.951 after placing a high of 104.090 and a low of 103.602. The USD/JPY pair raised on Friday and extended its gains as the U.S. dollar was strong across the board amid the rising U.S. Treasury bond yields. The USD/JPY pair staged an impressive rebound and rose more than 150 pips in two days as the 10-year U.S. Treasury bond yield placed almost 13% gains in these two days. Over the week, the 10-year note U.S. Treasury yield has risen by about 21% and has supported the greenback since then. 

The U.S. dollar’s strength added further gains in the USD/PY pair and extended its upward momentum on Friday to its highest since December 15. The U.S. Dollar Index was also high beyond the 90.00 level for the first time in the week and supported the USD/JPY pair’s rise. Meanwhile, another factor involved in the rising demand for the U.S. dollar was Donald Trump’s comments, who agreed on a smooth transition of power. The political risk related to transition power that rose after Thursday’s attack was lifted and supported the local currency on Friday that eventually helped the USD/JPY pair to rise further n board. It means that the incoming President Joe Biden will have control over all three legislative bodies, the White House, the House of Representatives, and the U.S. Senate, to give his Democratic Party stability in rules. 

Despite all these positive sentiments, the incoming president promised to deliver two massive stimulus packages in 2021, and his first order is expected to increase the direct payment checks to $2000 kept the local currency USD under pressure and capped further upside in the USD/JPY pair. 

On the data front, at 04:30 GMT, the Household Spending from Japan in November raised to 1.1% against the expected -1.0% and supported the Japanese Yen that capped further upside in the USD/JPY pair. At 10:00 GMT, the Leading Indicators from Japan remained flat at 96.6%. 

From the U.S. side, at 18:30 GMT, the Average Hourly Earnings for December advanced to 0.8% against the projected 0.2% and supported the U.S. dollar that pushed the USD/JPY pair higher. In December, the Non-Farm Employment Change decreased to -140K against the projected 60K and weighed on the U.S. dollar. During December, the Unemployment Rate decreased to 6.7% against the projected 6.8% and supported the U.S. dollar that added further gains in the USD/JPY pair. At 20:00 GMT, the Final Wholesales Inventories for November came in as 0.0% against the projected -0.1% and weighed on the U.S. dollar that capped further upside in the USD/JPY pair on Friday. Furthermore, the USD/JPY pair’s upward momentum was also supported by the rising risk sentiment in the market. The risk flows were encouraged after the U.K. approved another vaccine from Moderna on Friday. U.K. became the first country to approve a third coronavirus vaccine for emergency use authorization that lifted the market’s risk sentiment that ultimately added weight on the safe-haven Japanese Yen and pushed the USD/JPY pair even higher on board.

Daily Technical Levels

Support   Resistance

103.18     104.19

102.56     104.58

102.16     105.21

Pivot Point: 103.57

USD/JPY – Trading Tips

The USD/JPY is trading at 104.123 level, facing immediate resistance at 104.223. On the 4 hour timeframe, the USD/JPY pair suggests bullish bias, and as the 10 and 20 periods, EMA is in support of buying trend while the MACD holds above 0, supporting bullish bias in the USD/JPY pair. A bullish breakout of the 104.223 level can extend the buying trend until the 104.610 level today. Let’s consider taking the buying trade over the 104.223 level and selling below the same. Good luck! 

Categories
Forex Basic Strategies Forex Indicators Forex Service Review Forex Services Reviews-2

Market Profile Singles Indicator Review

Today we will examine the Market Profile Singles Indicator (we could also call it a single print indicator or gap indicator), which is available on the mql5.com market in metatrader4 and metatrader5 versions.

The developer of this indicator is Tomas Papp, who is located in Slovakia, and currently has 7 products available on the MQL5 market.

It is fair to point out that four of his products are completely FREE and are in a full-working version. These are: Close partially, Close partially MT5, Display Spread meter, Display Spread meter MT5. So it’s definitely worth a try.

Overview of the Market Profile Singles 

This indicator is based on market profile theory. It was designed to show “singles areas.” But, what exactly is a singles area?

Theory of the Market Profile Singles

Singles, or single prints, or gaps of the profile are placed inside a profile structure, not at the upper or lower edge. They are represented with single TPOs printed on the Market profile. Singles draw our attention to places where the price moved very fast (impulse movements). They leave low-volume nodes with liquidity gaps and, therefore, the market imbalance. Thus, Singles show us an area of imbalance. Singles are usually created when the market reacts to unexpected news. These reports can generate extreme imbalances and prepare the spawn for the extreme emotional reactions of buyers and sellers.

The market will usually revisit this area to examine as these price levels are attractive for forex traders, as support or resistance zones. Why should these traders be there? Because the market literally flew through the area, and only a small number of traders got a chance to trade there. For this reason, these areas are likely to be filled in the future.

The author also adds: “These inefficient moves tend to get filled, and we can seek trading opportunities once they get filled, or we can also enter before they get filled and use these single prints as targets.”

The author points out: Used as support/resistance zones, but be careful not always. Usually, it works very well on trendy days. See market profile days: trend day (Strategy 1 – BUY – third picture) and trend day with double distribution (Strategy 1 – SELL- third picture).

Practical use of the Market Profile Singles Indicator

So let’s imagine the strategies that the author himself recommends. Of course, it’s up to you whether you use these strategies or whether you trade other strategies for the singles area. Here we will review the following ones:

  • Strategy 1: The trend is your friend
  • Strategy 2: Test the nearest level
  • Strategy3: Close singles and continuing the trend

The author comments that these three strategies are common and repeated in the market, so it is profitable to trade them all.

The recommended time frame is M30, especially when using Strategy 2.

It is good to start the trend day and increase the profit, but be aware that trendy days happen only 15 – 20% of the time. Therefore, the author recommends mainly strategy 2, which is precise 75-80% of the time.


Strategy 1 – BUY :

  1. A bullish trend has begun.
  2. The singles area has been created.
  3. The prize moves sideways and stays above the singles area.
  4. We buy above the singles area and place the stop loss under the singles area.
  5. We place the profit target either according to the nearest market profile POC or resistance or under the nearest singles area. We try to keep this trade as long as possible because there is a high probability that the trend will continue for more days.

Strategy 1 – SELL :

  1. The bear trend has begun.
  2. The singles area has been created.
  3. The prize goes to the side and stays under the singles area.
  4. We sell below the singles area and place the stop loss above the singles area.
  5. We will place the target profit either according to the nearest market profile POC or support or above the nearest singles area. We try to keep this trade as long as possible because there is a high probability that the trend will continue for more days.


Before we start with Strategy 2, let’s explain the Initial Balance(IB) concept. IB is the price range of (usually) of the first two 30-minute bars of the session of the Market Profile. Therefore, Initial Balance may help define the context for the trading day.

The IBH (Initial Balance High) is also seen as an area of resistance, and the IBL (Initial Balance Low) as an area of support until it is broken.

Strategy 2 – one day – BUY:

This strategy will take place on a given day.

  1. There is a singles area near IB. (a singles area was created on a given day)
  2. The price goes sideways or creates a V-shape
  3. We expect to return to the singles area or IB. We buy low and place the stop loss below the daily low (preferably a little lower) and place the target profit below the IBL (preferably a little lower).


Strategy 2 – one day – SELL:

This strategy will take place on a given day.

  1. There is a singles area near IB. (a singles area was created on a given day)
  2. The price goes sideways or creates a reversed font V
  3. We expect to return to the singles area or IB. We sell high and place the stop loss above the daily high (preferably a little higher) and place the target profit above the IBH (preferably a little higher).


Strategy 2- more days- BUY:

This strategy takes more than one day to complete (Singles were created one or more days ago)

  1. After the trend, the price goes sideways and does not create a new low (or only minimal but with big problems)
  2. Nearby is a singles area (Since the price cannot go to one side, there is a high probability that these singles will close).
  3. We buy at a low, placing a stop-loss order a bit lower. We will place the target profile under the singles area.


Strategy 2- more days- SELL:

This strategy takes longer than one day (Singles were created one or more days ago)

  1. After the trend, the price goes to the side and does not create a new high (or only minimal but with big problems)
  2. Nearby is a singles area ( Since the price cannot go to one side, there is a high probability that these singles will close ).
  3. We sell at a high, and we place a stop-loss a bit higher. We will place the target profile above the singles area.

Strategy 3 – BUY:

  1. The current candle closes singles.
  2. Add a pending order above the singles area and place the stop-loss under the singles area or the candle’s low. (whichever is lower)
  3. Another candle must occur above the singles area. (If this does not happen, we will delete the pending order) .
  4. We will place the profit-target either according to the nearest market profile POC or resistance or under the nearest singles area.


Strategy 3 – SELL:

  1. The current candle closes singles.
  2. Add a pending order under the singles area and place the stop-loss above the singles area or candle’s high (whichever is higher).
  3. Another candle must occur under the singles area. (If this does not happen, we will delete the pending order) .
  4. We will place the profit-target either according to the nearest market profile POC or support or above the nearest singles area.

Discussion

These strategies look really interesting.  As the author himself says:

It’s not just a strategy. There is more to it in profitable trading. For me personally, they are most important when trading: Probability of profit, patience, quality signals with a good risk reward ratio (minimum 3: 1) and my head. I think this is the most important.

In this, we must agree with the author.


Service Cost

The current cost of this indicator is $50. You are also able to rent the indicator. For a one-month rental, it is $30 per month. There is also a demo version available it is always worth testing out the demos before purchasing. Though.

After purchasing the indicator, the author sends two more indicators to his customers as a gift: Market Profile Indicator and Support and Resistance Indicator.

Conclusion: There are only 2 reviews for the indicator so far, but they have 5 stars and are very positive.

For us, this indicator is interesting, and it is a big plus that the author shares his strategies. The price is also acceptable since the indicator costs 50 USD = 5 copies (10-USD / 1 piece), and since the author sends another 2 indicators as a gift, this price is really worthwhile.

The author added:

By studying the market profile and monitoring the market, I came up with an indicator and strategies we would like to present to you. Here you can try it for free :


MT4: https://www.mql5.com/en/market/product/52715

MT5: https://www.mql5.com/en/market/product/53385


And here you can watch the video:


Also, a complete description of the strategies and all the pictures can be seen HERE :

Other completely free of charge tools:

https://www.mql5.com/en/users/tomo007/seller#products


Categories
Forex Elliott Wave Forex Market Analysis

USDCAD Bullish Divergence in a Complex Corrective Formation; What’s next?

The big picture of the USDCAD pair shows a bullish divergence suggesting the exhaustion of the current bearish trend that remains active since past March 2020 when the price topped at 1.46674 and began to decline in a complex corrective pattern. Follow with us what’s next for Lonnie.

Technical Overview

The long-term Elliott wave view of the USDCAD pair unfolded in its 2-day chart and log-scale, illustrates a downward movement that began on the second half of March 2020 when the price found fresh sellers at level 1.46674. Once the price topped, the Lonnie started to decline in a complex corrective formation identified as a double-three pattern (3-3-3) of Minor degree labeled in green.

According to the textbook, the double-three pattern characterizes itself by following an internal sequence subdivided into 3-3-3, each “three” a complete corrective formation. In this regard, the previous figure shows the price action moving in the third segment of the double-tree pattern corresponding to its wave Y. Also, the lower degree structural sequence reveals the progress in its wave ((c)) of Minute degree identified in black.

On the other hand, the technical indicators support the bearish bias that dominates the downtrend, persisting since March 2020. Both the trend and the momentum oscillators confirm the downtrend in progress. Nevertheless, the timing oscillator shows a bullish divergence plotted in green. This reading suggests the exhaustion of the bearish trend. In this context, the candlesticks formations observed in the last chart remains weighting declines over rallies.

Technical Outlook

The short-term outlook for USDCAD exposed in the next 8-hour chart reveals the incomplete downward advance corresponding to wave ((c)) of Minute degree identified in black, suggesting a potential new decline.

The figure illustrates the downward channel in play that connects the extremes of waves (i)-(iii) and (ii)-(iv) Minuette degree identified in blue. The Elliott Wave theory suggests that the penetration below the base-line between waves (i) and (iii) could reveal the end of wave (v). In this regard, a potential new decline could strike the area bounded between 1.2585 and 1.2425. Likewise, the gap between momentum and timing oscillators supports the likely additional downward move in the USDCAD pair. 

In summary, the USDCAD advances in a downward complex corrective sequence identified as a double-three pattern of Minor degree, which looks running in its wave Y. Simultaneously, the internal structure reveals the progress in its wave ((c)) of Minute degree, which could see a new drop to the potential target area between 1.2585 and 1.2425. Finally, the bearish scenario will invalidate if the price soars and closes above 1.27980.

Categories
Crypto Market Analysis

Daily Crypto Review, Jan 8 – Bitcoin Continues Its Rise as it Breaks the $40k Mark Briefly

The crypto sector pushed even higher as Bitcoin passed the $40,000 mark and created a new all-time high. Bitcoin is currently trading for $39,094, representing an increase of 5.35% compared to yesterday’s value. Meanwhile, Ethereum’s price has decreased by 1% on the day, while XRP gained 23.53% of its value.

Daily Crypto Sector Heat Map

COVER Protocol gained 2124.46% in the past 24 hours, making it the most prominent daily crypto gainer by far. It is followed by KIMCHI.finance’s 1159.97% and TAI’s 265.52% gain. On the other hand, Stand Share lost 74.11%, making it the most prominent daily loser. It is followed by the Receive Access Ecosystem’s loss of 61.71% and CY Finance’s loss of 56.34%.

Top 10 24-hour Performers (Click to enlarge)

Bottom 10 24-hour Performers (Click to enlarge)

Bitcoin’s market dominance has moved up half a percent since our last report, with its value currently being 69.8%. This value represents a 0.5% difference to the upside than the value it had when we last reported.

Daily Crypto Market Cap Chart

The cryptocurrency sector capitalization has decreased slightly since we last reported, with its current value being $1,03 trillion. This represents a $2 billion decrease when compared to our previous report.

_______________________________________________________________________

What happened in the past 24 hours?

_______________________________________________________________________

_______________________________________________________________________

Technical analysis

_______________________________________________________________________

Bitcoin

Bitcoin has continued moving up, with its price surpassing the $38,000 and $39,000 mark without much problem. The largest cryptocurrency by market cap reached as high as $40,402.5 level before crashing down as bulls could not sustain the price. The price instantly dipped to $36,388 but quickly recovered to the $39,000 area, where it is consolidating at the moment.

Bitcoin has positioned itself for another push towards the upside as it quickly found support in the 50-hour moving average, proving that it doesn’t even need to dip to the horizontal support levels to stabilize itself.


BTC/USD 4-hour chart

Bitcoin’s technicals on the 4-hour, daily, and weekly chart show a tilt towards the buy-side with no signs of neutrality or bearishness. On the other hand, its monthly overview shows slight bearishness in the oscillator sector opposing the overall bullishness.

BTC/USD 1-day Technicals

Technical factors (4-hour Chart):

  • Price is above both its 50-period EMA and its 21-period EMA
  • Price is between its middle and top Bollinger band
  • RSI is in the overbought territory (70.36)
  • Volume is above average

Key levels to the upside:          Key levels to the downside:

1: $40,402                             1: $38,140

2: $43,000                             2: $36,740

3: $46,500                             3: $35,610

Ethereum

Ethereum followed Bitcoin to the upside, pushing its price above its previous resistance levels and up to as high as $1292. Just like Bitcoin, Ethereum instantly dipped to $1,140 but quickly recovered. However, this is where the high correlation with Bitcoin ends, as Ethereum didn’t recover its recent highs but rather lost quite a bit of its value.

While it has recovered since the price dip, Ethereum is now right below the $1,211 resistance level. The cryptocurrency has a high possibility of passing it even if Bitcoin remains stagnant. Still, any moves that would contest the next resistance level would have to be backed by the largest cryptocurrency by market cap.


ETH/USD 1-hour Chart

Ethereum’s technicals on the daily time-frame show an overall bullish tilt with no hints of neutrality. On the other hand, the monthly, weekly, and 4-hour time-frames show some signs of neutrality or even bearishness.

ETH/USD 1-day Technicals

Technical Factors (4-hour Chart):

  • Price is above its 50-period and at its 21-period EMA
  • Price is near its middle Bollinger band
  • RSI has left the overbought area (63.27)
  • Volume is significantly above-average

Key levels to the upside:          Key levels to the downside:

1: $1,292                               1: $1,211

2: $1,420                               2: $1,180

3: $1,500                               3: $1,092

Litecoin

Litecoin followed the market as well, pushing its price further up and breaking its previous resistance level of $174.5. However, while LTC did manage to break this level and post a new high of $181.25 for a moment, the price was unsustainable, resulting in a classic price drop, followed by a failed attempt of recovering (the moment when LTC hit the $174.5 level after dropping below it) acting as a confirmation of a price drop, and then a full-on retracement towards the downside.

Litecoin has bounced off of the $152.25 level beautifully and is now attempting to pass the 50-hour and 21-hour moving averages and continue its move up.


LTC/USD 1-hour Chart

Litecoin’s technicals on the 4-hour, daily, and weekly time-frame are bullish but show some neutrality or even bearishness. On the other hand, its monthly overview is completely bullish.

LTC/USD 1-day Technicals

Technical factors (4-hour Chart):

  • Its price is currently above its 50-period EMA and at its 21-period EMA
  • Price at its middle Bollinger band
  • RSI is neutral (54.95)
  • Volume is on above-average levels

Key levels to the upside:          Key levels to the downside:

1: $174.5                               1: $163.7

2: $181.3                               2: $155.25

3: $195.5                               3: $149.3


Categories
Forex Market Analysis

Daily F.X. Analysis, January 08 – Top Trade Setups In Forex – U.S. NFP Figures Ahead! 

The eyes will remain on the U.S. NFP data on the news side, which is expected to report a slight drop from 638K to 500K during the previous month. Besides, the U.S. Average Hourly Earnings m/m and Unemployment Rate will also remain the main highlight of the day, and these may determine the USD trend for today and next week. Let’s wait for the news.

Economic Events to Watch Today  


EUR/USD – Daily Analysis

The EUR/USD pair was closed at 1.22690 after placing a high of 1.23442 and a low of 1.22449. The EUR/USD pair came under renewed pressure as the U.S. dollar rebounded after an increased 10-year U.S. treasury yield and the depressing economic data from the Eurozone. The U.S. Dollar was strong onboard after falling to the multi-year lowest level this week amid the rising U.S. Treasury yield on a 10-year note that raised by 1% for the first time since March. The rising demand for the greenback ultimately added weight on EUR/USD pair that fell on Thursday.

However, the strong demand for the U.S. dollar is expected not to live for a large time as the Democratic win in the U.S. Senate elections has raised the prospects for a larger stimulus package that will ultimately weigh on the local currency. Meanwhile, the European Central Bank released the regular economic bulletin on Thursday in which it said that the Eurozone economic indicators point to an economic contraction in the final quarter of 2020. 

The ECB said that high-frequency indicators and the latest survey results were consistent with a fall in GDP in the final quarter of 2020. The survey indicators point to a renewed contraction in activity mainly affecting the services sector. The ECB also said that the stat of vaccinations supports expectations for a rapid recovery. Still, it will take time before widespread immunity could be reached and the economy could return to normal. These depressing comments from ECB also added weight on the single currency Euro that added further pressure on EUR/USD pair on Thursday.

On the data front, at 12:00 GMT, the German Factory Orders in November raised to 2.3% against the expectations of -0.6% and supported the single currency Euro that capped further downside in EUR/USD pair. At 15:00 GMT, the CPI Flash Estimate for the year for December declined to -0.3% against the expected -0.2% and weighed on Euro that added losses in EUR/USD pair. The Core CPI Flash Estimate remained flat with expectations of 0.2%. The Italian Prelim CPI also raised to 0.3%against the forecasted 0.2% and supported Euro and capped further downside in EUR/USD pair. The Retail Sales from Eurozone dropped to -6.1% against the forecasted -3.4% and weighed heavily on Euro that added further downside pressure on EUR/USD pair.

The Challenger Job Cuts for the year in December rose to 134.5% compared to November’s 45.4%. At 18:30 GMT, the Unemployment Claims from last week were dropped to 787K against the expected 798K and supported the U.S. dollar that added losses in EUR/USD pair. The Trade Balance from November showed a deficit of -68.1B against the expected -66.7B and weighed on the U.S. dollar that capped further downside in EUR/USD pair. The ISM Services PMI rose in December to 57.2 against the expected 54.5 and supported the U.S. dollar that added further losses in EUR/USD pair on Thursday.

Daily Technical Levels

Support   Resistance

1.2228      1.2330

1.2186      1.2388

1.2127      1.2431

Pivot Point: 1.2287

EUR/USD– Trading Tip

The EUR/USD continues trading with a bullish bias at 1.2367, facing resistance at the 1.2350 level. On the lower side, the support continues to hold around the 1.2278 level. Simultaneously, the bullish breakout of the 1.2350 resistance level can extend buying until the 1.2435 level. The leading indicators such as RSI and MACD support selling, but the EUR/USD 50 periods EMA is likely to support at 1.2289. 


GBP/USD – Daily Analysis

The GBP/USD pair was closed at 1.35641 after placing a high of 1.36330 and a low of 1.35324. The GBP/USD pair extended its losses on Thursday amid the broad-based U.S. dollar recovery amid the rising safe-haven demand and the British Pound’s weakness due to the rising deaths from a new coronavirus variant. Since March, the U.S. Dollar was high on board after the U.S. 10-year Treasury yield rose by more than 1% for the first time. The U.S. Dollar Index that measures the value of the greenback against the basket of six major currencies also recovered from the multi-year lowest level and supported the U.S. dollar that ultimately added weight on the GBP/USD pair on Thursday.

Moreover, the U.S. dollar gains were limited as the pressure of prospects of a larger stimulus package in 2021 from the Democratic government held the local currency down. The Democratic win in the U.S. Senate elections raised the anticipations that President-elect Joe Biden will stand true to His promises for delivering two major stimulus packages in 2021. 

However, the losses in the GBP/USD pair could also be attributed to the rising number of deaths in the U.K. from the new UK coronavirus variant. The U.K. reported a further 1041 fatalities due to coronavirus, which is the highest daily death toll since April. 

On Thursday, about 62,322 new coronavirus cases were recorded, which was also the highest daily rise since mass testing began. The rising spread of coronavirus due to its new variant and the increased number of deaths despite the nationwide lockdown and vaccine rollout raised fears for the newly independent nation Great Britain’s economy that ultimately weighed on the local currency Sterling and dragged the currency pair GBP/USD on the downside.

Furthermore, the World Health Organization (WHO) called on European countries to intensify coronavirus measures as the region deals with the new UK-detected variant. On Thursday, the WHO Europe director Hans Kluge said that further measures were needed to flatten the steep vertical line of rising cases in some countries. Moreover, the French Prime Minister Jean Castex said that France’s border with the U.K. will remain shut and that it was out of the question to lower their guard in weeks to come. These statements also weighed on British Pound and affected the GBP/USD pair’s movement on Thursday.

The Construction PMI for December from Great Britain came in line with the expectations of 54.6. At 14:32 GMT, the Housing Equity Withdrawal for the quarter also remained flat with the expectations of -7.0B. The Challenger Job Cuts for the year in December surged to 134.5% compared to November’s 45.4%. At 18:30 GMT, the Unemployment Claims from last week fell to 787K against the projected 798K and supported the U.S. dollar that added losses in GBP/USD pair. The Trade Balance from November showed a deficit of -68.1B against the projected -66.7B and weighed on the U.S. dollar that capped further downside in GBP/USD pair. The ISM Services PMI surged in December to 57.2 against the projected 54.5 and supported the U.S. dollar that added further GBP/USD pair losses on Thursday.

The GBP/USD pair’s losses were limited as the U.K. government was trying to increase the vaccination supply to control coronavirus spread. The health minister Matt Hancock has said on Thursday that the Britain government was working with both Pfizer and AstraZeneca to increase supplies as the pace of Britain’s rollout of coronavirus vaccines was being limited by the supply of shots. He said that the government must quickly ramp up the rate of vaccinations to meet an ambitious target to protect more than 13 million people who were elderly, vulnerable, or frontline workers by mid-February. 

Daily Technical Levels

Support   Resistance

1.3518      1.3620

1.3474      1.3678

1.3416      1.3722

Pivot Point: 1.3576

GBP/USD– Trading Tip

The GBP/USD pair continues to consolidate in a narrow trading range of 1.3625 – 1.3556. The Sterling may face immediate resistance at the 1.3625 level, and the continuation of an upward trend can lead the Cable towards the 1.3700 resistance level. On the lower side, the breakout of 1.3545 support can extend the selling trend until the 1.3468 level.


USD/JPY – Daily Analysis

The USD/JPY pair was closed at 103.824 after placing a high of 103.955 and a low of 102.948. The USD/JPY pair rose to its highest level since mid-December on Thursday amid the broad-based strength of the U.S. dollar. The USD/JPY pair’s bullish momentum was supported by the stronger U.S. dollar driven by the rising 10-year U.S. Treasury yields. The U.S. 10-year Treasury yields rose to 1.085% on Thursday that was the highest level since March. On Wall Street, the main indexes were also at record highs as Dow Jones gained about 1.7% and NASDAQ gained about 2.25% on Thursday.

The rising risk sentiment because of the rally in the stock market and the U.S. treasury yield, along with the rising crude oil prices, added weight on the safe-haven Japanese Yen that ultimately pushed the currency pair USD/JPY higher onboard to 4 weeks highest level. The U.S. Dollar Index was also up from the multi-year lowest level on Thursday and moved near 89.85 and was up 0.35% for the day. The rising demand for the greenback pushed the currency pair USD/JPY higher on the board.

However, the U.S. dollar demand is expected not to live for a longer period as the Democratic win in U.S. Senate elections has raised the prospects for a larger stimulus package. Joe Biden, who will begin his term from January 20th, has promised to deliver about two large stimulus measures this year, ultimately hurting local currency.

On the data front, at 04:30 GMT, the Average Cash Earnings for the year from Japan dropped to -2.2% against the projection of -0.9% and weighed on the Japanese Yen that ultimately added further gains in the USD/JPY pair. From the U.S. side, at 17:30 GMT, the Challenger Job Cuts for the year in December increased to 134.5% compared to November’s 45.4%. At 18:30 GMT, the Unemployment Claims from last week were decreased to 787K against the anticipated 798K and supported the U.S. dollar that added further gains in the USD/JPY pair. The Trade Balance from November showed a deficit of -68.1B against the anticipated -66.7B and weighed on the U.S. dollar that capped further upside in the USD/JPY pair. At 20:00 GMT, the ISM Services PMI increased in December to 57.2 against the forecasted 54.5 and supported the U.S. dollar that added further gains in the USD/JPY pair.

Meanwhile, on Thursday, the Federal Reserve released its FOMC December meeting minutes that revealed that the Federal Reserve officials consistently backed, holding the pace of asset purchases stable, while some were open to future adjustments if needed. Minutes also revealed that all participants judged that it would be appropriate to continue those purchases at least at the current pace. Nearly all members favored keeping the current arrangement of purchases. The Federal Open Market Committee kept interest rates near zero. It supported its commitment to bond-buying at the meeting after vowing to maintain a $120 billion monthly pace of purchases until there will be considered further progress towards inflation goals and employment. The FOMC meeting minutes also supported the local currency U.S. dollar and added further upside in the USD/JPY pair on Thursday.

Daily Technical Levels

Support   Resistance

103.18     104.19

102.56     104.58

102.16     105.21

Pivot Point: 103.57

USD/JPY – Trading Tips

The USD/JPY consolidates below 103.950 level, after bouncing off above 103.528 support level. A bullish breakout of 103.950 can lead the USD/JPY pair to the 104.322 level. The 50 periods EMA is expected to keep the USD/JPY support at 103.355, which is very far from the current market price; thus, we can also expect some bearish correction. The market may show further movements upon the release of U.S. NFP figures today. Good luck! 

Categories
Crypto Market Analysis

Daily Crypto Review, Jan 7 – Crypto Sector Market Cap Over $1 Trillion as BTC Approaches the $40k Mark

Most of the cryptocurrency sector ended up in the green as Bitcoin passed $38,000. Another thing to mention is that the overall industry market cap has reached past $1 trillion for the first time in the history of cryptocurrencies. Bitcoin is currently trading for $38,400, representing an increase of 10.78% compared to yesterday’s value. Meanwhile, Ethereum’s price has increased by 7.78% on the day, while XRP skyrocketed, gaining 46.55% of its value.

Daily Crypto Sector Heat Map

X Infinity gained 896.37% in the past 24 hours, making it the most prominent daily crypto gainer by far. It is followed by 7up Finance’s 298.93% and EveryCoin’s 278.57% gain. On the other hand, COVER Protocol lost 99.48%, making it the most prominent daily loser. It is followed by UniMex’s loss of 97.1% and Team Heretics Fan Token’s loss of 91.66%.

Top 10 24-hour Performers (Click to enlarge)

Bottom 10 24-hour Performers (Click to enlarge)

Bitcoin’s market dominance has moved down slightly since our last report, with its value currently being 68.6%. This value represents a 0.7% difference to the downside than the value it had when we last reported.

Daily Crypto Market Cap Chart

The cryptocurrency sector capitalization skyrocketed and passed the one trillion mark since we last reported, with its current value being $1,005 trillion. This represents a $33.51 billion increase when compared to our previous report.

_______________________________________________________________________

What happened in the past 24 hours?

_______________________________________________________________________

_______________________________________________________________________

Technical analysis

_______________________________________________________________________

Bitcoin

Bitcoin continued the upward trajectory and pushed past the previous all-time high with confidence, reaching a new high of $38,510 at one point. While the price did retrace after hitting the 37,800 at one point, but the 50-hour moving average created strong support, and BTC pushed back up to contest the all-time high level once again.

As we have mentioned many times, shorting of any kind and trading against the overall trend is most likely not optimal, and traders might find a good opportunity to long BTC each time it breaks the all-time high, as this is when it gets a large influx of buyers.

BTC/USD 1-hour chart

Bitcoin’s short-term technicals (4-hour and daily) are completely bullish, while its long-term overview is a bit more tilted towards neutrality.

BTC/USD 1-day Technicals

Technical factors (4-hour Chart):

  • Price is above both its 50-period EMA and its 21-period EMA
  • Price is near its top Bollinger band
  • RSI is in the overbought territory (72.04)
  • Volume is above average

Key levels to the upside          Key levels to the downside

1: $37,800                                 1: $35,880

2: $40,000                                 2: $34,800

3: $43,220                                 3: $33,100

Ethereum

Ethereum’s chart looks pretty similar to Bitcoin’s, as they both moved to the upside in the same manner. The second-largest cryptocurrency by market cap pushed past many support levels and reached $1,225 before descending slightly. Alongside Bitcoin’s move to new all-time highs, this move contributed the most to the overall crypto sector market cap passing the $1 trillion mark.

Ethereum is currently trading within a narrow range, bound by $1,169 to the downside and $1,211 to the upside. If ETH decides to move up, the next most likely resistance level will be the $1,341.5 level. If, however, it breaks this range to the downside, it has many support levels.

ETH/USD 1-hour Chart

Ethereum’s technicals on the daily, weekly, and monthly time-frames are fully tilted towards the buy-side, while its 4-hour technicals are slightly more neutral.

ETH/USD 1-day Technicals

Technical Factors (4-hour Chart):

  • Price is above both its 50-period and its 21-period EMA
  • Price is at its top Bollinger band
  • RSI is in the overbought area (73.41)
  • Volume is significantly above-average

Key levels to the upside          Key levels to the downside

1: $1,211                                    1: $1,169

2: $1,341.5                                 2: $1,080

3: $1,425                                    3: $1,050

Litecoin

Litecoin increased in price as well, but while its chart looks similar to Bitcoin’s and Ethereum’s, it’s important to notice that it did not break the high it made on Jan 4. In fact, Litecoin almost got to the $174.5 level but quickly pulled back to $165.

Litecoin found strong support in its 50-hour moving average, which held it above $165 and kept it from possibly breaking $163.7 to the downside.

Litecoin’s next move will most likely be highly dependent on Bitcoin’s short-term movement.

LTC/USD 1-hour Chart

Litecoin’s technicals are fully bullish on every single time frame and vary from “buy” to “strong-buy” indicators.

LTC/USD 1-day Technicals

Technical factors (4-hour Chart):

  • Its price is currently above both its 50-period EMA and its 21-period EMA
  • Price between its middle and top Bollinger band
  • RSI is nearing the overbought area (63.82)
  • Volume is above-average but descending

Key levels to the upside          Key levels to the downside

1: $163.7                                      1: $155.25

2: $174.5                                      2: $149.3

3: $195.5                                      3: $143.5


Categories
Forex Market Analysis

Daily FX Analysis, January 07 – Top Trade Setups In Forex – Eyes on Series of US and European Events! 

It’s going to be a busy day from the news front, as the market will be focusing on the German Factory Orders m/m, ECB Economic Bulletin, Retail Sales, and CPI figures from the Eurozone economy that can drive price action in the Euro pairs during the UK session. On the other hand, the dollar’s movement can be influenced by Unemployment Claims and ISM Services PMI scheduled to be released during the US session.

Economic Events to Watch Today  


EUR/USD – Daily Analysis

The EUR/USD pair was closed at 1.23259 after placing a high of 1.23492 and a low of 1.22653. The depressed US dollar after the signs of a Democratic win in the US Senate runoff elections and the rebounded risk-on market sentiment helped EUR/USD pair to post gains on Wednesday.
The markets anticipated a Democratic win in the US Senate election in Georgia that would evacuate the track for a bigger fiscal stimulus package; the greenback came under pressure. Democrats won one US Senate race in Georgia and led in another on Wednesday, moving closer to a sweep in a Deep South state. The result will be announced on late Wednesday, and winning both seats by Democrats will give Congress control to power the President-elect Joe Biden’s policy goals.

Biden has said that he wanted two fiscal stimulus packages in 2021 to support his economy through the pandemic. His first order is expected to increase the stimulus paychecks amount to $2000 rejected by Republicans. These hopes kept the US dollar under pressure and supported the upward momentum in the EUR//USD pair.

On the data front, at 10:00 GMT, the German Prelim CPI for December dropped to 0.5% against the expected 0.6% and weighed on Euro and capped further upside in EUR/USD pair. At 12:45 GMT, the French Prelim CPI for December also dropped to 0.2% against the forecasted 0.4% and weighed on Euro. At 13:15 GMT, the Spanish Services PMI for December raised to 48.0 against the expected 44.5 and supported the single currency Euro and added further EUR/USD pair gains. At 13:45 GMT, the Italian Services PMI for December declined to 39.7 against the estimated 45.0 and weighed on the single currency Euro.

At 13:50 GMT, the French Final Services PMI came in line with the expectations of 49.1. At 13:55 GMT, the German Final Services PMI dropped to 47.0 against the anticipated 47.7 and weighed on Euro and capped further upside in EUR/USD pair. At 14:00 GMT, the Final Services PMI from Europe also fell to 46.4 against the forecasted 47.4 and weighed on Euro. At 15:00 GMT, the PPI for November from the Euro area raised to 0.4% against the expected 0.2% and supported Euro and gave strength to the EUR/USD pair’s rising prices.

From the US side, at 18:15 GMT, the ADP Non-Farm Employment Change for December declined to -123K against the forecasted 60K and weighed on the US dollar that gave further gains to EUR/USD pair. At 19:45 GMT, the Final Services PMI for December also declined to 54.8 against the forecasted 55.2 and weighed on the US dollar and helped EUR/USD to rise further. At 20:00 GMT, the Factory Orders for November rose to 1.0% against the forecasted 0.7%, supported the US dollar, and capped further gains in EUR/USD pair.

Meanwhile, the market’s risk sentiment was improved after the resurgence in global manufacturing as shown in various surveys this week despite the rising coronavirus cases, which also gave strength to the risk perceived EUR/USD pair on Wednesday.


Daily Technical Levels

Support   Resistance

1.2257      1.2318

1.2220      1.2344

1.2195      1.2380

Pivot point: 1.2282

EUR/USD– Trading Tip

The EUR/USD continues trading with a bullish bias at 1.2367, facing resistance at the 1.2350 level. On the lower side, the support continues to hold around the 1.2278 level. Simultaneously, the bullish breakout of the 1.2350 resistance level can extend buying until the 1.2435 level. The leading indicators such as RSI and MACD support selling, but the EUR/USD 50 periods EMA is likely to support at 1.2289. 


GBP/USD – Daily Analysis

The GBP/USD pair was closed at 1.36075 after placing a high of 1.36711 and a low of 1.35380. The currency pair came under pressure on Wednesday amid the rising number of coronavirus cases in the UK, depressing comments from Andrew Bailey, and the poor macroeconomic data from Great Britain.

The UK has more new coronavirus cases per capita than any other major country globally as the number of daily cases topped 60,000 for the first time this week. The latest data suggested that around one in 50 people in the UK currently have the virus. Only the US has a per capita infection rate nearly equivalent to the UK of any country with more than 1 million cases.

Since December 06, the average number of new daily cases has risen from around 15,000 to above 55,000. PM Boris Johnson said on Tuesday that about 1.3 M people have so far received a coronavirus vaccination. The rising number of coronavirus made the UK the worst-hit country in Europe in terms of cumulative cases and weighed on its local currency British Pound, which ultimately added weight to the GBP/USD pair.

Meanwhile, on Wednesday, the Governor of Bank of England Andrew Bailey risked reigniting the politically charged debate over Brexit by predicting that the trade deal struck with the European Union could end up costing the UK economy the equivalent of more than 80 billion pounds.
During his first public comments since Britain completed its withdrawal from the bloc on December 31, Bailey endorsed warnings from the Office for Budget Responsibility, the fiscal watchdog, that gross domestic product will be as much as 4% lower in the long term than it would be had the country remained in the EU.

These comments from the Bank of England governor right after the Brexit completion raised fears and added weight on Sterling that eventually dragged the GBP/USD currency pair on the downside. On the data front, at 14:30 GMT, the Final Services PMI from Great Britain for December dropped to 49.4 against the expected 499 and weighed on British Pound and added more losses on the currency pair GBP/USD.

From the US side, at 18:15 GMT, the ADP Non-Farm Employment Change for December fell to -123K against the anticipated 60K and weighed on the US dollar and capped further losses in GBP/USD pair. At 19:45 GMT, the Final Services PMI for December also fell to 54.8 against the anticipated 55.2 and weighed on the US dollar. At 20:00 GMT, the Factory Orders for November surged to 1.0% against the anticipated 0.7% and supported the US dollar that added further GBP/USD pair losses.

However, the GBP/USD pair’s losses were somewhat recovered in the late trading session over the positive sentiment that was mostly driven by the rising expectation that the Democrats will win both seats in Georgia’s Senate runoff. A clean sweep for the Democrats would hand charge of both houses of Congress to the incoming administration that would pave the way for Joe Biden to push through more stimulus. This left the US dollar under pressure and supported the GBP/USD pair in late trading hours.


Daily Technical Levels

Support   Resistance

1.3572      1.3660

1.3518     1.3696 

1.3483      1.3749

Pivot Point: 1.3607

GBP/USD– Trading Tip

The GBP/USD pair continues to consolidate in a narrow trading range of 1.3625 – 1.3556. The Sterling may face immediate resistance at the 1.3625 level, and the continuation of an upward trend can lead the Cable towards the 1.3700 resistance level. On the lower side, the breakout of 1.3545 support can extend the selling trend until the 1.3468 level.


USD/JPY – Daily Analysis

The USD/JPY pair was closed at 103.049 after placing a high of 103.442 and a low of 102.590. The higher US yields and the market’s risk appetite boosted the USD/JPY prices on Wednesday. Since March, the currency pair bounced from the lowest levels, near 102.50, and peaked at 103.43, a one-week high.

The main driver of the pair USD/JPY remained the US yields followed by the elections to decide the US Senate’s composition. The 10-year yield reached 1.05%, its highest since March, and supported the US dollar that ultimately pushed the USD/JPY pair higher on board. The market sentiment was not affected by the weaker than expected US economic data as the Dow Jones was at record highs, up by 1.55%, and the NASDAQ gained 0.51%.

Markets were pricing the prospects of a Democratic win in the US Senate runoff elections in Georgia. The Democrats already have the House of Representatives, aka lower chamber of Congress, in their control. Winning the Senate elections will also give them control over the upper chamber that means they will have a complete majority in the US legislative assembly and the power to push forward their agenda.

The term of Joe Biden will begin on January 20. He has hinted that he wanted at least two stimulus packages in 2021 to overcome the damage caused and expected to continue from the coronavirus pandemic. Markets were also pricing their bets on the prospects of Biden’s first order that is expected to push out $2000 checks to most Americans that had been strictly opposed by the Republicans.

On the data front, at 10:00 GMT, the Consumer Confidence from Japan for December dropped to 31.8against the anticipated 32.6 and weighed on the Japanese Yen that added more gains in the USD/JPY pair.
From the US side, at 18:15 GMT, the ADP Non-Farm Employment Change for December decreased to -123K against the projected 60K and weighed on the US dollar that capped further gains in the USD/JPY pair. At 19:45 GMT, the Final Services PMI for December also decreased to 54.8 against the projected 55.2 and weighed on the US dollar that limited additional USD/JPY pair gains. At 20:00 GMT, the Factory Orders for November increased to 1.0% against the projected 0.7% and supported the US dollar that added further gains in the USD/JPY pair.

Furthermore, some of the USD/JPY pair’s gains were lost in late trading hours of Wednesday as the rising number of coronavirus cases kept the global economic recovery under pressure and safe-haven demand intact. On Wednesday, Japan’s number of coronavirus cases reached its highest level as the government faced mounting pressure from health experts to impose a strict state of emergency for Tokyo.

In Portugal, about 10,027 new cases on Wednesday were reported, which was the highest since the pandemic started. Ontario reported 3266 new coronavirus cases that brought the total number of coronavirus in the region to 200,626. All these fears kept the safe-haven Japanese yen supportive that ultimately weighed on the USD/JPY pair and lost most of its gains for the day on Wednesday.


Daily Technical Levels

Support   Resistance

102.49      103.08

102.24      103.44

101.89      103.68

Pivot Point: 102.84

USD/JPY – Trading Tips

The USD/JPY bounced off to violate the resistance level of 102.960 level, and now it’s working as a support for the USD/JPY pair. The pair may find resistance at the 103.430 level. Overall, the bullish bias seems strong as the USD/JPY pair has crossed over 50 EMA at the 103.063 level. Taking a look at the 2-hour timeframe, the USD/JPY has closed a bullish engulfing candle over 102.962 level that can drive the further bullish trend in the USD/JPY pair. Let’s consider taking a buy trade over the 102.960 level today. Good luck!

Categories
Forex Market Analysis

GBPJPY Under the Bearish Pressure

The GBPJPY cross continues moving in an incomplete long-term sideways corrective pattern of Intermediate degree that remains active since the price found support at 124.786 in early October 2016. The Elliott wave sequence in progress suggests the possibility of a new decline for the coming trading sessions.

Technical Overview

The following figure illustrates the GBPJPY cross in its 2-day range, developing a sideways formation of Intermediate degree labeled in blue, which could correspond to an incomplete, irregular flat pattern (3-3-5). This Elliott wave formation began in early October 2016 when the price found support at 124.786 and rallied until 156.608 reached in early February 2018 when the price completed its wave (A) identified in blue.

The previous chart exposes the downward advance of wave (B) in blue, which began once the cross topped at 156.608. In this context, wave (B) internal structure seems like a double-three pattern of Minor degree labeled in green, which currently advances in its wave Y.

Likewise, the lower degree sequence shows the progress in its incomplete wave ((c)) of Minute degree identified in black, which began in early September 2020 when the price found fresh sellers at 142.714.

According to the textbook, the wave ((c)) in progress should follow an internal sequence subdivided into five waves. In this context, the lower degree structure of GBPJPY might move in its second wave (ii) of Minuette degree labeled in blue. Thus, completing this corrective rally should give way to a new decline corresponding to wave (iii).

Technical Outlook

The next 12-hour chart shows the GBPJPY advancing in the wave c of Subminuette degree labeled in green inside the corrective rally corresponding to wave (ii) in blue. The completion of this corrective formation could correspond to an incomplete ending diagonal pattern suggesting a new decline.

The new decline’s potential bearish target corresponding to wave (iii) in blue locates in the demand zone between 130.808 and 129.298. On the other hand, the downward scenario’s invalidation finds at the top of the wave (i) at 142.714, corresponding to the last September 01st high.

In summary, the GBPJPY cross advances in an incomplete sideways corrective formation, which its internal structure suggests the progress in a complex double-three pattern. The lower degree structure exposes the advance of wave (ii), which seems incomplete. In this regard, the ascending base-line breakdown should confirm the potential next decline, which has a potential target the demand zone located between 130.808 and 129.298. Finally, the bearish scenario forecasted will be invalid if the price surpasses and closes above 142.714.

Categories
Forex Videos

Brexit Is Done – How To Profit Trading Forex GBPUSD


Brexit done – where now for Cable?

Thank you for joining this forex academy educational video.  in this section, we will be looking at the aftermath of the Brexit future trade deal agreement negotiations, which have finally concluded.  And what this might mean for the GBPUSD pair.

After 4 years of wrangling over a future trading arrangement between the European Union and the United Kingdom, which left EU membership back in June 2016, by way of a national referendum, a free trade deal has been agreed between the UK and EU on Christmas Eve 2020. 

The markets will be grateful for a breather in the now finalised divorce, which has finally been settled after years of; will they, or won’t they get a future treading deal completed in time before the UK was forced to end the transition period on wt20 trading regulations, which was seen as potentially very bad for the British economy.  As many had predicted, the negotiations went down to the wire, and an agreement was set in place with hardly any time to spare.

The referendum, which took place on the 23rd of June 2016, and where the British people voted to leave the EU, caused the pound against the dollar to crash from 1.47 to a low of 1.21 during the following year, as the markets tried to decipher how this may play out for the British economy.

The pear rallied up to 1.42 in April 2018 as hopes were raised of a negotiated trade free trade deal, which was dashed. 

And we had the crash to 1.16 in march 2020 as the pandemic gripped the United Kingdom.

The pair has been rallying up to its current position at 1.36 – at the time of writing – based on the market anticipation that a free trade agreement would be reached.  This extremely bumpy road has been smoothed by the free trade agreement, but what now for the British economy and the pound, as it finally goes its own way as an independent nation?

There is no doubt that the bulls are in control of the pair at the moment, and some institutional traders will be looking for the previous highs, as shown here on the chart of 1.42 and 1.47.

However, things to consider are that the free trade agreement only takes up 20% of the British economy, with the remaining 80% of the gross domestic product being attributed to financial services, which does not form part of the agreement, and which still has to be negotiated between the EU and UK.  It is unlikely that issues in this sector will cause a major upset; however, there is potential for a spanner in the works should the two sides diverge from current alignments in trading standards.

The other critical component, which will affect the pound, is the United States dollar currency index, or DXY, which measures the dollar against the most commonly traded currencies known as the majors and which includes the British pound and Euro.

The dollar index has fallen from a high of 103.00 in march 2020 to its current level at just under 90.00 at the time of writing, as the federal reserve and United States’ government implement stimulus measures by pumping more and more dollars into the system to shore up the failing US economy, which is still in the grips of the pandemic.

While traders wonder if Cable has run out of steam at 1.36, traders will also be wondering if there is further room for a continued slide in the dollar index, perhaps down to 88.00 in the short term, as the market opens to a new year and a first new quarter, with institutions and investors adjusting their portfolios for the new financial year ahead.

On a market sentiment basis, a fundamental basis, and on a technical analysis basis, it would appear that there is scope for a push higher in Cable to reach some of the previous levels mentioned at 1.42 and 1.47, especially while the US dollar index is generally under pressure.


Categories
Forex Signals

USD/CAD Descending Triangle in Play – Quick Trade Idea! 

The USD/CAD pair was closed at 1.26689 after placing a high of 1.27909 and a low of 1.26556. The currency pair USD/CAD fell to its lowest since 2018 April on rising crude oil prices and the US dollar weakness. Despite Canada’s negative economic data and positive data from the US side, the currency pair USD/CAD still moved in the downward direction on Tuesday as investors’ focus was shifted on the OPEC meeting and Georgia’s runoff elections.

On the data front, at 18:30 GMT, the IPPI for November from Canada dropped to -0.6% against the expected -0.2% and weighed on the Canadian dollar that capped further losses in the USD/CAD pair. The RMPI for November also dropped to 0.6% against the expected 0.9% and weighed on the Canadian dollar that capped further losses in the USD/CAD pair on Tuesday. From the US side, at 20:00 GMT, the ISM Manufacturing PMI from December surged to 60.7 against the predicted 56.6 and supported the US dollar, and capped further losses in the USD/CAD pair. The ISM Manufacturing Prices also rose to 77.6 against the expected 66.0 and supported the US dollar that limited further losses in the USD/CAD pair. The Wards Total Vehicle Sales rose to 16.3M against the anticipated 15.8M and supported the US dollar that ultimately limited further losses in the USD/CAD pair.

The West Texas Intermediate (WTI) crude oil prices rose above $50 per barrel on Tuesday as Russia and the Organization of Petroleum Exporting Countries remained deadlocked over how much oil to produce from February. Russia and its neighbor Kazakhstan were both pressuring for the scheduled output increase of 500,000 barrels a day to come into effect, while OPEC, with what appears to be total unanimity, wanted to kept output at its present level due to short-term weakness in demand caused by the latest surge in coronavirus and imposed lockdowns in various countries.

The rising prices of crude oil gave strength to the commodity-linked currency Loonie and added weight on the currency pair USD/CAD. Meanwhile, Georgia’s runoff elections that will decide the US Senate’s future also kept the US dollar under pressure on Tuesday. The result of the elections is expected to announce on Wednesday, and investors were cautious ahead of it, and the selling pressure surrounding the greenback increased that ultimately weighed on the USD/CAD pair.


Daily Technical Levels

Support Resistance

1.2619 1.2758

1.2568 1.2844

1.2481 1.2896

Pivot Point: 1.2706

The USD/CAD’s technical side is trading at 1.2690, disrupting the support area of 1.2725 level, which is now working as a resistance for the USD/CAD pair. On the lower side, the support stays at the 1.2647 level, and a bearish breakout of this level can extend selling trend until 1.2591. Let’s wait for opening a sell trade below the 1.2725 level today. Good luck! 


Categories
Crypto Market Analysis

Daily Crypto Review, Jan 6 – Bitcoin Retraces after Creating a New All-Time High; Sector in the Green

Most of the cryptocurrency sector ended up in the green as Bitcoin pushed towards the upside and created a brand new all-time high. Bitcoin is currently trading for $34,801, representing an increase of 12.63% compared to yesterday’s value. Meanwhile, Ethereum’s price has increased by 9.47% on the day, while LTC gained 6.53% of its value.

Daily Crypto Sector Heat Map

Foglory Coin gained 3809.54% in the past 24 hours, making it the most prominent daily crypto gainer by far. It is followed by COVER Protocol’s 2102.06% and Birdchain’s 683.22% gain. On the other hand, MINDOL lost 74.94%, making it the most prominent daily loser. It is followed by Scanetchain loss of 71.12% and XLMDOWN’s loss of 55.53%.

Top 10 24-hour Performers (Click to enlarge)

Bottom 10 24-hour Performers (Click to enlarge)

Bitcoin’s market dominance has moved up slightly since our last report, with its value currently being 69.3%. This value represents a 1.1% difference to the upside than the value it had when we last reported.

Daily Crypto Market Cap Chart

The cryptocurrency sector capitalization has increased over 100 billion since we last reported, with its current value being $967.49 billion. This represents a $122.12 billion decrease when compared to our previous report.

_______________________________________________________________________

What happened in the past 24 hours?

_______________________________________________________________________

_______________________________________________________________________

Technical analysis

_______________________________________________________________________

Bitcoin

Bitcoin has had another amazing bull run, with its price pushing from just below $30,000 all the way up to $35,879, setting a brand new all-time high. However, this is where the price hit a wall, and Bitcoin started retracing. The largest cryptocurrency by market cap is now trading right below the previous all-time high of $34,800 and is seemingly going further down.

With the volume being as high as it is, the most does not seem like it’s done yet. Traders should pay attention to how the price reacts to certain levels.

BTC/USD 4-hour chart

Bitcoin’s technicals show a strong tilt towards the buy-side with some neutral characteristics, with only the 4-hour time-frame showing full bullish tilt.

BTC/USD 1-day Technicals

Technical factors (4-hour Chart):

  • Price is slightly above both its 50-period EMA and its 21-period EMA
  • Price is near its top Bollinger band
  • RSI is near the overbought territory (65.11)
  • Volume is above average

Key levels to the upside          Key levels to the downside

1: $34,800                                 1: $30,807

2: $35,000                                 2: $28,337

3: $35,890                                 3: $26,340

Ethereum

Ethereum also moved to the upside, with its price slowly but surely going from $975 all the way up to $1,139 before retracing slightly. Its move, however, didn’t seem as forced as Bitcoin’s.

While the overall sentiment around Ethereum is bullish, the fact that it hit nearly the same high three times without passing it could indicate a possible short-term top and a retracement.

Traders should pay great attention to the area around above $1,125 and how ETH reacts to it.

ETH/USD 1-hour Chart

Ethereum’s technicals on the daily and weekly time-frames show an overall bullish tilt with no hints of neutrality coming from oscillators. On the other hand, the monthly and 4-hour time-frames show some signs of neutrality or even bearishness.

ETH/USD 1-day Technicals

Technical Factors (4-hour Chart):

  • Price is above both its 50-period and its 21-period EMA
  • Price is between its middle and top Bollinger band
  • RSI is in the overbought area (72.01)
  • Volume is significantly above-average

Key levels to the upside          Key levels to the downside

1: $1,047                                     1: $1,009

2: $1,080                                     2: $960

3: $1,169                                      3: $932

Litecoin

Litecoin moved in a much more narrow range than Bitcoin and Ethereum. Its price slowly moved towards the upside (with one hiccup that brought its price from $163 to $155) and reached as high as $165. However, this move didn’t create new highs or approach the recent ones either.

At the moment, Litecoin looks like a cryptocurrency that mirrors Bitcoin’s moves, but with less volatility. While this brings a bit of perceived safety, the truth is that the profit potential is also greatly diminished.

LTC/USD 1-hour Chart

Litecoin’s technicals on the 4-hour and monthly time-frame are completely bullish, while its daily and weekly overviews show some oscillators having bearish values.

LTC/USD 1-day Technicals

Technical factors (4-hour Chart):

  • Its price is currently above both its 50-period EMA and its 21-period EMA
  • Price between its middle and top Bollinger band
  • RSI is nearing the overbought area (65.96)
  • Volume is above-average but descending

Key levels to the upside          Key levels to the downside

1: $163.7                                      1: $155.25

2: $174.5                                      2: $149.3

3: $195.5                                   3: $143.5

Categories
Forex Market Analysis

Daily F.X. Analysis, January 06 – Top Trade Setups In Forex – ADP Non-Farm Employment Change Ahead! 

On the news front, eyes will remain on the Services PMI figures from the Eurozone, U.K., and the United States. Almost all economic figures are expected to perform better than previous months, perhaps due to a lockdown lift. Price action will depend upon any surprise changes in the PMI figures. Later today, the U.S. ADP figures will also drive some volatility in the market.

Economic Events to Watch Today  


EUR/USD – Daily Analysis

The EUR/USD pair was closed at 1.22984 after placing a high of 1.23055 and a low of 1.22419. The renewed U.S. dollar weakness and the prospects for a Democratic majority in the Senate after the runoff election in Georgia boosted the market sentiment that supported the upward trend in EUR/USD pair on Tuesday.

The U.S. Dollar Index that gauges the greenback’s value against the basket of six major currencies fell by almost 0.38% on Tuesday to an 89.53 level that ultimately added gains in EUR/USD pair. The U.S. Dollar was also under stress on Tuesday amid the US Georgia runoff elections that would decide the future of the U.S. Senate. The outcome will be crucial for incoming president Joe Biden as the Senate majority helps pass the law and confirm the cabinet appointments. The result is expected on Wednesday. It has made investors cautious about placing any strong bids in favor of the U.S. dollar, resulting in the upward momentum of EUR/USD.

On the data front, at 12:00 GMT, the German Retail Sales for November raised to 1.9% against the expected -2.0% and supported the single currency Euro and added further gains in EUR/USD pair. At 13:00 GMT, the Spanish Unemployment Change in December raised to 36.8K against the expected 30.5K and weighed on the single currency Euro that capped further EUR/USD pair gains. At 13:55 GMT, the German Unemployment Change for December declined to-37K against the expected 10K and supported the single currency Euro that added further EUR/USD pair gains. At 14:00 GMT, the M3 Money Supply for the year from Eurozone raised to 11.0% against the forecasted 10.6% and supported the single currency Euro that added additional EUR/USD pair gains. The Private Loans for the year from Eurozone dropped to 3.1% from the expected 3.3% and weighed on Euro that further capped gains in EUR/USD pair.

From the U.S. side, at 20:00 GMT, the ISM Manufacturing PMI from December rose to 60.7 against the estimated 56.6 and supported the U.S. dollar, and capped further gains in EUR/USD pair. The ISM Manufacturing Prices also raised to 77.6 against the anticipated 66.0 and supported the U.S. dollar. The Wards Total Vehicle Sales raised to 16.3M against the estimated 15.8M and supported the U.S. dollar, ultimately limiting further gains in EUR/USD pair.

On Wednesday, the HIS Markit will release the Services PMI data for Germany and the Euro area. From the U.S., the ADP Employment Change will also be featured in the economic docket that will impact EUR/USD prices. Furthermore, the investors will keep a close eye on the Georgia election results.

Daily Technical Levels

Support   Resistance

1.2257      1.2318

1.2220      1.2344

1.2195      1.2380

Pivot point: 1.2282

EUR/USD– Trading Tip

The EUR/USD is trading with a mixed bias at the 1.2272 level, having violated the upward trendline at the 1.2252 level. At the moment, the pair is likely to face resistance at the 1.2307 level along with a support area of 1.2245 and 1.2215. Bullish bias seems dominant today, so a bullish breakout of 1.2307 can extend buying until the next resistance level of 1.2345.


GBP/USD – Daily Analysis

The GBP/USD pair was closed at 1.36278 after a high of 1.36420 and a low of 1.35540. Despite the third nationwide lockdown in the U.K., the GBP/USD pair raised on Tuesday amid the broad-based U.S. dollar weakness. The U.S. Dollar Index that measures the value of the U.S. dollar against the basket of six major currencies fell by 0.38% towards the two years, the lowest level of 89.53, and weighed on the greenback that ultimately supported the gains in GBP/USD pair.

The U.S. dollar was weak across the board despite the safe-haven appeal in the market mainly because of the Georgia runoff elections in the U.S. The runoff will decide the future of the U.S. Senate. It will be essential for Joe Biden, the upcoming Democratic president of the U.S., as it holds major importance in the U.S. Congress being its upper chamber. Senate holding party could easily approve its bills, which is the main attractiveness for getting majority votes in the Georgia runoff elections. Since 2014, the Senate has been controlled by the Republican Party, and if Democrats win on Wednesday, the extra two seats will give them effective control.

On the other hand, the British Pound was under pressure on Tuesday as the number of new daily confirmed cases of coronavirus in the U.K. has topped 60,000 for the first time since the pandemic started.

According to the government figures on Tuesday, the number of people who tested positive was 60,916. It came in as England and Scotland announced new strict lockdowns with people told to stay at home. The country is entering another nationwide lockdown to control coronavirus’s new variant affected the local currency and GBP/USD pair. However, investors did not give much attention to it and continued moving with the weakness of the U.S. dollar that ultimately pushed the GBP/USD pair higher.

There was no macroeconomic data on the data front to be released from the U.K. From the U.S. side, at 20:00 GMT, the ISM Manufacturing PMI from December surged to 60.7 against the anticipated 56.6 and supported the U.S. dollar and capped further gains in GBP/USD pair. The ISM Manufacturing Prices also rose to 77.6 against the projected 66.0 and supported the U.S. dollar. The Wards Total Vehicle Sales surged to 16.3M against the expected 15.8M and supported the U.S. dollar that ultimately limited further GBP/USD pair gains.

Daily Technical Levels

Support   Resistance

1.3572      1.3660

1.3518      1.3696

1.3483      1.3749

Pivot point: 1.3607

GBP/USD– Trading Tip

The Cable’s technical side also remains mostly unchanged as the GBP/USD pair consolidates between 1.3632 – 1.3556 after violating the support level of 1.3609 level. On the higher side, the Sterling may find resistance at 1.3632 and 1.3697 level while support at 1.3550 and 1.3473 level. Choppy trading expected. 


USD/JPY – Daily Analysis

The USD/JPY pair was closed at 102.716 after placing a high of 103.189 and a low of 102.603. On Tuesday, the currency pair USD/JPY came under resumed bearish pressure through the American trading hours and reached its lowest level in nearly ten months at 102.60. The intensified selling pressure surrounding the U.S. dollar in the second half of the day forced the USD/JPY pair on the lower side. The U.S. Dollar Index that measures the value of the greenback against the basket of six major currencies fell to its multi-year lowest level at 89.44 by 0.47% on Tuesday and weighed heavily on the USD/JPY pair.

The U.S. Dollar was also weak across the board ahead of the results of the Georgia runoff elections. The state of Georgia held runoff elections for its two Senate seats. The results will determine who gets to control the U.S. Senate for the next two years and will consequently have a profound impact on the course of U.S. fiscal policy. The U.S. Republican Party has been controlling the U.S. Senate since 2014, and markets are betting that the Republicans will still win at least one of the seats and cement its hold on the upper chamber of the U.S. Congress.

On the data front, at 04:50 GMT, the Monetary Base for the year from Japan raised to 18.3% against the forecasted 18.0% and supported the Japanese Yen that ultimately weighed on the USD/JPY pair. From the U.S. side, at 20:00 GMT, the ISM Manufacturing PMI from December rose to 60.7 against the forecasted 56.6 and supported the U.S. dollar, and capped further losses in the USD/JPY pair. The ISM Manufacturing Prices also raised to 77.6 against the projected 66.0 and supported the U.S. dollar that limited further losses in the USD/JPY pair. The Wards Total Vehicle Sales raised to 16.3M against the estimated 15.8M and supported the U.S. dollar that ultimately limited further losses in the USD/JPY pair.

Meanwhile, the rising demand for safe-haven appeal in the market also supported the safe-haven Japanese Yen that ultimately weighed on the USD/JPY pair. The U.K. entered into a third nationwide lockdown on Monday as the daily count of new coronavirus cases surpassed 60,000 figure for the first time since the pandemic started. The PM Boris Johnson said that it was crucial to control the spread of a new variant of coronavirus that was more contagious.

Meanwhile, Germany also stretched its nationwide lockdown until the end of the month and announced tougher new restrictions to curb rising cases of coronavirus infections. New York on Monday reported its first case of a new variant of the coronavirus that has been reported in more than 30 countries so far. In the past four days, the U.S. has added about 1 million new coronavirus cases that have pushed the total number of cases beyond 21 million. This rising number of cases across the globe added fears for the recovery of the global economy and increased the appeal for safe-haven that ultimately supported the safe-haven Japanese Yen and added weight on the USD/JPY pair on Tuesday.

Daily Technical Levels

Support   Resistance

102.49      103.08

102.24      103.44

101.89      103.68

Pivot point: 102.84

USD/JPY – Trading Tips

The technical side of the USD/JPY also remains mostly unchanged as the USD/JPY is trading sharply bearish at 102.74. On the downside, the USD/JPY pair may find support at the 102.595 level along with resistance at 102.930. The USD/JPY pair has formed a downward channel on the two-hourly timeframes, which is likely to keep the pair bearish. The MACD and 50 EMA is suggesting selling bias in the USD/JPY. Let’s consider taking sell trades below the 102.850 level today. Good luck!

Categories
Forex Basic Strategies

Two Ways To Trade The ‘Descending Top’ Chart Pattern Like A Pro

Introduction

The Descending Top is a technical chart pattern that frequently appears on the Forex price charts. Each peak of the price in this pattern is lower than its previous peak. The descending top chart pattern’s appearance indicates a downtrend in the market, and we must only look for sell trades at that point.

This pattern can be recognized when the first peak is lower than the second peak and the second peak is lower than the third peak. For instance, if the first peak is at 88.00, and the price drops down to 83.00, then the second peak at 85.00, and drop to 80.00, and if the next peak is below 85.00, we can see the descending top pattern forming on the chart, and we should then looks out for selling trade in an underlying asset.

If the next peak is higher than the previous peak, instead of being lower, the pattern gets invalidated, and the market goes up, or it will consolidate. We will often witness the descending top pattern on lower timeframes, and we should not be expecting this pattern to form on the higher timeframes. The reason is that in a higher timeframe, the pullback is very less, and even the trend soon comes to an end.

To identify the pattern, we must spot two tops on the price chart, which are descending, and then we must draw a line to connect these tops.

Descending Tops – Trading Strategies

Now that we know what a descending top pattern is, we will see how to combine it with other technical tools to trade this pattern.

Channel Trading

The first step is to identify the descending top pattern on the price chart. After that, identify the bottom between the two tops and draw a horizontal support line. Then wait for the break below the support line to enter a trade. Place the stop loss below the second top of the pattern and ride the trade. As we know, we cannot stay in a trade forever. We have to close our trade at some point. To close the trade, wait for the price to break the channel.

Example 1

As you can see in the image below, we have identified the descending top pattern in the EUR/USD 5 minute chart.

As you can see, when price action printed the pattern, we started preparing to take sell trades, and when the price broke below the most recent support area, it was a sure sign for us to go short. As we took the sell trade, the price immediately came back to retest the support area. Here, we choose to scale our trade at the support line and go for the brand new lower low.

Initially, our trade goes to a 1.1255 area, and we were looking for more profit in the trade. The trade failed to print the lower low furthermore, and it broke above the channel at around 1.274. Here, we choose to close our trade as that was a sign of the trend getting reversed. The Forex market is all about probabilities. We cannot expect the price to do what we want it to do. Instead, follow the rules of the game. When the market gives less profit, accept it, and don’t try to break the rules.

Descending Top Breakout Trading Strategy

As we know, the descending top is a pattern that gives the selling trades. But in this strategy, we will show you how to use it to take the buy trades. To enter a buying trade, we should wait for the price action to break above the descending top trend line. Your stop-loss order must be placed below the last bottom of the chart. Stay in the trade as long as price action prints the brand new higher high and exit your whole position when the prices break below the upper trend line.

The image below represents the descending top pattern on the price chart, and also it represents our entry, exit, and stop-loss in this pair. As you can see, when the price action prints the descending top pattern, it immediately goes down, and it prints the lower low.

In this one, we were looking for the breakout above the descending top chart pattern, and when the breakout happened, we were all set to take the buy trade. After our buy entry, price action prints a brand new higher high aggressively. When it gave the reversal signal, we choose to close our whole position, and the stops below the entry should be good enough.

Strategy Roundup

The descending top is a chart pattern that gave us potential selling trades. Trading this pattern is quite reliable, and when it gives the trading opportunity, we must trust it and go big. To identify this pattern, we must spot a price top, followed by a lower top. Take an entry below the most recent higher low and go for the brand new lower low and place the stop loss just above the entry. If you desire a safe trade, choose to place the stop loss above the first top.

We hope you find this educational article informative.  Let us know if you have any questions in the comments below. Cheers!

Categories
Forex Market Analysis

Daily F.X. Analysis, January 05 – Top Trade Setups In Forex – ISM Manufacturing PMI In Focus!


On the news side, eyes will remain on European Unemployment Change and the ISM Manufacturing PMI manufacturing data from the U.S., Both of the figures, are expected to drive moves in Euro and dollar today.

Economic Events to Watch Today  


EUR/USD – Daily Analysis

Today in the early European trading session, the EUR/USD currency pair successfully extended its previous session winning streak and remained well bid around above the 1.2250 level as the U.S. dollar remains on the bearish track despite coronavirus concerns and weak China data. However, the losses in the U.S. dollar were triggered after the U.S. Food and Drug Administration said that 2-different mRNA vaccines now show the extraordinary result of about 95% in preventing Covid-19 infection in adults. 

Apart from this, the Federal Reserve’s expectations would keep rates low for a prolonged period also weighs on the greenback and contributes to the currency pair gains. Meanwhile, the probability of an additional U.S. financial aid package also played its major role in undermining the U.S. dollar. In that way, the U.S. dollar weakness was seen as one of the key factors that benefitted the EUR/USD currency pair.

 In contrast to this, the latest B117 strain of COVID-19 lead to the fresh lockdown restrictions on economic activity in Europe and the U.K., which keep raising doubts over the economic recovery and turned out to be one of the key factors that kept the lid on any additional gains in the currency pair. As of writing, the EUR/USD currency pair is currently trading at 1.2262 and consolidating in the range between 1.2246 – 1.2278.

The sentiment around the global equity market has been flashing red since the day started amid worries about the continuous surge in new COVID-19 cases. Also fueling the risk-off mood was the cautious sentiment ahead of the Georgia election and the Sino-American tussle. As per the latest report, Japan saw a record number of COVID-19 cases in recent days, which in turn, Prime Minister Yoshihide Suga said that he would consider declaring a fresh state of emergency in the Tokyo area. 

Across the ocean, the U.K. Prime Minister Boris Johnson also gave warnings over the possibility of tougher lockdown restrictions in the U.K., which instantly overshadowed the optimism over vaccines’ rollout for the highly contagious disease and contributed to the equity market losses. However, the intensifying concerns about rising COVID-19 cases and the intensifying lockdowns could cap further gains in the currency pair.

Daily Technical Levels

Support   Resistance

1.2179     1.2279

1.2144     1.2344

1.2078     1.2379

Pivot Point: 1.2244

EUR/USD– Trading Tip

The EUR/USD is trading with a mixed bias at the 1.2272 level, having violated the upward trendline at the 1.2252 level. At the moment, the pair is likely to face resistance at the 1.2307 level along with a support area of 1.2245 and 1.2215. Bullish bias seems dominant today as the 50 periods EMA supports the pair at 1.2245 level. However, the MACD stays in a sell mode, as histograms are being formed below 0, supporting selling bias. 


GBP/USD – Daily Analysis

During Tuesday’s European trading hours, the GBP/USD currency pair failed to extend its previous session winning streak and took some offer well below the 1.360 level mainly due to the continuous surge in new COVID-19 cases in the U.K., which raised doubts over the U.K. economic recovery and turned out to be one of the key factors that kept the currency pair down. On the contrary, the broad-based U.S. dollar weakness, triggered by multiple factors, failed to support the GBP/USD pair or ease the bearish pressure. At this particular time, the GBP/USD currency pair is currently trading at 1.3556 and consolidating in the range between 1.3556 – 1.3612.

Despite the risk-off market sentiment, the broad-based U.S. dollar failed to gain any positive traction and dropped near multi-year lows amid the probability of an additional U.S. financial aid package and speculations Fed will keep interest rates lower for a longer period. Apart from this, the optimism over a possible coronavirus vaccine pushes investors towards riskier currencies and higher-yielding assets rather than the safe-haven asset, which eventually leads to further losses in the safe-haven U.S. dollar. 

However, the U.S. dollar losses were seen as one of the key factors that benefitted the EUR/USD currency pair. As of now, the U.S. Dollar Index that tracks the greenback against a bucket of other currencies dropped by 0.04% to 89.812 by 8:49 PM ET (1:49 AM GMT).

Apart from Brexit and U.S. headlines, the currency pair came under pressure as the market’s risk sentiment was affected by the increase in the number of coronavirus cases worldwide. 

The rising number of infections from COVID-19 raised fears that countries might extend the restrictions that would have a negative impact on global economic recovery. These fears kept the risk perceived GBP/USD pair under pressure and kept its gains limited during the Asian session on Monday.

Daily Technical Levels

Support   Resistance

1.3623      1.3705

1.3573      1.3737

1.3540      1.3788

Pivot Point: 1.3655

GBP/USD– Trading Tip

The GBP/USD pair has also violated the support level of 1.3609 level extended by an upward channel, which has now been violated. On the higher side, the Sterling may find resistance at 1.3609 and 1.3698 level while support at 1.3533 level today. The Cable is crossing below 50 periods EMA, and the MACD is also forming histograms below 0, suggesting strong selling bias. We should consider taking a selling trade the Cable below 1.3607 level today. 


USD/JPY – Daily Analysis

The USD/JPY continues trading with a bearish bias at the 102.930 level, as it looks clear direction while taking rounds to 103.10/15 through the opening hour of Asian trading sessions. The yen pair descended to the new low in 10 months the prior day before closing with the Doji candlestick’s near opening levels on the daily chart. The risk-aversion stream, supported by concerns of the coronavirus (COVID-19) tension and the unadventurous spirits ahead of the Georgian elections, battles the greenback recovery and holds the USD/JPY in a compact range off-late.

The U.S. Dollar Index that includes the worth of the greenback against the basket of six major currencies was dropping by 0.25% to 89.67 on the day to insignificantly beneath the level it closed 2020 at 89.766. The U.S. dollar instability appended to the downward momentum of the USD/JPY pair. The Federal Reserve is scheduled to publish the minutes from its December conference on Wednesday. Investors will be watching for more detail on the talks about securing their forward policy guidance more specific and the chance of additional development in asset buying in 2021. 

The USD/JPY pair was also down in initial trading hours on Monday as the rising number of coronavirus cases throughout the world raised the safe-haven appeal in the market. Prime Minister Boris Johnson urged that strict lockdown stipulations would be placed in England to fight against the new variant of coronavirus that has pushed the infection rates to their highest record levels. School unions have raised called for the closure of all schools for a couple of weeks as the virus was spreading faster, but Johnson said to parents that they should send children to school as the threats to young kids from the deadly virus were very small.

 From the U.S. side, at 19:45 GMT, the Final Manufacturing PMI from the U.S. for December is projected to come as 56.3 against the previous 56.5 and weigh on the U.S. dollar add in the losses of USD/JPY pair. At 20:00 GMT, the Construction Spending for November is estimated to decrease to 1.1% against the previous 1.3% that could weigh on the U.S. dollar and USD/JPY pair as well.

Daily Technical Levels

Support Resistance

103.02     103.34

102.85     103.49

102.70     103.66

Pivot Point: 103.17

USD/JPY – Trading Tips

The USD/JPY is trading sharply bearish at 102.940, gaining support at the 102.940 level. The USD/JPY pair has formed a downward channel on the two-hourly timeframes, which may extend resistance at 103.300 as at the same level 50 periods EMA is also extending resistance. Today, we need to keep an eye on the 102.940 mark as a violation of this may offer us a sell trade until the 102.598 level. The MACD and RSI are suggesting selling bias in USD/JPY today. Good luck!

Categories
Crypto Market Analysis

Daily Crypto Review, Jan 5 – Ethereum Outpaces the Market; Most Cryptos in the Red

Daily Crypto Review, Jan 5 – Ethereum Outpaces the Market; Most Cryptos in the Red

The cryptocurrency sector experienced volatility amongst cryptos as Bitcoin continues its retracement and Ethereum outpaces the market. Bitcoin is currently trading for $31,479, representing a decrease of 4.15% compared to yesterday’s value. Meanwhile, Ethereum’s price has increased by a whopping 11.70% on the day, while XRP gained 1.27% of its value.

Daily Crypto Sector Heat Map

Birdchain gained 1498.92% in the past 24 hours, making it the most prominent daily crypto gainer by far. It is followed by Folgory Coin’s 837.8% and Rewardiqa’s 720.43% gain. On the other hand, Basiscoin Share lost 98.58%, making it the most prominent daily loser. It is followed by Basiscoin Cash’s loss of 90.24% and Mith Cash’s loss of 78.91%.

Top 10 24-hour Performers (Click to enlarge)

Bottom 10 24-hour Performers (Click to enlarge)

Bitcoin’s market dominance has moved down slightly since our last report, with its value currently being 68.2%. This value represents a 0.5% difference to the downside than the value it had when we last reported.

Daily Crypto Market Cap Chart

The cryptocurrency sector capitalization has decreased since we last reported, with its current value being $845.71 billion. This represents a $14.82 billion decrease when compared to our previous report.

_______________________________________________________________________

What happened in the past 24 hours?

_______________________________________________________________________

_______________________________________________________________________

Technical analysis

_______________________________________________________________________

Bitcoin

Bitcoin has possibly ended its retracement and entered sideways trading as its price created a double bottom at the $30,000 mark. However, there was one point where the largest cryptocurrency by market cap dropped as much as 20% and broke $28,000 to the downside, but recovered almost instantly.

BTC is currently right above the $30,807 Fib retracement level and is fighting to stay above it. If it posts a candle that shows it consolidated above this level, we could see another push towards the upside. However, if it breaks the Fib retracement, we could see BTC looking for support at the $30,000 or $29,300 levels.

BTC/USD 4-hour chart

Bitcoin’s technicals are showing a strong tilt towards the buy-side, with only the 4-hour time-frame showing bearish oscillator values.

BTC/USD 1-day Technicals

Technical factors (4-hour Chart):

  • Price is slightly above its 50-period EMA and at its 21-period EMA
  • Price is near its middle Bollinger band
  • RSI is neutral (48.20)
  • Volume is slightly above average

Key levels to the upside          Key levels to the downside

1: $34,800                                 1: $30,807

2: $35,000                                 2: $28,337

3: $36,000                                 3: $26,340

Ethereum

Ethereum is certainly one of the most interesting cryptocurrencies in the last couple of days, with its price going from stagnation to skyrocket mode in a matter of hours. While many thought that the initial push above $1,000 is over and that ETH is destined to retrace below it, the second-largest cryptocurrency by market cap managed to do it again – just one day later.

The cryptocurrency managed to bounce off of one of its numerous support levels and propel its price back above $1,000.

Ethereum is now fighting for the $1,000 level, with its price barely staying above it.

ETH/USD 1-hour Chart

Ethereum’s technicals on all time-frames show an overall bullish tilt with hints of neutrality coming from oscillators.

ETH/USD 1-day Technicals

Technical Factors (4-hour Chart):

  • Price is above both its 50-period and its 21-period EMA
  • Price is near its top Bollinger band
  • RSI has left the overbought area (68.56)
  • Volume is significantly above-average

Key levels to the upside          Key levels to the downside

1: $1,047                                     1: $1,009

2: $1,080                                     2: $960

3: $1,169                                      3: $932

Litecoin

Litecoin ended its 2-day bull run after reaching bull exhaustion at the $174.5 mark, after which it started to consolidate. However, the consolidation phase looks like less of a consolidation phase and more like a fight for the $152 Fib retracement level.

Litecoin is currently losing the battle for $152 –  but even in the case of bears pushing it to the downside, its price has many support anchor points, most notably the zone between $135 and $142.

LTC/USD 1-hour Chart

Litecoin’s technicals on the 4-hour and monthly time-frame are completely bullish, while its daily and weekly overviews show some oscillators having bearish values.

LTC/USD 1-day Technicals

Technical factors (4-hour Chart):

  • Its price is currently above both its 50-period EMA and its 21-period EMA
  • Price is at its middle Bollinger band
  • RSI is neutral (58.54)
  • Volume is above-average

Key levels to the upside          Key levels to the downside

1: $163.7                                      1: $155.25

2: $174.5                                      2: $149.3

3: $195.5                                   3: $143.5


Categories
Forex Market Analysis

GBPUSD Advances in an Irregular Correction. What’s Ahead?

The GBPUSD pair advances in an incomplete Elliott Wave Irregular Flat pattern that began on September 01st when the Pound found resistance at 1.34832. Currently, the price action moves in its wave (b) of Minuette degree identified in blue, suggesting a potential decline in the coming trading sessions.

Technical Overview

The big picture of the GBPUSD illustrated in the following daily chart shows the advance in an incomplete upward corrective sequence of Minute degree labeled in black, which began on last March 20th when the Pound found support and fresh buyers at 1.14098 developing a corrective rally. Once completed the three-wave upward sequence on September 01st at 1.34832, the price completed its wave ((a)) in black and began to advance in a sideways corrective formation corresponding to wave ((b)), which remains in progress.

The previous chart shows the incomplete wave ((b)), which at the same time, rallies in a corrective sequence corresponding to wave (b) of Minuette degree identified in blue. This corrective formation in progress could correspond to an irregular flat pattern (3-3-5).

On the other hand, both the trend and momentum indicator confirms the upward bias of wave (b). The stochastic oscillator that acts as a timing indicator carries to suspect the wave (b) could advance in a complex correction. In this regard, the next 8-hour chart illustrates the internal structure of the wave (b).

The second chart exposes the Pound advancing in a triple-three pattern of Subminuette degree labeled in green. According to the textbook, this complex formation identified as w-x-y-x-z follows an internal structural series subdivided into (3-3-3-3-3). In this context, the complex correction in progress looks advancing in its third segment of wave z, which seems like an ending diagonal pattern.

In consequence, the GBPUSD should end this complex corrective rally in the coming trading sessions giving way to a new decline corresponding to wave (c) of Minuette degree.

Technical Outlook

The short-term structure developed by GBPUSD corresponds to an ending diagonal pattern, which suggests the finalization of the current corrective rally before starting a new decline.

The next chart exposes the Pound in its 8-hour time frame, which could make a new upward move, surpassing the ending diagonal pattern’s upper-line with a potential target in the area between 1.3700 and 1.3800.

Once the ending diagonal pattern finalizes, a breakdown below the Invalidation Level at 1.3439 would confirm the start of wave (c) in blue. According to the Elliott Wave Theory, this bearish leg should follow an internal sequence subdivided into a five-wave sequence.

On the other hand, considering that the upper degree’s current corrective pattern might correspond to an irregular flat, the price might develop two potential scenarios identified as follows.

  • Scenario 1: If wave (c) finds support above the end of wave (a), the Pound could drop to the demand zone between 1.2916 and 1.2853. This scenario suggests the strong long-term bullish pressure and the Elliott Wave formation should correspond to an irregular flat pattern with the failure in wave (c).
  • Scenario 2: If the price drops violating the end of wave (a) at 1.26753, the GBPUSD could decline to the next demand zone between 1.2553 and 1.2506. This scenario suggests the strength of bearish pressure, and the irregular flat pattern is extended in wave (c).

The price advance in a complex correction is identified as a triple-three formation, which seems moving in its last internal segment, which looks like an incomplete ending diagonal pattern. In this context, the breakdown and close below the 1.3439 would confirm the end of wave (b) and the start of wave (c) of Minuette degree identified in blue.

Considering that the upper degree corrective structure could correspond to an irregular flat pattern, wave (c) offers two potential scenarios. The first scenario could see a potential target between 1.2916 and 1.2853. In the second one, the price could decline between 1.2553 and 1.2506.

Categories
Forex Technical Analysis

Quantitative Trading and Its Differences with Technical Analysis

Today’s article is about definitions. Maybe for those who read us regularly, it is not necessary, but every day new readers approach for whom all this subject of quantitative trading, technical analysis, backtesting, chartismo… etc sounds more or less Chinese. Quantitative trading is my way of understanding trading today. It’s what I do and what I work with. So today I will provide my definition on the subject.

Quantitative Analysis: Talk of Numbers

When we refer to quantitative analysis we are talking about examining numerical variables. In the case of investment or speculation on the stock exchange, we are talking about quotes, volume, indicators, correlations, etc. Other aspects that cannot be reliably quantified, such as the change of the CEO of a company or the results of the presidential elections, are not taken into account. Working on the basis of these numerical variables, quantitative analysis uses mathematical and statistical methods to establish models for developing trading systems.

A quantitative trading system can be very sophisticated and trades highly complex derivative instruments, or it can be a simple system that trades shares. The asset type does not qualify for the type of trading. You need to work with models. I don’t know if you’ve ever heard the phrase: “All models are wrong, but some are useful.” When we refer to quantitative analysis, this is the case. So, indeed, you need to work with models. Why?

I personally have several reasons:

-On the one hand, the models are more accurate than our discretionary judgments. The psychological aspect has an important weight in our decisions.

-We are human and cognitive biases affect our perception of reality. Finding ways to master them is always positive

-They streamline decision-making. Using systems allows you to have a much faster reaction.

-It allows several approaches to be addressed.

-Models or systems give you the framework to work with.

But remember that models are simplifications. In order for a system to be efficient, it needs to cover only part of reality. There is no all-terrain system that never fails and is perfect. Hence, the plan to follow is the use of a portfolio of systems combining different strategies: pairs trading, arbitrations, mean-reverting until even tracking trends.

Working With Odds

In a quantitative trading strategy, you work with probabilities. There are no certainties but probabilistic models to explain the behavior of the market. In algorithmic trading, everything is written. There’s no algorithmic trading without computers.

Quantitative trading, also called algorithmic trading, is a systematic way of trading. It is said that a system does not exist unless its rules are written. Well, in algorithmic trading all rules are written in the computer code of the system. Metrics are used when quantitative trading systems are developed. These metrics and ratios help in the development and use of the system to make decisions.

HFT (high-frequency trading) is quantitative trading, but not all quantitative trading is HFT. It’s understood, right? Quantitative trading is not synonymous with high-frequency trading, nor does it necessarily mean intraday trading. Quantitative analysis can be used perfectly in larger time frames such as daily or even weekly.

What happens is that trading systems that operate in very short periods of time are automatic systems. It is an algorithm that sends the orders to the market and hence the association with algorithmic trading /quantitative.

A trader using a quantitative system may or may not transmit orders automatically to the broker. Transmitting orders automatically is the norm, but it is not mandatory. An automatic system retrieves quotes in real-time directly from the broker or other data provider, executes an algorithm leading to trading signals, and sends orders directly to the broker for execution.

A semi-automatic system, for example, can run the algorithm and generate the input or output signals, but it is you as a trader who is responsible for sending the orders to the broker. The advantage of the automatic system is the reduction of human error. Especially, that kind of human error that causes you as a trader to break the rules of the system. Does it sound like you have made this kind of mistake? It’s impossible to break the rules here. In addition, the obvious advantage is the increase in execution speed, so for systems that work in short time frames, a fully automated system is indispensable.

Quantitative Versus Technical Analysis

Quantitative analysis and technical analysis have commonalities, but also fundamental differences in their principles. To clarify the terms, we start by defining what is the technical analysis

The main idea of the technical analysis is that “the price discounts everything”. All the information you need to make your trading decisions is based on quotes, and in some cases also on volume. From quotes, the technical analyst tries to look for recurring patterns that can predict future price behavior.

This is a common point with quantitative analysis, which can also be based (but not necessarily exclusively) on quotations and look for patterns in them. But what differs is the method and the form.

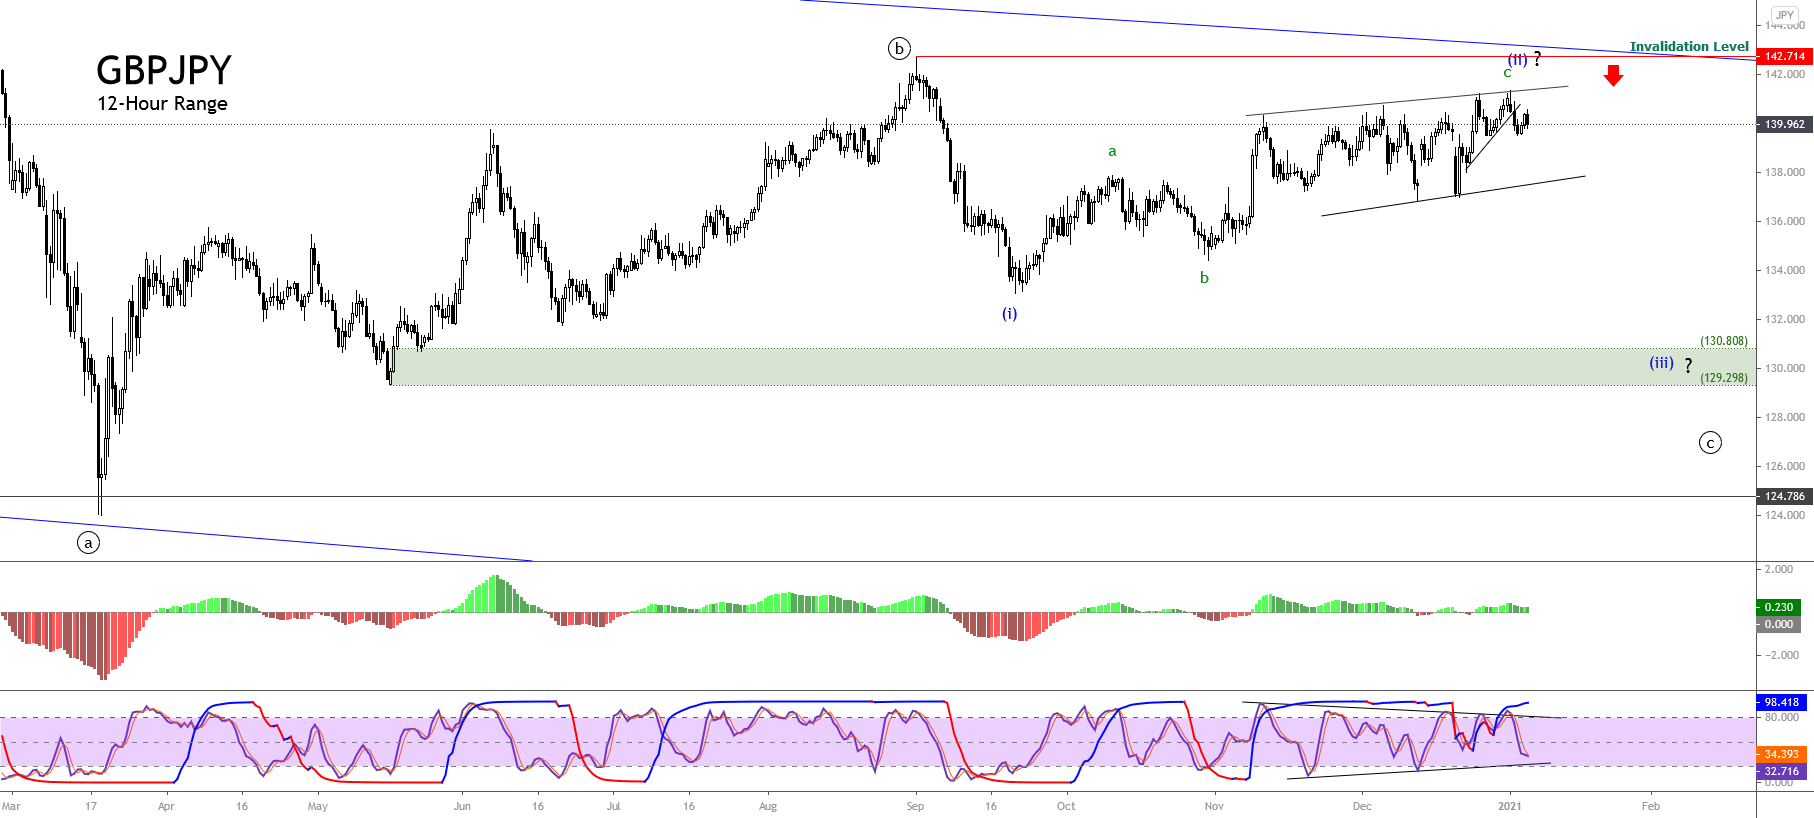
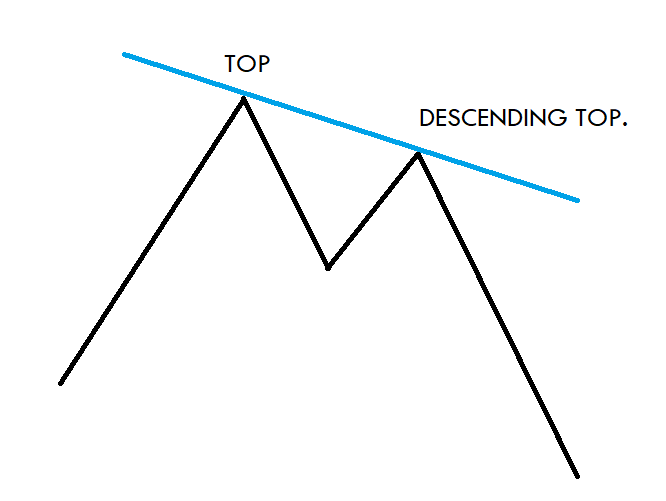
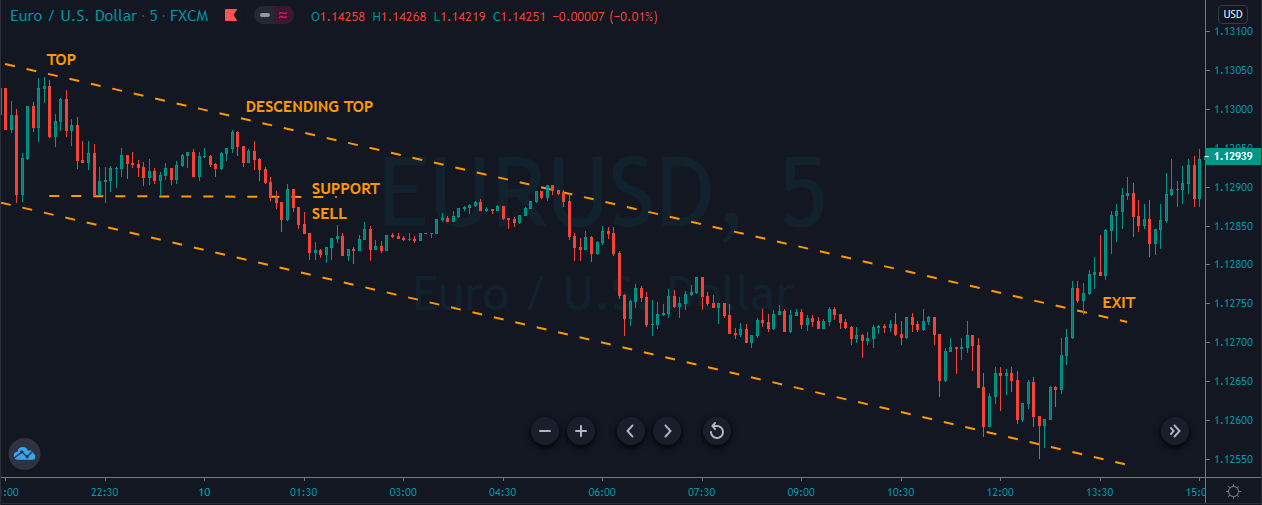
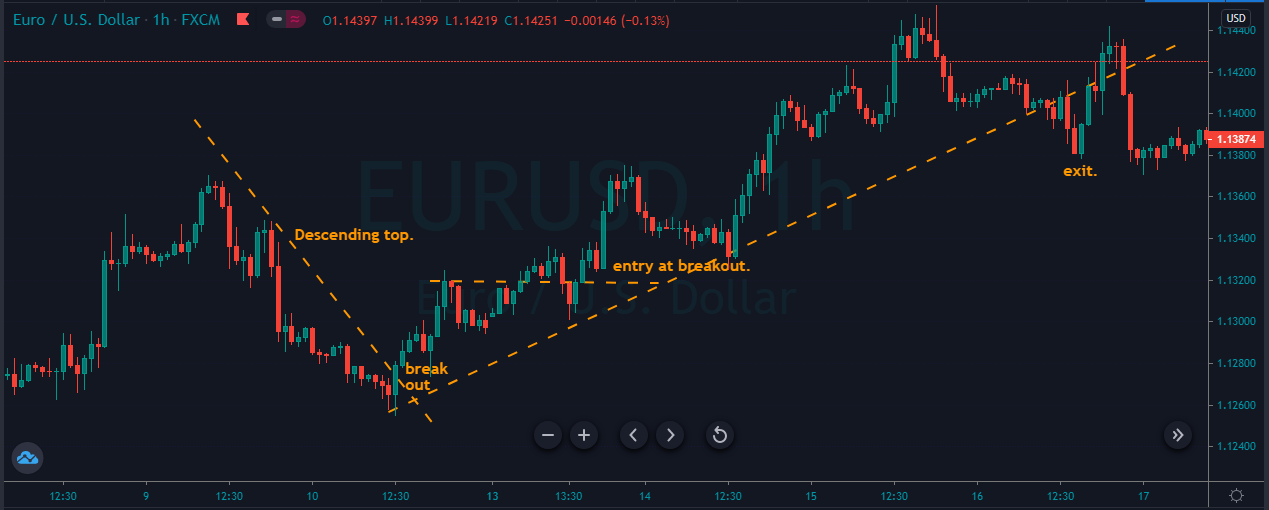
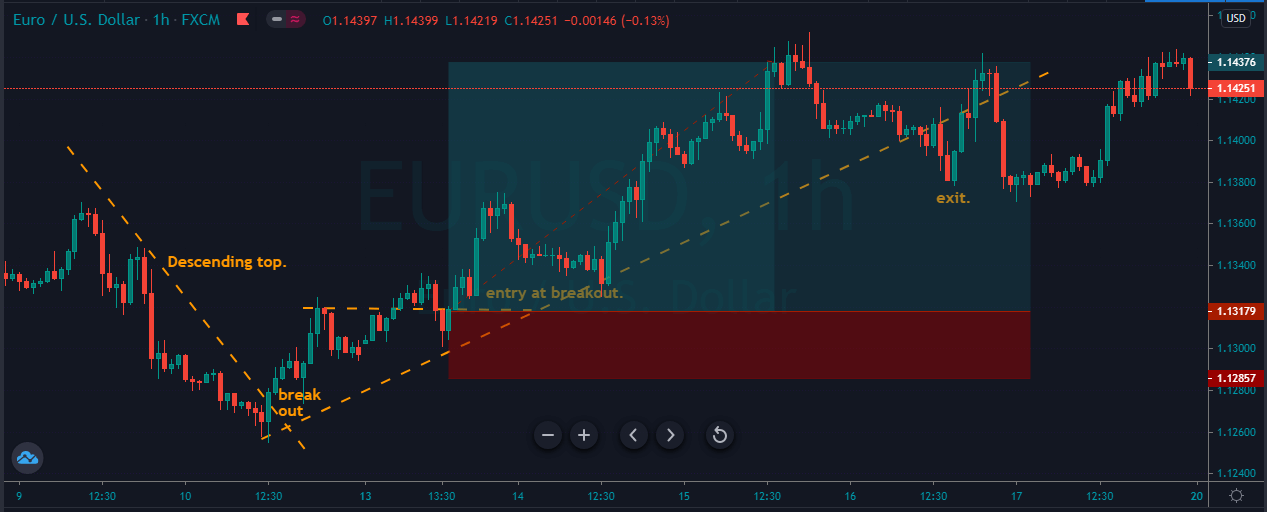
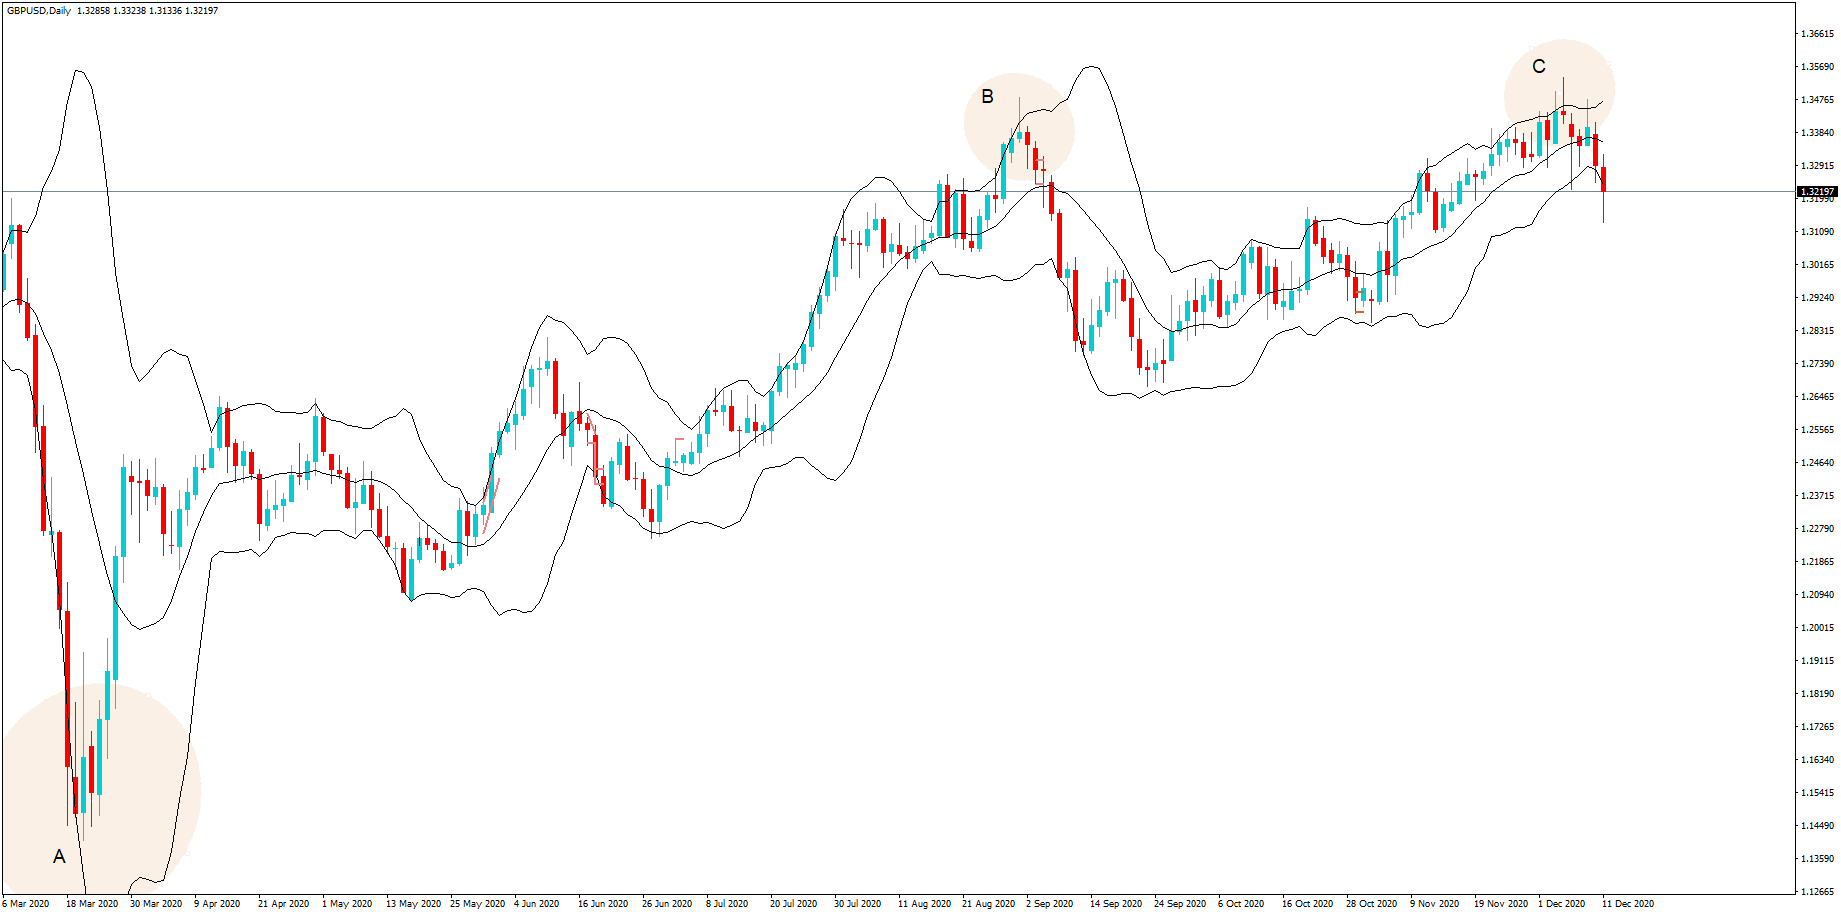
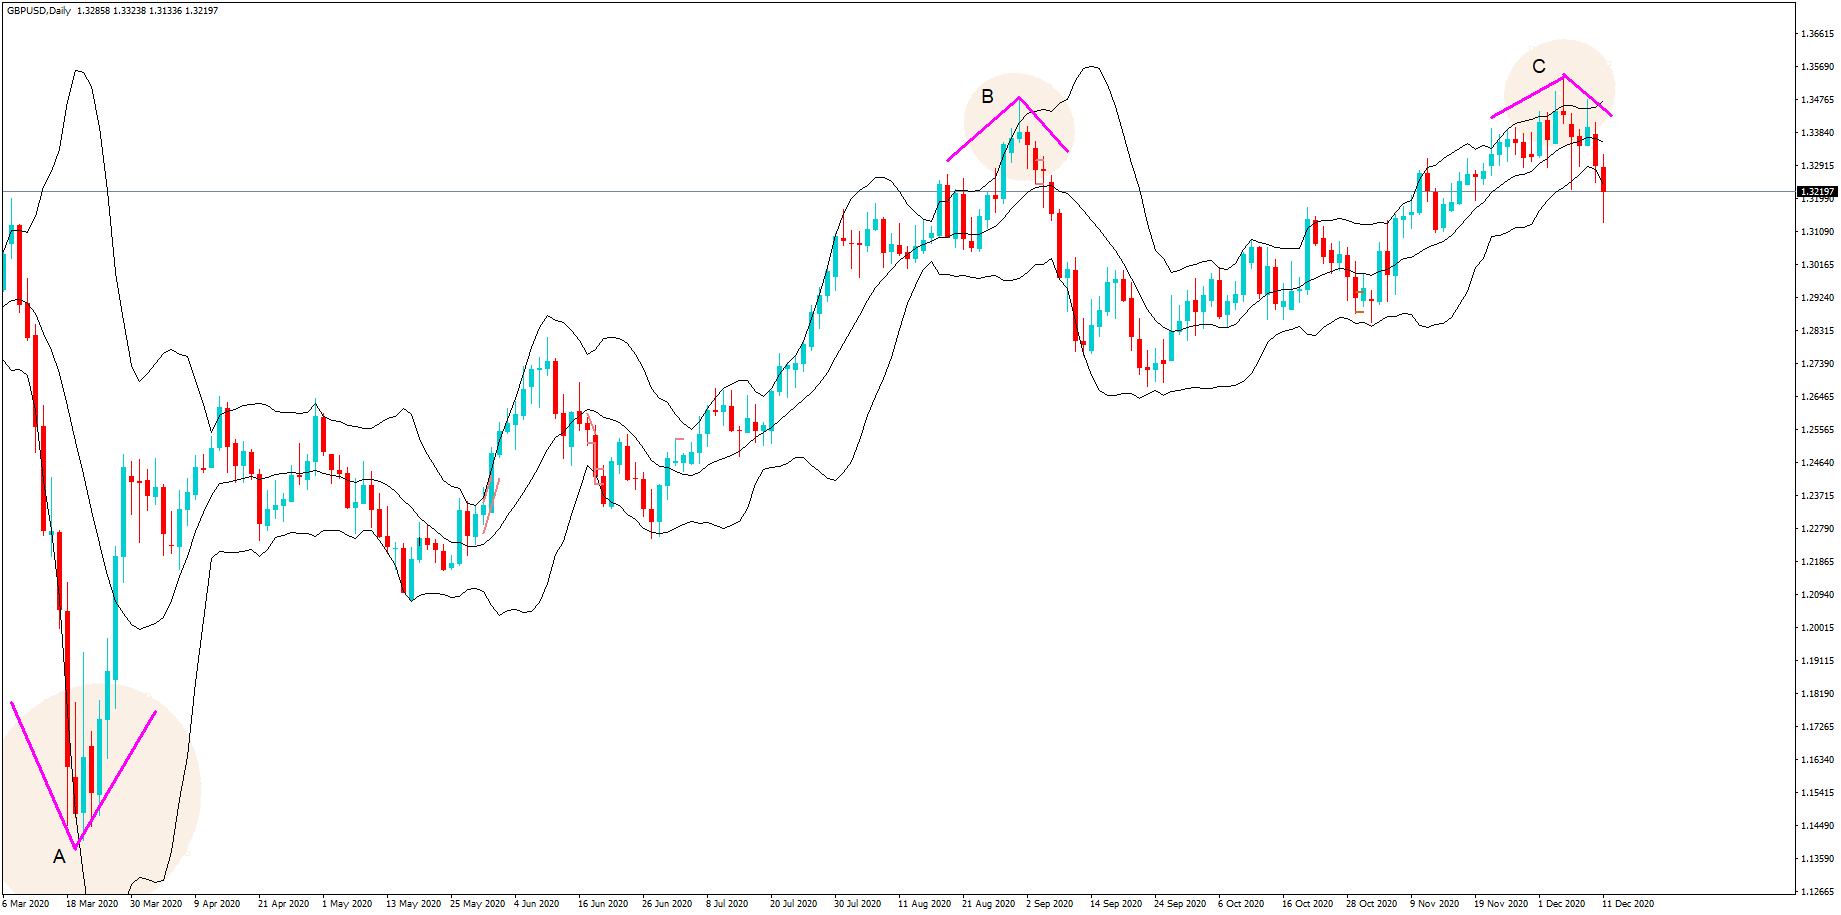
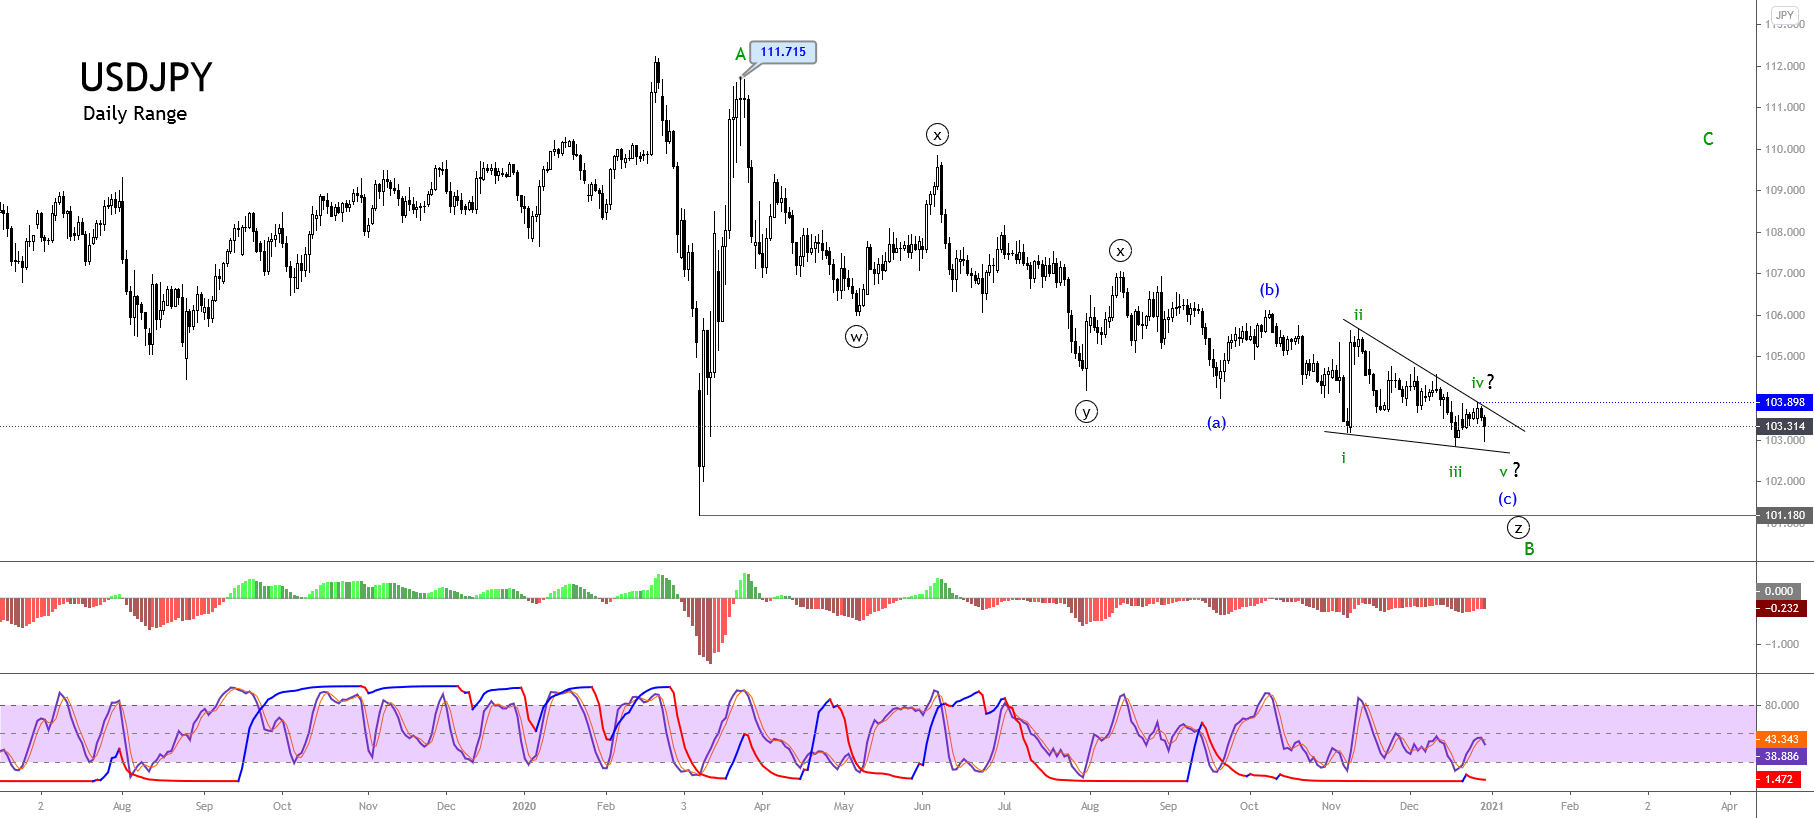
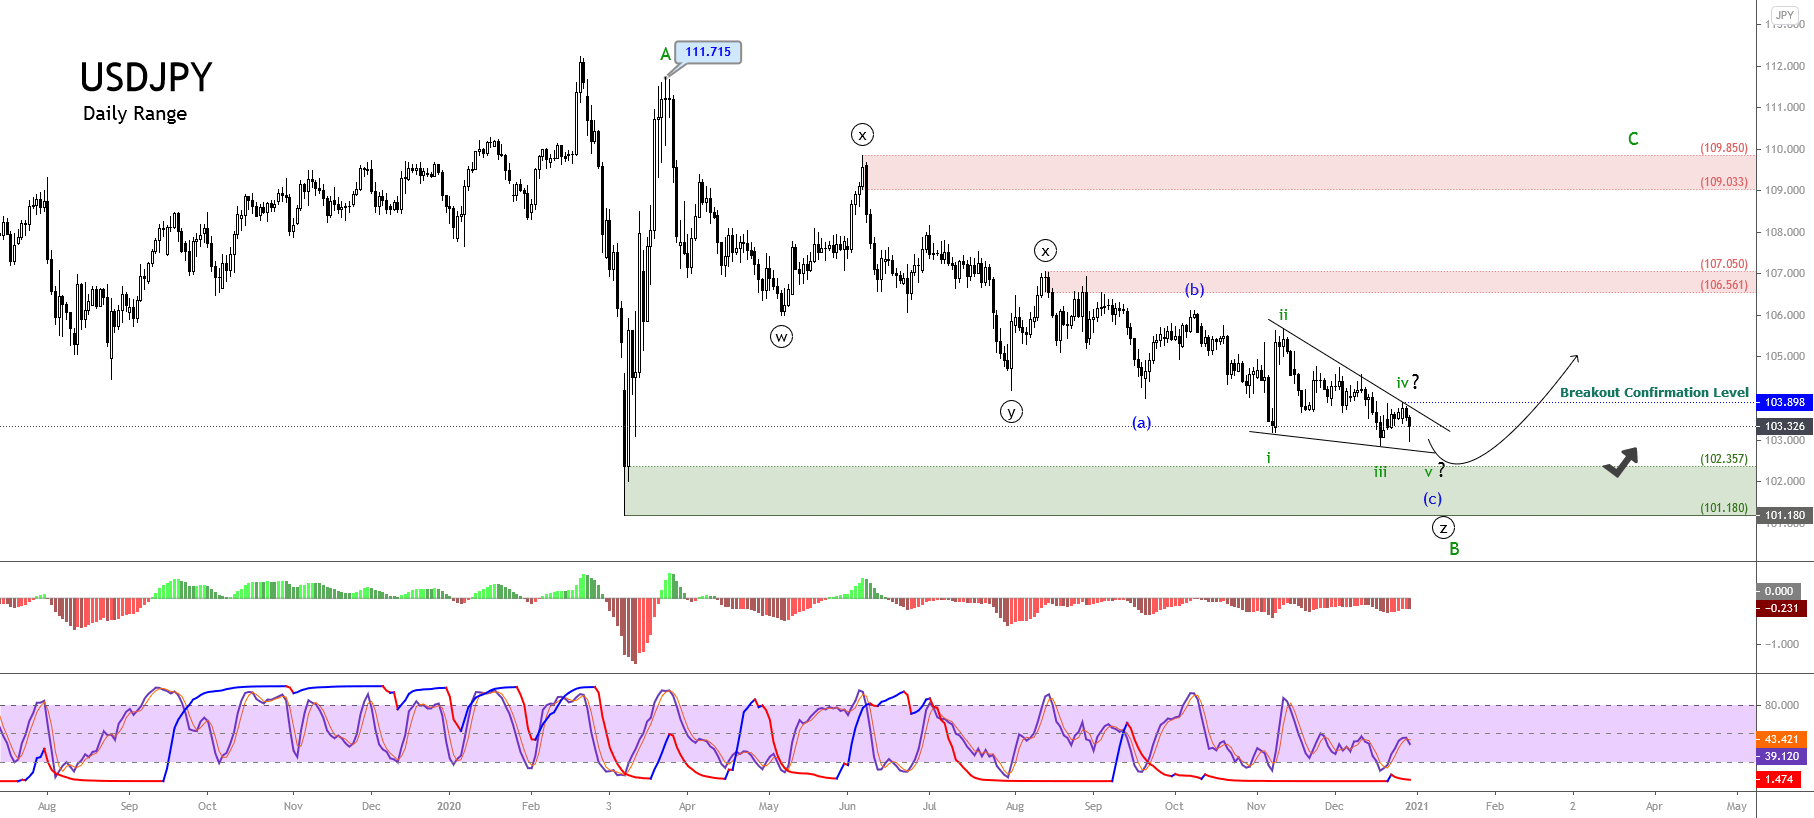
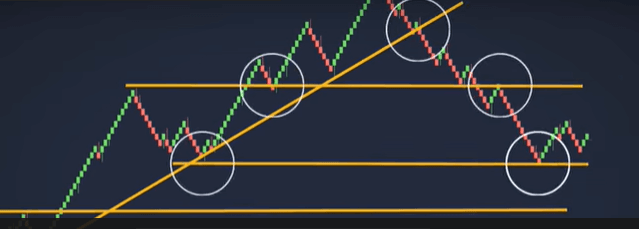
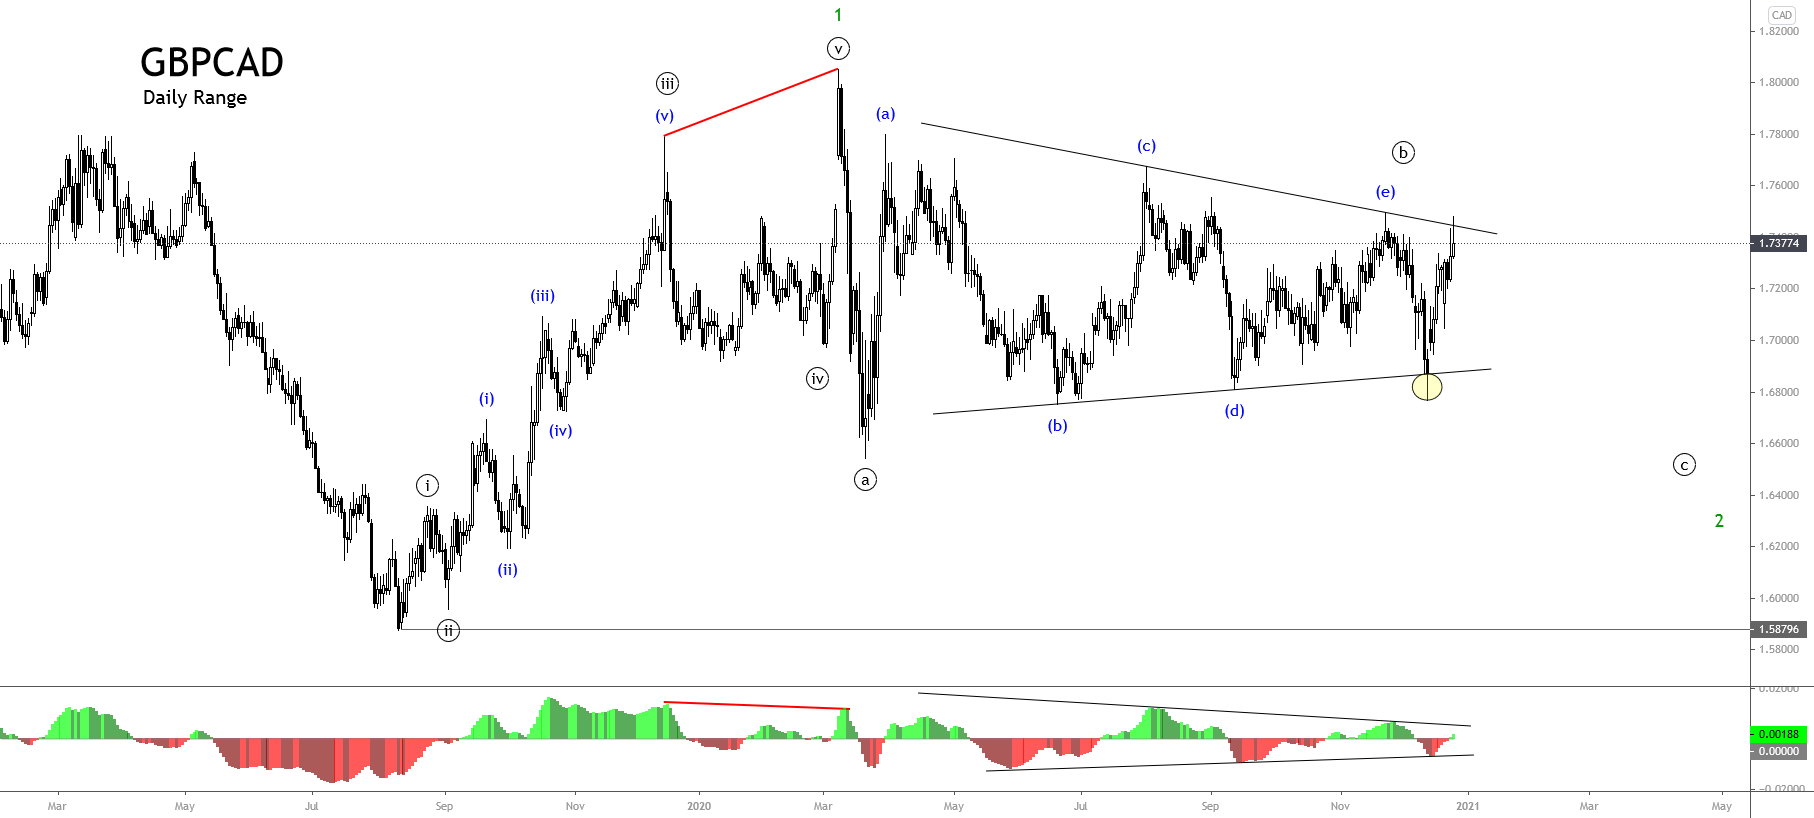
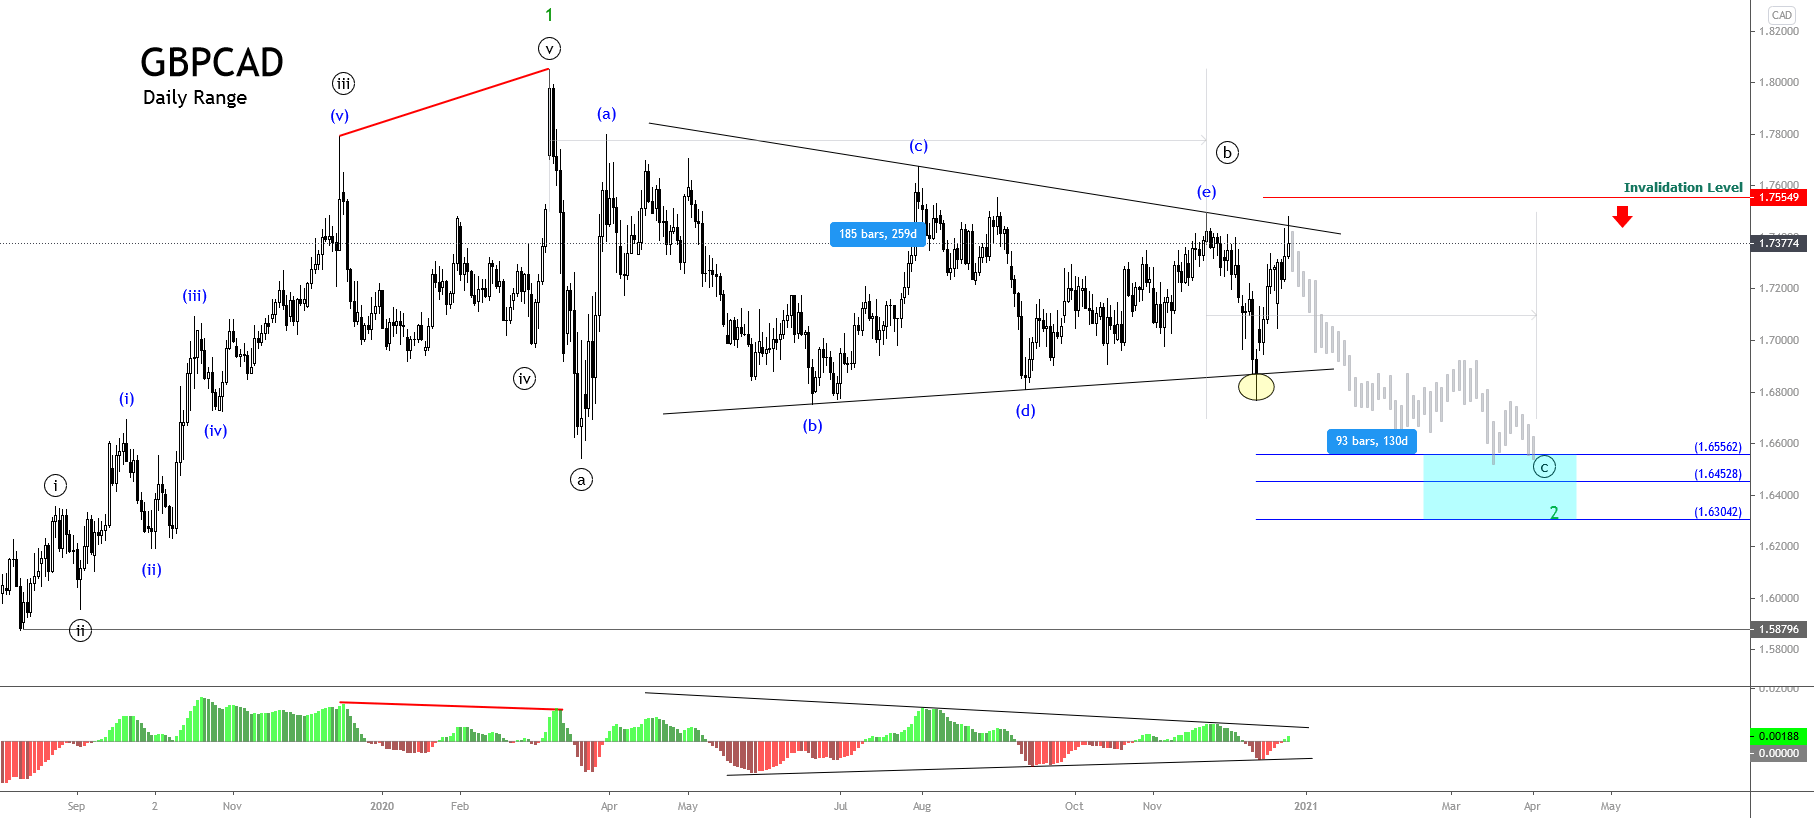
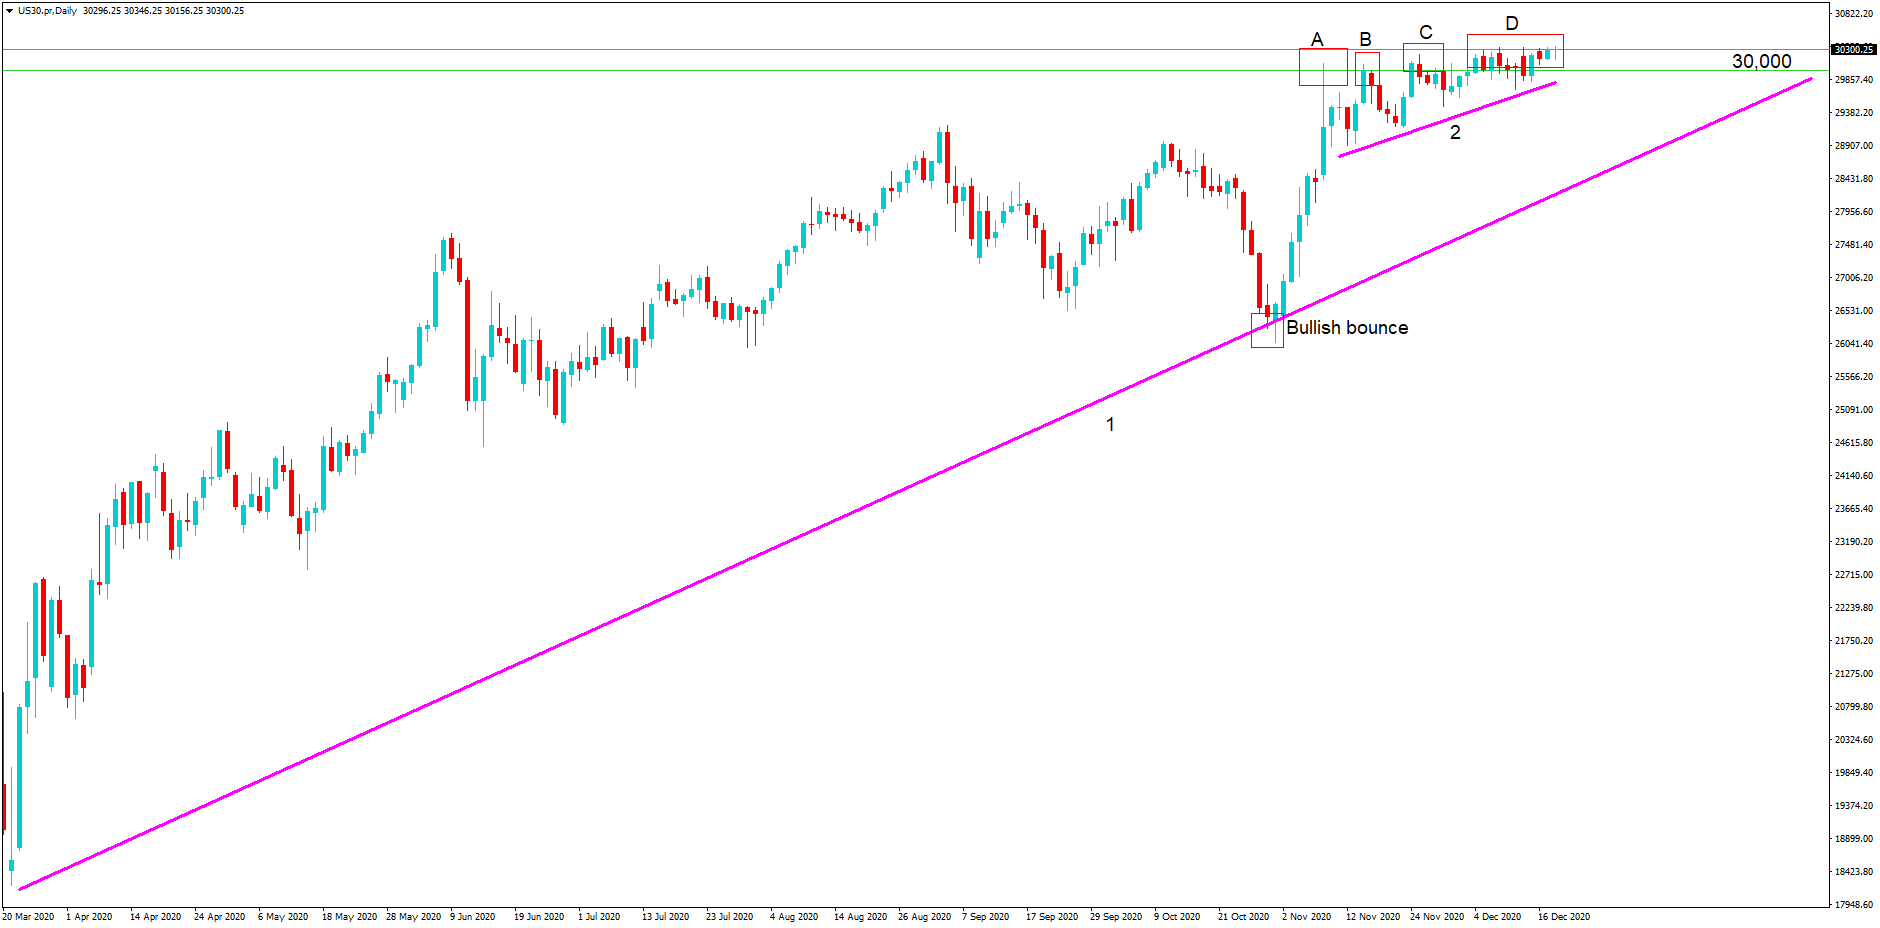
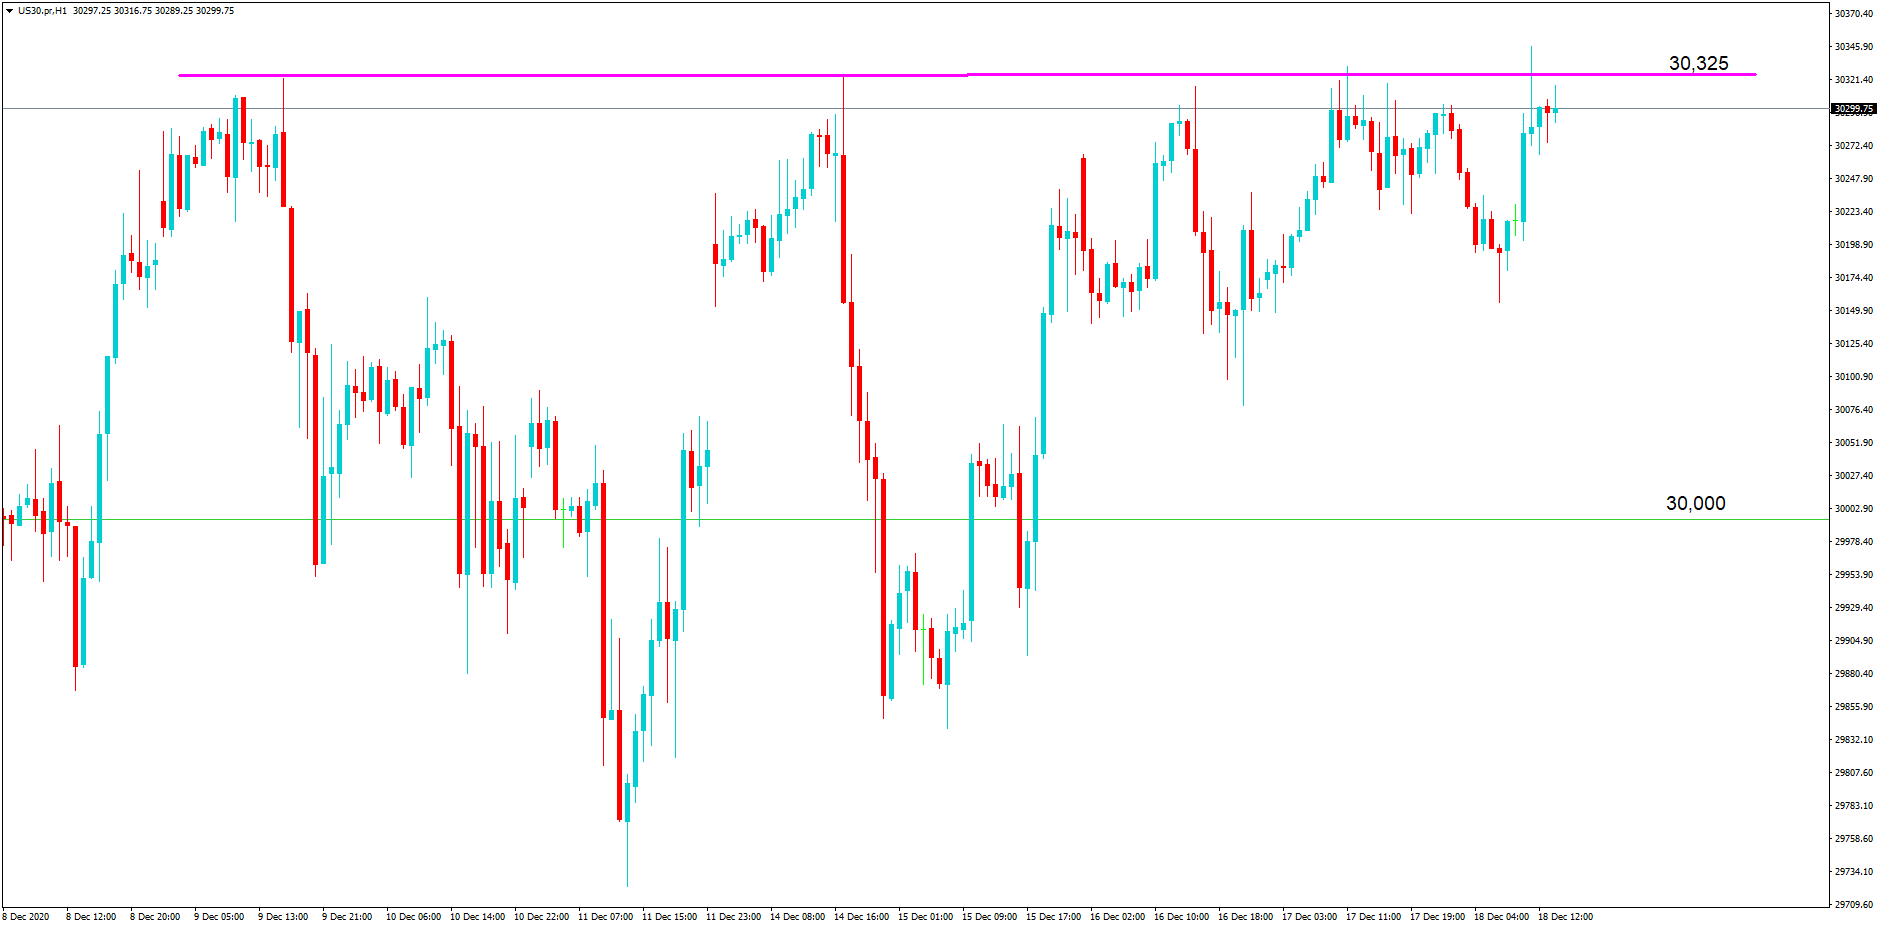
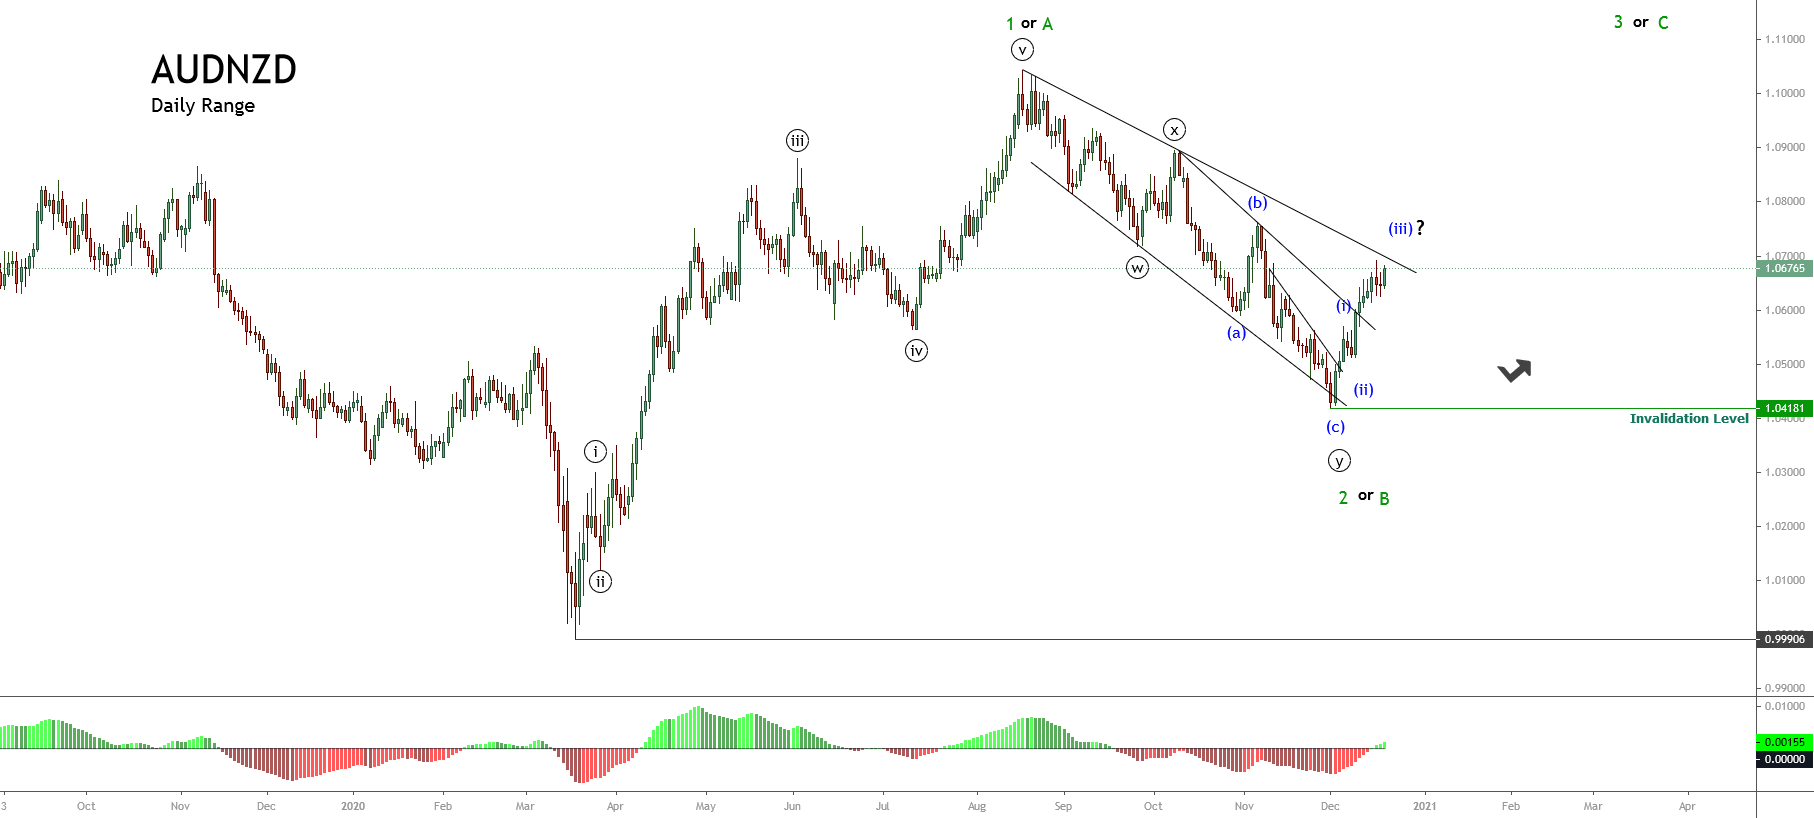
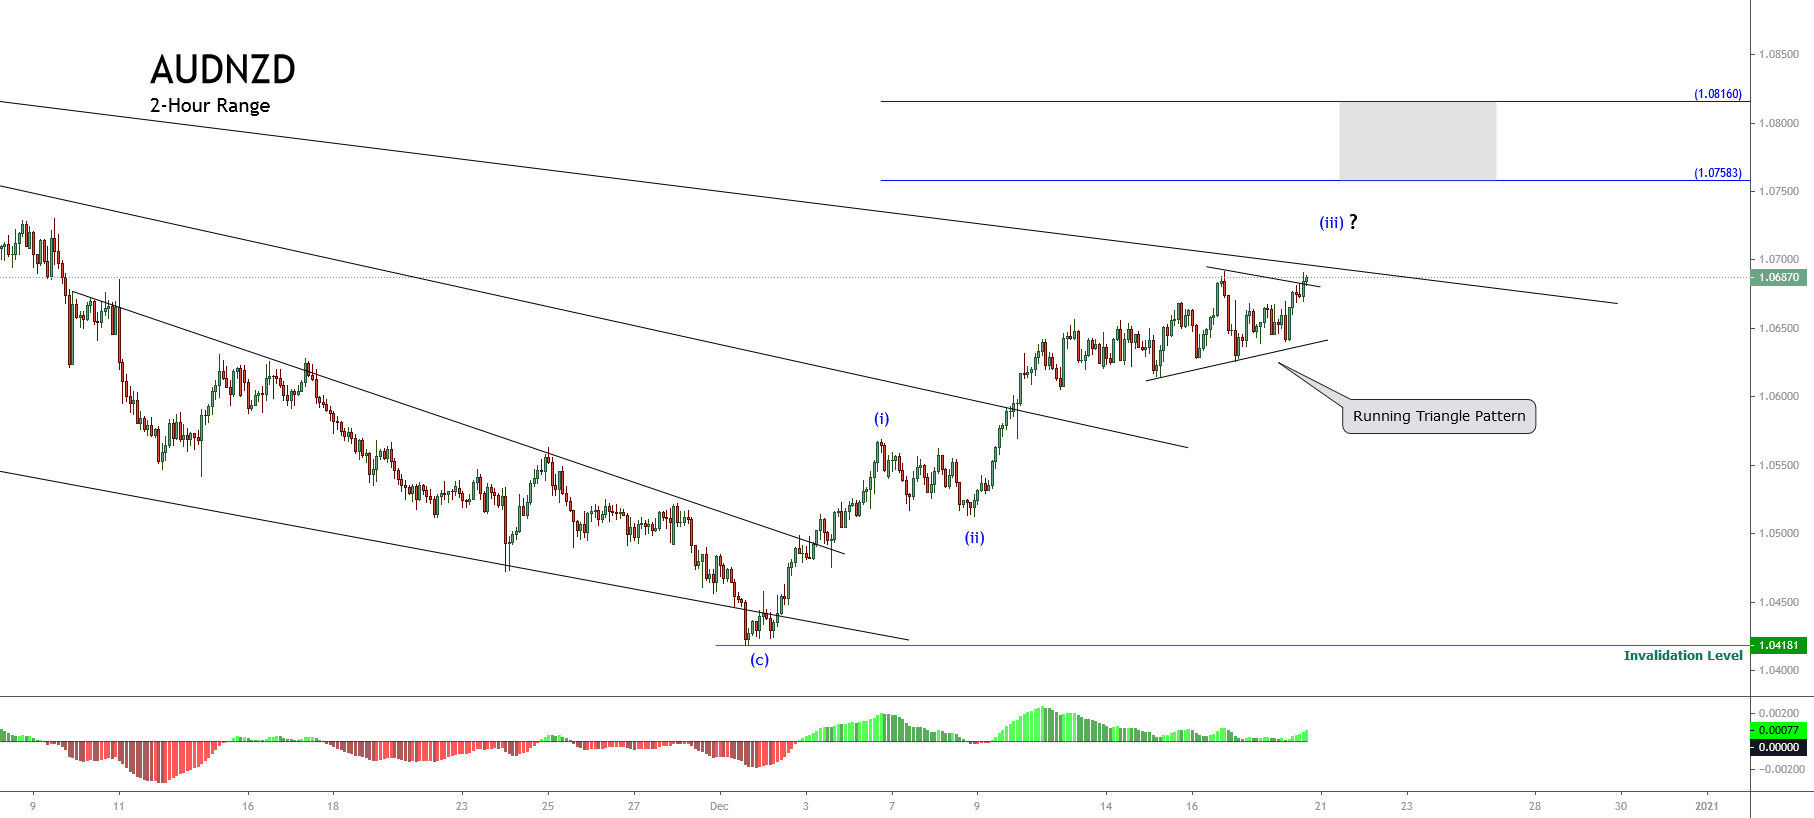
In technical analysis, one way of identifying patterns is chartism. By chartism, we mean figures such as shoulder-head-shoulder, triangles, Elliot waves, etc. Well, chartist analysis based on graphs has a subjective component incompatible with quantitative analysis.

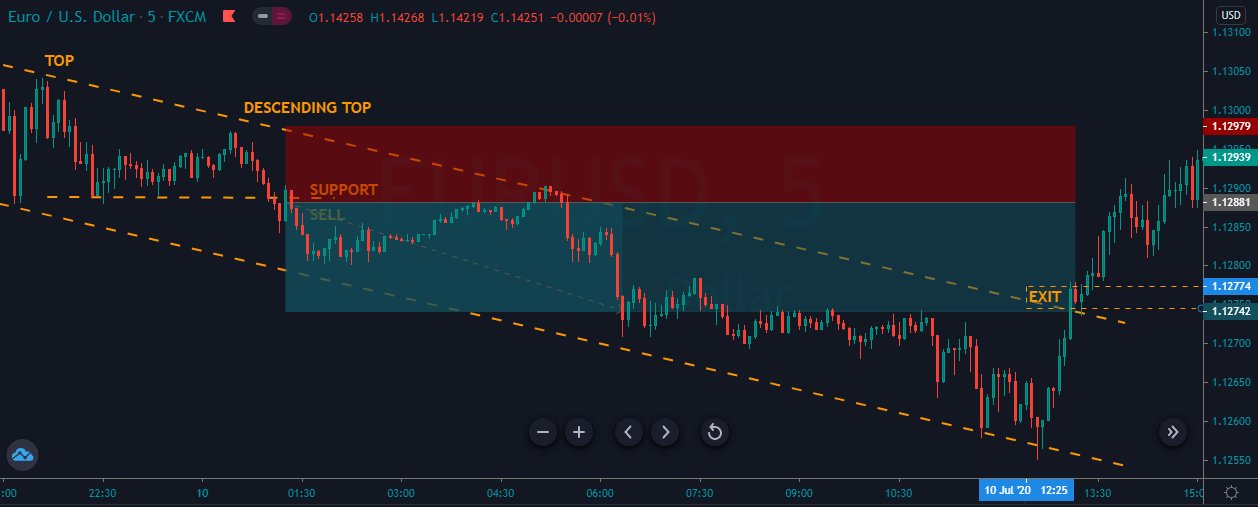
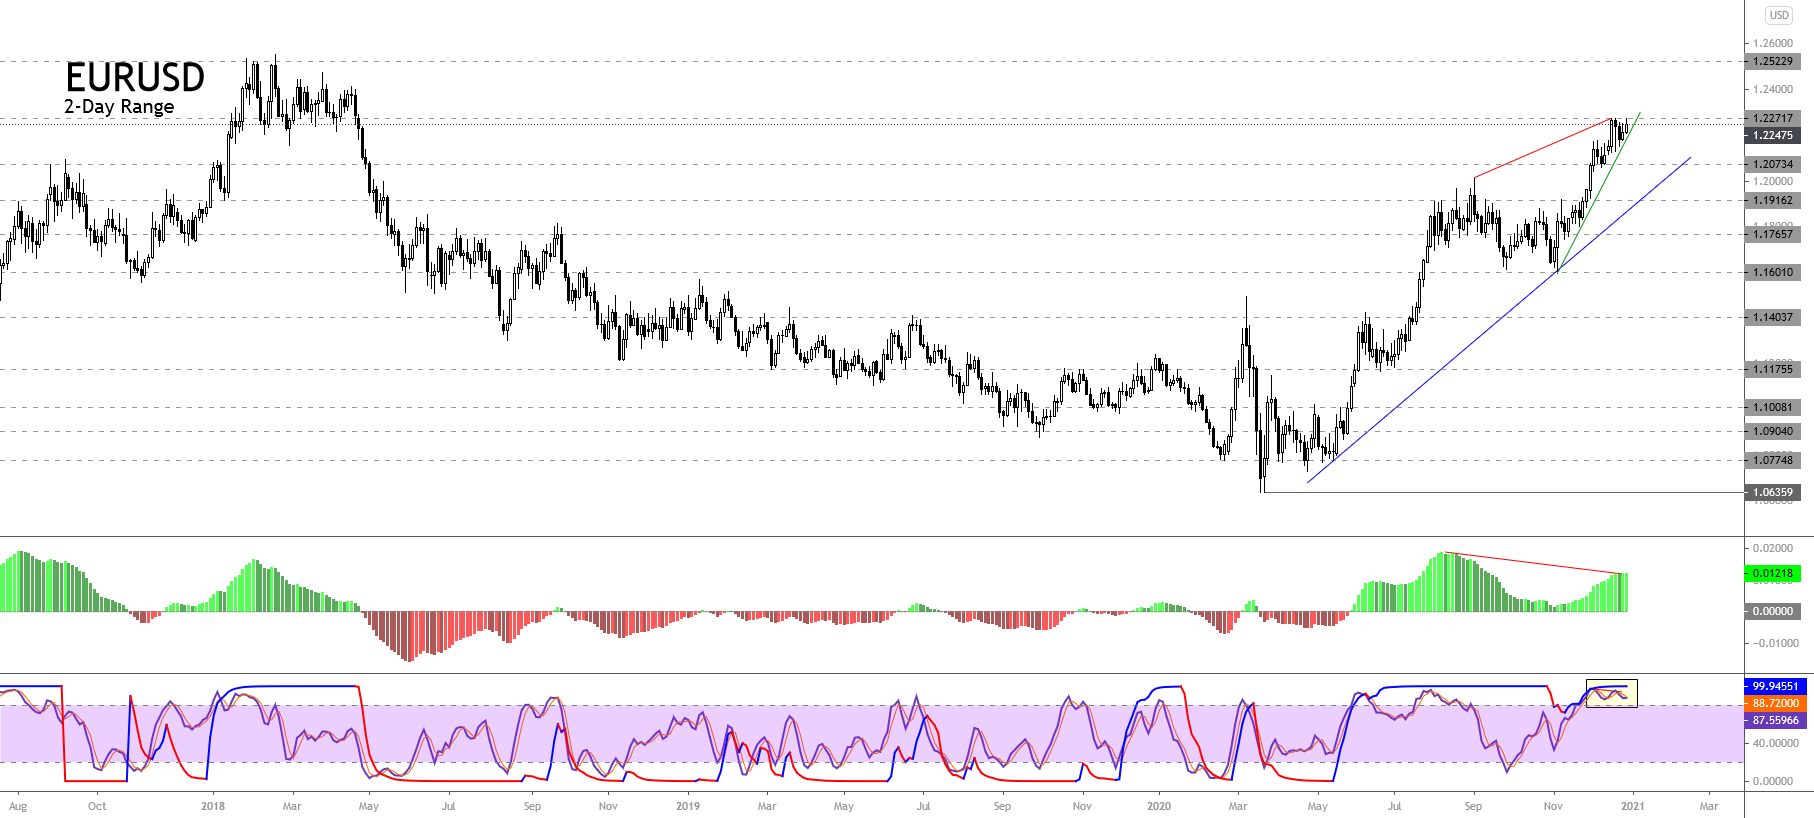
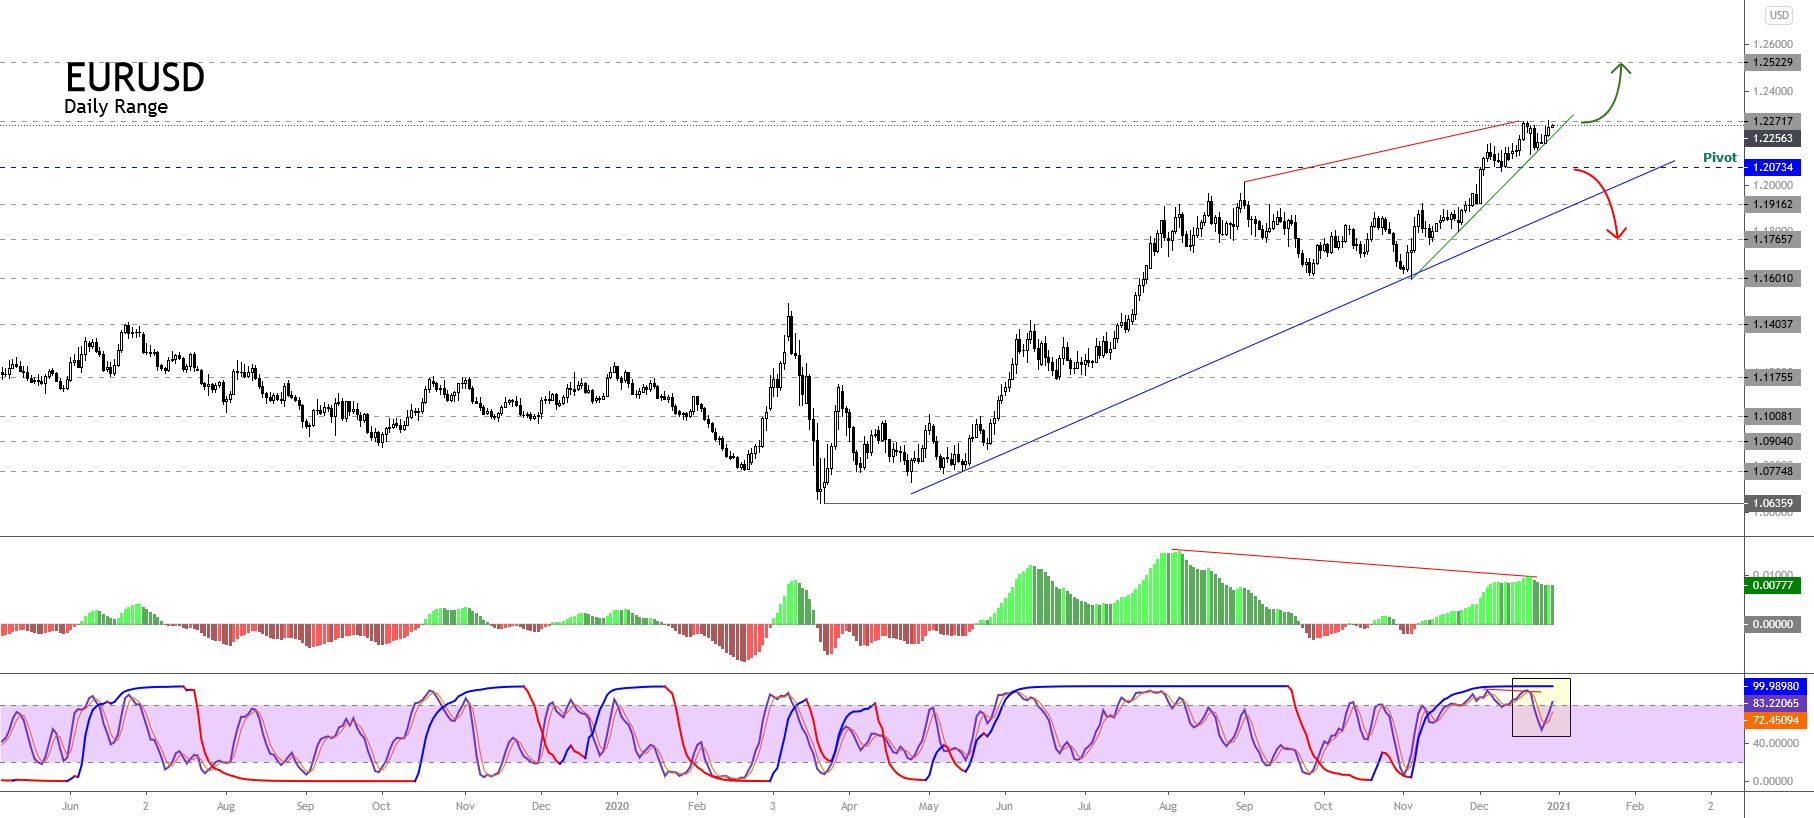
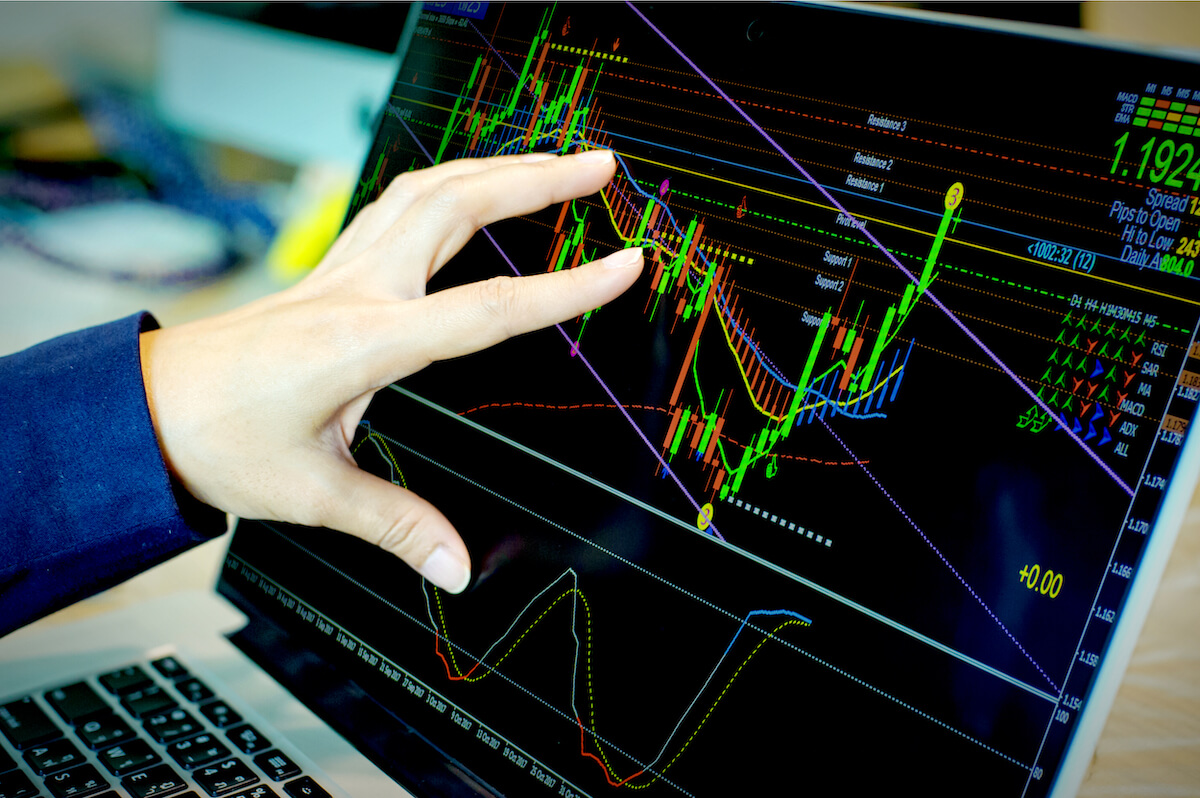
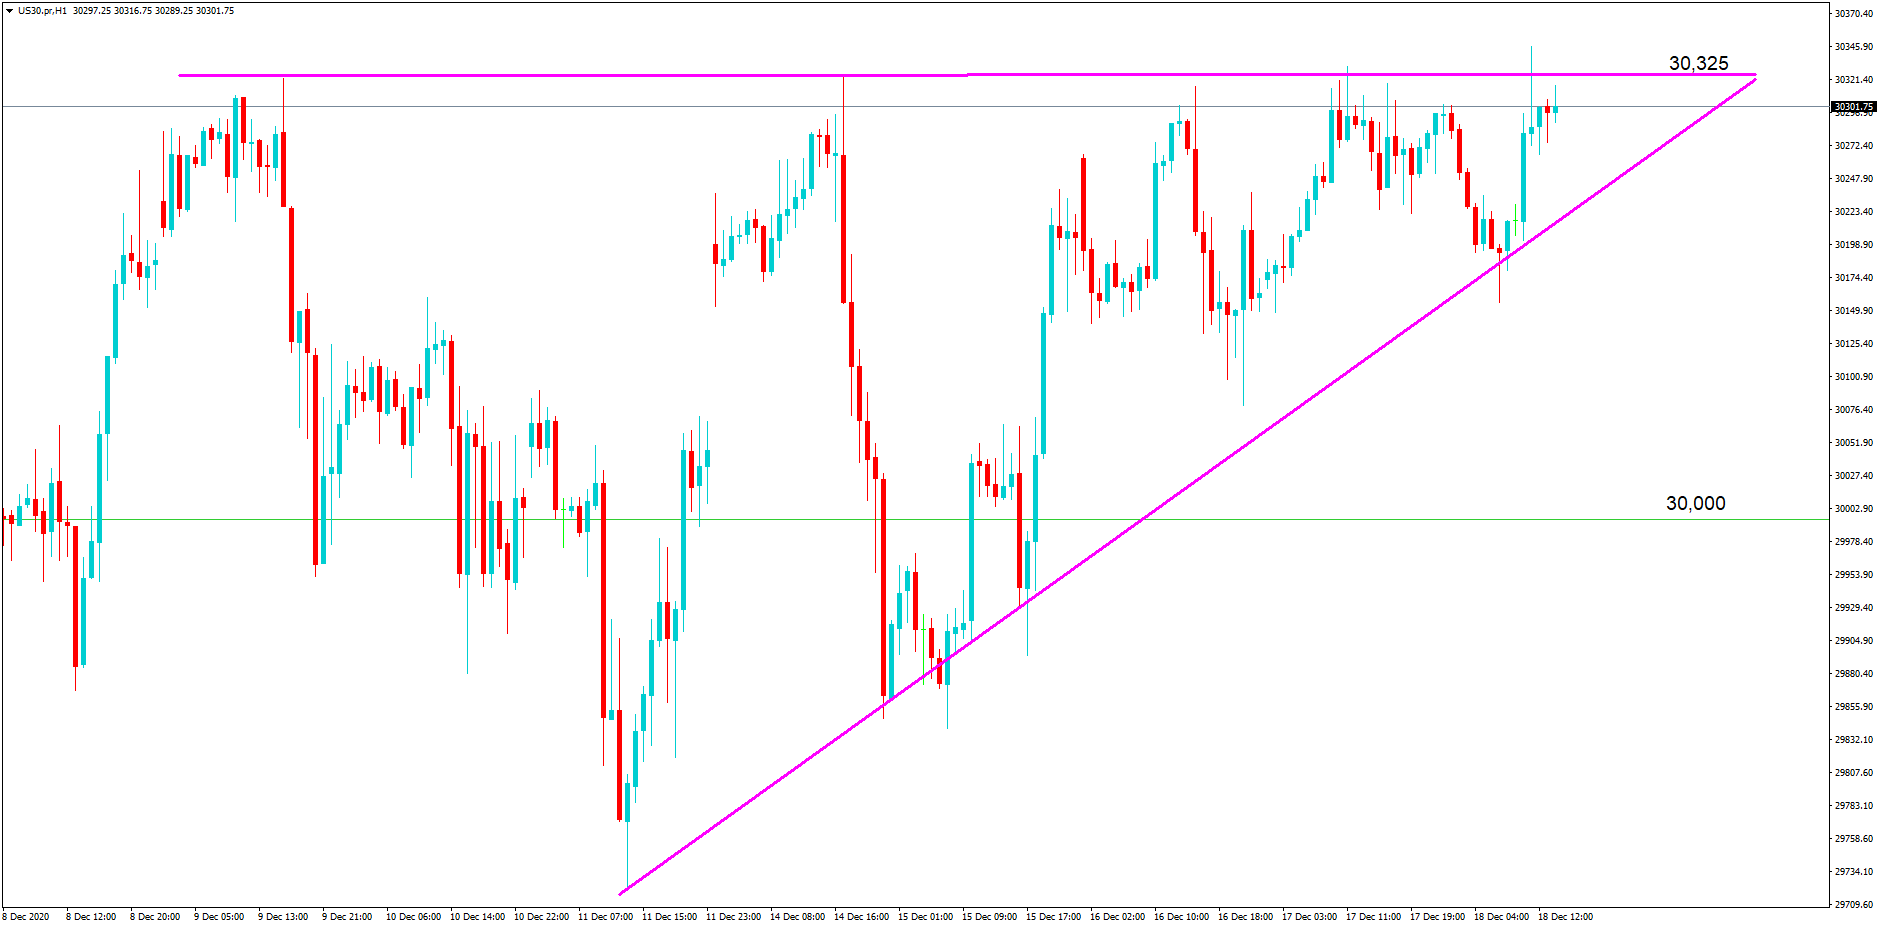
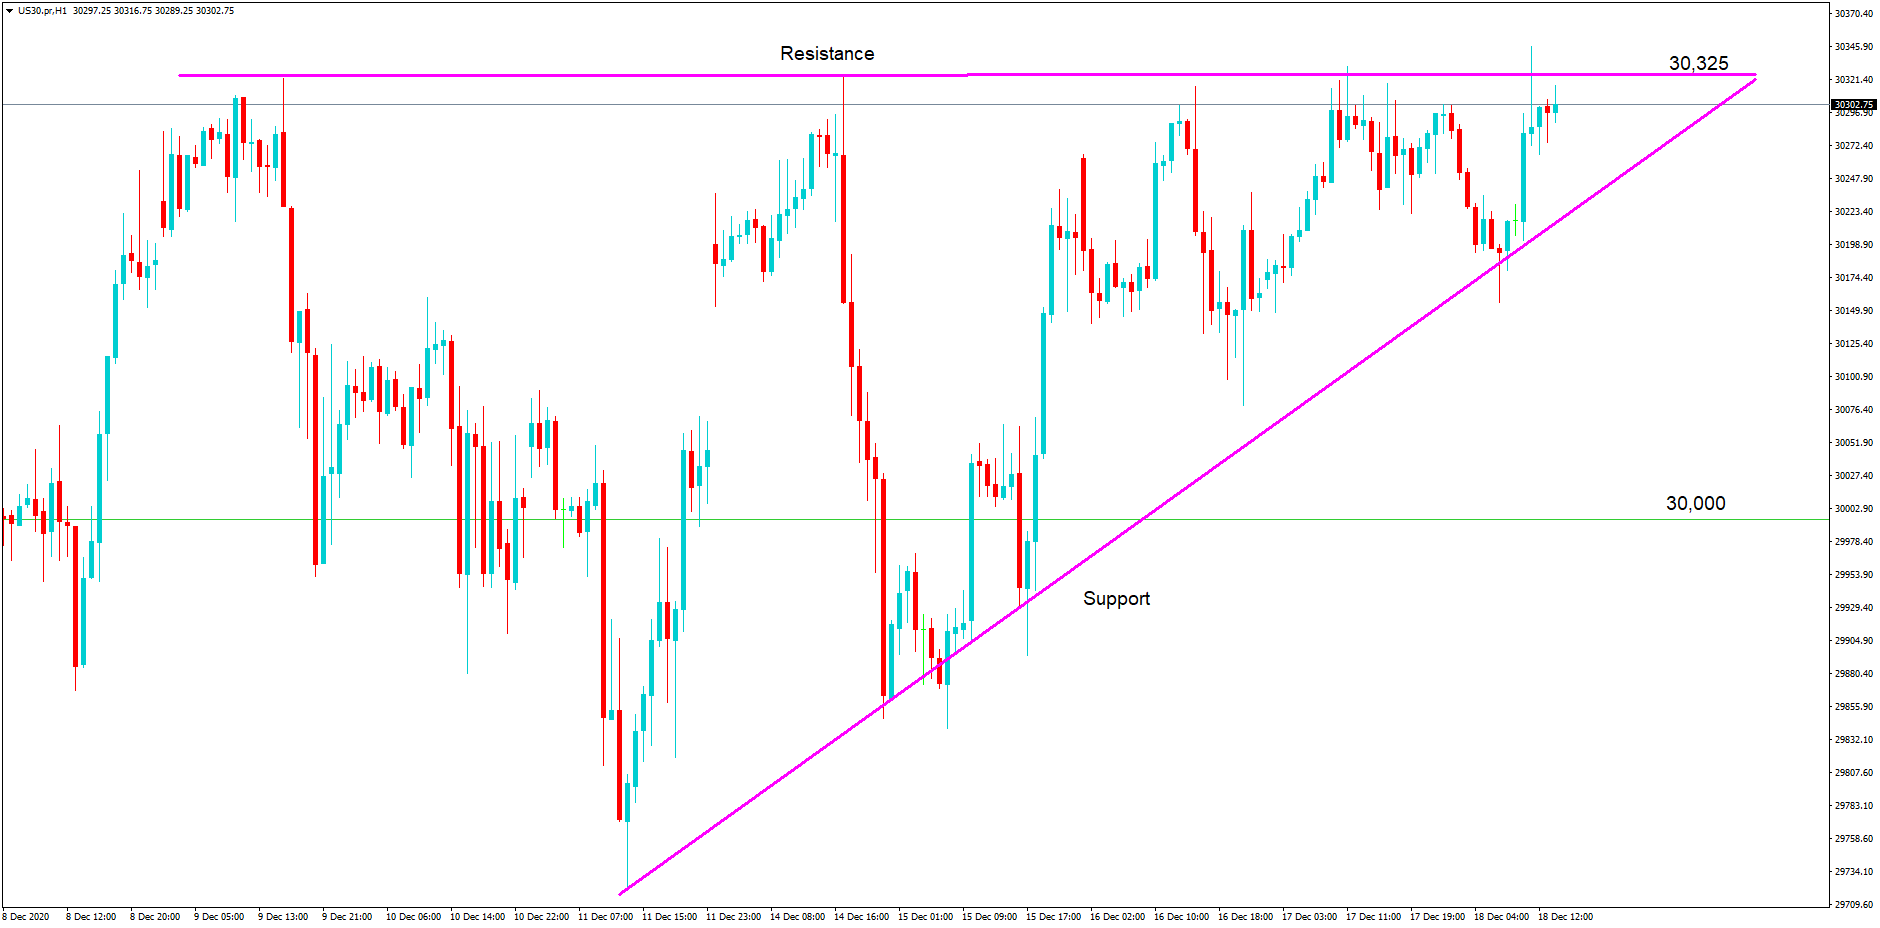
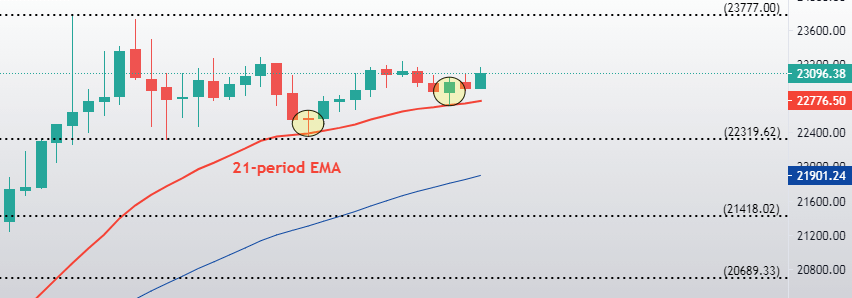
Technical analysis is mainly based on visual examination of charts or charts. By looking at the graphs, trends are established, the points of support and resistance, the crossings of indicators, etc. The technical trader makes his decisions, usually discretionary, looking at the charts and trading according to what he sees.

On the other hand, quantitative trading is not based on what you see in the chart. If you want, you can illustrate your system by plotting the signals on a chart, but it is not essential to generate the input and output signals to the market. Your signals come from the trading system you’ve programmed, not from what your eyes see.

Discretionary or Non-Discretionary

Quantitative trading is not discretionary. Trades are taken according to pre-established rules. The trader who operates on the basis of technical analysis does make discretionary decisions. I’ll tell you about my experience when I only operated by following technical analysis. Perhaps you are familiar with it.

1- You’re in front of the screen.

2- You are convinced that now is a good time to do a trade.

3- You look for any sign on the chart. You look, you look and you look.

4- In the end, you end up performing an operation, but based on the emotion and your previous belief that conditions you.

5- Evidently, then you try to justify the operation by arguing technical reasons: that if it looked like a certain figure, that if the resistance X would break, all this only to justify a decision not 100% rational and influenced by your cognitive biases.

Down Theory

The second idea on which technical analysis is based is Down theory. According to this theory, prices are driven by trends. The trader that operates on the basis of technical analysis tries to take advantage of these trends to obtain profitable trades.

Quantitative analysis is not based on this theory. It does not blindly accept that prices follow trends. What you are looking for is to analyze for each asset and time frame how its behavior is. From the results of the analysis, look for the best way to take advantage of the behavior studied.

Backtesting is something that distinguishes quantitative trading from discretionary trading. When you operate a quantitative trading system it’s because you’ve done a backtest before. Discretionary trading cannot backtest because the entry and exit conditions are not the same over time.

Conclusion

Remember that we already said at the beginning of this article, the main characteristic of quantitative trading is that it is based on mathematical and statistical models. Chartist figures, Elliot waves, and hunches are not incorporated here. It is not worth it if in the graph I see a flag or a bat, if I am in wave 4 of the extended third or if it is an ABC. There is no place at all for a subjective opinion. Only data matters. Then we can already say that it is the opposite of discretionary trading.

In quantitative trading, decisions to buy and sell assets, whether shares, ETFs, futures, forex, etc- are based on a computer algorithm. Hence quantitative trading is also known as algorithmic trading. The starting point of a quantitative trading system is data. What types of data? The system can incorporate quotation data such as price and volume, global economic data such as interest rates or inflation, asset financial ratios such as cash flow, income, DTE, EPS, etc.

A technical analysis strategy can be part of a quantitative system if it can be coded. However, not all technical analysis can be included in the quantitative, for example, some chartist techniques are subjective, cannot be quantified, and need candles in the future for the confirmation of the figure. Let’s say one of the differences is in the quality of the analysis. Many technical analysts look for patterns that they say repeat themselves, but cannot prove how often statistics these patterns precede certain price movements.

Categories
Forex Signals

Gold Breakout Ascending Triangle Pattern – Bullish Bias Dominates! 

During Monday’s Asian trading session, the precious metal managed to extend its early-day positive performance and remained bullish around above the $1,920 level as the sharp rise in global COVID-19 cases and the possibility of more countries imposing tighter restrictions tend to underpin the safe-haven yellow metal. Meanwhile, the broad-based U.S. dollar weakness, triggered by the market upbeat mood, also played its key role in underpinning the gold prices as the price of gold is inversely related to the price of the U.S. dollar. However, the market trading sentiment was being supported by the optimism surrounding the coronavirus (COVID-19) vaccine, Brexit headlines, and the U.S. covid aid package. 

In that way, the upbeat market sentiment was seen as one of the key factors that kept the lid on any additional gold gains. Furthermore, the upticks in the gold prices could also be attributed to the escalating US-China tussles, which eventually lend some support to the safe-haven yellow metal. As of writing, the yellow metal prices are currently trading at 1,923.70 and consolidating in the range between 1,893.81 – 1,925.35.

The market trading sentiment managed to extend its last week’s positive performance and stay positive on the day as the U.S. stocks futures’ bullish appearance tends to highlight the risk-on sentiment. Behind this positive performance was the optimism surrounding the coronavirus (COVID-19) vaccine, Brexit headlines, and the U.S. covid aid package. Across the ocean, the latest upbeat prints of Asian activity numbers from Japan, South Korea, Indonesia, and Taiwan for December also played its major role in underpinning the market trading sentiment. However, the positive tone around the market sentiment favors the gold buyers via U.S. dollar weakness.

As a result of the risk-on mood, the broad-based U.S. dollar failed to gain any positive traction and remained bearish on the day. Meanwhile, the losses in the U.S. dollar were further bolstered by the easy money policy of the U.S. Federal Reserve and central bankers elsewhere. It is worth mentioning that the U.S. Federal Reserve is set to release the minutes from its December meeting on Wednesday. In that way, the market players will be looking for more detail on making their forward policy guidance more explicit and the chance of a further increase in asset buying in 2021. Hence, the losses in the U.S. dollar becomes the key factor that helps the gold to stay bid as the price of gold is inversely related to the price of the U.S. dollar. 

Elsewhere, the upticks in the gold prices could also be attributed to the concerns over the coronavirus (COVID-19) and tussles between the U.S. and China. The coronavirus (COVID-19) cases continue to rise, with above 85 million COVID-19 cases as of Jan. 4, with over 20.6 million cases of them in the U.S. Apart from the U.S., Japan is also gaining attention amid the recent surge in the cases and the death toll. As per the latest report, Japan recorded more than 3,100 new cases overnight. While Tokyo reported 816 new infections, bringing the cumulative total to 62,590, the largest among the country’s 47 prefectures so far. This, in turn, the government of Japan is seeking expert advice on whether to declare a state of emergency in Tokyo and neighboring prefectures. 

Looking forward, the market traders will keep their eyes on Caixin Manufacturing PMI for December, which is expected to reprint 54.9. Meanwhile, the second readings of monthly PMIs from Europe, the U.K., and the U.S. can decorate the calendar ahead. In addition to this, the updates about the U.S. stimulus package will be key to watch. In the meantime, the risk catalyst like geopolitics and the virus woes, not to forget the Brexit, will not lose their importance. 


Daily Support and Resistance

S1 1863.1

S2 1879.13

S3 1888.81

Pivot Point 1895.17

R1 1904.84

R2 1911.2

R3 1927.24

On Monday, the gold is trading sharply bullish at the 1,925 level. Gold has disrupted the ascending triangle pattern at the 1,898 mark on the daily chart, and now gold is likely to encounter resistance at 1,933 and 1,965 marks. The buying trend can be seen in gold, but unfortunately, our trades are closed at stop loss. I will be looking to take another buying trade once gold retraces back to 1,913 level. Good luck! 

Categories
Crypto Market Analysis

Daily Crypto Review, Jan 4 – Bitcoin Retraces Below $32k, Ether Breaks $1k!

The cryptocurrency sector is trying to find an equilibrium but was mostly volatile in recent days, with BTC retracing slightly and Ethereum skyrocketing towards its all-time highs. Bitcoin is currently trading for $31,796, representing a decrease of 8.08% compared to yesterday’s value. Meanwhile, Ethereum’s price has increased by a whopping 24.61% on the day, while XRP gained 7.37% of its value.

Daily Crypto Sector Heat Map

Scanetchain gained 446.19% in the past 24 hours, making it the most prominent daily crypto gainer by far. It is followed by Amun Ether 3x Daily Long’s 246.1% and Education Ecosystem’s 195.84% gain. On the other hand, Basiscoin Cash lost 96.51%, making it the most prominent daily loser. It is followed by Wownero’s loss of 91.09% and Bridge Finance’s loss of 90.45%.

Top 10 24-hour Performers (Click to enlarge)


Bottom 10 24-hour Performers (Click to enlarge)

Bitcoin’s market dominance has moved down almost two percent since our last report, with its value currently being 68.7%. This value represents a 1.9% difference to the downside than the value it had when we last reported.


Daily Crypto Market Cap Chart

The cryptocurrency sector capitalization has increased greatly since we last reported, with its current value being $860.45 billion. This represents a $97.68 billion increase when compared to our previous report.

_______________________________________________________________________

What happened in the past 24 hours?

_______________________________________________________________________

_______________________________________________________________________


Technical analysis

_______________________________________________________________________

Bitcoin

Bitcoin had continued its move up slowly until Jan 2, when its price skyrocketed and reached as high as $34,800. With this being set as the new all-time high, BTC started retracing and consolidating within a wide range, bound by the all-time high to the upside and $30,807 to the downside.

Any strong pushes were easily foreseen by the gradual increase in volume, which is what traders should pay attention to when trading the largest cryptocurrency by market cap.

BTC/USD 4-hour chart

Bitcoin’s technicals are showing a strong tilt towards the buy-side. However, some of its time-frames show slight neutrality alongside the overall bullishness.

BTC/USD 1-day Technicals

Technical factors (4-hour Chart):

  • Price is slightly above its 50-period EMA and above its 21-period EMA
  • Price is near its middle Bollinger band
  • RSI is neutral (55.04)
  • Volume is slightly above average

Key levels to the upside          Key levels to the downside

1: $34,800                                 1: $30,807

2: $35,000                                 2: $28,337

3: $36,000                                 3: $26,340

Ethereum

Ethereum’s spike could be considered a late response to Bitcoin’s spike, as its price followed in direction but not percentage-wise when BTC pushed towards $35k. However, the second-largest cryptocurrency by market cap skyrocketed in the past hours, reaching as high as $1,169.

This push towards the $1k mark is historic, as the only real upside is the all-time high of $1,420 from Jan 2, 2020.

Ethereum is currently fighting to stay above the $1,000 mark, and its short-term future will be determined by it managing to stay above or retracing below this level.

 ETH/USD 1-hour Chart

Ethereum’s technicals look very much like Bitcoin’s, with the overall tilt being towards the buy-side, with oscillators tilting towards bearishness.

ETH/USD 1-day Technicals

Technical Factors (4-hour Chart):

  • Price is above its 50-period and at its 21-period EMA
  • Price is near its middle Bollinger band
  • RSI is neutral (60.37)
  • Volume is descending from above-average levels

Key levels to the upside          Key levels to the downside

1: $1,047                                     1: $1,009

2: $1,080                                     2: $960

3: $1,169                                      3: $932

Litecoin

Litecoin had an amazing 2-day run as its price increased from $124 all the way up to $175. However, the $175 mark stopped the bulls from reaching any higher, and Litecoin started retracing. The retracement also came as a response to BTC’s retracement, as the two cryptocurrencies are highly correlated.

Litecoin is now struggling to stay above the $155.25 level. However, its short-term price direction will most likely be decided by Bitcoin’s movements, rather than staying above or below any support/resistance levels.

 LTC/USD 1-hour Chart

Litecoin’s technicals on all time-frames are tilted towards the buy-side and show almost no bearish or neutral signs.

LTC/USD 1-day Technicals

Technical factors (4-hour Chart):

  • Its price is currently above its 50-period EMA and at its 21-period EMA
  • Price is at its middle Bollinger band
  • RSI is in the oversold territory (50.57)
  • Volume is currently on below-average levels

Key levels to the upside          Key levels to the downside

1: $163.7                                      1: $155.25

2: $174.5                                      2: $149.3

3: $195.5                                   3: $143.5


Categories
Forex Market Analysis

Daily F.X. Analysis, January 04 – Top Trade Setups In Forex – Manufacturing PMI In Focus! 

On the news front, eyes will remain on the Manufacturing PMI and Services PMI figures from the Eurozone, U.K., and the United States. Almost all economic figures are expected to perform better than previous months, perhaps due to a lift of lockdown. Price action will depend upon any surprise changes in the PMI figures.

Economic Events to Watch Today  


EUR/USD – Daily Analysis

The EUR/USD pair was opened at 1.22387, and it has placed a high of 1.22584 and a low of 1.22276 so far. The currency pair is currently moving at 1.25514 and has shown a consolidative move since the start of the day.

The U.S. dollar was weak across the board on Monday and the starting day of the week and pushed the currency pair EUR/USD higher on board. However, the EUR/USD pair’s gains remained consolidative ahead of the release of macroeconomic data from the European side.

At 13:15 GMT, the Spanish Manufacturing PMI for December is forecasted to come in as 52.6 compared to November’s 49.8, which, if met, will be supportive to the single currency Euro and will probably add gains in EUR/USD pair. At 13:45 GMT, the Italian manufacturing PMI for December is also expected to surpass the previous 51.5 and come in as 53.5 and support the single currency Euro to add further gains in EUR/USD pair. At 13:50 GMT, the French Final Manufacturing PMI is projected to remain flat at 51.1 for December. At 13:55 GMT, The German Final Manufacturing PMI for December is also projected to remain the same as November’s 58.6. At 14:00 GMT, the Final manufacturing PMI for December from the whole Eurozone is also expected to remain flat at 55.5.

From the U.S. side, at 19:45 GMT, the Final Manufacturing PMI from the U.S. for December is anticipated to release as 56.3 against the previous 56.5 and weigh on the U.S. dollar be beneficial for EUR/USD pair. At 20:00 GMT, the Construction Spending for November is estimated to decline to 1.1% compared to the previous 1.3%, and if the actual meet the expectations, then EUR/USD will gain more as the U.S. dollar will become weak.

Apart from macroeconomic data, the gains in EUR/USD pair were very limited at the start of the trading session as the rise in coronavirus cases in Europe urged the countries to get ready to extend lockdowns to control the spread of the virus. Not in Europe, but all countries across the world, including UK, Canada, India, the USA, Japan, and Mexico also have seen a rise in the number of infection cases that has prompted the need for safe-haven and resulted in the consolidative movement of EUR/USD pair on Monday.

The risk perceived EUR/USD pair faced pressure while moving upward as the risk sentiment in the market deteriorated after the rising number of coronavirus cases throughout the globe. However, the currency pair EUR/USD remained on the plus side as the European countries have started immunizing people against coronavirus in earnest, but huge discrepancies in vaccination pace exist.

Meanwhile, the U.S. dollar was also weak ahead of Tuesday’s Georgia runoff elections that will decide the control of the U.S. Senate and also the fate of President-elect Joe Biden’s legislative agenda. Whereas, Senate ended the demand for an increase in direct payments from $600 to $2000 by Donald Trump and supported by Democrats as Republicans did not approve it and weighed on the U.S. dollar that ultimately kept the EUR/USD pair higher.

Daily Technical Levels

Support   Resistance

1.2179      1.2279

1.2144      1.2344

1.2078      1.2379

Pivot Point: 1.2244

EUR/USD– Trading Tip

The EUR/USD is trading with a bearish bias today at the 1.2248 level, having violated the upward trendline at the 1.2252 level. Closing of candles below this trendline confirms a breakout, and there’s a strong odd of selling trend’s continuation until 1.2203. The next support may be found around the 1.2175 level below this, along with resistance at 1.2258 and 1.2313. The 50 periods EMA is likely to extend resistance at the 1.2262 level, and supporting selling trend in the EUR/USD today! 


GBP/USD – Daily Analysis

On January 04, the currency pair was opened at 1.36471, and it has placed a high of 1.36982 and a low of 1.36436 so far. The pair is currently moving at 136884 and is rising to place gains for the 4th consecutive session on Monday. The U.K. was enjoying its first trading session as an independent nation on Monday as the transition period for Brexit ended on Thursday when the United Kingdom finally ended its ties with the European Union, almost a year after its formal departure from the 27-nation bloc.

After four and a half years, when the majority in the U.K. voted to leave the European Union, the end of the transition period was a significant moment in the history of the U.K. Great Britain will now forge a separate path after almost five decades as part of the bloc. 

According to PM Boris Johnson, Britain will be an open, generous, outward-looking, internationalist, and free-trading country free to do things differently and, if necessary better than the E.U. On Sunday, the PM Boris Johnson said that he intended to carry on as a prime minister after Brexit.

Although the British Pound will see a selling pressure given the impact of Brexit sooner or later, the investors were favoring the currency in the beginning hours of the trading session ahead of the macroeconomic data or any major news as after a long fight between the E.U. & U.K.; the country has departure from the E.U. with a deal beneficial for both sides successfully.

At 14:30 GMT, the Final Manufacturing PMI for December is expected to remain flat at 57.3. The Mortgage Approvals from Britain in November are expected to decline to 82K from October’s 98K and weigh on British Pound that could drag the pair GBP/USD lower. The Net Lending to Individuals for November is also expected to decline to 3.0B from October’s 3.7B and weigh on British Pound and limit the GBP/USD pair’s upward trend. Furthermore, the pair was also supported in the Asian session due to the weakness of the U.S. dollar on Monday. The U.S. dollar was weak due to the broad market optimism and rallying equities. Some news from the U.S. Congress unveiled that Nancy Pelosi was re-elected as the U.S. House Speaker, which indicated an easy way for further stimulus. 

Meanwhile, Georgia’s electoral runoff will also decide the Senate majority’s fate and will be crucial to watch on Tuesday. All these developments kept the greenback under pressure and supported GBP/USD’s rising prices on Monday during the early session.

Apart from Brexit and U.S. headlines, the currency pair came under pressure as the market’s risk sentiment was affected by the increase in the number of coronavirus cases throughout the globe. 

The rising number of infections from COVID-19 raised fears that countries might extend the restrictions that would have a negative impact on global economic recovery. These fears kept the risk perceived GBP/USD pair under pressure and kept its gains limited during the Asian session on Monday.

Daily Technical Levels

Support   Resistance

1.3623      1.3705

1.3573      1.3737

1.3540      1.3788

Pivot Point: 1.3655

GBP/USD– Trading Tip

The GBP/USD pair has also violated the resistance level of 1.3617 level, and on the higher side, the next target remains at the 1.3698 level. On the lower side, the GBP/USD pair may find support at the 1.3617 level for now. We can expect a continuation of an upward trend in the Sterling today. The 50 periods EMA is supporting bullish bias at the 1.3600 level, and at the same time, the upward channel is also likely to keep Sterling bullish on Monday. Let’s consider taking buying trades over 1.3609 and selling below the 1.3698 level today. 


USD/JPY – Daily Analysis

On January 04, the USD/JPY opened at 103.096, and it has placed a high of 103.314 and a low of 102.932 since then. The pair USD/JPY was currently moving at 103.023 and was placing losses for the day.

In the Asian trading session, the U.S. dollar was down on Monday, with investors continuing to put pressure on the safe-haven assets on the first trading day of 2021. The rising expectations that the U.S. interest rates will remain low and hopes for an eventual global economic recovery from coronavirus will likely continue to slow the dollar down against other major currencies.

The U.S. Dollar Index that measures the value of the U.S. dollar against the basket of six major currencies was down by 0.25% to 89.67 on the day to slightly below the level it ended 2020 at 89.766. The U.S. dollar weakness added to the downward momentum of the USD/JPY pair on Monday.

The Federal Reserve is due to release the minutes from its December meeting on Wednesday. Investors will be looking for more detail on the discussions about making their forward policy guidance more explicit and the chance of a further increase in asset buying in 2021. Meanwhile, the USD/JPY pair was also down in early trading hours on Monday as the rising number of coronavirus cases throughout the world raised the safe-haven appeal in the market. 

On Sunday, Prime Minister Boris Johnson warned that severe lockdown restrictions would be installed in England to fight against the new variant of coronavirus that has pushed the infection rates to their highest record levels. Whereas, School unions have raised called for the closure of all schools for a couple of weeks as the virus was spreading faster, but Johnson said to parents that they should send children to school as the threats to young kids from the deadly virus were very small.

Meanwhile, on Saturday, Canada reported an estimated 4800 more cases of the deadly coronavirus that added to the country’s total caseload and made it 586,425. Canada said that the rise in the number of coronaviruses was seen after the holiday season. In India, 16,660 fresh cases were reported in a single day that sent the total number of infections to 10,341,291. 

Americans have been reported to flee to Mexico to avoid the lockdown restrictions back at home. According to Times, about half a million Americans traveled to Mexico in November, whereas Mexico has reported an increase in the number of coronavirus cases in November and December.

The global sum of coronavirus cases reached 85,489,058, out of which 60,443,211 have recovered, and 1,850,202 have died so far. The U.S. cases reached a total of 21,110,917 number and remained the worst-hit county by the world’s coronavirus. Despite the vaccine rollout, the rising number of coronavirus cases throughout the globe added to the fears that countries will enter new lockdown restrictions and affect global economic recovery. These fears raised the market’s safe-haven appeal and supported the safe-haven Japanese Yen that ultimately weighed on the USD/JPY pair. 

On the data front, at 05:30 GMT, the Final Manufacturing PMI in December came in as 50.0 against the expected 49.7 and supported the Japanese Yen that added in the losses of the USD/JPY pair on Monday. From the U.S. side, at 19:45 GMT, the Final Manufacturing PMI from the U.S. for December is projected to come as 56.3 against the previous 56.5 and weigh on the U.S. dollar add in the losses of USD/JPY pair. At 20:00 GMT, the Construction Spending for November is estimated to decrease to 1.1% against the previous 1.3% that could weigh on the U.S. dollar and USD/JPY pair as well.

Daily Technical Levels

Support   Resistance

103.02      103.34

102.85      103.49

102.70      103.66

Pivot Point: 103.17

USD/JPY – Trading Tips

The USD/JPY is trading sharply bearish at 102.940, gaining support at the 102.940 level. The USD/JPY pair has formed a downward channel on the two-hourly timeframes, which may extend resistance at 103.300 as at the same level 50 periods EMA is also extending resistance. Today, we need to keep an eye on the 102.940 mark as a violation of this may offer us a sell trade until the 102.598 level. The MACD and RSI are suggesting selling bias in USD/JPY today. Good luck!

Categories
Forex Signals

USD/CAD Supported Over Triple Bottom – Brace for a Trade Here! 

The USD/CAD pair was opened at 1.27142, and it has placed a high of 1.27358 and a low of 1.26950 since then. The pair was currently moving at 1.27035 and was posting losses on Monday for the 5th consecutive session. The losses in the USD/CAD pair during the Asian session on Monday could be attributed to the US dollar’s weakness along with the rising crude oil prices on the day. The deteriorated risk-sentiment could also be a factor behind the USD/CAD pair’s declining prices on Monday. 

The US Dollar was weak across the board on Monday as the US saw a massive increase in the number of coronavirus cases as the total count of infection cases reached 21,110,917 in the country and made it the worst-hit country by the COVID-19. The US Dollar Index was also down on Monday by 0.25% at the 89.67 level.

The US dollar weakness could also be attributed to the latest rejection of an increase in direct payments by the US Senate. Lately, the US President called to increase the direct payments to Americans to $2000 from $600 that was also supported by Democrats; however, these efforts have come to an end after Republicans refused to increase them. Furthermore, the US billions were also hesitant to place strong moves in the market ahead of Tuesday’s Georgia’s electoral runoff and Wednesday’s December meeting minutes release from FOMC.

On the other hand, the West Texas Intermediate (WTI) Crude Oil prices on Monday have reached $49.27 per barrel so far and were moving upward continuously. The crude oil has posted gains for four consecutive sessions, and the outlook remained positive, which means it could increase further. The rising crude oil prices added support to the commodity-linked currency Loonie that ultimately added more pressure on the USD/CAD pair’s prices on Monday.

On the data front, Manufacturing PMI from Canada is expected to release at 19:30 GMT, November’s PMI was 55.8, and anything above it in December could be beneficial for the Canadian dollar, and anything less than it could be against the local currency. From the US side, at 19:45 GMT, the Final Manufacturing PMI from the US for December is predicted to come as 56.3 against the previous 56.5 that could hurt the US dollar and add further losses in the USD/CAD pair. At 20:00 GMT, the Construction Spending for November is forecasted to drop to 1.1% against the previous 1.3% that could also add more losses in the USD/CAD pair.


Daily Technical Levels

Support Resistance

1.2704 1.2762

1.2679 1.2795

1.2647 1.2820

Pivot point: 1.2737

The USD/CAD is trading at 1.2684, and violation of this level can extend the selling trend until the 1.2637 level. On the 2 hour timeframe, the USD/CAD is supported due to the triple bottom, but the RSI and MACD are suggesting a selling trend in USD/CAD. However, we can’t take a sell trade unless the 1.2685 level is violated. Let’s wait for a breakout elsewhere; we can take a buy trade over 1.2685 tp target 1.2760. Good luck!

Categories
Forex Signals

EUR/USD Completes Retracement – Brace for a Bullish Correction! 

The EUR/USD is trading with a bearish bias today at the 1.2248 level, having violated the upward trendline at the 1.2252 level. Closing of candles below this trendline confirms a breakout, and there’s a strong odd of selling trend’s continuation until 1.2203. The next support may be found around the 1.2175 level below this, along with resistance at 1.2258 and 1.2313. The 50 periods EMA is likely to extend resistance at the 1.2262 level, and supporting the selling trend in the EUR/USD today; however, we are taking a buying trade as the pair is forming Doji, and it may bounce off to continue trading bullish. 


Entry Price – Buy 1.226

Stop Loss – 1.222

Take Profit – 1.23

Risk to Reward – 1:1

Profit & Loss Per Standard Lot = -$400/ +$400

Profit & Loss Per Micro Lot = -$40/ +$40

Fellas, now you can check out forex trading signals via Forex Academy mobile app. Follow the links below.

iPhone Users: https://apps.apple.com/es/app/fasignals/id1521281368

Andriod Users: https://play.google.com/store/apps/details?id=academy.forex.thesignal&hl=en_US


Categories
Forex Videos

Forex – How To Sell At The Top & Buy At The Bottom!


How to sell at the top and buy at the bottom

Thank you for joining this Forex Academy educational video.

In this session, we will be looking at one of the oldest adages in trading: sell at the top and buy at the bottom.  And how can this be implemented in your trading for maximum results?

20 years ago, financial markets, including foreign exchange, were driven by fundamental analysis over technical analysis.  That is to say that professional traders and analysts would base their trading around fundamental economic data, including policy-making decisions, interest rates, GDP, inflation, and political events, including wars. Technical analysis was in its infancy.  In these times, it was much easier to predict where the bottoms and tops of assets were likely to be based on fundamental reasons alone. 

Today, things have completely flipped to the opposite side. Technical analysis is heavily dependent upon where chart patterns dominate price movement and where fundamental reasons for trading often lag behind technical and sometimes seem to defy logic.

You only have to take a look at the Dow Jones 30 industrial average index, which is at an all-time record-breaking high of over 30,000 while the US economy is still struggling because the pandemic still has it in its grips.  Fundamental analysis has gone out of the window on the basis that technical analysis is fuelling the US stock market to the upside, where hopes of a vaccine roll-out outweigh the fact that hospitals are currently at extremely high levels for covid patients, and where a new bleak record was passed this week of over 3000 deaths in a single day in the United States. Similar circumstances, albeit non-pandemic related, perhaps more to do with an overpriced stock market fuelled by the success of the 1920s where share trading on margin was rife probably caused the famous 1929 US stock market crash, which took years to recover from.  

Currently, the US market is also buoyed by hopes of extra stimulus by the federal governments and where this money is finding its way into the stock market. Even so, the market is overbought, does not comply with earnings per share, and yet is still relentlessly bid.

Even so, where is the top? It is difficult to say in this hyped market, which is pulling back from every attempt to short it.

If the market reaction is so extreme and fundamental analysis is second to technical analysis, traders have to be on their guard and look for several signs that the market is topping or bottoming out to find a good entry point to trade in either direction.

In this daily chart of the GBPUSD pair, we can see a huge push lower at position A during the middle of March 2020, where Britain began to fall into the grip of the coronavirus, which plunged the exchange rate to 1.1400.  Buyers were looking for an opportunity to go long because this was seen as the bottom of the bear move.

We have a high in September at position B, where there is a spike outside of the Bollinger band, where the candlestick is an upturned bearish hammer, and where the subsequent candlesticks are bearish, providing the trader with the knowledge that this is potentially a top at 1.3485. A subsequent high at position C, with a bearish hammer spiking out of the bands, provides chartists with a potential top at 1.3535.

Incorporating these simple chart lines at positions, A B, and C helps us visualize trend reversals.  Once we have one or two candlesticks on the daily chart confirming that there is indeed a trend reversal in progress, we can drill down into lower time frames, as intraday traders, to look for opportunities to go short or long.  We must never ignore fundamental reasons for taking a trade on. However, based on what has been set out today, we must conclude that fundamental analysis often lags behind technical analysis and therefore, by looking at swings in price action forming tops and bottoms outside of periods of consolidation,  traders give themselves a better edge while stacking the odds in their favor and trading in line with institutional size traders who typically trade in this manner.

In conclusion, we are in an age where fundamental analysis often has no bearing on an asset price and where technical analysis and fundamental analysis are often out of kilter,  but where eventually with two will catch up with each other.

Traders best opportunities of bagging more pips must be centered around reversals in price action based on longer time-frames such as daily charts, before drilling down into lower time frames such as an hourly chart and trade in the direction of the daily chart trend, to stack the odds in their favor of a successful trades, while never forgetting the importance of the fundamental reasons why a currency pair exchange rate might potentially be changing direction.

Categories
Crypto Market Analysis

Daily Crypto Review, Dec 31 – Bitcoin Hits a New All-Time High as it Pushes Past $29K

The cryptocurrency sector is stabilizing vastly in the green as Bitcoin pushed above $29,000, creating a new all-time high. Bitcoin is currently trading for $29,001, representing an increase of 4.40% compared to yesterday’s value. Meanwhile, Ethereum’s price has increased by 2.40% on the day, while XRP gained 6.74% of its value.

Daily Crypto Sector Heat Map

Yearn Finance Passive Income gained 759.27% in the past 24 hours, making it the most prominent daily crypto gainer by far. It is followed by DragonVein’s 268.8% and Gala’s 146.76% gain. On the other hand, BitBall lost 63.32%, making it the most prominent daily loser. It is followed by MITH Cash’s loss of 63.25% and Blue Whale Exchange’s loss of 53.96%.

Top 10 24-hour Performers (Click to enlarge)

Bottom 10 24-hour Performers (Click to enlarge)

Bitcoin’s market dominance has moved up half a percent since our last report, with its value currently being 70.6%. This value represents a 0.5% difference to the upside than the value it had when we last reported.

Daily Crypto Market Cap Chart

The cryptocurrency sector capitalization has increased since we last reported, with its current value being $762.78 billion. This represents a $25.47 billion increase when compared to our previous report.

_______________________________________________________________________

What happened in the past 24 hours?

_______________________________________________________________________

_______________________________________________________________________

Technical analysis

_______________________________________________________________________

Bitcoin

Bitcoin has continued its move up on slightly higher volume, breaking its $28,600 resistance level and entering unexplored territory. The push ended with bull exhaustion at the $29,300 mark, creating a new all-time high.

Bitcoin’s price has hit this level twice in a short span of time, creating a double top and propelling BTC slightly backward. Its price is currently trading below $29,000, in a range bound by $28,600 to the downside and $29,300 to the upside.

Even though a move towards $30,000 is quite possible, many analysts have pointed to enormous sell walls at and around this level, making it extremely hard to breakthrough.

 BTC/USD 1-hour chart

Bitcoin’s technicals are showing a strong tilt towards the buy-side. However, its oscillators are tilting towards bearishness due to the overextended move to the upside.

BTC/USD 1-day Technicals

Technical factors (4-hour Chart):

  • Price is above its 50-period EMA and at its 21-period EMA
  • Price is near its middle Bollinger band
  • RSI is neutral (56.57)
  • Volume is slightly above average

Key levels to the upside          Key levels to the downside

1: $28,600                                 1: $28,391

2: $29,000                                 2: $25,512

3: $30,000                                 3: $24,696

Ethereum

Ethereum has sparked by Bitcoin’s push up, tried to break its most immediate resistance level of $747. While the second-largest cryptocurrency by market cap did manage to push through and reach $759 at one point, the bulls were not able to hold this level, which triggered a pullback below $747.

Ethereum is currently trading right below $747, with the 50-hour and 21-period 4-hour moving averages providing it support.

Ethereum is most likely in for a short-term correction as its volume is descending quickly after a failed attempt to tackle the upside.

 ETH/USD 1-hour Chart

Ethereum’s technicals look very much like Bitcoin’s, with the overall tilt being towards the buy-side, with oscillators tilting towards bearishness.

ETH/USD 1-day Technicals

Technical Factors (4-hour Chart):

  • Price is above its 50-period and at its 21-period EMA
  • Price is near its middle Bollinger band
  • RSI is neutral (50.10)
  • Volume is descending from above-average levels

Key levels to the upside          Key levels to the downside

1: $747                                     1: $675

2: $800                                     2: $653

3: $900                                      3: $632

Ripple

XRP gained over 5% on the day due to Bitcoin’s upwards-facing move pulling the market as a whole up. When looking at it from a technical standpoint, XRP managed to win the fight for $0.214, which is certainly a positive thing.

However, more bad news came out to the public, with even more exchanges suspending trading for XRP. Even though many analysts say that XRP is not a security, the sheer pressure that the SEC lawsuit exerts on the project caused almost every exchange and fund to distance themselves from Ripple and XRP, causing its price to crash.

 XRP/USD 1-hour Chart

XRP’s technicals on all time-frames are tilted towards the sell-side, with only the daily overview being completely bearish.

XRP/USD 1-day Technicals

Technical factors (4-hour Chart):

  • Its price is currently at its 50-period EMA and below its 21-period EMA
  • Price is at its middle Bollinger band
  • RSI is in the oversold territory (50.22)
  • Volume is currently on below-average levels

Key levels to the upside          Key levels to the downside

1: $0.25                                    1: $0.214

2: $0.30                                     2: $0.14

3: $0.358


Categories
Forex Market Analysis

USD/JPY Complex Correction, What does that mean for Traders?

The USDJPY pair is progressing in an Elliott wave complex correction identified as a triple-three pattern (3-3-3-3-3) of Minute degree, labeled in black. The completion of this downward corrective formation suggests the start of a new rally of the same degree.

Technical Overview

The following daily chart shows the USDJPY pair advancing in a corrective structure of Minor degree labeled in green, which began on last March 09th when the price found support at 101.180, from where the price started an aggressive rally that has found resistance and completed wave A in green at 111.715 on March 24th.

According to the Elliot Wave theory’s alternation principle, if the first move is aggressive, the next path should be a slow move elapsing more time than the previous leg. Likely, the second leg will be a triangle or a complex corrective formation. In this regard, the second leg corresponding to wave B in green shows the progress in a triple-three pattern, which follows an internal sequence subdivided into 3-3-3-3-3, where each three is a simple corrective formation.

On the other hand, the MACD oscillator endorses the downward corrective sequence that remains in progress. Likewise, the momentum and timing oscillator confirms the bearish pressure in play. It suggests the possibility of a new decline completing the ending diagonal pattern in progress corresponding to wave (c) of Minuette degree labeled in blue.

Technical Outlook

The long-term outlook for the USDJPY pair under the Elliott Wave perspective, shown in the following daily chart, foresees a potential limited decline until the demand zone, between 102.357 and 101.180, where the price could find fresh buyers expecting to join in the next rally.

The confirmation of its recovery would occur if the USDJPY breaks and closes above the 103.898 level, which corresponds to the end of wave iv of Subminuette degree labeled in green. This potential next rally corresponding to wave C of Minor degree should follow an internal sequence subdivided into five waves. Likewise, if the price extends its gains, USDJPY could continue rallying toward the next supply zone bounded between 109.033 and 109.850. On the other hand, the invalidation of this bullish scenario occurs if the price extends its drops below 101.180.

In summary, the USDJPY pair advances in an incomplete complex corrective pattern identified as a triple-three formation, which currently moves in its third internal segment of wave ((z)). In this regard, the price could decline toward the next demand zone between 102.357 and 101.180. If the price confirms the bottom and starts the rally, the wave C will be confirmed if the price breaks and closes above 103.898. The first potential target is located between 106.561 and 107.050; the second potential target zone is placed between 109.033 until 109.850. Finally, the bullish scenario’s invalidation level is set at 101.180, which corresponds to the March 09th low.

Categories
Forex Market Analysis

Daily F.X. Analysis, December 31 – Top Trade Setups In Forex – U.S. Jobless Claims Ahead

On Thursday, the German banks will be closed in observance of New Year’s Eve since banks aid most foreign exchange volume. When they are closed, the market is less liquid, and speculators become a more dominant market influence. This can lead to both abnormally weak and abnormally huge volatility. Later throughout the U.S. session, the U.S. unemployment claims will remain in highlights.

Economic Events to Watch Today  


EUR/USD – Daily Analysis

The EUR/USD pair was closed at 1.22998 after placing a high of 1.23099 and a low of 1.22454. EUR/USD pair rose for the 5th consecutive day on Wednesday and reached above 1.23000 level, its highest since April 2018 amid the broad-based U.S. dollar weakness. The reports that the U.S. Senate has delayed a decision on increasing the coronavirus relief checks added pressure on the U.S. dollar. The Republican Senator Mitch McConnell blocked a move by colleague Bernie Sanders to allow a vote on increasing stimulus checks from $600 to $2000. However, Treasury Secretary Steve Mnuchin announced that direct payments of $600 would be out as soon as this week.

Despite a delay in the vote on the increase in the stimulus checks, the greenback dropped as investors were hopeful that the Senate would approve the rise in stimulus checks. The declining U.S. dollar added strength to the rising EUR/USD pair. On the data front, at 13:00 GMT, Spanish Flash CPI for the year dropped to -0.5% against the expected -0.6% and supported Euro that added additional gains in EUR/USD pair. From the U.S. side, at 18:30 GMT, the Goods Trade Balance from November fell to -84.8B against the projected -81.5B and weighed on the U.S. dollar that added further gains in EUR/USD pair. The Prelim Wholesale Inventories from November also fell to -0.1% against the projected 0.7% and supported the U.S. dollar. At 19:45 GMT, Chicago PMI in December surged to 59.5 against the projected 56.6 and supported the U.S. dollar. At 20:00 GMT, the Pending Home Sales from November fell to -2.6% against the projected 0.1% and weighed on the U.S. dollar that ultimately added gains in EUR/USD pair.

Furthermore, the risk-sensitive EUR/USD pair was also supported by the rising risk sentiment in the market after Britain approved another vaccine made by AstraZeneca and Oxford University. On Wednesday, Britain became the first country to approve the emergency use authorization of a vaccine developed by AstraZeneca and the University of Oxford that offers a 90% efficacy rate with the second vaccine shot.

The news about another vaccine available for use to control the coronavirus’s spread and in cheap amounts gave hopes that the global economic recovery process will speed up. These hopes raised the risk sentiment in the market and supported the currency pair EUR/USD on Wednesday.

Meanwhile, the optimism surrounding the Brexit deal also kept the EUR/USD pair on the upside on Wednesday. However, the EUR/USD pair’s gains remain limited throughout the day as the new variant of coronavirus that was originally discovered in the U.K. reached almost eight European Union nations. This urged E.U. nations to start mass vaccination to control the spread of the virus whereas, Spain was set to register people who refuse to be vaccinated against coronavirus and share it with European Union nations.

Daily Technical Levels

Support Resistance

1.2210    1.2279

1.2175    1.2311

1.2142    1.2347

Pivot point: 1.2243

EUR/USD– Trading Tip

The EURUSD continues to trade with a bullish bias after violating the ascending triangle pattern, extending resistance at the 1.2265 level. Above this, the odds of bullish trend continuation remains pretty solid. On the higher side, the pair may find resistance at 1.2308, and a bullish breakout of 1.2308 can lead its price towards the 1.2340 level. Bullish bias dominates today.

GBP/USD – Daily Analysis

The GBP/USD pair was closed at 1.36245 after a high of 1.36255 and a low of 1.34888. The British Pound to U.S. Dollar exchange rate climbed to weekly highs as the U.K. Parliament voted for the Brexit trade deal. Barely 24 hours before the U.K.’s final split from the European Union, Prime Minister Boris Johnson’s post-Brexit trade deal won approval from the U.K. Parliament. The agreement earlier crossed the House of Commons with 521 votes in favor of 73 opposing it. The Scottish National Party (SNP) was against the bills while stating that it will harm Scotland’s fishing industry and told PM Johnson that it would bolster the case for independence.

The Sterling got support from the Brexit deal’s approval in the U.K. Parliament and supported the GBP/USD currency pair on Wednesday. At the same time, the U.K. has ordered 100 million doses of the new vaccine that will be enough to vaccinate most of the population. On Wednesday, the U.K. regulatory approved the emergency use authorization to the vaccine of AstraZeneca and Oxford University that is said to offer 90% efficacy against coronavirus with the second vaccine shot. 

On Tuesday, the U.K. reported a record increase in new infections of over 50,000, the largest daily increase since the pandemic began. THE British Prime Minister Boris Johnson has approved placing more parts of the country into tier-4 restrictions as the country was fighting against the new variant of coronavirus, which scientists have warned that could spread more rapidly.

In parts of Southwest England and Cumbria, the ministers were considering imposing the toughest measures to control the spread of a new variant of coronavirus. Johnson announced that a further 20 million people in England will join the toughest tier of coronavirus restrictions from Thursday. These negative developments could not reverse the GBP/USD pair’s movement on Wednesday, and the pair continued increasing for the second consecutive day.

On the data front, at 11:57 GMT, the Nationwide HPI in December came in as 0.8% against the expected 0.4% and supported British Pound, and pushed the pair GBP/USD higher. From the U.S. side, at 18:30 GMT, the Goods Trade Balance from November decreased to -84.8B against the anticipated -81.5B and weighed on the U.S. dollar that added gains in GBP/USD pair. The Prelim Wholesale Inventories from November also decreased to -0.1% against the anticipated 0.7% and supported the U.S. dollar. At 19:45 GMT, Chicago PMI in December surged to 59.5 against the anticipated 56.6 and supported the U.S. dollar. At 20:00 GMT, the Pending Home Sales from November decreased to -2.6% against the anticipated0.1% and weighed on the U.S. dollar that ultimately added further gains in GBP/USD pair.

The U.S. dollar weakness was driven by the hopes that the increase in stimulus checks will be passed in the Senate even though they have delayed the decision. This weakness of the U.S. dollar kept the GBP/USD pair higher on board on Wednesday.

Daily Technical Levels

Support Resistance

1.3456    1.3533

1.3413    1.3567

1.3379    1.3611

Pivot Point: 1.3490

GBP/USD– Trading Tip

The GBP/USD pair has also violated the resistance level of 1.3617 level, and on the higher side, the next target remains at the 1.3698 level. On the lower side, the GBP/USD pair may find support at the 1.3617 level for now. We can expect a continuation of an upward trend in the Sterling today.

USD/JPY – Daily Analysis

The USD/JPY pair was closed at 103.207 after placing a high of 103.591 and a low of 102.959. USD/JPY pair extended its losses on Wednesday amid the declining U.S. dollar despite the market’s rising risk sentiment. The USD/JPY pair fell to its fresh weekly lowest level below 103.00 level on Wednesday as the greenback was very weak across the board against its rival currencies. The U.S. Dollar Index that measures the value of the U.S. dollar against the basket of six major currencies fell to its lowest level for almost three years below 89.52 on Wednesday.

The U.S. Senate delayed its decision on increasing the number of stimulus checks from$600 to $2000 as the Republican Senator Mitch McConnell blocked a move by colleague Bernie Sanders to allow a vote on increasing stimulus checks. Treasury Secretary Steve Mnuchin has announced that direct payments of $600 would be out as soon as this week. Investors were hopeful that the rise in stimulus checks will be accepted by Senate and continued selling the U.S. dollar on Wednesday that ultimately weighed on the currency pair USD/JPY and dragged the pair towards fresh weekly lowest level.

On the data front, at 18:30 GMT, the Goods Trade Balance from November declined to -84.8B against the estimated-81.5B and weighed on the U.S. dollar that dragged the currency pair USD/JPY on the downside. The Prelim Wholesale Inventories from November also dropped to -0.1% against the estimated 0.7% and supported the U.S. dollar. At 19:45 GMT, Chicago PMI in December raised to 59.5 against the estimated 56.6 and supported the U.S. dollar. At 20:00 GMT, the Pending Home Sales from November dropped to -2.6% against the estimated 0.1% and weighed on the U.S. dollar, increasing the USD/JPY pair’s losses.

Furthermore, the market’s risk sentiment was also improved after Great Britain became the first country to approve the vaccine by AstraZeneca and the University of Oxford for emergency use. This vaccine is said to provide 625 efficacy against coronavirus in the first shot that could be increased to 90% in the second shot. After this news, the hopes for economic recovery took their pace as a cheaper vaccine will be wildly available and help control the loss caused by the coronavirus pandemic. This news raised the market’s risk sentiment and added weight on the safe-haven Japanese Yen that ultimately capped further losses in the USD/JPY pair on Wednesday.

The main driver of the currency pair USD/JPY remained the sell-off in the U.S. dollar amid the rising hopes for an increase in stimulus checks the amount, and it will remain at the mercy of the U.S. dollar for a while as there will be no macroeconomic release from Japanese side until next week.

Daily Technical Levels

Support Resistance

103.39    103.78

103.23    104.01

103.01    104.17

Pivot point: 103.62

USD/JPY – Trading Tips

The USD/JPY violates the sideways range at the 103.500 level. It was a support level extended by an ascending triangle pattern that has already been violated. On the 2 hour timeframe, the USD/JPY pair is gaining support at 103.003 and 102.750 levels along with a resistance level of 103.575, which is extended by a triangle pattern that got violated. The pair is now closing a doji candle over 103.260 support level that suggests odds of bullish correction. On the higher side, the pair can lead towards the 103.575 level and then offer us a sell trade. Let’s brace for it. Good luck!

Categories
Forex Market Analysis

Daily F.X. Analysis, December 30 – Top Trade Setups In Forex – U.S. Trade Balance Ahead! 

The eyes will remain on the Spanish Flash CPI y/y, the U.S. Chicago PMI, and Pending Home Sales m/m figures on the news side. However, these are low impact events and may not drive sharp moves in the market.

Economic Events to Watch Today  

EUR/USD – Daily Analysis

The EUR/USD pair was closed at 1.22489 after placing a high of 1.22748 and a low of 1.22066. EUR/USD currency pair raised on Tuesday for the 4th consecutive day as the U.S. dollar was weak across the board and risk sentiment was high. The European stocks closed higher on Tuesday following a rally on Wall Street in the previous session. The pan-European Stoxx600 indexes ended up 0.76%, with most sectors in the positive territory. The rally has improved the European sentiment in U.S. stocks on Monday that came in after President Donald Trump signed a $900 billion coronavirus relief package into law; the measure will include direct payment to most Americans by $600.

Previously, Trump has demanded a $2000 direct payment days before the signing. On Monday, the House of Representatives voted to increase the second round of direct federal payments to $2000 and left it up to the GOP-controlled Senate. After this, the U.S. stocks rallied and continued rising till Tuesday morning. This pressured on the U.S. dollar ultimately added in the EUR/USD pair’s upward direction on Tuesday.

However, the positive sentiment in Europe came after the Brexit trade deal was secured between the E.U. and U.K. on Christmas Eve. Following this, London’s FTSE100 index rose by 2% on Tuesday. On Monday, the 27 ambassadors from the European Union member nations formally accepted the deal implemented on January 1. This news also supported the upward momentum in the currency pair EUR/USD pair on Tuesday.

Meanwhile, on Tuesday, the European Commission President Ursula von der Leyen said that the European Union would buy an extra 100 million doses of Pfizer and BioNTech’s coronavirus vaccine to bring the total from the two firms to 300 million doses.

She tweeted that they had decided to take an additional 100 million doses of the Pfizer/BionTech vaccine that has already being used to vaccinate people across the E.U. After some of the vaccine contestants organized by the E.U, this plan came in after some of the vaccine candidates faced unexpected delays in clinical trials that forced the bloc and other wealthy nations to rely on shots from fewer manufacturers than initially planned.

The E.U. officials said that the two firms have committed to rapidly deliver 200 million doses after regulatory approval for 15.5 euros per piece. The extra 100 million will be delivered at the same price, but the timetable will be negotiated as they will be delivered in 2021. The E.U.’s goal to roll out vaccine at the mass level also supported the local currency Euro and supported the upward momentum in EUR/USD pair.

The risk sentiment in the market driven by the vaccine rollout, U.S. stimulus, and the Brexit optimism also kept pushing the pair EUR.USD even higher on the board on Tuesday. Moreover, on the data front, at 19:00 GMT, the S&P/CS Composite -20 HPI for the year from the U.S. rose to 7.9% in October from the expected 7.0% and supported the U.S. dollar that capped further upside in the EUR/USD prices.

Daily Technical Levels

Support   Resistance

1.2210     1.2279

1.2175     1.2311

1.2142     1.2347

Pivot point: 1.2243

EUR/USD– Trading Tip

The EURUSD has violated the ascending triangle pattern, which was extending resistance at 1.2265 level, and above this, the odds of bullish trend continuation remain pretty stable. On the lower side, the support stays at the 1.2266 level, and the continuation of an upward trend can lead the pair towards the next resistance level of 1.2317. A slight downward retracement can be expected before a further upward trend.


GBP/USD – Daily Analysis

The GBP/USD pair was closed at 1.35009 after placing a high of 1.35225 and a low of 1.34405. The GBP/USD pair raised on Tuesday despite the rising number of coronavirus cases in the U.K. amid the Brexit development and improved risk sentiment.

The GBP/USD pair was supported on Tuesday from the rising risk sentiment in the market due to more optimistic news from the vaccine front. The U.K. has covered the way for widespread vaccinations with a homegrown shot that will be less expensive and easier to transport and store than other vaccines. For this purpose, the vaccines developed by the University of Oxford and AstraZeneca were set to get approval from the U.K. for emergency use authorization.

The U.K. drug regulator, the Medicines and Health products Regulatory Agency, will imminently authorize the AstraZeneca and Oxford University vaccine for emergency use within days to control the spread of coronavirus in the country. The vaccine’s efficacy rate is 90% after taking two doses, as one dose will provide only 62% efficacy against the coronavirus. Approving another vaccine will help the U.K. government battle against the coronavirus pandemic and lift the severe social distancing restrictions put in place before Christmas.

The new coronavirus cases in the U.K. on Tuesday were recorded as 53,135, and a health regulator of the country has said that the rise in coronavirus cases in the U.K. was of extreme concern. The Health Secretary has announced that the NHS was facing unprecedented pressures as hospitals in England and Wales were treating more coronavirus patients than at the peak of the first wave in April.

On the Brexit front, four days after sealing a free trade agreement with the European Union, the British government warned businesses to get ready for disruptions and bumpy moments when the new rules affect Thursday night. On Monday, the Businesses were scrambling to digest the details and implications of the 1240 page deal sealed between the U.K. and the E.U. on Christmas Eve. Meanwhile, E.U. ambassadors gave their unanimous approval on Monday to the Brexit trade deal with the U.K. However, the deal still needs approval from the E.U. legislature that is expected to come in February. At the same time, the U.K.’s House of Commons is expected to approve it on Wednesday.

After its approval by 27 E.U. ambassadors, the Brexit trade deal’s optimism gave support to British Pound that ultimately pushed the currency pair GBP/USD higher on the board despite the rising number of coronavirus cases in the country. Furthermore, the U.S. dollar was also weak across the board, which also helped the GBP/USD pair keep posting gains on Tuesday. Trump signed the second stimulus bill on Sunday that weighed heavily on local currency. Whereas, on the data front, at 19:00 GMT, the S&P/CS Composite -20 HPI for the year from the U.S. surged to 7.9% in October from the predicted 7.0% and supported the U.S. dollar that capped further gains in the GBP/USD prices on Tuesday.

Daily Technical Levels

Support   Resistance

1.3456     1.3533

1.3413     1.3567

1.3379     1.3611

Pivot point: 1.3490

GBP/USD– Trading Tip

The GBP/USD pair has also violated the resistance level of 1.3520 level, and on the higher side, the next target remains at the 1.3580 level. On the lower side, the GBP/USD pair may find support at the 1.3520 level now. We can expect a continuation of an upward trend in the Sterling today as the MACD and RSI suggest a bullish trend. Alongside, the GBP/USD pair may soar until the 1.3620 level today as the 50 EMA also extending bullish bias for the Cable.


USD/JPY – Daily Analysis

The USD/JPY pair was closed at 103.530 after placing a high of 103.824 and a low of 103.461. After posting gains for two consecutive days, USD/JPY dropped and posted losses on Tuesday amid the broad-based U.S. dollar weakness despite the risk sentiment. The U.S. Dollar was weak on Tuesday as investors were hopeful that Senate would pass the additional $1400 in stimulus paychecks. The greenback that measures the value of the U.S. dollar against the basket of six currencies was down by 0.24% on Tuesday and weighed on the USD/JPY pair.

The House of Representatives approved the rise in the amount of the stimulus checks from $600 to $2000 earlier in the week. Now the eyes have turned to Senate, where the Majority Leader Mitch McConnell moved to block the rise in the amount on Tuesday. Whereas, U.S. President Donald Trump has urged him to approve the increase in the number of stimulus paychecks.

The greenback has seen steady losses since U.S. President Donald Trump has signed the $2.3 trillion coronaviruses and spending bill on Sunday. Investors shifted from the U.S. dollar immediately after as more stimulus prospects reduced the demand for safe-haven assets. The country’s economic recovery was under threat as the U.S. continuously saw a large number of coronavirus cases, and it has increased the hopes for more fiscal stimulus measures from Congress. Hence, investors kept selling the U.S. dollar in hopes that the Senate could pass the increase in the number of stimulus checks at the last minute.

Furthermore, another reason behind the weakness of the U.S. dollar was that some investors warned that the dollar would fall further in 2021 as President-elect Joe Biden will roll out further stimulus measures. Biden and his administration will come into power on January 20. Despite the weakness of the U.S. dollar, the USD/JPY pair was also falling on the back of increasing figures of coronavirus cases in the U.S. There were also reports suggesting that the new variant of coronavirus first discovered in the U.K. has reached the U.S. The health officials in Colorado confirmed that the infected individual was held in isolation in Elbert Country and that the person was in his 20s and had no travel history.

This also raised the fears for global economic recovery and raised the safe-haven appeal that ultimately supported the safe-haven Japanese yen, and added the USD/JPY pair’s downward momentum on Tuesday.

Meanwhile, on the data front, at 19:00 GMT, the S&P/CS Composite -20 HPI for the year from the U.S. advanced to 7.9% in October from the anticipated 7.0% and supported the U.S. dollar that capped further losses in the USD/JPY prices on Tuesday.

On the other hand, the losses in USD/JPY pair were also capped by the reports that AstraZeneca and University of Oxford’s vaccine were set to receive approval from the U.K.’s regulatory for emergency use authorization. This resulted in improved risk sentiment and weighed on the Japanese Yen due to its safe-haven status and capped further losses in the USD/JPY pair on Tuesday.

Daily Technical Levels

Support   Resistance

103.39     103.78

103.23     104.01

103.01     104.17

Pivot point: 103.62

USD/JPY – Trading Tips

The USD/JPY violates the sideways range at the 103.500 level. It was a support level extended by an ascending triangle pattern that has already been violated. On the 2 hour timeframe, the USD/JPY pair is gaining support at 103.250 and 102.980 levels along with a resistance level of 103.575, which is extended by a triangle pattern that got violated. The pair is now closing a doji candle over 103.260 support level that suggests odds of bullish correction. On the higher side, the pair can lead towards the 103.575 level and then offer us a sell trade. Let’s brace for it. Good luck!

Categories
Forex Market Analysis

is EUR-USD Losing its Bullish Momentum?

EURUSD’s big picture reveals an acceleration in its uptrend, which is progressing since the second half of March when the price reached and confirmed its bottom of 1.06359. In this context, since the price saw its yearly low, the common currency is up over 15.2% to date.

Technical Overview

The following 2-day chart illustrates the EURUSD pair shows the primary trendline plotted in blue. We see the trend continuing its progression on the bullish side. The secondary trend identified with the green trendline reveals an acceleration of price action since early November when the common currency found support at 1.16025.

On the chart, we see that once the pair found support in early November, it began to rally, finding resistance at 1.22728 in mid-December, where the price started to consolidate until date.

On the other hand, the MACD oscillator shows a bearish divergence, which leads us to suspect the bullish trend’s exhaustion. However, the exhaustion signal doesn’t mean that the EURUSD will reverse the uptrend in progress. Moreover, the momentum and timing oscillators confirm the bullish pressure; however, the reading over level 80 (yellow box) on both indicators suggest the short-term overbought of the common currency. In this regard, the price could experience a short retracement in the following trading sessions before continuing its rally.

Technical Outlook

The EURUSD outlook for the coming weeks illustrated in the following daily chart shows the possibility of a limited correction, which could retrace until the next support located at about 1.20734, where the price could find fresh buyers with a potential target located in the long-term resistance of 1.25229, corresponding to the highs made in February 2018.

The bullish scenario’s confirmation will happen if the price closes above the resistance corresponding to the yearly high of 1.22717. On the other hand, if the common currency closes below 1.20734, the price could decline to the primary trend-line as dynamic support, it even could extend its decline until 1.17657.

Summarizing, the EURUSD pair continues developing a bullish trend, which currently looks consolidating the last rally that began on early November low at 1.16025. The MACD oscillator suggests exhaustion of the current bullish trend. Likewise, the momentum and timing oscillators reveal the common currency’s overbought condition, suggesting a short-term correction.

In this regard, considering that the bullish pressure persists, the price could retrace until 1.20734, where the EURUSD could find fresh buyers. However, the close above 1.22717 would confirm the upward continuation till the next long-term resistance of 1.25229. On the contrary, if the price closes below 1.20734, the common currency could extend its drops to 1.17657.

Categories
Crypto Market Analysis

Daily Crypto Review, Dec 29 – XRP Trading Suspended by Coinbase and OKEx, Causing a 22% Price Dip

The cryptocurrency sector had is currently in a consolidation phase as Bitcoin fell below $27,000. Bitcoin is currently trading for $26,624, representing a decrease of 1.13% compared to yesterday’s value. Meanwhile, Ethereum’s price has decreased by 2.56% on the day, while XRP had another major dip, losing 19.42% of its value.

 Daily Crypto Sector Heat Map

Ethereum Lightning gained 1097.36% in the past 24 hours, making it the most prominent daily crypto gainer by far. It is followed by N3RD Finance’s 94.18% and Matrix AI Network’s 86.08% gain. On the other hand, COVER Protocol lost 97.97%, making it the most prominent daily loser. It is followed by Encryptgen’s loss of 91.18% and Mining Core Coin’s loss of 69.41%.

Top 10 24-hour Performers (Click to enlarge)

Bottom 10 24-hour Performers (Click to enlarge)

Bitcoin’s market dominance has moved up slightly since our last report, with its value currently being 69.2%. This value represents a 0.1% difference to the upside than the value it had when we last reported.

Daily Crypto Market Cap Chart

The cryptocurrency sector capitalization has decreased slightly since we last reported, with its current value being $712.73 billion. This represents an $8.45 billion decrease when compared to our previous report.

_______________________________________________________________________

What happened in the past 24 hours?

_______________________________________________________________________

_______________________________________________________________________

Technical analysis

_______________________________________________________________________

Bitcoin

Ever since it hit the $28,391 all-time high, Bitcoin has been trading in a sideways manner. Its price is currently within a large channel, bound by $25,512 to the downside and the aforementioned all-time high to the upside.

The descending volume alongside sideways trading was never a long-term occurrence with Bitcoin, but rather good indicators of a new explosive move ahead.

Bitcoin traders should be mindful of any volume spikes when trading, and should look for smaller time-frame Fib retracements if they want to be more precise with setting their support and resistance levels.

BTC/USD 1-hour chart

Bitcoin’s technicals on both short-term and long-term time-frames are completely bullish and show close to no signs of neutrality or bearishness.

BTC/USD 1-day Technicals

Technical factors (4-hour Chart):
  • Price is above its 50-period EMA and at its 21-period EMA
  • Price is at its middle Bollinger band
  • RSI is neutral (55.72)
  • Volume is slightly above average, but descending
Key levels to the upside          Key levels to the downside

1: $28,391                                 1: $25,512

2: $29,000                                 2: $24,696

3: $30,000                                  3: $24,315

Ethereum

Ethereum’s move towards the upside ended at $747, prompting a pullback. However, while many analysts believed that Ether would not keep its price above $700, that’s exactly what happened.

Ethereum’s signature trading move has occurred once again, with that move being: pushing up, then pulling back, and breaking the 21-hour moving average to the downside, only to find support at the 50-hour moving average and push back up. Knowing how Ethereum moves alongside watching Bitcoin’s moves is one of the safest ways to trade cryptocurrencies at the moment, as the moves have pre-determined stop-losses and targets.


ETH/USD 1-hour Chart

Ethereum’s shorter time-frames are completely bullish and show no signs of neutrality or bearishness, while its longer-time frames have some neutrality present alongside the overall bullishness.

ETH/USD 1-day Technicals

Technical Factors (4-hour Chart):
  • Price is above both its 50-period and its 21-period EMA
  • Price is above its middle Bollinger band
  • RSI is neutral (59.39)
  • Volume is trading on above-average levels
Key levels to the upside          Key levels to the downside

1: $747                                     1: $675

2: $800                                     2: $653 

3: $900                                      3: $632

Ripple

XRP has experienced another extremely bad day, as its price dropped more than 22% on the day. The move came as a result of two major exchanges, OKEx and Coinbase, dropping support for XRP due to the pending lawsuit against its company, Ripple, as well as Ripple’s executives.

Trading XRP is extremely risky at the moment due to price fluctuations that are a result of news rather than technical formations.

XRP/USD 1-hour Chart

XRP’s technicals on all time-frames are tilted towards the sell-side, with all of them showing slight signs of neutrality.

XRP/USD 1-day Technicals

Technical factors (4-hour Chart):
  • Its price is currently far below both its 50-period EMA and its 21-period EMA
  • Price is at its bottom Bollinger band
  • RSI is in the oversold territory (28.88)
  • Volume has spiked to above-average levels
Key levels to the upside          Key levels to the downside

1: $0.25                                    1: $0.214

2: $0.30                                     2: $0.14

3: $0.358 

Categories
Forex Market Analysis

Daily F.X. Analysis, December 29 – Top Trade Setups In Forex – Technical Levels in Play! 

On Tuesday, the market’s fundamental side is mostly muted as we don’t have any significant economic data scheduled from any economy. The S&P/CS Composite-20 HPI y/y will be released during the U.S. session; however, it’s low-impact and may not drive any major movement in the market today.

Economic Events to Watch Today  


EUR/USD – Daily Analysis

The EUR/USD pair was closed at 1.22142 after placing a high of 1.22501 and a low of 1.21809. EUR/USD pair posted gains on Monday; however, some of the gains were lost in the late trading session. On the first day of the new trading week, the EUR/USD pair moved on the upside on the back of a weak U.S. dollar and the rising risk sentiment in the market. The global risk sentiment remained well supported by the latest optimism over a last0-minute Brexit deal and got an additional boost after the U.S. President Donald Trump finally signed the $2.3 trillion pandemic aid and spending package.

On Sunday, U.S. President Donald Trump signed the bipartisan bill of $2.3 trillion packages, including $900 billion for stimulus checks and $1.4 trillion for government funding. Trump, who first called this bill a disgrace, signed the bill and made it legislation as the government was near to shut down. However, he urged the U.S. Congress to increase the stimulus check amount to $2000 from $600. Given his calls, the House of Representatives led by Democratic leaders approved the CASH Act on Monday. The Act was designed to support Trump’s decision to increase the stimulus checks. The House voted 275-134 on Monday to increase the proposed $600 payments to more than triple $2000 and send it to Senate.

All these developments in the U.S. stimulus measure raised the market’s risk sentiment that ultimately added strength in the risk perceived EUR/USD pair. Meanwhile, another reason behind the EUR/USD pair’s upward momentum was the sharp rise in European markets on Monday. At the start of the last trading week of 2020, the Brexit developments and the U.S. stimulus measure raised the risk sentiment that supported the European stocks to move higher levels added in the EUR/USD pair. France’s CAC40 rose by 1.3%, the Swiss SMI surged by 1.8%, and Germany’s DAX index finished up by 1.5% on Monday.

However, some of the EUR/USD pair gains in the late trading session on Monday were lost after the news of a new variant of coronavirus reaching eight European countries emerged. The more contagious variant of coronavirus identified in the U.K. has been confirmed to be reported in Spain, Switzerland, Sweden, and France. This spread of a new variant of coronavirus affected EUR/USD’s upward momentum by weighing on the local currency Euro, as fears for economic slowdown emerged again in the European countries.

Daily Technical Levels

Support   Resistance

1.2179     1.2249

1.2144     1.2286

1.2108     1.2320

Pivot Point: 1.2215

EUR/USD– Trading Tip

On Tuesday, the EUR/USD consolidating in a narrow trading range of 1.2259 – 1.2205. On the 2 hour timeframe, the EUR/USD has formed an ascending triangle pattern supporting the pair around 1.2204 and a resistance at 1.2259. The MACD and RSI have now shifted to the bullish zone, supporting a bullish trend in the EUR/USD pair. Additionally, the 50 periods EMA supports the pair at 1.2204, and it’s also expending bullish sentiment for the EUR/USD pair today. 


GBP/USD – Daily Analysis

The GBP/USD pair was closed at 1.34574 after a high of 1.35760 and a low of 1.34289. On Monday, the currency pair GBP/USD fell sharply as market participants showed concerns that the post-Brexit trade agreement will slow the trade after the crucial services sector was largely excluded from the deal. The mayor of French fishing port has warned that Thursday’s historic Brexit trade deal between the U.K. and E.U. still left the fishing sector with many key questions unanswered. The mayor of Boulogne-sur-Mer, Frederic Cuvillier, said that the agreement left French fishermen wondering how it will impact them once the festive season was over. 

The long-awaited agreement between the two parties was resolved after granting a five-year transition period over fisheries, after which E.U. fish captures ought to be reduced by 25%. The concession was given from the U.K., who has initially demanded 60% at the start of the negotiations. Furthermore, on financial services, the Brexit deal is said to go in favor of the E.U. According to Boris Johnson, the agreement on financial services has fallen short of U.K. hopes. He said that perhaps the financial sector did not go as far as the U.K. would like. After these comments, Rishi Sunak offered financial services firms the prospect of closer access to E.U. markets than outlined in the Brexit trade deal.

Sunak said that he hoped that a planned memorandum of understanding on this issue between the U.K. and E.U. would smooth over many obstacles in the next few months. However, all these tensions weighed on the local currency British Pound and dragged the GBP/USD pair to the downside.

Meanwhile, the U.K. reported its highest day of new coronavirus infections on Monday with 41,385 new COVID-19 cases. The surge was driven by the new variant of the virus that is more transmissible and has forced the hospitals to cancel non-urgent procedures and scramble to find the space. Even though the new variant does not appear to make people sicker, it is believed to be up to 70% more contagious, resulting in an increased number of coronavirus infections in the U.K.

The rising number of coronavirus in the country and its faster rate affected the local currency, as hopes for an economic recovery dampened and weighed on the GBP/USD pair. It was another reason behind the downward momentum of the GBP/USD pair on Monday. However, the pair’s losses were limited on Monday due to the weakness of the U.S. dollar. The greenback was weak across the board as the U.S. President Donald Trump has signed the new coronavirus relief bill, turning it into law on Sunday. 

Whereas, the House of Representatives, which is led by Democrats, held a vote on the CASH Act on Monday, approved the Act, and passed it to the Senate. According to CASH Act, the number of stimulus checks in the bipartisan bill of $600 will be increased to $2000 as demanded by U.S. President Donald Trump and supported by the House of Democrats.

All the U.S. stimulus relief bill developments weighed on the U.S. dollar and capped further losses in the GBP/USD pair on Monday in the absence of any macroeconomic data release.

Daily Technical Levels

Support   Resistance

1.3393     1.3541

1.3337     1.3633

1.3245     1.3689

Pivot point: 1.3485

GBP/USD– Trading Tip

The GBP/USD is trading at 1.3485, having supported over 1.3443 level. The support level is extended by an upward trendline on the two-hourly timeframes. The GBP/USD pair is likely to face resistance at the 1.3525 level, and a bullish crossover of 1.3525 level can drive Sterling’s price towards 1.3620. The bullish trendline is likely to support the pair today at the 1.3443 level, and violation of this can extend the selling trend until the 1.3343 level.     


USD/JPY – Daily Analysis

The USD/JPY pair closed at 103.778 after placing a high of 103.896 and a low of 103.402. The currency pair USD/JPY extended its gains on Monday and raised for the second consecutive day as the market’s risk sentiment increased. The risk-on market sentiment was driven by the latest decision of Donald Trump to sign the bipartisan stimulus bill of $2.3 trillion that he had initially refused to pass. 

The U.S. President Donald Trump turned the bill of $2.3 trillion, including $900 billion for pandemic aid and $1.4 trillion for spending package on Sunday as the government was near to shut down in less than 30 days. However, despite signing the bill, Donald Trump continued urging Congress to increase the number of stimulus checks from $600 per person to $2000. Followed by his calls, the House of Representatives with a Democratic majority approved the CASH Act on Monday to allow the rise in payment of stimulus checks demanded by Donald Trump. The CASH Act was approved by Democrats and sent to Senate for further proceedings.

This added in to the risk sentiment as it raised hopes for economic recovery in a depressing environment and weighed on the safe-haven Japanese Yen that ultimately added in the USD/JPY pair’s upward momentum on Monday. Furthermore, the Bank of Japan released the summary of opinions at the December rate review that showed that the B.O. policymakers were divided on how far to go in changing its stimulus program, with some calling for an overhaul of its strategy achieving 2% inflation. 

The Governor of the Bank of Japan, Haruhiko Kuroda, said that the policy review would not lead to big changes to yield curve control (YCC) instead of focusing on fine-tuning the framework to make it more sustainable. However, some BOJ board members called for a more ambitious review as the hit to grow from coronavirus stokes fears of a return to deflation. 

On the data front, at 04:50 GMT, the Prelim Industrial Production reduced to 0.0% against the forecasted 1.4% and weighed on the Japanese Yen that added gains in the USD/JPY pair. Meanwhile, the USD/JPY pair’s gains were limited on Monday as the U.S. dollar was weak across the board due to the second round of stimulus relief package issuance. The bill will restore unemployment benefits to millions of Americans and averted a partial federal government shutdown that would have begun on Thursday. It raised the risk sentiment and weighed on the U.S. dollar that ultimately capped further upside in the USD/JPY pair on Monday.

Daily Technical Levels

Support   Resistance

103.47     104.02

103.25     104.37

102.91     104.58

Pivot point: 103.81

USD/JPY – Trading Tips

The USD/JPY is trading sideways at the 103.700 level, supported by an ascending triangle pattern. On the 2 hour timeframe, the USD/JPY pair is gaining support at 103.600 and 103.400 levels along with a resistance level of 103.860, which is extended by a triple top pattern. The pair is now closing a series of doji and spinning top candles, suggesting neutral bias among investors. It’s common during such a timeframe of December as most of the traders are on holiday. Let’s consider taking a buy trade over 103.860 level and selling below the same as this level is of major importance today. Good luck! 

Categories
Forex Market Analysis

Daily F.X. Analysis, December 28 – Top Trade Setups In Forex – Boxing Day Holiday! 

Welcome back to a fresh week after a long weekend. I hope you had a fantastic Christmas. The global banks will be closed in observance of Boxing Day today; therefore, we may have thin volatility and trading volume today in the market. Let’s check out the technical side of the market. 


Economic Events to Watch Today  


EUR/USD – Daily Analysis

The EUR/USD succeeded in maintaining its overnight bullish bias and remained well bid around above the 1.2200 level. However, the currency pair’s sentiment was being supported by the latest progress over the massive U.S. government spending bill and COVID-19 relief measures, which undermined the safe-haven U.S. dollar and contributed to the currency pair gains. 

Moreover, the S&P 500 Futures sentiment was further bolstered by the recent passage of the Brexit deal and upbeat comments from the covid vaccine producers, which in turn, added further weakness to the greenback and contributed to the currency pair gains. In contrast to this, the intensifying concerns about increasing COVID-19 deaths and the possibility of economically-painful hard lockdowns keep questioning the pair’s upside momentum. As of writing, the EUR/USD currency pair is currently trading at 1.2226 and consolidating in the range between 1.2181 – 1.2227.

The S&P 500 Futures enter the 3,700 marks and refreshed intraday high near 3,710 during early Monday. The market trading sentiment recently gained bids after U.S. President Donald Trump signed the much-awaited coronavirus (COVID-19) aid package, which instantly boosted the investor’s confidence. As per the New York Post, President Trump has signed a $2.3 trillion COVID-19 relief and government funding bill that includes $600 stimulus checks for most Americans. The funding bill authorizes direct checks of $600 for people earning up to $75,000 per year. In addition to this, the bill creates a new $300 weekly unemployment supplement and replenishes a forgivable loan program for small businesses, while there’s an additional $600 per child stimulus payment. This latest optimism put a bid under risk assets and weighed over the safe-haven U.S. dollar. 

Elsewhere, the gains in the currency pair were further bolstered after the passage of the Brexit deal and upbeat remarks from the covid vaccine makers. As per the latest report, the U.K.’s Foreign Secretary Dominic Raab said that the United Kingdom is now seeking trade deals with Australia, the United States, and countries in the Indo-Pacific region.” Across the pond, the AstraZeneca CEO Pascal Soriot said that their covid vaccine is effective against the new strain, which in turn exerted an additional positive impact on the market trading sentiment and contributed to the currency pair gains.

Looking ahead, the market traders will keep their eyes only on updates surrounding the virus, vaccine, and the U.S. stimulus package. However, the global markets may witness a dull trading session amid the year-end celebration mood and off at major bourses. 

Daily Technical Levels

Support Resistance

1.2143 1.2231

1.2090 1.2266

1.2055 1.2320

Pivot point: 1.2178

EUR/USD– Trading Tip

The EUR/USD is trading with a bullish bias at the 1.2224 area, having crossed over the triple top resistance level of 1.2200, now working as a support for the EUR/USD. Continuation of an upward trend can extend the buying trend until the 1.2250 level. The EUR/USD pair violates the symmetric triangle pattern, which is likely to drive further upward movement in the market. Bullish bias seems dominant today.

GBP/USD – Daily Analysis

The GBP/USD currency pair managed to maintain its bullish bias through the first half of the Asian session and remained bullish around above the mid-1.3500 level due to the prevalent risk-on market sentiment, which tends to undermine the safe-haven U.S. dollar and contributes to the currency pair gains. Hence the market trading sentiment was supported by the hopes of coronavirus vaccine and progress toward a massive U.S. government spending bill and COVID-19 relief measures. 

On the contrary, the currency pair trimmed some of its sharp gains during Monday’s European session as the renewed uncertainties over the future of the recently signed Brexit deal tend to undermine the British Pound even as markets are off in the U.K. Furthermore, the currency pair’s gains were also capped by the growing market concerns about the continuous rise in new coronavirus cases and the enforcement of fresh restrictions in the U.K. As of writing, the GBP/USD currency pair is currently trading at 1.3561 and consolidating in the range between 1.3530 – 1.3576.

Despite the recent passage of the Brexit deal, the doubts over the key issues like the level Playing Field, Finance, and Gibraltar remain on the cards as the U.K. Prime Minister Boris Johnson has admitted it is an agreement which does not have as much as he would have liked about the financial services sector and regulatory equivalence. He further added that this agreement would give the people hope that we will remain in close dialogue with our European partners regarding things like equivalence decisions. In that way, the uncertainties over the recently signed Brexit deal’s future exerted downside pressure on the GBP/USD currency pair.

Despite this, the S&P 500 Futures managed to extend its previous session’s positive performance and refreshed intraday high near 3,710 during the early European session on the day. The market trading sentiment recently gained bids after U.S. President Donald Trump signed the much-awaited coronavirus (COVID-19) aid package, which instantly boosted the investor’s confidence. As per the New York Post, President Trump has signed a $2.3 trillion COVID-19 relief and government funding bill that includes $600 stimulus checks for most Americans. The funding bill authorizes direct reviews of $600 for people earning up to $75,000 per year. 

In addition to this, the bill creates a new $300 weekly unemployment supplement and replenishes a forgivable loan program for small businesses, while there’s an additional $600 per child stimulus payment. This latest optimism put a bid under risk assets and weighed over the safe-haven U.S. dollar. 

Looking ahead, the market traders will keep their eyes only on updates surrounding the virus, vaccine, and the U.S. stimulus package as the global markets witnessing a dull trading session amid the year-end celebration mood and off at significant bourses. 

Daily Technical Levels

Support Resistance

1.3442 1.3562

1.3378 1.3618 

1.3322 1.3683

Pivot point: 1.3498

GBP/USD– Trading Tip

The Sterling is trading with a bullish bias at 1.376 level, heading further higher towards the next resistance level of 1.3650 level. Support stays at 1.3495 level today. This support level is extended by an upward trendline, which can be seen in the 4-hour timeframe. On the higher side, the GBP/USD pair can prolong the buying trend unto the 1.3622 level, and the bullish trend continuation can lead the GBP/USD pair towards the 1.3706 mark. 

USD/JPY – Daily Analysis

The USD/JPY failed to stop its previous-session bearish bias and remained depressed around below the 103.50 level, mainly due to the broad-based U.S. dollar weakness. The fresh optimism was pressuring the U.S. dollar that the U.S. President Donald Trump signed a $2.3 trillion COVID-19 relief and government funding bill, urging investors to retreat from the safe-haven investment riskier assets. Apart from this, the losses in the U.S. dollar could also be attributed to the lingering doubts over the U.S. economic recovery from COVID-1, which adds further burden around the U.S. dollar and contributes to the currency pair losses. 

The upbeat market sentiment, backed by the hopes of coronavirus vaccine and the U.S. covid stimulus, boosted investors’ confidence and undermined the safe-haven Japanese yen, which, in turn, was seen as one of the leading factors that helped the USD/JPY currency pair to limit its deeper losses.

Despite the worries over the coronavirus pandemic’s resurgence, the optimism over a possible vaccine for the highly infectious coronavirus disease has remained supportive of the market risk tone. Also favoring the optimism could be the recent comments from the covid vaccine producers. As per the keywords, AstraZeneca CEO Pascal Soriot said that their covid vaccine is effective against the new strain. Thus, the risk-on market mood tends to undermine the safe-haven Japanese yen, which becomes the key factor that lends some support to the currency pair to ease the intraday bearish pressure surrounding the USD/JPY currency pair.

In addition to this, the sentiment around the equity market was improved further after U.S. President Donald Trump signed a $2.3 trillion COVID-19 relief and government funding bill. It is worth noted that U.S. President Trump had signed a $2.3 trillion COVID-19 relief and government funding bill that includes $600 stimulus checks for most Americans. The funding bill authorizes direct reviews of $600 for people earning up to $75,000 per year. Furthermore, the bill creates a new $300 weekly unemployment supplement and provides a forgivable loan program for small businesses. Besides this, there’s an additional $600 per child stimulus payment. 

This, in turn, the broad-based U.S. dollar failed to stop its bearish trend and remained depressed on the day. Apart from this, doubts over the U.S. economic recovery remains on the cards amid rising COVID-19 deaths, which adds further burden around the greenback. However, the losses in the U.S. dollar becomes the key factor that kept the currency pair lower. Meanwhile, the U.S. dollar index, which measures the greenback against a bucket of currencies, dropped by 0.15% to 90.112 by 12:09 AM ET (5:09 AM GMT).

In contrast to this, the optimism around the equity market was slightly unaffected by the intensifying market worries regarding the continuous rise in new coronavirus cases in the U.S. and Europe, which keep sparking the worries over the global economic recovery through imposing new lockdown restrictions on economic and social activity. Furthermore, the equity market gains were also capped by the renewed uncertainty over the Brexit deal and intensified China-US tussles.

There isn’t any major market-moving economic data due for release on the day, which in turn, the market traders will keep their eyes only on updates surrounding the virus, vaccine, and the U.S. stimulus package as the global markets seeing a dull trading session amid the year-end celebration mood and off at major bourses.

Daily Technical Levels

Support Resistance

103.47 104.02

103.25 104.37

102.91 104.58

Pivot point: 103.81

USD/JPY – Trading Tips

The USD/JPY trades choppy in between a narrow trading range of 103.750 – 103.360 level. The safe-haven USD/JPY pair faces immediate support of 103.360, and the formation of candles above this level can drive the buying trend until 103.746. Whereas, bullish trend continuation can extend further buying trend until 104.090 level. The MACD and RSI are suggesting selling bias as it’s forming histograms below 0 level. While the 50 EMA also supports the selling trend. Let’s consider taking a selling trade until the 102.990 level today. Good luck!

Categories
Forex Basic Strategies

Trading The Forex Market Effectively Using ‘Renko’ Charts

Introduction

If you are a Forex trader, you can agree-many winning strategies exist out there. And Renko charts are among the handy weapons you can deploy to your advantage. This write-up will help you grasp handy tips to get your feet wet, as well as scaling your trading into a profitable trajectory.

Renko charts are not very popular as bars or candlesticks among traders. However, they can be very profitable when a trader uses them correctly. Renko chart trading is a robust way to analyze price trends, and even superb when you combine it with another tool to confirm entry and exit positions.

What Is Unique With Renko?

Well, Renko charts only show you the price movements of an underlying asset without factoring in time and volume. The formation of a Renko bar or body is in one direction. And it forms only when prices move by a predefined amount in pips. You can adjust the number of pips per block to suit your needs or trading strategy.

Also, a subsequent Renko bar can only form either adobe or below a previous one. It’s that model that shows you the price direction with unique preciseness.

Their naming arises from Japanese “Renga,” which means brick. Therefore, Renko charting arises from a series of blocks. In the light of Forex trading, the charting of the blocks moves up or down with prices.

Advantages of Trading Forex using Renko charts

  1. Renko charts are simple in both ease of interpretation and use.
  2. Great for determining the levels of support and resistance.
  3. Traders can adjust the block sizes to suit their trading needs.
  4. Renko charts are great at signaling price breakout or reversal.
  5. Ideally, Renko charts only show you how prices are moving.

Overall, Renko charts give traders an edge with overly volatile commodities like Oil and Gold. The charting digs deeper into the pricing histories. The charting model behind Renko builds on plotting price on the -Y-axis Vis a Vis time.

Renko beats conventional price-charting by removing insignificant price movements.

There are three metrics that Renko shades off from ordinary price action. And they are:

  • Any false price breakouts
  • The candle-wicks
  • The price volatility

Ideally, it pays attention to the critical metrics: support, resistance, and the trend.

Whenever prices move, Renko converts that into a commensurate block on the chart. And every block forms after price confirmations. The reality is, Renko charts do not work with partial blocks. They have to be wholesome and in line with the set numbers per single block.

As a trader, it makes great sense if you’re able to sift out short-term fluctuations out of a price chart. Beauty is Renko charting is a great tool at that. Price volatility is the greatest enemy for many traders, especially if you can only bring in a small trading margin.

While most traders can establish trends from normal price- charting, Renko charting is another wholesome set of trading tools to help you sharpen your decisions while trading.

More Pointers with Renko Charts

As indicated earlier, Renko charting creates blocks after by concurrently establishing the closing positions of a previous block. Next, subsequent blocks can only form either below or above a previous one.

Using the precedence above, Renko charting brings you a precise tool into your trading arsenal to help you view trends more clearly. Along with that, it’s also important to calculate the most appropriate block size – in line with the asset you target to trade.

Calculation of Renko blocks

There are two documented methods for the determination of the optimal sizes of Renko blocks.

First is the ATR or Average True Range. It relies on the ART indicator to determine the height of an ordinary candlestick.

Second is the model where a trader provides a predefined value for the size of a block.

So, new blocks only form when price movements meet the minimum value set for a block.

Sniffing a Buy Opportunity with Renko Charts

Image credits: best-trading-platforms.com

Renko charts help traders spot trend directions very clearly. And there are two ways to spot an opportunity to go long. Using the image above, a monthly view of a stock’s prices is visible. Simple, green bricks signify uptrends, while the ref ones signify the downtrend.

Primarily, the years 2017 and 2019 are trends – good opportunities to go long (buy). Towards the end of 2018, there’s a trend reversal (bricks turn red- the opportunity for buyers to exit and pocket profits)

Also, the same trend reversal creates an opportunity for traders to go short and also take profits. Look at 2019 also; the green bricks signify the continuity of the uptrend.

Image Credits: best-trading-platforms.com

Look at the figure above, the EUR/USD pair oscillations ranging from 1.0500 – 1.1500 from 2015 through to -2016. Also, notice the uptrend starting from 2017 but with a reversal along the way. Uptrends are opportunities to go long, while downtrends are opportunities to go short.

Pro Tip: If you are looking to upscale your trading success, Renko charts greatly help. However, ensure that aside from mastering them, it’s excellent to confirm the trends, support, and resistance levels using one or more indicators.

Keep in mind that trading success arises from careful analysis of entry and exit positions. Upfront, it may seem cumbersome – taking time to do the due diligence in the analysis. Utmost, do not trade with emotions. Renko charts and many other tools will help you sharpen your analysis.

The preciseness and effectiveness of a strategy arise from long spells of practical use. Renko is a super-tool for scalping when you compare it to classical price charting or bar or candlesticks.

Other handy trade signal tools to combine with Renko Charts

  • Simple Moving Averages -SME Enter trades with three bars in the direction of the trend and 10 SME sloping downwards or upwards. (This will help you avoid false breaks in a reversal against the trend)
  • On Balance Volume –OBV Enter trades when you confirm the trend and SME as tally that with OBV indicator’s direction.

Parting Shot

Renko charting brings in more preciseness for your trend confirmation in line with price action and the trend. It helps you filter out the noise with volume and time and leaves you with price direction only. For successful scalping, incorporating Renko is a better way to go about it. Renko charts help you keep the focus on the trend for position trades and note it’s the reversal in good time to exit.

Categories
Crypto Market Analysis

Daily Crypto Review, Dec 28 – Ethereum Breaks $700; Bitcoin at $30k?

The cryptocurrency sector had an incredible weekend as Bitcoin skyrocketed towards $28,000. Bitcoin is currently trading for $27,031, representing a decrease of 2.91% compared to yesterday’s value, but a massive increase compared to its value on Friday. Meanwhile, Ethereum’s price has increased by 12.79% on the day, while XRP managed to lose 4.05%.

 Daily Crypto Sector Heat Map

EncrypGen gained 2787.56% in the past 24 hours, making it the most prominent daily crypto gainer by far. It is followed by Bankacoin’s 212.44% and Trabzonspor Fan Token’s 178.8% gain. On the other hand, CEZO lost 89.89%, making it the most prominent daily loser. It is followed by JD Coin’s loss of 64.79% and Triumph X’s loss of 57.74%.

Top 10 24-hour Performers (Click to enlarge)

Bottom 10 24-hour Performers (Click to enlarge)

Bitcoin’s market dominance has moved down slightly since our last report, with its value currently being 69.1%. This value represents a 0.25% difference to the downside than the value it had when we last reported.

Daily Crypto Market Cap Chart

The cryptocurrency sector capitalization has increased over $100 billion since we last reported, with its current value being $721.10 billion. This represents a $101.89 billion increase when compared to our previous report.

_______________________________________________________________________

What happened in the past 24 hours?

_______________________________________________________________________

_______________________________________________________________________

Technical analysis

_______________________________________________________________________

Bitcoin

Bitcoin did not sleep this weekend as it took its time to push towards new all-time highs. The best-known cryptocurrency pushed towards the upside, reaching as high as $28,391 at one point. It is now consolidating around the $27,000 level and preparing for the next move.

Our Fib extensions drawn on Friday worked exactly as expected, with Bitcoin respecting every single one of them. With all of them still being a valid choice, traders should either look for a bounce off the immediate support levels or increased volume followed by a sharp increase in price. Trading Bitcoin’s pullbacks is not exactly the best option at the moment.

BTC/USD 4-hour chart

While Bitcoin’s 4-hour and weekly technicals show a full tilt towards the buy-side, its daily and monthly technicals show some neutrality signs.

BTC/USD 1-day Technicals

Technical factors (4-hour Chart):
  • Price is above its 50-period EMA and slightly above its 21-period EMA
  • Price is slightly above its middle Bollinger band
  • RSI is neutral (62.10)
  • Volume is slightly above average
Key levels to the upside          Key levels to the downside

1: $28,391                                 1: $25,512

2: $29,000                                 2: $24,696

3: $30,000                                  3: $24,315

Ethereum

While Ethereum did manage to score some gains over the weekend, its upside got overshadowed by Bitcoin’s growth. However, the second-largest cryptocurrency by market cap has decided to make that up by suddenly pushing from $624 all the way up to $738. While the move seemingly ended here, it is not yet certain whether the price will break the level or go even higher, or start its consolidation at slightly lower levels.

Traders should utilize the volume indicator, order books, and well-established support/resistance levels to its fullest to catch these explosive trades while remaining safe.

ETH/USD 4-hour Chart

Ethereum’s shorter time-frames are completely bullish, while its longer-time frames show slight neutrality signs.

ETH/USD 1-day Technicals

Technical Factors (4-hour Chart):
  • Price is far above both its 50-period and its 21-period EMA
  • Price is at its top Bollinger band
  • RSI has stepped into the overbought territory (71.68)
  • Volume is trading on above-average levels
Key levels to the upside          Key levels to the downside

1: $738                                     1: $675

2: $800                                     2: $632 

3: $900                                      3: $600

Ripple

XRP has been trading on low volume and slowly descending after a brief rally to $0.385. The fourth-largest cryptocurrency keeps getting crushed by various companies dropping support or liquidating their XRP positions after Ripple and its executives got sued by the SEC.

XRP traders should (more than anything) pay attention to the news. However, there are many other cryptocurrencies with much safer and potentially more profitable trading setups at the moment.

XRP/USD 4-hour Chart

XRP’s technicals on all time-frames slightly tilted towards the sell-side, but they all show some signs of uncertainty.

XRP/USD 1-day Technicals

Technical factors (4-hour Chart):
  • Its price is currently far below its 50-period EMA and slightly below its 21-period EMA
  • Price slightly below its middle Bollinger band
  • RSI has left the oversold territory (37.46)
  • Volume is returning to average levels
Key levels to the upside          Key levels to the downside

1: $0.30                                    1: $0.25

2: $0.358                                   2: $0.214

3: $0.475 

Categories
Forex Elliott Wave Forex Market Analysis

GBPCAD Triangle Pattern Completion. What’s Next?

The GBPCAD cross shows the completion of an Elliott wave triangle developed in its wave ((b)) of Minute degree, which moves inside the incomplete wave 2 of Minor degree. 

Technical Overview

The big picture of GBPCAD cross under the Elliott Wave view exposed in the following daily chart shows the progress of a corrective structure that began on March 09th when the price found fresh sellers at 1.80531. Once the cross topped at 180531, the cross completed an impulsive wave identified as wave 1 of Minor degree labeled in green and began to develop its wave 2 of the same degree, which remains incomplete.

The previous chart also shows the price developed its wave ((a)) of Minute degree in black as a sharp decline, making its next path corresponding to wave ((b)) as a triangle pattern. This price context carries us to verify the alternation principle between waves inside a corrective pattern. In fact,  the speedy first corrective leg gave way to an elapsed second move in an extended time range compared with wave ((a)). Likewise, the next decline corresponding to wave ((c)) shouldn’t be as quick as wave ((a)).

On the other hand, the piercing below the base-line of the triangle that connects the end of waves (b) and (d) of Minuette degree labeled in blue suggests that the cross could see further declines in the following weeks. Additionally, considering that the price action didn’t surpass the end of wave (e), the likelihood of further drops increases.

Technical Outlook

The next daily chart exposes the time segment of the corrective sequence corresponding to wave 2 of Minor degree, in which waves ((a)) and ((b)) in black were moving for 259 days, starting when the cross topped at 1.80531 and till the end of wave (e) in blue. Additionally, the piercing of the base-line that connects the end of waves (b) and (b) suggests that wave (c) should be in progress.

In this context, the incomplete bearish sequence in progress corresponding to wave ((c)) could extend in a fraction of 259 days, for example, 50 percent of that time or approximately 130 days, which carries us to foresee a downward correction in the GBPCAD cross till early April 2021. Likewise, the potential bearish target zone can be found between 1.65562 and 1.63042.

In summary, the GBPCAD cross advances in an incomplete corrective sequence corresponding to wave 2 of Minor degree. Simultaneously, its internal structure reveals the progress in its wave ((c)). The potential bearish target for this segment extends between 165562 and 1.63042. Also, the downward sequence could elapse until early April 2021. Finally, the invalidation level of the current bearish scenario is located at 1.75549.

Categories
Crypto Market Analysis

Daily Crypto Review, Dec 24 – XRP Downturn Pulls the Crypto Sector in the Red

The cryptocurrency sector reacted to XRP getting crushed by the market and ended up mostly in the red. Bitcoin is currently trading for $23,112, representing a decrease of 1.97% when compared to yesterday’s value. Meanwhile, Ethereum’s price has decreased by 6.27% on the day, while XRP managed to lose a whopping 30.85%.

 Daily Crypto Sector Heat Map

Folgory Coin gained 5571.49% in the past 24 hours, making it the most prominent daily crypto gainer by far. It is followed by MINDOL’s 1224.26% and DACC’s 1070.44% gain. On the other hand, 3x Long XRP Token lost 77.00%, making it the most prominent daily loser. It is followed by B21 Invest’s loss of 74.30% and YFPRO Finance’s loss of 70.96%.

Top 10 24-hour Performers (Click to enlarge)

Bottom 10 24-hour Performers (Click to enlarge)

Bitcoin’s market dominance has moved up over one percent since our last report, with its value currently being 69.3%. This value represents a 1.5% difference to the upside than the value it had when we last reported.

Daily Crypto Market Cap Chart

The cryptocurrency sector capitalization has decreased significantly since we last reported, with its current value being $619.31 billion. This represents a $22.90 billion decrease when compared to our previous report.

_______________________________________________________________________

What happened in the past 24 hours?

_______________________________________________________________________

_______________________________________________________________________

Technical analysis

_______________________________________________________________________

Bitcoin

Bitcoin was one of the few cryptocurrencies not affected by the major downturn of XRP after the SEC announced a lawsuit against Ripple and its executives. The largest cryptocurrency by market cap stayed within its wide range and continued trading sideways after bouncing back from the $24,000 level.

Traders currently have the option to catch a couple of safe trades within the trading range Bitcoin is in, or wait for it to spike in volume and break the range (either to the downside or upside).

BTC/USD 4-hour chart

While Bitcoin’s daily and weekly technicals are slightly tilted towards the bull side, its 4-hour and monthly technicals show some hints of neutrality alongside the bullishness.

BTC/USD 1-day Technicals

Technical factors (4-hour Chart):
  • Price is above its 50-period EMA and at its 21-period EMA
  • Price at its middle Bollinger band
  • RSI is neutral (53.57)
  • Volume is slightly above average
Key levels to the upside          Key levels to the downside

1: $24,315                                 1: $22,054

2: $24,700                                 2: $21,350

3: $25,511                                  3: $19,918

Ethereum

Unlike Bitcoin, Ethereum got affected by XRP’s downturn, which pulled it back over 5% on the day. The second-largest cryptocurrency fell below its $600 support level, and caused a quick panic-sell which brought its price as low as $550 (though just for a moment). Ether is now fighting to stay above the $581 level, which it will most likely succeed.

Many analysts are calling for a double bottom and are expecting an upswing from Ethereum. Traders should pay close attention to Ether’s volume and (possibly) order books.

ETH/USD 4-hour Chart

Ethereum’s weekly and monthly technicals are completely bullish, while its 4-hour and daily overview are mainly tilted towards the sell-side, but show some signs of uncertainty.

ETH/USD 1-day Technicals

Technical Factors (4-hour Chart):
  • Price is below both its 50-period and its 21-period EMA
  • Price is close to its bottom Bollinger band
  • RSI is neutral (37.44)
  • Volume is on slightly above-average levels
Key levels to the upside          Key levels to the downside

1: $600                                     1: $581

2: $632                                     2: $564 

3: $675                                      3: $545

Ripple

XRP got crushed as more bad news came. The fourth-largest cryptocurrency by market cap got dropped by various exchanges, as well as its positions fully liquidated by major funds such as Bitwise. Its price dipped over 65% in just 5 days. However, XRP seems to have found support in (first) the $0.214 and (later) $0.25 levels.

XRP will most likely try to either hold its price level or push slightly towards the upside. While its further downside potential is not very high (unless more bad news comes out), buying or longing XRP is extremely risky.

XRP/USD 4-hour Chart

XRP’s technicals on all time-frames are completely tilted towards the sell-side.

XRP/USD 1-day Technicals

Technical factors (4-hour Chart):
  • Its price is currently far below both its 50-period EMA and its 21-period EMA
  • Price slightly above its bottom Bollinger band
  • RSI is in the oversold territory (19.40)
  • Volume is on extremely high levels
Key levels to the upside          Key levels to the downside

1: $0.30                                    1: $0.25

2: $0.358                                   2: $0.214

3: $0.475 

Categories
Forex Fundamental Analysis Forex Technical Analysis

Fundamental Analysis Vs Technical Analysis: Know the Differences!

Traders make decisions about when and what to trade based on several different factors. Fundamental and technical analysis are two different methods that one can use to predict what will happen with any given instrument by looking at different types of data. As a forex trader, you’ll need to understand the differences between these key schools of thought so that you can make more informed trading decisions. Both fundamental and technical analysis can give you an edge in the markets, but you’ll need to decide which one sounds the most appealing or consider using both methods. 

Fundamental Analysis

Fundamental analysis aims to measure the intrinsic value of a stock by looking at several different factors about the company. This method considers earnings, outgoing costs, assets, liabilities, the overall business model, the status of those in charge, and many other things about a company in order to get the best idea of where prices will go. Some of these things can be measured in simple numerical terms, while others can’t.

For example, you’ll find statistics and numbers when it comes to things like earning reports but evaluating the company’s business model is more of a personal interpretation. Real-time events can also affect the company evaluation. If a scandal goes down involving a certain company, for example, you can expect its revenue to fall. All of these things are taken into consideration when one measures the intrinsic value of a company through fundamental analysis. 

Technical Analysis

Technical analysts exclusively consider a stock’s price and volume, with no need to calculate extra factors. Traders using this method look at charts in order to identify the history of patterns and trends for an idea of what they will do in the future. Some examples of the most popular forms of technical analysis include simple moving averages, support & resistance, trend lines, and other indicators. There are three main types of technical analysis – bar, candlestick, and line charts. Each of these is created using the same price data but will display the data in different ways. This school of thought believes in the idea that charts are great for predicting the past. 

The Bottom Line

While fundamental and technical analysis both aim to predict where a stock’s price will go, each school of thought uses very different methods to come up with its prediction. Fundamental analysts aim to measure the intrinsic value of a company by taking several factors into account, including hard numbers and some personal interpretation. Technical analysts study charts from the past with the stock’s volume and price being the only information considered. While technical analysts look at more complex information about companies that affect a stock’s price in the present and future, technical analysts study charts from the past to get an idea of where the price will go in the future. Both methods have been proven to be effective, so one would need to personally decide which to use.

Categories
Crypto Market Analysis

Daily Crypto Review, Dec 23 – Is This the End of XRP? SEC Officially Files Lawsuit Against Ripple and its Executives

The cryptocurrency sector was mostly neutral as Bitcoin gained even more market dominance. Bitcoin is currently trading for $23.498, representing an increase of 3.53% when compared to yesterday’s value. Meanwhile, Ethereum’s price has increased by 1.28% on the day, while XRP managed to lose a whopping 23.99%.

 Daily Crypto Sector Heat Map

SYNC Network gained 97.23% in the past 24 hours, making it the most prominent daily crypto gainer by far. It is followed by 3x Short XRP Token’s 84.56% and Basis Share’s 77.1% gain. On the other hand, DMme lost 85.99%, making it the most prominent daily loser. It is followed by 3x Long XRP Token’s loss of 66.89% and S4FE’s loss of 60.04%.

Top 10 24-hour Performers (Click to enlarge)

Bottom 10 24-hour Performers (Click to enlarge)

Bitcoin’s market dominance has moved up over one percent since our last report, with its value currently being 67.8%. This value represents a 1.2% difference to the downside than the value it had when we last reported.

Daily Crypto Market Cap Chart

The cryptocurrency sector capitalization has increased since we last reported, with its current value being $642.21 billion. This represents a $9.69 billion increase when compared to our previous report.

_______________________________________________________________________

What happened in the past 24 hours?

_______________________________________________________________________

_______________________________________________________________________

Technical analysis

_______________________________________________________________________

Bitcoin

Bitcoin continued trading within a decently large range, bound by $22,054 to the downside and $24,315 to the upside. The largest cryptocurrency by market cap managed to gain a couple of percent on its price today, as most of the market consolidated. Therefore, Bitcoin market dominance has risen once again, almost reaching 70%.

Bitcoin’s descending volume and sideways trading were always a sign of a new move in the making. However, as the current trading range is quite wide, the sharp move to either side might not be so imminent.

BTC/USD 4-hour chart

While Bitcoin’s daily and weekly technicals are tilted towards the bull side, its 4-hour and monthly overviews are slightly bullish, but show some hints of neutrality.

BTC/USD 1-day Technicals

Technical factors (4-hour Chart):
  • Price is above its 50-period EMA and slightly above its 21-period EMA
  • Price near its middle Bollinger band
  • RSI is neutral (56.31)
  • Volume is slightly above average
Key levels to the upside          Key levels to the downside

1: $24,315                                 1: $22,054

2: $24,700                                 2: $21,350

3: $25,511                                  3: $19,918

Ethereum

Ethereum has followed Bitcoin to the upside and gained just enough traction to attempt a $632 level break, but not enough to actually break it. This triggered a small correction, which brought it to the middle of the range, bound by $600-$602 to the downside and $632 to the upside.

Ethereum’s price movements are (in the past couple of days) either an exact copy of Bitcoin’s moves, or an exaggerated move in the same direction. Traders could possibly use this to trade Ether’s exaggerated moves by watching Bitcoin’s movement.

ETH/USD 4-hour Chart

Ethereum’s daily, weekly, and monthly technicals are completely bullish, while its 4-hour overview is tilted towards the sell-side.

ETH/USD 1-day Technicals

Technical Factors (4-hour Chart):
  • Price is slightly below both its 50-period and its 21-period EMA
  • Price is close to its middle Bollinger band
  • RSI is neutral (44.94)
  • Volume is on slightly above-average levels
Key levels to the upside          Key levels to the downside

1: $632                                     1: $600

2: $675                                     2: $581 

3: $738.5                                   3: $564

Ripple

XRP got crushed today on horrible news of SEC officially filing a lawsuit against its company Ripple as well as against its cofounders. While MoneyGram took a lenient position and didn’t want to make any negative comments, most crypto exchanges are planning on delisting XRP due to concerns regarding regulation.

While some may think that short-selling XRP is a good idea, watch out for slippage and insufficient demand.

XRP/USD 4-hour Chart

XRP’s short-term technicals show a heavy tilt towards the sell-side, while its long-term technicals (weekly and monthly) remain bullish.

XRP/USD 1-day Technicals

Technical factors (4-hour Chart):
  • Its price is currently far below both its 50-period EMA and its 21-period EMA
  • Price slightly below its bottom Bollinger band
  • RSI is in the oversold territory (18.53)
  • Volume is on extremely high levels
Key levels to the upside          Key levels to the downside

1: $0.40                                    1: $0.33

2: $0.475                                   2: $0.297

3: $0.481 

Categories
Crypto Market Analysis

Daily Crypto Review, Dec 22 – XRP Plummets on News of SEC Suing Ripple; Crypto Sector in the Red

The cryptocurrency sector bounced back from its recent highs as the news of a new COVID-19 strain came out. Bitcoin is currently trading for $22,716, representing a decrease of 5.01% when compared to yesterday’s value. Meanwhile, Ethereum’s price has decreased by 5.41% on the day, while XRP managed to lose a whopping 16.97%.

 Daily Crypto Sector Heat Map

P2P gained 185.24% in the past 24 hours, making it the most prominent daily crypto gainer by far. It is followed by DMme’s 123.95% and Actinium’s 96.18% gain. On the other hand, Wownero lost 54.05%, making it the most prominent daily loser. It is followed by Tap’s loss of 47.05% and Super Bitcoin’s loss of 46.31%.

Top 10 24-hour Performers (Click to enlarge)

Bottom 10 24-hour Performers (Click to enlarge)

Bitcoin’s market dominance has moved up over one percent since our last report, with its value currently being 66.6%. This value represents a 1.4% difference to the downside than the value it had when we last reported.

Daily Crypto Market Cap Chart

The cryptocurrency sector capitalization has decreased significantly since we last reported, with its current value being $632.90 billion. This represents a $36.72 billion decrease when compared to our previous report.

_______________________________________________________________________

What happened in the past 24 hours?

_______________________________________________________________________

_______________________________________________________________________

Technical analysis

_______________________________________________________________________

Bitcoin

Bitcoin experienced a 5% pullback after the news of a new strain of COVID-19 came out. Of course, Bitcoin was not the only one hit, as all traditional asset classes dipped in the past 24 hours as well. The downturn got stopped at the $22,054 level, and quickly sprung up to the current levels.

As mentioned in our previous daily crypto review, Bitcoin would experience an increase in volume as it exits consolidation below the recent highs, which happened today.

BTC/USD 4-hour chart

While Bitcoin’s daily technicals are tilted towards the bull side, its 4-hour overview is completely neutral. On the other hand, its weekly and monthly overviews are tilted towards the buy-side, but show hints of neutrality.

BTC/USD 1-day Technicals

Technical factors (4-hour Chart):
  • Price is above its 50-period EMA and below its 21-period EMA
  • Price between its bottom and middle Bollinger band
  • RSI is neutral (48.91)
  • Volume is slightly above average
Key levels to the upside          Key levels to the downside

1: $24,315                                 1: $22,054

2: $24,700                                 2: $21,350

3: $25,511                                  3: $19,918

Ethereum

Ethereum has followed Bitcoin to the downside, and lost just over 5% on the day. The second-largest cryptocurrency by market cap fell below the $632 level and attempted to break the $600-$602 support line. However, ETH bulls stopped the downturn, and the cryptocurrency is now consolidating right above this level.

Ethereum’s price movements are pretty tame so far, and traders should pay close attention to Bitcoin and its movement in the near future as Ether seems to follow it almost to the tee.

ETH/USD 4-hour Chart

Ethereum’s daily, weekly and monthly technicals show a strong bullish tilt, while its 4-hour overview is tilted towards the sell-side.

ETH/USD 1-day Technicals

Technical Factors (4-hour Chart):
  • Price is below both its 50-period and its 21-period EMA
  • Price is close to its bottom Bollinger band
  • RSI is heading towards being oversold (37.52)
  • Volume is on slightly above-average levels
Key levels to the upside          Key levels to the downside

1: $632                                     1: $600

2: $675                                     2: $581 

3: $738.5                                   3: $564

Ripple

XRP had a horrible 24 hour trading session as its price crashed on Ripple’s announcement that they will most likely get sued by the SEC. This news brought its price down almost 20%, with it currently trading right above the $0.457 level, which stopped XRP from going down further.

XRP traders should pay attention to further updates on the lawsuit news as well as to any volume increase the cryptocurrency experiences.

XRP/USD 4-hour Chart

XRP’s long-term technicals (weekly and monthly) show a slight tilt towards the buy-side, while its short-term technicals (4-hour and daily) are completely bearish.

XRP/USD 1-day Technicals

Technical factors (4-hour Chart):
  • Its price is currently far below both its 50-period EMA and its 21-period EMA
  • Price slightly below its bottom Bollinger band
  • RSI is in the oversold territory (25.83)
  • Volume has returned to average levels
Key levels to the upside          Key levels to the downside

1: $0.5                                      1: $0.475

2: $0.543                                   2: $457

3: $0.57                                    3: $45

Categories
Crypto Market Analysis

Daily Crypto Review, Dec 21 – Bitcoin Dangerously Close to Making a Sharp Move

The cryptocurrency sector is split between gainers and losers as Bitcoin consolidates right below its all-time high level. Bitcoin is currently trading for $23,825, representing an increase of 1.03% when compared to yesterday’s value. Meanwhile, Ethereum’s price has decreased by 1.42% on the day, while XRP managed to lose 3.20%.

 Daily Crypto Sector Heat Map

Axion gained 3402.38% in the past 24 hours, making it the most prominent daily crypto gainer by far. It is followed by MahaDAO’s 199.69% and Elxis’ 186.79% gain. On the other hand, Golden Ratio Per Liquidity lost 59.64%, making it the most prominent daily loser. It is followed by ALL BEST ICO’s loss of 50.84% and Quras’s loss of 49.42%.

Top 10 24-hour Performers (Click to enlarge)

Bottom 10 24-hour Performers (Click to enlarge)

Bitcoin’s market dominance has moved down almost half a percent since our last report, with its value currently being 65.1%. This value represents a 0.4% difference to the downside than the value it had when we last reported.

Daily Crypto Market Cap Chart

The cryptocurrency sector capitalization has increased since we last reported, with its current value being $669.26 billion. This represents an $18.25billion increase when compared to our previous report.

_______________________________________________________________________

What happened in the past 24 hours?

_______________________________________________________________________

_______________________________________________________________________

Technical analysis

_______________________________________________________________________

Bitcoin

Bitcoin has spent its weekend slowly rising towards the resistance level of its trading channel, which is bound by $22,055 to the downside and $24,315 to the upside. However, The two attempts to break the resistance level and enter the price discovery phase failed, leaving Bitcoin just below $24,315. With volume descending ever since Dec 17, we might expect this consolidation to end with a volume boom and a very sharp move.

While it is yet unknown whether this sharp move will be to the upside or downside, the increase in volume and a strong push towards one side will make it quite clear. Traders can use this momentum to catch a very safe trade.


BTC/USD 2-hour chart

While Bitcoin’s technicals are overall bullish, they either show signs of neutrality or even hints of bearishness. Its daily and monthly overviews have some indications of sellers being present, while its 4-hour and weekly overviews are bullish-neutral.

BTC/USD 1-day Technicals

Technical factors (4-hour Chart):
  • Price is far above both its 50-period and its 21-period EMA
  • Price slightly below its top Bollinger band
  • RSI is close to being overbought (65.90)
  • Volume is decreasing, and trading below the average level
Key levels to the upside          Key levels to the downside

1: $24,315                                 1: $22,054

2: $24,700                                 2: $21,350

3: $25,511                                  3: $19,918

Ethereum

Ethereum has, unlike Bitcoin, descended slowly within its trading range, which is bound by $675 to the upside and $632. The second-largest cryptocurrency by market cap had one strong push towards the downside, which brought its price all the way down to $620 on Dec 20. However, the bulls prevailed, and Ether is now trading above $632 safely.

Ethereum’s price movements seem pretty tame, meaning that its next move will be of larger magnitude. Traders should pay close attention to Bitcoin and its moves in the near future before trading any other cryptocurrency, including Ether.

ETH/USD 2-hour Chart

Ethereum’s technicals are very bullish on all time-frames, with only its weekly overview showing slight neutrality.

ETH/USD 1-day Technicals

Technical Factors (4-hour Chart):
  • Price is far above its 50-period and at its 21-period EMA
  • Price is slightly below its bottom Bollinger band
  • RSI is neutral (52.43)
  • Volume is on slightly above-average levels
Key levels to the upside          Key levels to the downside

1: $675                                     1: $632

2: $738.5                                  2: $600 

3: $817.5                                   3: $581

Ripple

With XRP’s strong push towards the upside ending on Dec 17, the fourth-largest cryptocurrency by market cap has entered another descending channel. The price was slowly dwindling down over the weekend, breaking the $0.57 support level, and then confirming its position below it. The price even went below the $0.543 support at one point, but quickly recovered.

XRP’s volume is currently almost non-existent, and traders should pay attention to any volume spikes if they intend on trading XRP.

XRP/USD 2-hour Chart

XRP’s technicals are quite mixed, but overall tilted slightly towards the buy-side. It’s 4-hour and daily overviews are bullish-neutral, while its weekly overview shows some hints of bearishness. Its monthly overview, however, is completely bullish.

XRP/USD 1-day Technicals

Technical factors (4-hour Chart):
  • Its price is currently between its 50-period EMA and its 21-period EMA
  • Price slightly above its bottom Bollinger band
  • RSI is neutral (48.77)
  • Volume has descended to average levels
Key levels to the upside          Key levels to the downside

1: $0.57                                    1: $0.543

2: $0.597                                   2: $0.5

3: $0.63                                    3: $0.475

Categories
Crypto Videos

Stimulus Hope Is Driving Up The Dow Jones – Should You Buy Or Short it?


Stimulus hopes drive up the Dow Jones – where next? 

Thank you for joining this Forex Academy educational video

In this session, we will be looking at the Dow Jones 30 Industrial Index and looking for indications of the next likely move.

While the United States economy is still reeling from the ongoing Covid situation, which has as a country in its grip, investors are looking long-term, buoyed on by vaccine news and hopes of a speedy back to normal recovery once it has been rolled out to the general population. 

In reality, of course, this may still take over 12 months to implement. Therefore hopes of the recovery are fuelled by my hopes that the American government will continue to support individuals and companies via a Covid-19 relief aid stimulus to help unemployed and financial relief for other individuals and those who need it.

This has been stifled somewhat by the fact that the discussions between the democrats and republicans have not yet been able to agree on how much money the state should put up. Current estimations are that a $900 billion stimulus bill may include checks for $600 for eligible adults and their independents. 

Some Republicans have asked for hand-outs of $1,200 per individual and $2400 per couple, with $500 going to children, to support families through this critical time.

The plan is that the 900 billion stimulus package will be the first of two parts, with phase one considered as an emergency relief bill, and phase two will kick in during the early part of January 2021, once that has been agreed on.

It is talk of the stimulus package, which has been keeping the Dow Jones at record highs.

This is a daily chart of the Dow Jones 30 industrial index.  We can see that since March 2020, the general trend has been a bull trend to the upside, following on from the earlier crash as the pandemic took hold in early February. The technical line numbered 1 shows the general upward trend as hopes of a V-shaped recovery fuelled investor to buy the index.

More recently, talks of an emergency stimulus package, and especially during November where investors believed a deal was imminent, saw price action move higher from this average and particularly where we see the bullish bounce from the line where we see a steady rise up to the record-breaking 30,000 level at position A. 

Talks of the stimulus package went to and fro between the democrats and republicans, with concerns of the, will they or won’t they agree on a package and where price action moved lower to the trend line at position 2, while talks stalled, and where price action itself bounced this higher trend line, marked as 2, back up at position B C  and D in an overall bias squeeze to the upside, where price continued to flirt with 30,000 and eventually where there was a significant close and open above this key level.

In this 1-hour chart, we can see that price action is seeing resistance at around 30,300.

And by adding this support line, we now have rising wedge formation clearly evident, where price action is fading to the upside, with a potential break above the 30,300 level. Should this immanent covid relief bill be agreed upon, price action could punch higher and continue with potential for the 30,300 level to become a support line and a possible move higher by 200 or 300 points.

There is so much pressure on the American government right now to come up with an agreed amount of stimulus for those who need it that it is almost impossible that nothing will happen. This is what is driving the Dow Jones Index and other US indices higher at the moment.


Categories
Forex Elliott Wave Forex Market Analysis

AUDNZD: Profiting from its Intraday Triangle Pattern

The AUDNZD cross seems to start a movement in wave 3 of Minor degree labeled in green after completing its second corrective wave of the same degree, which found its bottom at 1.04181 on December 01st.

Technical Overview

The big picture of the AUDNZD cross and under the Elliott Wave perspective and illustrated in the following daily chart reveals the bullish sequence of Minor degree that began last March 09th, when the price pierced the parity level, dropping to 0.99906.

Once the price found fresh buyers, the Oceanic cross climbed in five internal movements of Minute degree, identified in black, until 1.10438, where the cross completed its first wave in green. After this completion, AUDNZD dropped in a complex corrective formation identified as a double-three pattern, which found support at 1.04181 on December 01st. From there, it bounced up to the current levels. 

On the other hand, the breakout of the short-term descending trendline that connects the end of wave ((x)), in black, with the end of wave (b), in blue, suggests the end of the second wave of Minor degree.

Short-term Technical Outlook

The intraday view unfolded in the next 2-hour chart shows the rally that remains in progress since December 01st when the cross found fresh buyers at 1.04181 suggesting further upsides in the following trading sessions.

The previous chart shows the wave (iii) movement of the Minuette degree labeled in blue, which currently looks consolidating its internal structure in a potential running triangle pattern. 

According to the Elliott Wave theory, practically all running triangle patterns tend to be confused with ending diagonals driving retail traders to open trades in the opposite direction to the current trend instead of considering the pattern as a continuation of the trend. Therefore under this scenario, our main bias remains on the bullish side. In this regard, this triangular pattern makes us think that the Oceanic cross might continue extending its movement until the potential target zone between 1.0758 and 1.0816, where the price could complete its third wave, in blue.

In summary, the AUDNZD cross completed its second wave of Minor degree subdivided in a descending three-wave sequence calling for a new upward movement in favor of the first rally, which should follow a five-wave sequence. In this context, the internal structure shows the progress in the third wave of an impulsive wave, which looks consolidating in a running triangle pattern. The potential target of the current rally is located between 1.0758 and 1.0816. On the other hand, the bullish scenario’s invalidation level is set at 1.04181, corresponding to the origin of the current upward sequence.

Categories
Crypto Market Analysis

BTC/USD Weekly Chart Analysis + Possible Outcomes

In this week’s BTC/USD analysis, we will be taking an in-depth look at the most recent technical formations, as well as look for the possible price outcomes in the following days.

Overview

The crypto sector was nothing short of explosive as Bitcoin pushed past its old all-time highs and reached almost as high as $24,000. The largest cryptocurrency by market cap went into skyrocket mode without facing much resistance until it hit a wall near $23,800. As it failed to break this level twice, it started a consolidation phase.

While Bitcoin’s sentiment is extremely bullish, many analysts call for a pullback and say that the most recent push to the upside is still much overextended. However, Bitcoin is consolidating sideways rather than pulling back. One thing is certain, Bitcoin is preparing for its next move.

Technical factors


Bitcoin is currently in consolidation mode after it hit a wall twice near the $23,800 price level. The price range is getting narrower and narrower as time passes, indicating a strong breakout move out of the current boundaries inevitable. On top of that, Bitcoin’s volume has been steadily declining after the final attempt above $23,777. When it comes to support, Bitcoin’s downside is protected by the 21-period moving average as well as the $22,320 Fib retracement line.

While a move to the downside should be considered healthy, the current price bouncing off of its support levels might be just good enough for BTC to push towards the upside once again.

Likely Outcomes

We can expect three main outcomes for Bitcoin, with the ones starting with an upswing being just slightly more plausible.

  1. Bitcoin’s price can easily shoot up past $23,777 and enter price discovery mode yet again. Not much to say about the target levels there, except that the possible resistance zones might be Fib extensions from the current Fib retracement levels.
  2. Bitcoin’s price is most likely to push towards the upside, hit the all-time high level, and fail to break it, therefore prompting a pullback. In this case, the price will most likely fall below $22,320 and head straight for the $21,420 or even lower (some analysts are calling for a drop below $20,000 and a CME Futures gap fill).
  3. Bitcoin’s price might head straight down and break the $22,320 level, in which case the market will steadily test every single support level that has worked until now.

In any case, a significant increase in volume will be required, and traders should certainly pay attention to it.

Categories
Forex Videos

US Stock Indices – Which Currencies Should You Be Buying Right Now!


US stock indices – Bad news is the new good news!

Thank you for joining this forex academy educational video.

In this session we will be looking at us stock indices,  and trying to reason why they are at record highs when the US economy is faltering due to the ongoing coronavirus pandemic.

This is a chart of the S&P 500 index which measures the stock performance of 500 of the largest companies listed on the United States stock exchanges it is a commonly follow equity index.

On Friday the 4th of December 2020 the index rose to an all-time record high currently sitting at 3699.  Remarkable considering the unit United States is still in the grip of the coronavirus pandemic and where hospitals are currently overrun with victims of the disease across the United States, and especially New York and California, where ICU capacity is down to just 15%, and where the governor of California has recently said he expects large areas of the state of California to be locked down within the next few days affecting businesses and individuals’ livelihoods.

 In an almost identical trajectory since march the Dow Jones industrial average index has also reached record highs and is holding ground above the key 30,000 level.  This is simply staggering bearing in mind millions of people are still unemployed and gross domestic product and have a key indicators show that the American economy is not showing a V-shaped recovery, as was expected and hoped for by the federal reserve.

The NASDAQ Composite index and Barrons 400 also simultaneously hit all time highs. A rare occurrence.

Conversely the US dollar index, or DXY, which is a weighted index against major currencies including the euro, British pound, and yen, over the same period since the middle of march 2020 has been falling from its peak of 103.00, to 90.7 at the time of writing.

Traders have been using the dollar index as any inversely correlated technical analysis tool in particular when trading the Dow Jones 30 industrial average.

One of the reasons for this is that as the federal reserve pour billions of dollars into the system many of these are being used by institutions, traders, speculators and investors to buy stocks and shares in the hope that the US economy will quickly recover once the pandemic is under control within the United States and things revert to normal, and where history tells us that many stock indices go on to recover over 10% of their market value following previous pandemics, including Sars, and asian bird flu.

 It was no coincidence that these levels were reached after the November us non farm payroll where the unemployment rate fell to 6.7% from 6.9% and where 245,000 jobs were added, and although just year ago these types of numbers would have been seen as fantastic for the American economy,  the November key jobs report, where analyst expectations were  for over 600,000 jobs to have been added, was seen as disappointing.


And so while the US economy looks to be stalling and payroll numbers are weak and yet there is such optimism by investors which is keeping the US stock market buoyant. So what is going on what is really behind this?  Certainly, the US dollar seems to be reflective of the poor state of affairs with the United States economy.  And as previously alluded to, some of these dollars are finding their way back into the stock market, even though some major American corporations are lagging. The news that the covid vaccine will soon be rolled out across the globe has encouraged investors, but the truth may be that the market is expecting that the woeful economic data will simply force congress to quickly pass a stimulus bill before the Christmas break, and this would effectively prop up the American economy providing a much-needed lifeline for workers and businesses and where some of the anticipated $900 billion being talked about as a potential amount which could be agreed by both the democrats and republicans would likely maintain the buoyancy in the stock markets. The flip side of the stimulus is that on a supply and demand basis the influx of dollars will likely weigh on the dollar index providing counter currencies such as the Euro, Canadian dollar and the Australian and New Zealand dollars a lift.