Categories
Forex Signals

Gold Trade Choppy – Can Upward Channel Underpin? 

During Friday’s Asian trading session, the yellow metal prices failed to extend their overnight winning streak. They edged lower around the $1,880 level mainly due to the upbeat market sentiment, which tends to undermine the yellow-metal prices as investors continuing a retreat from the safe-haven asset after progress in U.S. stimulus measures and Brexit talks. Elsewhere, the reason behind the risk-on market sentiment could also be associated with the expectations for global economic recovery on potential coronavirus vaccines. 

In contrast to this, the widespread rise in the COVID-19 cases from the U.K., U.S., and Europe keeps challenging the market risk-on mood, helping the bullion prices limit their deeper losses. Apart from this, the US-China long-lasting tussle is also questioning the market upside momentum, which also caps further downside for the gold. Besides this, the broad-based U.S. dollar weakness has also played its major role in supporting the gold prices as the price of gold is inversely related to the price of the U.S. dollar. The yellow metal is currently trading at 1,883.14 and consolidating in the range between 1,878.60 – 1,886.06.

The news about vaccine rollouts was supporting the market trading sentiment. In the meantime, the progress on both Brexit trade talks and the latest U.S. stimulus measures also boosted the market trading sentiment, which tends to undermine the safe-haven metal prices. As per the latest report, House Speaker Nancy Pelosi said she hopes to receive the final legislative text on the deal later on Thursday. Whereas, President Donald Trump said by a tweet that stimulus talks were looking good. However, the lawmakers are now confident to approve the stimulus before the year-end. Additionally, the market trading sentiment was supported by the on-going hopes of the coronavirus vaccine. Thus the positive tone surrounding the market trading sentiment was seen as one of the key factors that kept the gold prices under pressure. 

At the USD front, the broad-based U.S. dollar failed to stop its long bearish bias and dropped towards its worst week in a month as demand for the safe-haven assets declined amid progress toward agreeing U.S. fiscal stimulus. It is worth mentioning that the U.S. dollar was down 1.2% for the week so far and has dropped by 12.7% from a 3-year peak in March, falling to 89.862, just above a 2-and-a-half-year low seen on the previous day. Besides, the U.S. dollar losses could also be associated with Powell’s dovish comments on inflation. The U.S. Federal Reserve’s promised to keep interest rates low until an economic recovery is secure. However, the U.S. dollar losses helped the yellow-metal prices limit its deeper losses as the price of gold is inversely related to the U.S. dollar price.

In contrast to this, the growing worries over the resurgence of the coronavirus pandemic have been destroying the hopes of the global economic recovery, which keeps challenging the market trading sentiment and help the yellow-metal prices to limit their deeper losses. On the other hand, the long-lasting tussle between the United States and China remains on the cards as the U.S. continuously imposing sanctions on Beijing. This, in turn, added further questions around the market trading sentiment and became the key factor that kept the lid on any additional losses in the safe-haven metal prices.

Looking ahead, the market traders will keep their eyes on U.K. Retail Sales m/m, which are scheduled for publicity later in the day. Meanwhile, the German PPI m/m data will also be key to watch. Apart from this, the updates surrounding the Brexit, virus, and U.S. stimulus package will not lose their importance. 


Daily Support and Resistance

S1 1807.17

S2 1827.65

S3 1840.79

Pivot Point 1848.13

R1 1861.27

R2 1868.61

R3 1889.09

The yellow metal gold is trading in between a tight range of 1,884 – 1,880 mark. Gold retraced downward to complete 38.2% Fibonacci level of 1,876. On the daily timeframe, gold has formed an upward channel supporting gold around 1,874 level along with a resistance level of 1,894 and 1,910 level. The 50 periods EMA holds around 1,864, suggesting an upward trend in gold; however, we are not opening a buying trade yet as the MACD forms histograms below 0, supporting a selling trend. Let’s consider taking a buying trade over the 1,874 level today. Good luck! 


Categories
Forex Elliott Wave Forex Technical Analysis

EURJPY Consolidates Expecting Further Upsides

Technical Overview

The EURJPY cross consolidates in the extreme bullish sentiment zone, suggesting a bullish continuation of the strong upward movement developed in early December.

The following daily chart exposes the EURJPY cross developing a consolidation pattern, which looks like a flag pattern bounded between 125.77 and 126.70. According to the chartist analysis, the formation suggests the continuation of the previous movement. In this case, the cross could extend its gains surpassing the next resistance corresponding to the 52-week high located at 127.075.

The mid-term overview for the EURJPY cross reveals its primary trend plotted in blue, supporting a rally that remains in progress since the price confirmed its bottom at 114.397 touched on last May 07th. The secondary trend traced in green and minor trend drawn in black supports the price acceleration, which currently consolidates carrying to expect the bullish continuation for the following trading sessions.

Technical Outlook

The big picture for the EURJPY cross under the Elliott wave perspective unfolded in the next 12-hour chart shows the incomplete corrective rally corresponding to wave ((b)) of Minute degree labeled in black. This corrective rally remains in progress since the price found fresh buyers at 121.617 on last October 29th and could reach new yearly highs.

The upper degree structure of the EURJPY cross illustrated in the previous chart exposes the progress in wave B of Minor degree labeled in green, which began when the cross completed its wave A at 127.075 on last September 01st. Currently, the price advances in its wave ((b)) in black. Likewise, its internal structural series shows the development in the wave (c) of Minuette degree labeled in blue, which at the same time, looks starting to develop the wave v of Suminuette degree identified in green.

In this context, the EURJPY cross could extend its gains toward the potential target zone bounded between 126.96 until 128.08, where the cross could find fresh sellers expecting to drag the price to new lows developing the wave ((c)) in black. 

In this regard, if the price confirms its new bearish leg, the cross could complete the third segment of wave B in green. On the other hand, considering both the alternation principle and the wave ((a)) and ((b)) looks extended in terms of time, the wave ((c)) could be a sharp decline.

In conclusion, the EURJPY cross moves mostly upward in a corrective rally that belongs to wave ((b)), corresponding to the second segment of the upper degree wave B. If the price breaks the sideways consolidation structure developed since early December, the cross could strike the potential target zone between 126.96 and 128.08. Likewise, the invalidation level of the bullish scenario locates at 125.130.

Categories
Forex Signals

AUD/USD Ascending Triangle Pattern Support – Buying Setup Looms! 

The AUD/USD closed at 0.76263 after placing a high of 0.76393 and a low of 0.75668. The AUD/USD rose above the 0.76300 level on Thursday to its highest level since June 2018 amid the broad-based weakness of the US dollar and the rising risk sentiment in the market. The risk-sensitive Aussie benefited from the market’s broadly positive risk appetite that raised the Wall streets’ main indexes added in the gains of AUD/USD pair. The S&P 500 and Nasdaq Composite indices hit an all-time high on Thursday and added in the risk sentiment that gave strength to risk perceived Aussie.

The dovish comments from Chairman of Federal Reserve Jerome Powell reassured market participants that the Fed’s ultra-accommodative monetary policy stance was not going anywhere anytime soon. This news also added in the risk sentiment, supported the risk-sensitive Australian dollar, and pushed the AUD/USD pair higher.

Furthermore, the UK and EU prospects reaching a deal before the end of the year as the EU parliament had given the deadline to get an agreement before 20th December also increased and supported the risk perceived Aussie and added in the upward trend of the AUD/USD pair.

On the data front, at 05:30 GMT, the Employment Change in November raised to 90.0K against the expected 40.9K and supported Aussie and added in the gains of AUD/USD pair. In November, the Unemployment Rate also decreased to 6.8% against the forecasted 7.0% and supported the Australian dollar and supported the upward momentum of the AUD/USD pair.

From the US side, at 18:29 GMT, the Philly Fed Manufacturing Index in December fell to 11.1 against the projected 20.1 and weighed on the US dollar and added AUD/USD pair gains. At 18:30 GMT, the Unemployment Claims from last week raised to 885K against the estimated 817K and weighed on the US dollar and supported the AUD/USD pair’s an upward trend. For November, the Building Permits surged to 1.64M against the forecasted 1.55M and supported the US dollar that capped further gains in AUD/USD pair. The Housing Starts in November remained flat as anticipated 1.55M.

The greenback was weak across the board on Thursday as the US Dollar Index (DXY) fell to its lowest since April 2018, below 90 levels to 89.7. The US dollar weakness was due to many factors, including the rising prospects of reaching a deal between Democrats and Republicans over the second round of the US stimulus bill. 

The US dollar was also weak because of the rising number of coronavirus cases in many US states despite the vaccine rollout and lockdown. The reports suggested that the total number of coronavirus cases in the US reached 17M and made the country the hardest-hit country in the world by the pandemic. Furthermore, the Federal Reserve’s latest decision to extend its bond purchases program also added pressure on the greenback that ultimately affected the movement of the AUD/USD pair. All these factors combined and weighed on the US dollar on Thursday that added strength in the currency pair AUD/USD pair.


Daily Technical Levels

Support Resistance

0.7550 0.7592

0.7542 0.7606

0.7509 0.7633

Pivot point: 0.7565

On the technical front, the AUD/USD is trading slightly bullish at 0.7590, facing immediate resistance at the 0.7640 level. Bullish crossover of this level can extend upward trend until the next target level of 0.7680. However, failure to break above the 0.7680 level can extend selling moves until the support area of the 0.7580 AND 0.7545 level. The 50 periods EMA is suggesting a buying trend, but the MACD is suggesting a buying scenario. Thus, we should look for buying trades over the 0.7580 level. Good luck! 

Categories
Forex Market Analysis

Daily F.X. Analysis, December 18 – Top Trade Setups In Forex – German IFO Business Climate in Focus! 

On Friday, the fundamental side-eyes will remain on the German Ifo Business Climate figures, which are expected to drop from 90.7 to 90.2 along with the current account data, which is likely to drop from 25.2 B to 22.6B. Both of these figures extend bearish pressure on the Euro. Later, the Canadian retail sales will be in focus as it may drive some price action in the Canadian pairs.


Economic Events to Watch Today  


EUR/USD – Daily Analysis

The EUR/USD pair was closed at 1.22679 after placing a high of 1.22725 and a low of 1.21897. EUR/USD pair extended its gains on Thursday and peaked in April 2018, amid the broad-based U.S. dollar weakness and the rebound of the Eurozone economy. The U.S. dollar weakness was derived from various factors, including rising hopes that the coronavirus relief bill will release soon, the dovish comments from Powell post-meeting, and the soft U.S. labor market data on Thursday. 

The Democrats and Republicans were close to reaching a deal over a new $900 billion proposal, including $600-$700 in paychecks and unemployment benefits. The U.S. House Speaker Nancy Pelosi has even said that it might be possible that U.S. lawmakers will have the agreement in writing by the end of Thursday. These rising hopes for the U.S. stimulus bill added pressure on the U.S. dollar that ultimately supported the EUR/USD pair’s upward movement.

Powell emphasized that the Fed was following outcomes-based policies, which means if progress slows toward achieving those outcomes, then-Fed could step up its asset purchases. Powell’s dovish comments weighed on the U.S. dollar and supported rising EUR/USD prices on Thursday. Furthermore, on Thursday, the soft labor market data weighed on the U.S. dollar as the Unemployment Claims from last week surged to 885K. The weak U.S. dollar because of rising unemployment claims also supported the upward momentum in EUR/USD pair on Thursday.

On the data front, at 15:00 GMT, the Final CPI for the year in November remained flat at -0.3%. The Final Core CPI from Eurozone in November also remained as expected at 0.2%. From the U.S. side, at 18:29 GMT, the Philly Fed Manufacturing Index in December declined to 11.1 against the projected 20.1 and weighed on the U.S. dollar and supported EUR/USD prices. At 18:30 GMT, the Unemployment Claims from last week surged to 885K against the projected 817K and weighed on the U.S. dollar. For November, the Building Permits surged to 1.64M against the projected 1.55M and supported the U.S. dollar. The Housing Starts in November remained flat as projected 1.55M.

The Eurozone economy was rebounded as suggested by the December Eurozone’s Composite PMI that rose above 49 levels compared to expected 45.3 and supported the single currency. However, the Eurozone market confidence was tempered by the news that Germany, the largest Eurozone economy, would re-enter lockdown in January to curb coronavirus spread.

Meanwhile, the global economic outlook continued to improve following the news that Europe will be rolling out coronavirus vaccines. The E.U. Commission chief Ursula von der Leyen said that the coronavirus vaccination would start from December 27 in Austria, Germany, and Italy. The Health Minister Jens Spahn said that if the approval comes as planned, Germany will start vaccination on December 27. The potential vaccine rollout in Europe raised the Eurozone economy’s outlook and supported the single currency Euro and added the EUR/USD pair’s gains.

Daily Technical Levels

Support   Resistance

1.2143      1.2231

1.2090      1.2266

1.2055      1.2320

Pivot point: 1.2178

EUR/USD– Trading Tip

The EUR/USD bullish bias continues to drive an upward movement at 1.2245, and continuing an upward trend is likely to be continued. On the 4 hour timeframe, the EURUSD has entered the overbought zone, and it has completed 23.6% Fibonacci retracement at the 1.2240 level. A bearish breakout of 1.2240 can send the EUR/USD pair towards a 38.2% Fibo level of 1.2214. The odds of buying seems strong over the 1.2214 level today.


GBP/USD – Daily Analysis

 The GBP/USD pair was closed at 1.35833 after placing a high of 1.36244 and a low of 1.34950. GBP/USD pair extended its gains for the third consecutive day on Thursday and peaked since May 2018 due to broad-based U.S. dollar weakness. The British Pound pared some gains on Thursday after the U.K. Prime Minister Boris Johnson said that it was likely that a deal would not be reached until the European Union eased its stance over key sticking issues, including fishing rights.

Johnson poured cold water on the deal’s hopes, saying that it looked very likely that the agreement will not be finalized until the European Union shifts its position substantially. This update came in the right after the positive comments from European Commission President Ursula von der Leyen, who said that the progress in trade negotiations was seen.


Despite the hints of possible progress on a post-Brexit trade deal, PM Johnson has not shied away from his views that the possible outcome for the U.K. to leave the E.U. was without a deal. In this scenario, the U.K. and E.U. will follow the terms and conditions under the World Trade Organization that would not be good for both nations. The European Parliament has given Brexit negotiators until December 20 to strike a deal to allow enough time to ratify a potential agreement before the end of the U.K.’s transition period to leave the E.U.

Furthermore, on Thursday, the Bank of England kept interest rates at the lowest level on record after warning that rapid growth in coronavirus infections will deliver a bigger hit to the U.K. economy than expected in the final months of 2020. The official interest rate was kept unchanged at 0.1% by BoE, while the bank also left the Q.E. bond-buying program unchanged at 895 billion pounds after pumping an additional 150 billion pounds into the economy last month.

The bank acknowledged that against a backdrop of soaring coronavirus infections amid the second wave of the pandemic has forced the government to launch tier-3 restrictions in England and tighter control over Scotland, Wales, and Northern Ireland that has put the economy under pressure. The bank projected that the GDP of the U.K. in the final three months of 2020 would contract by a little over 1%, which means that national output for 2020 will be 11% below 2019, and it will be the biggest recession in 300 years. These dovish comments from the Bank of England removed some of the GBP/USD pair’s daily gain on Thursday.

On the data front, at 17:00 GMT, the Asset Purchase Facility from Great Britain in December remained flat at 895B. 

From the U.S. side, at 18:29 GMT, the Philly Fed Manufacturing Index in December fell to 11.1 against the anticipated 20.1 and weighed on the U.S. dollar and supported the GBP/USD pair. At 18:30 GMT, the Unemployment Claims from last week rose to 885K against the anticipated 817K and weighed on the U.S. dollar, and added further gains in GBP/USD pair. For November, the Building Permits rose to 1.64M against the anticipated 1.55M and supported the U.S. dollar. The Housing Starts in November remained flat as anticipated 1.55M.  The U.S. dollar was weak across the board as the hopes for the second round of stimulus bills raised as the Democrats and Republicans were coming closer to reach a $900 billion proposal that would include $600 to $700 paychecks and unemployment benefits. The rising hopes that U.S. stimulus will reach an agreement soon weighed on the U.S. dollar and added in the gains of GBP/USD.

The U.S. dollar was also weak because of the rising number of coronavirus cases in the U.S. despite the vaccine rollout. According to Johns Hopkins University, the U.S. confirmed 247,403 new coronavirus cases on Wednesday, and the number of Americans’ deaths was recorded as 3656 in a single day. Meanwhile, the risk perceived the latest improvement in risk sentiment also supported British Pound after the hopes of another vaccine approval rose. A vaccine by Moderna that will offer about 94% protection against the coronavirus was set to get emergency authorization as early as this week by US FDA. On Thursday, a panel of 22 members of experts met to discuss the efficacy and potential side effects of Moderna’s vaccine. However, the American public will start receiving vaccine shots possibly after months, and in the meantime, the hospitals across the country will be caring for the coronavirus patients. These rising optimism raised the hopes that global economic recovery will reach soon and supported the risk sentiment that added strength in Sterling and helped GBP/USD pair to continue its upward movement.

Daily Technical Levels

Support   Resistance

1.3442      1.3562

1.3378      1.3618 

1.3322      1.3683

Pivot point: 1.3498

GBP/USD– Trading Tip

The GBP/USD is trading at 1.3550 level, facing an immediate support level of 1.3518 level. This support level is extended by an upward trendline, which can be seen in the 4-hour timeframe. On the higher side, the pair can extend the buying trend until the 1.3588 level, and the continuation of the buying trend can also lead Sterling towards the 1.3625 level. Support holds around the 1.3518 level, and a breakout can lead the pair towards the 1.3495 area. Bullish bias dominates today.


USD/JPY – Daily Analysis

The USD/JPY pair was closed at 103.074 after placing a high of 103.560 and a low of 102.872. The currency pair USD/JPY fell for the third consecutive day on Thursday amid the U.S. dollar’s broad-based weakness. The U.S. dollar fell significantly against the Japanese Yen, and the USD/JPY pair reached 102 level on Thursday as the U.S. dollar index fell below 90 levels for the first time since April 2018. The U.S. Dollar Index that measures the value of the U.S. dollar against the basket of six currencies fell to 89.7 level on Thursday and dragged the USD/JPY pair further on the downside towards its lowest since March.

On Thursday, the Wall Street main indexes rose modestly, with Dow Jones up by 0.39% and the NASDAQ by 0.42%. Meanwhile, the Japanese Yen performed well against its rivals across the board despite the risk appetite and kept the USD/JPY pair under pressure. The hopes for the second round of U.S. stimulus bill from Congress rose and weighed on the U.S. dollar as the Democrats and Republicans reached a consensus over the proposal of $900 billion stimulus aid that will include $600-$700 in the paychecks and unemployment benefits. Furthermore, the rising number of coronavirus cases in the U.S. were also weighing on the local currency as the cases in total reached about 17M in the U.S. Despite the vaccine rollout in the U.S., the rising number of coronavirus causes added pressure on the U.S. dollar and added further downside on the USD/JPY pair.

The USD/JPY pair’s downward momentum was the disappointing U.S. jobless claims on Thursday. On the data front, at 18:29 GMT, the Philly Fed Manufacturing Index in December decreased to 11.1 against the estimated 20.1 and weighed on the U.S. dollar that added pressure over the USD/JPY pair. At 18:30 GMT, the Unemployment Claims from last week increased to 885K against the estimated 817K and weighed on the U.S. dollar and dragged the pair USD/JPY further on the downside. Building Permits for November increased to 1.64M against the estimated 1.55M and supported the U.S. dollar. The Housing Starts in November remained flat as estimated at 1.55M.

Since September, the rising number of unemployment claims to the highest level suggested the effect of increasingly restrictive measures in many states due to increased coronavirus cases and people’s loss of confidence. Meanwhile, in Japan, the main upcoming event was the central bank meeting on Friday. The most likely scenario was a no change in the monetary policy setting and keeping the rates at -10bps and the 10-year JGB yield target at 0.00%. The emergency lending facilities are expected to extend beyond the current run-off date of March 31, 2021. There were no macroeconomic figures to be released from Japan on Thursday, so the pair USD/JPY kept following the U.S. dollar movements that were weak across the board on the day.


Daily Technical Levels

Support   Resistance

103.47      104.02

103.25      104.37

102.91      104.58

Pivot point: 103.81

USD/JPY – Trading Tips

The USD/JPY has reversed the selling bias to trade at the 103.550 level. The safe-haven currency pair is trading beneath an immediate support mark of 103.750, and the formation of candles beneath this level will reinforce the bearish breakout. If this happens, we may have an opportunity to short the USD/JPY pair today. Bearish bias looks firm as the MACD is creating histograms underneath 0, and the 50 periods EMA is operating around 103.800 level, suggesting strong probabilities of selling. On the lower side, the USD/JPY pair may find subsequent support at the 102.900 level. It can be a good idea to take a selling position below 103.750 today. Good luck!

Categories
Crypto Market Analysis

Daily Crypto Review, Dec 18 – Bitcoin at $23,000; Crypto Sector Preparing for the Next Move

The majority of the cryptocurrencies ended up in the green as the cryptocurrency sector tried to consolidate after Bitcoin’s price discovery in the all-time high territory. Bitcoin is currently trading for $22.912, representing an increase of 3.96% compared to yesterday’s value. Meanwhile, Ethereum’s price has increased by 0.16% on the day, while XRP managed to gain 3.79%.

 Daily Crypto Sector Heat Map

MobileGo gained 94.96% in the past 24 hours, making it the most prominent daily crypto gainer by far. It is followed by Puriever’s 85.99% and Tokes’ 85.09% gain. On the other hand, Basis Share lost 49.6%, making it the most prominent daily loser. It is followed by 3x Short Litecoin Token’s loss of 46.73% and Force For Fast’s loss of 42.92%.

Top 10 24-hour Performers (Click to enlarge)

Bottom 10 24-hour Performers (Click to enlarge)

Bitcoin’s market dominance has moved up half a percent since our last report, with its value currently being 65.5%. This value represents a 0.5% difference to the upside than the value it had when we last reported.

Daily Crypto Market Cap Chart

The cryptocurrency sector capitalization has increased since we last reported, with its current value being $651.01 billion. This represents a $17.07 billion increase when compared to our previous report.

_______________________________________________________________________

What happened in the past 24 hours?

_______________________________________________________________________

_______________________________________________________________________

Technical analysis

_______________________________________________________________________

Bitcoin

Bitcoin has stopped its price discovery phase as it bounced off the $24,000 level and began consolidating. The largest cryptocurrency by market cap is currently fighting for the $23,000 level, a minor pivot point within a larger range bound by $24,000 to the upside and $22,050 to the downside.

At the moment, the Fib extension sitting at $22,055 is the most likely strong support level, while Bitcoin’s upside is open to new highs if the cryptocurrency passes $24,000, $23,315, and $24,500.

BTC/USD 2-hour chart

Bitcoin’s 4-hour and weekly overview are fully bullish, while its daily and monthly time-frames show slight neutrality on top of the overall bullishness.

BTC/USD 1-day Technicals

Technical factors (4-hour Chart):
  • Price is far above both its 50-period and its 21-period EMA
  • Price slightly below its top Bollinger band
  • RSI is heavily overbought (80.71)
  • Volume is far higher than its average levels
Key levels to the upside          Key levels to the downside

1: $24,315                                 1: $22,054

2: $24,700                                 2: $21,350

3: $25,511                                  3: $19,918

Ethereum

Ethereum has, just like Bitcoin, hit a wall in its price ascension, triggering a pullback from the highs of $675. The second-largest cryptocurrency by market cap quickly fell to its immediate support level, which sits at $632. This level held up nicely, and Ethereum is now on a slow rise after confirming the support level.

An important thing to note is that Ethereum is very far from reaching its all-time high. It might be a good value investment simply because of its potential to increase its price faster than Bitcoin.

ETH/USD 2-hour Chart

Ethereum’s 4-hour and monthly overview are fully bullish, while its daily and weekly time-frames show slight neutrality on top of the overall bullishness.

ETH/USD 1-day Technicals

Technical Factors (4-hour Chart):
  • Price is far above both its 50-period and its 21-period EMAs
  • Price is between its middle and top Bollinger band
  • RSI has barely left the overbought territory (67.29)
  • Volume is much higher than its weekly average but is descending
Key levels to the upside          Key levels to the downside

1: $675                                     1: $632

2: $738.5                                  2: $600 

3: $817.5                                   3: $581

Ripple

XRP was the cryptocurrency that experienced the largest gains out of the three cryptocurrencies we cover daily. The fourth-largest cryptocurrency by market cap couldn’t break a high of $0.597 with conviction (though the price briefly went as high as $0.656), which triggered a correction to its $0.57 support level. After confirming this level as strong support, XRP continued its path towards the upside and slowly started increasing in price. It is currently contesting the $0.597 level once again.


XRP/USD 2-hour Chart

XRP’s 4-hour and monthly overview are fully bullish, while its daily and weekly time-frames show slight neutrality on top of the overall bullishness.

XRP/USD 1-day Technicals

Technical factors (4-hour Chart):
  • Its price is currently above both its 50-period EMA and its 21-period EMA
  • Price slightly below its top Bollinger band
  • RSI is nearing the overbought territory (63.71)
  • Volume is well above its average level, thought descending
Key levels to the upside          Key levels to the downside

1: $0.597                                    1: $0.57

2: $0.63                                    2: $0.543

3: $0.66                                     3: $0.5

Categories
Forex Basic Strategies

The Most Reliable 5-Minute Forex Scalping Strategy

Introduction

Scalping is a type of trading that involves placing many trades in a single day to profit from minor price changes in the Forex market. Traders who use this strategy are known as scalpers. It is crucial to have a robust exit strategy for scalpers to earn large gains from small market moves.

Scalping strategies are mostly applied to the intraday markets, and the trade holding duration can vary from a few seconds to minutes. For novice Forex traders, this type of trading is not recommended as scalping involves a fast-paced activity that requires precision in timing and execution.

We must always use a smaller timeframe such as a 5-min or 1-min for scalping the Forex market. We can use various reliable indicators for scalping, but in this article, we’ll learn how to scalp the 5-minute timeframe using Bollinger Bands.

Why Bollinger Bands?

Bollinger Bands is a technical analysis tool that was developed by John Bollinger. This indicator is composed of three lines as follows – A Simple Moving Average, which is the Middle band, the Upper Band & the Lower Band. The usage of Bollinger Bands indicator goes like this – the closer the price action moves to the upper band, the more overbought the market. Likewise, the closer the price moves to the lower band, the more oversold the market. The bands in this indicator widen and contract based on the market volatility. They expand when the market activity is increased and contract in choppy or less volatile markets. Let’s use this indicator in the 5-min timeframe to identify potential trading opportunities.

Scalp Trading With Bollinger Bands

We must go long when the price hits the lower band and look out for short-selling opportunities when prices hit the upper band. This is the traditional way of trading the market using Bollinger bands which is still being used by scalp traders across the world. The reason why this strategy is famous is because of its ease of usage and its ability to milk quick buck from the market.

Scalping Ranges – Example 1

In the below price chart, you can see that we have taken five buying and four selling trades in the EUR/NZD Forex pair. In this example, we have applied this strategy in a ranging market. When the price approached the support line, and when it also hit the upper Bollinger band, it is an indication for us to go long. Similarly, when the price goes near the resistance line in a range, it is an indication for us to close our long positions and look for selling opportunities.

By doing this, we have been continuously engaged in the market and made some consistent profits overall.

Example 2

Below is another example of scalp trading the Forex market when it is in the consolidation phase. Typically in a range, both the parties have equal strength. Also, it is a known fact that it is comparatively hard to trade the consolidation markets than the ranging markets. However, using this strategy, we have managed to take five buying and three selling trades in the GBPJPY Forex pair.

Scalpers typically go long or short when the price approaches the upper or lower range lines. This is the right approach, but by pairing that strategy with an indicator like Bollinger band can drastically increase the probability of those trades. The USP of the Bollinger band indicator is that it works well in all the types of market situations. It really doesn’t matter whether you scalp the ranges, channels, or even trends; this strategy will always provide reliable trading opportunities.

Example 3

In the below price chart, the price was dragging towards the upside, indicating a buying momentum, but it ended up forming a channel. In a channel, both parties hold equal power and us being scalpers; it is easy to make money from both sides. Below we can notice that if we go either long or short, we can make an equal amount of money if we are right. This is the major benefit of using Bollinger bands in channel conditions.

Scalping Trends – Example 1

Below is the price chart of the AUD/JPY currency pair in an uptrend. As you can see, during the pullback phase, the market gave us the first buy trade. When the price action approached the upper Bollinger band, the price immediately moved in the opposite direction. As a scalper, prepare your mind for these kinds of quick moves. Follow the rules of the strategy to the point, and if any trade goes three to four pips against you, immediately exit and wait for the next opportunity.

Our third buy trade also performed, but it didn’t go for bigger targets. Instead, the price action immediately reversed, which end up generating a sell signal. The next buy trade was also ended u with minor profits. For scalpers, even a profit of 8 to 10 pips can be considered good in a single trade.

Example 2

Below is an example of buying and selling trades in an uptrend in the AUD/JPY pair. We are saying this pair is an uptrend after analyzing its higher time frame. In the lower timeframe, the market may seem to be ranging, but since we know that this pair is up-trending overall, we must consider buying opportunities over sell signals.

The markets gave us five buying and three selling trades in this pair. Even though we have identifies many sell signals, we recommend not to enter those unless you have confirmation. Always remember that trend is your friend and trade according to the trend. This is the essence of scalp trading the trending markets. Therefore, when scalping trends, always go for bigger targets by following the trend. Also, expect less accuracy on counter-trend trades.

Conclusion

It requires a lot of practice to master scalping. Since the time frame is small, you must be quick in everything you do while scalping. Also, talking additional confirmations is not possible in this form of trading because of its swift nature. Please practice these strategies on a demo account before you apply them on the live markets. All the best. Cheers!

Categories
Forex Fundamental Analysis

USD/CHF Global Macro Analysis – Part 3

USD/CHF Exogenous Analysis

The exogenous analysis covers fundamental indicators that can compare the performance of the US and Swiss economies. Note that this comparison between the two economies is what drives the exchange rate of USD/CHF. They are:

  • US and Swiss interest rate differential
  • The difference in the GDP growth in the US and Switzerland
  • Balance of trade differential

Balance of trade differential

For each country, the balance of trade shows the demand for the domestic currency in the international market. When a country has a surplus of the balance of trade, it means that its currency is in high demand in international trade. The rationale behind this is that when a country exports more than it imports, other countries will need more of that country’s currency to participate in international trade.

The balance of trade differential measures the difference between the balance of trade in Switzerland and the US. If the Swiss balance of trade is higher than that of the US, the USD/CHF pair will be bearish.

In October 2020, Switzerland had a trade surplus of CHF 2.9 billion while the US a deficit of $63.1 billion. Throughout 2020, the US trade deficit has been widening from $37 billion in January, while the Swiss trade surplus has increased from CHF 2.8 billion.

Based on the correlation with the USD/CHF pair, we assign the balance of trade differential a score of -5.

US and Switzerland interest rate differential

Typically, the country with a higher interest rate attracts more foreign capital seeking superior returns. A higher interest rate increases the domestic currency demand, which makes it appreciate in the forex market. More so, forex traders tend to be bullish on the currency with the higher interest rate.

The interest rate by The Swiss National Bank is -0.75% since January 2015. In the US, the federal funds rate is 0.25%. That makes the interest rate differential 1% for the USD/CHF pair.

Based on the correlation analysis with the USD/CHF pair, we assign the interest rate differential a score of 3.

The difference in the GDP growth in the US and Switzerland

A country’s GDP is primarily driven by domestic consumption. Although the GDP size differs in absolute terms, we can compare the US and Swiss GDP in terms of growth rate. An expanding economy is accompanied by appreciating currency. Therefore, if the US growth rate is higher than Switzerland’s, we can expect a bullish trend for the USD/CHF pair.

In Q3 of 2020, the Swiss economy expanded by 7.2% and the US by 33.1%. It means that the US economy is recovering faster than that of Switzerland. We, therefore, assign a score of 2. This implies that the GDP growth rate differential between the US and Switzerland has led to a bullish USD/CHF.

Conclusion

The USD/CHF pair has an exogenous score of -2. This implies that we can expect the pair to continue with its current bearish trend in the near future.

Note that the USD/CHF pair has breached the lower Bollinger band. Therefore, we can expect the downtrend to continue for a while, which supports our fundamental analysis. All the best.

Categories
Forex Market Analysis

Daily F.X. Analysis, December 17 – Top Trade Setups In Forex – BOE Policy In Limelight! 

On the news front, the eyes will remain on the U.K. Monetary Policy reports due during the late European hours. BOE isn’t expected to change the rates, and it may keep them at 0.10%. However, it will be essential to see MPC Official Bank Rate Votes. Besides, the European Final CPI data will remain in focus today. During the U.S. session, the Unemployment Claims and Philly Fed Manufacturing Index will be the main highlight to drive further market movement.


Economic Events to Watch Today  


EUR/USD – Daily Analysis

The EUR/USD pair was closed at 1.21988 after placing a high of 1.22121 and a low of 1.21450. EUR/USD pair extended its gains and rose for 3rd consecutive day on Wednesday to reach its highest since April 2018.

EUR/USD pair broke above 1.22 level mainly because of the strong PMIs on Wednesday and the U.S. dollar weakness. On the data front, at 13:15 GMT, the French Flash Services PMI for December raised to 49.2 against the expected 39.9 and supported Euro. The French Flash Manufacturing PMI in December also raised to 51.1 against the estimated 50.0 and supported Euro. 

At 13:30 GMT, the German Flash Manufacturing PMI in December surged to 58.6 against the forecasted 56.4 and supported Euro. The German Flash Services PMI also advanced to 47.7 against the expected 44.1 and supported Euro. At 14:00 GMT, the Flash manufacturing PMI from Eurozone raised to 55.5 against the forecasted 53.0 and supported Euro. The Flash Services PMI in December from the whole bloc also raised to 47.3 from the expected 41.9 and supported Euro. At 15:00 GMT, the Trade Balance from Eurozone for October came in greater than expected 22.1B as 25,9B and supported Euro.

The manufacturing and services sector in Eurozone advanced and showed growth in December that supported the single currency Euro and added in the daily gains of the EUR/USD pair. From the U.S. side, at 18:30 GMT, the Core Retail Sales for November declined to -0.9% against the projected 0.1% and weighed on the U.S. dollar and supported EUR/USD gains. For November, the Retail Sales also declined to -1.1% against the projected -0.3% and weighed on the U.S. dollar and added in the EUR/USD pair. AT 19:45 GMT, the Flash manufacturing PMI for December rose to56.5 against the projected 55.9 and supported the U.S. dollar, and capped further gains in EUR/USD pair. 

The Flash Services PMI for December declined to 55.3 against the projected 55.7 and weighed on the U.S. dollar and supported momentum upward in EUR/USD pair. At 20:00 GMT, the Business Inventories for October rose to 0.7% against the projected 0.6%and weighed on the U.S. dollar. The NAHB Housing Market Index also declined to 86 against the projected 88 and weighed on the U.S. dollar, and added additional EUR/USD pair gains.

Apart from strong PMI figures, the latest news that Moderna’s vaccine was also up to getting emergency use authorization from the US FDA by the end of this week. This vaccine will be the second vaccine after Pfizer’s drug was approved last week and is currently being used on people. This news added in the risk sentiment and supported the risk perceived EUR/USD pair.

Furthermore, the Brexit hopes also raised on Wednesday and supported the single currency Euro after E.U.’s chief negotiator explained that she could not say if there will be a trade deal with Britain, but there had been progressing. The next few days would be critical. These developments also added to the upward trend of the EUR/USD pair on Wednesday.

Moreover, the Federal Reserve concluded its two-day meeting on Wednesday and decided to keep its interest rates at the same level until the inflation reaches its target. However, it decided to extend its Q.E. program that weighed on the U.S. dollar and supported the EUR/USD pair’s upward trend.


Daily Technical Levels

Support   Resistance

1.2126      1.2175

1.2077      1.2197

1.2099      1.2224

Pivot point: 1.2148

EUR/USD– Trading Tip

The EUR/USD bullish bias continues to dominate the market as it’s trading at 1.2225. On the higher side, the EUR/USD may target the 1.2250 level and 1.2282 resistance areas. The direct currency pair may find support at 1.2175, which is extended by a double top resistance, which now is working as a support. The MACD and RSI are supporting bullish bias along with the 50 periods EMA. We can expect a continuation of a bullish trend in the EUR/USD today.


GBP/USD – Daily Analysis

 The GBP/USD pair was closed at 1.35083 after placing a high of 1.35543 and a low of 1.34340. GBP/USD pair extended its gains on Wednesday and rose to its highest level since May 2018. The British Pound pared gains on Wednesday against the U.S. dollar as reports suggested that U.K. and E.U. were close to a breakthrough on a key sticking point amid the ongoing talks. The President of European Commission Ursula von der Leyen said that there was a narrow path to an agreement on a post-Brexit trade deal with the U.K.

The U.K. acknowledged that some progress had been made but continued to suggest a no-deal was most likely outcome as significant differences remain. Reports suggested that progress has been made over the level playing rules, but differences remain over the fisheries issue, as fishing quotas remain a challenge in negotiations.

However, the U.K. has softened its tone on fisheries in a bid to get a deal over the line. Britain ditched the demands for fishing vessels operating under the U.K. flag to be majority British-owned in the post Brexit era. Whereas PM Boris Johnson remained harsh in his speech on Wednesday and said that the E.U. should realize that the U.K. has a right to take control over its land and waters like every other country.

The hopes for the Brexit trade deal increased as the recent progress on talks came as both sides were coming under increasing pressure to secure a deal before the transition period on December 31. These hopes kept the British Pound supported and GBP/USD pair higher.

On the data front, at 12:00 GMT, the Consumer Price Index from the U.K. for November fell short of expectations of 0.6% and came in as 0.3% that weighed on the British Pound. In November, the Core CPI also fell to 1.1% against the expectations of 1.4% and weighed on Sterling. The RPI of the year from the U.K. for November also declined to 0.9% against the forecasted 1.3% and weighed heavily on GBP. At 12:02 GMT, the PPI Input from the U.K. declined to 0.2% from the expected 0.4% in November and weighed on the British Pound. The PPI Output, however, remained flat with the expectations of 0.2%. At 14:30 GMT, the Flash manufacturing PMI in December from Great Britain raised to 57.3 against the projected 55.9 and supported British Pound and added GBP/USD pair gains. The Flash Services PMI, however, declined to 49.9 against the forecasted 50.5 in December and weighed on Sterling. The Housing Price Index for October advanced to 5.4% against the estimated 5.1% and supported British Pound. 

Most of the data came in against the British Pound; however, the currency pair GBP/USD remains on the upside over the latest Brexit optimism.

From the U.S. side, at 18:30 GMT, the Core Retail Sales for November fell to -0.9% against the anticipated 0.1% and weighed on the U.S. dollar and supported GBP/USD pair. The Retail Sales for November also fell to -1.1% against the anticipated -0.3% and weighed on the U.S. dollar and added gains in GBP/USD pair. 

At 19:45 GMT, the Flash manufacturing PMI for December surged to56.5 against the anticipated 55.9 and supported the U.S. dollar. The Flash Services PMI for December fell to 55.3 against the anticipated 55.7 and weighed on the U.S. dollar. At 20:00 GMT, the Business Inventories for October surged to 0.7% against the anticipated 0.6%and weighed on the U.S. dollar. The NAHB Housing Market Index also fell to 86 against the anticipated 88 and weighed on the U.S. dollar and added further gains in GBP/USD pair.

Daily Technical Levels

Support   Resistance

1.3338      1.3258

1.3213      1.3595

1.3147      1.3719

Pivot point: 1.3404

GBP/USD– Trading Tip

Since the Cable is also a direct currency pair and the dollar is getting weaker, we can expect a continuation of an upward trend in the GBP/USD pair. The GBP/USD pair may find resistance at 1.3600 and 1.3706 level, while the support level stays at 1.3470 marks. The MACD and EMA are supporting the bullish trend in the Cable. On the 4 hour timeframe, the GBP/USD pair has formed an upward channel, which may keep pushing the Sterling further higher today. The buying trend can be seen over 1.3470 level until 1.3600 and 1.3706 level.


USD/JPY – Daily Analysis

The USD/JPY pair was closed at 103.419 after placing a high of 103.915 and a low of 103.259. The USD/JPY pair extended its losses on Wednesday and reached its lowest since November 9. The USD/JPY pair dropped on Wednesday amid the U.S. dollar weakness due to rising stimulus hopes and growing vaccine optimism. The U.S. lawmakers made progress toward a coronavirus relief package that added weight on the U.S. dollar and dragged the USD/JPY pair on the downside. The U.S. Dollar Index that tracks the greenback against a basket of six other currencies was down on Wednesday to 0.1% at 90.317. 

The bipartisan group had originally proposed a $908 billion stimulus bill, but it has now been split into two bills. The first bill includes a $748 billion proposal, including aid for vaccine distribution and unemployment benefits. This bill has gained traction and is expected to pass by Congress by the end of the week. The second bill that is worth $160 billion for local and state government support along with the temporary coronavirus liability protection that appears to be having more difficulty in gathering the necessary support from Congress.

On the data front, at 04:50 GMT, the Trade Balance from Japan for November surged to 0.57T against the forecasted 0.54T and supported the Japanese Yen that added further losses in the USD/JPY pair. At 05:30 GMT, the Flash Manufacturing PMI from Japan in December also raised to 49.7 against the forecasted 48.9 and supported the Japanese Yen that added additional losses in USD/JPY pair.

Meanwhile, the Federal Reserve kept its interest rates unchanged on Wednesday and said that they would remain the same until the inflation reaches 2-3%. However, Federal Reserve also announces to purchase at least $120 Billion of U.S. treasuries and mortgage-backed securities each month until employment gets better. This way to support the U.S. economy by increasing bond purchases also weighed on the U.S. dollar and dragged the USD/JPY pair on the downside.

From the U.S. side, at 02:00 GMT, the TIC Long-Term Purchases dropped to 51.9B against the forecasted 75.5 B and weighed on the U.S. dollar, and supported the downside movement in the USD/JPY pair. At 18:30 GMT, the Core Retail Sales for November decreased to -0.9% against the estimated 0.1% and weighed on the U.S. dollar and weighed on the USD/JPY pair. The Retail Sales for November also decreased to -1.1% against the estimated -0.3% and weighed on the U.S. dollar. AT 19:45 GMT, the Flash manufacturing PMI for December advanced to56.5 against the estimated 55.9 and supported the U.S. dollar. 

The Flash Services PMI for December decreased to 55.3 against the estimated 55.7 and weighed on the U.S. dollar and dragged the USD/JPY pair on the downside. At 20:00 GMT, the Business Inventories for October advanced to 0.7% against the estimated 0.6%and weighed on the U.S. dollar. The NAHB Housing Market Index also decreased to 86 against the estimated 88 and weighed on the U.S. dollar and added further losses in the USD/JPY pair.

Another factor included in the losses of the USD/JPY pair was the increasing risk sentiment of the market from another coronavirus vaccine. Moderna has also applied for emergency use authorization of its vaccine from the U.S. regulatory FDA that is expected to approve within a week. Moderna will become the second company to get authorization from the U.S. regulator after Pfizer got approval last week and is currently being roll-out. This latest news added in the risk sentiment and weighed on the safe-haven Japanese Yen that ultimately weighed on the USD/JPY pair.

Daily Technical Levels

Support   Resistance

103.47      104.02

103.25      104.37

102.91      104.58

Pivot point: 103.81

USD/JPY – Trading Tips

The USD/JPY extends it’s selling trend as the pair trades at 103.250. The safe-haven currency pair is trading below an immediate support level of 103.250, and the closing of candles below this level will confirm the bearish breakout. If this happens, we may have an opportunity to short the USD/JPY pair today. Bearish bias seems solid as the MACD is forming histograms below 0, and the 50 periods EMA is holding around 103.860 level, suggesting strong odds of selling. On the lower side, the USD/JPY pair may find next support at the 102.900 level. Let’s consider taking a selling trade below 103.650 today. Good luck! 

Categories
Crypto Market Analysis

Daily Crypto Review, Dec 17 – BTC Reaches a New ATH at $22k; XRP Skyrockets as it Breaks its Descending Channel

The cryptocurrency sector experienced an overall major gain as Bitcoin reached its new all-time high. Bitcoin is currently trading for $22.095, representing an increase of 13.82% compared to yesterday’s value. Meanwhile, Ethereum’s price has increased by 9.69% on the day, while XRP managed to gain a whopping 23.35%.

 Daily Crypto Sector Heat Map

Puriever gained 238.59% in the past 24 hours, making it the most prominent daily crypto gainer by far. It is followed by Combine.finance’s 159.58% and Amun Bitcoin 3x Daily Shorts’ 146.94% gain. On the other hand, BigGame lost 82.62%, making it the most prominent daily loser. It is followed by GNY’s loss of 75,95% and Hush’s loss of 61.30%.

Top 10 24-hour Performers (Click to enlarge)

Bottom 10 24-hour Performers (Click to enlarge)

Bitcoin’s market dominance has moved up over a whole percent since our last report, with its value currently being 65%. This value represents a 1.1% difference to the upside than the value it had when we last reported.

Daily Crypto Market Cap Chart

The cryptocurrency sector capitalization has increased drastically since we last reported, with its current value being $634.94 billion. This represents a whopping $70.94 billion increase when compared to our previous report.

_______________________________________________________________________

What happened in the past 24 hours?

_______________________________________________________________________

_______________________________________________________________________

Technical analysis

_______________________________________________________________________

Bitcoin

Bitcoin has had quite an amazing day, as its price skyrocketed to new all-time highs. The largest cryptocurrency by market cap reached price discovery mode as its price topped at $22,400. While there are no set resistance levels at the moment, we can use Fib retracement extensions to determine where they could form.

At the moment, the Fib extensions sitting at $21,350 and $22,055 are the best contenders to act as support levels to Bitcoin’s eventual downturn.


BTC/USD 4-hour chart

Bitcoin’s daily and weekly overview are fully bullish, while its 4-hour and monthly time-frames show slight neutrality on top of the overall bullishness.

BTC/USD 1-day Technicals

Technical factors (4-hour Chart):
  • Price is far above both its 50-period and its 21-period EMA
  • Price slightly above its top Bollinger band
  • RSI is heavily overbought (86.76)
  • Volume is far higher than its average levels
Key levels to the upside          Key levels to the downside

1: $24,315                                 1: $22,054

2: $24,700                                 2: $21,350

3: $25,511                                  3: $19,918

Ethereum

Ethereum followed the extremely bullish sentiment caused by Bitcoin’s push, reaching a price of $625 before hitting a sell wall. The second-largest cryptocurrency by market cap has held these levels, and is currently consolidating above the $632 level.

An important thing to note is that, while Bitcoin has reached its ATH, Ethereum is very far from it. Ethereum might be a good value investment simply due to its potential to possibly reach towards higher levels on account of pushing towards its ATH.

ETH/USD 4-hour Chart

While Ethereum shows overall bullish sentiment on all time-frames, every time-frame except the monthly time-frame shows slight neutrality.

ETH/USD 1-day Technicals

Technical Factors (4-hour Chart):
  • Price is far above both its 50-period and its 21-period EMAs
  • Price is at its top Bollinger band
  • RSI is heavily overbought (78.20)
  • Volume is much higher than its weekly average
Key levels to the upside          Key levels to the downside

1: $675                                     1: $636.5

2: $738.5                                  2: $632 

3: $817.5                                   3: $600

Ripple

Unlike most days where XRP is having larger moves to the downside and smaller moves to the upside compared to BTC and ETH, the roles are reversed this time. The fourth-largest cryptocurrency by market cap has gained almost 25% on the day as its price bounced off of the lower line of the descending channel, and pushed towards the upside, reaching as high as $0.583 before starting its consolidation.

XRP is now trading within a range, bound by the $0.57 resistance and $0.543 support levels.


XRP/USD 4-hour Chart

XRP has changed its sentiment to overall bullishness, with its monthly time-frame showing full tilt towards the buy-side, and the rest of the time-frames showing some neutrality or hints of bearishness remaining.

XRP/USD 1-day Technicals

Technical factors (4-hour Chart):
  • Its price is currently above both its 50-period EMA and its 21-period EMA
  • Price slightly below its top Bollinger band
  • RSI is nearing the overbought territory (61.30)
  • Volume is well above its average level
Key levels to the upside          Key levels to the downside

1: $0.57                                     1: $0.543

2: $0.597                                    2: $0.5

3: $0.63                                     3: $0.475

Categories
Forex Signals

USD/CAD Selling Bias Dominates – Sell Signal Update! 

The USD/CAD pair was closed at 1.27392 after placing a high of 1.27892 and a low of 1.26931. The currency pair USD/CAD raised on Wednesday despite the weakness of the US dollar and rising crude oil prices amid the dovish comments from Governor of Bank of Canada Tiff Macklem.

On Wednesday, the US dollar was weak across the board due to the rising hopes for a further stimulus package from Congress and the dovish comments from the Federal Reserve Open Market Committee in its meeting. The bipartisan proposed that originally worth $908 billion was divided into two bills of $748 billion and $160 billion, was closer to reach a deal and get pass by Congress by the end of this week and weighed on the US dollar.

On the other hand, the WTI crude oil prices raised above $47 per barrel on Wednesday amid the declining crude oil inventories in the US over the last week. The US crude oil inventories dropped last week to -3.1M against the forecasted -2.8M and supported the crude oil prices that gave strength to the Canadian dollar that ultimately weighed on the USD/CAD pair on Wednesday.

Meanwhile, on Wednesday, the Governor of Bank of Canada Tiff Macklem warned the nation’s economy that could temporarily shrink again amid the second wave of virus cases and lightened the positive mode of the market that was lifted by the vaccine news. In his last speech of the year on Tuesday, Macklem said that uncertainty persisted and new restrictions could trigger a small contraction at the start of 2021. Sometime later next year the normal activities could resume because of the rollout of vaccines.

On the data front, at 18:30 GMT, the Consumer Price Index (CPI) for November from Canada was increased to 0.1% from the forecasted 0.0% and supported the Canadian dollar. The Common CPI declined to 1.5% against the expected 1.6% and weighed on the Canadian dollar and added gains in the USD/CAD pair. The Median CPI, however, came in line with the expectations of 1.9%. The Trimmed CPI declined to 1.7% against the estimated 1.8%and weighed on the Canadian dollar and supported an upward trend in the USD/CAD pair. 

The Foreign Securities Purchases during October in Canada were declined to 6.92B against the forecasted 10.05B and weighed heavily on the Canadian dollar and supported the gains in the USD/CAD pair. The Wholesale Sales in October surged to 1.0% against the expected 0.7% and supported the Canadian dollar. At 18:32 GMT, the Core CPI from Canada for November came in as 0.2%. The poor macroeconomic data from Canada weighed on local currency and ultimately added strength to the USD/CAD pair.

From the US side, at 18:30 GMT, the Core Retail Sales for November dropped to -0.9% against the expected 0.1% and weighed on the US dollar. The Retail Sales for November also dropped to -1.1% against the expected -0.3% and weighed on the US dollar. At 19:45 GMT, the Flash manufacturing PMI for December increased to56.5 against the expected 55.9 and supported the US dollar and added gains in the USD/CAD pair.

 The Flash Services PMI for December dropped to 55.3 against the expected 55.7 and weighed on the US dollar. At 20:00 GMT, the Business Inventories for October increased to 0.7% against the expected 0.6%and weighed on the US dollar. The NAHB Housing Market Index also dropped to 86 against the expected 88 and weighed on the US dollar and capped further upside in the USD/CAD pair.


Daily Technical Levels

Support Resistance

1.2665 1.2752

1.2632 1.2806 

1.2578 1.2839

Pivot point: 1.2719

The technical side of the USD/CAD is trading at 1.2708 level, holding below an immediate resistance level of 1.2743 mark which is extended by a downward trendline. On the lower side, the next support holds around 1.2693 level and violation of this level can extend further selling until the next support area of 1.2650 level. The MACD and RSI are in support of selling while the 50 periods EMA is dispensing a strong selling bias in the Loonie. let’s consider taking a selling trade below 1.2743 level until 1.2695 level.

Entry Price – Sell 1.27107

Stop Loss – 1.27507

Take Profit – 1.26607

Risk to Reward – 1:1.25

Profit & Loss Per Standard Lot = -$400/ +$400

Profit & Loss Per Micro Lot = -$40/ +$40

Fellas, now you can check out forex trading signals via Forex Academy mobile app. Follow the links below.

iPhone Users: https://apps.apple.com/es/app/fasignals/id1521281368

Andriod Users: https://play.google.com/store/apps/details?id=academy.forex.thesignal&hl=en_US

Categories
Forex Technical Analysis

US Dollar Index awaiting FOMC Meeting in the Extreme Bearish Zone

The US Dollar Index (DXY) reached a new yearly low of 90.128, expecting the last FOMC interest rate decision meeting of the year. The analysts’ consensus anticipates the rate unchanged at 0.25% by the FED.

Source: TradingEconomics.com

Technical Overview

The short-term overview for the Greenback illustrated in the following 8-hour chart displays the short-term market participants’ sentiment unfolded by the 90-day high and low range, which shows the price action moving in the extreme bearish sentiment zone. Likewise, the bullish divergence observed on the EMA(60) to Close Index carries to expect a recovery for the following trading sessions.

On the other hand, the short-term primary trend outlined with its trend-line drawn in blue reveals that the bearish bias remains intact since September 25th, when the price topped at 94.742. The secondary trend plotted with the trend-line in green shows the acceleration of the downward movement that began on November 04th at 94.302.

Nevertheless, the breakdown of the last sideways range developed by DXY during the latest trading session, combined with the bullish divergence observed between the price and the EMA to Close indicator, makes us suspect a bounce, which could hit the resistance of the extreme bearish sentiment zone at 91.282.

Short-term Technical Outlook

The short-term Elliott wave view for the US Dollar Index unfolded by the next 4-hour chart exposes the bearish progression of wave ((iii)) of Minute degree labeled in black that belongs to the downward sequence that began on November 04th at 94.302. 


According to the textbook, the price action requires to confirm the third wave’s completion before acknowledging the start of the wave ((iv)) in black. In this regard, the internal structure of the wave ((iii)) added to the bullish divergence observed in the MACD oscillator; thus, suggesting the advance in wave (v) of Minuette degree identified in blue.

On the other hand, considering both the alternation principle and that the second wave of the same degree looks simple in terms of price and time, the next corrective structure should be complex in terms of price, time, or both.

In this context, the next DXY path could produce a bounce corresponding to the fourth wave of Minute degree, advancing to the supply zone between 91.014 and 91.200, and even strike the 91.580 level.

In summary, the US Dollar Index looks advancing in the fifth wave of Minuette degree that belongs to the third wave of Minute degree. In this context, the price action could experience a bounce corresponding to the fourth wave of Minute degree, which could move up to 91.850. Nevertheless, if the price surpasses the invalidation level located at 92.107, the Greenback could be showing the start of a reversal of the current bearish trend.

Categories
Forex Videos

Make Money In Forex With Less Risk Counter Trend Trading!


How to reduce risk while counter trading a trend

Thank you for joining this Forex Academy educational video.

In this session, we will be looking at how to reduce your risk in a counter-trend set up.

Trading against the trend is inherently risky.  However, as your experience grows as a trader, you will likely start seeing opportunities where trends run out of steam and look right for a reversal.  These kinds of trades can often be extremely profitable if the timing is right. 

Of course, trading any financial asset, but specifically foreign exchange, is almost impossible to correctly find entries and exits which are down to the pip perfect, i.e., identifying an entry or exit of a particular move within a single pip.

This is where it is important to adopt a variable approach to leverage.  Quite often, new traders will simply execute the same amount of leverage per trade, no matter what the circumstances.  So any particular trade, they might open with half a standard lot, or even a full lot, no matter whether they are trading after an economic data release, which might be low impact or a high-impact release such as non-farm payrolls, they keep their trade size the same no matter what, and this can be particularly dangerous and it is a poor aspect of money management.  A variable approach is another string to the bow of becoming a more rounded trader.

This is a 4-hour chart of GBP USD

The majority of the price action as shown during position A in this section from the 24th of November to the 3rd of December has largely been a sideways move while traders wait for the outcome of the Brexit future trade negotiations with the EU. 

Although there was a spike outside of the range at position B, price action reverted back within the original range on the 2nd of December.

There is then a bounce off of the support line and a 200 pip bull run, which breaches the resistance line, and takes price action all the way up to within a pip of the key 1.3500 level.

This is a good opportunity for profit-taking for many traders and a potential double top reversal …….

…from this daily chart of the pair with which was a multi-month as shown during August 2020.

Under these circumstances, we believe there may be a reversal in price action, and we had decided to trade against the trend, believing that it will reverse at this point.  And we initiate a short trade, with reduced leverage than perhaps we might normally use because we are trading against the trend, and then we will layer the trade with market executions or sell limit orders just above our first trade, dependant on risk, and because we cannot predict where the reversal will happen, if at all.

Had this been a real trade, at least two of the orders would have been filled, including the at market order and where there was a reversal of 89 pips, which is a healthy profit.

In this particular instance, we have taken advantage of uncertainty in the market with regard to Brexit, a multi month high, double top scenario, and a key round number 1.3500.  We have reduced our leverage because of uncertainty and the fact that it was a counter-trend reversal trade, which can be inherently risky.  But we have diluted that risk by lowering our leverage and layering the trades over varying exchange rates in close proximity to the key level of 1.3500. Stop losses should be implemented as per your personal risk appetite.    

This style can also be implemented for long trades with similar principles, and the reduced leverage and layering style can be adopted in any trade scenario. 

Categories
Forex Market Analysis

Daily F.X. Analysis, December 16 – Top Trade Setups In Forex – U.K.Manufacturing PMI Figures Ahead! 

On the news front, eyes will remain on the series of Manufacturing PMI figures from the Eurozone, U.K., and the U.S. Although it’s a low impact event, it may help determine the market sentiment today.


Economic Events to Watch Today  


EUR/USD – Daily Analysis

The EUR/USD pair closed at 1.21522 after placing a high of 1.21687 and a low of 1.21210. Despite the coronavirus related lockdowns, the EUR/USD pair moved higher on Tuesday as the European stock markets traded higher amid the optimism over the ongoing Brexit trade negotiations.

The European Union negotiator Michel Barnier said that securing a trade deal with Britain was still possible. In contrast, European Commission Ursula von der Leyen said that there was some movement over the sticking points.

According to the Times of London, the two sides had made progress on the level playing field, and only the biggest obstacle to a deal has left of differences over fishing rights. However, the hopes increased that some form of a deal could be reached with just days to go before the U.K. leaves the E.U. trading bloc. This optimism kept the single currency Euro higher and supported the upward momentum in EUR/USD pair.

On the data front, at 12:45 GMT, the French Final CPI for November came in line with the expectations of 0.2%. At 15:00 GMT, the Italian Trade Balance for October raised to 7.57B against the forecasted 5.40B and supported Euro and added gains in the EUR/USD pair.

On the U.S. front, at 18:30 GMT, the Empire State Manufacturing Index for December declined to 4.9 against the projected 6.3 and weighed on the U.S. dollar that added further gains in EUR/USD pair. The U.S. Import Prices in November fell to 0.1% against the projected 0.3% and weighed on the U.S. dollar and supported the upward momentum in EUR/USD pair. At 19:15 GMT, the Capacity Utilization Rate from the U.S. for November rose to 73.3% against the projected 73.1% and supported the U.S. dollar. The Industrial Production in November also surged to 0.4%against the projected 0.3% and supported the U.S. dollar and capped further gains in EUR/USD pair.

Meanwhile, the lockdown restrictions increased in Europe, given the region’s rising number of coronavirus cases. On late Monday, the U.K. government imposed tighter restrictions on London amid the increased infection rates. It cited that these may be partly linked to a new variant of the coronavirus. From Wednesday, Germany will also enter a lockdown that will include the closure of non-essential stores. Netherland also announced a new five-week lockdown, while Italy was considering more restrictions over the Christmas holidays.

Throughout the region, these lockdown restrictions added pressure on the single currency Euro and capped further gains in the EUR/USD pair on Tuesday.

Daily Technical Levels

Support   Resistance

1.2126       1.2175

1.2099       1.2197

1.2077       1.2224

Pivot point: 1.2148

EUR/USD– Trading Tip

The precious metal gold continues to trade bullish at 1,857, having crossed over double top resistance level of 1,857 level. On the higher side, the metal opens up further room for buying until the next target level of 1,865 and 1,875 level. On the lower side, the precious metal gold may find support at 1,848, and below this level, the metal may drop until the 1,832 level. Let’s consider staying bullish over 1,848 today. The 50 periods EMA supports a bullish bias, keeping the EUR/USD pair in a little bit of buying mode. Simultaneously, the MACD and RSI are also supporting a buying trend; thus, we should look for a buying trade over the 1.2175 level to target the 1.2265 level today. 


GBP/USD – Daily Analysis

 The GBP/USD pair closed at 1.34635 after placing a high of 1.34688 and a low of 1.32800. The GBP/USD pair was among the best performer on the day amid the speculation regarding the prospect of an imminent Brexit deal.

There were speculations mostly amongst Conservative M.P.s that a Brexit deal was close and might be voted in the House of Commons next Monday and Tuesday. This optimism led the GBP/USD pair higher in the market to post gains for the day.

After posting losses for three consecutive days, the currency pair GBP/USD pair rose by nearly 1% on Tuesday after the speculation that there had been progressing on the issue of a level playing field. The European Union negotiator Michel Barnier said that reaching a trade pact with Britain was still possible. At the same time, European Commission Ursula von der Leyen noted that there was some progress made over the sticking points.

British Pound is highly sensitive to Brexit progress, and any news showing optimism regarding the post-Brexit trade deal with the E.U. will have a great impact on the GBP/USD pair. This was the reason behind the sudden surge in GBP/USD currency pair on Tuesday despite the renewed lockdown restrictions by the U.K. government over London.

The Health Secretary of the UK, Matt Hancock, said on Monday that this week London would return to a strict lockdown as the coronavirus cases have soared in the British capital. Hancock said London would move from England’s Tier 2 – high alert local restrictions to Tier 3 – very high alert on Wednesday noon. 

Under the highest restriction level, all hospitality venues, including pubs, restaurants, and cafes, will close except for takeout and delivery. People will avoid unnecessary traveling and reduce the number of journeys. Residents in London will be restricted from meeting in private gardens or outdoor venues.

Meanwhile, on the data front, at 12:00 GMT, the Average Earnings Index from Great Britain raised to 2.7% against the forecasted 2.2% and supported the British Pound that added gains in the GBP/USD pair. The Claimant Count Change from the U.K. raised to 64.3K against the expected 10.5K and weighed on British Pound. The Unemployment Rate from the U.K. dropped to 4.9% from the expected 5.1% and supported the Sterling that added strength to the GBP/USD pair.

From the U.S. side, at 18:30 GMT, the Empire State Manufacturing Index for December fell to 4.9 against the estimated 6.3 and weighed on the U.S. dollar that added further gains in GBP/USD pair. The U.S. Import Prices in November dropped to 0.1% against the estimated 0.3% and weighed on the U.S. dollar and supported the upward momentum in GBP/USD pair. At 19:15 GMT, the Capacity Utilization Rate from the U.S. for November surged to 73.3% against the estimated 73.1% and supported the U.S. dollar. The Industrial Production in November also rose to 0.4% against the estimated 0.3% and supported the U.S. dollar.

Daily Technical Levels

Support   Resistance

1.3338       1.3528

1.3218       1.3595

1.3147       1.3719

Pivot point: 1.3404

GBP/USD– Trading Tip

The GBP/USD pair is trading at 1.3460 level, facing immediate resistance at 1.3475 and 1.3538 level. While the support stays at 1.3430 and 1.3401 level. The RSI and MACD support the buying trend in the market, while Cable has the potential to stay bullish over 1.3400 today. A choppy session can be expected until the pair violates the 1.3345 – 1.3309 range.


USD/JPY – Daily Analysis

The USD/JPY pair closed at 103.647 after placing a high of 104.150 and a low of 103.604. The USD/JPY pair failed to capitalize on its previous daily gains and dropped on Tuesday over the fears of a new variant of coronavirus and the increased lockdown restrictions over the globe.

The safe-haven appeal in the market returned after the U.K. Health Minister Matt Hancock told parliament that a new variant of the coronavirus associated with faster spread had been identified in southeast England. This led to widespread concern as headlines in the newspaper called this new variant “Super covid” and “mutant covid.”

Matt Hancock added that about 60 different local authorities had recorded coronavirus infections caused by the new variant. He also said that the World Health Organization had been notified, and a detailed study by U.K. scientists has started.

The fear of new and improved disease raised the market’s safe-haven appeal as London went into renewed lockdown restriction of Tier-3 level. Along with London, Germany and Netherland also extended their lockdown restrictions. The rising demand for safe-haven assets added strength to the Japanese Yen that ultimately weighed on the USD/JPY pair.

Meanwhile, on the data front, at 18:30 GMT, the Empire State Manufacturing Index for December declined to 4.9 against the anticipated 6.3. It weighed on the U.S. dollar that added further losses in the USD/JPY pair. The U.S. Import Prices in November fell to 0.1% against the anticipated 0.3% and weighed on the U.S. dollar and added further in the losses of the USD/JPY pair. At 19:15 GMT, the Capacity Utilization Rate from the U.S. for November rose to 73.3% against the anticipated 73.1% and supported the U.S. dollar. The Industrial Production in November also surged to 0.4% against the anticipated 0.3% and supported the U.S. dollar and capped further losses in the USD/JPY pair.

Furthermore, on Tuesday, Dr. Anthony Fauci, the U.S. senior official for infectious diseases, predicted that the U.S. could begin to achieve early stages of herd immunity against the deadly coronavirus by late Spring or Summer. 

Fauci said that to see an impact of the vaccine over the coronavirus spread, almost 50% of people would have to get vaccinated. To achieve herd immunity, 75 to 85% of people would have to get vaccinated. 

Herd immunity occurs when enough people become immune to the disease that the spread of the virus from one person to another person becomes unlikely. Fauci pointed to polio and measles as examples of herd immunity. Despite these positive statements from the top health official from the U.S., the USD/JPY pair failed to reverse its direction upward because of traders’ focus on the new variant of coronavirus.

Daily Technical Levels

Support   Resistance

103.47       104.02

103.25       104.37

102.91       104.58

Pivot Point: 103.81

USD/JPY – Trading Tips

The USD/JPY is trading dramatically bearish, falling below 103.700. This resistance area is extended by a double bottom pattern, which later was violated on the 2-hour timeframe. Below this level, the USD/JPY pair has odds of extending a sell trade until the next support level of 103.211. The 50 EMA and MACD are supporting selling bias. Thus we can expect to sell below 103.700, to target the 103.200 mark. Good luck! 

Categories
Crypto Market Analysis

Daily Crypto Review, Dec 16 – XRP Getting Crushed; BTC and ETH Stuck within a Range

The cryptocurrency sector was mostly stable today as Bitcoin kept within its trading range. Bitcoin is currently trading for $19,393, representing an increase of 1.13% compared to yesterday’s value. Meanwhile, Ethereum’s price has increased by 0.10% on the day, while XRP managed to lose a whopping 8.56%.

 Daily Crypto Sector Heat Map

XcelToken Plus gained 263.82% in the past 24 hours, making it the most prominent daily crypto gainer by far. It is followed by Amun Bitcoin 3x Daily Long’s 161.53% and rbase.finance’s 129.84% gain. On the other hand, Maximine Coin lost 99.42%, making it the most prominent daily loser. It is followed by STEM CELL COIN’s loss of 97.69% and Patron’s loss of 89.45%.

Top 10 24-hour Performers (Click to enlarge)

Bottom 10 24-hour Performers (Click to enlarge)

Bitcoin’s market dominance has moved up since our last report, with its value currently being 63.9%. This value represents a 0.4% difference to the upside than the value it had when we last reported.

Daily Crypto Market Cap Chart

The cryptocurrency sector capitalization has decreased slightly since we last reported, with its current value being $564.0 billion. This represents a $4.20 billion decrease when compared to our previous report.

_______________________________________________________________________

What happened in the past 24 hours?

_______________________________________________________________________

_______________________________________________________________________

Technical analysis

_______________________________________________________________________

Bitcoin

Bitcoin has continued trading within a range between $19,100 and $19,570, possibly hitting a wall of profit-taking institutional traders. Despite the overall bullishness of the market, the largest cryptocurrency by market cap failed to break the $19,666 level or even reach it. This is because of the increasing number of BTC Whales (holders of 10,000 to 100,000 Bitcoin) leaving the market and taking profit as the price approaches the $20,000 mark.

The sheer amount of resistance hovering above $19,500 will make it quite hard for Bitcoin bulls to push towards the all-time highs. In case the aforementioned push doesn’t happen, we can expect a possible dip towards $18,000.

BTC/USD 4-hour chart

Bitcoin’s overview on all time-frames is bullish, with its weekly time-frame being the only one completely bullish. The rest of the time-frames are slightly tilted to the neutral side.

BTC/USD 1-day Technicals

Technical factors (4-hour Chart):
  • Price is above its 50-period and slightly above its 21-period EMA
  • Price is between its middle and top Bollinger band
  • RSI is neutral (60.06)
  • Volume is average
Key levels to the upside          Key levels to the downside

1: $19,100                                 1: $18,600

2: $19,666                                 2: $18,190

3: $20,000                                  3: $17,800

Ethereum

Ethereum has hit a sell wall as well, stopping its upward price movement just below $600 for the third time in 3 days. The second-largest cryptocurrency by market cap is stuck between $581 to the downside and $600 to the upside, which is a very narrow range for long-term trading.

Ethereum will most likely experience a sharp break out of the current range, creating a potential safe trade with set parameters.

ETH/USD 4-hour Chart

Ethereum’s overview on all time-frames is bullish, with its daily time-frame being the only one completely bullish. The rest of the time-frames are slightly tilted to the neutral side.

ETH/USD 1-day Technicals

Technical Factors (4-hour Chart):
  • Price is slightly above its 50-period and at its 21-period EMAs
  • Price is at its middle Bollinger band
  • RSI is neutral (54.03)
  • Volume is slightly below average when compared to the previous week
Key levels to the upside          Key levels to the downside

1: $600                                     1: $581

2: $632                                     2: $565 

3: $636.5                                   3: $545

Ripple

XRP has continued its downturn, this time breaking the crucial $0.475 level. Its price has steadily decreased ever since Dec 1, when it could not break $0.683. This steady descent has created a downtrend, which many analysts think is the death of XRP’s price.

However, there is still hope for XRP. Some analysts believe that this is the 4th of 5 waves in a pattern that XRP started creating on Aug 20 and that the next wave will start an uptrend that will propel its price above $1.

XRP/USD 4-hour Chart

XRP’s longer-term technicals are tilted towards the buy-side, while its short-term technicals are tilted towards the sell-side. While its 4-hour time-frame is completely bearish, its daily overview is slightly more neutral.

XRP/USD 1-day Technicals

Technical factors (4-hour Chart):
  • Its price is currently well below both its 50-period EMA and its 21-period EMA
  • Price is at its bottom Bollinger band
  • RSI is close to the oversold territory (31.25)
  • Volume is well below its average level
Key levels to the upside          Key levels to the downside

1: $0.5                                      1: $0.475

2: $0.543                                   2: $0.45

3: $0.57                                    3: $0.425

Categories
Forex Elliott Wave Forex Market Analysis

EURAUD Advances Supported by the RBA Minutes

Technical Overview

The EURAUD cross advanced on the overnight trading session, expecting the minutes from the last Reserve Australia Bank (RBA) interest rate decision meeting, where policymakers decided to keep unchanged the rate at 0.1% for the second month in a row.

Source: TradingEconomics.com

On the technical side, the following 12-hour chart shows the short-term market sentiment unfolded by the 90-day high and low range, which illustrates the cross consolidating in the extreme bearish sentiment zone

The bullish candlestick formation developed during the recent trading sessions carries to suspect the possibility of a short-term bounce. This bounce could find strike the level 1.62374 that corresponds to the resistance of the extreme bearish zone.

On the other hand, the short-term primary trend plotted in blue shows the bearish bias that remains in progress. The secondary trend also shows the intraday downward acceleration, which dragged the price until 1.60408, where the cross found support. Likewise, the bounce observed on the EMA(60) to Close Index carries to support the possibility of a limited recovery.

Technical Outlook

The short-term Elliott wave view for the EURAUD cross shows the downward progress of the incomplete five-wave sequence of Minute degree labeled in black, suggesting a limited recovery in the following trading sessions.

The next 4-hour chart shows the bearish movement subdivided into a five-wave sequence of Minute degree identified in black. It began on October 20th at 1.68273 and found its temporary bottom at 1.60408 on December 11th.

The previous figure illustrates the price looks advancing in its fifth wave in black, which after the bottom reached on the last Friday 11 session completed its wave (iii) of Minuette degree labeled in blue. In this context, according to the Elliott wave theory, the price action should start to develop a corrective formation, which could find resistance in the supply zone between 1.61786 and 1.62271.

On the other hand, considering that the wave ((iii)) in black looks like the extended wave, the fifth wave could have a limited extension. In this context, the lesser degree structure of the wave ((v)) could pierce slightly below the end of wave (iii) in blue.

In conclusion, the EURAUD cross shows the possibility of a limited recovery, which could strike the supply zone between 1.61786 and 1.62271, where the price could start to consolidate in a sideways range with support at the end of wave (iii) at 1.60408. On the other hand, if the cross surpasses the supply zone, it would indicate further recoveries, and the price could start a bullish rally. Finally, the invalidation level of the current bearish scenario locates at 1.62872.

Categories
Forex Videos

Forex For Beginners – How To Trade EURGBP! Buying The Euro With A No Brexit Trade Deal!

For beginners – How to trade the EURGBP with no trade deal Brexit 

Thank you for joining this forex academy educational video.

Great Britain voted in a national referendum to leave the European Union June 2016.  The  United Kingdom officially left the EU you in January 2020 with a one-year transition period which ends on the 31st of December 2020.

This was to allow the EU and the United Kingdom four years to come up with a future trading solution with regard to laws and arrangements which would allow the United Kingdom to take back its sovereignty, which is what the people of Great Britain wanted.

However, unravelling the years of business ties between the two areas, including laws,  fishing rights,  humanitarian issues,  worker’s rights,  competitive fairness,  financial regulatory alignment, including a whole myriad of rules and regulations has been one of the most complicated issues in modern times.  The affair is turning into an acrimonious divorcAfter the transition period, theThe two sides agreed thod they would work towards having a free trade agreem,ent which would lead to an almost seamless continuation of business.

But the United Kingdom claims that many of the terms and conditions as set out by the European Union in order to grant a free trade agreement to the United Kingdom are seen as not acceptable to the British government.  Some of these conditions are centred around fishing, where the EU wants to continue fishing in British sovereign waters, a so-called level playing field,  where the United Kingdom cannot go out and sign up other trade agreements around the world by undercutting EU member states.  And where the EU has said that any breach by the UK of such a future agreement, or where the EU changes regulations, and the UK does not fall into line, would be penalised by tariffs and which the UK has said this is totally unacceptable.  Ten deadlines have come and passed between the two sides regarding reaching an agreement,  and where currently, at the time of writing,  there are just a few days left to instigate and agreement,  and where both sides are saying this is now very unlikely to happen.

This is a daily chart of the euro to Great British pound pair ,or EURGBP,  and where we can clearly by the blue candlesticks that since the latter part of November 2020, the Euro is gaining in value on the exchange rate.  

Investors believe that the sentiment has changed in the latter stages of November and certainly since the 7th of December, and  where they believe that in the current state there will likely be no deal and therefore because the European Union is economy is much greater than that of the United Kingdom that the Euro will fare better than the pound in the event of a no tariff-free arrangement being reached.

In in the same chart we have highlighted a section A,  where the pound was gaining against the euro since August,  because the market considered that an agreement would be reached.


 So how can investors get in on the action and ride the pair hire based on current sentiment?

Firstly, we need to bring the chart down to a smaller time frame, such as the one hour.  Here we can see a defined bull channel, with areas of support at two points and areas of resistance at two points as show by the exchange rate touching the two purple lines, and where we might consider going long at a pull-back to the support line, perhaps somewhere around the X mark.  

By reverting back to our daily chart we can see some potential targets, or areas of resistance, the closest is 0.9294  which was reached in September 2020 and way back in  the middle of March this year, where we have a target/resistance level of 0.9500.

Of course the exchange rate might be a little different by the time you get to view this video, however, should there be a no tariff deal agreement and where the United Kingdom crashes out of the EU on world trade organisation rules, where tariffs will be imposed by either side,  but most likely to be more detrimental to the UK than the EU, you should then be looking for setups such as we have shown today to buy the pair.

Categories
Forex Signals

AUD/USD Supported Over 0.7515 Level – Is It Good Time to Buy? 

The AUD/USD pair was closed at 0.75324 after placing a high of 0.75779 and a low of 0.75243. After placing gains for three consecutive days, the AUD/USD pair dropped on Monday despite the market’s risk flows. After rising above the highest level since June 2018, the AUD/USD pair saw heavy technical selling in the market. The pair reached above the 0.75700 level and faced heavy selling pressure as the investors started to take profits from their trades. The profit-taking overshadowed the market’s risk flows, and the pair AUD/USD continued falling on Monday. 

The risk sentiment was improved on Monday due to the latest vaccine rollout in the US and Canada after the UK. The US started giving Pfizer and BioNtech vaccine doses to nurses and health officials on Monday as it provides a 95% efficacy rate against the coronavirus.

The vaccine rolls out raised hopes that the global economic recovery will soon begin as the coronavirus will become less of a threat. This optimism raised the risk sentiment in the market but failed to impress the risk-sensitive Aussie buyers.

The risk sentiment was also supported by the latest hopes that the US coronavirus stimulus bill will be released soon to support the US economy from the coronavirus impact. The US dollar also came under pressure as the coronavirus cases, and the death toll from COVID-19 surpassed 300,000 number. The US dollar weakness could not impress the AUD/USD buyers, and the pair continued its bearish movement on Monday.

Meanwhile, the AUD/USD pair was under pressure on Monday as Biden has said that he will not remove the tariffs on Chinese products by Trump immediately. The President-elect nominated Katherine Tail for the role of US trade representative said on Friday that she was the trade enforcer against China’s unfair trade practices that will be a key priority in the Biden-Harris administration. It was a sign that Donald trump’s trade war will continue, which weighed on the China-Proxy Australian dollar and added losses in the AUD/USD pair on Monday.


Daily Technical Levels

Support Resistance

0.7514 0.7570

0.7492 0.7602

0.7459 0.7625

Pivot point: 0.7547

The AUD/USD is trading sideways at 0.7515, but it’s supported by an upward trendline that can be seen in the 2-hour timeframe. On the higher side, the AUD/USD is forming a double top level at 0.7527, which is now extending resistance. The leading technical indicators such as MACD and RSI support the buying trend, while the 50 periods EMA is also supporting the AUD/USD pair at 0.7515. Let’s consider buying over 0.7515 level to capture quick 40 pips. Good luck! 

Categories
Forex Market Analysis

Daily F.X. Analysis, December 15 – Top Trade Setups In Forex – U.K. Labor Market Figures! 

Investor’s eyes will stay on the French Final CPI and Italian Trade Balance due from the European Economy. Economists are expecting no major changes in these inflation and trade balance data. Thus it may go muted. However, the Claimant Count Change and Unemployment Rate data from the U.K. is likely to drive market movements. Let’s keep an eye on U.K. labor market figures today.

Economic Events to Watch Today  


EUR/USD – Daily Analysis

During Tuesday’s Asian trading session, the EUR/USD currency pair managed to extend its overnight winning streak and sidelined near above the 1.2150 level mainly due to the risk-on market sentiment. That was supported by the upbeat China data and optimism over treatment for the highly infectious coronavirus, which weakens the safe-haven U.S. dollar and contributes to the currency pair gains. Moreover, the upbeat market tone was further boosted by the further U.S. stimulus package’s rising expectations, which add further burden around the U.S. dollar and boost the currency pair. 

On the contrary, the ongoing concerns about increasing COVID-19 deaths and the possibility of economically-painful hard lockdowns become the key factor that kept the lid on any additional gains in the currency pair. As of writing, the EUR/USD currency pair is currently trading at 1.2149 and consolidating in the range between 1.2143 – 1.2165.

As we already mentioned, the market trading sentiment succeeded in extending its previous day bullish bias and still representing positive performance on the day as the bullish appearance of Asia-Pacific stocks and the gains of the U.S. stocks futures tends to highlight the risk-on mood. However, the risk-on market sentiment could be attributed to the vaccine optimism and upbeat China data, which showed the economic recovery increased in November. On the data front, China’s Retail Sales increased by 5.0% year-on-year in November, marking the 4th-successive month of growth. Industrial Production, a gauge of manufacturing, mining, and utility output, rose 7% year-on-year versus October’s 5.9% growth. 

On the other hand, the renewed optimism over a possible vaccine for the highly infectious coronavirus disease also keeps supporting the market trading sentiment. It is worth recalling that the U.S. Food and Drug Administration (FDA) granted permission for emergency use to BNT162b2, the COVID-19 vaccine co-developed by Pfizer (NYSE: PFE) and BioNTech SE (F:22UAy) on December 11. The approval will see the first U.S. deliveries of BNT162b2 later in the day, which lifted hopes that the world’s largest economy will likely see a reduction in the COVID-19 cases. However, the positive developments over the covid vaccine keep favoring the market risk-on mood and undermine the safe-haven U.S. dollar.

As in result, the broad-based U.S. dollar failed to stop its previous day bearish bias and drew further offers on the day as demand for the safe-haven assets decreased amid progress toward agreeing on U.S. fiscal stimulus and optimism for a Brexit deal. On the other hand, the U.S. dollar losses were further bolstered by the Fed’s expectations to keep interest rates low for an extended period at its last policy meeting of 2020. However, the U.S. dollar losses helped the gold prices to deeper its losses as the gold price is inversely related to the U.S. dollar price. The U.S. Dollar Index Futures that tracks the greenback against a bucket of other currencies dropped to 90.642.

On the contrary, the concerns about rising COVID-19 deaths and the possibility of economically-painful hard lockdowns keep challenging the upbeat market performance, which becomes the key factor that kept the lid on any additional gains currency pair. As per the latest report, the growing virus cases recall the local lockdowns in the U.K. and the U.S. After New York, that was witnessed readiness to enter a second full lockdown as the number of COVID-19 cases surge. In addition to this, Germany also extended national activity restrictions. Across the ocean, the fears of a full-fledged trade/political war between the West and China also challenge the market’s upbeat mood. The tension between the two biggest economies in the world was fueled after the U.S. imposed back to back travel restrictions over the Chinese Communist Party members and their families.

In the absence of the major data/events on the day, the market traders will keep their eyes on the continuous drama surrounding the U.S. stimulus package. In the meantime, the risk catalyst like geopolitics and the virus woes, not to forget the Brexit, will also be key to watch for a fresh direction. 

Daily Technical Levels

Support   Resistance

1.2044       1.2133

1.2006       1.2186

1.1954       1.2223

Pivot point: 1.2096

EUR/USD– Trading Tip

The technical side of the EUR/USD is still unchanged as it trades at the 1.2131 level, facing immediate resistance at 1.2160 and 1.2196 level along with a support level of 1.2085. Closing of candles below the 1.2103 level can send the EUR/USD pair further lower until 1.2080 and 1.2040. The 50 periods EMA supports a bullish bias, keeping the EUR/USD pair in a little bit of buying mode. Simultaneously, the MACD and RSI are also in support of a buying trend; thus, we should look for a buying trade over the 1.2175 level to target the 1.2265 level today. 


GBP/USD – Daily Analysis

During Tuesday’s Asian trading session, the GBP/USD currency pair maintained its strong bid tone through the first half of the Asian session and remained positive around the 1.3335 level mainly due to the reports suggesting that the U.K. and the E.U. agreed to extend Brexit talks. Furthermore, the bid tone surrounding the British pound was further bolstered after the E.U.’s chief Brexit negotiator, Michel Barnier, said that they could face every hurdle to reach a post-Brexit trade deal. 

Across the ocean, the broad-based U.S. dollar fresh weakness, backed by the market risk-on mood, also played its major role in underpinning the currency pair. At a particular time, the GBP/USD currency pair is currently trading at 1.3333 and consolidating in the range between 1.3312 – 1.3348. Moving on, the traders seem cautious to place any strong position ahead of the U.K. jobs data, which is due to release later in the day.

It is worth recalling that the U.K. Prime Minister Boris Johnson and European Commission President announced that they discussed the key issues and decided to go for another round of discussions to reach a historic trade deal, which in turn, raised expectations for a free trade agreement before the end of Brexit transition period on December 31. However, these hopes were further fueled after the E.U.’s chief Brexit negotiator, Michel Barnier, told them to use every way to reach a post-Brexit trade deal.

Despite the prevalent doubts over the global economic recovery from coronavirus (COVID-19), the market trading sentiment managed to extend its previous day’s positive performance. It remained supportive by optimism over a potential vaccine/treatment for the highly infectious coronavirus. Let me remind you that the U.S. Food and Drug Administration (FDA) granted permission for emergency use to BNT162b2, the COVID-19 vaccine co-developed by Pfizer (NYSE: PFE) and BioNTech SE (F:22UAy) on December 11. However, the positive developments over the covid vaccine keep favoring the market risk-on mood and undermine the safe-haven U.S. dollar.

As in result, the broad-based U.S. dollar failed to stop its previous day bearish bias and drew further offers on the day as demand for the safe-haven assets decreased amid progress toward agreeing on U.S. fiscal stimulus and optimism for a Brexit deal. On the other hand, the U.S. dollar losses were further bolstered by the Fed’s expectations to keep interest rates low for an extended period at its last policy meeting of 2020. However, the U.S. dollar losses provided an additional boost to the GBP/USD currency pair and remained supportive of the strong intraday positive move. The U.S. Dollar Index Futures that tracks the greenback against a bucket of other currencies dropped to 90.642.

On the bearish side, the concerns about rising COVID-19 deaths and the possibilities of the economically-painful hard lockdowns keep challenging the upbeat market performance, which becomes the key factor that kept the lid on any additional gains in the currency pair. As per the latest report, the growing virus cases recall the local lockdowns in the U.K. and the U.S. After New York, that was witnessed readiness to enter a second full lockdown as the number of COVID-19 cases surge. In addition to this, Germany also extended national activity restrictions. 

Moving on, the traders seem cautious to place any strong position ahead of the U.K. jobs data, which is due to release later in the day. From the projected view, the U.K. labor market report is anticipated to show that the average weekly earnings, including bonuses, in the 3-months to October, to increase from the previous 1.3% to 2.2%, while ex-bonuses, the wages are seen improving from 1.9% to 2.6% during the stated period. 

In addition to this, the number of people asking for jobless benefits is expected to rise from -29.8K previous to +50K in November. Moreover, the ILO Unemployment Rate may rise from 4.8% to 5.1% during the 3- months ending in October. However, the positive earnings growth tends to underpin the GBP; conversely, the low figures would be seen as negative for the GBP currency.

In the absence of the major data/events on the day, the market traders will keep their eyes on the continuous drama surrounding the U.S. stimulus package. In the meantime, the risk catalyst like geopolitics and the virus woes, not to forget the Brexit, will also be key to watch for a fresh direction. 

Daily Technical Levels

Support   Resistance

1.3338       1.3466

1.3280       1.3536

1.3209       1.3594

Pivot point: 1.3408

GBP/USD– Trading Tip

The GBP/USD is trading at the 1.3330 level, maintaining a narrow trading range of 1.3345 – 1.3309. A lack of high-impact economic data drives the choppy session; however, the market will be offering us labor market figures, which are expected to be worse than before, and it may drive selling in the Sterling. Technically, the bearish breakout of the 1.3309 level can extend the selling trend until the 1.3265 level, whereas a bullish breakout can lead it towards the 1.3409 mark. A choppy session can be expected until the pair violates the 1.3345 – 1.3309 range.


USD/JPY – Daily Analysis

During Tuesday’s Asian trading session, the USD/JPY currency pair managed to stop its previous day losing streak and drew some modest bids around well above the 104.00 level. However, the bullish sentiment around the currency pair was supported by the upbeat market mood, which undermined the safe-haven Japanese yen and contributed to the currency pair gains. Apart from this, the latest local lockdowns in the northern hemispheres and the surge in Tokyo’s virus figures added further pressure on the Japanese yen and boosted the currency pair. On the contrary, the broad-based U.S. dollar, triggered by the upbeat market mood, has become the key factor that capped further upside momentum for the currency pair. Currently, the USD/JPY currency pair is currently trading at 104.09 and consolidating in the range between 103.98 – 104.15. 

As we already mentioned, market trading sentiment has been gaining positive traction since the day started and supported by the optimism over the U.S. President-elect Joe Biden’s victory in the Electoral College. As per the latest report, the U.S. President-elect Joe Biden recently won Electoral College and claimed his victory over President Donald Trump by achieving over 270 votes needed. In addition to this, the intensifying hopes of the U.S. covid stimulus also positively impacted the market trading sentiment. These hopes were triggered after Treasury Secretary Steve Mnuchin and House Speaker Nancy Pelosi urged policymakers toward an early aid package while also indicating good progress in the discussions. 

Across the ocean, the reason behind the risk-on market sentiment could also be attributed to the upbeat China data, which showed the economic recovery improved in November. On the data front, China’s Retail Sales increased by 5.0% year-on-year in November, marking the 4th-successive month of growth. Industrial Production, a gauge of manufacturing, mining, and utility output, rose 7% year-on-year versus October’s 5.9% growth. 

On the other hand, the renewed optimism over a possible vaccine for the highly infectious coronavirus disease also keeps supporting the market trading sentiment. It is worth recalling that the U.S. Food and Drug Administration (FDA) granted permission for emergency use to BNT162b2, the COVID-19 vaccine co-developed by Pfizer (NYSE: PFE) and BioNTech SE (F:22UAy) on December 11. The approval will see the first U.S. deliveries of BNT162b2 later in the day, which lifted hopes that the world’s largest economy will likely see a reduction in the COVID-19 cases. However, the positive developments over the covid vaccine keep favoring the market risk-on mood and undermined the safe-haven assets like the Japanese yen and U.S. dollar.

At the USD front, the broad-based U.S. dollar extended its previous session bearish bias. It failed to gain any positive traction during the Asian trading hours amid risk-on market sentiment. Apart from this, the greenback losses could also be associated with the Fed’s expectations to keep interest rates low for an extended period at its last policy meeting of 2020. However, the U.S. dollar losses might stop bulls from placing any strong position and keep a lid on any further gains for the USD/JPY currency pair. The U.S. Dollar Index Futures that tracks the greenback against a bucket of other currencies dropped to 90.642.

However, the market trading sentiment was rather unaffected by the fresh lockdown restrictions in Britain and Europe. As per the latest report, the growing virus numbers recall the local lockdowns in the U.K. and the U.S. After New York, a willingness to enter a second full lockdown as the number of COVID-19 cases surge. In addition to this, Germany also extended national activity restrictions. 

In the absence of the major data/events on the day, the market traders will keep their eyes on the ongoing drama surrounding the U.S. stimulus package. In the meantime, the risk catalyst like geopolitics and the virus woes, not to forget the Brexit, will also be key to watch for a fresh direction. 

Daily Technical Levels

Support   Resistance

104.04       104.41

103.86       104.60

103.67       104.78

Pivot Point: 104.23

USD/JPY – Trading Tips

The USD/JPY is hardly moving as it continues to trade sideways below the 104.150 resistance area. This resistance area is extended by a double top level on the 2-hour timeframe. Bullish crossover of 104.156 level can open buying until 104.590 level. Conversely, the support holds around 103.910 level. A bearish breakout of this support can drive the selling trend until the next support area of 103.700 and 103.500. Let’s keep an eye on a breakout before placing any bullish or bearish bets. Good luck! 

Categories
Crypto Market Analysis

Daily Crypto Review, Dec 15 – Bitcoin Whales Stopping the Push Towards $20k; XRP on the Downturn

The majority of the cryptocurrency sector ended up being in the slight green since we last reported, with Bitcoin trying to reach the all-time highs (though so-far unsuccessfully). Bitcoin is currently trading for $19,106, representing an increase of 0.15% compared to yesterday’s value. Meanwhile, Ethereum’s price has decreased by 0.32% on the day, while XRP managed to lose 2.97%.

 Daily Crypto Sector Heat Map

Mandi Token gained 175.35% in the past 24 hours, making it the most prominent daily crypto gainer by far. It is followed by yTSLA Finance’s 169.53% and DefHold’s 129.84% gain. On the other hand, DistX lost 98.32%, making it the most prominent daily loser. It is followed by AC Index’s loss of 94.05% and YXO’s loss of 43.16%.

Top 10 24-hour Performers (Click to enlarge)

Bottom 10 24-hour Performers (Click to enlarge)

Bitcoin’s market dominance has moved up very slightly since our last report, with its value currently being 63.5%. This value represents a 0.2% difference to the upside compared to the value it had when we last reported.

Daily Crypto Market Cap Chart

The cryptocurrency sector capitalization has increased since we last reported, with its current value being $569.80 billion. This represents a $9.01 billion increase when compared to our previous report.

_______________________________________________________________________

What happened in the past 24 hours?

_______________________________________________________________________

_______________________________________________________________________

Technical analysis

_______________________________________________________________________

Bitcoin

Bitcoin had quite an interesting day as it (at one point) tried to push towards the all-time highs, or at least towards its next resistance level (sitting at $19,666). However, the sheer resistance near the $20k level was immense, and the largest cryptocurrency by market cap dipped to its immediate support level ($19,100), which is where it’s at right now.

The data provided by various sources point to Bitcoin whales blocking the way towards and past $20k, despite all the bullish sentiment currently surrounding the cryptocurrency.


BTC/USD 4-hour chart

Bitcoin’s overview on all time-frames is fully bullish, with its monthly time-frame being slightly more tilted to the neutral side than the rest.

BTC/USD 1-day Technicals

Technical factors (4-hour Chart):
  • Price is above its 50-period and slightly above its 21-period EMA
  • Price is near its middle Bollinger band
  • RSI is neutral (55.33)
  • Volume is average when compared to the past week
Key levels to the upside          Key levels to the downside

1: $19,100                                 1: $18,600

2: $19,666                                 2: $18,190

3: $20,000                                  3: $17,800

Ethereum

Ethereum was in the same boat as Bitcoin for the past couple of days, with its price movement mirroring Bitcoin’s. Ether tried to move towards the $600 mark, but got stopped out just below it, triggering a pullback to its immediate support level ($581). However, its downside is well-guarded, both by the $581 support level and the 4-hour 21-period moving average.

Ethereum will most likely continue mirroring Bitcoin’s moves in the short future, meaning that traders should either focus on trading Bitcoin or pay close attention to its movements while trading Ether.

ETH/USD 4-hour Chart

Ethereum’s overview on all time-frames is fully bullish, with its weekly time-frame being slightly more tilted to the neutral side than the rest.

ETH/USD 1-day Technicals

Technical Factors (4-hour Chart):
  • Price is slightly above both its 50-period and 21-period EMAs
  • Price is near its middle Bollinger band
  • RSI is neutral (53.74)
  • Volume is slightly below average when compared to the previous week
Key levels to the upside          Key levels to the downside

1: $600                                     1: $581

2: $632                                     2: $565 

3: $636.5                                   3: $545

Ripple

XRP is one of the cryptocurrencies that rarely mirrors Bitcoin’s movements, and that was the case in the past 24 hours as well. However, the fact that its price doesn’t mirror the largest cryptocurrency was bad news lately. XRP’s price continued its slow descent, this time breaking the $0.5 mark to the downside. At one point, there was an attempt to regain this level, which got shut down pretty quickly.

While the overall crypto sector is surrounded by bullish sentiment, XRP is looking quite bearish in the short-term. Shorting the fourth-largest cryptocurrency by market cap can be a valid trading strategy, simply due to its consistency going down in recent days.

XRP/USD 4-hour Chart

XRP’s longer-term technicals are completely bullish, while its daily overview is slightly more tilted towards neutrality. Its 4-hour time-frame, however, is slightly tilted towards the sell-side.

XRP/USD 1-day Technicals

Technical factors (4-hour Chart):
  • Its price is currently below its 50-period EMA and slightly below its 21-period EMA
  • Price is between its middle and bottom Bollinger band
  • RSI is neutral (37.98)
  • Volume is well below its average level
Key levels to the upside          Key levels to the downside

1: $0.5                                      1: $0.475

2: $0.543                                   2: $0.45

3: $0.57                                    3: $0.425

Categories
Forex Elliott Wave Forex Market Analysis

NZDUSD Could Reach a New Yearly High

The NZDUSD pair continues extending its gains, testing the psychological barrier of 0.71, helped by the US Dollar weakness. The Oceanic currency outperforms over 5.4% during the current year. Also, the pair advances over 27% since it confirmed its bottom on March 22nd at 0.55862.

Technical Overview

The big picture of the NZDUSD illustrated in the following 12-hour chart shows the primary upward trend, its trendline plotted in blue, intact since March 22nd when the price confirmed its bottom at 0.55862 and began the rally that remains in progress to date. Likewise, the secondary trend and its green trendline reveal the acceleration of the price testing by the third time the psychological barrier of 0.71.

Considering that the NZDUSD pair currently re-tests the 0.71 level, the price could extend its gains, reaching a new yearly high, to find resistance in the next psychological resistance of 0.72.

Short-term Technical Outlook

The short-term Elliott wave view for the NZDUSD pair unfolded by its 4-hour chart led us to observe an incomplete impulsive sequence of Minute degree labeled in black, which began on October 22nd price found fresh buyers at 0.65529.

The previous chart illustrates the impulsive structure that continues progressing and looks to develop its fourth wave of Minute degree labeled in black. Moreover, in the chart, we should remark that the third wave, which looks like the extended wave of the incomplete impulsive sequence identified in black, has found resistance at 0.71043 on December 03rd. 

Once the price topped the yearly high at 0.71043, the pair began to develop a sideways corrective formation, still progressing. In this regard, considering both the alternation principle stated by the Elliott Wave Theory and that wave ((ii)) in black looks like a simple corrective pattern, the current wave ((iv)) of the same degree should be complex in terms of price, time, or both.

In this scenario, the price action might retrace until the demand zone bounded between 0.69462 and 0.68970, where the Kiwi could find fresh buyers expecting to boost the pair toward a new yearly high. This high could strike the potential target zone between 0.71618 and 0.7260.

In summary, the short-term Elliott wave perspective for the NZDUSD pair reveals the advance in a bullish trend that currently moves mostly sideways in an incomplete corrective formation. The fourth wave in progress could find support in the demand zone bounded between 0.69462 and 0.68970. Likewise, fresh buyers could boost the price toward 0.71618 and extend its gains until 0.7260. Finally, the invalidation level of the current bullish scenario is located at 0.68106.

Categories
Crypto Market Analysis

Daily Crypto Review, Dec 14 – BTC and ETH Consolidating After A Bull Rally; XRP Left in the Dust

The majority of the cryptocurrency sector ended up in the green as Bitcoin spent the weekend regaining the value it lost after failing to break its all-time high with confidence. Bitcoin is currently trading for $19,144, representing an increase of 1.69% compared to yesterday’s value. Meanwhile, Ethereum’s price has increased by 3.61% on the day, while XRP managed to gain 3.77%.

 Daily Crypto Sector Heat Map

BDCC Bitica COIN gained 229.29% in the past 24 hours, making it the most prominent daily crypto gainer by far. It is followed by Ethereum Lightning’s 223.18% and Nuggets’ 190.36% gain. On the other hand, rbase.finance lost 72.18%, making it the most prominent daily loser. It is followed by COIL’s loss of 48.85% and SBank’s loss of 40.65%.

Top 10 24-hour Performers (Click to enlarge)

Bottom 10 24-hour Performers (Click to enlarge)

Bitcoin’s market dominance has moved up half a percent since we last reported, with its value currently being 63.3%. This value represents a 0.5% difference to the upside compared to the value it had when we last reported.

Daily Crypto Market Cap Chart

The cryptocurrency sector capitalization has increased significantly over the weekend, with its current value being $560.79 billion. This represents a $31.22 billion increase when compared to our previous report.

_______________________________________________________________________

What happened in the past 24 hours?

_______________________________________________________________________

_______________________________________________________________________

Technical analysis

_______________________________________________________________________

Bitcoin

Bitcoin has been on fire this weekend, with its price skyrocketing from its recent lows. The uptrend that started on Dec 11 brought its price from $17,600 all the way up to $19,400 before starting to consolidate. The steep ascending trend it created was unsustainable in the long run, so Bitcoin left it and continued trading sideways just above $19,100. The largest cryptocurrency by market cap is currently fighting for this level, with the previous five 4-hour candles holding above the support.

BTC/USD 4-hour chart

Bitcoin’s daily and monthly technicals show slight signs of neutrality on top of its overall bullishness. On the other hand, its 4-hour and weekly technicals are completely bullish.

BTC/USD 1-day Technicals

Technical factors (4-hour Chart):
  • Price is above both its 50-period and 21-period EMAs
  • Price is between its middle and top Bollinger band
  • RSI is neutral (59.17)
  • Volume is slightly below the average level
Key levels to the upside          Key levels to the downside

1: $19,100                                 1: $18,600

2: $19,666                                 2: $18,190

3: $20,000                                  3: $17,800

Ethereum

Ethereum has followed Bitcoin’s footsteps and created its own ascending channel, in which it moved from Dec 11 until Dec 13. The second-largest cryptocurrency by market cap has left this channel and started its own consolidation phase right above the $581 support level.

Ethereum’s moves seem like a mirror to Bitcoin’s moves, with slightly more or less intensity. Traders should be extremely careful of sudden moves Bitcoin can make that could disrupt their Ethereum trades.

ETH/USD 4-hour Chart

Ethereum’s 4-hour, daily, and weekly technicals overall bullish but show signs of neutrality or even some bearish indicators. On the other hand, its monthly technicals are completely tilted towards the buy-side.

ETH/USD 1-day Technicals

Technical Factors (4-hour Chart):
  • Price is above both its 50-period and 21-period EMAs
  • Price is between its middle and top Bollinger band
  • RSI is starting to descend after being close to overbought (58.72)
  • Volume is average when compared to the previous week
Key levels to the upside          Key levels to the downside

1: $600                                     1: $581

2: $632                                     2: $565 

3: $636.5                                   3: $545

Ripple

XRP performed much worse than Bitcoin and Ethereum over the weekend, with its short-term outlook being quite bearish. The fourth-largest cryptocurrency by market cap ended up losing $13.11% of its value week-over-week, with its price currently sitting at the $0.5 level.

XRP is currently fighting to stay above the $0.5 level, with its past four 4-hour candles managing to do this. Traders may be able to catch a trade in either direction when XRP confirms its position above/below $0.5 on increased volume.

XRP/USD 4-hour Chart

XRP’s 4-hour and daily overviews are heavily tilted towards the sell-side but still show some neutral indicators. Its longer-term technicals, though, are completely bullish.

XRP/USD 1-day Technicals

Technical factors (4-hour Chart):
  • Its price is currently below both its 50-period EMA and its 21-period EMA
  • Price is between its middle and bottom Bollinger band
  • RSI is neutral (37.98)
  • Volume is slightly below the average level
Key levels to the upside          Key levels to the downside

1: $0.5435                                 1: $0.5

2: $0.57                                     2: $0.475

3: $0.6                                      3: $0.45

Categories
Forex Market Analysis

Daily F.X. Analysis, December 14 – Top Trade Setups In Forex – European Events in Highlights!  

On the news side, the market is expected to report a low impact on economic events, which may have a very slight or no effect on the market. The German WPI m/m, Industrial Production, and German Buba Monthly Report will be released from the European economy. Still, I suspect there’s not going to be any significant movement in the market.

Economic Events to Watch Today  


EUR/USD – Daily Analysis

During Monday’s Asian trading session, the EUR/USD currency pair succeeded in extending its overnight winning streak and remained well bid around the 1.2140 level mainly due to the risk-on market sentiment. That was supported by the optimism over treatment for the highly infectious coronavirus, which tends to weaken the safe-haven U.S. dollar and contributes to the currency pair gains. 

Moreover, the upbeat market tone was further boosted by the increasing expectations of a further U.S. stimulus package, which boosted the currency pair. On the contrary, the fresh jump in infections and death toll in Europe keeps fueling the doubts over the Eurozone economic recovery, which becomes the key factor that kept the lid on any additional currency pair gains. The EUR/USD is trading at 1.2134 and consolidating between 1.2116 and 1.2145.

The global equity market has been flashing green since the day started and is supported by the further stimulus package’s renewed possibilities. As per the latest report, the U.S. Congress members are still progressing over the much-awaited stimulus talks. In that way, the latest talks suggest the partition of over $900 billion of aid package with $748 billion and $160 billion likely figures for each bill. Across the pond, the optimism over treatment for the highly infectious coronavirus has also been favoring the market trading sentiment. These hopes were sparked after the U.S. Food and Drug Administration’s (FDA) officially authorized the Pfizer-BioNTech covid vaccine for emergency use. Thereby, the upbeat market mood has been playing its major role in underpinning the currency pair.

The broad-based U.S. dollar declined to obtain any positive traction and drew an offer on the day as doubts persist over the global economic recovery from COVID-19. That was witnessed by the U.S. previous week’s downbeat U.S. data. Meanwhile, the risk-on market sentiment also weighed on the U.S. currency. On the other hand, the U.S. dollar losses were further bolstered by the Fed’s expectations to keep interest rates low for an extended period at its last policy meeting of 2020. However, the losses in the U.S. dollar becomes the key factor that kept the currency pair higher. The U.S. Dollar Index Futures that tracks the greenback against a bucket of other currencies dropped by 0.17% to 90.773 by 9:48 PM ET (1:48 AM GMT).

On the contrary, the intensifying coronavirus woes across the globe and intensifying lockdowns restrictions in Europe and the U.S. keep challenging the upbeat market performance and become the key factor that kept the lid on any additional gains in the currency pair. As per the latest report, the growing virus cases recall the local lockdowns in the U.K. and the U.S. In the meantime, Germany also extended national activity restrictions. Meanwhile, the fears of a full-fledged trade/political war between the West and China also challenge the market’s upbeat mood. The tension between the two largest markets in the world was fueled after the U.S. imposed back to back travel restrictions over the Chinese Communist Party members and their families.

Looking forward, the traders will keep their eyes on the U.S. employment data for November along with Euro German Factory Orders data, which will likely entertain market players amid a light calendar. All in all, the updates surrounding the Brexit, virus, and U.S. stimulus package will not lose their importance. 

Daily Technical Levels

Support   Resistance

1.2044       1.2133

1.2006       1.2186

1.1954       1.2223

Pivot point: 1.2096

EUR/USD– Trading Tip

The technical side of the EUR/USD is trading choppy at the 1.2131 mark, meeting immediate resistance at 1.2160 and 1.2196 marks along with a support mark of 1.2085. Formation of candles beneath the 1.2103 level can send the EUR/USD pair further lower until 1.2080 and 1.2040. Industrial Production and German Buba Monthly Report will remain in highlights. Let’s wait to trade a breakout setup during the European or the U.S. session today. 


GBP/USD – Daily Analysis

During Monday’s Asian trading session, the GBP/USD currency pair managed to stop its previous week’s bearish bias and refresh the intra-day high around above the mid-1.3300 level, mainly due to reports suggesting that the UK PM. Boris Johnson and the European Commission (E.C.) President Ursula von der Leyen agreed to extend the Brexit talks for one more week, which eased fears of a no-deal Brexit and contributed to the currency pair gains. On the other hand, the broad-based U.S. dollar fresh weakness, backed by the market risk-on mood, also played its major role in underpinning the currency pair. At a particular time, the GBP/USD currency pair is currently trading at 1.3325 and consolidating in the range between 1.3291 – 1.3354.

It is worth recalling that the U.K. Prime Minister Boris Johnson and European Commission President announced that they discussed the key issues and decided to go for another round of discussions to reach a historic trade deal, which in turn, boosted the sentiment around the British Pound and contributed to the currency pair gans. In contrast, the British PM Johnson repeats, “I’m afraid we’re still very far apart on some issues.” However, this negative statement failed to leave any meaningful impact on the Pound. 

Despite the lingering doubts about global economic recovery and the intensifying tension between the world’s two biggest economies, the market players continue to cheering the optimism over a possible vaccine for the highly infectious coronavirus disease. These hopes were fueled after the U.S. Food and Drug Administration’s (FDA) officially approved the Pfizer-BioNTech covid vaccine for emergency use. However, the positive developments over the covid vaccine keep favoring the market risk-on mood. Apart from this, the global equity market was further supported by the further stimulus package’s renewed possibilities. As per the latest report, the U.S. Congress members keep working to give the much-awaited stimulus package ahead of this Friday’s deadline. In that way, the latest talks suggest the partition of over $900 billion of aid package with $748 billion and $160 billion likely figures for each bill. 

As in result, the broad-based U.S. dollar failed to stop its bearish bias and remained depressed on the day. Moreover, the doubts over the global economic recovery from COVID-19 remains on the card. That was witnessed by the U.S. previous week’s downbeat U.S. data. On the other hand, the U.S. dollar losses were further bolstered by the Fed’s expectations to keep interest rates low for an extended period at its last policy meeting of 2020. However, the losses in the U.S. dollar becomes the key factor that kept the currency pair higher. The U.S. Dollar Index Futures that tracks the greenback against a bucket of other currencies dropped by 0.17% to 90.773 by 9:48 PM ET (1:48 AM GMT).

Conversely, the intensifying coronavirus woes in the U.K. and the U.S. and intensifying lockdown restrictions keep challenging the upbeat market performance and become the key factor that kept the lid on any additional gains in the currency pair. As per the latest report, the U.S. and U.K. policymakers were forced to impose the local lockdowns once again. In the meantime, Germany also extended national activity restrictions. 

Looking forward, the market traders will keep their eyes on the developments surrounding the Brexit story for some significant direction in the pair. Furthermore, the updates covering the virus and the US-China tussle will also be key to watch.

Daily Technical Levels

Support   Resistance

1.3338       1.3466

1.3280       1.3536

1.3209       1.3594

Pivot point: 1.3408

GBP/USD– Trading Tip

The GBP/USD is trading at the 1.3313 level, holding below an immediate resistance level of 1.3322. On the upper side, the GBP/USD pair can lead to a 1.3390 level, and support stays at 1.3269, which is extended by a double bottom level. Selling bias seems dominant; therefore, we should be looking for a sell trade only upon the violation of the 1.3265 level. The lagging technical indicators like 50 EMA suggest selling bias. Thus we should look for selling trades below 1.3400 and upon breakout 1.3265 level too.   


USD/JPY – Daily Analysis

During Monday’s Asian trading session, the USD/JPY currency pair failed to gain any positive traction. They witnessed some modest selling moves near below the 104.00 level, mainly due to the upbeat market sentiment, which tends to undermine the safe-haven U.S. dollar and contributes to the currency pair losses. However, the market trading sentiment was supported by the optimism about the coronavirus treatment and progress in the U.S. stimulus talks. Simultaneously, the market’s upbeat mood weakens the safe-haven Japanese yen, which could be considered one of the key factors that help the currency pair limit its deeper losses. In contrast, Japan’s Tankan data for the 4th-quarter (Q4) marked upbeat figures, which boosted the Japanese yen’s sentiment and contributed to the currency pair losses.  

At the data front, Tankan Large Manufacturing Index for Q4 grew from -27 to -10, against expectations of -15, while the Non-Manufacturing Index increased from -6 market consensus to -5 during the stated period. Moreover, Tankan Large Manufacturing Outlook and Non-Manufacturing Outlook also recorded upbeat numbers of -8 and -6 respectively, against -11 and -7 forecasts in that order.

Despite the lingering doubts over the U.S. economic recovery and the escalating tension between the world’s two biggest economies, the market players continue to cheer the optimism over a potential vaccine for the highly dangerous coronavirus infection. These hopes were fueled after the U.S. Food and Drug Administration’s (FDA) officially approved the Pfizer-BioNTech covid vaccine for emergency use. In turn, the New York Times got help to say that the White House staff members will be among the first to be vaccinated. However, the positive developments over the covid vaccine keep favoring the market risk-on mood and contributed to the currency losses by undermining the safe-haven U.S. dollar.

Apart from this, the global equity market upticks were further fueled by the further stimulus package’s renewed possibilities. As per the latest report, the U.S. Congress members keep working to give the much-awaited stimulus package ahead of this Friday’s deadline. In that way, the latest talks suggest the partition of over $900 billion of aid package with $748 billion and $160 billion likely figures for each bill. 

This, in turn, the broad-based U.S. dollar failed to stop its bearish traction and edged lower on the day. Moreover, the doubts over the U.S. economic recovery from COVID-19 remains on the card, as witnessed by the U.S. previous week’s downbeat U.S. data. On the other hand, the U.S. dollar losses were further bolstered by the Fed’s expectations to keep interest rates low for an extended period at its last policy meeting of 2020. However, the losses in the U.S. dollar becomes the key factor that kept the currency pair lower. The U.S. Dollar Index Futures that tracks the greenback against a bucket of other currencies dropped by 0.17% to 90.773 by 9:48 PM ET (1:48 AM GMT).

The rising tensions between the United States and China keep challenging the market risk-on tone and might suffer the currency pair into deeper losses. It’s also questioning the market risk-on mood could be the intensifying coronavirus woes in the U.K. and U.S., which leads to the intensifying lockdown restrictions. 

Daily Technical Levels

Support   Resistance

104.04       104.41

103.86       104.60

103.67       104.78

Pivot Point: 104.23

USD/JPY – Trading Tips

During the previous week, the USD/JPY violation of the symmetric triangle pattern at 104.346 faked out as the safe-haven currency pair reversed trade within the same triangle pattern. The current trading range of the USD/JPY pair remains 104.375 – 103.650, and violation of this range can extend the selling trend until the next support area of 103.200 level. Typically, such a triangle pattern can breakout on either side; this, we should be careful before opening any trade. The market is neutral as investors seem to wind up their positions ahead of the December holidays. Good luck

Categories
Forex Technical Analysis

Burning the Japanese Candlestick at Both Ends?

Japanese candlestick patterns are a popular forex trading tool but are they really useful or can they be more of a burden than an asset? Read on to hear both sides of the story and get insights you won’t find elsewhere.

Storytelling Candlesticks?

The first thing to say here is that this is a look at how forex traders use candlestick patterns as a technical tool and not about the use of Japanese candlesticks as an alternative to bar charts. Compared with the more traditional bar charts – that were used more heavily in the past – Japanese candlestick charts have only a slight advantage. Overall, both types display the exact same information, with the candlesticks perhaps making it a little easier to identify patterns and some people will also tell you that they are just easier to read and neater.

The other thing to remember about candlestick charts (though this does also apply to bar charts) is that – unlike, say, a line chart – Japanese candlesticks are telling you a story about how the price moved over a given time period. Let’s say you are trading using the one-day chart. Well, with a candlestick chart, for any given day you will know where the price was when trading opened, where the price peaked, where it bottomed out, and where it closed – all just by looking at a single candle for a second or two! All on its own, that’s magic. But the real story behind Japanese candlesticks isn’t about how they display price movements. It’s a little more involved than that.

History Lesson?

Japanese candlesticks go back a long way. Now, it is really not very interesting to most traders to read long histories of where their trading tools come from – most people just want to know how they work or if they even work at all. That’s pretty easy to understand and, in most cases, the history of an indicator or any other tool isn’t particularly fascinating and is generally pretty irrelevant. With Japanese candlesticks, it is actually pretty useful to know where the technique originates from, so as to better understand the role it plays today.

So, the story behind Japanese candlesticks is that they were originally developed in Japan a couple of hundred years ago to help traders track the price of rice on their own internal markets. They were popularised in the rest of the world in the early 90s when a guy called Steve Nison who wrote a hefty book about them and how recognizing patterns in the candlesticks can be used to analyze patterns in the prices of equity, commodities, and forex. The key part of the book’s success back when it was originally published is that it detailed how these patterns can help traders to discern, if not always predict, possible future price movements. 

Supply and Demand

Some traders say that being able to use candlesticks to predict what’s coming down the road in terms of price movements is more of an art than a science. That may or may not be true but, if it is, it is definitely an art that you can learn. As we said before, each candlestick on your chart is telling you a story but put together they are telling you a larger piece of that story. Learning to recognize these patterns and being able to understand the story your candlesticks are telling you is where the art comes in. But one thing is for certain, the main characters in the story are always supply and demand. The story arc is always about the balance between sellers and buyers.

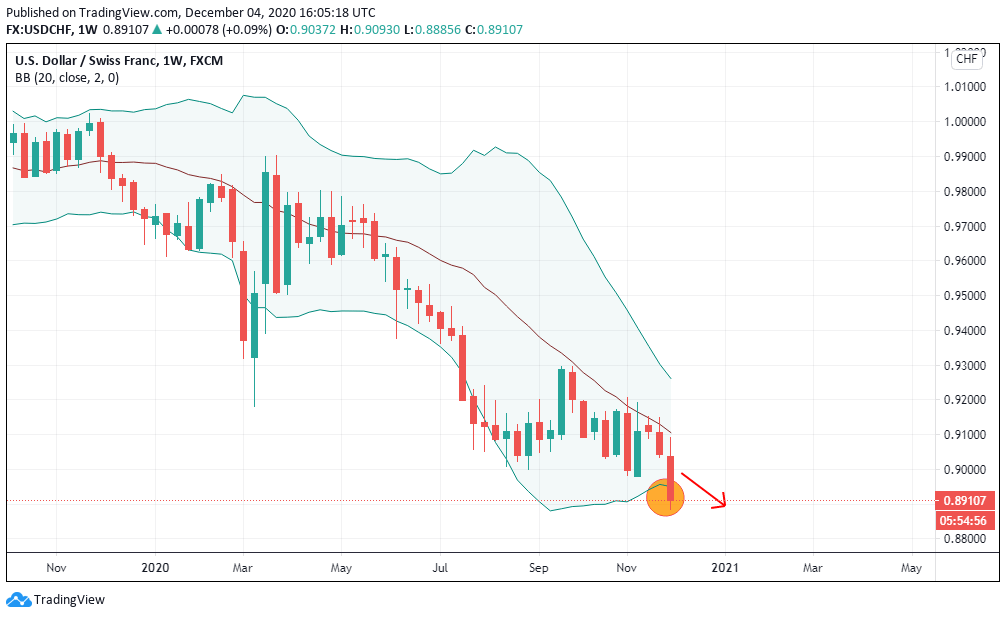
When it comes to trading, it is easy to forget the fundamentals that underpin how the market works. We all get lost in indicators, tools, charts, news events, and a plethora of other distractions and we just forget that the fundamental elements that drive price in one direction or the other is the balance between buyers and sellers. In short, supply and demand. Now, of course, there are a million factors that drive supply and demand – some big news story, government intervention in the market, the machinations of big players, and so on – but these factors are all expressed by how they affect the relationship between buyers and sellers. Say the UK government decides to curb government borrowing and the Bank of England decides to do nothing in response – well, this might undermine confidence in GBP and the price drops relative to the dollar and the euro. That’s all very well but the real driving force bringing the price down is that people who were worried about the breaking news and decided to sell their GBP outnumbered people who were looking to buy GBP at that time. Sellers outnumbered buyers and the price dropped. 

All the other indicators we use ultimately derive all of their data from this one simple fact. From whether there were more buyers or more sellers over a given period. Now, the beauty of Japanese candlesticks is that they give you a much more stripped-down view of the true nature of things. The stories they tell have all the noise stripped away and just show you the relationship between buyers and sellers.

The best way to show you how they do that is to take a look at a couple of examples. Now, this is nowhere near being an exhaustive list of Japanese candlestick patterns – there are literally hundreds of these things out there and very few people know more than a few. This is more of an opportunity to give you a sense of how they work so, before you take these and start applying them to your trading, be aware that any real use of these patterns will require your own research and testing (as well as making sure you use them in conjunction with other indicators as part of a broader trading system that includes risk analysis and money management). You just don’t get anything handed to you in this game, you have to put the work in.

Another thing to bear in mind is that these patterns work better on the longer timeframes. On shorter timeframes like the one-minute chart, you will still have these patterns emerging but their accuracy will be so low as to make them unusable. This is because the price is shifting around so fast it generates a lot of noise and makes the patterns unreliable. At the longer timeframes, the patterns will make more sense but the trade-off is that they will also be less timely, which will delay your entry and exit signals. This is a trade-off between accuracy and timeliness that you’re making with every indicator out there so you have to be aware of it and compensate for it with the way you manage your trades.

Examples – The Hammer

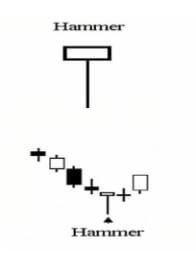
A hammer is a candlestick with a short body, a long lower shadow, and a small or no upper shadow. The story the candlestick is telling you is that the price dropped after opening but rallied during the time period and ended up close to the opening price (sometimes over and sometimes under).

Typically, you’ll see hammers close to the bottom of a clear downward price movement and they indicate that sellers predominated but that, eventually, enough buyers came into the market to sway the price the other way. Of course, you might also see hammers when the market is ranging or moving sideways where they are more likely to deceive you about where the price is going to go. After a strong short trend, however, they often signal a change in the price direction.

As with all of these patterns, they are a signal – there is no guarantee about the direction of the price after a given candlestick pattern. You might see a hammer come in and think it represents a reversal but the price can easily just turn around and burn you afterward. Smart traders who suspect that a downward trend has concluded once they see a hammer will wait for one or even two confirmation candles to form before pulling the trigger on a trade.

Examples – The Shooting Star

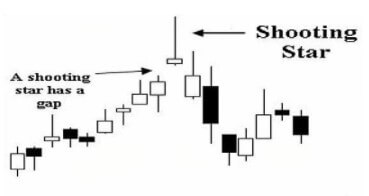
Just as a hammer signals a possible change of direction in the price movement after a downward trend, so its mirror image, the shooting star, signals a possible change of direction when it appears at the peak of an upward trend.

Since it is fully a mirror image of the hammer, the shooting star has a long upper shadow, it is also possible to glean a sense of the strength of the turnaround from the length of this shadow – a short shadow likely signals a dampened change of direction while a long upper shadow (sometimes many times longer than the body) is a sign of a more bearish pullback. The best examples of a shooting star will form above the previous candle – that is, its open, lows and close should all be above the shadow of the previous candle.

It is important to be aware that a shooting star pattern and an inverted hammer pattern both look exactly the same but that they differ in one crucial detail. A shooting star will appear at the top of an upward trend and signals a coming downturn, while an inverted hammer will appear at the bottom of a downward trend and, much like its sibling, the hammer signals a change of direction for the price movement. 

Examples – The Doji Star

A doji star or just plain ol’ doji is a candlestick that forms when the open and close price is so close that the candle looks like a cross. The name doji comes from the Japanese word for error or mistake, which is apt given what this candlestick is signaling. There are several types of doji but they are all telling you more or less the same thing – the price has reached a balance point and there is no strong trend in either direction.

You’ll see them in all sorts of contexts, so no matter what the market is doing at any given time, you could have a doji forming. That said, they are still giving traders a signal to be aware of and think about. Though they often crop up when the price is moving sideways – that is not the doji you are looking for. They are much more useful to you when they form after a strong move in either direction. Dojis represent indecision at the best of times but after a healthy trend, they are telling you that equilibrium is being reached between buyers and sellers and that could be a sign that the trend is losing strength. 

Of course, a doji doesn’t always mean there is going to be a turning point and you should watch out for those moments when a trend wavers a bit for a time and then simply carries on going because that could easily kick up a doji. 

Examples – The Hanging Man

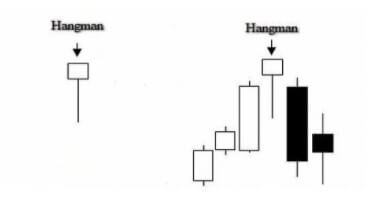
The hanging man or hangman is, in many ways, a similar candlestick pattern to a shooting star – in the sense that it represents a possible reversal of sentiment at the top of an upward price movement. Don’t be fooled, however, because there are differences.

A typical hanging man will look much like a hammer or an inverted shooting star – with a relatively small real body, a long lower shadow, and little or no upper shadow. The longer the lower shadow, the stronger the candlestick is as a signal. But the context is important because, unlike a hammer, a hanging man appears at the peak of an upward trend. Also important is the story the candlestick is telling us. From the shape of the candle, we can tell that buyers managed to rein in a sell-off that occurred between the open and close. Though you could read this to mean that the buying sentiment prevailed in the end, most traders will see this deep sell-off as a sign that the trend is losing strength.

There are many traders out there who think of the hanging man as being more useful for short-term changes in direction and that, as such, it should be used more as an exit signal than as an entry into a short trade. In that sense, it could be a useful addition to your toolkit as a way of maximizing wins by preventing the price from dropping through your stops.

Examples – The Bullish Engulfment

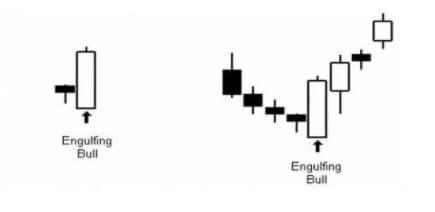
The bullish engulfing pattern or engulfing bull is a Japanese candlestick formation made up of two candles rather than one. It forms when a smaller bearish candle is followed immediately by a larger bullish candle whose body is bigger than the real body of the smaller candle. You don’t need to worry too much about the shadows of the smaller candle – the main aspect is the second candle’s large body being bigger than that of its little predecessor. The story that this tells us of the first candle representing a slowing downward price movement, the price opening lower still on the second candle but then closing near the period’s highs (which is why the second engulfing bull candle will often have small upper and lower shadows). This is important, especially for the upper shadow because it then indicates that the price was still heading upwards when the candle closed.

Since the bullish engulfment is telling you that buyers clearly won out during the second candle’s formation, it is usually taken to mean that the downward sentiment is losing strength and that a reversal could be imminent. This is why it is important for the open price of the second candle to be lower than the close of the first – this means that the downward trend continued but was eventually reversed by bulls winning out over bears.

The Other Side of Japanese Candlesticks

Understanding the patterns of Japanese candlesticks and using that knowledge to assist your trading (in conjunction with other indicators and tools) is hugely popular in forex. But although it is true to say that it is popular, that doesn’t mean that there are not those out there who think that Japanese candlesticks are either ineffective to the point of being meaningless or that they could actually be hurting your trading.

Supply and Demand?

The first of these criticisms of candlestick patterns as a tool in trading goes to the very heart of the power of what Japanese candlesticks are all about and it goes a little like this: Japanese candlesticks were originally developed and also later adapted as a tool for trading commodities (rice, in the original iteration) and stocks – both of which conform to the rules of supply and demand much more closely than forex. And there are elements of truth to that criticism. In forex trading, demand is certainly a factor but the supply side of the equation works rather differently than in commodities and stocks because the supply of a currency isn’t as limited – in theory, it is completely unlimited.

However, though there is some truth in there, that doesn’t mean that the story Japanese candlesticks tell traders about the relationship between sellers and buyers during a given time period is completely invalidated. Forex is still subject to the principle that price increases when buyers outnumber sellers and decreases when the reverse is true. But, and here’s the clincher, while it doesn’t invalidate the candlesticks approach, it is still something to bear in mind. You will see times when a candlestick pattern that unfolds just perfectly on your screen still doesn’t go on to give you the price movement you were expecting.

Well, as a trader, what does that tell you and where does that leave you? Ultimately, if you’re a smart trader, it leaves you pretty much where you started. It means that you cannot rely solely on following Japanese candlestick patterns without combining them with a well-worked out trading system that includes other indicators and a host of highly honed risk and money management techniques that you have adapted over time to suit your trading style.

The Big Players

Another – and very closely related – criticism of Japanese candlesticks comes from those that see the actions of big, powerful market players lurking behind every price move and directing the ups and downs of the market in the short term but also, and especially, in the longer term. That may initially sound like conspiracy theory hogwash to some readers but there is more to it than that. In forex, just as in most markets (but perhaps, at the end of the day, more so in forex), there certainly are huge and powerful financial institutions, funds, and so forth that influence the prices on forex markets. Traders need to be aware of that and the fact that this undermines to some extent the purity of a simple supply and demand equation.

There’s another side to this to also be aware of. Japanese candlesticks have become so popular now among retail forex traders that their huge popularity is also one of the main things that hold them back. They are so widespread now as a technique that they have been analyzed to death by the big players in the market and the algorithms and software they use that their reliability has been seriously degraded. The big players will happily use software that recognizes a pattern in the blink of an eye – a million times faster than any human trader would – and uses this advanced knowledge to analyze how the vast majority of traders will react to the emergence of this pattern relying on popular patterns. This essentially traps you – the slow human – in a computer-laid trap where you following the received wisdom in responding to a given pattern will be your ultimate undoing. 

Pattern Blindness

A third major criticism of using Japanese candlesticks – and perhaps the most valid – is based on how our brains work. Humans evolved over millions of years to be able to pick out patterns. Back when we were hunter-gatherers, this helped us to survive, to spot the tiger among the bushes, to find food, and generally to get by. Over time we became masters at it – second to none. But the thing is, being able to see patterns in the modern world isn’t quite the question of life or death that it once was. In fact, it’s of limited application. And then, along comes forex trading and Japanese candlesticks and suddenly we’re back in our element again. So, sure, our innate ability to spot patterns comes in handy sometimes but there’s also a downside.

The drawback of being such fine-tuned pattern identifiers is that we also tend to see them even when we shouldn’t. Sometimes that might mean seeing the savior of your choice in a piece of toast or getting creeped out by random shapes in the dark, but at other times it could be seeing an inverse hammer or a bullish engulfment on a chart. But there’s another couple of elements to the pattern recognition that could also really get in your way when using Japanese candlesticks in trading.

One of these is that you start looking at charts and seeing the candlestick patterns on it but because you’ve become so convinced by all of the hype around Japanese candlesticks, you start only seeing the wins and allowing your eyes to simply skate over the losses. This happens partly because Japanese candlesticks are so popular and so talked about on the forex internet and people become kind of indoctrinated to seeing their successes. You spend so much time watching videos or reading blogs that tell you over and again that these things work that it gradually becomes harder and harder for you to see the times when they don’t.

This generates a kind of belief because, well, wouldn’t it be great if this worked as advertised? You could just look at a chart, see a pattern emerging and you’d know what the market was going to do next – just in time to enter a trade and make a handy little profit from what you know. Once that sense of belief and hope is ingrained, you lose your objectivity and your ability to see things for what they are. And once you’re in that territory, you forget that belief and hope cannot replace a well-tested and well-thought-through strategy. Moreover, once you’ve gone deep enough and trained your brain to see these patterns, you can become blind to all of the other approaches to forex trading there are out there. 

A final piece of the pattern-seeing puzzle is that when you’ve trained your brain to pick out patterns of Japanese candlesticks, it becomes very difficult to untrain your brain again. Even if you stop using them actively as a tool, you’re still going to be seeing them everywhere while you’re trading. In a sense, using this approach to trading lures your brain into a trap from which it can become difficult to escape. Even when you think you’re free because you’ve stopped using candlestick patterns, you go on seeing them and they introduce doubt at a subconscious level, affecting your trading decisions.

Testing Yourself and Your System

Ultimately, whether there is any value to scanning the charts for patterns of Japanese candlesticks is something you will have to decide for yourself. The one thing that’s for sure is that you can’t fully trust your own brain to be objective about it. The only way to be truly and, above all, objectively sure whether any given approach or tool is valid and performs the way you need it to is to test it.

Believing and hoping that something is going to work – even believing other people’s judgment about it – leads to all kinds of problems. Not least of which is the fact that when it almost inevitably fails to work in the long term, the first person you’re going to blame is yourself because your instinct will tell you that you must be doing something wrong: “How can all these people be having success with this tool but it isn’t working for me – there must be something I’m not doing right”. The only way to combat that doubt is to make sure the tools and approaches you’re using have been tested by you and that you are comfortable with how they work.

Now, that doesn’t mean backtesting an approach once on a single currency pair and then clunking it into your system right away. No, if you want to test to remove the fallibility of your subjective and imperfect human brain, you have to put the work in. That means backtesting each tool you plan to use, comparing them with one another, and testing them in conjunction with each other. Then, when you feel like you’ve backtested thoroughly enough, it’s time to take your tools and your trading system out on the road – but in a demo account. Because forward testing is just as important as backtesting and can be even better at highlighting the weaknesses in a tool or indicator.

All of this is just as true with Japanese candlesticks as it is with any other tool that you’re thinking of using. The advantage of backtesting Japanese candlestick patterns, however, is that any individual pattern actually doesn’t crop up all that often. Not only does this make it quicker to backtest them but also you can backtest a whole slew of patterns all at once, just by picking them out of a chart going back a significant amount of time. Conversely, however, they will take longer to forward test than signals that crop up with greater frequency.

At the end of the day, it’s important to have a good overview of how a particular trading tool works but you should take nobody’s word for anything. Believe neither the proponents of a tool nor the detractors – ultimately, be careful about how much you believe your own subjective thought processes – because nobody is going to tell you as much info as you can learn by putting a tool through a robust testing regimen.

Categories
Crypto Market Analysis

BTC/USD Weekly Chart Analysis + Possible Outcomes

In this week’s BTC/USD analysis, we will be taking an in-depth look at the most recent technical formations, as well as look for the possible short-term price outcomes.

Overview

Bitcoin has had quite a volatile week experienced yet another steep decrease in price as a continuation of the bear retracement after the cryptocurrency couldn’t post new all-time highs with confidence. However, the largest cryptocurrency by market cap has recovered from the decline in a matter of days, with its price over $19,000 once again.

While Bitcoin’s fundamentals only grew stronger as more and more institutional investors acknowledge it as a competitor to gold. This trend of large public companies investing in the best-known cryptocurrency has been seen throughout 2020, and many say that this is the sole reason for the current Bitcoin’s run.

Technical factors


Bitcoin is currently in a steep upwards-facing trend, which brought its price from $17,600 all the way to $19,000. While the channel is way too steep to be considered a long-term option, Bitcoin has the option to follow it for a little bit more, possibly riding the way up to the $19,666 major resistance (and a previous all-time high on Bistamp). This will most likely be the pivot point for Bitcoin, which will decide if it will try to tackle the levels above $20,000 or stay below it and seek support near $19,100.

Likely Outcomes

Bitcoin’s currently sending out very bullish signals, but we included a slightly bearish scenario as well, just to make sure all bases are covered.

1: In case Bitcoin heads further up, its price will most likely stop at the major pivot point, which sits at $19,666. This level is the all-time high from 2017 and is a major resistance level. From here, Bitcoin bulls will have to decide whether they will push towards the upside or remain below this level:

  • In case that the price moves further up, its next possible resistance level (there isn’t much resistance above $20,000, so all possible resistance levels will be extensions of the Fib retracements) is most likely to be sitting at around $20,750.
  • In case the price decides to stay below $19,666, we can expect it to move down and look for support at $19,100 or $18,600 levels.

2: If Bitcoin breaks the ascending channel early and pushes towards the downside, its first strong support level is $19,100 (which it will inevitably break if it pushes down and breaks the channel) and then $18,600.

Entering any short trades could be quite risky at the moment due to the bullish momentum Bitcoin has gathered. However, trading above $20,000 is equally as risky as Bitcoin would be entering a zone with no set resistance and support levels. However, entering long traders is certainly a safer option at the moment.

Categories
Forex Elliott Wave Forex Technical Analysis

EURGBP Soars!, More Gains Ahead?

The EURGBP cross soared on Friday session, surpassing the psychological 0.92 barrier, advancing until the target area forecasted in our previous short-term analysis (here.)

Technical Overview

Our previous analysis discussed the completion of the complex corrective formation identified as a double-three pattern of Minute degree labeled in black, which began on last September 11th at 0.92916 and finished on November 11th at 0.88610. Likewise, after the double-three completion, the cross completed the wave B of Minor degree identified in green.

Once the EURGBP found the bottom at 0.88610, the cross began a rally corresponding to wave C. We have seen in our previous analysis the price completed wave ((ii)) at 0.88667 on November 23rd. After this completion, both the breakout of the descending trendline of the second wave in black and the strong bullish long-body candlestick formation developed in the November 27th session confirmed the start of the third wave in black.

Technical Outlook

During the last trading session of the week, the short-term Elliott wave view for the EURGBP cross exposed in the following 8-hour chart reveals the acceleration in its advance, which surpassed the supply zone between 0.92008 and 0.92181, finding resistance at 0.92298.

The impulsive upward movement observed during Friday’s session allows us to distinguish the completion of the wave ((iii)) at 0.92298 and the beginning of the fourth wave of the same degree.

In this context, the current corrective formation identified as wave ((iv)) in black could decline until the previous supply zone between 0.90686 and 0.90446, where the cross could find fresh buyers. Once the fourth wave completes, the cross should advance in a new rally corresponding to wave ((v)), which would be subdivided into a five-wave sequence. The potential target for the end of wave C is within the next supply zone between 0.92568 and 0.92916.

In summary, the EURGBP cross appears moving in an incomplete wave C of Minor degree, which, in its lesser degree count, shows the beginning of the fourth wave in black. This corrective formation could decline until the previous supply zone is located between 0.90446 and 0.90686. The cross, then, could find fresh buyers expecting the continuation of the trend that would push up the price toward the supply zone between 0.92568 and 0.92916.

Lastly, the invalidation level for this bullish scenario can be found at 0.90031.

Categories
Forex Elliott Wave Forex Market Analysis

EURNZD Consolidates after Bouncing from its Recent Lows

The EURNZD cross is seen consolidating near the extreme bearish sentiment zone backed by the strength of the New Zealand dollar. This consolidation suggests a pause of the downward sequence that began on August 20th and ended heavily oversold after its latest decline that drove it to 1.69472.

Technical Overview

The following 12-hour chart illustrates the short-term markets participants’ sentiment bounded by the 90 high and low range, which shows the price consolidating in the extreme bearish sentiment zone after the cross found support on 1.69472 on November 24th.

Furthermore, the previous chart shows the primary trend outlined a blue trend-line that tells the bias remains mostly bearish. Likewise, the secondary trend represented with the green trend-line exposes the downward acceleration, and, shows also its consolidation range between the levels of 1.69472 and 1.72664.

Finally, as long as the EURNZD cross keeps moving below level 1.72664, the bias will remain bearish, so we could expect further drops, likely below 1.69472. Whereas, the breakout of the extreme bearish zone of 1.72664 to the upside could indicate the start of a recovery.

Short-term Technical Outlook

The short-term outlook for the EURNZD cross under the Elliott Wave perspective is shown in the next 2-hour chart and seen moving in an incomplete downward sequence. The current leg in which is moving corresponds to the wave ((c)) of Minute degree labeled in black.  Within that wave ((c)), the price is advancing in its fourth wave of Minuette degree identified in blue.


We see all that the wave ((c)) of Minute degree labeled in black came after the completion of the wave ((b)), which ends on 1.80212 where the cross found fresh sellers dragging it in an accelerated bearish movement. In this context, the current wave ((c)) should develop an internal structure of five waves.

Right now, the chart shows the action is happening in its fourth wave, in blue, which could be advancing in its internal wave b of Subminuette degree identified in green. This leg could possibly test November’s lows. Likewise, considering that the third wave, in blue, looks like an extended wave, the fourth wave should be complex in price, time, or both. Therefore, the current corrective wave could continue evlving likely until early 2021.

Concerning the fifth wave, in blue, and considering that the third one of the same degree was the extended movement, there are two potential scenarios for the cross:

  • First scenario: the cross fails in its downward sequence finding fresh buyers above the end of the third wave, in blue, at 1.69472.
  • Second scenario: the cross penetrates below 1.69472, creating a new lower low. In this case, this new leg down could continue until the psychological barrier of 1.68.

In summary, the EURNZD cross currently moves in a corrective formation in the extreme bearish sentiment zone. In this context, our principal bias remains neutral until the completion of the fourth wave in blue. Once the cross ends the current consolidation, we could seek short positions following the direction of the fifth wave. Finally, the invalidation level of the bearish scenario locates at 1.73606.

Categories
Forex Market Analysis

Daily F.X. Analysis, December 11 – Top Trade Setups In Forex on Friday! 

On the news front, eyes will remain on the German Final CPI m/m, which are expected to remain unchanged, and it may not drive any major movement in the market. BOE Gov Bailey is due to hold a press conference about the Financial Stability Report in London. Euro Summit also remains in highlight as the heads of state from the European Union countries are due to discuss the banking union and the capital markets union in Brussels.


EUR/USD – Daily Analysis

The EUR/USD closed at 1.21215 after placing a high of 1.21588 and a low of 1.20633. After falling for four consecutive days, the EUR/USD pair rose on Thursday amid the European Central Bank’s latest decision.

On Thursday, the European Central Bank held its interest rates on its main refinancing operations at 0.00%, marginal lending facility at 0.25%, and the deposit facility at -0.50%. ECB said that it would continue to monitor the exchange rate’s developments about their possible implications for the medium-term inflation outlook.

The European Central Bank expanded its massive monetary stimulus program by another 500 billion euros as the second wave of lockdown measures weighed on the euro area’s economic recovery. It also expanded the emergency bond purchases scheme for nine months worth 1.85 trillion euros and aimed to keep firms and governments afloat until the economy was ready to re-open.

Central Bank also announced that it would hold the interest rates at the same level until the inflation outlook comes close to its below 2% target. The additional support to the Eurozone economy from ECB added that the Eurozone economy will now recover quickly. These hopes added strength in the single currency Euro that helped EUR/USD pair to post gains on Thursday. Meanwhile, on the Data front, at 12:45 GMT, the French Industrial Production for October raised to 1.6% against the expected 0.4% and supported the single currency Euro. From the U.S. side, at 18:30 GMT, the CPI for November rose to 0.2% against the estimated 0.1% and supported the U.S. dollar. The Core CPI for November also raised to 0.2% against the expected 0.1% and supported the U.S. dollar. The Unemployment Claims from last week rose to 853K against the forecasted 723K and weighed on the U.S. dollar that added strength in the EUR/USD pair on Thursday.

The U.S. dollar was also weak on Thursday as the Unemployment claims rose from their expected level during last week due to increased restrictive measures in the U.S. and supported the EUR/USD pair’s upward trend. Furthermore, the U.S. dollar came under more pressure after releasing additional stimulus by the European Central Bank. The U.S. lawmakers were also unable to sort out disagreements over aid to state and local governments, holding up a broader spending package. The U.S. dollar weakness added further support to the upward momentum of the EUR/USD pair.

Daily Technical Levels

Support   Resistance

1.2044       1.2133

1.2006       1.2186

1.1954       1.2223

Pivot point: 1.2096

EUR/USD– Trading Tip

The technical side of the EUR/USD continues to remain the same as the pair is trading at 1.2103 level, facing immediate resistance at 1.2160 and 1.2196 level along with a support level of 1.2085. Closing of candles below the 1.2103 level can send the EUR/USD pair further lower until 1.2080 and 1.2040. Euro Summit will remain in highlights, and the choppy session is expected until the release of the event.


GBP/USD – Daily Analysis

The GBP/USD pair was closed at 1.32900 after placing a high of 1.34108 and a low of 1.32453. The GBP/USD pair declined on Thursday as the meeting between PM Boris Johnson and E.U. Commission President Ursula von der Leyen failed to bridge major gaps between them.

PM Boris Johnson offered his ministers to prepare for the strong possibility of a no-deal Brexit. He said that the E.U.’s current offer was unacceptable because the U.K. could not be treated like its twin. He added that the deal offered by the E.U. was not sensible and was unlike any other free trade deal. He said that it was a way of keeping the U.K. locked in the E.U.’s regulatory orbit.

Johnson added a strong possibility that they would have a solution that will be much more like an Australian & Canadian relationship with the E.U. However, after the meeting, the PM Boris Johnson and E.U. Commission President Ursula von der Leyen agreed that a firm decision should be taken about the future of the talks by Sunday. The talks between the E.U.’s top negotiator Michel Barnier and the U.K.’s top negotiator David Frost will resume Brussels. Whereas, Foreign Secretary Dominic Raab said that it was unlikely the negotiations would be extended beyond Sunday.

At 05:30 GMT, the RICS House Price Balance from the U.K. raised 66% against the estimated 64% and supported British Pound. At 12:00 GMT, the Construction Output in October declined to 1.0% against the expectations of 1.2%. The Gross Domestic Product from Great Britain in October remained flat with expectations of 0.4%. The Goods Trade Balance from the U.K. showed a deficit of -12.0B against the forecasted -9.6B and weighed on British Pound and added losses in the GBP/USD pair. The Index of Services for the quarter also dropped to 9.7% against the expected 9.8% and weighed on Sterling and added further losses in GBP/USD pair. The Industrial Production in October surged to 1.3% against the expected 0.3% and supported British Pound. The Manufacturing Production for October also raised to 1.7% against the projected 0.3% and supported British Pound. 

At 18:30 GMT, the CPI for November surged to 0.2% against the anticipated 0.1% and supported the U.S. dollar that added pressure on GBP/USD pair. For November, the Core CPI also rose to 0.2% against the anticipated 0.1% and supported the U.S. dollar and added losses on GBP/USD pair. The Unemployment Claims from last week increased to 853K against the anticipated 723K and weighed on the U.S. dollar.

Moreover, the E.U. outlined contingency measures for a no-deal Brexit that reflected significant uncertainty whether a deal would be in place on January 1, 2021. This also raised the expectations that a Brexit deal might not be reached and weighed on GBP/USD pair on Thursday.

Daily Technical Levels

Support   Resistance

1.3338       1.3466

1.3280       1.3536

1.3209       1.3594

Pivot point: 1.3408

GBP/USD– Trading Tip

The GBP/USD is trading at the 1.3313 level, holding below an immediate resistance level of 1.3322. On the upper side, the GBP/USD pair can lead to a 1.3390 level, and support stays at 1.3269, which is extended by a double bottom level. Selling bias seems dominant, therefore, we should be looking for a sell trade only upon the violation of 1.3265 level. The lagging technical indicators like 50 EMA is suggesting selling bias, thus we should look for selling trades below 1.3400 and upon breakout 1.3265 level too.   


USD/JPY – Daily Analysis

The USD/JPY was closed at 104.212 after placing a high of 104.577 and a low of 104.139. The USD/JPY pair rose in the early trading session on Thursday amid the rising risk sentiment in the market after the stimulus measure from ECB and the vaccine optimism. On Thursday, an independent committee of experts recommended the U.S. Food and Drug Administration to approve the use of Pfizer and BioNtech’s coronavirus vaccine for people over the age of 16. It will be up to the FDA to decide whether to follow the recommendation or not. The agency is anticipated to announce its decision within days, and if it decides to approve the vaccine, then the health care workers could begin receiving the shots almost immediately.

The vaccine optimism in the U.S. raised the risk sentiment in the market as the chances for vaccine approval raised the chance for quick economic recovery and weighed on the safe-haven Japanese Yen, which ultimately added gains in the USD/JPY pair. The European Central Bank announced expanding its debt purchases scheme and further stimulus measures that also added in the market’s risk sentiment and supported the upward trend in the USD/JPY pair after weighing on the safe-haven Japanese Yen.

However, the USD/JPY pair failed to hold its gain on Thursday and started to decline as the U.S. Unemployment claims from last week raised to their highest since September 19 level. The rise in Americans’ jobless claim benefits was due to the states’ increased restrictive measures that halted economic activities. The raised unemployment claims weighed on the U.S. dollar and dragged the USD/JPY pair on the downside. 

On the data front, at 04:50 GMT, the BSI Manufacturing Index for the 4th quarter raised to 21.6 from the expectations of 3.5 and supported the Japanese Yen and weighed on the USD/JPY pair. The Producer Price Index from Japan came in line as expected -2.2%.

From the U.S. side, at 18:30 GMT, the CPI for November rose to 0.2% against the projected 0.1% and supported the U.S. dollar. The Core CPI for November also raised to 0.2% against the estimated 0.1% and supported the U.S. dollar. The Unemployment Claims from last week rose to 853K against the forecasted 723K and weighed on the U.S. dollar that made the USD/JPY pair to lose all of its gains on Thursday.

Daily Technical Levels

Support   Resistance

104.04        104.41

103.86        104.60

103.67        104.78

Pivot Point: 104.23

USD/JPY – Trading Tips

The USD/JPY violation of the symmetric triangle pattern at 104.346 faked out as the safe-haven currency pair reversed trade within the same triangle pattern. The current trading range of the USD/JPY pair remains 104.375 – 103.650, and violation of this range can extend the selling trend until the next support area of 103.200 level. Typically, such a triangle pattern can breakout on either side; this, we should be careful before opening any trade. The market is neutral as investors seem to wind up their positions ahead of the December holidays. Good luck

Categories
Crypto Market Analysis

Daily Crypto Review, Dec 11 – Bitcoin Fighting for $18,000; Crypto Market in the Red

The majority of the cryptocurrency sector has ended up being in the red as Bitcoin spent most of the day under the $18,000 level. Bitcoin is currently trading for $17,920, representing a decrease of 2.91% compared to our last report. Meanwhile, Ethereum’s price has decreased by 4.30% on the day, while XRP managed to lost 2.85%.

 Daily Crypto Sector Heat Map

Freedom Reserve gained 950.51% in the past 24 hours, making it the most prominent daily crypto gainer by far. It is followed by LBRY Credits’s 336.6% and Seigniorage Shares’ 117.99% gain. On the other hand, Basis Cash lost 87.95%, making it the most prominent daily loser. It is followed by xBTC’s loss of 55.09% and IterationSyndicate’s loss of 44.55%.

Top 10 24-hour Performers (Click to enlarge)

Bottom 10 24-hour Performers (Click to enlarge)

Bitcoin’s market dominance has moved up less than half a percent since we last reported, with its value currently being 62.8%. This value represents a 0.2% difference to the upside compared to the value it had when we last reported.

Daily Crypto Market Cap Chart

The cryptocurrency sector capitalization has decreased in the past 24 hours, with its current value being $528.97 46.31 billion. This represents a $17.34 billion decrease when compared to our previous report.

_______________________________________________________________________

What happened in the past 24 hours?

_______________________________________________________________________

_______________________________________________________________________

Technical analysis

_______________________________________________________________________

Bitcoin

Bitcoin has spent most of the day in a price descent after it failed to break the $18,600 mark. BTC bulls tried to pick the price back up but failed, which has caused another mini-dip, which brought the price as low as $17,721 on Bitstamp. The $17,780 level has proven itself as great support once again, and Bitcoin is now trading in a range between it and $18,190.

Due to the amount of support and resistance levels in a narrow price range Bitcoin currently has, a push towards either side could be a possible safe trade to catch.

BTC/USD 2-hour chart

Bitcoin’s short-term technicals are tilted towards the sell-side but show slight signs of neutrality. Its long-time technicals, however, are completely bullish.

BTC/USD 1-day Technicals

Technical factors (4-hour Chart):
  • Price is below both its 50-period and 21-period EMAs
  • Price is close to its bottom Bollinger band
  • RSI is dipping towards being oversold (36.77)
  • Volume is slightly above the average level
Key levels to the upside          Key levels to the downside

1: $18,190                                 1: $17,780

2: $18,600                                 2: $17,500

3: $18,790                                  3: $17,200

Ethereum

Ethereum has quickly stopped in its tracks towards $600 after hitting a brick wall at $581. The rebound pulled its price back below $565, as well as $545, which it is now fighting for. The fact that Ethereum is in a short-term bear run is confirmed by higher volume candles during price drops than during price spikes.

Our call from yesterday regarding Ethereum’s dip after dropping below $565 turned out as predicted. Traders should pay attention to Bitcoin’s movements and the ascending (red) trend line when trading Etheruem.

ETH/USD 2-hour Chart

Ethereum’s short-term technicals are tilted towards the sell-side but show slight neutral signs. However, its long-time technicals are bullish, with its weekly overview being slightly neutral than its monthly overview.

ETH/USD 1-day Technicals

Technical Factors (4-hour Chart):
  • Price is below both its 50-period and 21-period EMAs
  • Price is slightly above its bottom Bollinger band
  • RSI is dipping towards oversold territory (36.18)
  • Volume is slightly above the average level
Key levels to the upside          Key levels to the downside

1: $565                                     1: $545

2: $581                                      2: $525 

3: $600                                      3: $510

Ripple

XRP followed the rest of the crypto sector and made a price dip, which brought its price to the $0.543 level, which held up quite nicely. Its price is now recovering and consolidating between $0.543 and $0.57, with no signs of potential movement to either side.

XRP traders should pay attention to Bitcoin’s price movement, as most cryptocurrencies follow the general market direction it sets.

XRP/USD 2-hour Chart

XRP’s 4-hour and daily overviews show confusing signs, with some indicators being bullish and some bearish. Its long-term technicals are, however, completely bullish.

XRP/USD 1-day Technicals

Technical factors (4-hour Chart):
  • The price is currently below both its 50-period EMA and its 21-period EMA
  • Price is slightly below its middle Bollinger band
  • RSI is neutral (41.75)
  • Volume is slightly above the average level
Key levels to the upside          Key levels to the downside

1: $0.57                                   1: $0.5435

2: $0.6                                       2: $0.5

3: $0.63                                    3: $0.475

Categories
Forex Elliott Wave Forex Technical Analysis

EURJPY Consolidates Expecting the ECB Decision Ahead

The EURJPY cross consolidates in the overnight trading session expecting the ECB interest rate decision statement that will take place before the U.S. opening bell. The analysts’ consensus doesn’t expect changes both in the interest rate that remains at 0.0% and in the deposit facility rate that keeps at -0.50%.

Source: TradingEconomics.com

Technical Overview

The following 8-hour chart shows the EURJPY market participants’ sentiment, where the cross looks consolidating in the extreme bullish zone, developing a flag pattern. This chartist pattern suggests the continuation of the previous movement. In this case, the technical formation could be indicative of further upsides for the following trading sessions.

Moreover, the primary trend identified with the upward trend-line in blue remains on the bullish side. Also, the secondary trendline plotted in green reveals the bullish acceleration of the price action. This market context is confirmed by the EMA(60) to Close Index, with a reading above the level 2.000 that suggests the overbought levels and the potential correction or consolidation of the previous rally.

Short-term Technical Outlook

The EURJPY under the intraday Elliott wave perspective unfolded in its 2-hour chart illustrates the advance in an incomplete corrective rally corresponding to wave ((b)) of Minute degree labeled in black. The internal structure shows the cross advancing in its incomplete wave (c) of Minuette degree marked in blue, suggesting a further upside in the following trading sessions.

At the same time, the previous chart reveals the internal five-wave sequence of wave (c) in blue, which exposes the sideways progress of its fourth wave of Subminuette degree identified in green, which belongs to the wave (c) of Minuette degree. 

In this context, considering that the price action could develop a new upward movement, the cross could advance in its fifth wave in green to the potential target zone between 126.84 and 127.48, where the EURJPY cross could complete the wave (c) in blue, and the wave ((b)) in black. Likewise, once this corrective rally completes, the price could start to develop a downward movement identified as wave ((c)) in black.

In this regard, according to the Elliott Wave theory and considering that the mid-term structure corresponds to an incomplete corrective formation constituted by a three-wave sequence, after the completion of the wave ((b)) in black, the price should start to decline in its wave ((c)) with an internal structure subdivided into a five-wave sequence.

Summarizing, the EURJPY cross currently develops a consolidation pattern, which leads to expect a new upward movement with a potential target between 126.84 and 127.48. Once the price completed its target, the cross may start to decline in a five-wave sequence corresponding to wave ((c)) of Minute degree.

Finally, the invalidation level of the current bullish scenario can be found at 124.566.

Categories
Forex Signals

USD/CAD Sideways Channel Remains Intact – Brace to Trade Breakout! 

The USD/CAD pair was closed at 1.28179 after placing a high of 1.28332 and a low of 1.27691. The USD/CAD pair was choppy on Wednesday as it dropped to weekly lows in the early session but recovered all of its losses in the late session. The Bank of Canada released its interest rate decision on Wednesday that drove the USD/CAD pair lower in early trading hours. Later the crude oil prices and the strength of the US dollar pushed the pair higher on board.

On Wednesday, the Bank of Canada held rates at 0.25% and reiterated intentions to keep interest rates at the same level until at least 2023 as the Canadian economic recovery from the coronavirus pandemic was proceeding in line with the expectations.

The Bank said that the new infections and lockdowns continue to hold back the Canadian economy. Bank also mentioned that stronger demand for energy sources had pushed oil prices to boost the Canadian dollar. As well, the looming vaccines rolling out were also helping the Canadian dollar.

The Bank of Canada said that the news on the development of effective vaccines provided reassurance that the pandemic will end and more normal activities will resume, although the pace and breadth of the global rollout of vaccinations remain uncertain. However, there were no surprises on Wednesday from the Bank of Canada that weighed on Loonie and supported the upward trend in the USD/CAD pair.

Meanwhile, the declining crude oil prices on Wednesday after the release of US Crude oil stockpiles data weighed on Loonie. For the last week, the US crude oil inventories raised to 15.2M against the expectations of -0.9M and weighed on crude oil prices that added losses in the commodity-linked currency Loonie and supported the upward momentum in the USD/CAD pair.

Moreover, the US dollar was also strong on Wednesday amid multiple reasons, including deteriorated risk sentiment from Pfizer’s vaccine adverse reaction on two people, faded hopes for quick delivery of second round of US stimulus measure, and the rising safe-haven demand after the increased number of coronavirus cases in the US. The strong US dollar also helped the USD/CAD pair’s gains to persist in the market on Wednesday.

On the data front, at 20:00 GMT, the Final Wholesale Inventories for October raised to 1.1% against the projected 0.9% and weighed on the US dollar. The JOLTS Job Opening for October also surged to 6.65M against the estimated 6.30M and supported the US dollar that added further gains in the USD/CAD pair. On the data front, at 20:00 GMT, the Final Wholesale Inventories for October raised to 1.1% against the projected 0.9% and weighed on the US dollar. The JOLTS Job Opening for October also surged to 6.65M against the estimated 6.30M and supported the US dollar that added further gains in the USD/CAD pair.


Daily Technical Levels

Support Resistance

1.2787 1.2852

1.2745 1.2875

1.2722 1.2917

Pivot point: 1.2810

The USD/CAD pair is trading sideways at the 1.2789 level due to a lack of market volatility. On the lower side, the support holds around the 1.2770 level, whereas the bullish trend continuation can extend the buying trend until the next resistance level of 1.2835. We may not see a further trend in the pair until this range gets violated. On the lower side, a bearish breakout of the 1.2770 level can extend selling bias until the 1.2720 level. It seems like investors are waiting for a solid fundamental to determine further moves in the market. Let’s look for selling below 1.2836 and buying over 1.2770 level today. Good luck! 

Categories
Forex Market Analysis

Daily F.X. Analysis, December 10 – Top Trade Setups In Forex – Eyes on ECB Policy Decision! 

On the news front, it’s going to be an important day for the Euro and U.S. dollar as investors await the Main Refinancing Rate and the U.S. CPI figures during the European and the U.S. session. The ECB monetary policy decision, especially the Main Refinancing Rate, is expected to remain unchanged while the Inflation figures can support the U.S. dollar today.

Economic Events to Watch Today  


EUR/USD – Daily Analysis

The EUR/USD pair was closed at 1.20811 after placing a high of 1.21471 and a low of 1.20585. On Wednesday, the currency pair EUR/USD continued its bearish trend for the fourth consecutive day amid the deteriorated risk sentiment and higher U.S. yields that supported the greenback. The U.S. dollar was strong on Wednesday as the U.S. Dollar Index (DXY) rose above the 91.00 level, which was the highest in two days. The coronavirus situation in the U.S. has escalated to an alarming level as more than 200,000 Americans tested positive for the coronavirus every day on average. The total number of infections in the U.S. has surpassed 15 million.

Dr. Anthony Fauci, the nation’s top infectious disease expert, warned on Monday that the country was likely to see a Thanksgiving-related spike in coronavirus cases and hospitalizations in another week or so, in the middle of Hanukkah and just ahead of Christmas. The rising number of coronavirus cases in the U.S. raised the appeal for safe-haven and supported the greenback that ultimately added losses in EUR/USD pair.

Meanwhile, another reason for the continuous losses in the EUR/USD pair was the latest news from Great Britain about the coronavirus vaccine. On Wednesday, Britain’s health officials warned people with significant allergies to avoid receiving the Pfizer-BioNtech vaccine as two people reported an adverse reaction.

On the data front, at 12:00 GMT, the German Trade Balance for October showed a surplus of 18.2B against the expected 18.7B and weighed on Euro. From the U.S. side, at 20:00 GMT, the Final Wholesale Inventories for October surged to 1.1% against the forecasted 0.9% and weighed on the U.S. dollar. The JOLTS Job Opening for October also rose to 6.65M against the expected 6.30M and supported the U.S. dollar that added further losses in EUR/USD pair.

The U.S. dollar was also strong onboard after the hopes for further stimulus package were diminished with the White House’s latest proposal. Steven Mnuchin submitted a proposal on Wednesday worth $916 billion. The offer included only $40 billion towards unemployment benefits that were far less than the amount proposed in the package from a bipartisan group of lawmakers worth $180 billion. Democrats rejected the proposal as they have been trying since the CARES ACT for additional financial aid for laid-off workers.

This new proposal from the Trump administration gave mixed signals in the market. Some believed that the stalemate between Republicans & Democrats would remain intact for long to reach a deal. Others believed that the White House has reengaged in talks for the first time since the election and that it was a positive sign that a compromise could be reached before the end of the year. All the stimulus uncertainty added strength to the U.S. dollar and weighed on the riskier EUR/USD pair on Wednesday.

Daily Technical Levels

Support   Resistance

1.2042     1.2131

1.2006     1.2184

1.1954     1.2220

Pivot point: 1.2095

EUR/USD– Trading Tip

The technical side of the EUR/USD continues to remain the same as the pair is trading at 1.2103 level, facing immediate resistance at 1.2160 and 1.2196 level along with a support level of 1.2085. Closing of candles below the 1.2103 level can send the EUR/USD pair further lower until 1.2080 and 1.2040. However, the focus is likely to stay on the ECB monetary policy decision, especially the Main Refinancing Rate, which is expected to remain unchanged. The choppy session is expected until the release of the ECB report.


GBP/USD – Daily Analysis

The GBP/USD pair was closed at 1.34060 after placing a high of 1.34778 and a low of 1.33455. The GBP/USD pair ended its day in positive territory on Wednesday and climbed above 1.34700 as the final round of talks between UK PM Boris Johnson and the European Commission President Ursula von der Leyen started.

Ahead of the talks, the U.K. Pm Boris Johnson said that the E.U. insisted on terms that no prime minister could accept in EU-UK trade talks. The PM said that a good deal was still there to be done as the E.U. sought an automatic right to retaliate against the U.K. if its labor and environmental standards diverge from theirs. PM Boris Johnson also said that the E.U. could not accept the U.K. as having sovereign control over its fishing waters after Brexit. Major disagreements remain over fisheries, business competition rules, and governance issues.

PM Boris Johnson said that a deal would not be possible if the E.U. insisted that if a new law is passed in the future and if the U.K. did not follow suit, then the E.U. wanted an automatic right to punish the U.K. and retaliate. He also claimed that the E.U. wanted the U.K. to become the only country in the world not to have sovereign control over its fishing waters. He said that he would not believe that any prime minister of this country could accept under these terms. However, German Chancellor Angela Merkel has said that a Brexit deal was still possible but insisted that the E.U. single market’s integrity must be respected.

On Wednesday, PM Boris Johnson arrived in Brussels to find common grounds on significant differences that have stalled the talks for eight months. Over the past couple of days, the optimism has increased that a deal might reach as both sides have successfully reached a post-Brexit arrangement in principle over the Irish border. This optimism kept the British Pound on the upside ahead of the talks and pushed the GBP/USD pair higher. Both sides have confirmed that these final talks’ decision will be revealed on Sunday, and this statement forced investors to lose some of its early daily gains.

Meanwhile, on the USD front, the U.S. dollar was strong across the board. The risk sentiment deteriorated, and safe-haven appeal emerged after the rising number of coronavirus cases posted global economic recovery threats despite the vaccine development. The total number of infections in the U.S. surpassed 15 million on Wednesday, and it was reported that almost 200,000 Americans were tested positive for coronavirus every day in the U.S.

Furthermore, the British Pound lost some of its gains in the late trading session on Wednesday after Britain’s top medical adviser warned people with significant allergies to avoid having Pfizer and BioNtech’s vaccine shots as they could give an adverse reaction. On Wednesday, two people were reported to have an adverse reaction to Pfizer’s coronavirus vaccine in Great Britain and weighed on the local currency that capped further gains in GBP/USD pair.

Daily Technical Levels

Support   Resistance

1.3301     1.3453

1.3236     1.3542

1.3148     1.3606

Pivot point: 1.3389

GBP/USD– Trading Tip

The GBP/USD is trading at 1.3378, holding below an immediate resistance level of 1.3395. On the higher side, the GBP/USD pair can lead to a 1.3437 level, and support stays at 1.3340, which is extended by an upward trendline. Overall it’s an ascending triangle, and it typically breaks on the higher side; thus, we can expect the GBP/USD price to move until 1.3435.


USD/JPY – Daily Analysis

The USD/JPY pair was closed at 104.231 after placing a high of 104.403 and a low of 104.050. USD/JPY pair extended its gains for the second consecutive day on Wednesday as the U.S. dollar gained traction on the day. The hopes for the second round of massive stimulus package from Congress decreased n Wednesday after the Trump administration came up with a new proposal. The U.S. Secretary State Steven Mnuchin submitted a new proposal for an economic relief package that would offer far fewer unemployment benefits than what has been offered by a bipartisan group of lawmakers.

The unemployment benefits for millions of jobless Americans would be delivered as $180 billion under the framework proposed by a bipartisan group of lawmakers. But in contrast to this, the new package submitted by the Trump administration included $40billion in new funding for unemployment benefits.

The bipartisan effort of $908 billion packages has brought the Democrats and Republicans closer to a compromise on a coronavirus package. However, the new White House proposal of $916 billion was a sharp rejection from Democrats as the White House’s proposal was strongly criticized by House Speaker Nancy Pelosi and Senate Minority Leader Charles E. Schumer in a joint statement.

Meanwhile, on Wednesday, the U.S. House of Representatives agreed on a one-week extension of federal government funding that would give lawmakers more time to agree on a massive coronavirus relief package. However, the Senate Majority leader Mitch McConnell said that lawmakers were still looking forward to a relief package.

These developments raised the uncertainty related to the U.S. stimulus package, supported the U.S. dollar, and supported the USD/JPY pair’s upward trend.

Meanwhile, on the data front, At 04:50 GMT, the Core Machinery Orders for October raised to 17.1% against the forecasted 2.6% and supported the Japanese Yen. The M2 Money stock for the year from Japan also raised to 9.1% against the estimated 8.9% and supported the Japanese yen that capped further gains in the USD/JPY pair.

On the U.S. front, at 20:00 GMT, the Final Wholesale Inventories for October rose to 1.1% against the anticipated 0.9% and weighed on the U.S. dollar. The JOLTS Job Opening for October also raised to 6.65M against the projected 6.30M and supported the U.S. dollar that added further gains in the USD/JPY pair.

Daily Technical Levels

Support   Resistance

104.10      104.44

103.90      104.60

103.75      104.79

Pivot point: 104.25

USD/JPY – Trading Tips

The USD/JPY has violated the symmetric triangle pattern at 104.346, and it opens further odds of buying until the 104.750 level. The pair has recently disrupted the sideways trading series of 104.200 – 103850. Now it’s trading at 104.300 level, especially after bouncing off over 103.700 level on the lower side, supporting the pair nearby 103.700 mark. On the downside, the USD/JPY may find support at the 103.200 level upon a bearish breakout of the 103.750 support level. While resistance stays at 104.700 today. Good luck

Categories
Crypto Market Analysis

Daily Crypto Review, Dec 10 – Bitcoin Bulls Back in the Game as Sector Recovers From The Dip

The cryptocurrency sector is mostly green as cryptocurrencies took the day to recover from the sudden drop that occurred on Dec 8. Bitcoin is currently trading for $18,411, representing an increase of 1.25% compared to our last report. Meanwhile, Ethereum’s price has increased by 3.37% on the day, while XRP managed to gain 4.66%.

 Daily Crypto Sector Heat Map

WinCash gained 207.65% in the past 24 hours, making it the most prominent daily crypto gainer by far. It is followed by Nyan V2’s 181.02% and Pamp Network’s 172.94% gain. On the other hand, DMme lost 68.63%, making it the most prominent daily loser. It is followed by ALL BEST ICO’s loss of 64.69% and Moonday Finance’s loss of 54.48%.

Top 10 24-hour Performers (Click to enlarge)

Bottom 10 24-hour Performers (Click to enlarge)

Bitcoin’s market dominance has moved to the downside just under half a percent since we last reported, with its value currently being 62.6%. This value represents a 0.4% difference to the downside compared to the value it had when we last reported.

Daily Crypto Market Cap Chart

The cryptocurrency sector capitalization has increased significantly in the past 24 hours, with its current value being $546.31 billion. This represents a $10.23 billion increase when compared to our previous report.

_______________________________________________________________________

What happened in the past 24 hours?

_______________________________________________________________________

_______________________________________________________________________

Technical analysis

_______________________________________________________________________

Bitcoin

Bitcoin has spent the day slowly moving up after a sharp price descent, which brought it to $18,000. After establishing itself above $18,190, Bitcoin even tried to push further up above $18,600 but failed almost instantly, making its price go back to previous levels.

We want to point out (once again) Micheal van de Poppe’s call of a large CME gap looming between $18,275 and $16,995.

Due to the amount of support/resistance levels Bitcoin currently has, any push towards either the upside or downside could be a possible safe trade in the same direction.

BTC/USD 2-hour chart

Bitcoin’s daily, weekly, and monthly technicals are completely tilted towards the buy-side and show no bearish signs. Its 4-hour overview, however, is completely bearish.

BTC/USD 1-day Technicals

Technical factors (4-hour Chart):
  • Price is below both its 50-period and 21-period EMAs
  • Price is between its middle and bottom Bollinger band
  • RSI is has recovered from being oversold (43.38)
  • Volume is slightly above average
Key levels to the upside          Key levels to the downside

1: $18,600                                 1: $18,190

2: $18,790                                 2: $17,780

3: $19,000                                  3: $17,200

Ethereum

Ethereum has not only recovered from its drop to $530, where it hit the ascending (red) trend line but pushed back towards $600. Even though the price is not yet ready to tackle this resistance level, it has made an attempt to break the $581 level but failed and returned to the $565 one.

Ethereum traders should pay attention to whether the cryptocurrency will end up above or below $565, which may be an indicator of its short-term movement. Traders should also pay attention to Bitcoin’s movement whenever taking a trade with Ethereum.

ETH/USD 2-hour Chart

Ethereum’s daily and monthly technicals are completely tilted towards the buy-side and show no signs of bearishness. However, its 4-hour overview is completely bearish, while its weekly overview is bullish but shows slight neutrality as well.

ETH/USD 1-day Technicals

Technical Factors (4-hour Chart):
  • Price is below both its 50-period and 21-period EMAs
  • Price is slightly below its middle Bollinger band
  • RSI has recovered from being in the oversold territory (42.83)
  • Volume is slightly above average
Key levels to the upside          Key levels to the downside

1: $565                                     1: $550

2: $581                                      2: $525 

3: $600                                      3: $510

Ripple

XRP made a sharp (to the upside) price recovery as well, with its price pushing past $0.5435, as well as its $0.57 resistance (now support) levels. The fourth-largest cryptocurrency by market cap even tried to break $0.6 but got shut down swiftly. Its price is now consolidating slightly above $0.57 and showing no signs of potential dips.

XRP traders (finally) have the option to trade this cryptocurrency after several days of close-to-no volatility. Keeping track of Bitcoin’s movements when trading XRP is a must, as any change in Bitcoin’s price could change the outlook of the market as a whole.

XRP/USD 2-hour Chart

XRP’s daily, weekly, as well as monthly technicals, are completely tilted towards the buy-side and show no signs of neutrality or bearishness. Its 4-hour overview, on the other hand, is bearish with slight signs of neutrality.

XRP/USD 1-day Technicals

Technical factors (4-hour Chart):
  • The price is currently slightly below both its 50-period EMA, as well as its 21-period EMA
  • Price is slightly below its middle Bollinger band
  • RSI is neutral and recovered from being oversold (47.26)
  • Volume is slightly above average
Key levels to the upside          Key levels to the downside

1: $0.57                                   1: $0.5435

2: $0.6                                       2: $0.5

3: $0.63                                    3: $0.475

Categories
Forex Elliott Wave Forex Market Analysis

GBPUSD Ending Diagonal Completion a Warning Sign for a Trend Reversal?

In our last GBPUSD analysis, we discussed its upward advance in an incomplete ending diagonal pattern. We said that the terminal Elliott wave formation progressed in its fifth wave of Minuette degree identified in blue that belongs to a wave ((c)) of Minute degree labeled in black. Likewise, the wave ((c)) corresponds to the third internal segment of the wave B of Minor degree identified in green. 

Technical Overview

The big picture unveiled the sideways movement in an incomplete corrective formation, which could correspond to an expanding flat pattern. In this regard, after the completion of wave B, the Sterling should start developing wave C, which should lead to a decline of this major pair in a five-wave internal sequence.

On the other hand, the following 8-hour chart reveals the market participants’ sentiment unfolded by the 90-day high and low range, which looks advancing in the extreme bullish sentiment zone. 

The previous chart illustrates the bullish failure in the Wednesday trading session, which couldn’t strike the last high of 1.35394. This failure added to the breakdown of the previous upward trendline plotted in green leads us to expect further declines in the coming trading sessions, likely to the ascending primary trend-line identified in blue.

Short-term Technical Outlook

The intraday Elliott wave view for the GBPUSD pair displayed by the following 2-hour chart exposes the breakdown of the ending diagonal pattern formed on December 07th, confirming the completion of the terminal formation unveiled in the wave ((c)) identified in black. 

Once the Pound found the intraday support at 1.32238, the price action began to bounce in an internal corrective rally subdivided in a three-wave sequence corresponding to wave ((ii)) in black, founding resistance at 1.34779 on the Wednesday trading session.

In this regard, the breakdown of the intraday trend-line that connects the waves ((i)) and (b) should confirm the downward progress of its wave ((iii)) in black, which according to the Elliott wave theory, should be the largest wave of the downward sequence.

The third wave in black could find support in the demand zone between 1.31296 and 1.31064. If the price action continues deteriorating, the Cable could drop toward the next demand zone between 1.29843 and 1.29144.

Summarizing

After the GBPUSD pair made a breakdown of its ending diagonal pattern, is currently moving in a corrective rally corresponding to wave ((ii)), which should give way to a new decline corresponding to the third wave of Minute degree. According to the textbook, this movement should be the largest decline of the current downward sequence and could find support in the demand zone between 1.31296 and 1.31064. Finally, the invalidation level of the current bearish scenario can be found at 1.35394.

Categories
Forex Signals

USD/CHF Violates Descending Triangle Pattern – Brace for a Sell Signal! 

During Wednesday’s trading session, the USD/CHF currency pair failed to stop its previous-day bearish bias and remained pessimistic around below the 0.8900 level. However, the reason for the bearish tone around the currency pair could be associated with the broad-based U.S. dollar weakness. The U.S. dollar was being pressured by the optimism over the potential vaccine for the hazardous coronavirus infection, which urges investors to retreat from the safe-haven assets. 

Apart from this, the U.S. dollar losses could also be attributed to the on-going concerns of further monetary easing by the U.S. Federal Reserve, which adds burden around the U.S. dollar and contributes to the currency pair losses. On the contrary, the upbeat market sentiment boosted investors’ confidence and undermined the safe-haven Swiss Franc, which, in turn, was seen as one of the leading factors that help the USD/CHF currency pair to limit its deeper losses. Currently, the USD/CHF currency pair is currently trading at 0.8879 and consolidating in the range between 0.8871 – 0.8897.

The equity market had been flashing green since the Asian session started. The reason could be associated with the major positive catalysts. Be it the renewed probabilities of the U.S. aid package or optimism over treatment for the highly infectious coronavirus, both factors have favored the market trading sentiment. Therefore, the risk-on market mood tends to undermine the safe-haven Swiss franc, which becomes the key factor that lends some support to the currency pair to ease the intraday bearish pressure surrounding the USD/CHF currency pair.

The hopes of potential vaccines were further boosted after the U.K.’s has started vaccination, witnessed after the 1st-patients inoculated with BNT162b2, the COVID-19 vaccine co-developed by Pfizer (NYSE: PFE) and BioNTech SE (F:22UAy). In addition to this, the sentiment around the equity market was improved further after House Speaker Nancy Pelosi told that the stimulus discussions had made good progress. Meanwhile, the U.S. Treasury Secretary Steve Mnuchin offers a larger amount than the previously highlighted $908 billion for the stimulus package. 

At the USD front, the broad-based U.S. dollar failed to stop its bearish trend and remained depressed on the day as doubts persist over the U.S. economic recovery from COVID-19. Besides this, the risk-on market sentiment, backed by the optimism over a potential vaccine for the highly contagious coronavirus disease, also played its major role in undermining the safe-haven U.S. dollar. Besides this, the U.S. dollar losses could also be attributed to the concerns of further monetary easing by the U.S. Federal Reserve, which tends to undermine the American currency. However, the losses in the U.S. dollar becomes the key factor that kept the currency pair lower. Meantime, the U.S. Dollar Index, which tracks the greenback against a bucket of other currencies, dropped to 90.778.

Conversely, the optimism around the equity market was slightly unaffected by the intensifying market worries regarding the continuous surge in new coronavirus cases in the U.S. and Europe, which fueled the global economic recovery concerns imposing new lockdown restrictions on economic and social activity. Furthermore, the equity market gains were also capped by the lingering uncertainty over the Brexit deal and intensified China-US tussles over the U.S. sanctions on Chinese diplomats and the arrest of the Hong Kong opposition party members by police.

Moving ahead, the market traders will keep their eyes on the U.S. stimulus headlines and vaccine news. In the meantime, the updates surrounding the Brexit trade talks and the Sino-US tussle could not lose their importance on the day.

Daily Support and Resistance

S1 0.8767

S2 0.8839

S3 0.8874

Pivot Point 0.8911

R1 0.8946

R2 0.8982

R3 0.9054

Technically, the USD/CHF pair is gaining support above the 0.8875 mark, and it’s triggered an upward wave to achieve a 23.6% Fibonacci retracement mark of 0.8935. On the further higher front, an upward movement and violation of 0.8933 mark can drive more buying trend unto next Fibo level of 61.8% at 0.8965. However, the pair has formed a descending triangle pattern which, if violated, can send the pair until the 0.8835 level. Check out a trading plan below. 

Entry Price – Sell 0.88778

Stop Loss – 0.89178

Take Profit – 0.88378

Risk to Reward – 1:1

Profit & Loss Per Standard Lot = -$400/ +$400

Profit & Loss Per Micro Lot = -$40/ +$40

Fellas, now you can check out forex trading signals via Forex Academy mobile app. Follow the links below.

iPhone Users: https://apps.apple.com/es/app/fasignals/id1521281368

Andriod Users: https://play.google.com/store/apps/details?id=academy.forex.thesignal&hl=en_US

Categories
Forex Market Analysis

Daily F.X. Analysis, December 09 – Top Trade Setups In Forex – Brace for BOC Policy! 

On the news front, the economic calendar is filled with the Bank of Canada’s policy rate. The BOC is expected to keep the Overnight Rate rate unchanged at 0.25%, which is likely to drive no major change in the Loonie. The BOC Rate Statement will be worth watching to determine further moves in CAD.

Economic Events to Watch Today  


EUR/USD – Daily Analysis

The EUR/USD closed at 1.21044 after placing a high of 1.21337 and a low of 1.20952. EUR/USD pair fell on Tuesday for the third consecutive session but remained under consolidation in a tight range. The EUR/USD pair avoided major losses as the Euro remained appealing due to broad weakness in the U.S. dollar. The U.S. Dollar Index fell to its two and a half years lowest level on Tuesday and capped further losses in the EUR/USD pair. The U.S. dollar was weak on Tuesday as the country crossed the threshold of 15 million coronavirus cases, which was the world’s highest total. American hospitals braced to ration care amid staff shortages and warned about the rampant spread of the disease.

Pennsylvania’s governor Tom Wolf said that the coronavirus was running extensively throughout the state and could soon reach the level where hospitals will begin turning away patients. He also said that additional pandemic restrictions might be on controlling the spread of the virus.

Meanwhile, the talks for the second round of coronavirus relief stimulus between Democrats and the Republicans and the agreement of both parties over the bipartisan proposal of a $908 billion stimulus package also weighed on the U.S. dollar. Due to stimulus hopes and the rising number of coronavirus cases, the weak U.S. dollar capped further downside in the EUR/USD pair on Tuesday.

On the data front, at 11:30 GMT, the French Final Private Payrolls for the quarter raised to 1.6% against the expected -1.0% and supported the single currency Euro. At 12:45 GMT, the French Trade Balance showed a deficit of -4.8B against the expected -5.5B and supported Euro. At 15:00 GMT, the quarter raised the Final Employment Change to 1.0% against the forecasted 0.9% and supported Euro. The Revised GDP for the quarter dropped to 12.5% against the expected 12.6% and weighed on Euro. The ZEW Economic Sentiment raised in December to 54.4 against the estimated 37.5 and supported Euro. The German ZEW Economic Sentiment also surged to 55.0 from the projected 45.9 and supported Euro.

From the U.S. side, at 01:00 GMT, the Consumer Credit for October fell to 7.2B against the projected 17.6B and weighed on the U.S. dollar and capped further losses in EUR/USD pair. At 16:00 GMT, the NFIB Business Index fell to 101.4 against the estimated 102.6 in November and weighed on the U.S. dollar that capped further losses in the EUR/USD pair.

At 18:30 GMT, the Revised Nonfarm Productivity for the quarter declined to 4.6% against the expected 4.9% and supported the U.S. dollar and supported the downward momentum in EUR/USD pair. The Revised Unit Labor Costs for the quarter came in as -6.6% against the estimated -8.9% and supported the U.S. dollar. 

At 20:00 GMT, the IBD/TIPP Economic Optimism came in as 49.0 in December compared to the previous 50.0.

Moreover, the Euro remained comparatively appealing due to a more optimistic outlook of the Eurozone’s economy than the U.S. that capped further losses in the EUR/USD pair. The ECB’s policy decision is scheduled for Thursday. If the ECB takes a more hawkish tone, then Euro will rise and vice versa.

Daily Technical Levels

Support   Resistance

1.2086        1.2125

1.2071       1.2149

1.2046       1.2165

Pivot point: 1.2110

EUR/USD– Trading Tip

The EUR/USD is trading at 1.2127 level, finding an immediate resistance at 1.2160 and 1.2196 level along with a support level of 1.2085. Closing of candles underneath the 1.2103 level can send the EUR/USD pair further lower until 1.2080 and 1.2040. However, the focus is likely to stay on the German Trade Balance, which is due during the European session. Choppy session expected until economic figures show major deviations. The MACD is mixed, suggesting bearish; therefore, the idea will be to open a sell trade below the 1.2175 level today to capture quick green pips. 


GBP/USD – Daily Analysis

The GBP/USD pair closed at 1.33564 after placing a high of 1.33935 and a low of 1.32894. The GBP/USD pair fell on Tuesday for the third consecutive day amid the rising Brexit uncertainty that took its toll on British Pound. The mixed comments from various officials from both sides raised the uncertainty in the market related to the Brexit deal and weighed on British Pound. The British Cabinet Minister Michael Gove announced that they had reached an agreement in principle. The E.U.’s chief negotiator Michel Barnier told European ministers that a deal’s chances were very thin. At the same time, German Minister Michael Roth said there was no substantial progress in the trade talks between the E.U. and the U.K. He added that it was uncertain whether Britain and the E.U. could reach a trade deal.

All this uncertainty in the market weighed on the British Pound and dragged the pair GBP/USD on the downside. Another factor involved in the GBP/USD pair’s downward momentum was the latest move by the U.K. government to drop parts of its controversial internal market bill that paved the way for both sides to meet in Brussels on Wednesday to settle an agreement.

The U.K. government reached a post-Brexit arrangement in principle over the Irish border with the European Union after agreeing to ditch the most controversial parts of its internal markets bill. On Tuesday, the U.K. government said that it would abandon all the Brexit clauses relating to Northern Ireland in the internal market bill in exchange for promises by the E.U. to minimize checks and control due to being imposed on food and medicines going into Northern Ireland from Great Britain from January 01.

A deal on Ireland is reached between the E.U. and the U.K. it was not one of the key sticking points that have held the Brexit talks hostage. The Brexit talks will enter a last decisive phase from Wednesday as the PM Boris Johnson has prepared to travel to Brussels on that day to secure a deal over the European Union’s relations with the U.K. If he failed to reach an agreement with the E.U. It would mean that from the start of next year, the tariffs would be applied to some trade between the U.K. and the E.U. for the first time in almost half a century. U.K. sends almost 43% of its exports to the trade bloc E.U. and tariffs on its exports will be harmful to its economy. Failure to reach a deal will also end many cooperation types between the U.K. and the E.U. over crime, security, and travel.

The British Pound remains under pressure on Tuesday ahead of the final round of talks between PM Johnson and E.U. Commission President Ursula von der Leyen on Wednesday. On the data front, at 05:01 GMT, the BRC Retail Sales Monitor for the Year raised to 7.7%against the forecasted 5.0% and supported British Pound, and capped further losses in GBP/USD pair.

From the U.S. side, at 01:00 GMT, the Consumer Credit for October declined to 7.2B against the estimated 17.6B and weighed on the U.S. dollar. At 16:00 GMT, the NFIB Business Index declined to 101.4 against the expected 102.6 in November and weighed on the U.S. dollar.

At 18:30 GMT, the Revised Nonfarm Productivity for the quarter fell to 4.6% against the expected 4.9% and supported the U.S. dollar. The Revised Unit Labor Costs for the quarter came in as -6.6% against the projected -8.9% and supported the U.S. dollar. At 20:00 GMT, the IBD/TIPP Economic Optimism came in as 49.0 in December compared to the previous 50.0.

Daily Technical Levels

Support   Resistance

1.3297       1.3400

1.3242       1.3448

1.3193       1.3504

Pivot point: 1.3345

GBP/USD– Trading Tip

The GBP/USD is trading at 1.3378, holding below an immediate resistance level of 1.3395. On the higher side, the GBP/USD pair can lead to a 1.3437 level, and support stays at 1.3340, which is extended by an upward trendline. Overall it’s an ascending triangle, and it typically breaks on the higher side; thus, we can expect the GBP/USD price to move until 1.3435.


USD/JPY – Daily Analysis

The USD/JPY pair closed at 104.161 after placing a high of 104.204 and a low of 103.953. The pair posted gains on Tuesday as the market’s risk sentiment improved due to a combination of factors.

The news that Great Britain has started using the Pfizer vaccine on patients from Tuesday increased the risk-on sentiment as the hopes for economic recovery increased. Another factor involved in the rising risk-on sentiment was the rising hopes that the U.S. will soon deliver the second round of stimulus measures.

On late Monday, the Chinese Foreign Minister, Wang Yi, said that Beijing was open to restarting its relationship with the U.S. He also declared that both countries were at a critical historical stage after a year of intensifying tensions. Wang said that U.S. policy on China needed to return to objectivity and rationality. He also said that both sides should struggle to restart the dialogue and get back on the right track and rebuild mutual trust in the next Sino-US relations phase. Wang blamed the growing division between the world’s two biggest economies on some Americans with outdated Cold War mentality and ideological preconceptions. All these developments in vaccine usage, rising hopes for stimulus, and the U.S. and China relationship raised the risk sentiment that weighed heavily on the safe-haven Japanese Yen that ultimately supported the USD/JPY pair on Tuesday.

On the data front, at 04:30 GMT, the Average Cash Earnings for the Year came in as -0.8% against the expected -0.7% and weighed on the Japanese Yen. The Household Spending for the Year dropped to 1.9% against the forecasted 2.7% and weighed on the Japanese Yen and added gains in the USD/JPY pair. At 04:50 GMT, the Bank Lending for the Year came in line with the expectations of 6.3%. The Current Account Balance from Japan showed a surplus of 1.98T against the forecasted 1.83T for October and supported the Japanese Yen.

The quarter’s final GDP also raised to 5.3% against the expected 5.0% and supported the Japanese Yen. AT 04:52 GMT, the Final GDP Price Index for the Year raised to 1.2% against the forecasted 1.1% and supported the Japanese Yen. At 10:00 GMT, the Economic Watchers Sentiment dropped to 45.6 against the expected 52.7 and weighed on the Japanese Yen that supported the USD/JPY pair’s upward trend.

From the U.S. side, at 01:00 GMT, the Consumer Credit for October fell to 7.2B against the estimated 17.6B and weighed on the U.S. dollar. At 16:00 GMT, the NFIB Business Index fell to 101.4 against the estimated 102.6 in November and weighed on the U.S. dollar. At 18:30 GMT, the Revised Nonfarm Productivity for the quarter declined to 4.6% against the forecasted 4.9%, supported the U.S. dollar, and added further gains in the USD/JPY pair. The Revised Unit Labor Costs for the quarter came in as -6.6% against the projected -8.9% and supported the U.S. dollar and supported the USD/JPY pair’s upside momentum. At 20:00 GMT, the IBD/TIPP Economic Optimism came in as 49.0 in December than the previous 50.0.

Meanwhile, the USD/JPY pair’s gains remained limited as the U.S. dollar was under pressure as the country crossed 15 million coronavirus cases, which was the world’s highest total. American hospitals started to give warnings about the staff shortage and extensive spread of the disease. Pennsylvania’s governor Tom Wolf said that the coronavirus was spreading extensively throughout the state and could soon reach the level where hospitals will begin turning away patients. He also said that additional pandemic restrictions might be on controlling the spread of the virus.

Daily Technical Levels

Support   Resistance

104.00       104.27

103.84       104.38

103.73       104.54

Pivot point: 104.11

USD/JPY – Trading Tips

The USD/JPY is trading within a symmetric triangle pattern observed in the 4-hour timeframe. The pair recently disrupted the sideways trading series of 104.600 – 104.200, and now it’s trading at 104.300 level, especially after bouncing off over 103.700 level on the lower side, supporting the pair nearby 103.700 mark. On the downside, the USD/JPY may find support at the 103.200 level upon a bearish breakout of the 103.750 support level. While resistance stays at 104.350 and 104.700 today. Good luck

Categories
Crypto Market Analysis

Daily Crypto Review, Dec 09 – Bitcoin Drops to $18,000; Crypto Market Tumbles

The cryptocurrency sector has dropped significantly as bears took over the market. Bitcoin is currently trading for $18,315, representing a decrease of 4.50% compared to our last report. Meanwhile, Ethereum’s price has decreased by 6.17% on the day, while XRP managed to lose 7.73%.

 Daily Crypto Sector Heat Map

ALL BEST ICO gained 19,990.71% in the past 24 hours, making it the most prominent daily crypto gainer by far. It is followed by COIL’s 151.88% and Amun Bitcoin 3x Daily Short’s 112.92% gain. On the other hand, Monavale lost 54.51%, making it the most prominent daily loser. It is followed by KIMCHI.finance’s loss of 52.82% and Iteration Syndicate’s loss of 51.70%.

Top 10 24-hour Performers (Click to enlarge)

Bottom 10 24-hour Performers (Click to enlarge)

Bitcoin’s market dominance has moved to the upside just under half a percent since we last reported, with its value currently being 63%. This value represents a difference of 0.4% to the upside when compared to yesterday’s value.

Daily Crypto Market Cap Chart

The crypto sector capitalization has decreased significantly in the past 24 hours, with its current value being $536.08 billion. This represents a $32.76 billion decrease when compared to our previous report.

_______________________________________________________________________

What happened in the past 24 hours?

_______________________________________________________________________

_______________________________________________________________________

Technical analysis

_______________________________________________________________________

Bitcoin

After spending the past couple of days in a very narrow range, Bitcoin has finally made a move as bears took over the market. The price went down rapidly and reached as low as $18,000 at one point, but then went slightly above this crucial level.

While Bitcoin is safe from breaking $18,000 to the downside at the moment, Micheal van de Poppe pointed out that a large CME gap is looming. The gap ranges from $18,275 to $16,995.

Lastly, the Hash Ribbons indicator has posted a buy signal, giving long-term investors the green light to invest in Bitcoin. This indicator has proven itself one of the best RoI indicators for Bitcoin when it comes to long-term investing.

BTC/USD 4-hour chart

Bitcoin’s long-term technicals (weekly and monthly) are completely tilted towards the buy-side, while its daily overview is still bullish but showing slight signs of neutrality. On the other hand, its 4-hour overview is completely bearish.

BTC/USD 1-day Technicals

Technical factors (4-hour Chart):
  • Price is currently below both its 50-period EMA and its 21-period EMA
  • Price is at its bottom Bollinger band
  • RSI is close to being oversold (31.73)
  • Volume is average
Key levels to the upside          Key levels to the downside

1: $18,600                                 1: $18,190

2: $18,790                                 2: $17,780

3: $19,000                                  3: $17,200

Ethereum

Ethereum wasn’t immune to the downturn either, with its price dropping from the sub-$600 levels all the way down to just above $550. Unlike Bitcoin, however, there are no CME gaps to worry about, and Ethereum seems quite stable above $550.

The only thing to worry about when anticipating Ether’s next price move is Bitcoin’s movement. At the moment, Bitcoin is dictating all consolidations, as well as large moves in either direction.

ETH/USD 4-hour Chart

Ethereum’s monthly overview shows a full tilt towards the buy-side, while its daily and weekly overviews still show some signs of neutrality. On the other hand, its 4-hour overview is bearish but shows slight signs of neutrality.

ETH/USD 1-day Technicals

Technical Factors (4-hour Chart):
  • The price is currently below both its 50-period EMA and its 21-period EMA
  • Price is at its bottom Bollinger band
  • RSI is in the oversold territory (28.61)
  • Volume is above average
Key levels to the upside          Key levels to the downside

1: $565                                     1: $550

2: $582                                     2: $525 

3: $600                                      3: $510

Ripple

The fourth-largest cryptocurrency by market cap moved to the downside as well, with its $0.545 support level holding up as the last-resort support. XRP is currently stable and trading between $0.545 to the downside and $0.571 to the upside, with its price, seemingly creating a double bottom (today and on Dec 5).

XRP traders might want to (still) refrain from trading XRP simply due to the disbalance of the risk and reward, as well as due to its low volatility.

XRP/USD 4-hour Chart

XRP’s longer weekly and monthly time-frames show complete bullishness, while its 4-hour overview is completely bearish. Its daily overview is still bullish but shows some signs of neutrality or even some bearishness.

XRP/USD 1-day Technicals

Technical factors (4-hour Chart):
  • The price is currently below both its 50-period EMA, as well as its 21-period EMA
  • Price is at its bottom Bollinger band
  • RSI is close to being oversold (34.36)
  • Volume is slightly above average
Key levels to the upside          Key levels to the downside

1: $0.571                                   1: $0.545

2: $0.6                                       2: $0.5

3: $0.63                                    3: $0.475

Categories
Forex Elliott Wave Forex Market Analysis

EURUSD: is 1.22 at Hand?

The EURUSD pair advances in the extreme bullish sentiment range, consolidating the short-term rally that started on November 04th when the price found fresh buyers at 1.15615.

Technical Overview

The following 8-hour chart shows the short-term participants’ sentiment keeps pushing higher the price action. In this view, the common currency looks to consolidate the pair’s impulsive movement that began in early November.

In this chart, we can see that the current primary trend is clearly bullish. Simultaneously, the accelerated trendline identified with the green line shows the short-term bull market remains intact.

On the other hand, both the intraday sideways channel and the retracement observed in the EMA(60) to Close Index lead to a consolidation of the rally experienced by the common currency during the previous trading sessions.

Therefore, if the price action penetrates below 1.20338, the likelihood of a reversal movement in the EURUSD increases.

Short-term Technical Outlook

The short-term Elliott Wave view for the EURUSD pair unfolded in the next 4-hour chart reveals the advance in an incomplete bullish impulsive wave of Minor degree identified in green.

The EURUSD 4-hour chart illustrates the impulsive rally that began on November 04th when the price found fresh buyers at 1.16025. The price action currently looks to have completed its third wave of Minute degree labeled in black, confirmed by the broadest distance shown on the MACD oscillator

On the other hand, the consolidation structure in progress reveals the potential sideways advance of its fourth wave. Considering the Elliott Wave Principle, the fourth wave shouldn’t penetrate below the invalidation level located at 1.19201, which corresponds to the end of wave ((i)) in black.

Also, considering both the second wave, which looks like a simple corrective pattern, and the alternation principle on corrective waves, the fourth wave should be a complex correction. In this context, the fourth wave could be a triangle or a combination of simple waves grouped in a double-three or a triple-three formation.

Finally, the extension in terms of time should indicate the exhaustion of the bullish pressure; thus, the common currency could soon end its bullish cycle.

Categories
Forex Elliott Wave Forex Market Analysis

GBPAUD Consolidates in an Incomplete Correction

The GBPAUD cross continues consolidating in what is a corrective formation that continues in development since October 22nd when the price found fresh sellers on 1.85272. In this context, the current consolidation pattern suggests a coming rally in the following trading weeks.

Technical Overview

The next 12-hour chart illustrates the short-term market participants’ sentiment displaying the 90-day high and low range, which bounced in the bearish sentiment zone finding resistance in the neutral level of 1.80104, where the cross is still moving in the current trading session. However, as long as the GBPAUD cross doesn’t surpass and closes above the level of 1.80104, the bias will stay mostly bearish.

The primary trend identified in blue shows that the current uptrend remains in its formation process. In this context, the corrective movement in progress represents a secondary trend from the last upward move that carried the cross from 1.74935 to 1.85272.

Short-term Technical Outlook

The short-term Elliott wave view for the GBPAUD cross shown in the following 4-hour chart reveals the downward advance in an incomplete double-three pattern of Minute degree labeled in black, which suggests further declines for the following trading sessions.

The previous chart shows the GBPAUD developing a double three pattern. According to the textbook, this complex corrective formation follows an internal sequence subdivided into 3-3-3, where each three corresponds to a basic corrective structure.

Currently, the cross looks advancing in its wave (c) of Minuette degree labeled in blue, which belongs to the wave ((y)) of Minute degree identified in black. The movement developed until now fits two potential scenarios:

  • The first scenario considers the pause in the wave (c), which could see further declines to the demand zone between 1.7774 and 1.7716. The cross could even extend its drops until 1.7610 and 1.7554, where the price could find fresh buyers expecting a boost in its price to new highs.
  • The second occurs if the price ends its wave (c) in blue and rally toward fresh highs. In this context, the cross should confirm the breakout of the supply zone resistance at 1.8041. Also, the cross must break up the ((x))-(b) trend-line.

Finally, the invalidation level for this bearish sequence in progress can be found at the end of wave (b) in blue at 1.82144.

Categories
Forex Basic Strategies

Ever Heard Of The Andrew’s Pitchfork Forex Trading Strategy?

Introduction

Pitchfork is a technical indicator developed by Alan Andrews. This indicator consists of three parallel lines- These three lines help us identify the possible support and resistance levels. They also do help us in recognizing potential breakout and breakdown levels. With this, we can identify possible trading opportunities in the Forex market. Long term investors use this indicator to identify and gauge the overall cycles that affect the activity of the underlying currency pair.

Three lines of Andrew’s pitchfork tool are as follows. The first one is the median trend line in the center, and the two equidistant trend lines on each side. Moving from left to right of the chart, these lines are drawn by selecting the three points, which are usually a reaction of highs and lows. As long as price action holds inside the Andrew pitchfork tool, it indicates that the trend is in place. Reversals occur when the price breaks the pitchfork.

Andrew’s pitchfork indicator can be used on all the timeframes, and it works on every single chart. Note that this indicator works very well on all types of securities, such as stocks, cryptocurrencies, futures, or the Forex market.

Picking The Three Points

The first step to know before using Andrew’s pitchfork tool is to select the three points for drawing the trend lines. The first point that we chose must be either a high or low that occurs on the price chart. Once that point is chosen, we must identify the trough and peak to the right and left sides of this point. This must be a pullback, which is opposite in the direction of the ongoing trend. Once these points have been isolated, the indicator is placed on the price chart. The two prongs formed by the peak and trough serves as a support and resistance of the trend as shown below.

Trading Strategies Using The Andrew Pitchfork Tool

Mini Median Method

This one is the most basic and popular strategy used by the traders to trade the market using the Pitchfork indicator. We must place the Andrew Pitchfork tool in a strong ongoing trend and look for the buy/sell opportunities.

In the below image, we marked a few trading opportunities presented by this indicator.  We can see that when the price hits the lower line of the tool, we went long. Likewise, we have activated sell trades when the price action hits the median line. This strategy is basic, but it provides a good risk to reward ratio trades in a strong trending market.

In case of a buy entry, exit your position when the price hits the median line. Conversely, take sell when price reverses at the median line, and we can book our profit at the lower line. Place the stop loss a few pips above your entry and ride the move.

This approach works best for aggressive traders who prefer to pull the trigger when prices reach any significant level. So, if you are an aggressive trader, you can go with this approach. But if you are a conservative/confirmation trader, follow the next strategy.

For Conservative Traders

Most conservative traders do not prefer taking many trades in a single day because they tend to seek extra confirmation before pulling the trigger. This Pitchfork strategy is for them.

When the price action approaches the lower line of the indicator, wait for the price action to hold there to take entry. The holding confirms that the price action respects the dynamic support line, and going long from here will be a good idea.

As you can see in the below price-chart, the USDJPY was in a strong uptrend. We have identified three opportunities to go long, but out of three, only two trades were held at the lower support line to confirm the entry. Both of our trades worked very well, and they went on to make a brand-new higher high.

By using this approach, we can safely trade the market. We must always go for smaller stops because the holding at any significant area confirms the power of buyers.

Breakout Trading

Breakout trading is a popular way to trade the markets. Most of the highly successful traders, market technicians, chartists, banks, hedge fund managers use this approach to trade the Forex market. In this strategy, let’s understand trading the breakouts successfully by using the Andrew Pitchfork tool.

The idea is to find a strong trending market first and wait for the price to pullback. When the price gives enough pullback, place the Andrew pitchfork tool on price action and wait for the breakout in the ongoing trend direction. When the breakout happens, take the trade in the direction of the ongoing trend.

As you can see in the below image, the USDJPY was in an uptrend, giving quite deeper pullbacks. When we got enough pullback, we applied the tool on the price action, and when the breakout happened, we went long. Look for the breakouts only in the direction of the ongoing trend.

The chart below represents our buy entry and risk management in this pair. We went long when the breakout happened, and the stop-loss order was placed just below the breakout line.

There are several ways to book our profits. We can use indicators like RSI and Stochastic to confirm our exits. Here we have used the pitchfork itself to book our profit in the above-discussed trade. When we activate a trade at the breakout, the first thing we must do is to apply the Andrew Pitchfork tool in the direction of our trade and wait for the price action to break the tool to book the profits.

In the below image, we applied the tool when our trade took off, and at around 109.60, the price strongly broke the Andrew pitchfork tool. This is an indication for us to close our whole buying position. Also, you can notice that after our exit, the price action blasted to the south.

Conclusion

Just like other trading tools, Andrew pitchfork is not perfect. We need to have strong knowledge of the money management techniques in place before using this tool on live markets. If you are a novice trader, it is advisable to gain experience by experimenting with this tool on the demo account. Using this tool first hand, we are sure that you will discover various ways of using this tool. This will enhance your ability to understand the market better. Cheers!

Categories
Forex Course

187. Learning To Trade the News With Directional Bias

Introduction

In this course, we will further explain, with an example, how you can trade a news release with a directional bias. In the US, the labor market report is one of the most anticipated new releases in a month. The report has a significant impact on any pair with USD. Note that every trader has their approach to trading the news with a directional bias. Here’s our approach.

If you are a forex trader with a directional bias, you need to have in-depth knowledge of the news release you are trading. What do we mean by in-depth knowledge? Firstly, you have to know what that particular news release tells about the economy. For example, the US labor market report has the unemployment rate and nonfarm payroll data.

When both these indicators beat the analysts’ expectations, we can expect that the USD will become stronger than other currencies. The US labor market report is a leading indicator of consumer demand, contributing up to 70% of the GDP. Furthermore, in the current coronavirus pandemic, the labor market report is used to show the rate of economic recovery.

You’d also expect the USD to weaken relative to currencies it is paired with if the news of the labor market report doesn’t meet analysts’ expectations. In this case, it means that unemployment increased, and the economy didn’t add as many jobs as expected.

To make a proper directional bias trade, you need to understand how the labor market report impacts the forex price charts. You have to look into past releases and establish how much the market moved; this will help you get the average pip movement. You also need to be aware of the prevailing macroeconomic conditions and the recent unemployment rate trend.

What to do before the news release?

Go back a few hours on your chart and establish the intraday support and resistance levels. You will use these levels as your ‘take profit,’ and ‘stop-loss’ levels after the news is released.

Let’s check out the news release of the US unemployment rate on October 2, 2020, at 8.30 AM EST.

EUR/USD: Before US Unemployment Rate Release on October 2, 2020, 
just before 8.00 AM EST

Since the unemployment rate was lower than the previous release and also beat analysts’ expectations, our directional bias is to be bearish on the EUR/USD pair. In this case, we will use our previously established Support Level as the ‘take profit.’

EUR/USD: After US Unemployment Rate Release on October 2, 2020, 8.00 AM EST

[wp_quiz id=”94037″]
Categories
Crypto Market Analysis

Daily Crypto Review, Dec 08 – BTC, ETH and XRP Preparing for a Big Move; Crypto Sector in Consolidation Mode

The cryptocurrency sector has spent the past 24, mostly consolidating, as it failed to reach past its resistance levels on Monday. Bitcoin is currently trading for $19,180, representing a decrease of 0.65% compared to our last report. Meanwhile, Ethereum’s price has decreased by 1.14% on the day, while XRP managed to lose 1.65%.

 Daily Crypto Sector Heat Map

Prophet gained 358.97% in the past 24 hours, making it the most prominent daily crypto gainer. It is closely followed by Seigniorage Shares’ 344.54% and xBTC’s 340.23% gain. On the other hand, CryptoBet lost 95.85%, making it the most prominent daily loser. It is followed by Semux’s loss of 90.60% and Bitball Nyan v2’s loss of 51.05%.

Top 10 24-hour Performers (Click to enlarge)

Bottom 10 24-hour Performers (Click to enlarge)

Bitcoin’s market dominance has moved to the upside over half a percent since we last reported, with its value currently being 62.6%. This value represents a difference of 0.6% to the upside when compared to yesterday’s value.

Daily Crypto Market Cap Chart

The crypto sector capitalization has increased in the past 24 hours, with its current value being $568.82 51.68 billion. This represents a $17.24 billion increase when compared to our previous report.

_______________________________________________________________________

What happened in the past 24 hours?

_______________________________________________________________________

_______________________________________________________________________

Technical analysis

_______________________________________________________________________

Bitcoin

Bitcoin has continued with its slow movement as another low volatility day passed. The largest cryptocurrency by market cap oscillated between $18,905 and $19,431. The one time it dropped under the $19,000 mark, it found support in the 50-period moving average, which has proven to be a strong (both support and resistance) level.

Due to the low volatility, traders can’t really do much at the moment. However, they can prepare for the next move Bitcoin makes.

Lastly, the Hash Ribbons (one of the best accumulation indicators) indicator has posted a buy signal, giving long-term investors the green light.

BTC/USD 4-hour chart

Bitcoin’s technicals on both short and long time-frames are bullish, with its weekly time-frame showing full tilt to the buy-side and its 4-hour, daily, and monthly time-frames tilting more towards neutrality.

BTC/USD 1-day Technicals

Technical factors (4-hour Chart):
  • Price is slightly above its 50-period EMA while being at its 21-period EMA
  • Price is at its middle Bollinger band
  • RSI is neutral (51.61)
  • Volume is slightly below average
Key levels to the upside          Key levels to the downside

1: $19,500                                 1: $19,000

2: $19,666                                 2: $18,790

3: $20,000                                  3: $18,600

Ethereum

Ethereum has, just like Bitcoin, had quite a slow day, with its price moving slightly down. At the moment, the second-largest cryptocurrency by market cap doesn’t seem like it will tackle $600, as its volume is too low to pressure this major resistance level. However, if and when a bull run past $600 happens, traders will have a great opportunity to catch a safe trade with a stop-loss slightly below $600 and a possible target of $620 or $630.

ETH/USD 4-hour Chart

Ethereum’s monthly overview shows a full tilt towards the buy-side, while its daily and weekly overviews show some signs of neutrality. On the other hand, its 4-hour overview is completely bearish.

ETH/USD 1-day Technicals

Technical Factors (4-hour Chart):
  • The price is slightly above its 50-period EMA while being slightly below its 21-period EMA
  • Price is at its middle Bollinger band
  • RSI is neutral (48.32)
  • Volume is below average
Key levels to the upside          Key levels to the downside

1: $620                                     1: $600

2: $630                                     2: $530 

3: $735                                      3: $510

Ripple

The fourth-largest cryptocurrency by market cap has close to no volatility, as well as very low volume on most exchanges. With the price movement being non-existent, there is not much to say about the current XRP trading. However, whenever the trading range is getting this narrow, a breakout is on the horizon.

XRP has created a flag formation on the 1-day chart, signaling that an increase in volume could bring a breakout to the upside and a possible spike of up to 60%, which would take the coin’s price above $1,00.


XRP/USD 4-hour Chart

XRP’s longer time-frames (weekly and monthly) show complete bullishness, while its 4-hour and daily overviews show some signs of neutrality or even bearishness.

XRP/USD 1-day Technicals

Technical factors (4-hour Chart):
  • The price is at its 50-period EMA, as well as at its 21-period EMA
  • Price is at its middle Bollinger band
  • RSI is neutral (50.46)
  • Volume is well below average
Key levels to the upside          Key levels to the downside

1: $0.666                                   1: $0.6

2: $0.78                                     2: $0.596

3: $0.79                                   3: $0.535

Categories
Forex Signals

Daily F.X. Analysis, December 08 – Top Trade Setups In Forex – Eyes on European Events! 

On the news front, the market is likely to remain muted in the absence of high impact events. Italian banks will be closed in observance of Immaculate Conception Day while the Frend Trade Balance, European Revised GDP q/q, and German ZEW Economic Sentiment will remain in the highlights today.

Economic Events to Watch Today  


EUR/USD – Daily Analysis

The EUR/USD pair was closed at 1.21088 after placing a high of 1.21660 and a low of 1.20784. EUR/USD pair extended its losses on Monday for the second consecutive day over the diminishing risk sentiment and the hopes for further easing package from ECB. The EUR/USD pair remained under pressure on Monday ahead of the upcoming ECB meeting on Thursday. The European Central Bank was set to deliver a further easing package of almost 500 billion euros to the Pandemic Emergency Purchase Programme that will extend the purchases for many more months and weighed on the single currency Euro. 

Furthermore, the European Central Bank is also expected to increase its targeted longer-term refinancing operations and also to make them more accommodative. The ECB’s governing council members said that these decisions have been taken to extend the duration of accommodative financial conditions to support the recovery in 2021 further and beyond, rather than making financial conditions right now more accommodative.

The pressure on ECB to over-deliver on the market expectations declined due to the recent improvement in global financial market conditions since Joe Biden won the U.S. presidential election and positive vaccine news in early November. The more important event of the day for EUR was the Summit of 27 E.U. countries that will begin on Thursday and Friday.

The top agenda will be Brexit in the Summit as the question remained that UK PM Boris Johnson and E.U. Commission President Ursula von der Leyen will be successful in reaching a deal before the Summit. The paused Brexit talks by top E.U. negotiator Michel Barnier on Friday also added pressure on EUR/USD pair on Monday. Another factor pressuring the European Union was the Polish and Hungarian veto against the E.U. Recovery Fund and the 2021-2027 Budget. Both nations announced their intentions shortly before ambassadors of the E.U. member states met on Monday to veto various parts of the financial settlement. If a deal cannot be agreed with these two nations regarding the rule of law attachments being added to funding, then the E.U. has threatened to go with EU-minus Poland and Hungary fiscal package. 

On the data front, at 12:00 GMT, the German Industrial Production also raised to 3.2% against the estimated 1.8% and supported Euro and capped further losses in EUR/USD pair. At 14:30 GMT, the Sentix Investor Confidence came in as -2.7 against the estimated -11.9 and supported Euro and limited additional losses in EUR/USD pair.

Daily Technical Levels

Support   Resistance

1.2113      1.2129

1.2107      1.2139

1.2097     1.2146

Pivot point: 1.2123

EUR/USD– Trading Tip

The market’s technical side continues to be the same as the pair continues to trade sideways due to a lack of high impact economic events. On the higher side, the EUR/USD may find an immediate resistance at 1.2160 and 1.2196 level. Simultaneously, the closing of candles below the 1.2103 level can send the EUR/USD pair further lower until 1.2080 and 1.2040 level. The MACD is strongly bearish; therefore, the idea will be to open a sell trade below the 1.2175 level today to capture quick green pips. 


GBP/USD – Daily Analysis

The GBP/USD pair was closed at 1.33785 after placing a high of 1.34375 and a low of 1.32239. The GBP/USD pair dropped to its lowest since November 19 on Monday in the early trading session due to the rising U.S. dollar, but it started to recover in the late trading session after the Brexit hopes raised. The U.S. dollar raised on Monday after the coronavirus cases continued to rise, and lockdowns expanded and weighed on the U.S. economic recovery. On Sunday, the Governor of California, Gavin Newsom, ordered large parts of the most populous U.S. state to close down as coronavirus cases spiked to record levels. 

On Sunday, California reported more than 30,000 new cases and marked a new record for hospitalized coronavirus patients. Other states including, New Jersey, North Carolina, Virginia, and West Virginia, also announced a record one-day rise in new infections. These increased cases raised concerns over the economic recovery hopes and raised the demand for safe-haven greenback that ultimately weighed on GBP/USD pair. However, the currency pair GBP/USD recovered some of its losses on Monday after the UK PM Boris Johnson revealed that he was set to travel to Brussels in a last-ditch effort to break a post-Brexit deal. The E.U. Commission President Ursula von der Leyen and the UK PM Boris Johnson will remove the differences on a post-Brexit deal in the coming days. This came in after a 90 minutes phone call between the two leaders failed to produce a breakthrough. 

In a joint statement, both said that the conditions for a deal were not there, and significant differences remained on fishing, level playing field, and any deal governance. They have asked their chief negotiators to prepare an overview of the remaining sticking points discussed in a physical meeting in Brussels in the coming days. A senior U.K. governmental source warned that a deal might not be possible after the phone call between Ursula and Johnson. It was also reported that the talks were in the same position as they were on Friday and made no progress. All these downbeat statements related to Brexit weighed heavily on GBP/USD pair.

On the data front, at 13:30 GMT, the Halifax Housing Price Index for November raised to 1.2% against the forecasted 0.6% and supported British Pound, and capped further losses in GBP/USD pair.

Daily Technical Levels

Support  Resistance

1.3377      1.3438

1.3338      1.3462

1.3315      1.350 0

Pivot point: 1.3400

GBP/USD– Trading Tip

The GBP/USD pair bounced off over 1.3263 level, trading at 1.3340 level now. On the 4 hour timeframe, the GBP/USD is consolidating in between a wide trading range of 1.3406 – 1.3263 level. The Cable may find the next support at 1.3204 level, and below this, the next support can also be found around 1.3100 level today. On the higher side, the resistance hold around the 1.3406 mark. The MACD and RSI are suggesting selling bais in the pair, and we should look for selling trades below 1.3400 and buying over 1.3265 level today. 


USD/JPY – Daily Analysis

The USD/JPY pair was closed at 104.046 after placing a high of 104.310 and a low of 103.920. On Monday, the USD/JPY pair consolidated within a tight range around 104.00 level after placing a high of 104.310 on the U.S. dollar’s strength in the early European morning. However, the pair USD/JPY reversed its direction and started posting losses in late trading hours. The U.S. dollar was strong in early European trade on Monday as the coronavirus cases continued to rise and lockdowns expanded and weighed on the U.S. economic recovery. The U.S. Dollar Index that tracks the greenback against the six other currencies basket was up by 0.3% at 90.993.

The record hike in the coronavirus spread caused the Governor of California, Gavin Newsom, to order large parts of the most populous U.S. state to close down again. California state reported 30,000 new cases in a single day and broke its daily high record. Other states like New Jersey, North Carolina, Virginia, and West Virginia also reported a record-high number of coronavirus cases.

The rising number of coronavirus infections and the U.S. hospitalization rate added pressure on the U.S. economic recovery and raised the appeal for safe-haven that ultimately added strength to the greenback. The strong U.S. dollar helped the USD/JPY pair rise to the 104.300 level in the early trading session.

However, the USD/JPY pair’s gains were short-lived as the pair started to decline in the late trading session and posted losses for the day. The decline in the USD/JPY pair was due to appreciation in the Japanese Yen after the lower U.S. yields on the day.

The 10-year Treasury yield fell by 4bps to 0.929%, and the 10-year real rates also dropped to -0.97% by 3bps. The declining U.S. yields thus decreased the attractiveness of USD investments relative to Japanese government bonds and underpinned selling pressure in the USD/JPY pair.

On the data front, at 09:59 GMT, the Leading Indicators from Japan came in line with the expectations of 93.8%. Meanwhile, the latest optimism regarding the vaccine and fiscal stimulus also kept the USD/JPY pair supported and limited the day’s losses.

Another reason behind the increasing demand for safe-haven Japanese Yen was the recent financial sanctions imposed by the U.S. and a travel ban on 14 Chinese officials over their suspected role in disqualifying elected opposition legislators in Hong Kong.

Hong Kong’s Beijing-backed government expelled four opposition members last month. In this response, the U.S. levied sanctions on Chinese officials and also blocked any assets the official might have within the U.S. These sanctions added in the safe-haven demand in the market and added strength in the Japanese Yen against the U.S. dollar, and weighed on the USD/JPY pair on Monday.

Daily Technical Levels

Support   Resistance

104.10      104.27

104.00      104.34

103.94      104.44

Pivot point: 104.17

USD/JPY – Trading Tips

The USD/JPY is trading within a symmetric triangle pattern seen in the 4-hour timeframe. The pair lately violated the sideways trading range of 104.600 – 104.200, and now it’s trading at 104.300 level, especially after bouncing off over 103.700 level on the lower side, supporting the pair around 103.700 level. On the downside, the USD/JPY may find support at the 103.200 level upon a bearish breakout of the 103.750 support level. While resistance stays at 104.350 and 104.700 today. Good luck

Categories
Forex Elliott Wave Forex Technical Analysis

US Dollar Index Under Bearish Pressure. What’s next?

The US Dollar Index (DXY) consolidates on Monday’s session in the extreme bearish sentiment zone bouncing a modest 0.06% from the last Friday 04th, from 90.476 to 90.757. However, the technical perspective is mostly bearish for the DXY basket of currencies.

Technical Overview

The following 8-hour chart shows the mid-term market participants’ sentiment unfolded in its 90-day high and low range. The figure reveals the bearish pressure that carries the Greenback in the extreme bearish zone between 90.476 and 91.543. Likewise, the intraday sideways candlestick formation suggests the likelihood of a pause and the downward continuation for the following trading sessions.

Regarding the US Dollar’s trend, the primary trend plotted in the blue line reveals the bearish bias. The secondary trend identified in green suggested the downward acceleration since November 04th when the price failed its bullish advance at 94.316. Likewise, the broader distance between the primary trend-line and the price leads to a limited correction before continuing the bearish path.

Short-term Technical Outlook

The short-term Elliott Wave perspective for the US Dollar Index exposed in the next 2-hour chart suggests the incomplete downward advance of a five-wave sequence, which could be starting to consolidate in its fourth wave of Minuette degree identified in blue.

The current bearish sequence began on November 04th when the price found fresh sellers at 90.302 and began a decline that is still present to date. The previous chart suggests the completion of the third wave of Minuette degree. This Elliott wave context is supported by the broadest distance observed in the MACD oscillator.

On the other hand, considering that the second corrective wave seems simple in terms of price and time, the alternation principle suggests that the fourth wave in progress should be complex in terms of price, time, or both. In this context, the next corrective pattern could be a triangle pattern or a combination such as a double-three or a triple-three formation.

The implication of the fourth wave’s extension could be indicative of the exhaustion of the bearish trend, and the price action should reverse soon.

Finally, if the price action rises and closes above the supply zone between 91.412 and 91.580, the US Dollar Index could reveal a possible reversion of the current bearish trend.

Categories
Forex Signals

USD/CAD Completes 23.6% Fibonacci – What’s Next? 

The USD/CAD closed at 1.27841 after placing a high of 1.28735 and a low of 1.27720. The USD/CAD pair extended its losses towards its lowest level since May 2018 amid the strength of the Canadian dollar against the US dollar and the rising crude oil prices. On Friday, the Canadian dollar outlook improved on the expectations that the currency will benefit from the domestic economic stimulus and the rollout of the coronavirus vaccine. On Monday, the Canadian Finance Minister Chrystia Freeland forecasted the budget deficit to hit a historic C$382 billion on coronavirus emergency aid. She also added that C$100 billion would be rolled out in stimulus once the virus came under control.

These statements from the Canadian Finance Minister added strength to the Canadian dollar as the hopes for Canadian economic recovery increased. The strong Canadian dollar added heavy pressure on the USD/CAD pair on Friday and dragged the pair on the downside.

Meanwhile, the Canadian dollar was also strong because of the positive macroeconomic data on Friday. At 18:30 GMT, the Employment Change from Canada raised to 62.1K against the forecasted 22.0K and supported the Canadian dollar and added losses in USD/CAD pair. 

The Unemployment Rate from Canada dropped to 8.5% against the forecasted 9.0% and supported the Canadian dollar and supported the USD/CAD pair’s downward trend. The Trade Balance from Canada came in as -3.8B against the forecasted -3.2B and weighed on the Canadian dollar.

From the US side, at 18:30 GMT, the Average Hourly Earnings raised to 0.3% against the estimated 0.1% and supported the US dollar, and capped further losses in the USD/CAD pair. The Non-Farm Employment Change declined to 245K against the estimated 480K and weighed on the US dollar and supported the USD/CAD pair’s losses. The Unemployment Rate dropped to 6.7% against the estimated 6.8% and supported the US dollar. The Trade Balance from the US came in as -63.1B against the estimated -64.7B and supported the US dollar. 

At 20:00 GMT, the Factory Orders for November raised to 1.0% against the estimated 0.8%, supported the US Dollar, and capped further USD/CAD pair losses. Most of the US dollar economic data came in favor of the US dollar, but the NFP employment change or the job creation by the US economy fell short of expectations and weighed on the US dollar that added losses in the USD/CAD pair.

Another important factor involved in the USD/CAD pair’s losses on Friday was the rising crude oil prices. The price of crude oil, one of Canada’s major export, rose on Friday above $46 per barrel after the coronavirus vaccine’s speedy approval that would boost the global economic recovery and ultimately increase the energy demand. The higher crude oil prices supported the commodity-linked currency Loonie and added pressure on the currency pair USD/CAD on Friday.


Daily Technical Levels

Support Resistance

1.2825 1.2918

1.2791 1.2977

1.2733 1.3011

Pivot point: 1.2884

The USD/CAD slipped to trade at a 1.2811 level, holding above an immediate support level of 1.2775. Above this level, the commodity currency pair has formed a Doji candle, suggesting odds of selling bias until the 1.2770 level. Taking a look at the 4-hour timeframe, the USD/CAD pair has closed a bullish engulfing pattern at the 1.2811 level, and it may head upward until the 38.2% Fibonacci retracement level of 1.2837 level. Bullish trend continuation can lead to its prices further higher until the next resistance level of the 1.2904 level marks a 61.8% Fibonacci level. Good luck! 

Categories
Forex Signals

AUD/USD Upward Channel In-Play – Brace for a Buying Trend! 

The AUD/USD closed at 0.74260 after placing a high of 0.74435 and a low of 0.74100. After rising for three consecutive days, the AUD/USD pair dropped on Friday and posted small losses as it remained confined in a range between 0.74100 and 0.74400. The currency pair rose in the early trading session on Friday as it followed the previous day’s trend and because of the Australian side’s supportive economic data. Another factor involved in the rising AUD/USD prices in the early trading session was the improved risk-sentiment from the latest development in the coronavirus vaccine.

The approval for emergency use authorization to Pfizer and BioNtech added in the risk sentiment as the hopes for global economic recovery increased and supported the risk-sensitive Aussie. The strong Australian dollar pushed the AUD/USD pair higher in early trading hours on Friday. On the data front, at 05:30 GMT, the Retail Sales from Australia raised to 1.4% against the projected 0.5% and supported the Australian dollar, and capped further losses in AUD/USD pair.

From the US side, at 18:30 GMT, the Average Hourly Earnings rose to 0.3% against the expected 0.1% and supported the US dollar and added pressure on AUD/USD pair. The Non-Farm Employment Change fell to 245K against the expected 480K and weighed on the US dollar, and capped further losses in AUD/USD pair. The Unemployment Rate fell to 6.7% against the expected 6.8% and supported the US dollar. The Trade Balance from the US came in as -63.1B against the expected -64.7B and supported the US dollar. At 20:00 GMT, the Factory Orders for November rose to 1.0% against the expected 0.8% and supported US Dollar and added pressure on AUD/USD pair.

Despite the US’s disappointing Job report, the unemployment rate and factory order data managed to support the US dollar through the rough time and exerted downward pressure on AUD/USD pair. Meanwhile, the AUD/USD pair’s losses were also limited because of the underlying pressure on the US dollar after the agreement between Democrats and Republicans over the $908 billion stimulus package. The agreement on the bipartisan proposal added hopes that a massive stimulus could also be approved and weighed on the US dollar that kept the losses in AUD/USD pair limited on Friday.


Daily Technical Levels

Support Resistance

0.7407 0.7461

0.7376 0.7482

0.7354 0.7514

Pivot point: 0.7429

The AUD/USD slipped to trade at 0.7372 level, holding above an upward support level, which is extended by an upward channel. The AUD/USD channel may drive upward movement until 0.7405 and 0.7440 resistance levels on the higher side. Conversely, a bearish breakout of 0.7372 level can extend the selling trend until the next support level of 0.7337. The RSI and MACD are reporting selling bias in the pair. Good luck! 

Categories
Forex Signals

Reverse Head & Shoulder Pattern Formation In The EUR/USD Pair

Categories
Forex Market Analysis

Daily F.X. Analysis, December 07 – Top Trade Setups In Forex – Eyes on European Events! 

The calendar is a bit muted today, and the market can exabit thin trading volume on the news front. However, the focus can stay on German Industrial Production m/m and Sentix Investor Confidence from the Eurozone, which are expected to perform better than the previous month and may underpin the Euro currency. Besides, the U.K. Halifax HPI m/m will also play a slight role in determining the GBP trend, while economists expect HPI to improve from 0.3% to 0.6% this month.

Economic Events to Watch Today  


EUR/USD – Daily Analysis

The EUR/USD pair was closed at 1.21185 after placing a high of 1.21772 and a low of 1.21101. After rising for three consecutive days, the EUR/USD pair dropped on Friday after the initial rally. The downfall in EUR/USD pair on the day came in after U.S. job figures’ release.

In the trading session on Friday, the EUR/USD pair rallied slightly on the back of improved risk sentiment and the U.S. dollar’s weakness. The risk perceived EUR/USD followed the optimism regarding the coronavirus vaccine and moved higher in the early trading session on Friday. Besides, the U.S. dollar’s weakness due to the increased spread of coronavirus and hospitalization rate in the U.S. also added strength to the rising EUR/USD pair.

The U.S. dollar was also weak due to increased hopes for the next round of U.S. stimulus package after the CARES Act passed in March. Democrats and Republicans have agreed over a $908 billion stimulus package, and the expectations have increased that a big stimulus will also be delivered soon. The weak U.S. dollar gave a Pushto EUR/USD pair on Friday and raised its prices above the 1.21700 level.

However, the EUR/USD pair’s gains started to reverse and converted into losses after the release of macroeconomic data from the U.S.

At 12:00 GMT, the German Factory Orders for November raised to 2.9% against the expected 1.4% and supported Euro. At 12:45 GMT, the French Gov Budget Balance came in as -159.9B. At 14:00 GMT, the Italian Retail Sales raised to 0.6% against the forecasted 0.2% and supported Euro.

At 18:30 GMT, the Average Hourly Earnings rose to 0.3% against the anticipated 0.1% and supported the U.S. dollar and added pressure on EUR/USD. The Non-Farm Employment Change declined to 245K against the anticipated 480K and weighed on the U.S. dollar. 

The Unemployment Rate declined to 6.7% against the anticipated 6.8% and supported the U.S. dollar and dragged the EUR/USD pair. The Trade Balance from the U.S. came in as -63.1B against the anticipated -64.7B and supported the U.S. dollar and weighed on EUR/USD pair. At 20:00 GMT, the Factory Orders for November raised to 1.0% against the anticipated 0.8% and supported U.S. Dollar. Most of the U.S. data came in support of the U.S. dollar that resulted in the EUR/USD pair’s downfall on Friday in the late trading session.

Daily Technical Levels

Support  Resistance

1.2101        1.2178

1.2063       1.2215

1.2025       1.2254

Pivot point: 1.2139

EUR/USD– Trading Tip

On Monday, the EUR/USD continues to trade sideways amid mixed NFP figures released on Friday. On the higher side, the EUR/USD may find an immediate resistance at 1.2160 and 1.2196 level. While the closing of candles below the 1.2103 level can send the EUR/USD pair further lower until 1.2080 and 1.2040 level. The MACD is strongly bearish; therefore, the idea will be to open a sell trade below the 1.2175 level today to capture quick green pips. 


GBP/USD – Daily Analysis

The GBP/USD pair was closed at 1.3413 after a high of 1.35390 and a low of 1.34096. The GBP/USD pair rose to its highest level since May 2018 in the early trading session on Friday over the combined factor of Brexit optimism and the weakness of the U.S. dollar. However, the British Pound cut its gains after the E.U.’s Brexit negotiator Michel Barnier paused the talks.

During the early trading session on Friday, the GBP/USD pair rose and started to post gains following the Brexit optimism triggered after the agreement was reached over the Fisheries between the U.K. and the E.U. Another factor involved in the GBP/USD pair’s upward momentum was the U.S. dollar’s weakness.

The U.S. dollar index (DXY) that measures the value of the U.S. dollar against the basket of six currencies fell to its six years, the lowest level of 90.47 on Friday. The losses in DXY were due to a combination of factors, including the rising number of coronavirus in the nation and the rising expectations of the U.S. stimulus package.

The number of new coronavirus cases in the past five days in the U.S. reached about 1 million. The hospitalization rate also increased to an alarming level and hit a record high after 101,487 patients were reported to be hospitalized in a single day. This negative news from the U.S. added further pressure on the U.S. dollar and supported the upward trend in the GBP/USD pair in the early trading session on Friday.

British Pound was under demand on Thursday after the U.K. and E.U. reported that they had reached an agreement over one key sticking issue of Fisheries. Investors started to buy GBP/USD in the early trading session on Friday as they continued following the previous trend.

However, the currency pair GBP/USD pair started to decline on Friday after the release of U.S. macroeconomic data and the announcement from Michel Barnier. The E.U. Brexit negotiator, Michel Barnier, said that he had paused the trade talks with the U.K. and added that the conditions for a deal had not yet been met.

After one week of intensive negotiations in London, the U.K. and E.U. agreed to pause talks because the post-Brexit deal conditions were not met. Barnier said that E.U. Commission president Ursula von der Leyen and PM Boris Johson would try to make progress on a deal in the next meeting that will take place on Saturday.

After these comments by the E.U. top negotiator, the earlier optimism that the deal was imminent could be reached before the end of the week. These updates suggested that talks have reached a very critical stage, and anything could happen. It raised the market’s uncertainty and supported the safe-haven greenback that exerted pressure on GBP/USD pair.

On the data front, at 14:30 GMT, the Construction PMI from Great Britain raised to 54.7 against the projected 52.3 and supported British Pound and limited the losses in GBP/USD pair.

From the U.S. side, at 18:30 GMT, the Average Hourly Earnings surged to 0.3% against the projected 0.1% and supported the U.S. dollar and added losses in GBP/USD pair. The Non-Farm Employment Change fell to 245K against the projected 480K and weighed on the U.S. dollar. The Unemployment Rate fell to 6.7% against the projected 6.8%, supported the U.S. dollar, and dragged GBP/USD pair. The Trade Balance from the U.S. came in as -63.1B against the projected -64.7B and supported the U.S. dollar. At 20:00 GMT, the Factory Orders for November surged to 1.0% against the projected 0.8% and supported U.S. Dollar and added losses in the GBP/USD pair on Friday.

Daily Technical Levels

Support   Resistance

1.3286       1.3441

1.3209       1.3519

1.3131       1.3596

Pivot Point: 1.3364

GBP/USD– Trading Tip

The GBP/USD is falling dramatically from 1.3450 to 1.3230 level by the time of covering this report. On the 4 hour timeframe, the GBP/USD pair has dipped sharply and has already violated the upward channel, which supported the pair around the 1.3350 level. The Cable may find the next support at 1.3204 level, and below this, the next support can also be found around 1.3100 level today. On the higher side, the resistance hold around the 1.3300 mark. The MACD and RSI are suggesting selling bais in the pair, we should look for selling trades below 1.3350 and buying over 1.3185 level today. 


USD/JPY – Daily Analysis

The USD/JPY pair was closed at 104.186 after placing a high of 104.242 and a low of 103.736. The currency pair USD/JPY rose on Friday amid the supportive U.S. macroeconomic data and the increased U.S. yields.

On Friday, the U.S. Bureau of Labour reported that only 245K jobs were added to the economy while the unemployment rate fell by 0.2% in November and supported the U.S. dollar.

On the data front, at 18:30 GMT, the Average Hourly Earnings advanced to 0.3% against the anticipated 0.1% and supported the U.S. dollar and added gains in the USD/JPY pair. The Non-Farm Employment Change declined to 245K against the anticipated 480K and weighed on the U.S. dollar capped further gains in the USD/JPY pair. The Unemployment Rate declined to 6.7% against the anticipated 6.8% and supported the U.S. dollar.

The Trade Balance from the U.S. came in as -63.1B against the anticipated -64.7B and supported the U.S. dollar and pushed the pair USD/JPY higher. At 20:00 GMT, the Factory Orders for November advanced to 1.0% against the anticipated 0.8% and supported the U.S. Dollar, and added further gains in the USD/JPY pair.

The U.S.’s supportive data proved good news for the market that pushed the S&P 500 to an all-time high and raised the U.S. 10-year yield by 5bps to 0.97%. The rise in U.S. yields also added strength in the U.S. dollar and added gains in the USD/JPY pair. The less than expected job creation by the U.S. Labor Department made the near-term U.S. fiscal stimulus more likely and exerted pressure on Congress to swiftly avert the labor market’s slowdown.

However, the risk sentiment was also strong in the market after the vaccine optimism escalated and supported the hopes that the economic activities will return to pre-pandemic levels. These hopes, along with the rising expectations that the world’s largest economy will also recover soon as the stimulus package was near to be delivered, added to the risk-sentiment. These risk flows added weight on the safe-haven Japanese Yen that supported the USD/JPY pair and pushed it higher.

Meanwhile, the gains in the USD/JPY pair were also limited because of the rising number of coronavirus cases in the U.S. Over the period of 5 days, the U.S. has recorded about 1 million new coronavirus cases, and the hospitalization rate in the U.S. also hit its highest record by reaching more than 104,000 patients in a single day.

The USD/JPY pair rose on Friday due to supportive U.S. macroeconomic data, higher U.S. yields, and the rising risk sentiment in the market due to global economic recovery hopes.

Daily Technical Levels

Support   Resistance

103.48       104.35

103.13       104.89

102.60       105.23

Pivot point: 104.01

USD/JPY – Trading Tips

The USD/JPY is trading within a symmetric triangle pattern seen in the 4-hour timeframe. The pair lately violated the sideways trading range of 104.600 – 104.200, and now it’s trading at 104.300 level, especially after bouncing off over 103.700 level on the lower side, supporting the pair around 103.700 level. On the downside, the USD/JPY may find support at the 103.200 level upon a bearish breakout of the 103.750 support level. While resistance stays at 104.350 and 104.700 today. Good luck

Categories
Forex Market Analysis

NZDCAD Heavy Drops driven by a Sharp Shift in Market Sentiment

In the last trading week, the NZDCAD cross  90-Day market sentiment declined from the extreme bullish to the bullish sentiment zone. The move was helped by the Canadian unemployment rate figures, which declined to 8.5% in November, beating the analysts’ expectations of 8.9%. 

Source: TradingEconomics.com

The last unemployment rate reading represents an improvement in the Canadian labor market, which showed a slight decline to 8.9% in October. On the other hand, during the current year, the data gathered from Statistics Canada stated that the record unemployment high was Mays figure of 13.7%, its highest level in more than four decades.

Technical Overview

The following 8-hour chart illustrates the market participants’ sentiment unfolded in the 90-day high and low range, revealing an aggressive decline in the Friday 04th trading session where the cross dropped over 1.7%. 

In this context, the downgrade on the market sentiment leads us to expect a corrective movement. This potential drop could find support in the neutral zone of 0.88698. Likewise, the descending of the NZDCAD EMA(60) to Close index below the zero-line drives us to anticipate a consolidation during the coming trading sessions before continuing a further decline.

Technical Outlook

The NZDCAD cross in its 8-hourly chart illustrates the mid-term uptrend that began on March 18th once the price confirmed its bottom of 0.80849. The primary trend plotted in blue reveals that the bull market remains intact.

Likewise, the breakdown observed in the last ascending secondary trend identified in green reveals a short-term correction with three potential key support levels: 0.89469, 0.88583, and 0.87489. Each of these levels shows a zone where the price action developed a polarization movement.

The following 2-hour chart shows an impulsive movement, which began on October 20th when the price found support at 0.86270. After completing its third wave of Minuette degree, in blue, the NZDCAD cross found resistance on December 03rd at 0.91630, where it started a decline in an incomplete corrective sequence that could correspond to wave (iv), in blue.

In this context, the cross could develop two potential scenarios:

  • The first scenario occurs if the price completes the third wave on 0.91630. In this case, the cross could advance mostly sideways in its wave (iv), in blue. In this scenario, the cross could find support in the demand zone between 0.89723 and 0.89490, where the price could begin to advance in its wave (v) of Minuette degree at least to the 0.9163 level.
  • The second scenario: considers an alternative count and occurs if the NZDCAD cross completes a wave (v), in blue, on 0.91630. If that is the case, it implies the price is currently advancing in a corrective formation of Minuette degree. Thus, the price could create a decline in a three-wave sequence toward the next demand zone between 0.88437 until 0.88234. 

In both scenarios, the invalidation level is found below the origin of wave (i) at 0.86270.

Categories
Crypto Market Analysis

Daily Crypto Review, Dec 07 – ETHE and GBTC Grayscale Funds Reach All-Time High Average Daily Volumes in November

The cryptocurrency sector has spent the weekend recovering from the price descent on Dec 3 and 4. Bitcoin is currently trading for $19,288, representing an increase of 0.16% compared to our last report. Meanwhile, Ethereum’s price has decreased by 1.49% on the day, while XRP managed to lose 0.74%.

 Daily Crypto Sector Heat Map

Omnitude gained 241.76% in the past 24 hours, making it the most prominent daily crypto gainer. It is closely followed by KIMCHI.finance’s 185% and Badger DAO’s 123.92% gain. On the other hand, DAV Coin lost 71.6%, making it the most prominent daily loser. It is followed by Semux’s loss of 66.12% and Bitball Treasure’s loss of 65.05%.

Top 10 24-hour Performers (Click to enlarge)

Bottom 10 24-hour Performers (Click to enlarge)

Bitcoin’s market dominance has barely moved to the downside since we last reported, with its value currently being 62.1%. This value represents a difference of 0.3% to the downside when compared to Friday’s value.

Daily Crypto Market Cap Chart

The crypto sector capitalization has decreased over the weekend. Its current value is $551.68 billion, representing an $18.83 billion decrease when compared to our previous report.

_______________________________________________________________________

What happened in the past 24 hours?

_______________________________________________________________________

_______________________________________________________________________

Technical analysis

_______________________________________________________________________

Bitcoin

Bitcoin has spent the weekend trying to recover from the downturn it had on Dec 3 and 4. The largest cryptocurrency by market cap has formed a triangle formation that is respected throughout the weekend and then broke it to the upside. While the move was short-lived, the overall short-term bullishness has increased.

Some traders see a bull flag instead of the triangle formation, which makes the possibly future even more bullish. Posting any short trades would most likely be more risky than profitable at the moment.

It is also important to note that the Has Ribbons (one of the best accumulation indicators) indicator has posted a buy signal.

BTC/USD 4-hour chart

Bitcoin’s technicals on all time-frames are bullish, with 4-hour and weekly time-frames showing full tilt to the buy-side and daily and monthly time-frames tilting more towards neutrality.

BTC/USD 1-day Technicals

Technical factors (4-hour Chart):
  • Price is above its 50-period EMA and slightly above its 21-period EMA
  • Price is slightly above its middle Bollinger band
  • RSI is neutral (54.36)
  • Volume is below average
Key levels to the upside          Key levels to the downside

1: $19,500                                 1: $19,000

2: $19,666                                 2: $18,790

3: $20,000                                 3: $18,500

Ethereum

Ethereum has spent the weekend slowly pushing towards the upside, reaching just under $600 and bouncing off the resistance level. Its current failure to break $600 is not a big red flag, as Ethereum’s large moves are (lately) mostly caused by Bitcoin’s movement.

Ethereum traders have a great opportunity to catch a safe trade if ETH/USD breaks $600. A stop-loss slightly below $600 and a possible target of $620 or $630 would make quite a viable trade.

ETH/USD 4-hour Chart

Ethereum’s 4-hour, weekly, and monthly overviews show a full tilt towards the buy-side, while its daily overview shows some signs of neutrality.

ETH/USD 1-day Technicals

Technical Factors (4-hour Chart):
  • The price is slightly above its 50-period and at its 21-period EMA
  • Price is at its middle Bollinger band
  • RSI is neutral (50.51)
  • Volume is slightly below average
Key levels to the upside          Key levels to the downside

1: $620                                     1: $600

2: $630                                     2: $510 

3: $735                                      3: $500

Ripple

The fourth-largest cryptocurrency by market cap experienced slightly more volatility over the weekend than during the previous week, with its price hovering between $0.542 and $0.626. The $0.6 level is currently holding quite well as a support line, and XRP shows no signs of dropping below it unless some external factor surfaces.

Trading XRP is, even with the slight increase in volatility, a near-impossible feat at the moment. Trading other (more volatile) cryptocurrencies could be a much better option.

XRP/USD 4-hour Chart

XRP’s 4-hour, weekly, and monthly overviews show complete bullishness, while its daily overview shows some signs of neutrality.

XRP/USD 1-day Technicals

Technical factors (4-hour Chart):
  • The price is at both its 50-period EMA and its 21-period EMA
  • Price is at its middle Bollinger band
  • RSI is neutral (53.49)
  • Volume is slightly below average
Key levels to the upside          Key levels to the downside

1: $0.666                                   1: $0.6

2: $0.78                                     2: $0.596

3: $0.79                                   3: $0.535

Categories
Crypto Market Analysis

BTC/USD Weekly Chart Analysis + Possible Outcomes

In this weekly BTC/USD analysis, we will be taking an in-depth look at the most recent technical formations, as well as look for the possible short-term price outcomes.

Overview

Bitcoin has spent the past week recovering levels it lost in a Nov 25 crash and even managed to push to a new all-time high on some exchanges. Still, the end-goal of Bitcoin above $20,000 was not reached.

Bitcoin’s institutional activity is more than booming, with news coming out left and right about companies investing in crypto, financial institutions preparing to embrace Bitcoin as an asset class, as well as regulators allowing Bitcoin to be held in employees’ company-funded 401k plans. On the other hand, Not being able to push past the $20,000 resistance level due to an incredible amount of sell orders near it has brought Bitcoin bears another day of hoping that the price will go lower.

Technical factors


Bitcoin has continued moving up until reaching an all-time high on some exchanges and then creating a doji candle followed by an inverted hammer candle on a weekly time-frame, indicating a possible bearish outlook as Bitcoin has most likely reached its short-term top. Looking at the shorter time-frames, such as the 4-hour one, we can see that Bitcoin has formed either a triangle formation or (if we include the movement from that started on Nov 27) a bull flag, which goes against the previously mentioned bearish outlook. Any break from the channel Bitcoin is trading in at the moment could mean a strong move towards that side.

The hash ribbons indicator flashed a BUY signal, which is an incredibly important update for long-term investors, as this indicator was the most consistent investment tool when it comes to RoI.

Likely Outcomes

Bitcoin’s sending out mixed signals on different time-frames, indicating indecisiveness from the retail sector. On the other hand, companies and institutions show incredibly bullishness as they are buying up Bitcoin over-the-counter. While a move to the downside is quite possible at the moment, the overall current trend is bullish, and short-selling could possibly harm traders’ portfolios more than they can improve it.

1: If Bitcoin fails to establish itself above $19,100 and breaks the range to the downside (slightly less likely), its most likely target will be $18,450. Due to a large number of buy orders in the zone between $18,190 and $18,450, this is the most likely place for reaccumulation and a push towards the upside after a pullback.

2: If Bitcoin manages to push towards the upside, first breaking $19,100 and then the descending black line (top line of the triangle formation), we can expect the price to attempt another push above $20,000, with the possibility of breaking it this time. If Bitcoin proves to be in a bull flag formation rather than a triangle formation, the profit target stays the same ($19,666 with possibly taking some profits along the way).

Entering any trade with having a target of above $20,000 is quite risky, and it would be better to play it safe and end the trade pre-$20,000 and then re-enter it if the price confidently moves up. The same goes for entering a short trade with sub-$18,450 in mind.