Categories
Forex Videos

Is The Stochastic Oscillator The Key To Making Money In Forex Or Is It Loosing You Money?

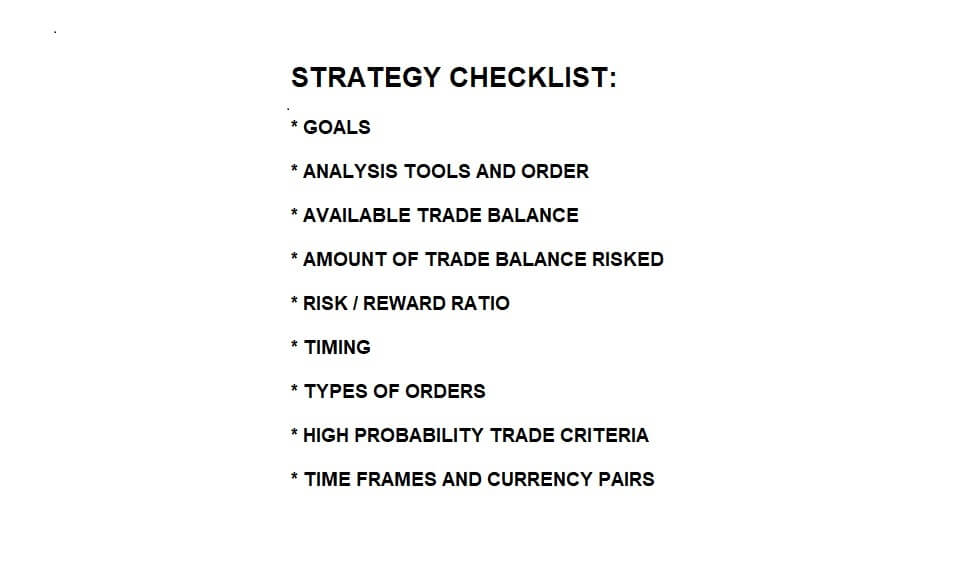
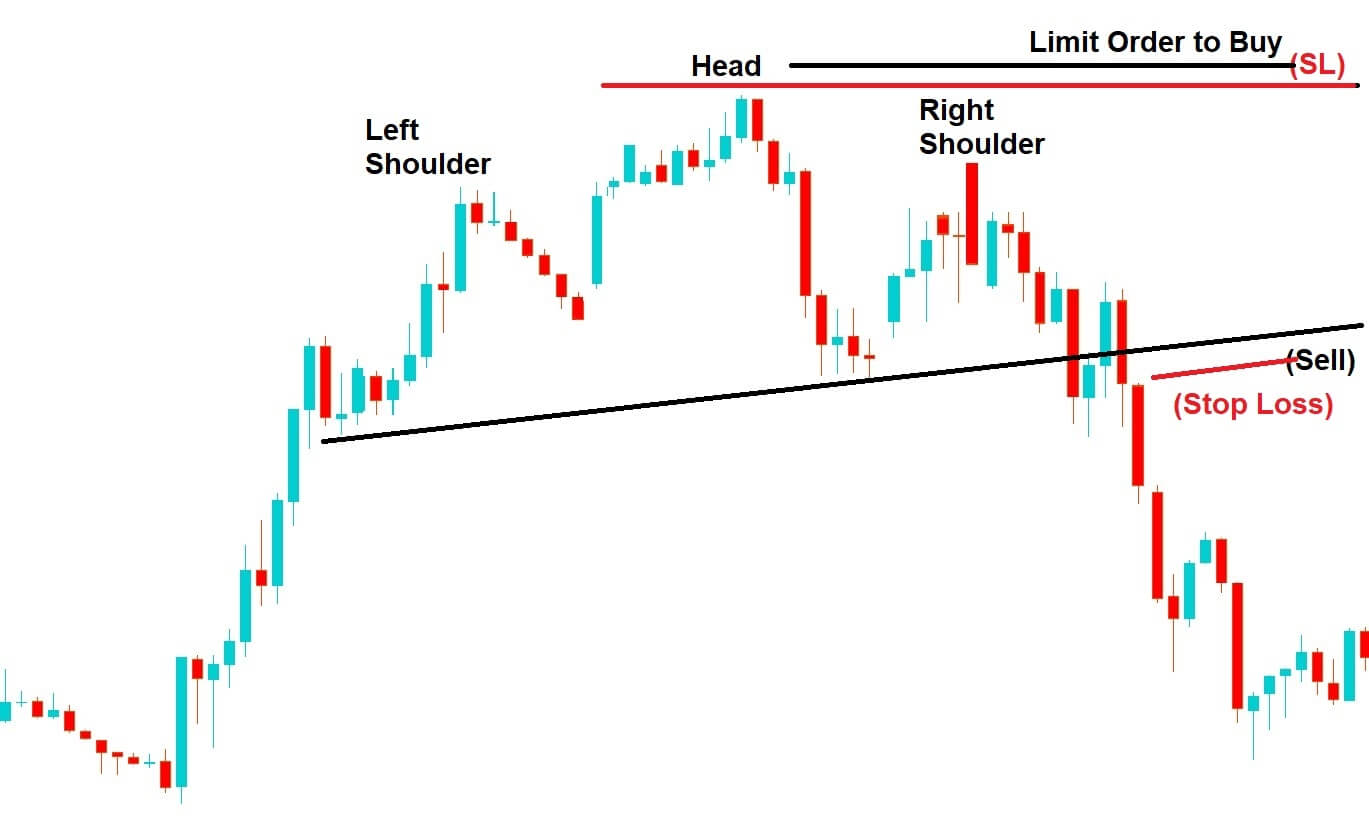
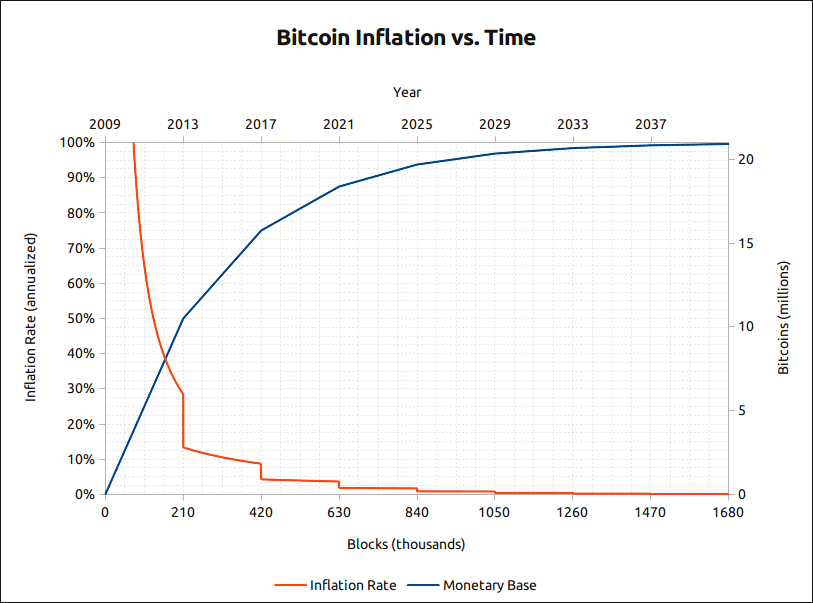
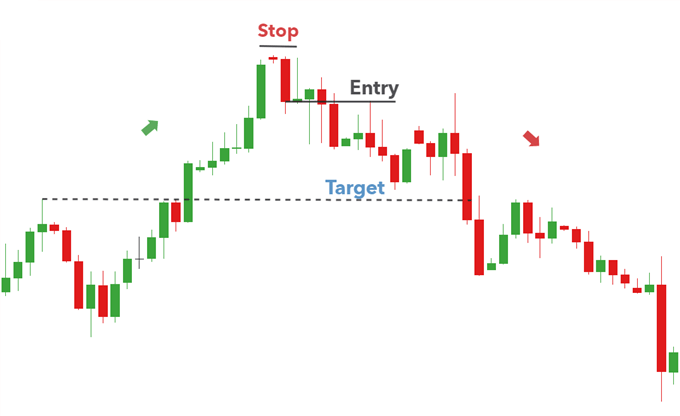
-Stochastic Oscillator, Friend or Foe ?


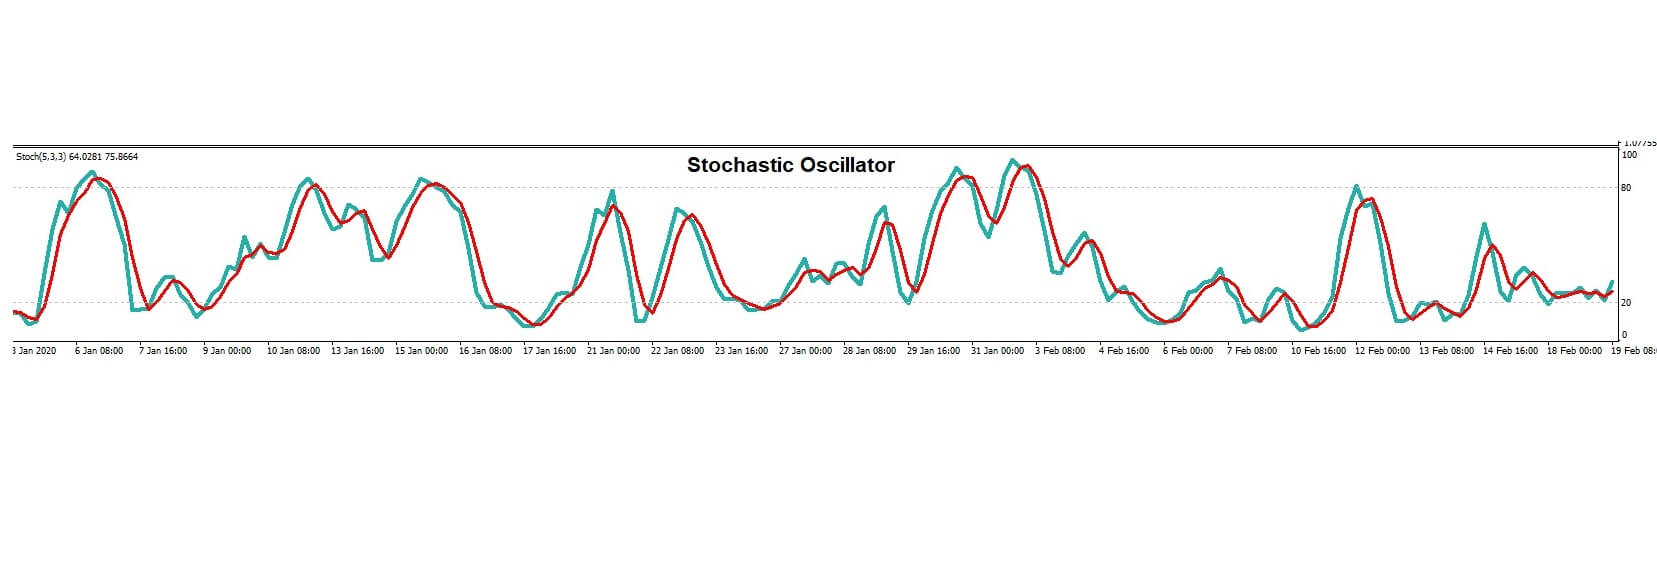
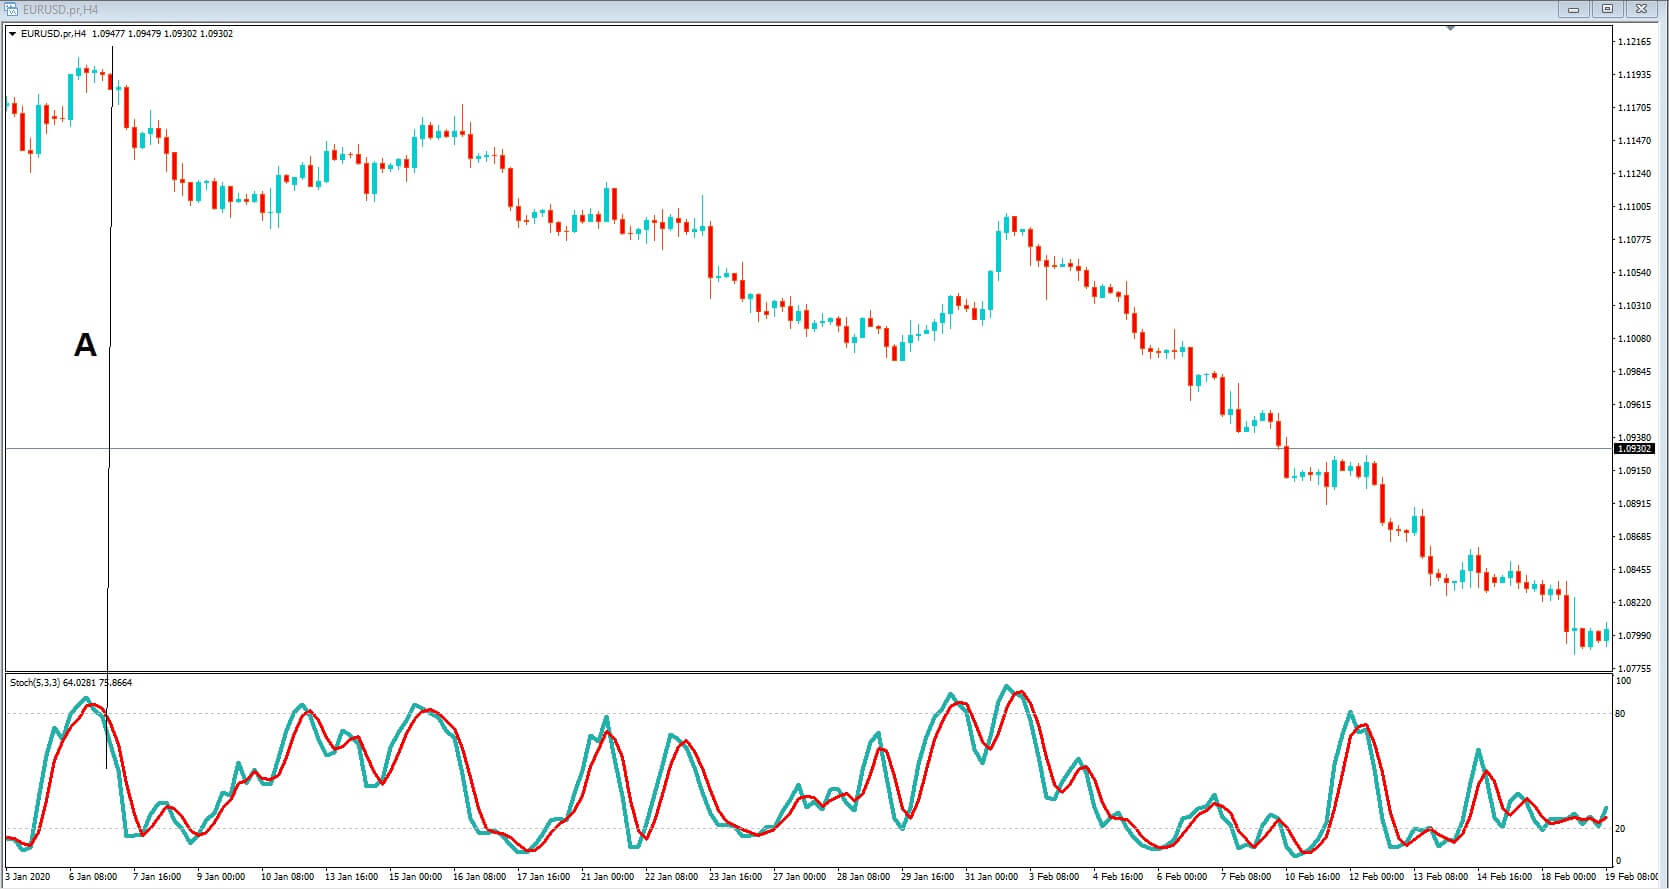
Insert A, The stochastic oscillator is used in technical analysis and was invented by George Lane in the late 1950s. The indicator measures the opening price of a financially traded asset and compares it to the closing price over a predetermined period of time. Because the data uses historical calculations and plots them in the form of two moving averages, the k-line, and the D-line, this is considered to be a lagging momentum indicator. The actual mathematical complications for the tool are very complex, and we will not be going into them in this session. The basic and generally widely used settings for the stochastic oscillator will automatically be set by your broker at 5 3 3. More experienced Traders are able to adjust the settings to their preference. However, we will be leaving them at the standard settings, and that way, we will be very much going with the crowd as it were in this example.


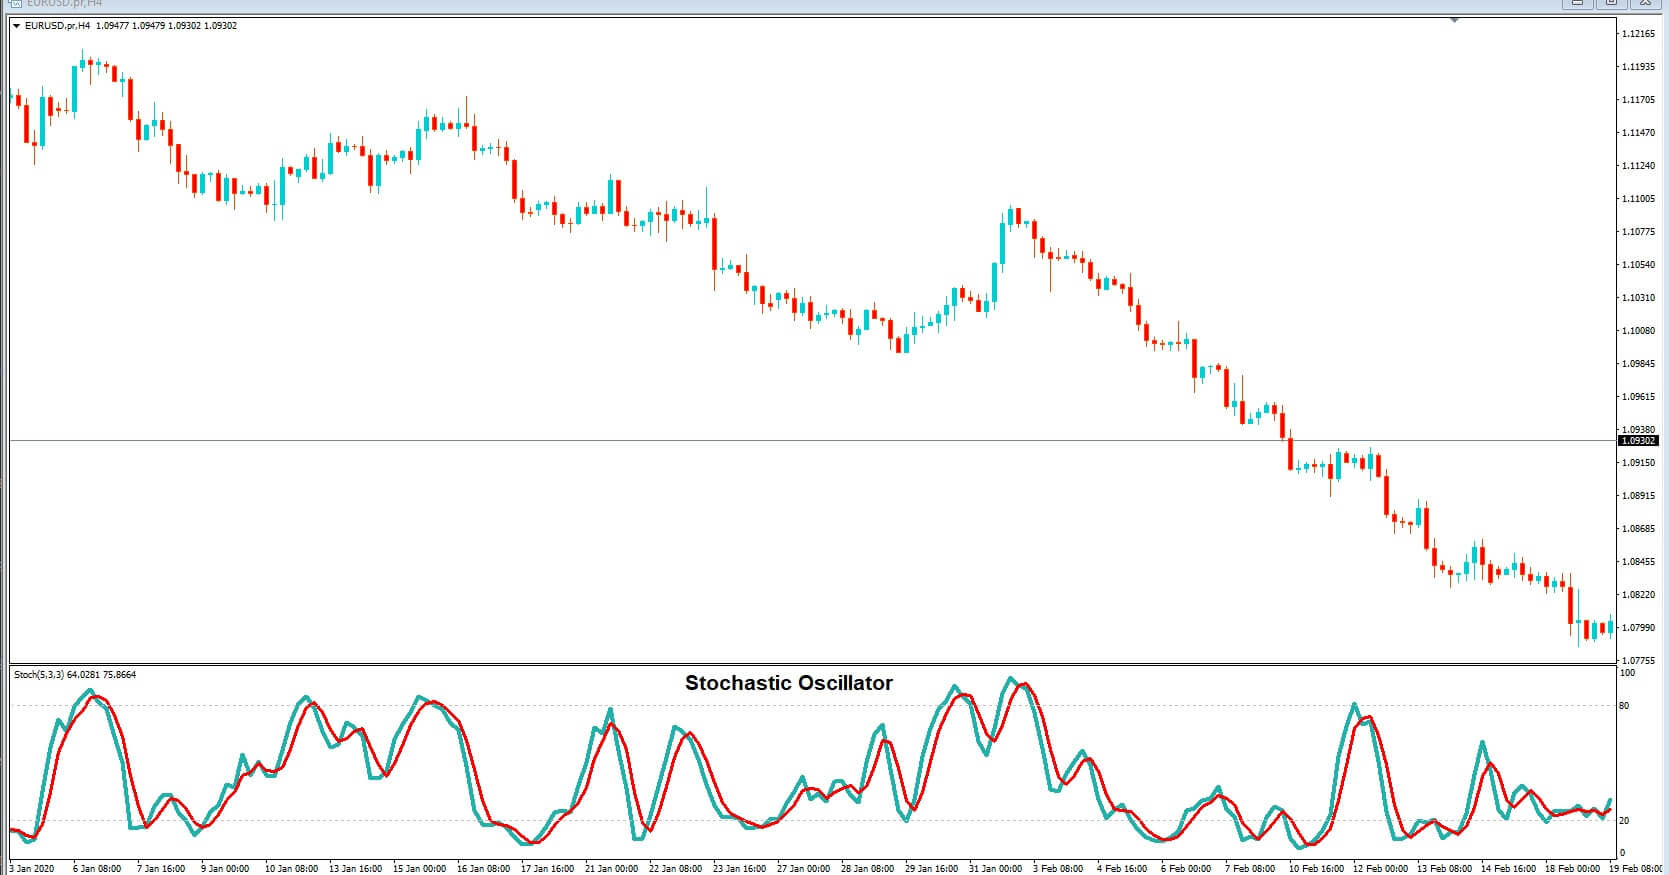
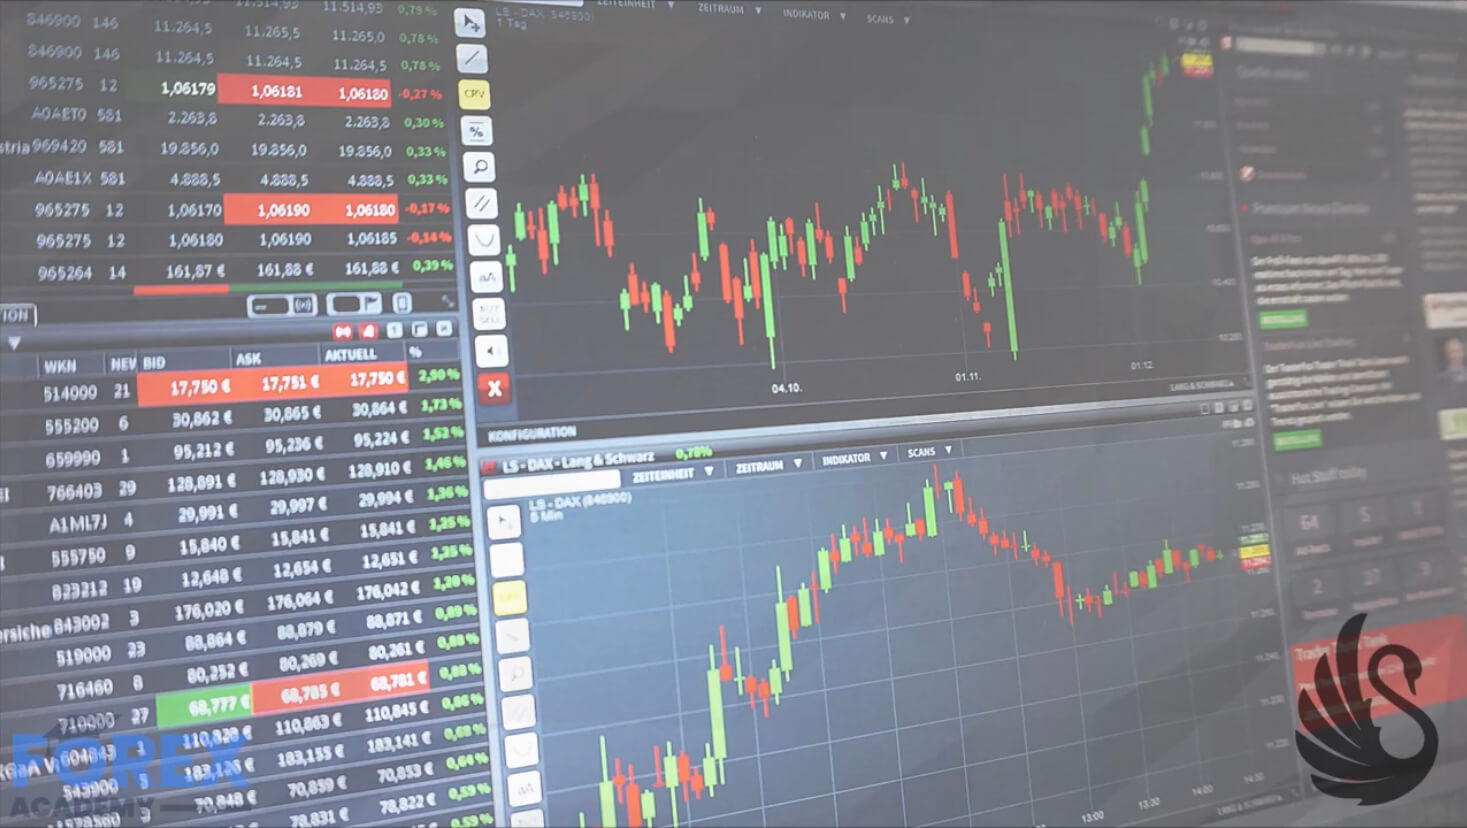
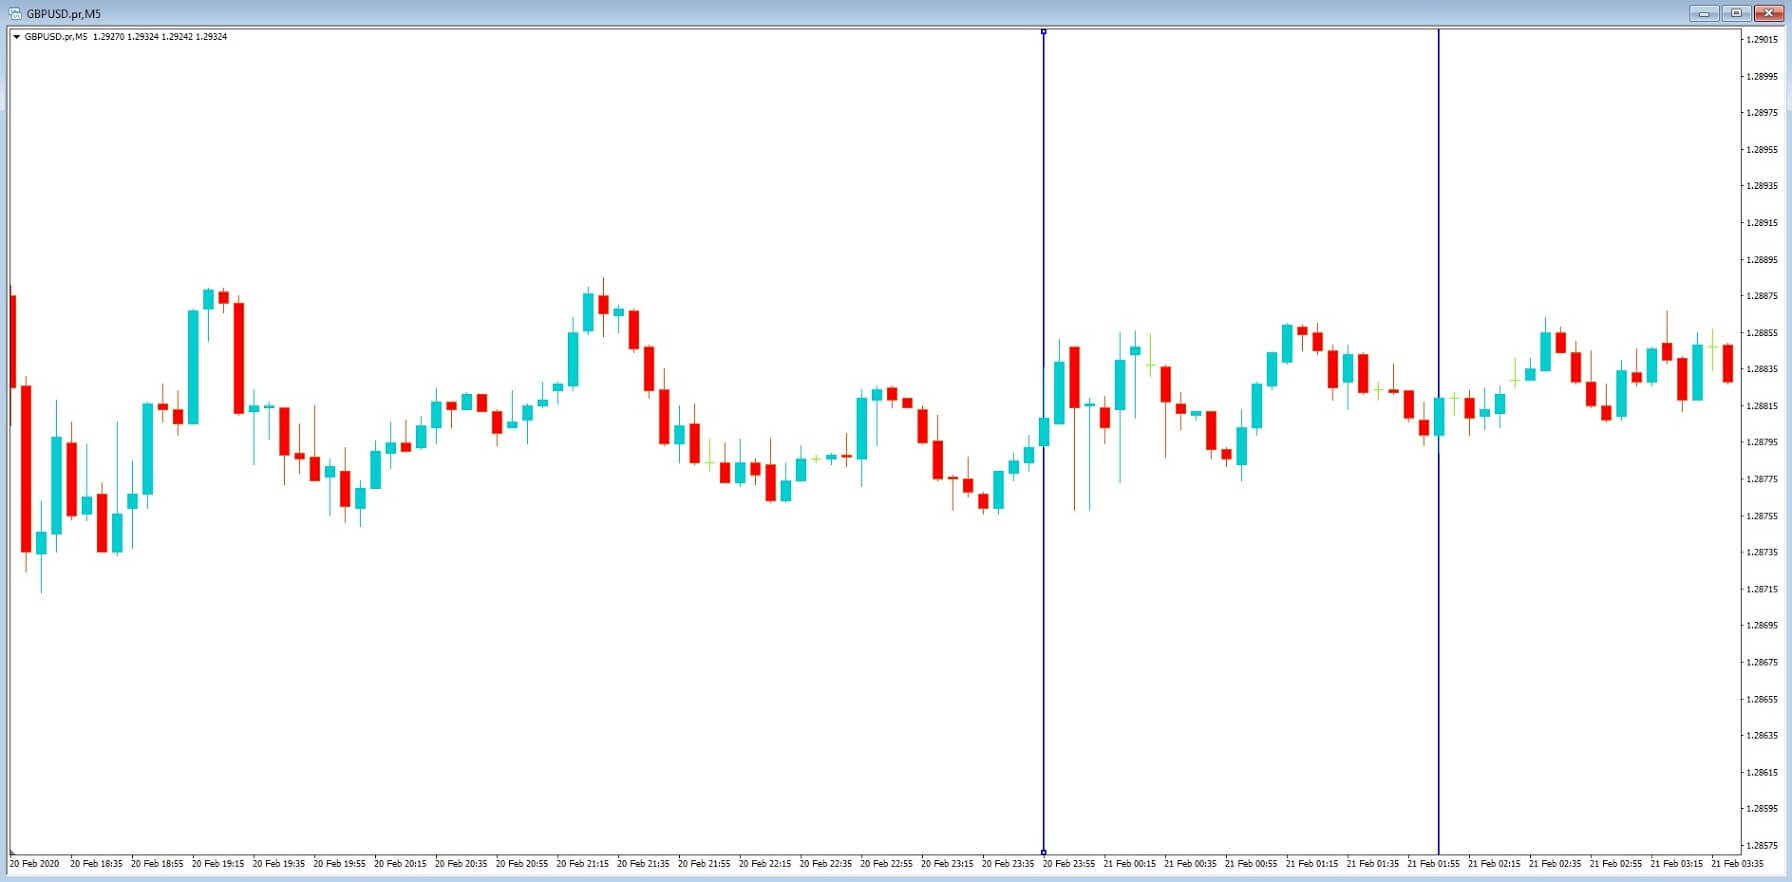
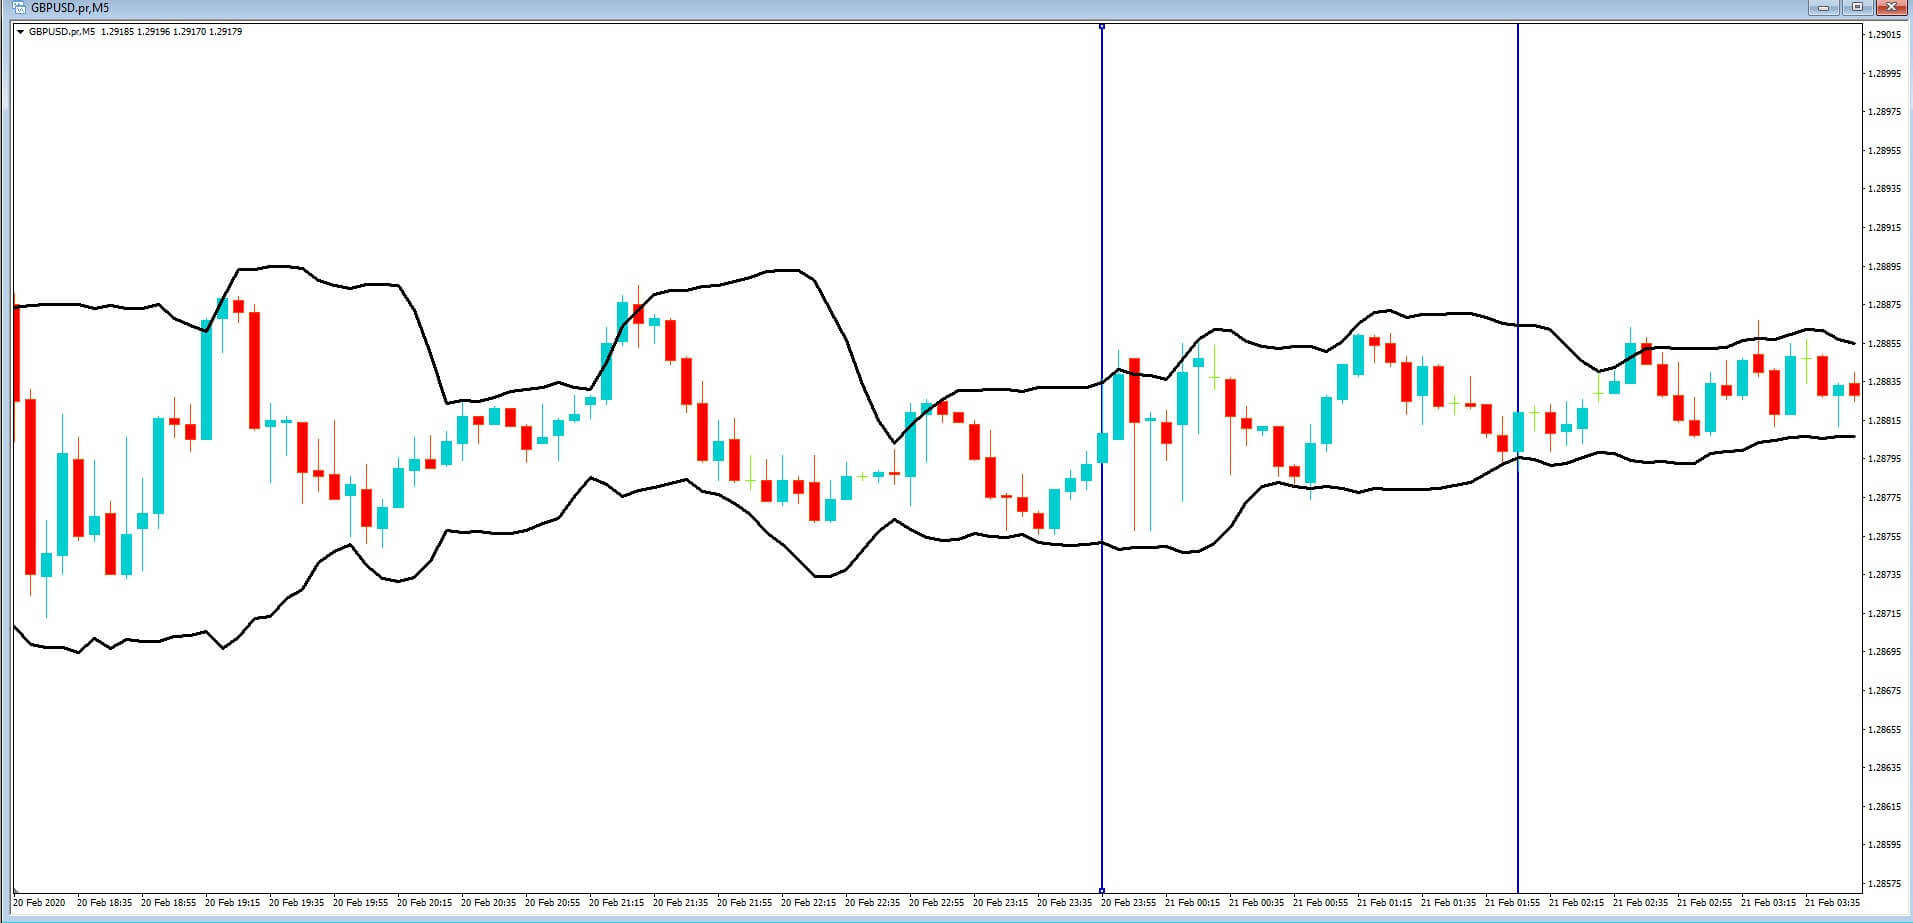
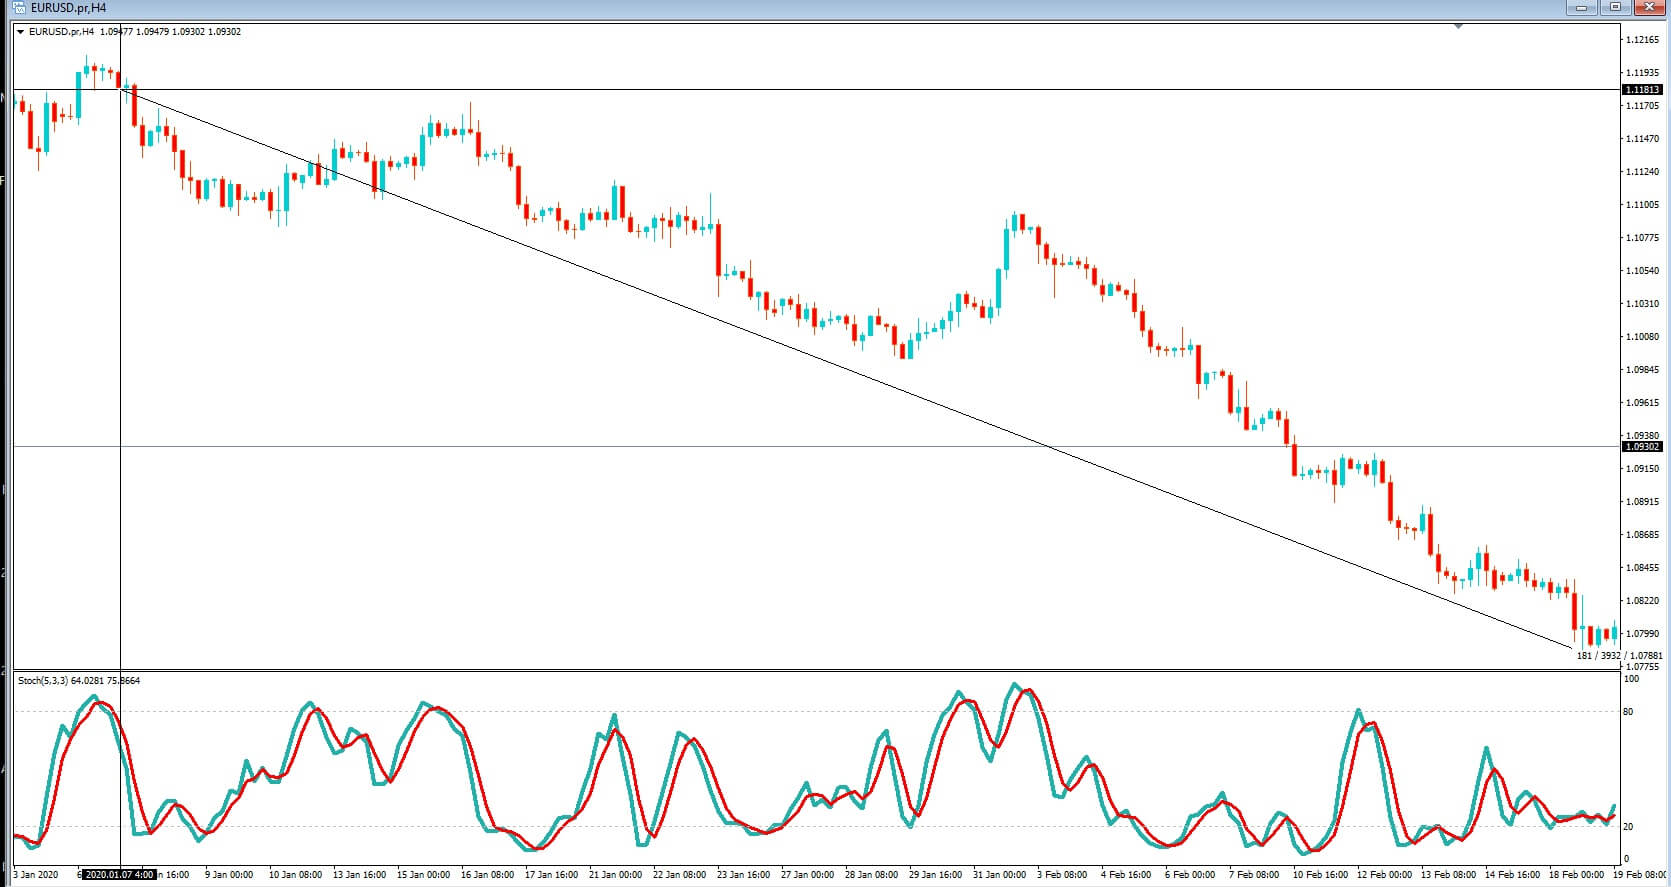
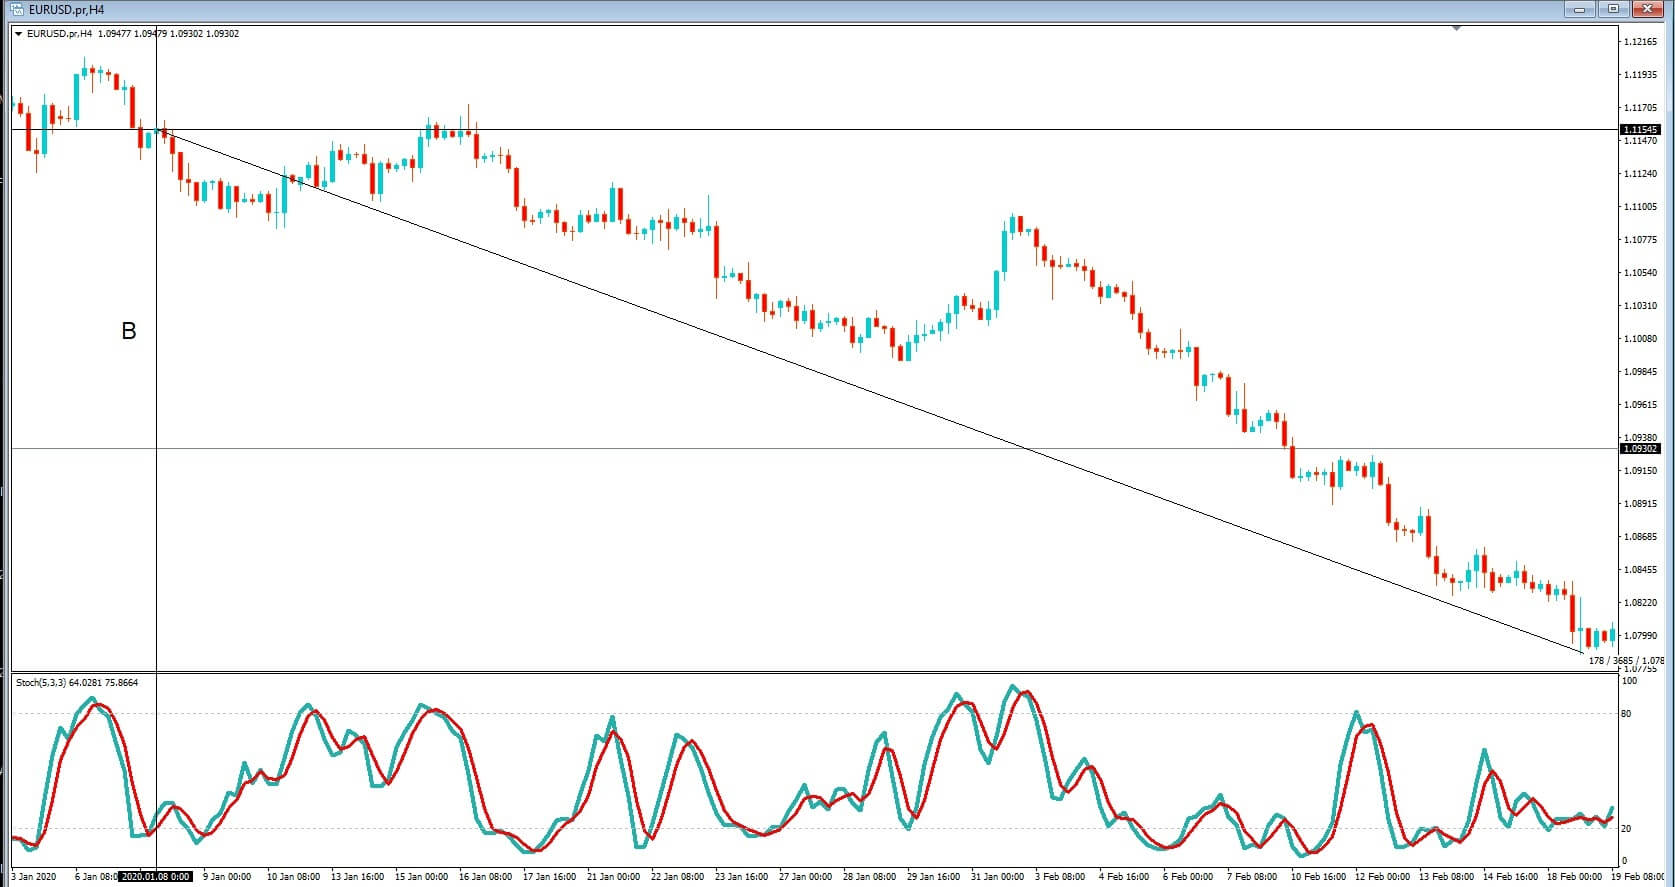
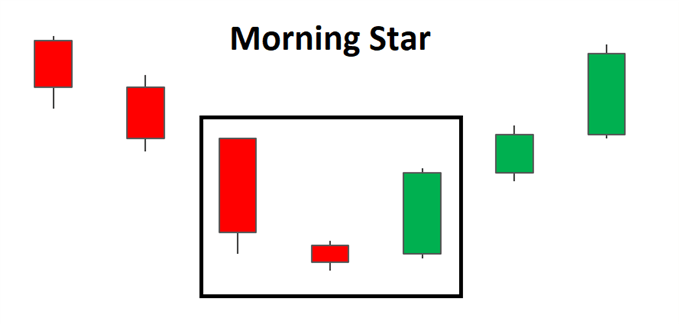
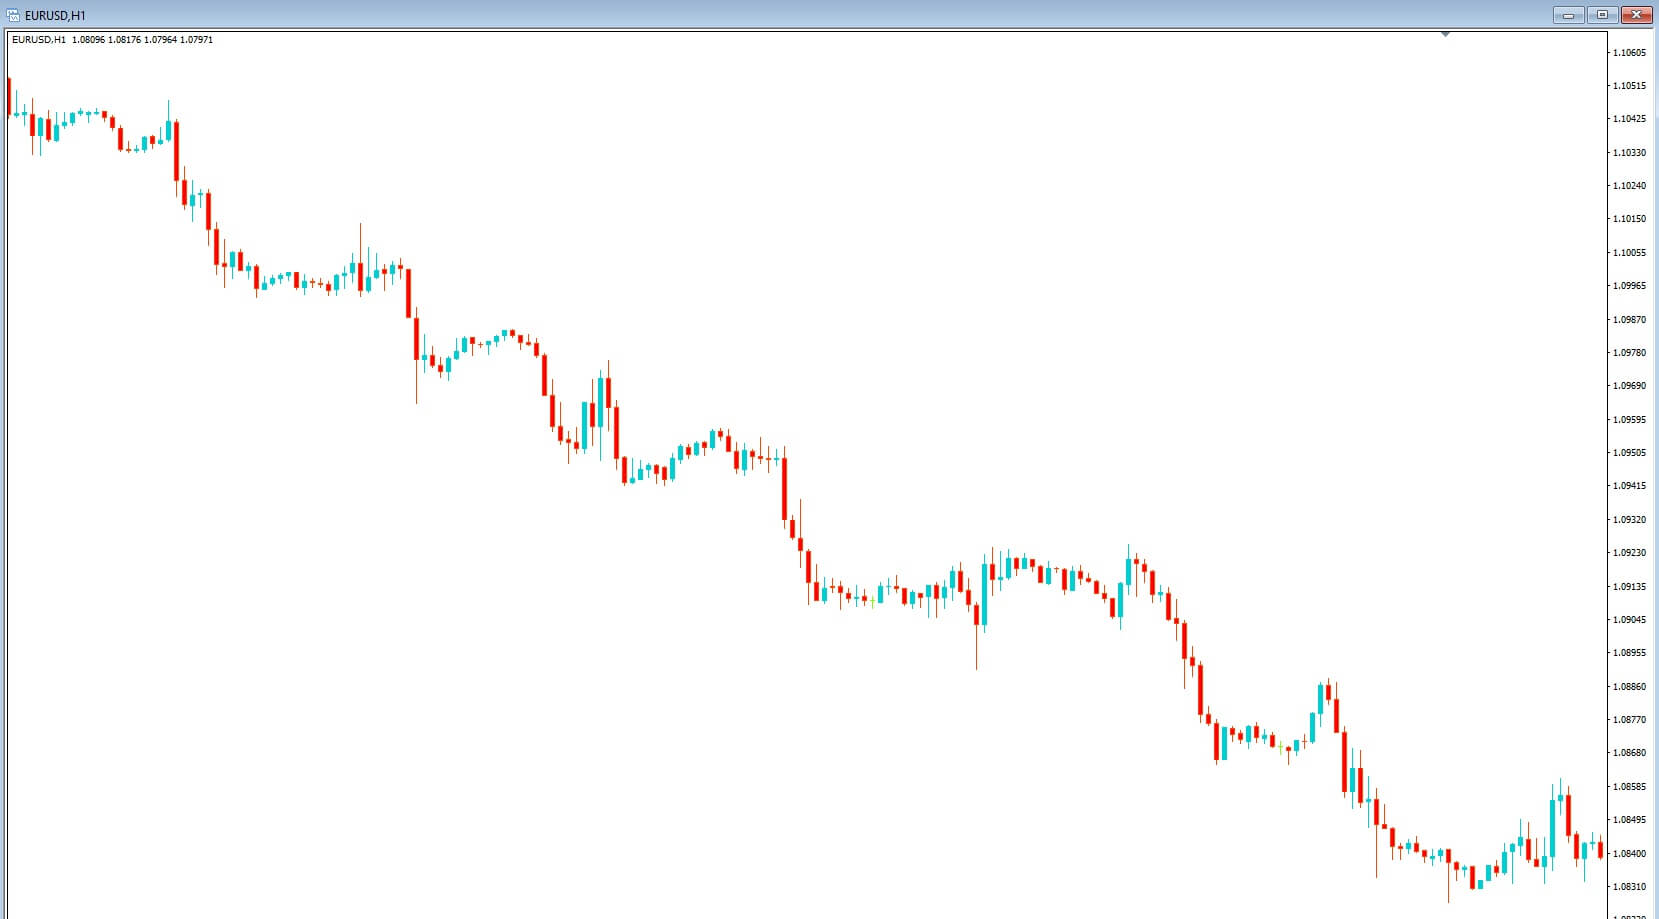
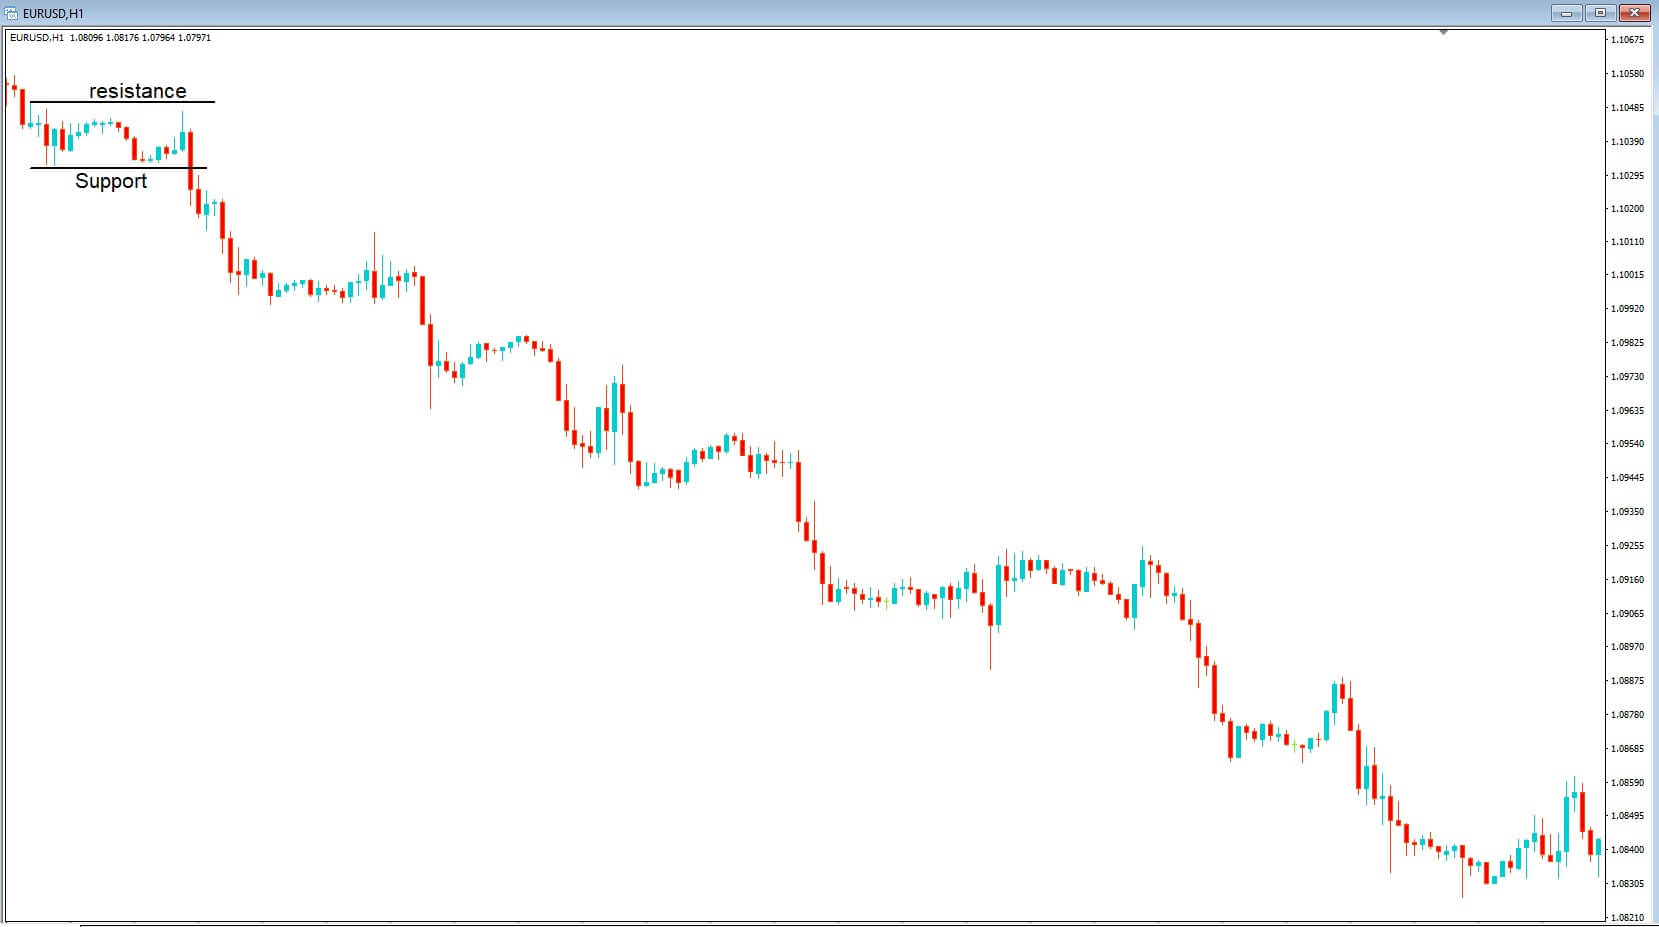
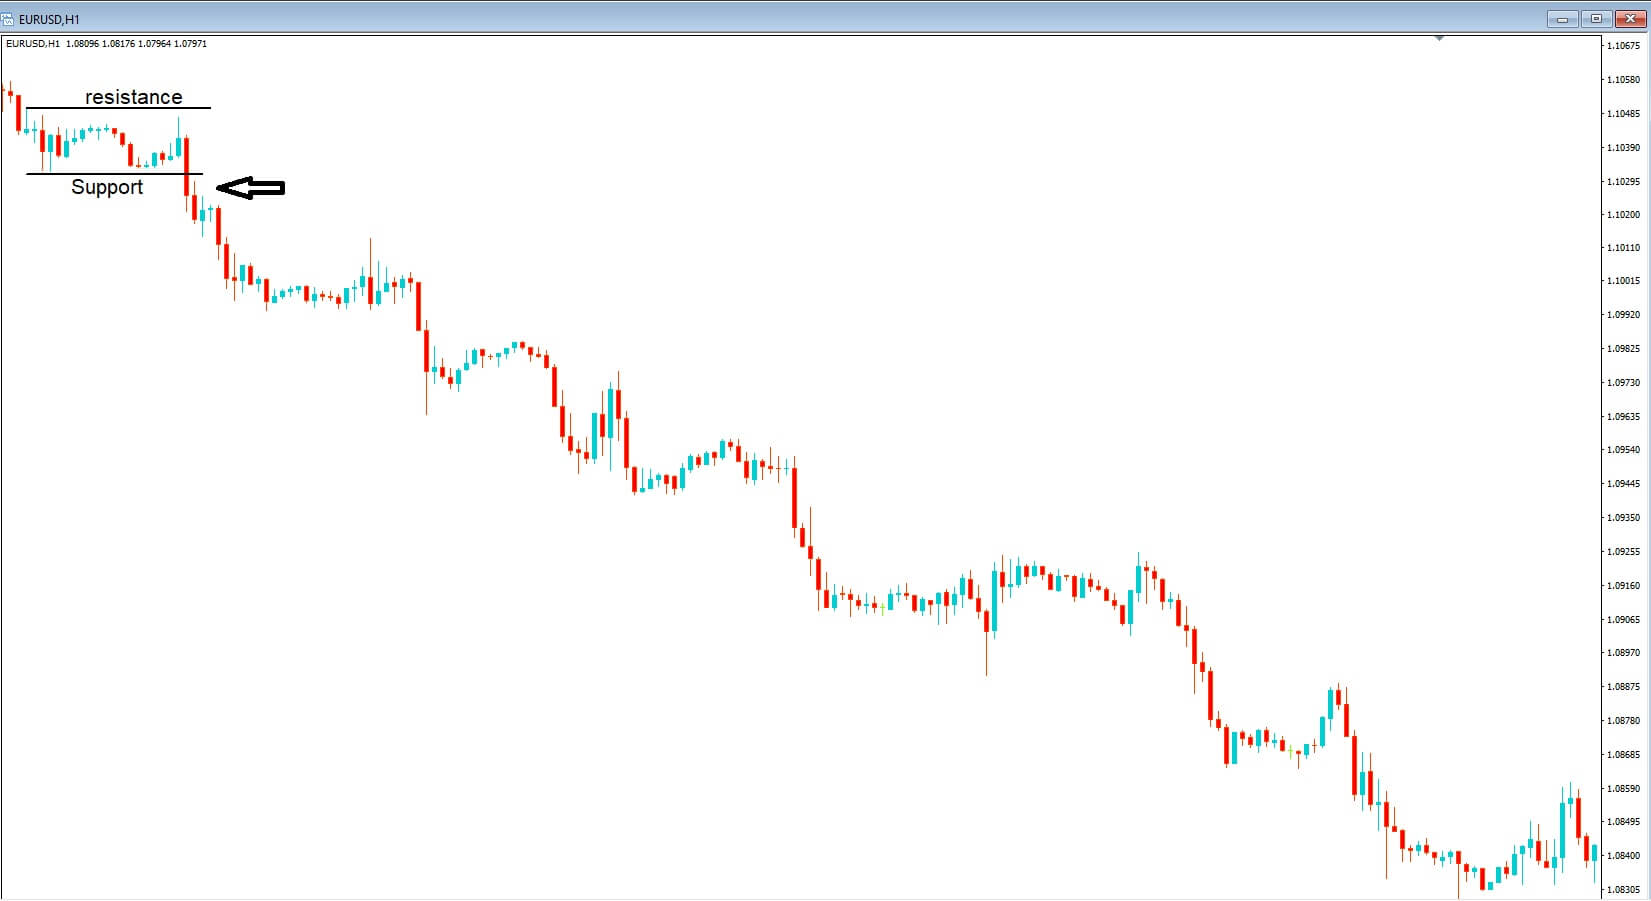
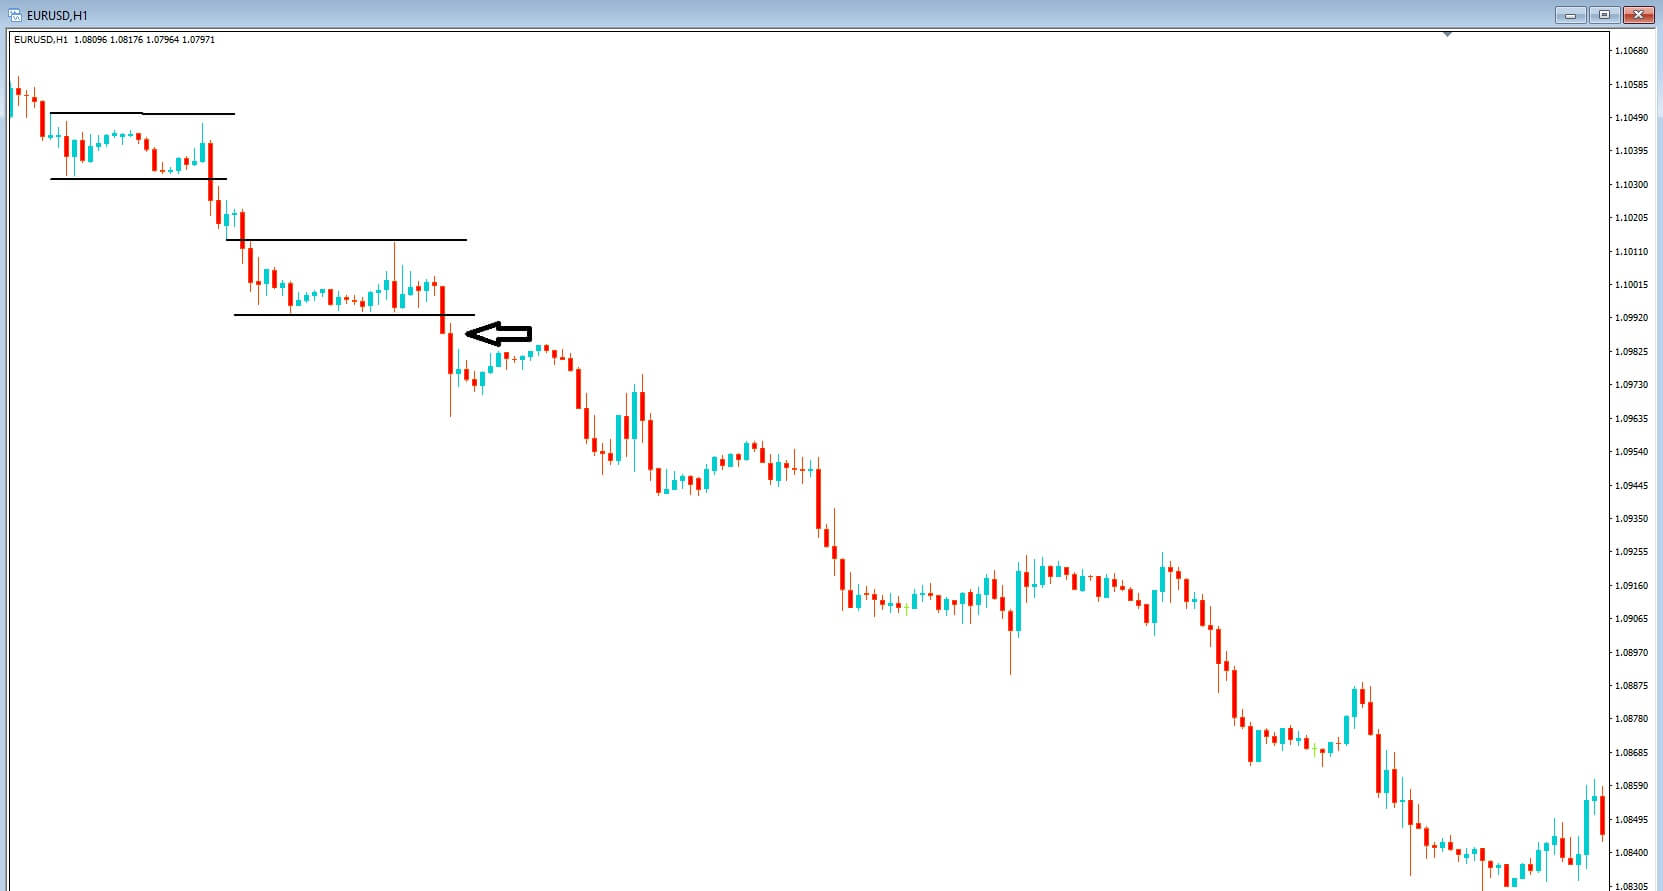
Insert B, The stochastic oscillator is widely used by professional traders and will be offered on almost every trading platform. It can simply be dragged straight onto your trading chart and will sit at the bottom, as in our example.


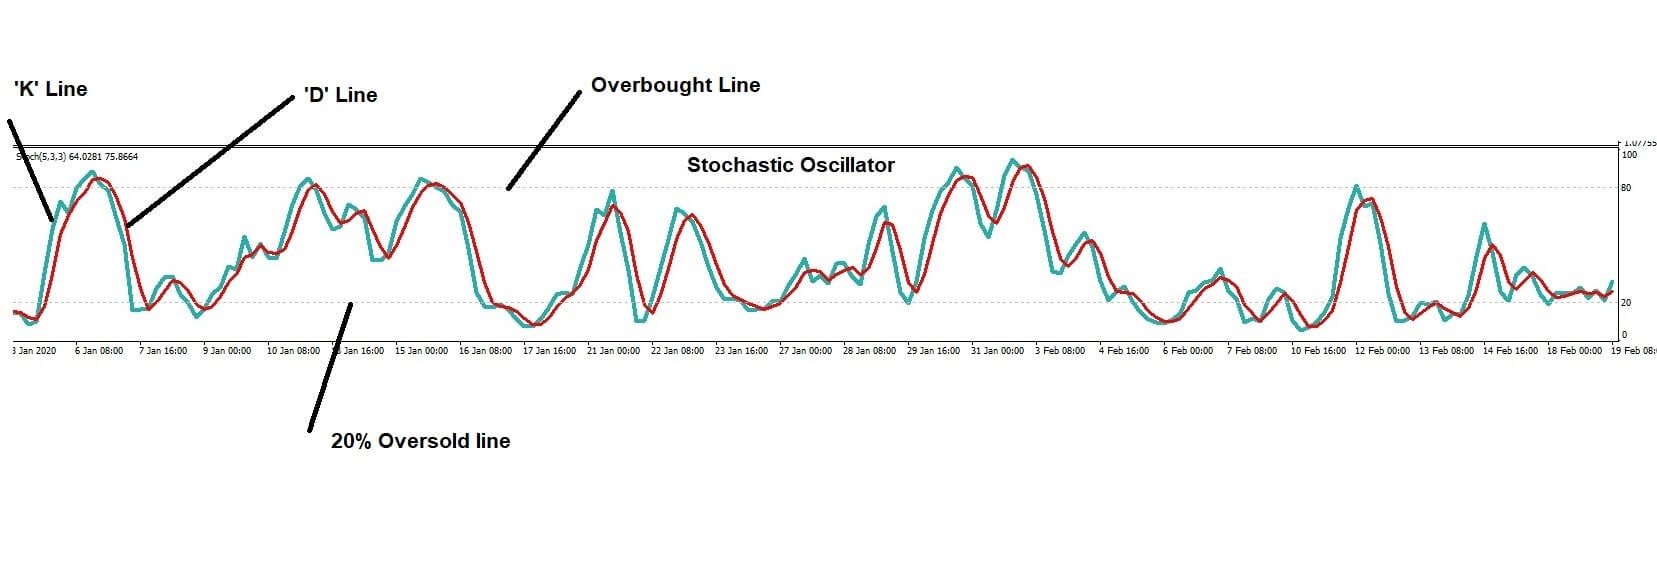
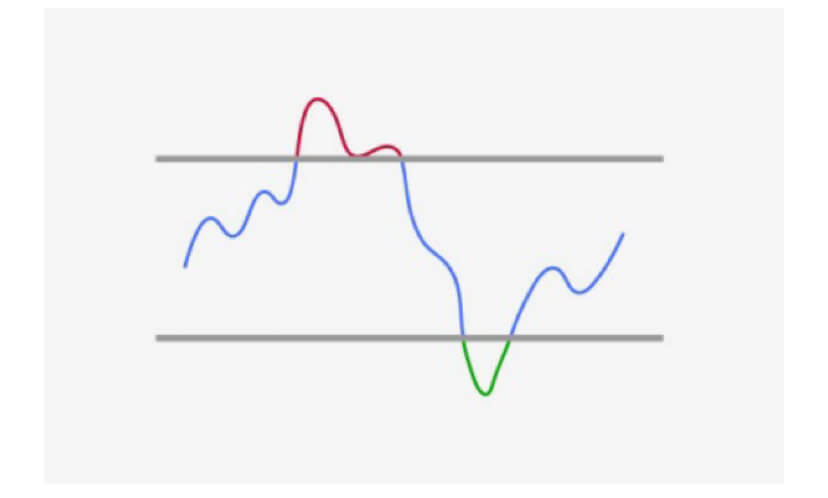
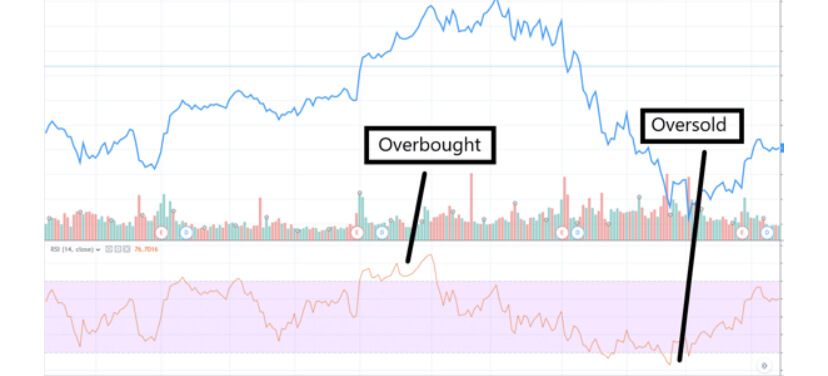
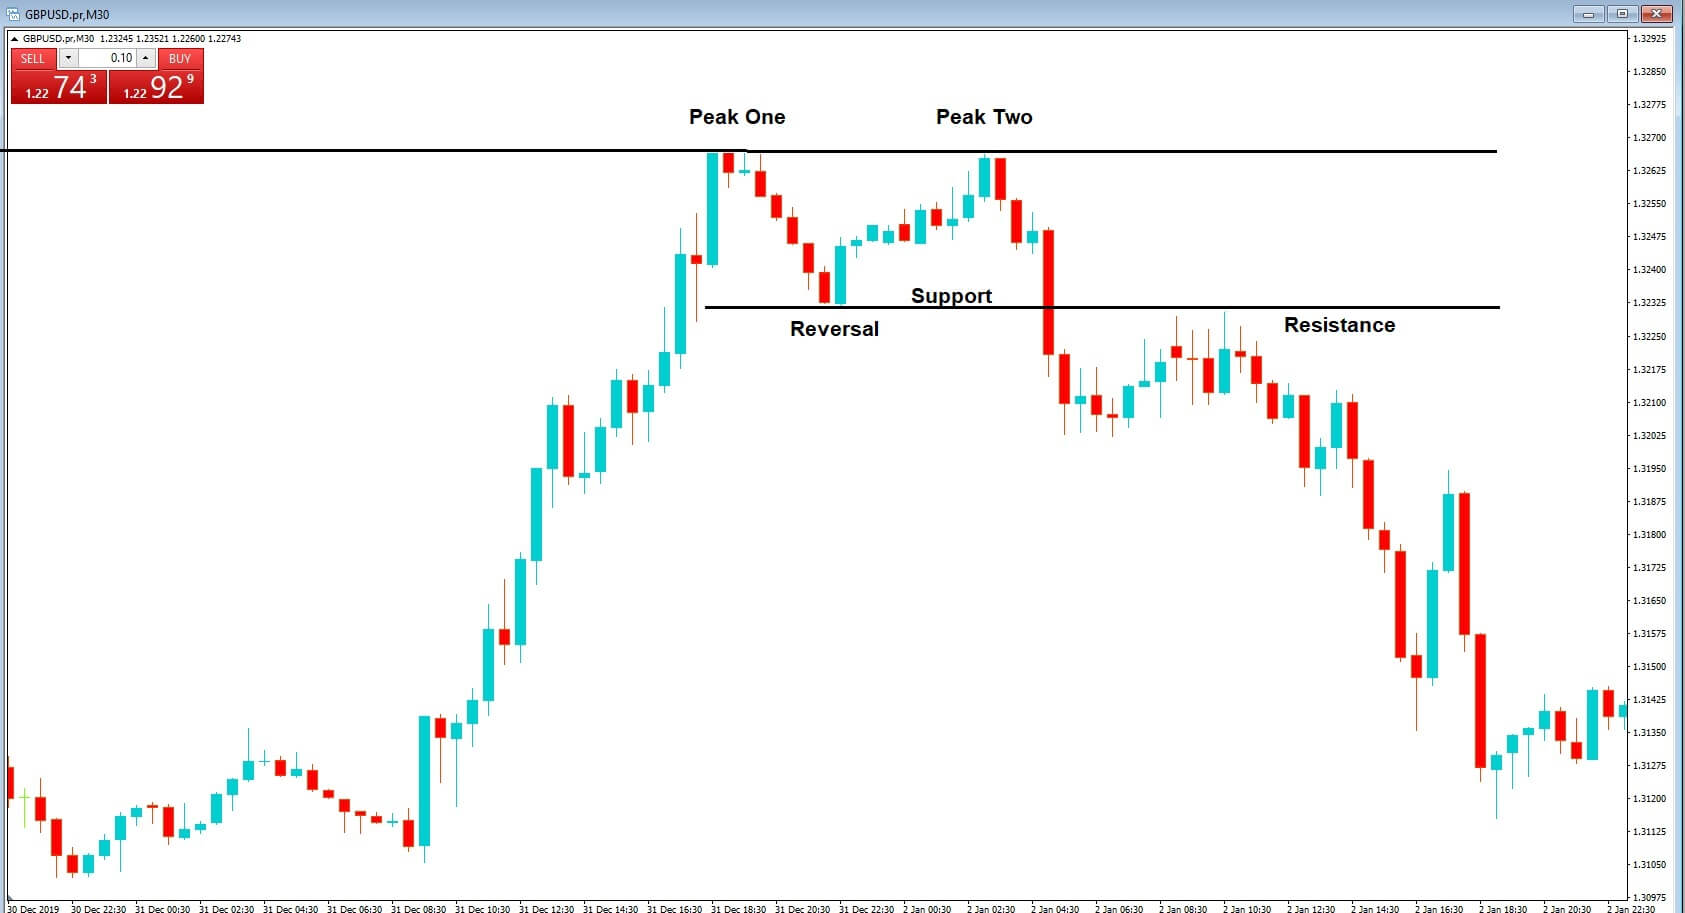
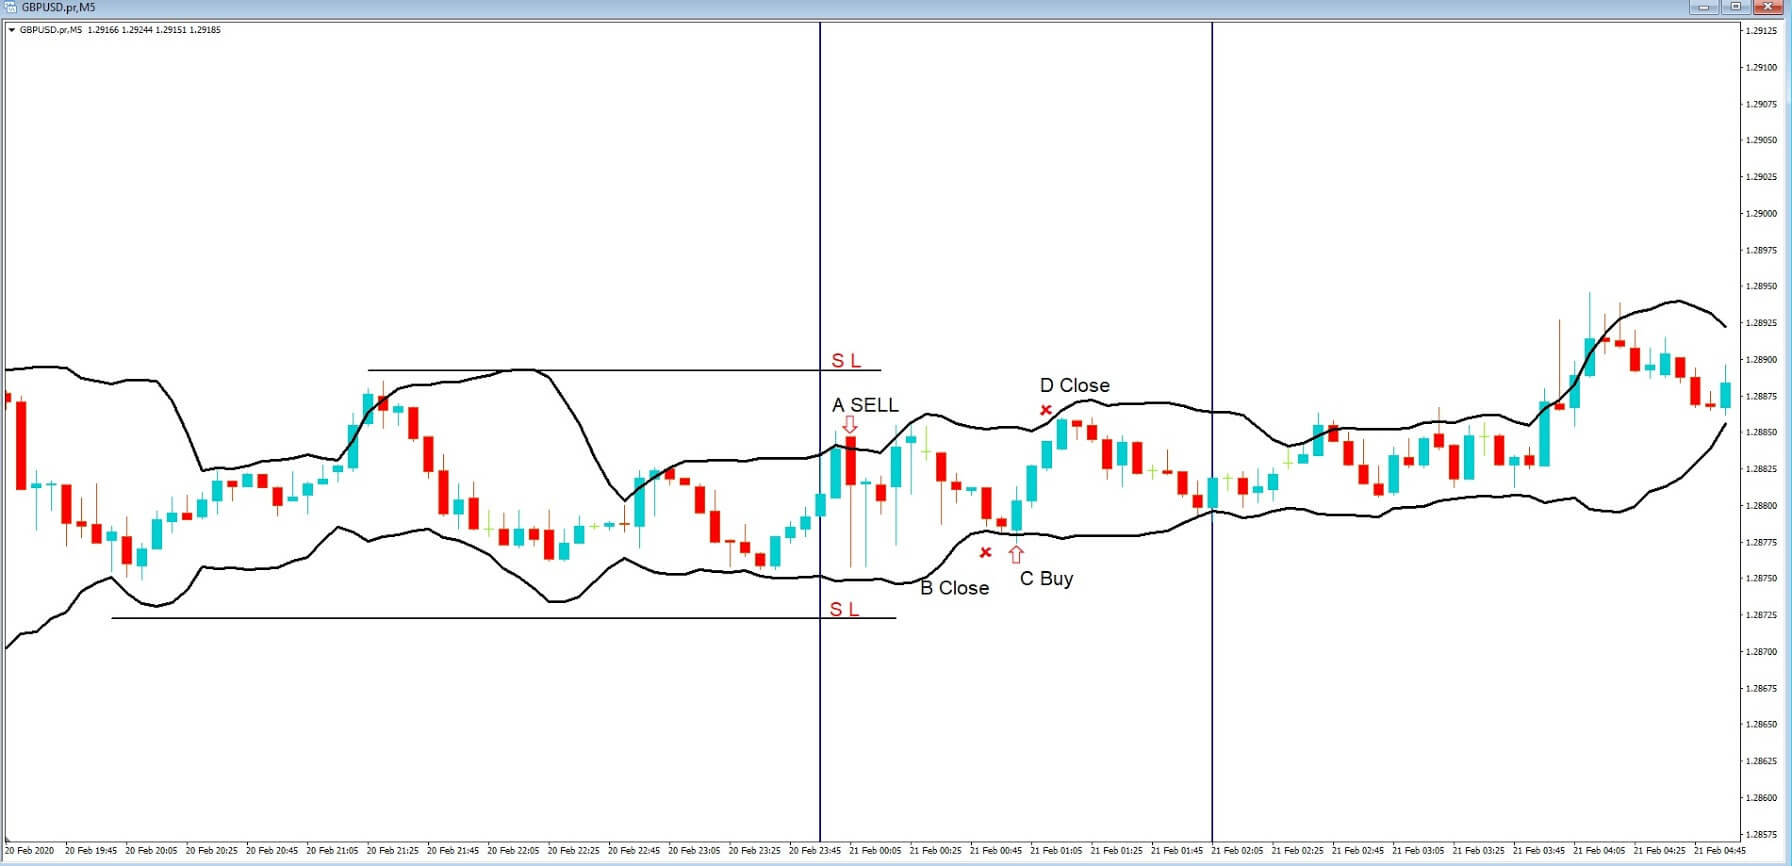
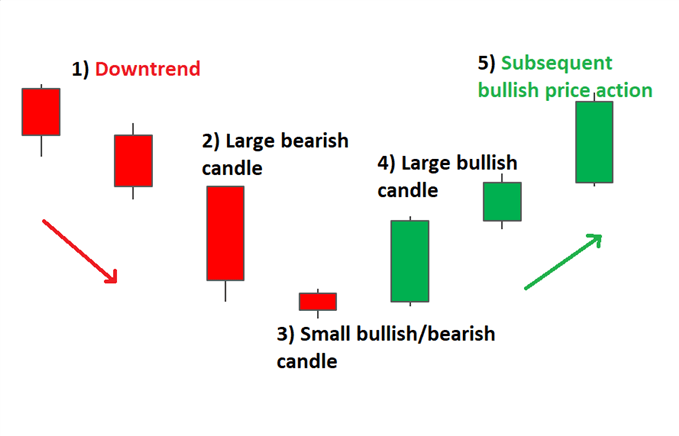
Insert C: The basic principle is that the Kline which is calculated over a slightly longer time period than the D line and when both of these lines are above the 80% Overbought line, the currency pair is considered to be overbought, and when the K and D lines are below the 20 % oversold line, the pair is said to be oversold.


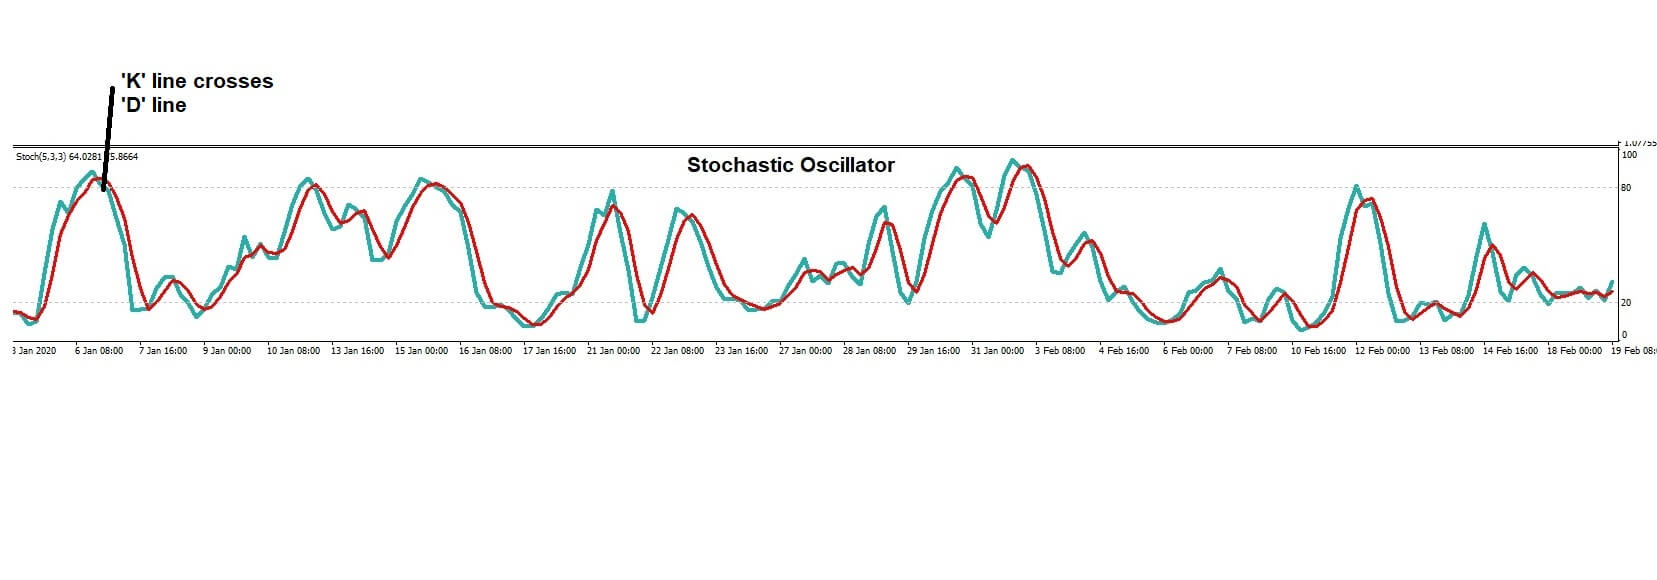
Insert D, traders look for the ‘k’ and D lines to have been above the 80% line in the overbought area and then dipped below the 80% line where the K-line has crossed over the d line, at which point they will go short on the currency pair.


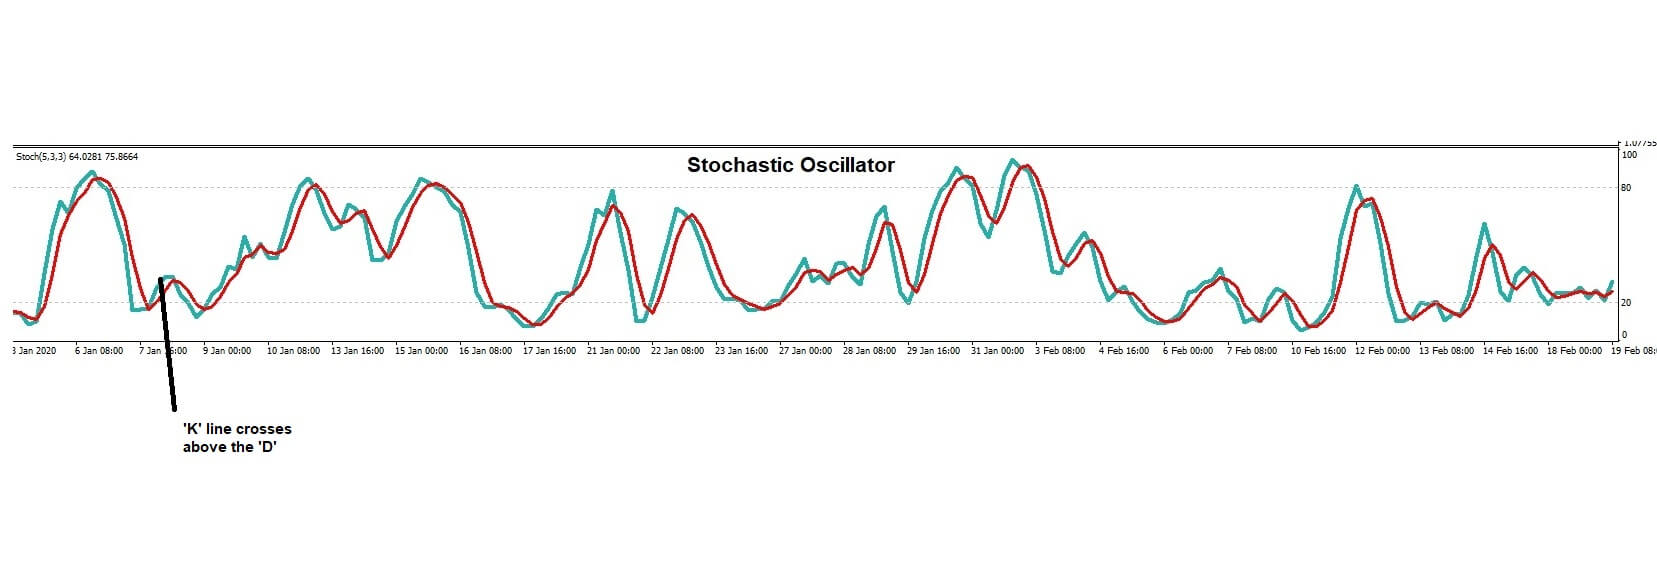
Insert E, Conversely, traders look for the K and D lines to have been below the 20% oversold line, and where the K-line has crossed above the D-line, they use this as a signal to buy a currency pair.
One of the biggest areas that new Traders falling into a trap is that they take the stochastic signal has been gospel and trade it accordingly and then wonder why they are losing money.
And so, is the stochastic indicator a friend or foe? First, we have to remember that all indicators, and especially lagging indicators, are just that: indicators. They are an indication that the market, in this example, might be overbought and ready to turn lower, or that the market is oversold and it might be ready to move higher.
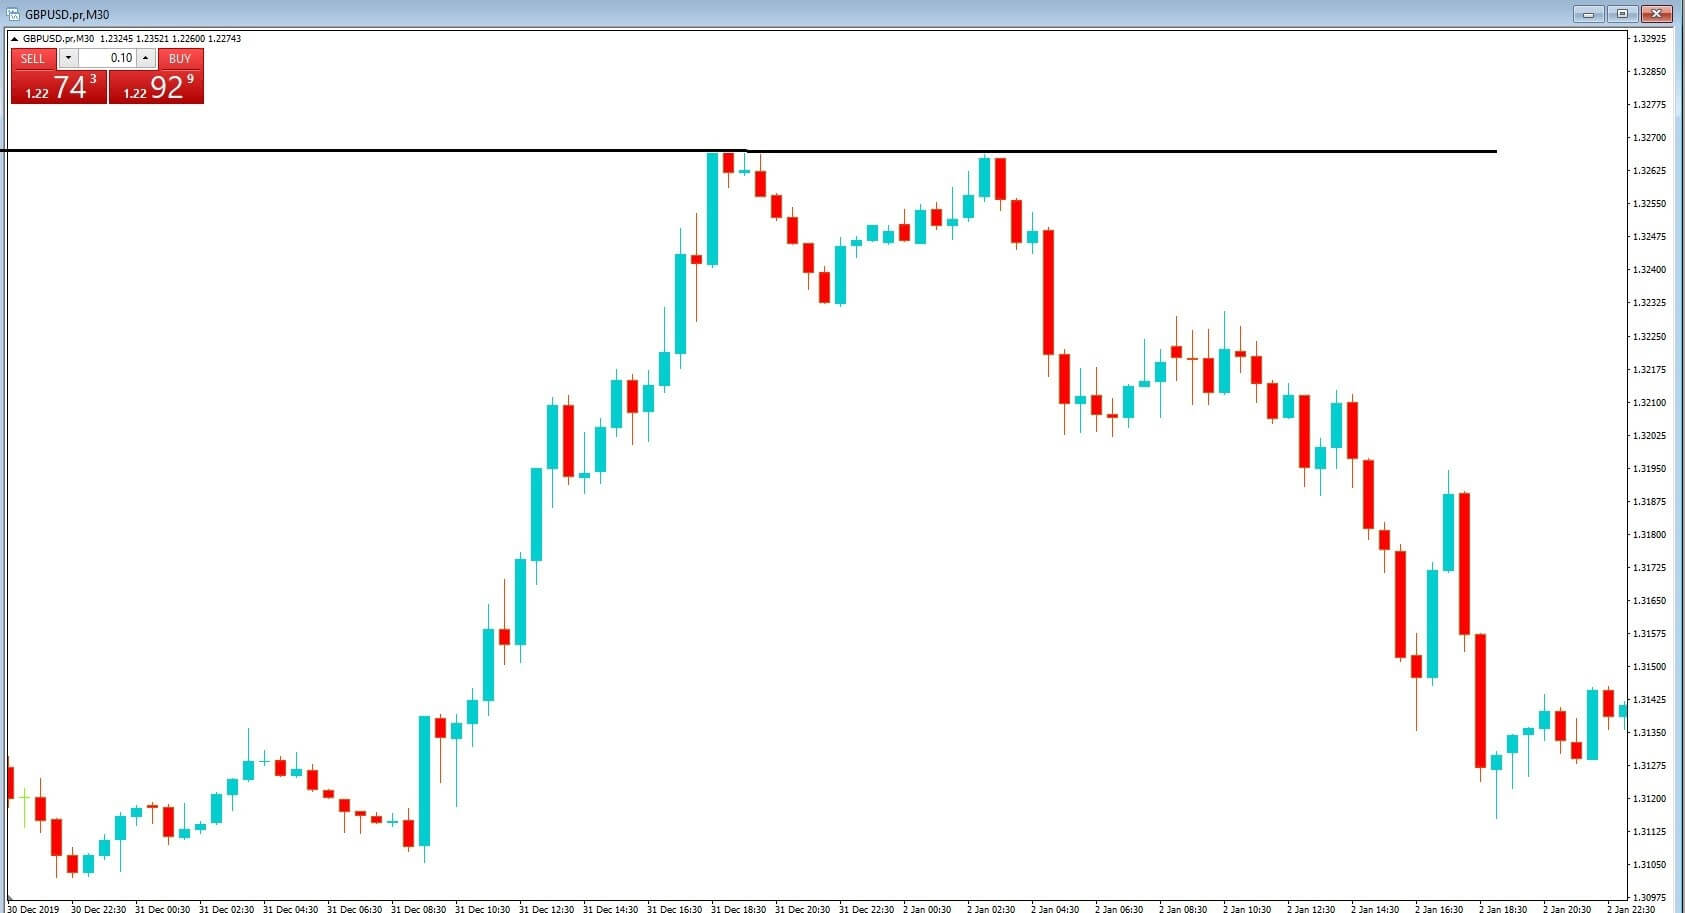
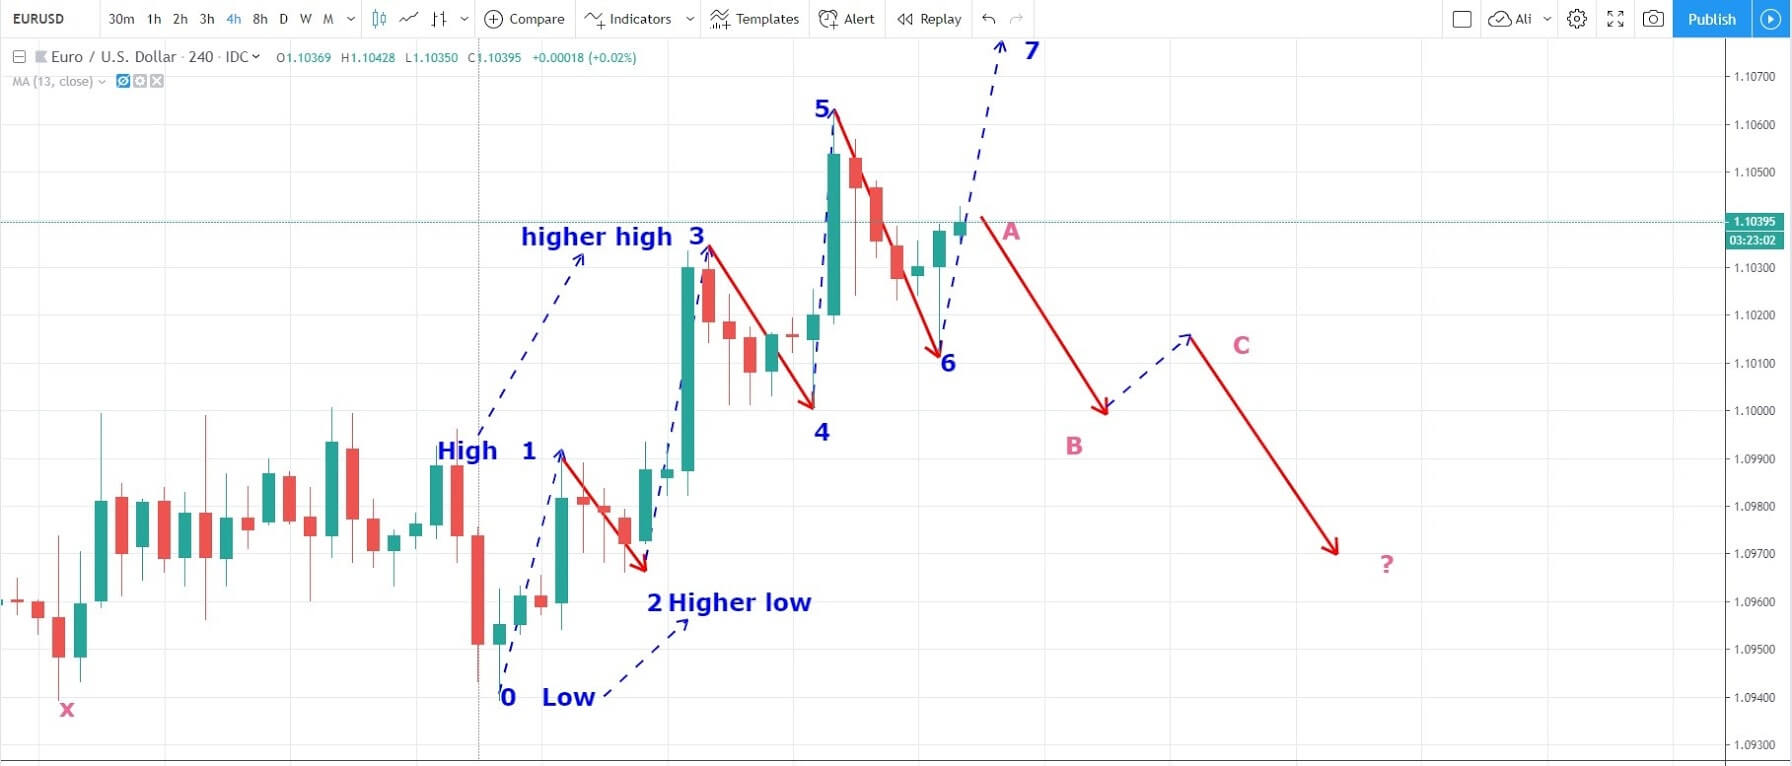
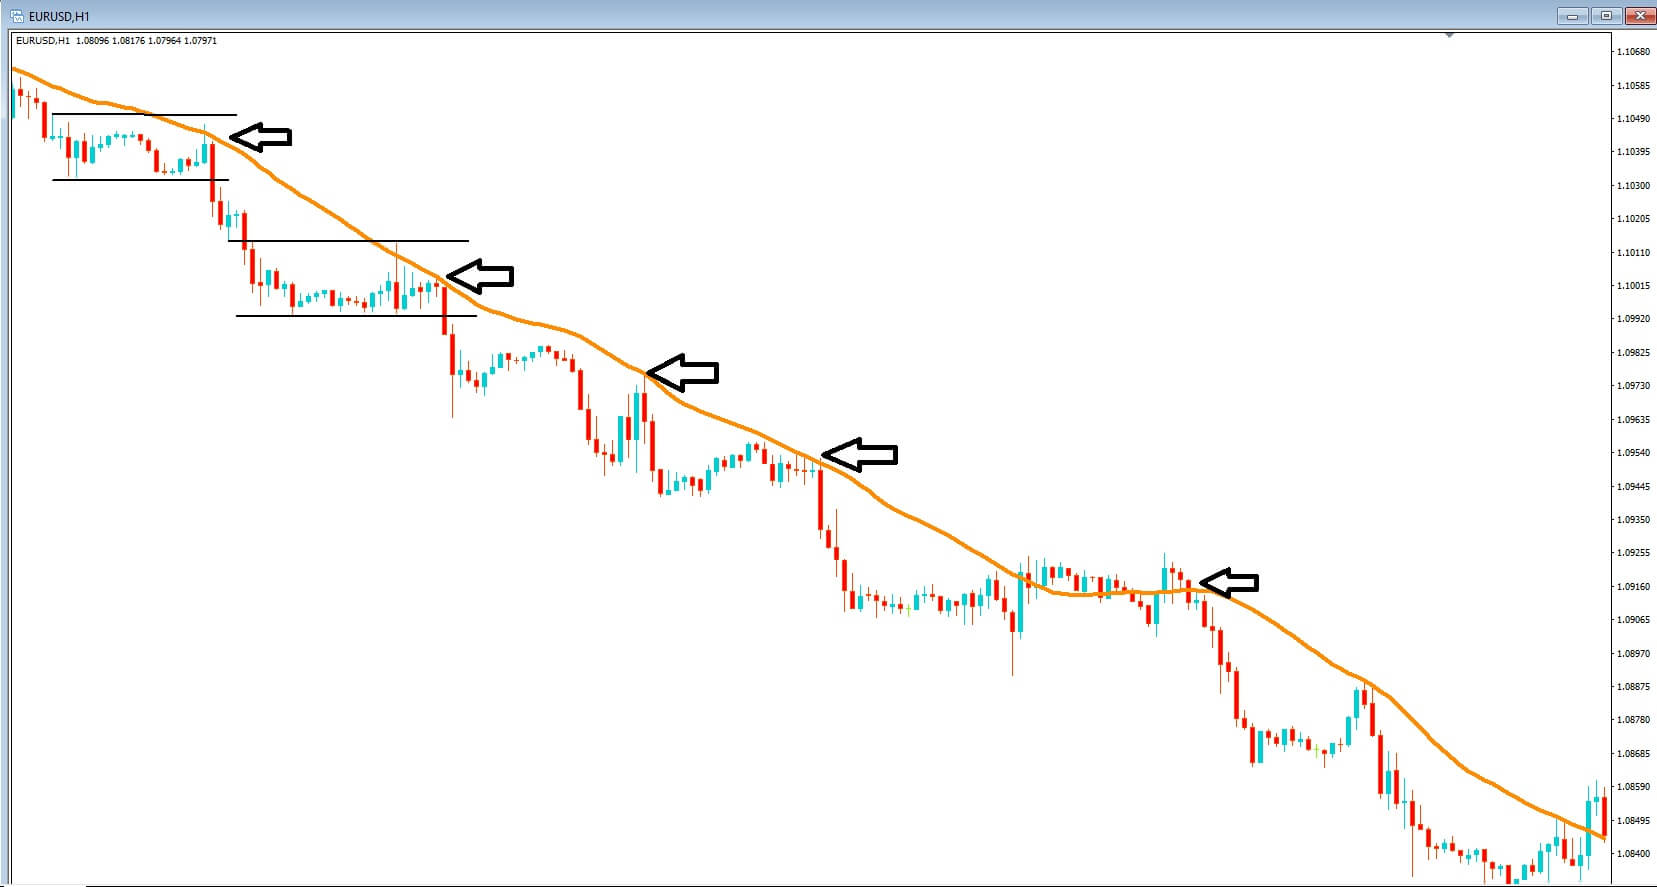
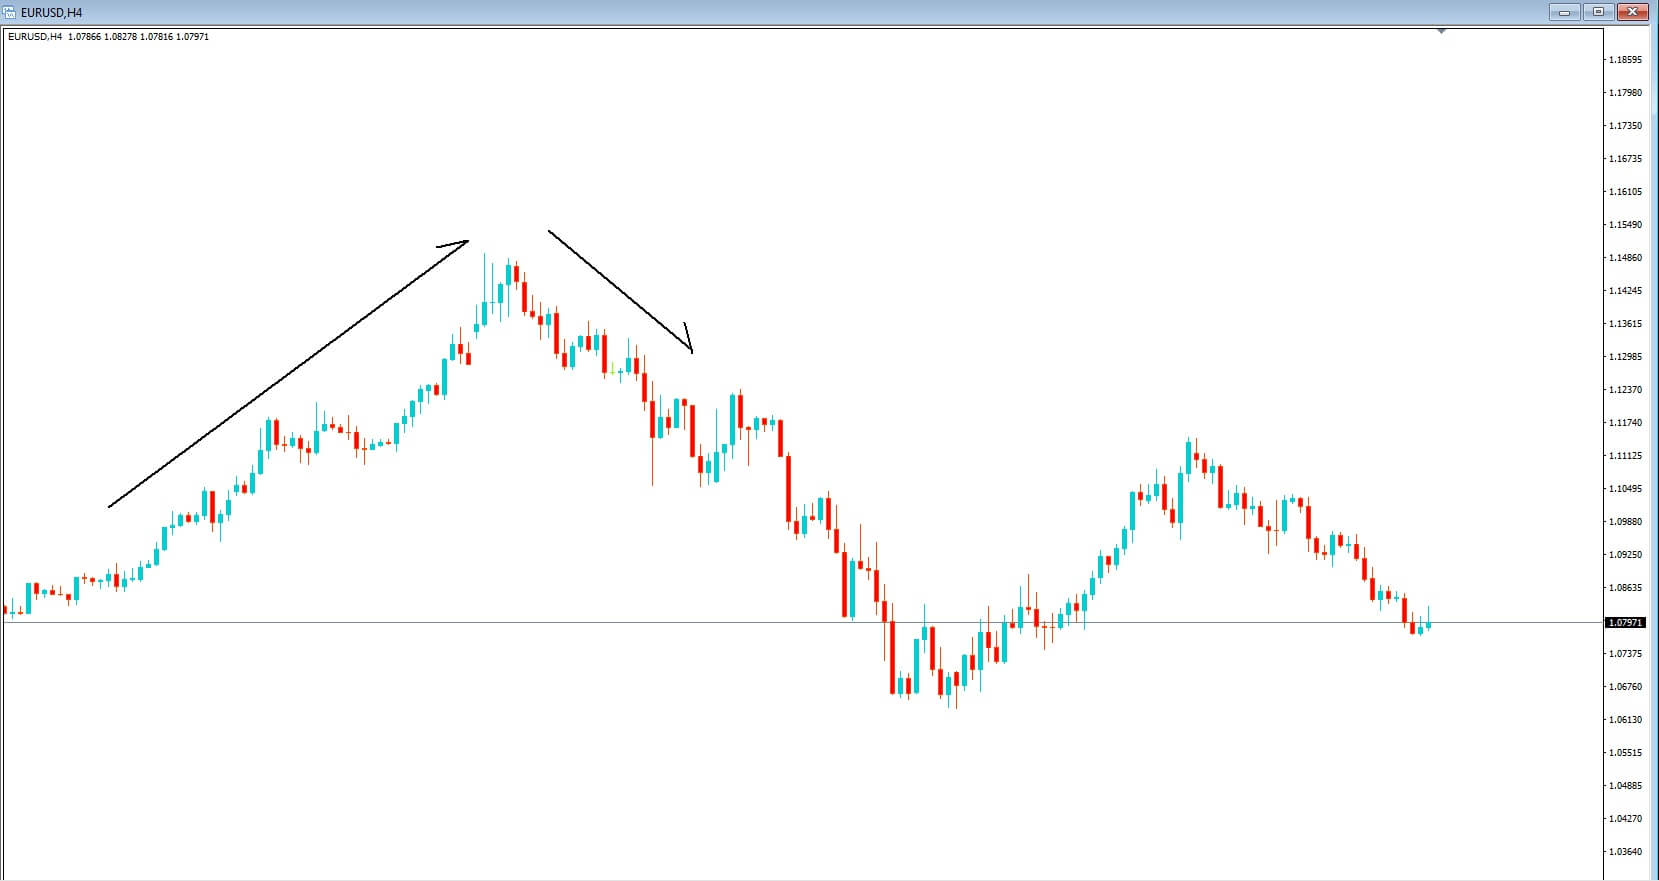
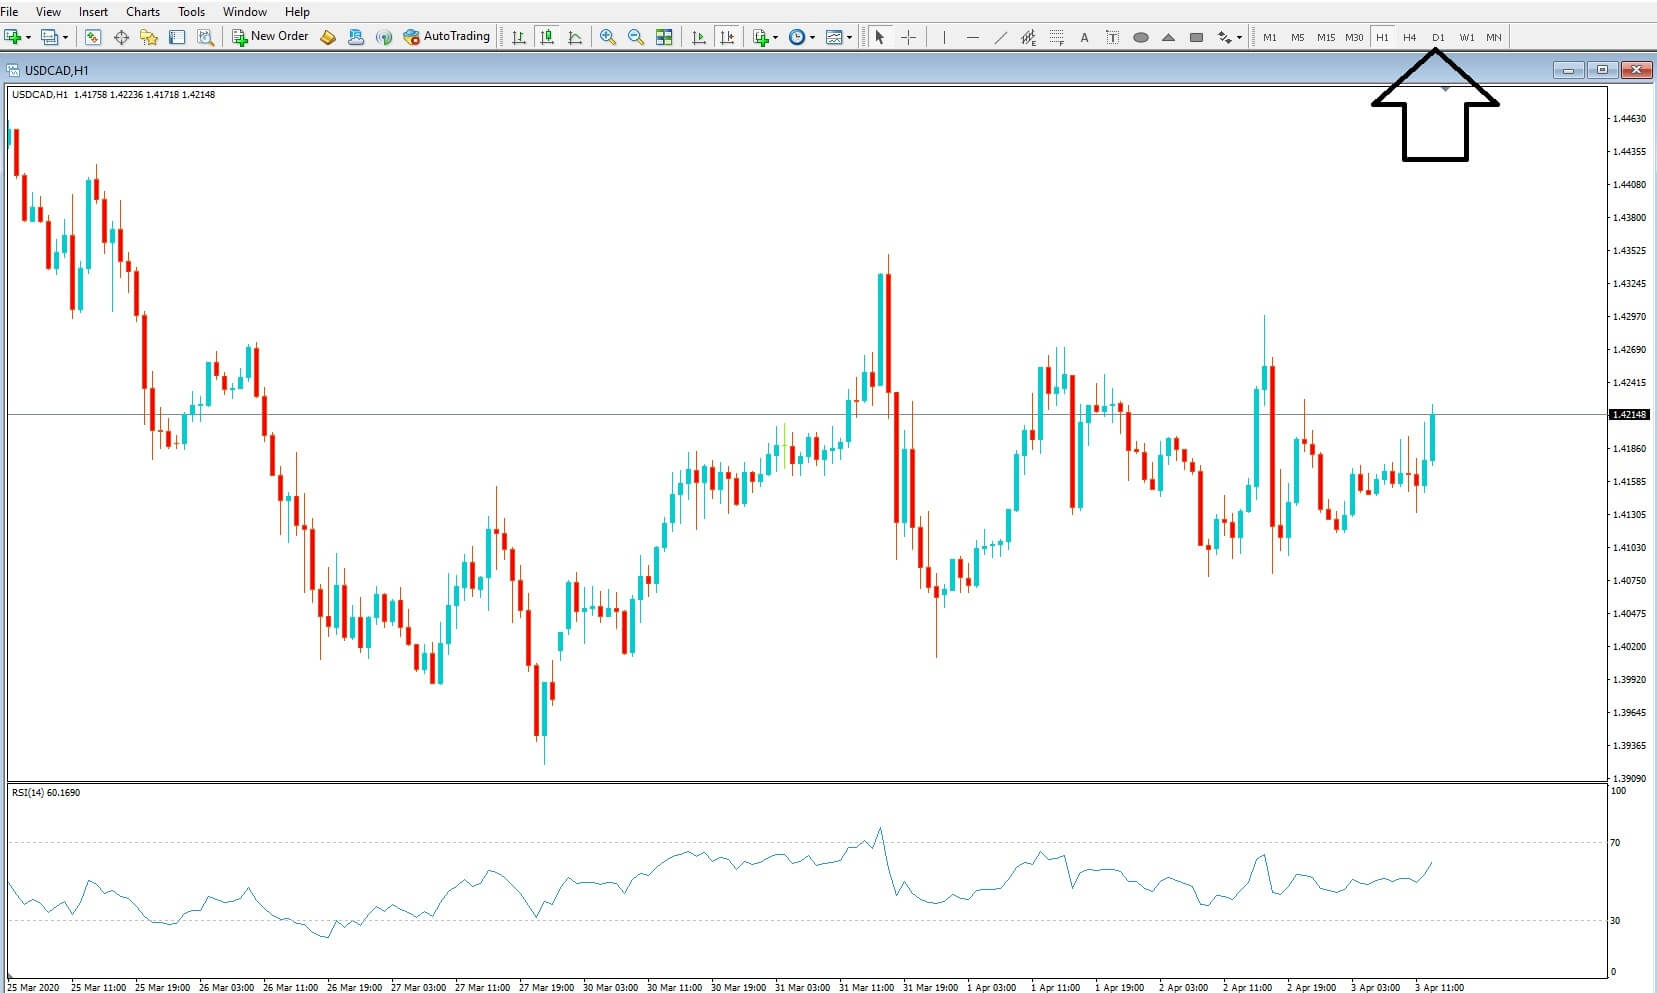
Let’s drill down a little bit more by going back to our 4-hour chart of the EURUSD pair. The longer the time frame, the more likely, the longer trend will become apparent, and that’s where the more pips will be realized, and of course, that translates into more money-making opportunities.


Insert F: By drawing a vertical line at position A, we can follow that down and see that the stochastic k and D lines have both moved above the 80% overbought area, and that’s the k-line has crossed below the d line, and both lines have moved below the 80% overbought line. This is represented by the price action which has been falling.


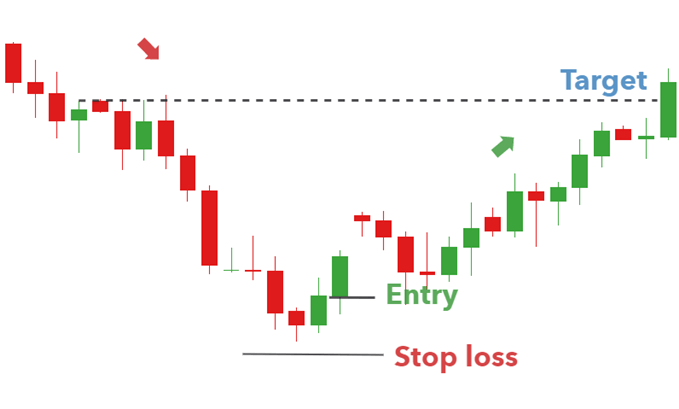
Insert G: Traders who sold the pair on this signal and stayed in the trade would have seen an overall pip movement in their favor of 390 pips, which is huge. The stochastic was a true friend at this point.


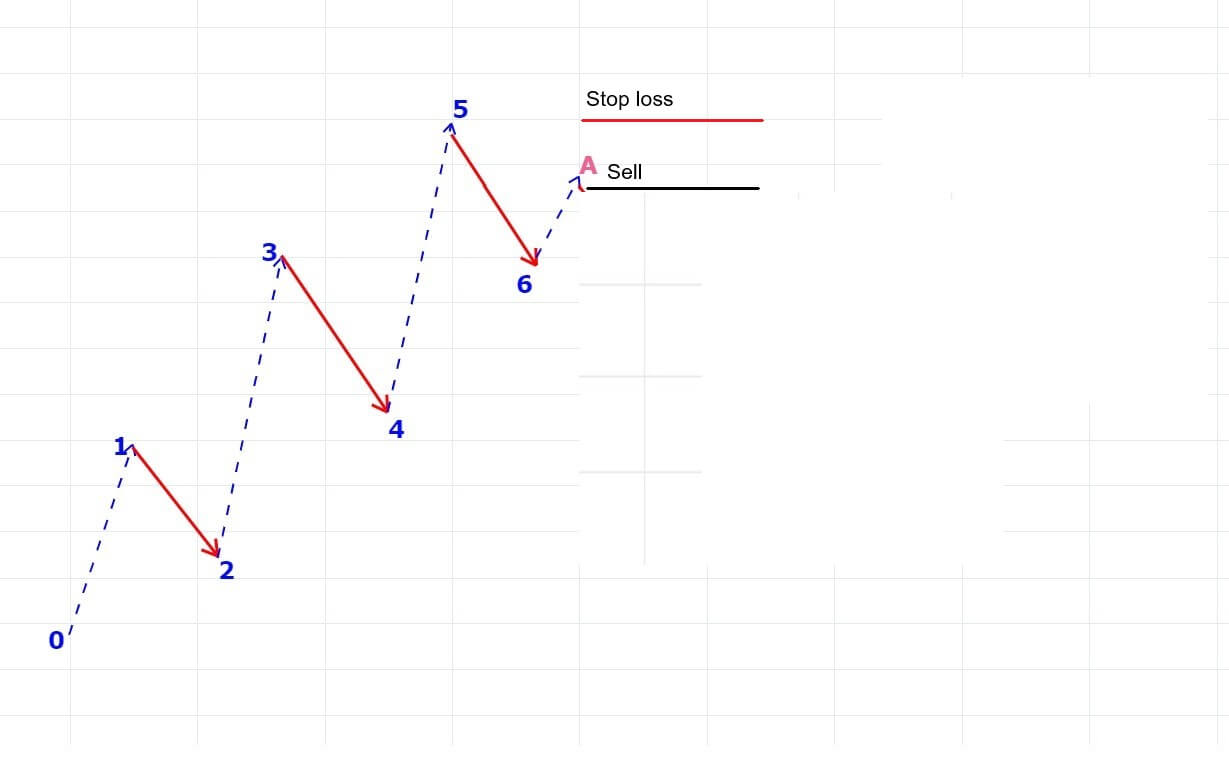
Insert H, However traders who abandoned the trade as soon as the stochastic became oversold, as per the example on your screen now at position B, because the K & D lines in the oversold area under the 20% line and where the k-line has crossed above the d line, they would have been extremely disappointed as the market continued to trend lower. While they would have made around 40 pips, they would have lost out on 350.
But one of the biggest problems we find with new traders is that they will buy a currency pair in a situation like this, where their trade goes immediately against them and falls
hitting them with losses of over 350 pics on this occasion because they have not supported their trade with a stop loss, due to poor risk management. In this example, the stochastic indicator would have been a foe.


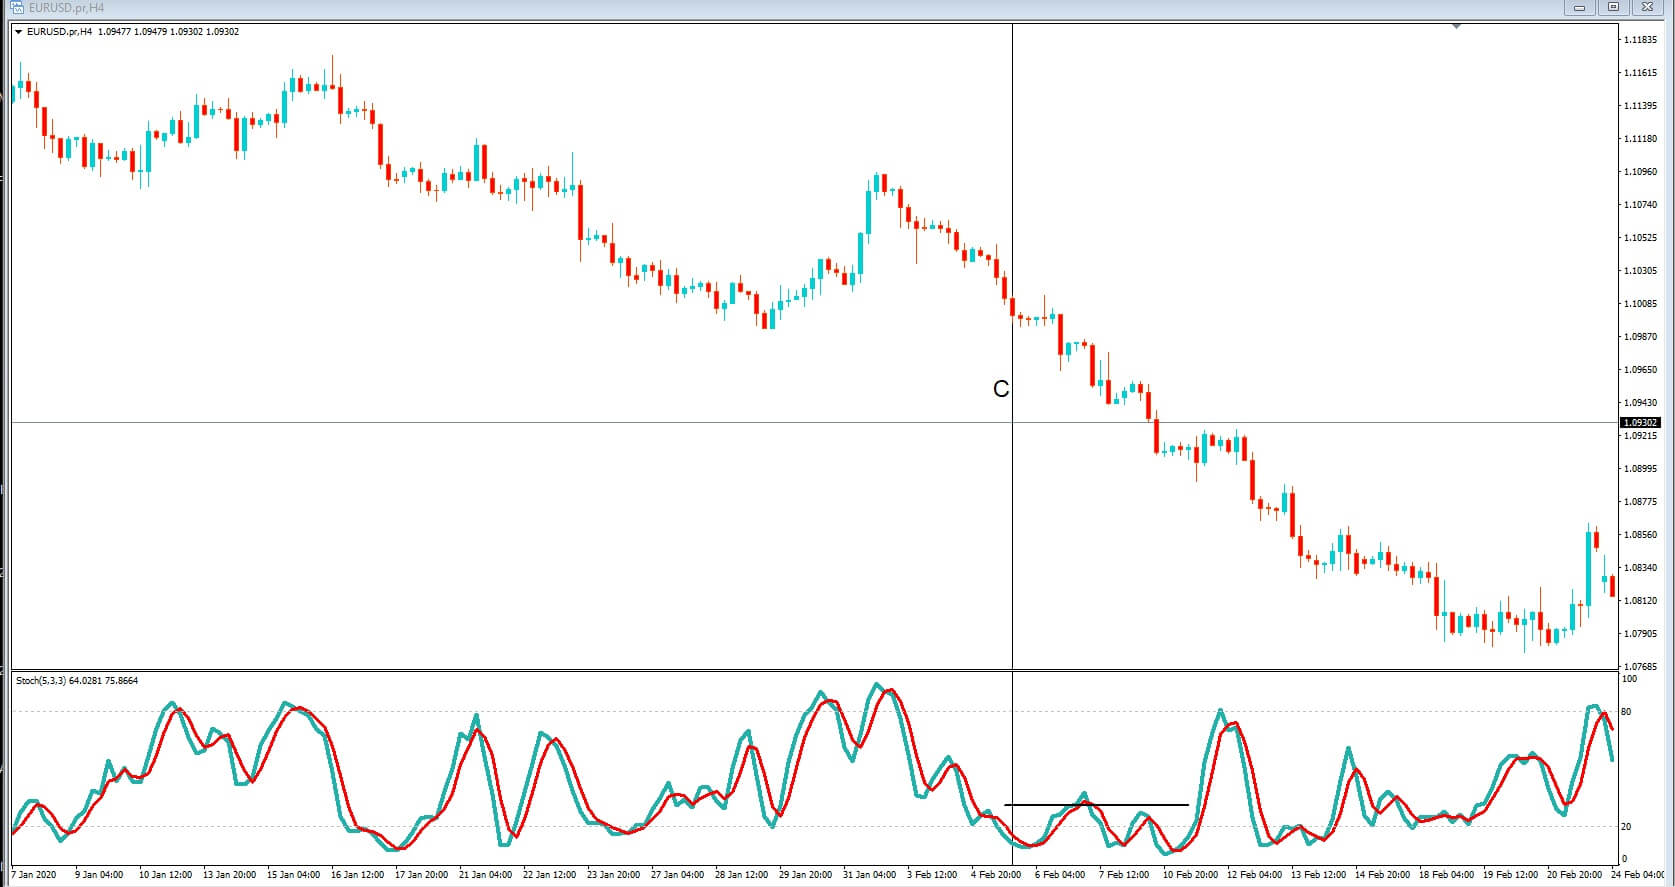
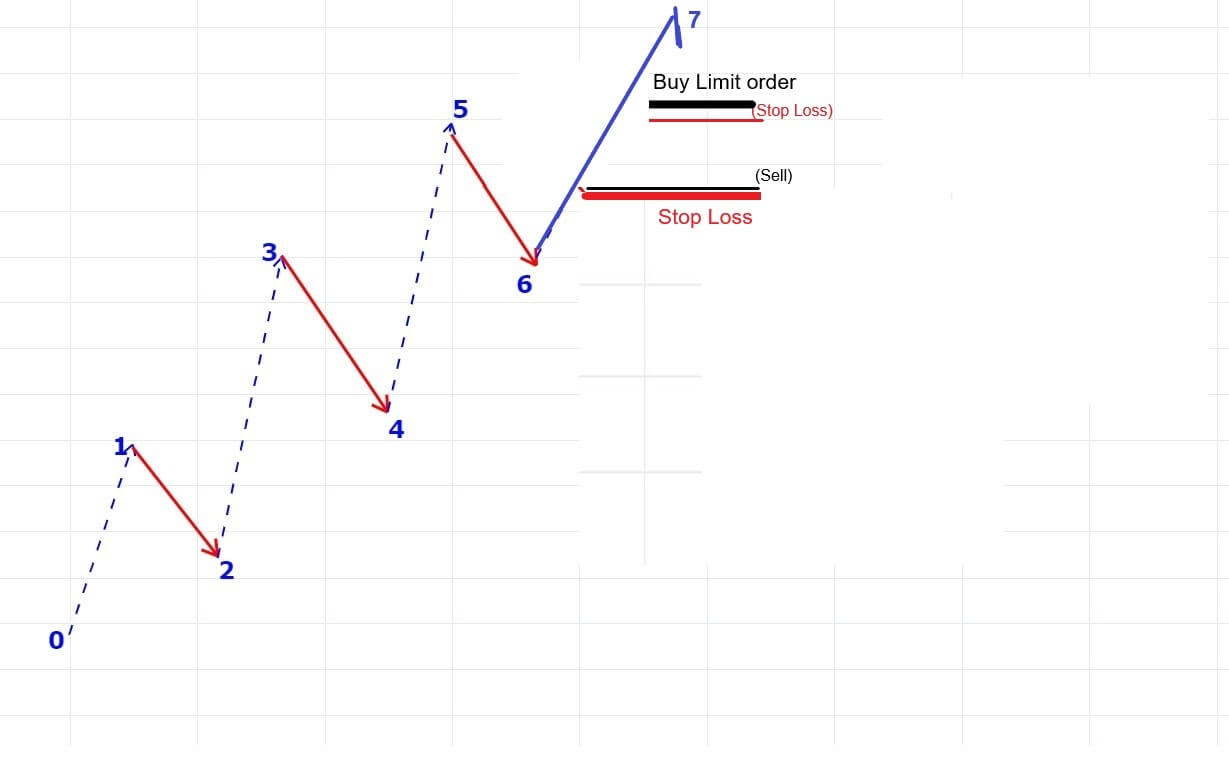
Insert I, Let’s return to our chart at position C, we can see that the stochastic is oversold, and more importantly, it is staying or remaining very close to the oversold 20% line as the market trends for lower.
And so the lesson here is that if the market is overbought, it does not necessarily mean that it will automatically fall, and which is clear from how example today if a pear is oversold, it does not necessarily mean that they will turn around and move higher.
So remember indicators are simply an indication that something might happen and not that it definitely will happen. Incorporate good risk management and money protecting tools such as stop losses in your trading plan. Learn to use price action as the definitive trendsetter, while incorporating other technical indicators to more reliably established entry points for your trades. And what is most important, which I’m sure you’ve heard many times, is to let the trend be your friend and I never trade against it.

Categories
Crypto Videos

How To Profit Trading Crypto With Elliot Wave Part 1


Elliot waves Crypto trading guide – part ½

The theory behind the Elliott wave principle is based around the price movements, which typically do not move in a straight line, but rather in a series of waves. Every action has an equal and opposite reaction, which is the case both in life and in any financial market (including cryptocurrencies). When the price goes up, a contrary downward movement will follow eventually.

Price action in any financial marketplace is often divided into separate trends as well as corrections. Price going up or down will showcase the direction of a trend, while the corrections will move against the trend. Ralph Nelson Elliott was the man that first discovered the repeating patterns that are better-known as impulsive and corrective waves. He noticed that these trend-following impulsive waves tend to respond in five waves. Even on a smaller scale, these impulsive waves can continue to repeat themselves inside the larger Elliott wave. This “waves within waves” theory is labeled as “wave degrees.”

Elliot waves – explained

Human social nature shows repetitive patterns due to the manner of human psychology, which is completely predictive. As mentioned above, Elliot waves have two different phases: the trend and corrective phases. The first phase forms three advancing waves of 1, 3, and 5. The corrective waves are comprised of 2 and 4.
During the corrective phase, two receding ways labeled A and C will almost always be present, as well as a counter wave labeled B.
The rules behind the trend waves are:
Wave 2 will never move below the starting point of wave 1. Wave 3 is never the shortest wave
Waves 2 and 4 might sometimes alternate in form, meaning that they will sometimes be presenting themselves in a zigzag or flat motion.
One of the trend waves will be much longer than the other two waves. The third wave will almost always be the longest out of the three.

Rules for the corrective waves are:

Wave B ends at or below the starting point of Wave A. Wave C ends below Wave A
In the crypto market, corrective waves often claim more than 60% of the all-time high price (which is at the top of the 5th wave)
Once we know what Elliot waves are and how to read them, we can move to the trading strategies. Check out part 2 of our Elliot wave crypto trading guide to learn more.

Categories
Crypto Videos

Make Huge Crypto Profits With The Heiken Ashi Strategy! Part 2

Heikin Ashi Technique – Crypto trading (part 2/2)

We will take a look at a Heikin Ashi cryptocurrency high-low breakout trading strategy. We will need to go through several steps in order to fully execute the strategy.
Identifying three consecutive bullish candles without any lower wicks.

After switching to the Heikin Ashi candlestick chart on your preferred trading platform, you will need to identify three consecutive bullish candles. It is mandatory that all three candlesticks have no lower wicks.
This is because bullish candlesticks with no wicks indicate a strong trend to the upside and a further increase in price. Once that is done, we need to check the location of the candles.


There have to be less than five consecutive bearish candles before the three consecutive bullish candles.

Trading Heikin Ashi candlesticks are very trend-oriented, so each of the little bits of info the chart gives, we have to take.
We need the location of the pattern, meaning that we can’t count more than five consecutive bearish candles prior to the three bullish candles spotted in the first step.
Now that we established the trend direction as well as the position of the pattern, we can look for buy opportunities.

Making an entry position at the 4th candle opening

To initiate a position, make an entry at the 4th candle opening, right after the three consecutive bullish candles have finished forming.
Get ready to pull the trigger near the finish of the 3rd candle, so you can be ready for the 4th candle opening.

Placing your Stop-Loss below the most recent swing low 

As with every trade you will take, there is a chance of it going the opposite direction to what you predicted. That’s why setting stop-losses is extremely important. The strategy behind setting stop-loss with Heikin-Ashi is quite simple.
The protective stop-loss should be placed just below the most recent swing low, or ultimately below the three bullish candlestick pattern. However, placing it below the three bullish candlestick patter might be risky as you can be taken out of the trade prematurely.

Taking Profit 

Depending on how strong the trend is, you would want your take profit to be two or three times more than you stop-loss. By doing so, you are trying to maximize your reward to risk ration.

Conclusion

Using the Heikin Ashi candles to determine the trend direction and set up trades can be extremely lucrative. It is important to make sure the position of the pattern is correct before entering trades, so that should not be compromised. This guide has hopefully taught you a trading strategy you can add to your toolset and possibly use.

Categories
Crypto Videos

The Bitcoin Halving Is Coming! Why Should You Be Buying Alts?


Making an insane profit from the Bitcoin Halving

Cryptocurrencies have made many people millionaires, and they will yet again. One of the biggest and fastest wealth distribution events in modern history is exactly the creation of cryptocurrencies. Events that severely impact the supply or demand of an asset are rarely known in advance, which is not the case with Bitcoin. Bitcoin’s halving event is widely known, and that makes Bitcoin extremely unique.

Bitcoin Halving

The event called the halving makes the supply of new Bitcoin coming onto the market cut in half. This is by design and happens approximately every four years. Shrinking supply, when combined with growing demand, is a proven recipe for a price increase. The halving presents an opportunity for regular people to invest a small amount of money and walk away with hundreds or thousands of dollars.

We know the Bitcoin halving will happen in May, and that the supply of Bitcoin will shrink as miners will be rewarded 50% less than up until then. Each time the halving happened, the prices soared. The first halving in 2012 brought Bitcoin’s price up 2,135%. The second halving in 2016 managed to propel Bitcoin’s price 3,122% over the next 18 months.

While most investors know about the halving, they don’t look into its track record when it comes to massive gains. On top of that, even fewer people know that altcoins might be the assets they should be looking for as the Bitcoin halving approaches. After Bitcoin’s first halving, Litecoin (which is called “Silver to Bitcoin’s Gold” soared more than 7,000%. The second Bitcoin’s halving happened, and an altcoin called verge shot up an astonishing 1,362,400%.

Conclusion

While it is true that altcoins are separate projects and that each one of them has something unique, it is undeniable that they are connected and correlated to Bitcoin. Investing in altcoins with the most promising technology might be the way to go before the halving happens.

Categories
Crypto Videos

Make Huge Crypto Profits With The Heiken Ashi Strategy!

Heikin Ashi Technique – Crypto trading (part 1/2)


There are many effective strategies for trading cryptocurrencies, and each trader needs to find its own comfort zone when it comes to technical analysis and trading. For that reason, it is important to know as many available strategies so you can pick the one that suits you best. Heikin-Ashi technique is used to forecast the price of a cryptocurrency and is considered one of the most effective trading strategies when trading traditional assets.
The Heikin-Ashi strategy revolves around the Heikin-Ashi candles, which are another form of looking at the charts. They can be applied to any time frame without restrictions, so it can suit any trading style. While they were initially designed for trading commodities and stocks, Heikin-Ashi had great success in trading cryptos as well.

The Heikin–Ashi Charts

Heikin–Ashi can be translated from the Japanese language, and means “average bar.” These candlesticks are different than the typical Japanese candlesticks that traders mostly use, even though they look alike. The difference between the two is the formula used. While the regular candlestick uses a form of open-high-low-close (OHLC), Heikin-Ashi uses a modified version of close-open-high-low (COHL).
Once we know the way Heikin–Ashi candlesticks work, we can understand how to use this trading strategy. There are two primary signals that traders can identify through the Heikin-Ashi candlestick:

1. Bullish candlesticks that have no or very small wicks indicate a strong move to the upside and good buying opportunities.
2. Small candlesticks that have a small body and big upper and lower wicks show us a potential reversal.
When it comes to bearish signals, the same applies but in reverse:
1. Bearish candlesticks that have no or very small wicks indicate a strong move to the downside and good short-selling opportunities.
2. Small candlesticks that have a small body and big upper and lower wicks show us a potential reversal.
Now that we learned how Heikin-Ashi candlesticks work and how we can read them, we are ready to move on to trading strategies. Check out part 2 of our Heikin Ashi Crypto Trading to learn more about using this strategy for crypto trading.

Categories
Forex Videos

Forex! Mastering Trading The Major Pairs!

Top Facts You Need To Know Before Trading Major Currency Pairs


Insert A: In this video presentation, we will be looking at trading the major currency pairs. Like all currencies which are trading in pairs, the major currencies are traded against the US dollar.
The quotes are the same as other currency pairs, but because the major currency pairs are more popular, this means there is more volume going through when they are traded than other currency pairs, and we, therefore, tend to find that the spreads are tighter on the majors.
Before we look at which of the pairs are considered the major currencies, we should just establish what a currency pair is. All financial traders look to speculate on the changing value of a particular asset, for example, precious metals such as gold and silver and stocks and shares.

The only difference in forex trading is that you are speculating on the value of one currency against another. And this is where the value of the first currency is expressed in units against the value of the second. These units are known as the exchange rate, and the exchange rate moves up and down and is measured in pips.


Insert B: If the Euro is being valued against the US dollar, the current exchange rate is 1.09, where 1 Euro is equal to $1 dollar and nine cents. Easy enough. The best way to learn how to gauge currencies and their value against one another is to open a demo account and spend some time looking at screen charts and seeing how currencies are quoted against each other. You can even play some trades at no risk to see how the spreads differ and look at historical price action of the pairs while experimenting with some of the many technical analysis tools which are available to help try and determine future price direction. This is the safest way to learn how to trade using virtual money in real market conditions.


Insert C: Let’s look at some examples now to learn how to read major currency pairs. This is one of the most commonly used trading platforms; it’s called the MetaTrader MT4 and is widely available via most brokers.
On the left of the screen, we can see the market watch section, which is home to all the currency pairs that your broker will offer you. We have highlighted one pair, which is one of the most widely traded major currency pair, the EURUSD, by clicking on the pair in the market watch window, we can open a trading chart and drag it onto our screen which we have done here.

Insert D, each currency is denoted by its three-letter ISO, Which stands for International organization for standardization.

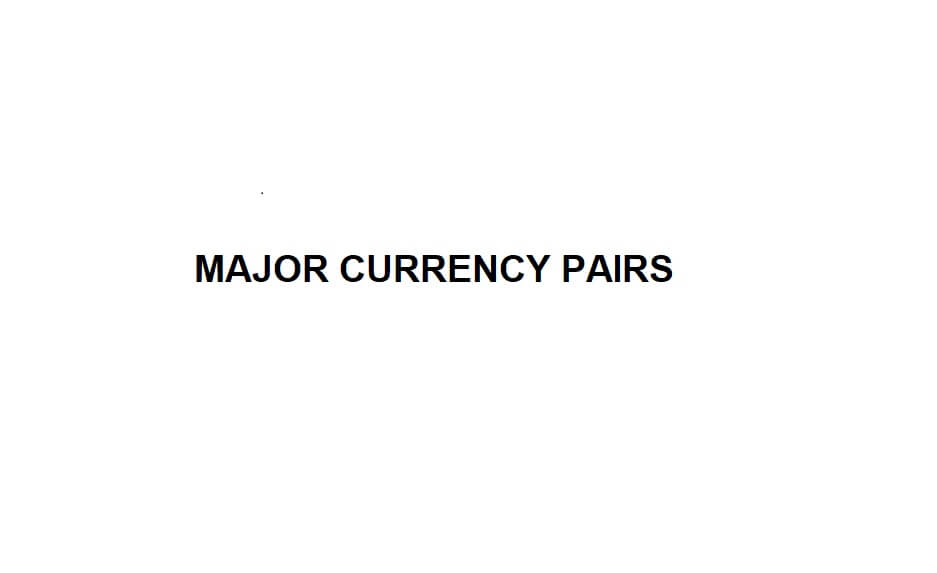
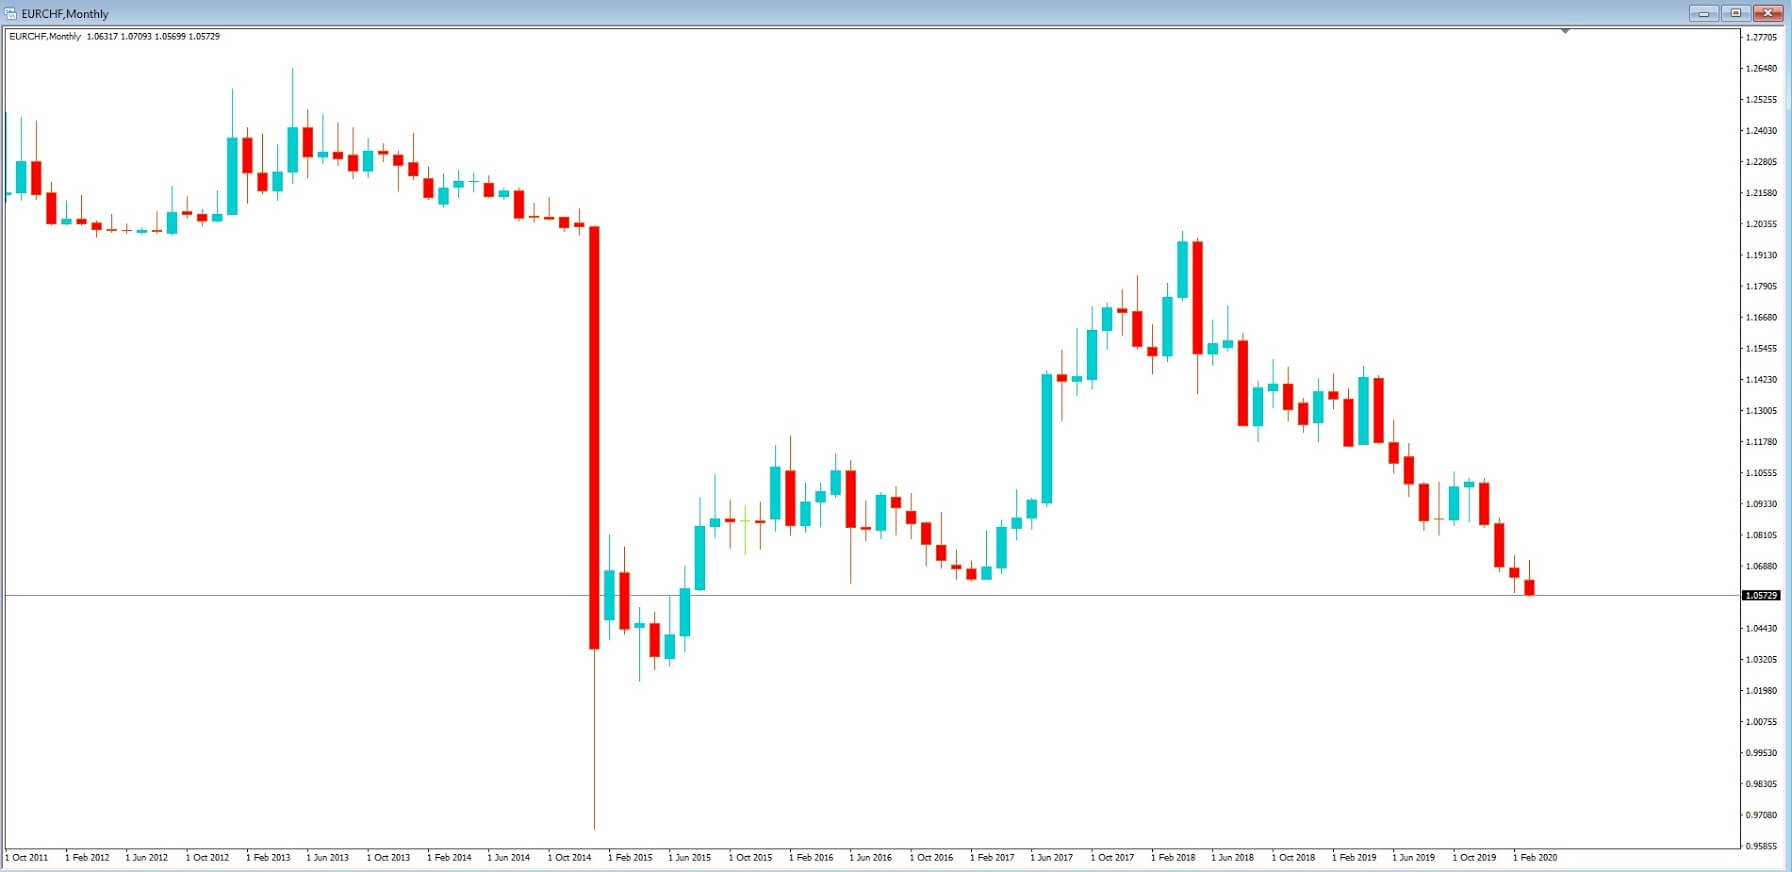
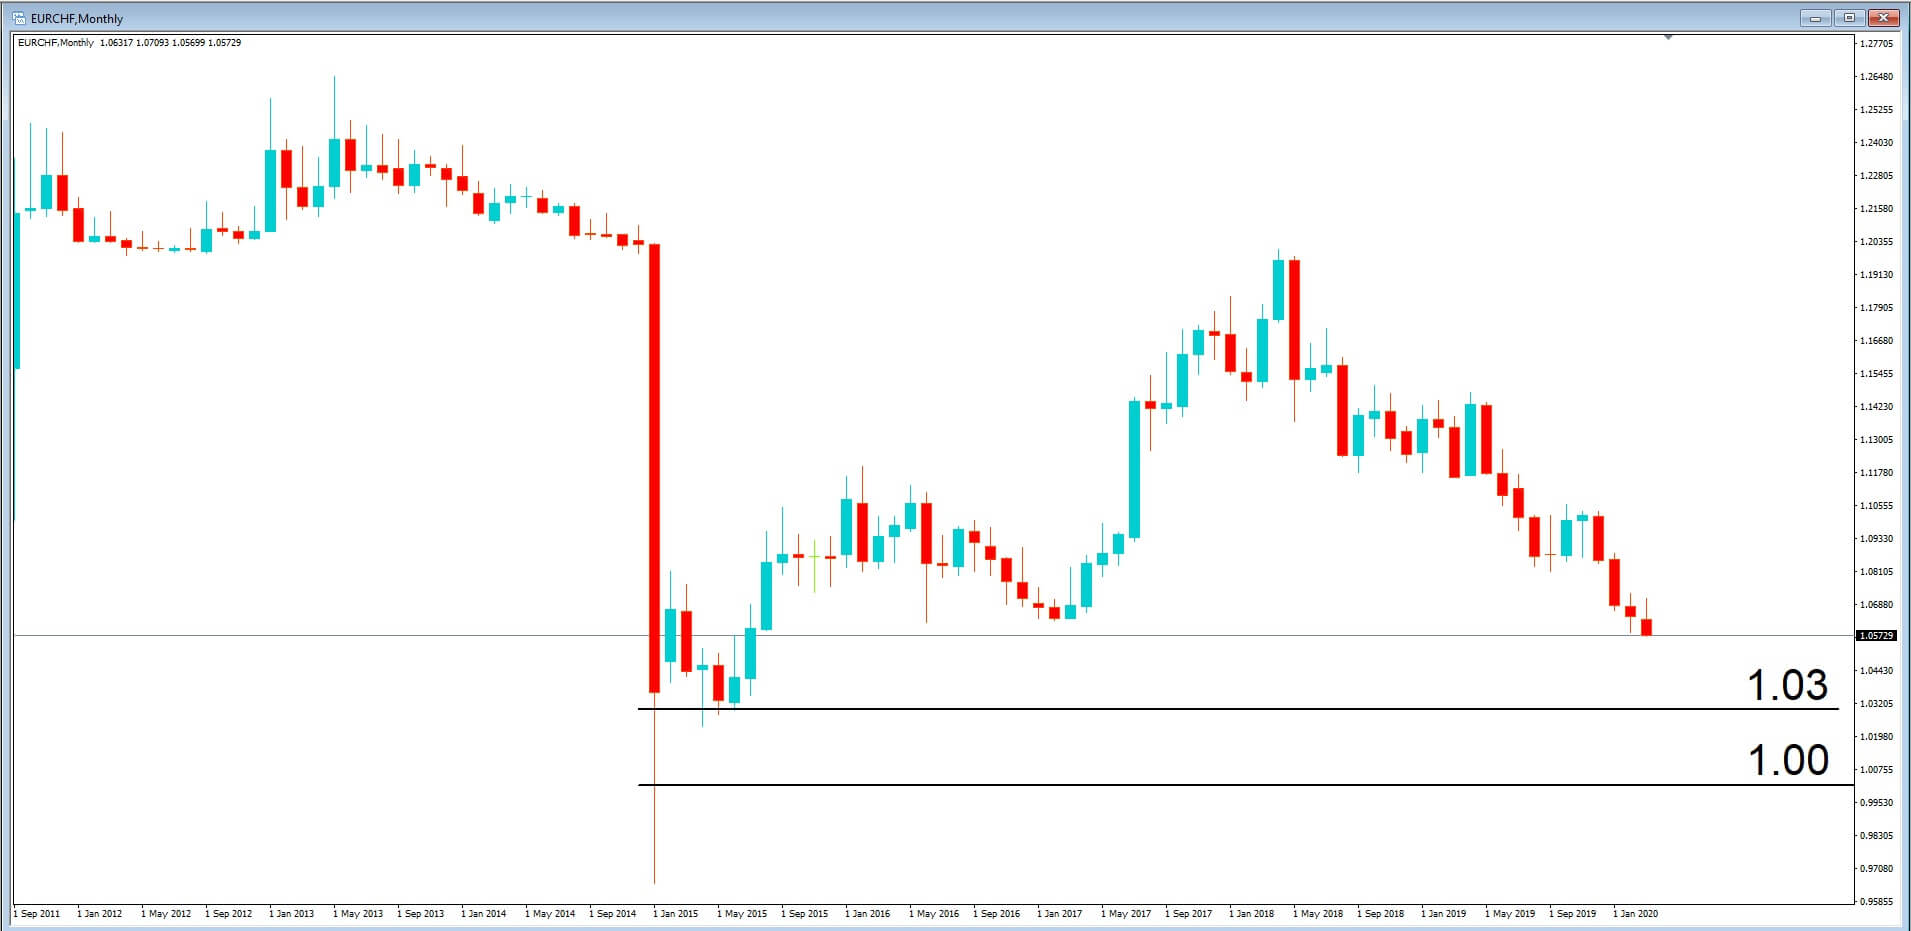
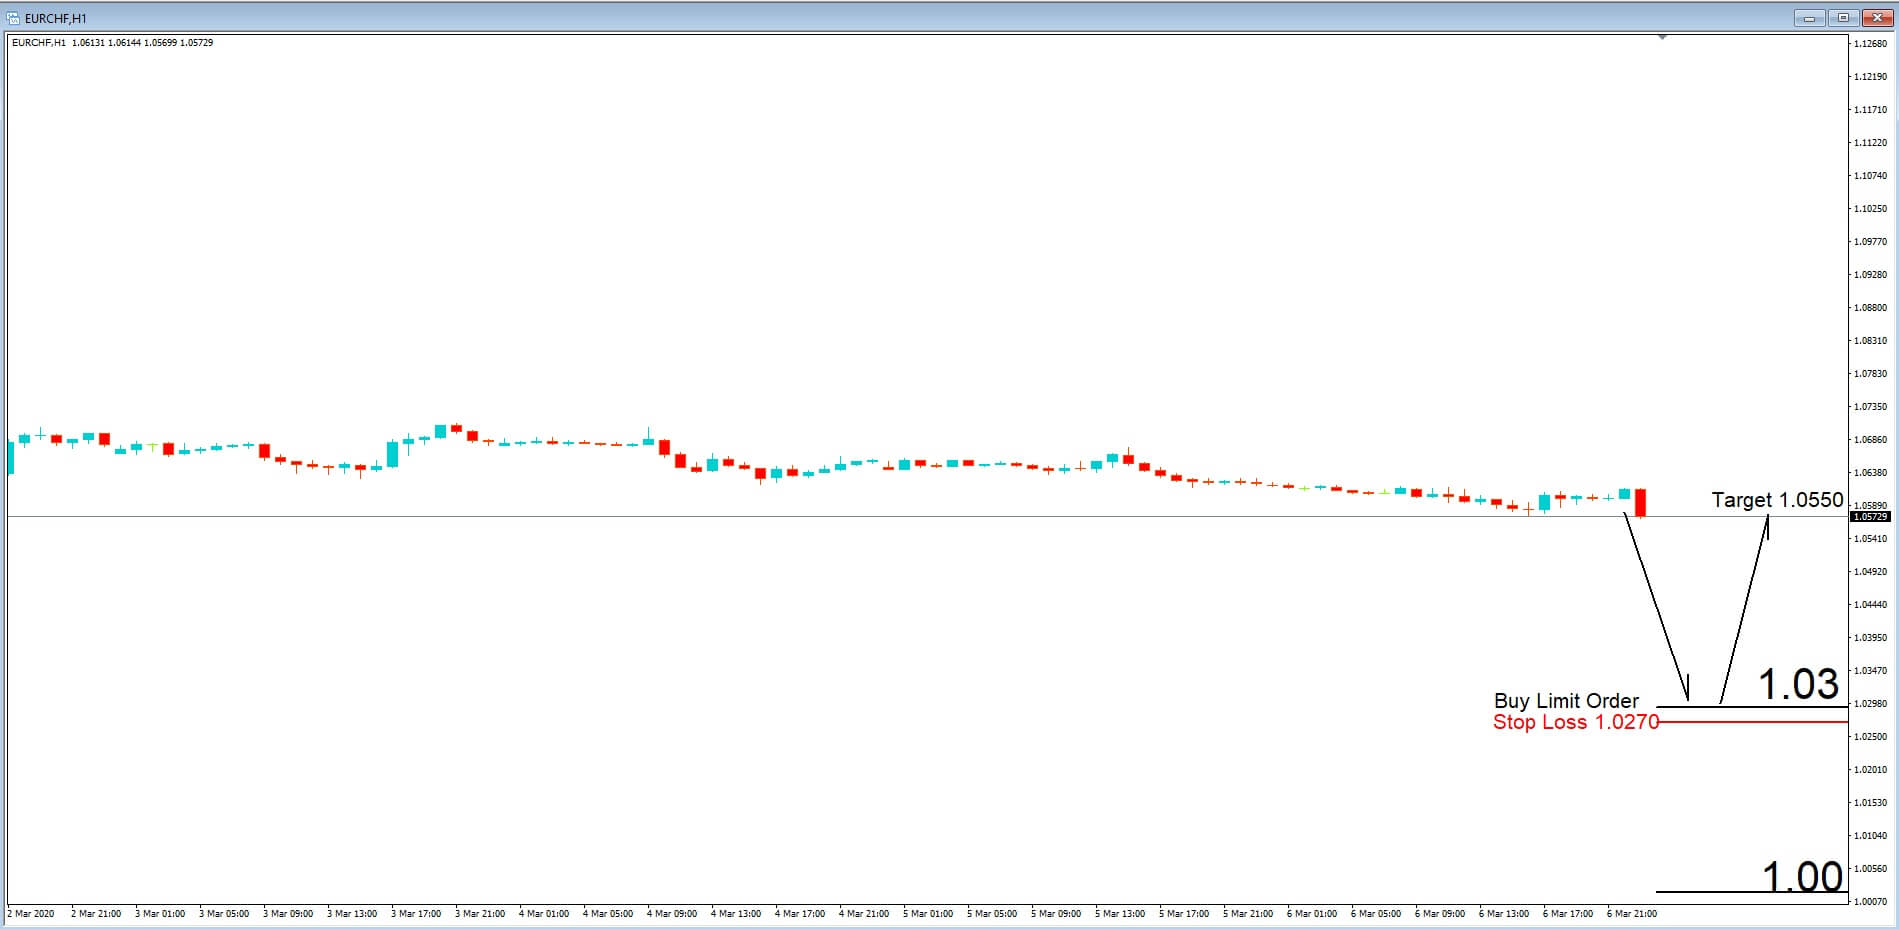
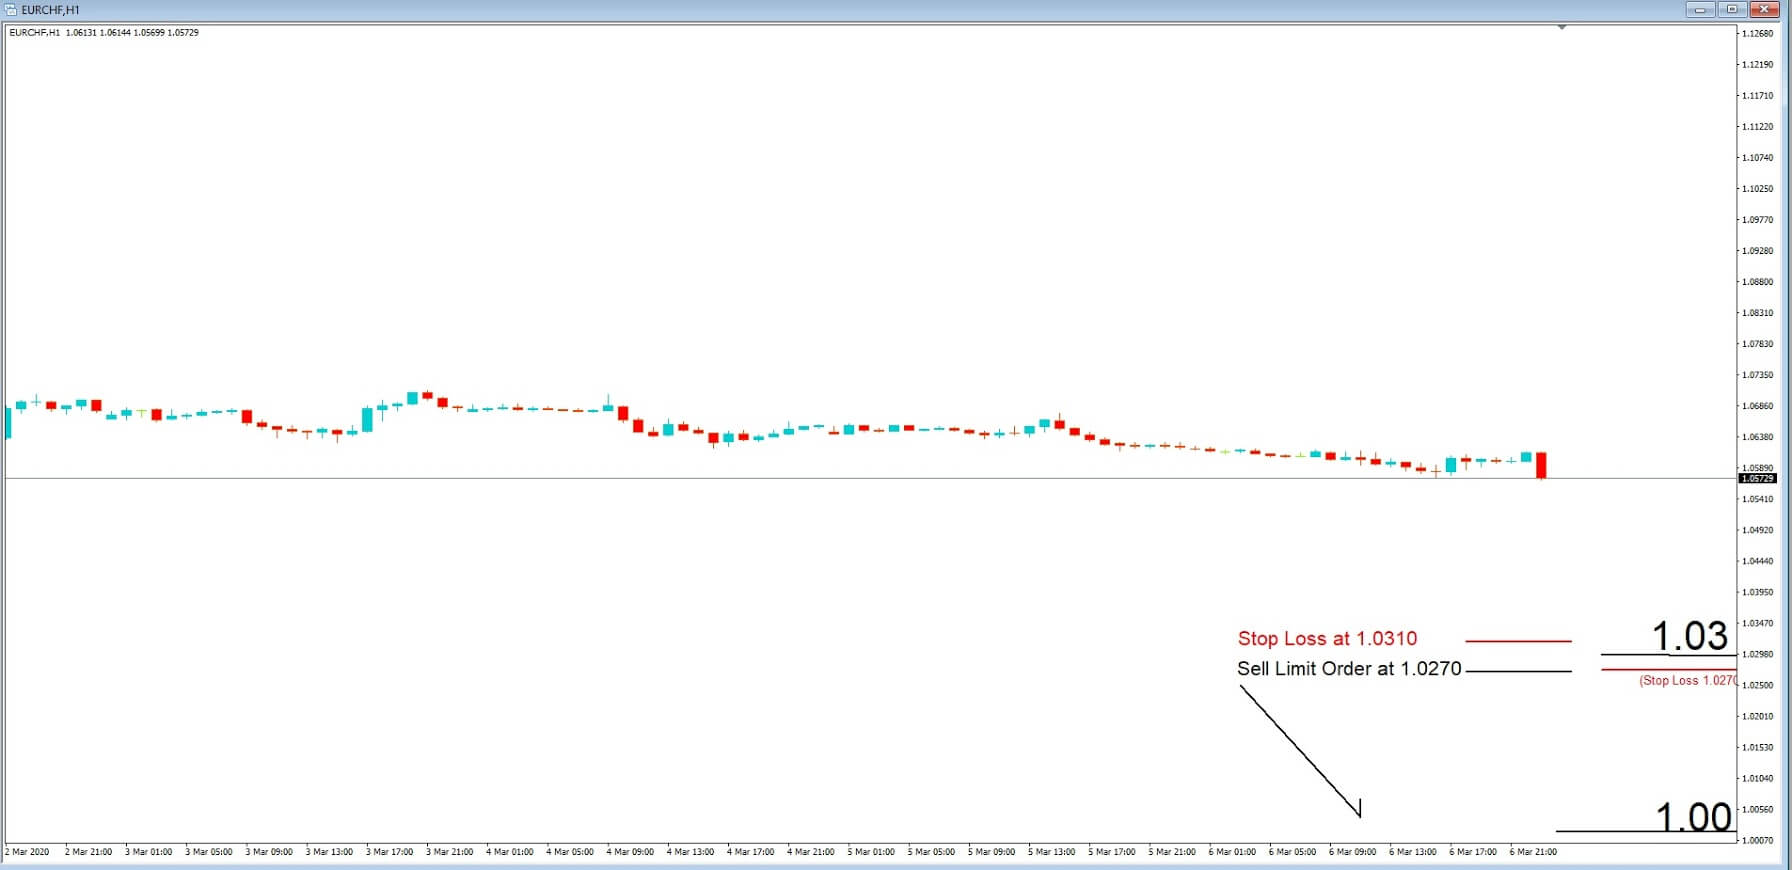
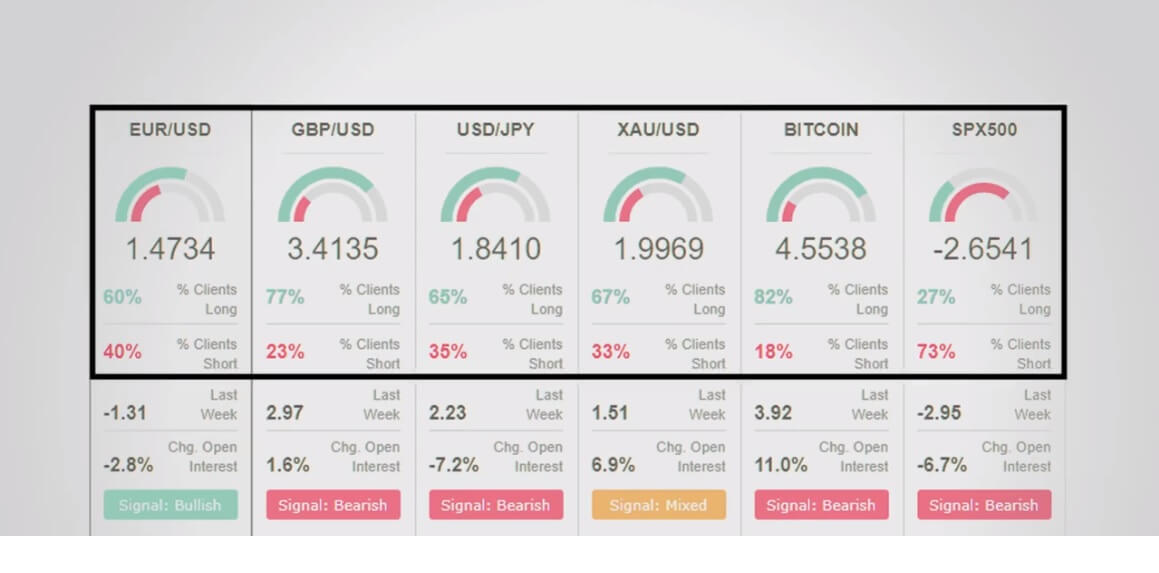
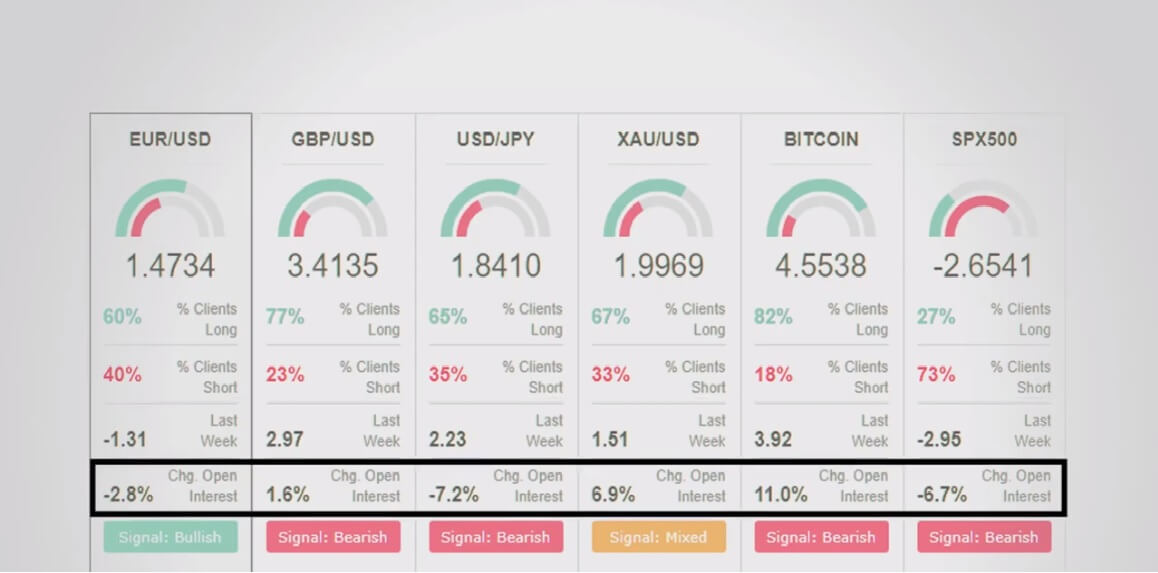
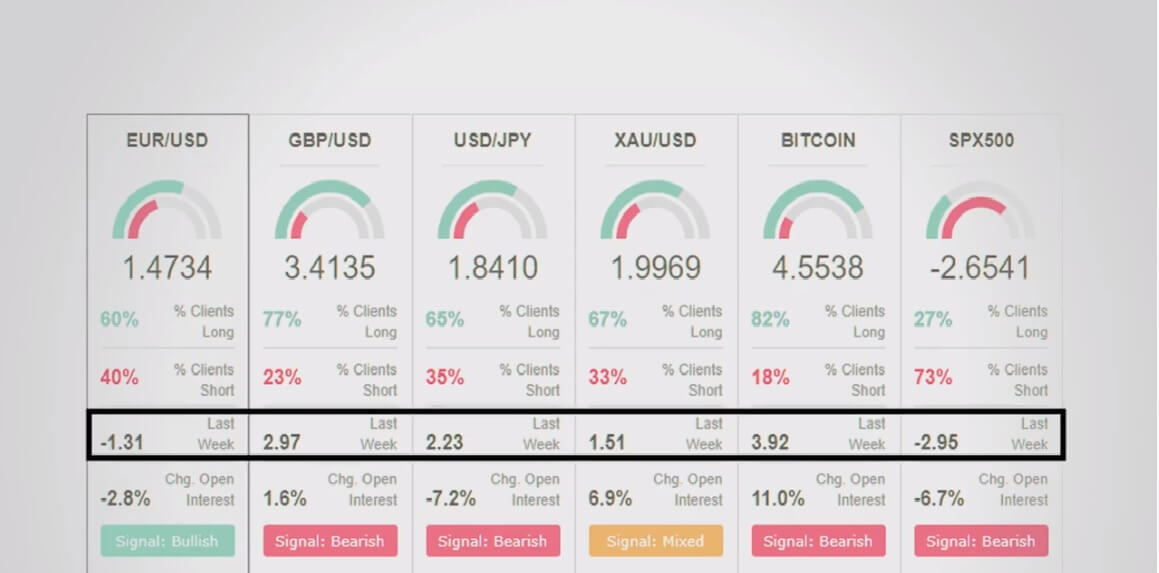
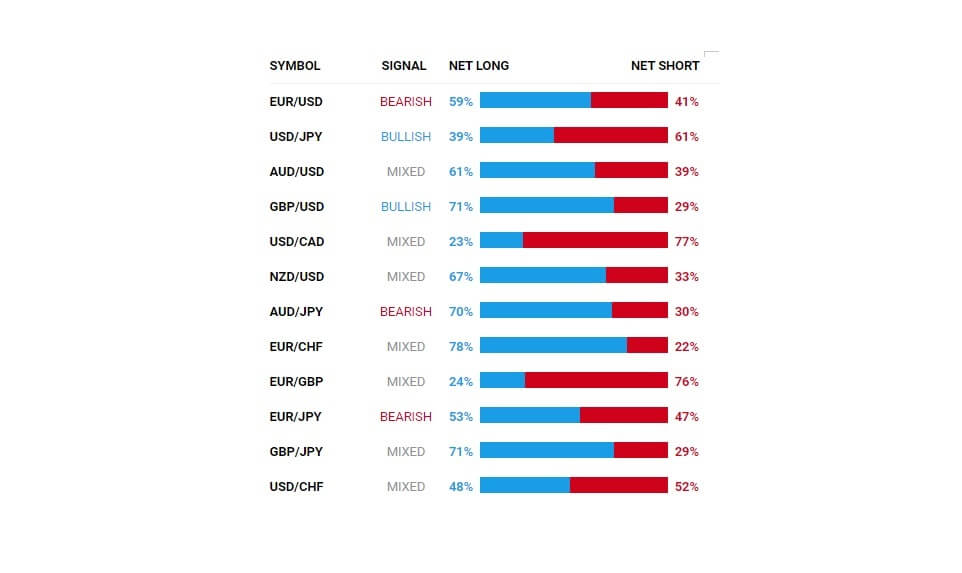
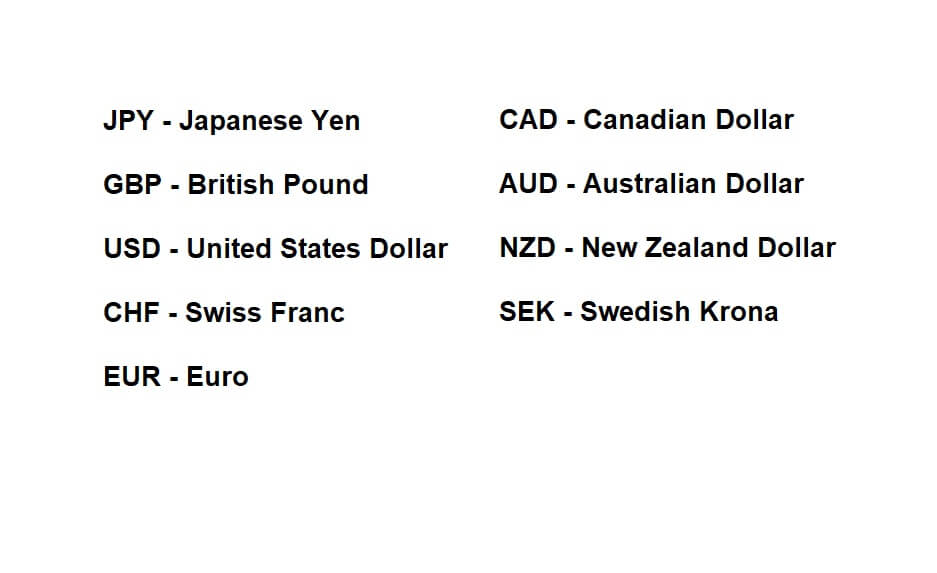
Insert E, The following ISO’s makeup the major currency pairs, so JPY for the Japanese yen GBP for the British pound, USD for the United States dollar, CHF for the Swiss franc, EUR for the Euro, cad for the Canadian dollar, AUD for the Australian dollar, NZD for the New Zealand dollar, and finally SEK for the Swedish krona.


Insert F, If we believed next fundamental reasons such as the European Union was about to increase their interest rates, which might be attractive to investors in Euros, we might expect that the Euro would rise in value you against the US dollar, as in this example, and where we would execute a buy trade in the hope that the Euro would rise in value against the dollar in which case we would make money.

Insert G, If only, on the other hand, we expected that the US Federal Reserve was going to increase their interest rates, which would be attractive for investors to then buy dollars, we might expect the price to fall all in this pair, in which case we would sell it.

There are a whole host of different reasons why currencies rise and fall against each other as well as economic conditions such as the strength of a country’s economy. There are technical reasons as well, and whereby traders use a system called technical analysis to tell them when the price of a pair might move higher or lower, and this would be based on factors including a currency being overbought or oversold.
Therefore traders bet against these exchange rate fluctuations where each movement is measured in pip value and where traders bet and amounts in value against the rise and fall of the exchange rate. So if a retail trader betted that the exchange rate would move up 10 pips and they bet $1 per pip, and they were correct, they would make $10. However, if the market moved down and therefore against them by 10 pips, they would lose $10 and so on.
When the unit value of the dollar is higher than an equal unit of a counter currency, the US dollar will be quoted first, such as the USD JPY pair. However, currency values can go from parity to inverted, but we’re typically the format will remain the same. The first quoted currency ISO is called the base currency. In this example, that’s the US dollar, and whereby the second currency is the quote currency.

Base currencies can be quoted as quote currencies on other pairs and vice versa, depending on which pairs are traded. Remember, currency pairs form the largest amount of volume going through the market at any given time, and this means there is a great deal of liquidity in these pairs. And liquidity and volume mean price movement. And movement means opportunities to make money trading Forex.
It is no coincidence that the major currencies belong to those countries which are amongst the richest on our planet. This means that they have a high gross domestic product due to the amount of goods and services which they provide across the world, and which has made them wealthy. Investors, traders, and providers of goods and services are continually driving exchange rate fluctuations, and this is why the best training opportunities are available on the major currency pairs.

Categories
Crypto Videos

Mastering Crypto Using The Morning Star


Trading Crypto using the Morning Star Pattern

The Morning Star pattern is a three-candle candlestick pattern that signals a bullish reversal and appears at the bottom of a downtrend. It signals a trend slowing down and a large bullish move laying the foundation for a new uptrend.
Identifying the Morning Star Pattern
Identifying the Morning Star on cryptocurrency charts requires more than just identifying the three main candles. It also requires knowledge of the previous price movement. The pattern should be identifiable if these five things occur:

The market should be posting lower highs and lower lows prior to the Morning Star formation.
The large bearish candle shows up as a result of large selling pressure as well as a continuation of the existing downtrend. Traders should be looking to take only short positions as there are no signs of a reversal yet.
The second candle is a small-bodied candle (sometimes even a Doji candle) is the first sign of market showing downtrend fatigue. This candle often gaps lower and makes a lower low. It does not matter whether the candle ends up being bearish or bullish, as it is only supposed to represent market uncertainty.
The first real sign of bullish pressure is this exact candle. It should be a big green candle followed by an increase in volume.
After a successful reversal, traders will start to enter long positions as the market posts higher highs and higher lows. However, make sure to manage the risk through the use of well-placed stops-losses.

Trading the Morning Star Pattern

The chart on the screen shows us the formation of a Morning Star pattern, where an established downtrend is leading up to the formation of the Morning Star reversal pattern.
Once the formation has completed, traders are looking for an entry point at the open of the next candle. If a trader is more conservative, they could delay their entry point until they are satisfied with how the pattern plays out.
Targets should be placed at previous resistance levels or previous areas of consolidation. Stops-losses should be placed right below the recent swing low. As there are no guarantees of this pattern playing out correctly, traders should always maintain a positive risk to reward ratio to avoid taking any substantial risk of ruining their portfolio.

Morning Star Pattern reliability

The Morning Star pattern, just like any other candlestick pattern, should be used alongside other trading tools available to the traders. Even though this pattern occurs frequently and has a fairly high chance of playing out correctly, one has to take all precautionary measures to protect oneself from the risk.

Categories
Forex Videos

Forex Education Scams – Know the Signs! Get A Real Education Free


Forex Education Platforms: A Route To Income Or A Get Rich Quick Scam?

There is an old saying in the United Kingdom: Where there is muck, there is brass. Essentially, what that means is that in any aspect of our lives, no matter how grimy, there are money-making opportunities to be made. And when the forex space opened up to retail traders after the advent of the internet, one huge area opened up regarding forex education, and where so-called experts, with very little experience of how the forex market operates, decided to set themselves up as educational gurus in order to exploit would-be traders looking to make a successful go at making money in Forex.


Be warned, if you have across people offering to teach you how to trade Forex, where they tell you that you will make a truckload of cash or fast cars, perhaps showing themselves in their luxury plane, or maybe sunning themselves in a far off exotic location, it is highly likely they are scammers looking to sell you a get rich scheme with very little substance behind it.


A great deal of these so-called forex educators make their money by getting you to subscribe to their educational platforms, where they might offer you a few videos, where you can see almost identical ones for free on YouTube, and in any case, have very little backbone to them, and where often these will be trading strategies that they guarantee will make you money, and in fact, most of them will fail.


The majority of these scammers set themselves up on platforms such as Instagram, Facebook, Twitter, and the like, while relying on the pictures of their so-called wealth made from their success as forex traders in order to subdue and entice you. When, in fact, they tend to be skilled marketers, but poor traders.

In fact, the forex space is littered with many types of fraudsters. One of the biggest areas where scammers made money was in binary options, where traders were asked to bet on the rise and fall of the forex market via binary options platforms, over certain time periods which were typically anything from 1- minute up to one hour, but where the prices were manipulated on the platforms, which operated almost like a casino, where the house always won. Regulators clamped down on this very quickly and shut them down.
Weigh more and more people ripping off newbie traders by offering them comprehensive educational experiences and where most of the information provided is inadequate or not at all comprehensive, in which case could we expect that the educational space will soon become regulated? It seems to be gathering a lot of interest in a space that is beginning to resemble the Wild West.

One thing is for sure, here at Forex Academy, we will not ask you to pay for the educational material which we provide on this website. What’s more, we offer a comprehensive educational experience and cover all the aspects that you need to be a proficient trader. And the people that write our educational material and present it to you are market professionals, some of them having come from an institutional background in the forex space. And so you can rest assured that the educational material we provide is professional, and comes with a wealth of real market experience behind it.
Forex is not a get rich scheme; there are no shortcuts to becoming a successful trader; it takes time, effort, and practice.

Categories
Crypto Videos

Mastering Crypto Using The Evening Star

Trading crypto using the Evening Star pattern

The Evening Star candlestick pattern is a three-candle bearish reversal formation that appears at the top of a bullish trend. It signals that the market is slowing down and that a bearish move is laying the foundation for a new trend.

Identifying an Evening Star
Evening Star pattern has been extremely popular in forex trading, but has increased in popularity in other markets, crypto included. Using this pattern when trading cryptocurrencies has proven to be extremely lucrative if done properly. Identifying the Evening Star on crypto charts involves more than just identifying the three main candles that constitute this pattern. While the Evening Star is just a three-candle pattern, one needs to understand the previous price action before trading it.

The market should be exhibiting higher highs as well as higher lows. The large bullish candle occurs as a result of large buying pressure as well as a continuation of the existing uptrend. Traders should be looking only for long trades at this point, as there is no evidence for any type of reversal yet.

The second candle is a small candle (sometimes even a Doji candle) that is the first sign of trend fatigue. This candle often gaps higher as it makes another higher high. It doesn’t matter if the candle ends up being bearish or bullish, as this candle only shows a lack of determination.
The first real sign of a trend reversal and big selling pressure is the big red candle.
After a successful reversal, we will be able to observe lower highs as well as lower lows.

Trading the Evening Star pattern

The chart shows an established uptrend that leads up to the formation of the Evening Star reversal pattern. Once the pattern formation has completed, traders are looking for an entry point at the open of the next candle. If traders are more conservative, they could delay their entry point to a slightly lower price.
Targets should be placed at previous support levels of consolidation levels. Stops, on the other hand, can be placed right above the recent swing high.

Evening Star pattern reliability
The Evening Star, like every other candlestick pattern, should be traded along with other trading tools available to the trader. While they are quite reliable, failed reversals can happen if a trader only uses the Evening Star pattern to trade.

Categories
Forex Videos

How To Trade Bitcoin Futures Price Gaps! 95% Assured Strategy Part 3 of 3

Trading Bitcoin Futures Gaps – part 3/3

The last part of the Bitcoin futures price gap trading is dedicated to the types of gaps and what they represent. Not all gaps are the same, and knowing which one is which will help with using them for trading.


Types of gaps

There are four types of price gaps, and while they might look alike, they are all traded differently. It is essential for traders to differentiate between them.

Breakaway gap

These gaps occur when the price makes a strong and sharp directional move from the consolidation area. This type of gap is particularly powerful when combining it with clear patterns such as trading ranges and patterns (that we covered in previous videos). A breakaway gap that is followed by a significant volume increase is a sign of a strong trend. This gap is somewhat unlikely to be filled, at least in the short term. A low volume move is more likely to see the price returning to the area it was previously in. To sum it up, breakaway gaps are not the best for trading as they are less likely to be filled than some other types of gaps.

Common gap

Also known as area gaps, temporary gaps, and pattern gaps, they are most often seen in sideways moving markets. They are almost always filled, but the problem is that they offer very little information in regards to what price will do after this occurs.

Exhaustion gap

This type of gap is mostly viewed as a signal for trend reversals. They occur around the end of a price pattern, signaling a final attempt to hit new highs or lows. These gaps occur in markets with rapid upswings or downswings, often on a large move up or down. They are usually preceded by a heavy spike in volume. These are the gaps with the biggest likelihood of being filled.

Measuring Gap

Also known as runaway or continuation gaps, they occur in the middle of a price pattern. They are considered a signal that buyers or sellers are flocking and trading in the same direction. Measuring gaps will not occur during consolidation periods. They occur only during rapid price upswings or downswings. These gaps are not normally filled for quite some time as the push in one direction is too strong.

Mistakes when trading Bitcoin price gaps

Common mistake traders make when using gaps to trade Bitcoin is confusing exhaustion gaps with measuring gaps. This can cause a trader to position himself in such a way that they will miss significant gains that occur in the last half of an uptrend. Exhaustion and measuring gaps are quite different as they predict moves in completely opposite directions.

Keeping track of volume can help with finding the clue for distinguishing measuring gaps from exhaustion gaps. A noticeable heavy volume would suggest an exhaustion gap, while the lack of heavy volume would indicate a measuring gap is happening. It is also important to note that the filling of the gap rarely stops as there are no immediate support or resistance areas within it.

Categories
Forex Videos

Dominating Price Action! Making You A Better Trader

Dominate Price Action To Amplify Your Trading Arsenal

In this video presentation, we will be looking at price action. If you want to be a successful forex trader, you need to understand what price action is. If we had to strip forex training down to 1 single most important feature, then price action would be it. Today we are going to show you how it is applied in forex trading.
All areas of the financial markets capture the movements of any specific asset, including Forex, on a chart and where this is recorded historically. These movements can be represented as candlesticks, line charts, or bar graphs, And can be observed over varying time periods from 1-minute or 5-minute time frames, all the way up to monthly charts. This data reflects the beliefs of market participants at any given time, whether they are human or algorithm-based traders, which is shown on the charts in the form of price action.

Price action is the methodology of applying all your decisions from a price chart while adhering to some basic trading principles. Price action is often called naked trading because traders rely on the price itself in order to denote when to enter and exit trades. However, by adding a couple of moving averages and some support and resistance lines, it becomes much more easy to identify key levels of support and resistance to trade around. Ideally, as a trader, we want to try and identify tops, bottoms, and trends. And this methodology is an extremely important feature in identifying these key areas.

A couple of old adages come to mind which lends themselves very nicely to forex trading: the first one is that sometimes you can’t see the wood for the trees, and where that can be applied to Forex in so far as sometimes traders overload their screens with technical tools and they cannot really clearly identify what is happening with the price action because they are too focused on too many technical tools. And the other adage is sometimes less is more, and that applies for the same reason: by stripping away technical tools, we can only rely on price action itself, which is a key leading indicator in its own right. While in this example of the EURUSD pair, we can quite safely say that during this period of the 1-hour chart, the general trend was to the downside, but how can we pick this out by utilizing price action itself?


Example B, the Price action of a pair is in continuous motion apart from interruptions during the weekends. Otherwise, price is consolidating or moving in a sidewards direction, or it is trending higher or lower. As traders, we should be looking at what is happening with price action at any given time and then try to establish if the price is trending, or if it is in a period of consolidation, or even a pullback before a trend continuation.
Price action alone can help us determine these areas, but by adding a couple of visual supports such as some trend Lines, it just makes it more easily identifiable. For this example, we have just added two very simple lines that help us to more clearly identify levels of support and resistance. Here we can see a period of consolidation, which is qualified by price action touching, or is very close to touching at least two areas of support and resistance, which are clearly identifiable such as drawn onto our chart.
One thing is for sure that price action will breach this area at some future point. This is a key area of interest for traders.


Example C, Here we can see that the support line has been breached by a strong bearish candlestick. Traders will jump on this opportunity to go short on the pair at this point.

Example D, We subsequently see another area of consolidation and a further breach to the downside, and where traders would expect that a downtrend is in process, and they would be looking for opportunities to go short.
Whilst stochastics, MACD, and moving averages are widely used throughout the trading community, many traders feel that price alone can be relied on for identifying trade opportunities, and certainly, these couple of examples would support that.
But of course, as cautious traders, we like to stack the odds in our favor, and if that means adding a couple of extra visual technical tools that will help us well, what’s the harm in that?

Example E, Here, for example, we have added a simple 30 period moving average. Notice how the price action tends to bounce lower off of this line, while price action continues in its trend lower.

Example F, I know the world price continues to consolidate and punches lower through support lines and where support lines become lines of resistance, but all the while price is bouncing lower from the 30-period ma.


Example G, Price action also throws up another favorite for traders: highs with lower highs and lows with lower lows which identify a downtrend, and where the opposite would apply for an uptrend, where they would be looking for highs with subsequently higher highs and lows with subsequent higher lows. But again, these key areas are clearly evident on the screen, even with price action alone.

Example H, Price action Traders will also observe higher time frames, in this example, we are looking at a 4-hour chart of the EURUSD pair, traders try and establish what is going on with price action on the longer time frames because this will filter through to the lower time frames and where they will look for opportunities to jump on the overall trend should there be one.
Price action becomes repetitive, and this is because human nature in trading tells us that certain things are likely to happen at certain levels, typically key levels or round numbers, and if these things are recurring on a regular basis, human emotion would suggest that they are likely to continue to recur and therefore trading sometimes becomes a self-fulfilling prophecy where certain price action events, in the absence of fundamental reasons, is likely to continue in this vein. Price action levels become significant because market participants give significance to them.

In summarising price action who is the most significant aspect of Forex trading, and where by just using the minimum amount of technical tools you can more easily see areas of price consolidation, within resistance and support levels, and when these areas are breached we may see a continuation in price action in the direction of the breach, and by incorporating a simple moving average it can more easily help us to identify a trend. And that these very basic mechanisms are highly favored by professional and institutional traders.

Categories
Crypto Videos

How To Trade Bitcoin Futures Price Gaps! 95% Assured Strategy Part 2 of 3

Trading Bitcoin Futures Gaps – part 2/3

While the previous part explained what price gaps in the Bitcoin futures market are, this part will show how to trade them and what to expect when doing so.

Why do price gaps fill?

There are a few explanations as to why most gaps fill. If the spike was too optimistic or too pessimistic, it might lead to a correction afterward. Another possible explanation might be that the price action was too sharp and did not form any support or resistance levels, making the correction more likely to occur.

Gaps and Bitcoin price

While there is no hard evidence of Bitcoin’s price being directly affected by the price gaps in the futures market, lots of people seem to believe so. In cases where the CME Bitcoin futures price flash crashes in just a few seconds, many people (analysts included) believe that manipulation is occurring.

Traders and Bitcoin price gaps

When looking at the price gaps in the Bitcoin futures market, one might conclude that a large majority of them get filled extremely fast. Some traders are even incorporating the futures chart as a necessary tool for their technical analysis. However, doing this could be quite dangerous if not executed properly.
When trading the traditional markets, using gaps as indicators is a lot more transparent. As an example, some traders use strategies such as buying stocks in the after-hours if the company releases an earnings report showing positive results. However, since Bitcoin never stops trading on other exchanges, using this strategy could be trickier than it initially seems.
That’s why we need to know a few rules to trade Bitcoin based on the futures market gaps.

When a significant gap appears, it usually removes the immediate support or resistance levels, meaning that the gap is more likely to get filled. Make sure to trade in the overall direction of the market on a higher timeframe.
The price usually retraces to the original resistance level. The gap will be filled, while the prior resistance will be turned support.
The risk management while trading should be symmetrical (1:1), as almost all gaps eventually close.

Conclusion

Trading Bitcoin while using the CME Bitcoin futures chart gaps as indicators of price direction may be a lucrative strategy. When paired up with good key level analysis, this way of trading might be one of the safer ones. However, one must set its goals (to the upside and downside) correctly to prevent any unnecessary losses.
Check out part 3 of Bitcoin gap trading to learn more about the types of gaps and what they represent.

Categories
Forex Videos

Forex Timeframes & Trading Windows – Which To Choose!

Time frames And Trading Windows Tricks – Maximize Opportunities With Overlap

In this video presentation, we are going to be looking at time frames and trading windows. Although these two subjects are separate by looking at them together, we hope you will see the importance of combining them in one section.

When it comes to time frames, new traders are often confused about which time frames to trade and why. So let’s look at three different types of time frames and traders who prefer to use them.

You will most likely be trading on a short-term, medium-term, or long term time frame, depending on your preferences, including your strategy, lifestyle, and the size of your trading account. Everybody is different, and some traders may use a one-time frame or a combination of all three.

But this can cause a lot of confusion for new traders when they begin to develop their trading strategy. Many new Traders tend to want to be in and out of a trade very quickly, which means they fall into the group known as scalpers and tend to use 1-minute and 5-minute time frames.

Other traders tend to want to look for longer-term trends, but do not want their trades to roll over from one day to the next, in which case they might prefer to use 15-minute to 1-hour time frames, and these are known as intraday traders, and larger professionals, including institutional traders, will have a longer-term view and look at 4 hour time frames up to daily, weekly and even monthly time frames. These are commonly referred to as swing traders.
Scalpers team to only use 1-minute and 5-minute they might only be in a trade for 1 to 2 minutes. Whereas day traders might be in a trade all day long, and institutional long-term or swing traders might be in a trade for days, weeks, months, or even years.

One of the reasons why trading can be inherently difficult is because all of these traders have different ideas about where the price of a pair is heading based on the various time frames that are used by the various groups of time frames, and therefore the majority of them will all be trading at odds with each other, not only within their own time frame but the other time frames as well.

No matter what time frame you choose to use, it is always advisable to look at the longer-term time frames before you place a trade and then filter down to the time frame that you want to use because a great deal of price action sentiment can be gained from doing so. This is the only way that you will be able to see if trends are developing and trade accordingly. You may have heard of the phrase let the trains be your friend, well this is the best way to find a trend, by looking at a higher time frame than the one you want to use and then filter down once you have established what is happening to price action overall.


Example A. Traders can look to the higher time frame, such as the daily or weekly charts.

Example B. In order to establish what is happening with price action and to find out if trends are available or forming and then simply move down to their preferred time frame. By doing this, they will also be able to more clearly see prominent support and resistance areas which may be being observed by institutional traders, because, after all, this is where the real money is. Institutional traders are the ones that move the market. And so it is always advisable to know what they are doing at the higher time frames.

In summary, the type of time frame that you choose is dependent on the type of trader that you want to be, whether it is a quick in and out scalper style, or perhaps to take a longer longer-term view. But however, you trade it is always advisable to look at other time frames especially, especially longer-term ones than your preferred time frame, in order to help you pick your trade entry more easily.

Next, we are going to look at trading sessions. The forex market is broken up into major trading sessions.

Example C.  The Sydney session, the Tokyo session, the London session, which includes Frankfurt and a New York session. The forex market is open between 10 p.m. Sunday evening GMT and runs all the way through until 10 p, GMT on Friday, non-stop. However, the main centers will typically open at around 7 a.m. their time and finish at around 5 p.m. In other words, business hours. And where we can see on the graph that some of the sessions overlap.
That more centers overlap means that there are more players in the forex market at that time, and this means extra volume and liquidity and, therefore, greater moves in price action or potentially happen during these overlaps.

In summary, the best times I’m two trees are when two sessions overlap, and most volume and liquidity is provided during the London session, which includes Frankfurt and is also known as the European session, and where this overlaps with New York. This is the time of most activity. Generally speaking, in the forex market. Please remember to adjust your trading to reflect the seasonal changes due to daylight saving hours. The middle of the week tends to be the busiest because this is where we find more economic data releases normally. These affect market volatility.

With the worst times to trade being Sundays and Fridays, especially after the US session, public holidays where markets are thin, and volume is low, which means spreads will be at their widest, and during major news events where the markets can be extremely volatile.

Categories
Crypto Videos

Become A God Of Crypro Trading With The Hammer Pattern

Profiting from the crypto market – Hammer pattern trading

Hammer Candlestick – explained

A hammer is a candlestick price pattern charting that occurs when a cryptocurrency trades significantly lower than its opening but quickly rallies within the candle period to near-opening price. This looks hammer-shaped candlestick, where the lower shadow is at least double the size of the real body. The candlestick body represents the difference between the open and close prices, while the shadow represents the highs and lows within the period.

Reading the Hammer Candlestick

A hammer occurs after a cryptocurrency has been declining, implying that the market is attempting to create a bottom. Hammers signal that sellers might have capitulated.

Hammers are most effective when the least three or more declining candles precede them. A hammer should look somewhat similar to the letter “T.” However, one thing to note is that a hammer candlestick doesn’t indicate a price reversal until it is confirmed.

Confirmation of the hammer pattern occurs if the candle following it closes above the hammer’s closing price. Candlestick traders will mostly look to enter their long positions or exit their short positions during or after the confirmation candle appears. Traders that are entering new long positions can benefit from setting a stop-loss below the low of the hammer’s shadow.

Hammer candle vs. Doji candle

A doji candle is another type of candlestick with a small body. A doji candle signifies indecision as it has both an upper and a lower shadow. Dojis, depending on the variation, may signal a price reversal or a trend continuation. This differs from the hammer candle, which occurs after a price decline and signals a potential upside reversal, and only has a long lower shadow.

Things to consider

As with any technical analysis tool, there is no assurance that the price will do as expected, even after the confirmation of the pattern. A long-shadowed hammer paired with a strong confirmation candle may push the price high for some time due to market instability. This may not be the best spot to buy because the stop-loss is far away from the entry point.
Hammer pattern also doesn’t provide a price target, which makes setting up a profit target quite difficult.

Categories
Crypto Videos

Master Doji Candlestick Trading! Unlock Your Potential!

Profiting from the crypto market – Doji candle trading

Doji candlesticks

The Doji star, better known as the Doji candlestick, is a unique candle that signals indecision in the crypto market. It shows that neither the crypto bulls nor bears are in control. However, not everything is that simple. The Doji candlestick has five variations. Each one of them shows something different. This is why it’s important to understand how to spot and read different Doji candle variations.

The Doji candlestick is characterized by its cross-like shape. This happens when a cryptocurrency pair opens and closes at the exact same level leaving a very small or even non-existent body while also exhibiting upper and lower wicks of equal length. While Doji mostly represents indecision in the market, it can also indicate a slowing momentum of an existing trend.

Doji candle in technical analysis

The Doji candle can be a very important piece of information as it can provide crypto traders with a moment to stop trading and reflect. However, it is important to consider the Doji candle in conjunction with other tools when timing your market exit point.

Doji candle variations

While the traditional Doji star shows indecisiveness, other variations can have different implications.
The picture on the screen will show different variations of the Doji candlestick, as well as its outcomes.

Trading the Doji candlestick

Traders use various ways to trade various Doji candlestick patterns. However, they all look for signals that complement the Doji candlestick in order to execute high-probability trades.

Trading the Doji star


The chart shows the Doji star appearing right at the bottom of an existing downtrend. This Doji pattern suggests that neither bulls nor bears are in control, meaning that a trend reversal is possible. At this point, it is crucial to take a look at supporting signals from other tools and indicators. This example makes use of the stochastic indicator, which is currently in the oversold territory, which adds to the bullish bias.

A popular Doji trading strategy involves looking for Dojis, which appear near support and resistance levels. The chart highlights the Dragonfly Doji, which appeared near trendline support. In this case, the Doji doesn’t appear at the top of the uptrend, so it doesn’t mark a trend reversal. The Dragonfly Doji, in this case, shows the rejection of lower-level prices. This potential bullish signal is further supported by the candle appearing near the trend support.

Categories
Crypto Videos

Make Crypto Trading Profits Using Forex Techniques – The Three Line Strike!


Generate profit trading cryptocurrencies – Three Line Strike

Many traders rely only on indicators, while only a few take into consideration patterns that appear in the market. Even fewer people are spotting small candlestick patterns, which they might think of as insignificant. However, they are far from insignificant.

Three Line Strike

A three-line strike represents a continuation group of candlesticks that is formed by three candlesticks in the direction of a trend, then followed by a final candlestick that pulls back to the starting point.
There are two versions of a three-line strike: Bullish/Bearish

The bullish three line strike consists of three strong bullish candlesticks that close higher than the last one, then followed by a final candle, also known as the strike candle. The strike candle goes in the opposite (bearish) direction and opens at or higher than the third candlestick, but closes below the open of the first candle in the pattern.

A bearish three line strike is everything, but in reverse, three strong descending candles that close progressively lower followed by a bullish strike candlestick. The strike candle opens at or lower than the third candle close and closes above the first candlestick open.

Validating the pattern

To validate this pattern, we need to confirm that the first three candles are at least of average size. They need to have a defined stair-case like appearance in order to be reliable.
A bullish three line strike should be treated as an extension of the three white soldiers pattern, while a bearish three line strike as an extension of the three black crows pattern.

Market Sentiment

The assumption behind the three-line strike amongst traders is that the strike candle shows a temporary correction that will not be prolonged, while the main trend will follow the first three candles. The pullback of the strike candle is a reaction to the strong move to one direction in the first part of the pattern.

Buyers should use the low point of the pattern to create an entry opportunity. Sellers, on the other hand, should use the high point of the pattern to create an opportunity to sell high.

Three Line Strike Reliability

The three-line strike is not a very common pattern in cryptocurrencies. However, it is quite reliable when paired up with volume indicators, and traded with the larger time frame trend. A thing to note is that the bearish three line strike is slightly more reliable than the bullish one when it comes to crypto trading.

While the bearish pattern was accurate over 60% of the time, the bullish one was accurate, only 50% of the time.
Bullish Three Line Strike – Example
The example will show a chart which created a bullish three line strike. The first three candlesticks lined up in a three white soldiers formation, signaling reliability.

A buy signal was confirmed when the low of the strike candle reached below the first candle open.
Bearish Three Line Strike – Example
This example will show a chart that illustrates a bearish three line strike. The high of the strike candle does not reach the open of the first candle, but remains within tolerance levels, and is close enough to be classed as a bearish continuation.

Categories
Forex Videos

Forex Passive Income – Make Money In Your Sleep!

Passive Income In Forex Trading

Example A In this video, we will be looking at The process of making income in the forex market, It’s processes Methods for doing so and whether or not it is a viable method for you to increase your income, Including the risks involved in doing so.


Example B, So what is the difference between passive and active income? Active income is something where you might expect to earn money in regular employment, whereas passive income is irregularly made income, which requires little or no effort. In this context, it would mean that minimal effort is made by the trader in order to earn extra income outside of their normal job. Examples of passive income would be profits made from gambling, stock markets, Interest on investments, or capital gains are just some of the examples, where some definitions, especially with regard to taxation, will change from country to country.

Example C, Active income within the forex arena is where a trader will spend a long time looking at economic data while carefully assessing fundamentals and then checking technical patterns on charts before executing a trade in order to earn income.


Example D, Passive trading is where you want to make money in the forex market. But you do not actually want to go through the processes of learning everything about it and also spend time analyzing the markets via your charts, keeping on top of fundamental analysis. In this case, you may have to pay a third party a monthly fee. And unlike active traders, your trading will fit around your job and lifestyle.

Example E, Let’s look at the pros and cons of active vs. passive trading. Obviously, with passive income, the most important benefit is the amount of time you would have to commit to trading, which would be less than that of an active trader. However, this will often result in earning less money than an active trader. However, opting to spend less time monitoring your trades might expose you to extra risks. It might also be detrimental should you desire to follow a signal service that offered signals with timeframes that did not suit or fit in with your lifestyle. Unfortunately, the Forex Marina is often fitted with scam artists who operate Ponzi schemes and offer signals that are completely unreliable, and these should be avoided at all costs when considering passive trading.


Example F, So how can we earn money passive trading the forex market? One example is automated trading technology which is a trading robot that can be downloaded onto your computer and automatically places trades, setting its own stop losses and take profit levels. These are also known as EA’a or expert advisors. Some of them are very reliable, while some of them are not and you will need to do a lot of research before investing in the right EA for you. Banks and institutions are using these automated trading systems more and more and they are becoming extremely powerful tools with learning capabilities that adjust to various market conditions. It’s just a matter of finding one that suits your budget and expectations. And while the human brain can only analyze a few opportunities to trade during the day, a sophisticated algorithm can filter out profitable trades many many times each day, once a predetermined criterion has been met by the software program.

Example G, Of course, no matter which automated trading robot you decide to invest in, it will still need to be closely monitored. You would not want it to run away with itself losing you money. And while many people are skeptical about these automated trading robots, it is a statistical fact that over 75% of trades on the New York Stock Exchange are now made by these robots, and 70% of banks and institutions now opt for automated trading systems in Forex.
So if you are confident to take the next step and invest in an automated trading robot, we suggest that you carefully monitor it and make sure that it is operating within the perimeters that it was advertised to do and meet your criteria. It would also be a good idea for you to turn the EA robot off during times of high impact news, especially in the current climate where the COVID- 19 pandemics is sending trading shockwaves through the forex market on an almost hour-by-hour basis. Yet the trading robots are still in action while making money for their owners.
The accessibility of EA’s is now so Commonplace that even active Traders are able to program their own trading robots to open and close trades based on the parameters that they set. Some software developers will also work with you on a personal basis in order to develop such an algorithm once again that meets your criteria. This is certainly a growth area that he said to expand within the forex arena.


Example H, Next, we have copy trading. Again this is very suitable for passive traders where they simply subscribe to a copy trading service such as Signal-start or ETorror, and where their accounts can be automatically set to copy the trading accounts of traders who offer their services on their platform. In effect, every trade that they take on will be automatically copied onto your trading account, and where you will mirror their trades. If they win, you win, and if they lose, you lose. You can, however, adjust your risk parameters around their trading, and if they consistently make money, then you can increase your leverage to maximize your profits. The copy trading platforms offer a detailed trading history of their traders, and it is advisable to filter through each trader and seek out the one that is consistently making money while being risk-averse, and where this can be established by the level of drawdown that they are prepared to accept on their account. The lower the percentage of drawdown equals means the lower their risk tolerance is. You would typically pay a success fee to the copy trading platform, and perhaps a monthly fee and the trader will require a monthly fee also and sometimes this will be based on a percentage of winning trades and sometimes this will just be a monthly fee whether they make money or not, and sometimes this is a blended fee structure.

The example I, While this might seem like a perfect solution to a passive train, there are risk factors to consider. The forex market is fraught with risk, and again the current market climate pertaining to the COVID-19 pandemic is very relevant. Even Traders with an exceptional track record can make mistakes, and this could lead to your account being wiped out or even sending you into negative equity on your account if your trading platform does not protect you from this.

That might mean that they will be sending you an invoice for any monies that have been lost on your account due to a negative balance situation.
Therefore choose your trader carefully, as mentioned earlier, a few aggressive wins might give you peace of mind initially. Still, if this flips around into massive losses, it will adversely affect you, not only monetarily, but also psychologically as you tried to come to terms with losing money.

Example J, The next thing that passive traders utilize is forex trading signals. These services are offered via websites, text, and social media platforms. These forex signals are used by passive traders to enter trades based on the information that they receive or observe via one of these platforms and where they then manually use that information to place trades in the forex market.

While some signals are sent out by reliable, professional traders, many such service providers have little or no clue about the forex market, and some of these will be scams where they ask you to subscribe on a monthly fee-paying basis only to send you unreliable trading signals. Therefore do your homework about the signal provider, and if they charge a fee ask for a free initial trial, I’ll and watch for the reliability of the signals and only use them when you are able to ascertain that the information is consistently reliable.

Here at forex Academy, we offer a free signal service and where the signals are provided by professional traders and whereby we offer a detailed analysis with visual representations of why the trades have been taken, or in the case of pending orders why they should be taken. Most of these setups will be centered around professional and widely accepted and used technical analysis skills and sound fundamental analysis. And what is more, this service is offered absolutely free of charge.

In conclusion, passive income in the forex market is an extremely attractive option with many various ways to implement strategies such as copy trading, EA’s, and professional trading signals. And while there is a lot of research to do to establish which area is suitable for your lifestyle, after some detailed homework we are sure that you will find opportunities that suit you.

Categories
Crypto Videos

Master Crypto Trading With The 3 Black Crows Formation!

Profiting from the crypto market – Three Black Crows pattern

Three black crows are a pattern that indicates a bearish reversal of an uptrend. The black crow formation consists of three consecutive candlesticks that each opened within the read body of the previous candle and closed at a lower price than the previous candle. Traders often use this pattern in conjunction with other tools and indicators to confirm a reversal.

Three Black Crows – Explained

Three black crows is a visual pattern, which means that there are no calculations included to create the indicator. This pattern occurs when the bears overtake the bulls during a trending market. It is important to note that the candlesticks should have short to no shadows.
Being a visual pattern, three black crows are best used as a sign to seek further confirmation from other trading tools. The confidence a trader can put into the pattern greatly depends on how well-formed the pattern actually forms. If the shadows are long, it may simply imply that a minor shift in momentum will occur between the bulls and the bears.

Using volume indicators can make the three black crows pattern much more accurate. Volume during the uptrend that leads up to the pattern should be relatively low, while the three candle black crow pattern comes with high volume.

Three Black Crows vs. Three White Soldiers


Three black crows pattern has a complete opposite, which is the three white knights pattern. This pattern looks and acts exactly the same, but is completely reversed. It signals a bear to bull reversal and has three bullish candles instead of bearish ones.

Notable info

If the three black crows pattern formation involves a significant move to the downside, traders should be careful and look for oversold conditions caused by market instability. To mitigate this threat of pattern failure, we have to use an oscillator that can help with confirmation of the market reversal.

Categories
Crypto Videos

Trading Crypto With The Three White Soldiers Pattern! Making Consistent Money

Profiting from the crypto market – Three White Soldiers pattern

Three white soldiers is a candlestick pattern used to predict current downtrend reversals in a pricing chart. The pattern is made of three long-bodied candlesticks that open within the previous candle’s body and close over the previous candle’s high. The candlesticks should not have long shadows.

The three white soldiers pattern suggests a strong market sentiment change. If a candle is closing with small to no shadows, it suggests that bulls have taken over the price and kept it at the top of the range.

Trading the three white soldiers pattern

As the three white soldiers is a bullish visual pattern, it is mostly used as an entry or exit point. Traders wanting to short a cryptocurrency look to exit, while traders who want to go long on a crypto see three white soldiers as an entry point.

When trading the three white soldiers pattern, make sure to take into consideration that the strong move higher might create temporary overbought conditions. That’s why this pattern should be paired up with oscillators, which may confirm the market reversal.

Three White Soldiers vs. Three Black Crows


The three white soldiers’ opposite pattern is the three black crows pattern. Three black crows have all the same attributes of the three white soldiers but in reverse. It consists of three consecutive candlesticks that open within the real body of the previous candle while closing lower than the previous candlestick. While three white soldiers mark a reversal from bear to the bull trend, three black crows show market reversal from bullish to bearish.

Things to consider

Three white soldiers might also appear during periods of consolidation, rather than during a trend. This is an easy way to fall into a trap, so one should take a good look at the longer time frames before trading Three white soldiers. One of the key things to take note of is the volume that supports the formation of this pattern. Any pattern is susceptible to failing in low volume conditions.

Categories
Forex Videos

Is Forex Gambling? The Harsh Truth!

What Is Forex & Is It Not Just Gambling?

There has been an explosion in interest in forex trading since the advent of the retail Forex market, which opened up after the internet was born.


Example A, Much hype has been made of people making fortunes from forex trading in the retail space. So is it all true, or is it a fabrication, and is it really easy to make money trading Forex? Unfortunately, wherever there is money involved, there will always be fraud, and therefore you will find a lot of scams in the forex retail space within social media sites such as Youtube and Facebook and Instagram, etc. People upload videos onto YouTube telling you that they will help you make a fortune and then, of course, they want to be paid money for their education programs or perhaps trading on your behalf with your money, when in actual fact they are ill-equipped and do not care about making a profit for you, they are simply out for your subscription fee or investment funds.
And so the forex world may conjure up ideas of easy money and wealth, with flash cars, luxurious houses, jet-set lifestyles, and exotic holidays. That is the reality Far from the portrayal that many of these scammers would lead you to believe?
In truth, the forex market is a skilled profession. There is a steep learning curve to go through to understand how this industry works. It is a highly complex and extremely fluid marketplace, Where over 5 trillion dollars are traded every day and which is interconnected throughout the financial markets With other asset classes such as stocks bonds, precious metals commodities, and oil. You would not strip a car engine down if you had not been to college to learn about car mechanics and you would not attempt to build a house without first learning how to do so, and you would not try and operate on a human being without first learning all the processes, having been to university. And the forex market is exactly the same: you must learn about economics and the fundamentals surrounding the government’s financial policies of the countries whose currencies you wish to trade in. You will need to learn how to look at trading charts, in what is called technical analysis, to learn how currencies, which are always traded in pairs, are moving against each other, in order to successfully find the trends and trade them accordingly.

Therefore the effort that you put into accumulating the relevant knowledge is the only way that you will be able to successfully and consistently make money trading Forex. Once you have learnt everything that you need to be able to trade successfully, you will then need to backtest your results and forward test them on a demo account before you risk losing your hard-earned money trading in the marketplace for real. Therefore there is no quick fix strategy on how to make money trading; anything short of what is necessary means that you will simply be gambling. And the forex market can be deadly if you slip up.

So how does this market work? The Forex or FX market is an international exchange that is un-centralized, which means that nobody is in charge of it, and where currencies are bought and sold against each other in pairs. We are over 5 trillion dollars being traded from Monday to Friday, 24 hours a day. It is the most liquid business on the planet. There are specific windows when the volume is higher than at other times during the day, and these are the best x to seek out trans in currency pairs and where traders look to latch onto a trend because this is where the real money can be made due to the increased volume going through at these particular times.


Example B, Just like other commercial areas, fluctuations in currencies are largely driven by supply and demand. If you have too much of a product, it tends to be cheaper, and where a product is difficult to obtain, it becomes more expensive, and this can be true with currencies.


Example C
, So when there is a surplus of a particular currency, it becomes cheaper to obtain And may fall against a particular counterpart currency.


Example D and the opposite is true when demand for a currency increases and there are fewer sellers, in which case the price of the currency will become more expensive against its counterpart currency, and the value of the currency will therefore rise.
So how do we apply this demand and supply scenario to the forex market? Each time a currency is bought, surplus demand is created within the market, which subsequently pushes the price of balance, and the price will rise.
And each time I currency is sold, a surplus supply is created. And this time the opposite is true, it throws the market price off balance and pushes the price down.

The Amount that the price moves up or down during these situations is dependent on the amount of volume going through at any particular time, and this fluctuates during the day, and where during those periods where extra volume is experienced during the busiest times of the trading day. Therefore the biggest likely market moving generators tend to be central banks, large financial institutions, large hedge funds, sovereign wealth funds, and whereby the retail sector has a much smaller impact on price fluctuations due to the fact that they only make up a very small part of the forex market.
These constant price fluctuations in the forex market are the main driver for how traders make money in trading. The economic events in the world are constantly changing, where government policymakers adjust their financial policies in relation to the swings in the fortune of their countries’ which affects their gross domestic product and whereby economic data releases, which come out on a weekly and monthly basis are the main drivers as to why there are consistent movements in price action pertaining to the balance of supply and demand for each currency.

Because currencies are always traded in pairs when trading, you are betting on the value of one currency against another moving up or down based on the underlying supply and demand for each currency.

Categories
Crypto Videos

Master Crypto Trading With The Cup & Handle Formation Part 2!


Make money in Crypto by spotting the Cup and Handle pattern – part 2/2

Picking a Profit Target


Determining the profit target is quite simple with this pattern; all you need to do is add the height of the cup to the point of breakout.
There will be times when the left side of the cup is a slightly different height than the right side. In this case, you should use the smaller height to stay on the conservative side, or the larger height for an aggressive approach.


In addition to using the cup and handle formation, you can use the Fibonacci extension indicator to create a great crypto trading strategy (as seen on the chart). Draw the extension tool from the low of the cup to the high on the right side of the cup. Then, connect the tool down to the handle low. The 1, or 100%, level represents a conservative price target, while the 1.618, or 162%, and represents a very aggressive target. The possible targets can then be placed anywhere in between 1 and 1.618.

Things to consider

Traditionally, the cup has a pause at the bottom of the cup built in the formation, where it moves sideways or forms a rounded bottom. This movement shows that the price found a support level and will not drop below it. However, this pattern can also have a so-called V-bottom.
A V-bottom occurs when the price drops and then sharply rallies. Some traders like trading this form of a cup and handle, while others do not. The argument of V-bottom traders is that the sharp reversal of the downtrend shows that buyers stepped in aggressively, signaling strength. Opponents of the V-bottom say that the price didn’t stabilize before bottoming, therefore making the price unstable and susceptible to retesting the level.
When trading this pattern, always look for additional confirmation. It can be found by looking for the bottom of the cup and seeing if it aligns with a longer-term support level. Consider using indicators and tools to determine the support and resistance levels and check if they align or interfere with the cup and handle targets.

Categories
Crypto Videos

Trading Crypto Using The Double Top & Bottom Formation

Trading Crypto using Double Top and Bottom patterns

This year has brought many uncertainties in all aspects of the world, especially health and finance. Cryptocurrencies have not been an exception, either. For the past couple of months, the sentiment has changed from very bullish to very bearish. The trend changed as quickly and sharply as the sentiment did. This is why we will cover the patterns which signal a trend reversal, called “double top” and “double bottom.

Double Top pattern

This image represents a double top pattern. After a cryptocurrency’s has trended upward for a while, it will create a top in price. Investors will often close their positions during this pause of the market, thus creating a downward trend in price. Shortly after that, the value rises again, reaching a second top at almost the exact same price as the previous one. These two tops form a double top pattern, which is essentially a test of the market.

The market is tested in terms of whether the price is susceptible to be nudged higher or not. The downward trend after the second top shows that the market does not have enough of a drive to go further up and that it will trend downward again. In a nutshell, the distinct shape of a double top that is quite similar to the letter M represents a bearish move.

Double Bottom pattern

As expected, the double bottom represents everything that the double top represents, but in reverse. Rather than testing the upside of a cryptocurrency, the market testing comes after a downward move and tests if the market is ready to go further down. The double bottom pattern is recognized by the two inverted peaks that are formed at approximately the same price level.

When it happens that the downward trend has been tested twice, and the bottom has been found, then the market will reverse, and the uptrend will start. In a nutshell, the distinct shape of a double bottom that is quite similar to the letter W represents a bullish move.

Additional information

The double top pattern and the double bottom patterns are price reversal indicators. However, there is always the risk that you will encounter a false reversal, meaning that the price movement will play out just the way you want for a very short amount of time, and then do the complete opposite. That’s why it is important to mitigate the risk by doing a couple of things. First, set the stop-loss below the double bottoms or above the double tops. Second, make sure to wait for a candle close in your direction to get a confirmation of the trend reversal. Ultimately, you can pair trading this pattern with candlestick analysis, indicators, and other tools at your disposal.

As the last piece of advice, try to make trades where the double bottom or top will show a trend reversal to a direction of the longer time-frame trend. This way, you will trade alongside the long-term trend, which is much safer than trading against.

Categories
Forex Videos

Win More Forex Trades With The Speculative Sentiment Index!

.Speculative Sentiment Index Index (SSI)

In this presentation, we will be looking at the speculative sentiment index and its significance in the forex market. If you have been researching some of the technical indicators that Traders use, such as the stochastic oscillator or perhaps the Bollinger bands or MACD, you will realize that the majority of them are lagging indicators. That is to say that the data they imprint on our computer screens are based on the previous or historical data, which it uses to plot the various graphs, moving averages and plot lines onto our charts.

Although this information, when carefully analyzed, helps us to determine to a great degree the potential future movements of price action, the very nature of such lagging indicators does not necessarily tell us what is happening at this very moment in time. Whereas price action, which is itself one of the only few leading indicators of price direction, does.
Although this does limit our trading ability to a certain extent, professional traders learn to marry the two together in order to tip the scales in their favor when it comes to pulling the trigger on trades.

Of course, the absolute perfect solution would be if we all traded the same way at the same time. This would be a perfect solution, but of course, it does not happen like this, because of the many different time frames being traded and the many different types of traders, from scalpers to intraday and swing to long term traders. But what if we could take a snapshot of what other traders are doing at any given time, and if we knew what they were doing, and if we could see statistically whether they were more long or more short on a particular pair, this would give us an added advantage, would it not?
This is exactly where the speculative sentiment index comes into play. It should be considered as a leading indicator, along with price action, and incorporated with your other technical tools to help you decide when to trade. So let’s take a look at how it works.


Example A, The speculative sentiment index or SSI is the accumulative trading positions data, which is captured in real-time by various brokers, as there is no central exchange.


Example B, The broker will then filter the information and offer it in graph format where each pair tells traders whether there are more buyers than sellers or vice versa. The information is provided as a ratio between the two groups.


Example C, If we know that there are more buyers or sellers on a particular currency pair that we are interested in trading, it can help to influence us either to take the trade or maybe even to wait on the sidelines. But one of the problems with the SSI is that the information will very likely differ from broker to broker, and from time frame to time frame, in which case it might be advisable for you to check two or three SSi’s on various brokers to help give you a clearer overall picture of which way price action is leaning.


Example D, Some SSiI’s provide more information than others. For example, you might expect to see the positioning, including the ratio of long to short.


Example E, The open interest


Example F, And the change between long and short positions

The more information, the better your decision-making processes will be.


Example G, Next we are going to look at how to use the SSI.


Example H, The positioning statement is one of the most utilized aspects of the SSI report.


Example I, Here we can see the numbers of traders who are long or short on a pair, and in this example, we can see that this broker offers the change in open interest, which is currently – 2.8% for the EURUSD pair. So for every one trader that is holding a long trade in this pair, there are 2.81 traders who are holding short positions. Any position that shows a minus in front of the number represents the number of short positions, while readings that are above zero represent the number of traders who are net long in the pair.

Although the SSI is a leading indicator, it is considered to be contrarian, that is to say, that the information that is supplied by the broker should be used to trade against the retail traders with currently open positions.

Example I, The rationale behind the contrarian aspect of this indicator using the 2.8% of EURUSD traders as an example who are short, means that eventually, the sellers will need to close those positions – by buying the pair to exit and because we know there is only one buyer for every 2.8 sellers, this position will eventually turn as the sellers close out their traders and leave a buying void behind them. And the opposite would apply if there were more buyers than sellers. To maximize the reversal potential of this indicator, it is advised to use it when there is a high ratio of change between the buyers and sellers.

Please remember to check SSI’s on a regular basis because some of them will be updated by the broker on a daily time frame basis, whereas some will update them once an hour or even every 20 minutes. It is important that if you decide to use this information to trade that it is as up-to-date as possible. Only then will it help you to determine whether a particular currency pair is bullish or bearish.

Categories
Crypto Videos

Master Crypto Trading With The Cup & Handle Formation Part1!

Make money in Crypto by spotting the Cup and Handle pattern – part 1/2

Chart patterns occur on charts when the movements of the price of an asset resemble a common shape. In this case, we will be talking about the cup and handle formation. These patterns are a visual tool that helps traders make their market decision. Cup and handle provide a logical entry point, a stop-loss target for managing risk, as well as a price target for exiting a profitable trade.

The Cup and Handle

The cup and handle pattern is a strong tool for both small time frames (such as one-minute charts) and in large time frames. It occurs when the price trends down, then have a stabilizing period, then followed by a rally of approximately equal size to the aforementioned decline. This creates a U-shape, which is the “cup” in the “cup and handle” formation. However, this is only a part of the pattern. The price then moves sideways or goes down within a channel, which forms the handle. The handle can also take the form of a triangle.
An important rule to keep in mind is that the handle should always be smaller than the cup. Ideally, the handle should stay in the upper third of the cup. If it is too deep, it will erase most of the gains of the cup, which makes it quite an unsafe bet when it comes to trading on this pattern.

A cup and handle chart may signal one of two things! A reversal pattern, or A continuation pattern. A cup and handle signals a reversal pattern when the price is in a long-term downtrend. If a cup and handle pattern is formed during that time, it will signal a trend reversal. However, if the cup and handle formation occurs during an uptrend, then the pattern would signal trend continuation.

How to trade the cup and handle pattern
Determining the Entry point

In order to trade this pattern well, wait for a handle to form and the full pattern to play out. The handle often goes sideways, descends, or creates a triangle. The entry point should be when the price breaks above the top of this channel or triangle. As soon as the price moves out of the handle, the pattern should be considered complete. However, you might want to wait for a full candle to form outside of the pattern, so you get a real confirmation of the move, rather than blindly entering a false breakout.

Setting up a Stop-Loss

A stop-loss order is a risk-control measure on the trade. It works by selling the position if the price goes the opposite way and declines enough to invalidate the pattern. The stop-loss should be put below the lowest point of the handle or below the most recent swing low (only if the price oscillated up and down often).

Since the handle occurs within the upper half of the cup, a stop-loss that is properly placed should not end up in the lower half of the cup. If the stop-loss happens to be below the half-way point of the cup, try to avoid the trade if possible. Ideally, the stop-loss should be placed in the upper third of the cup pattern.

Check out part 2 of our Cup and Handle crypto trading guide to learn more about setting profit targets as well as some other important info regarding this candlestick formation.

Categories
Crypto Videos

Using Pennants Correctly In Crypto Trading! How Is It Different To Forex?


Using pennants correctly in Crypto trading – spotting the difference between flags, pennants, and triangles


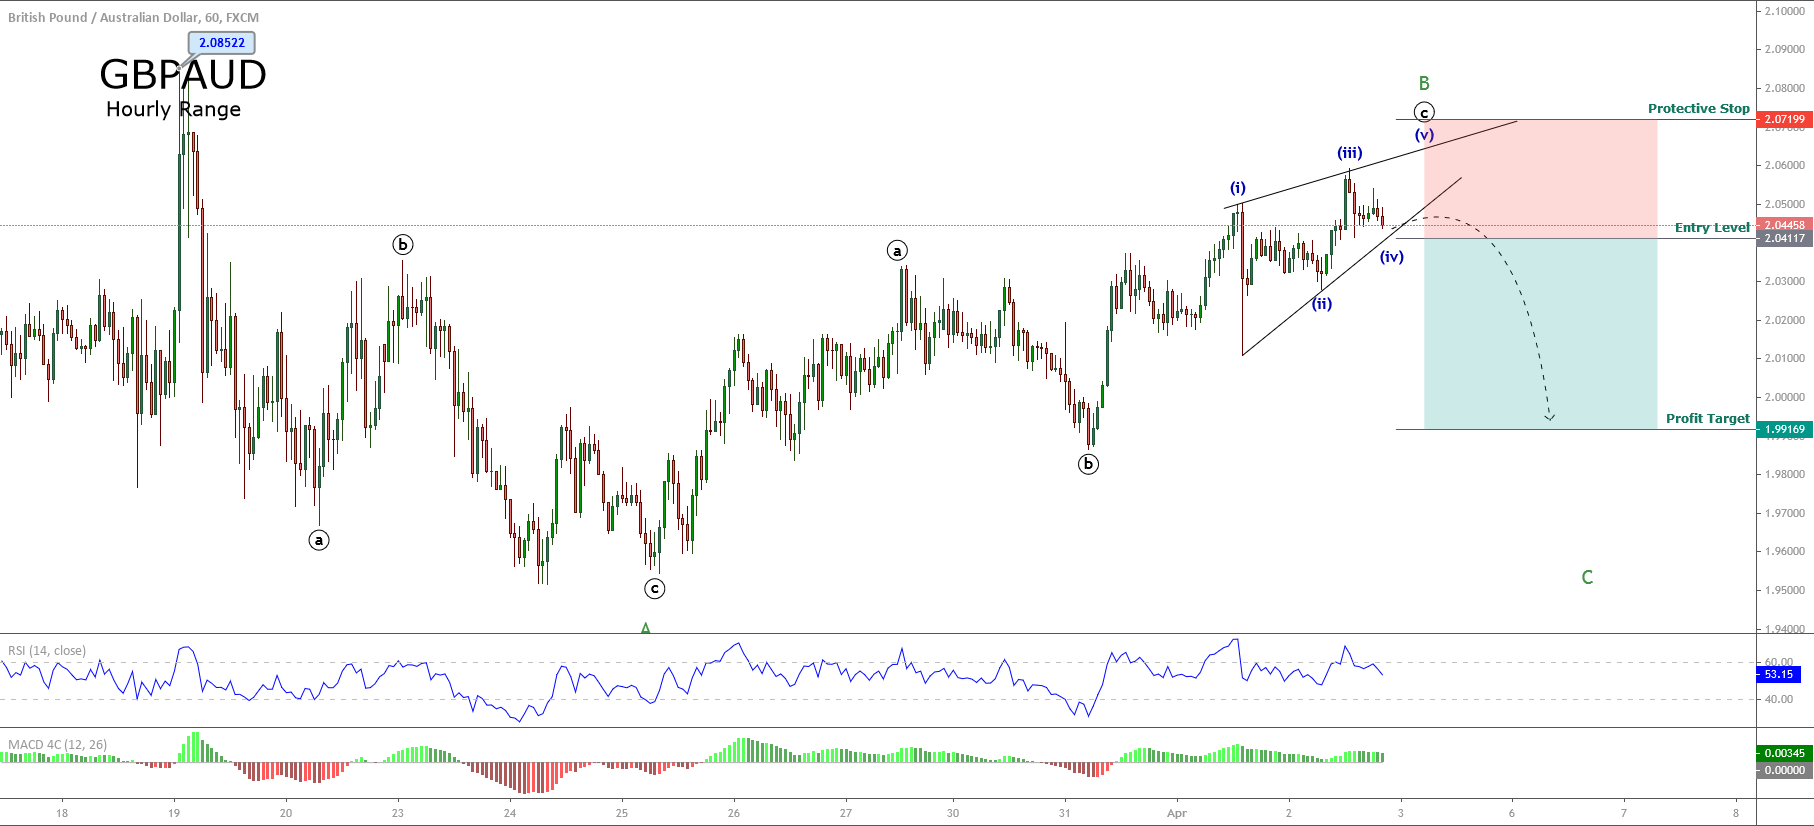
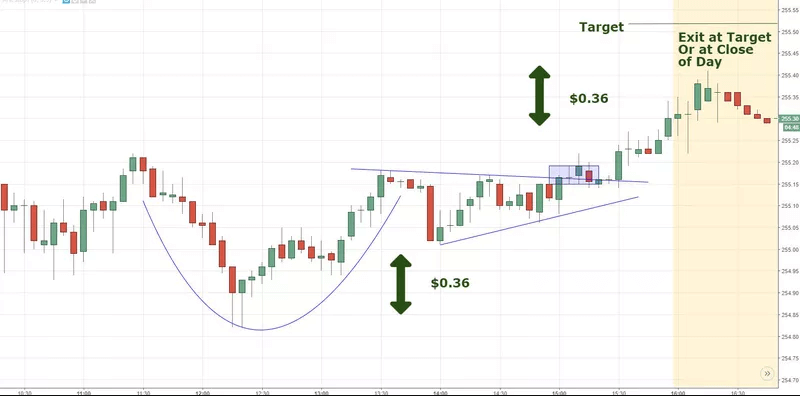
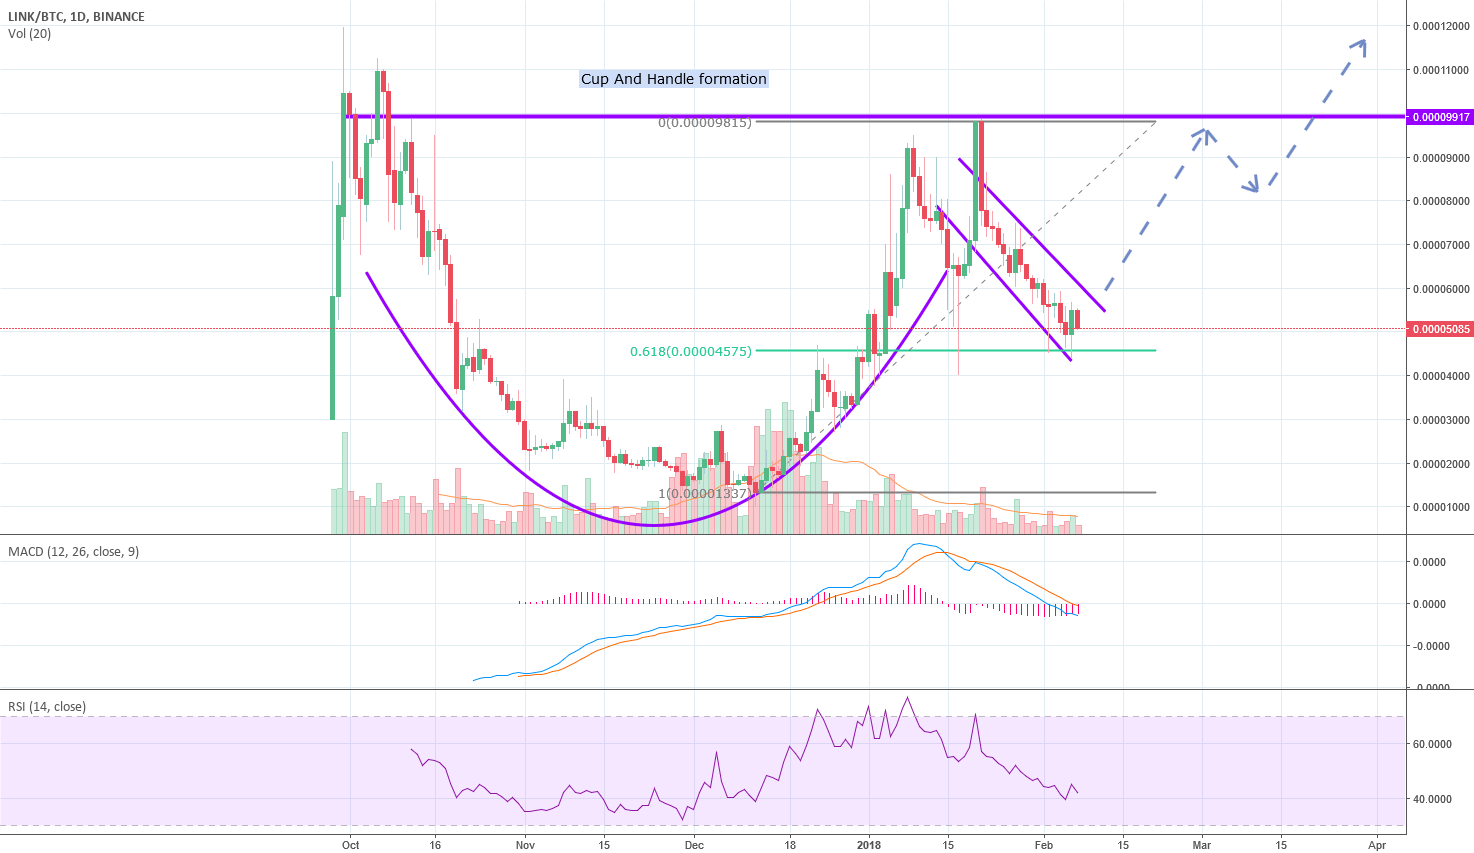
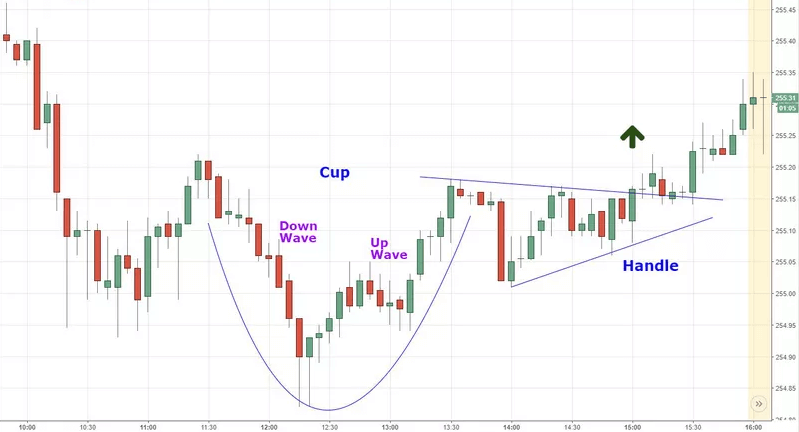
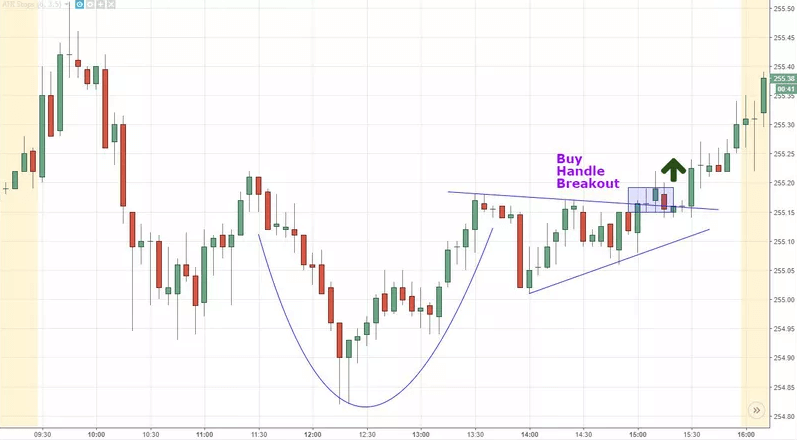
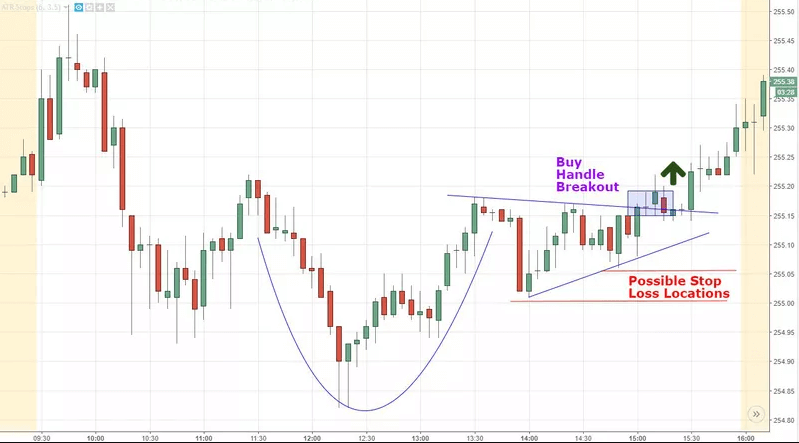
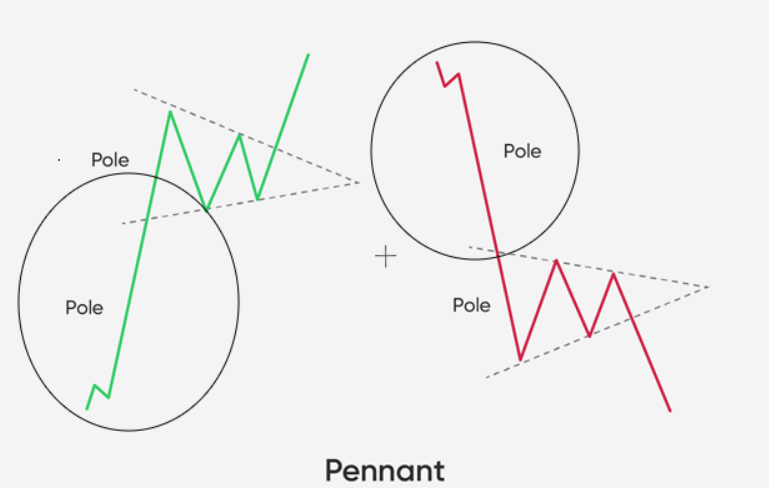
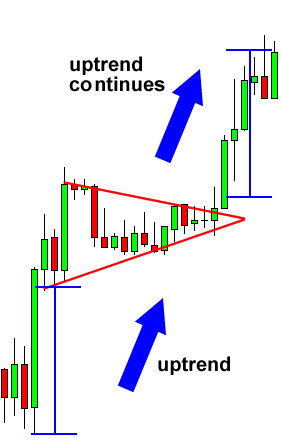
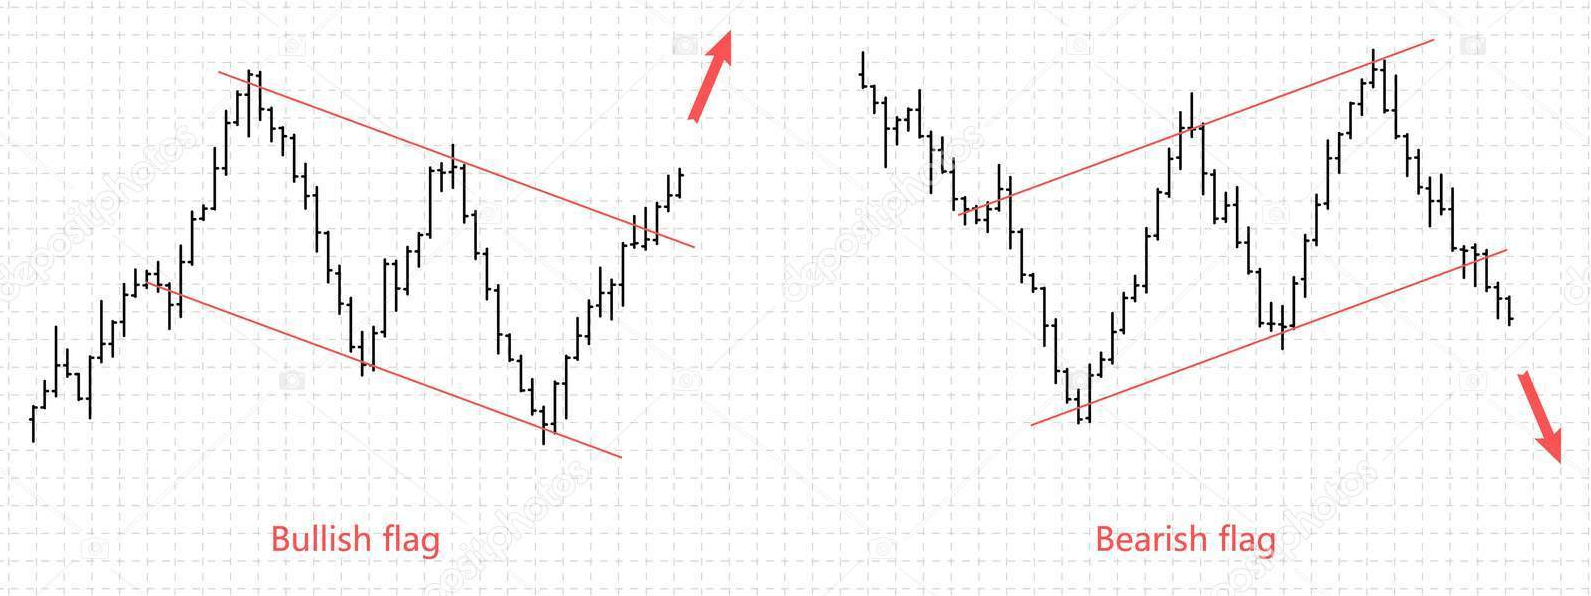
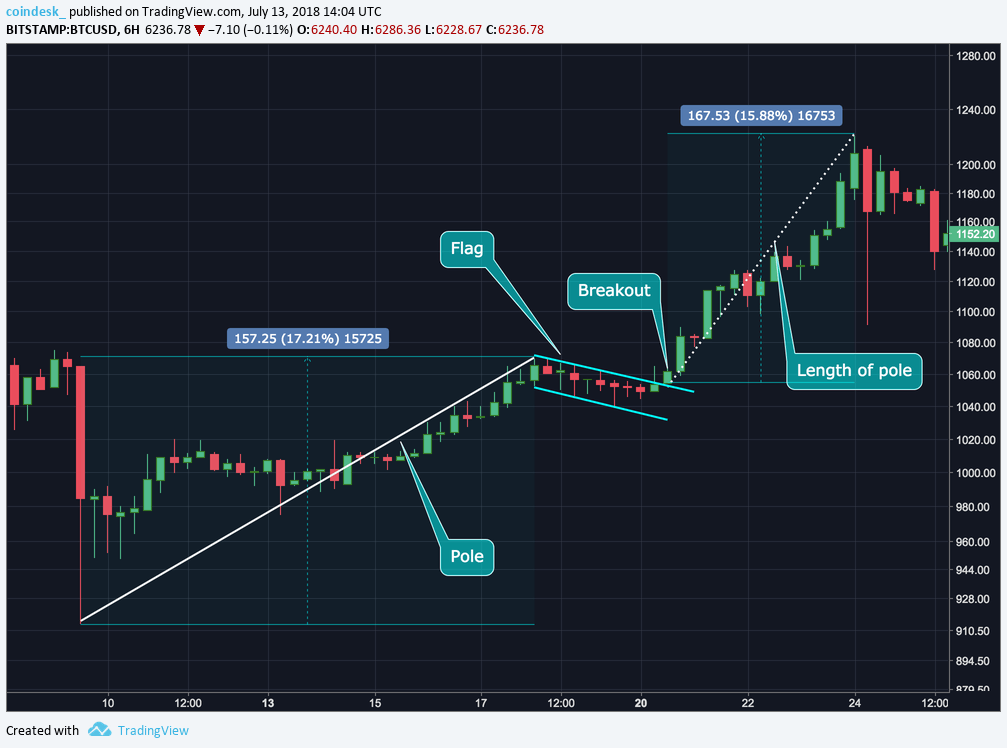
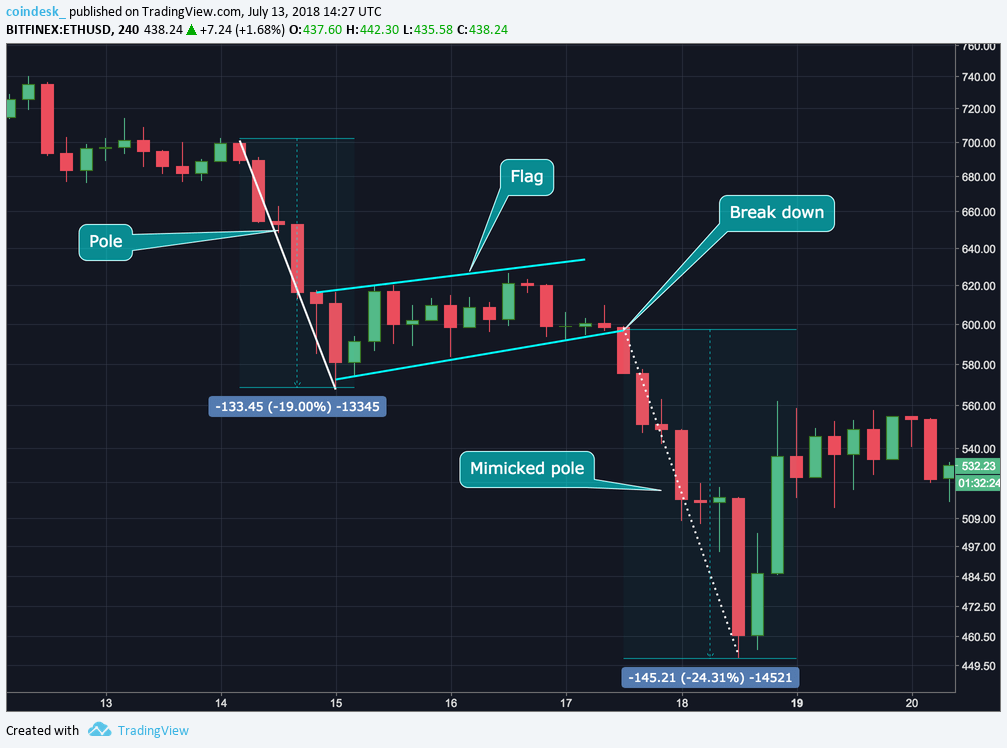
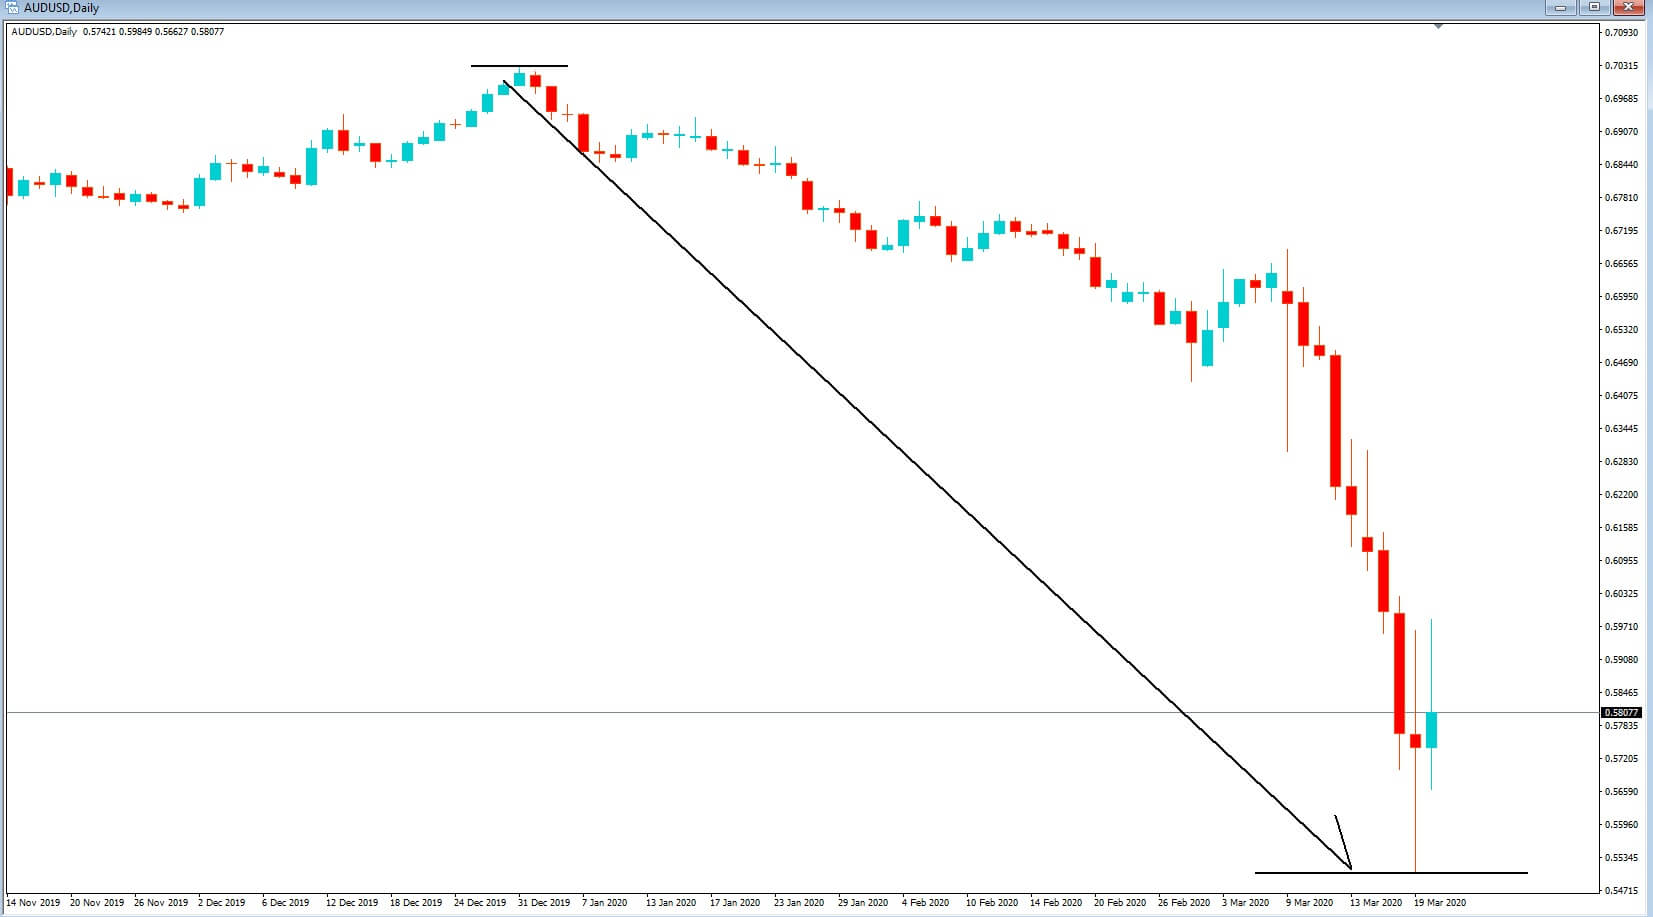
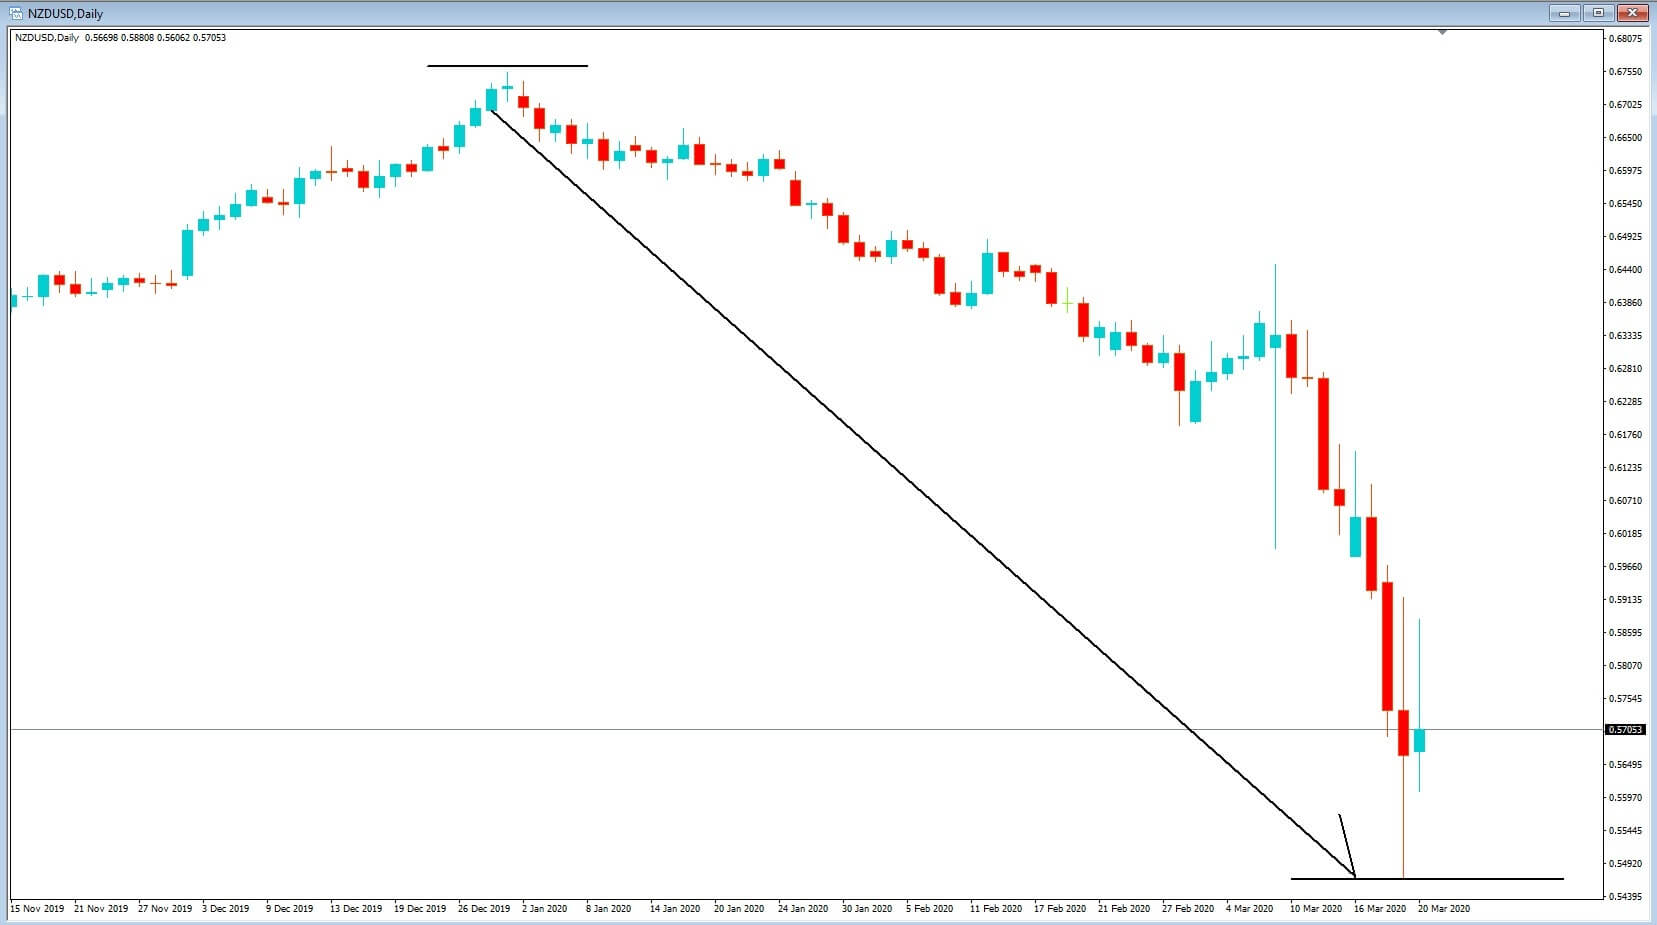
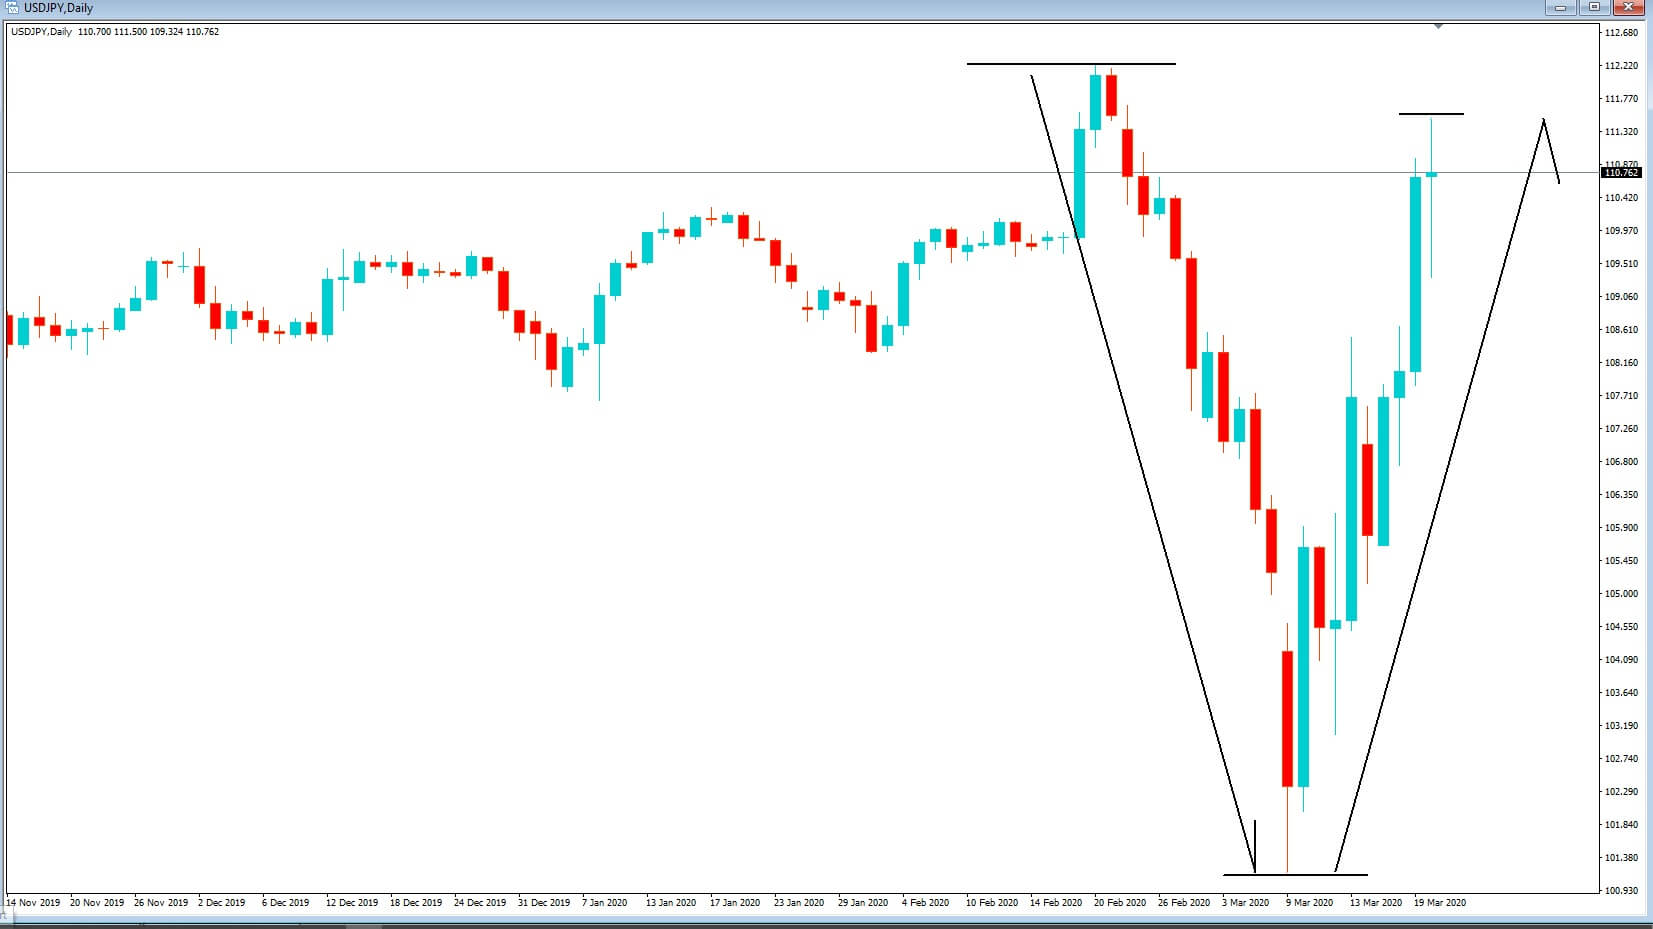
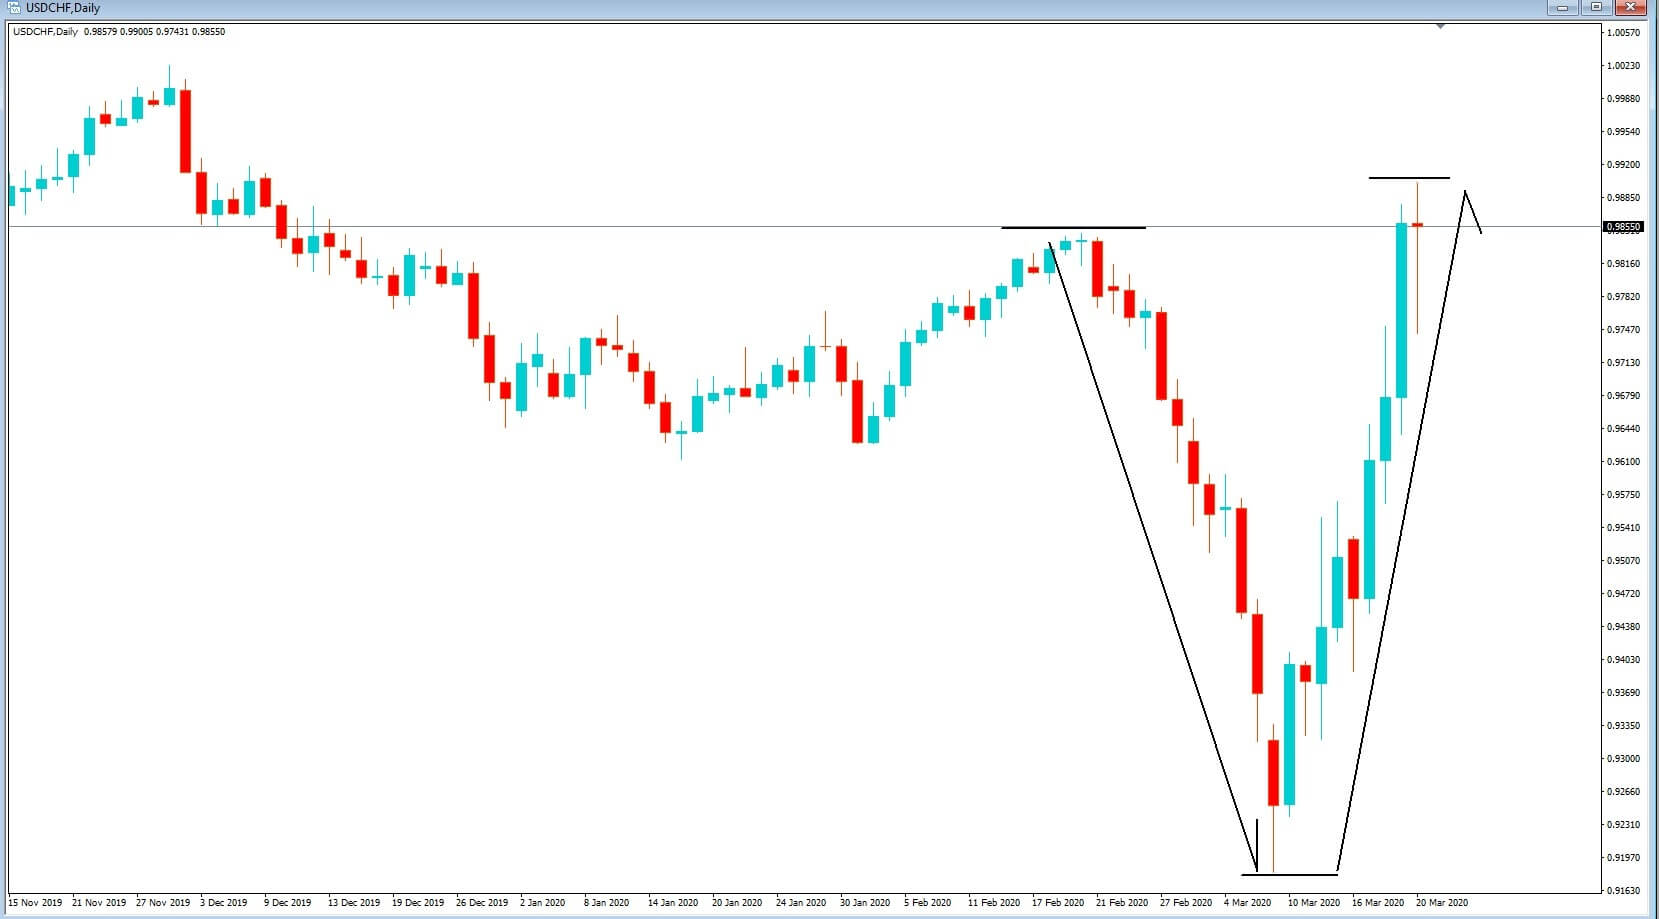
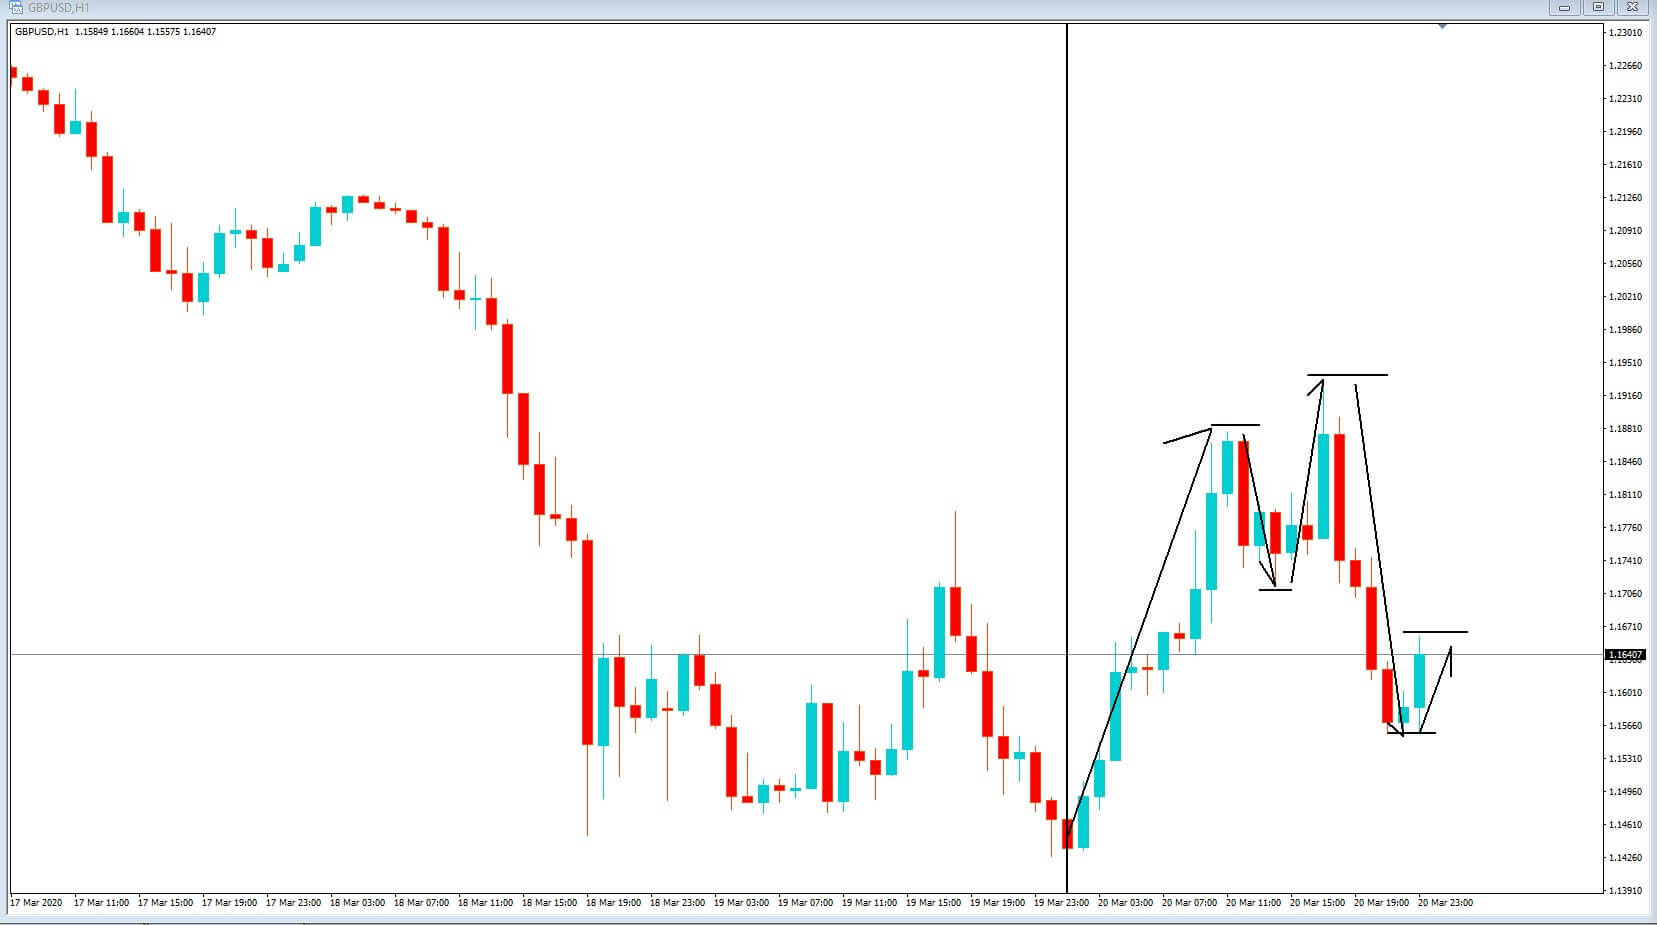
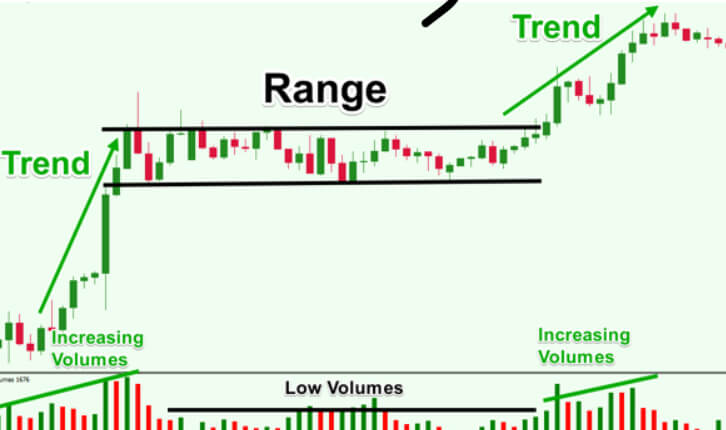
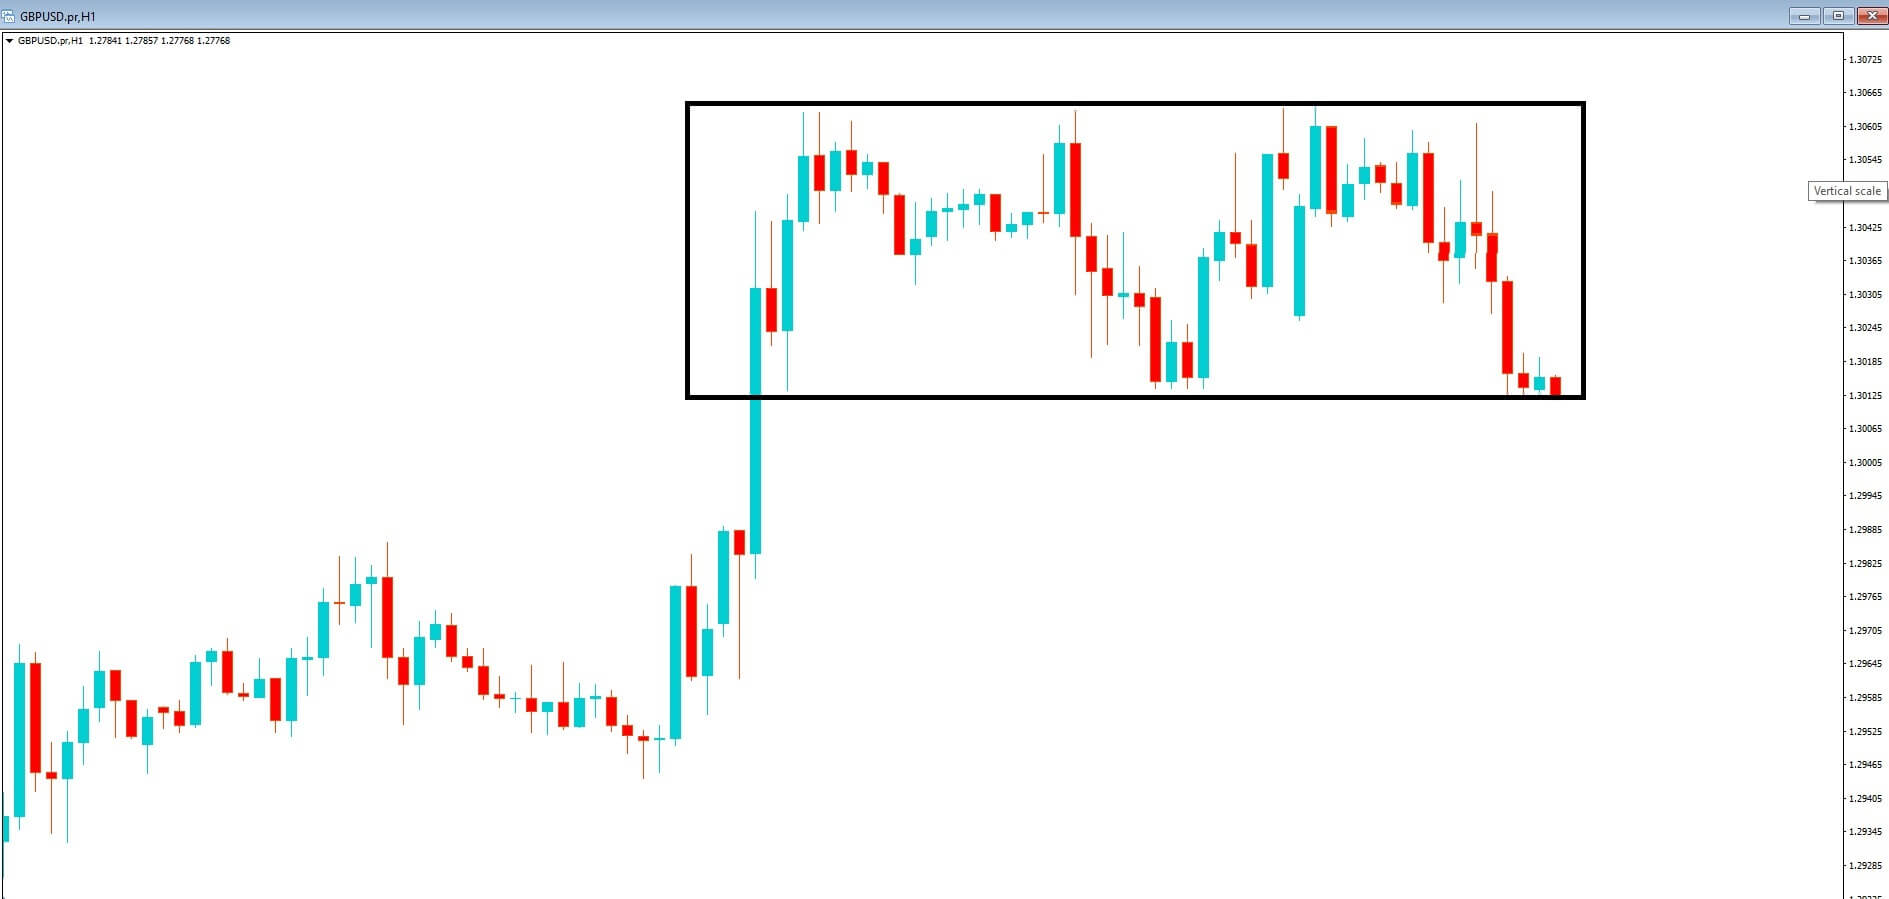
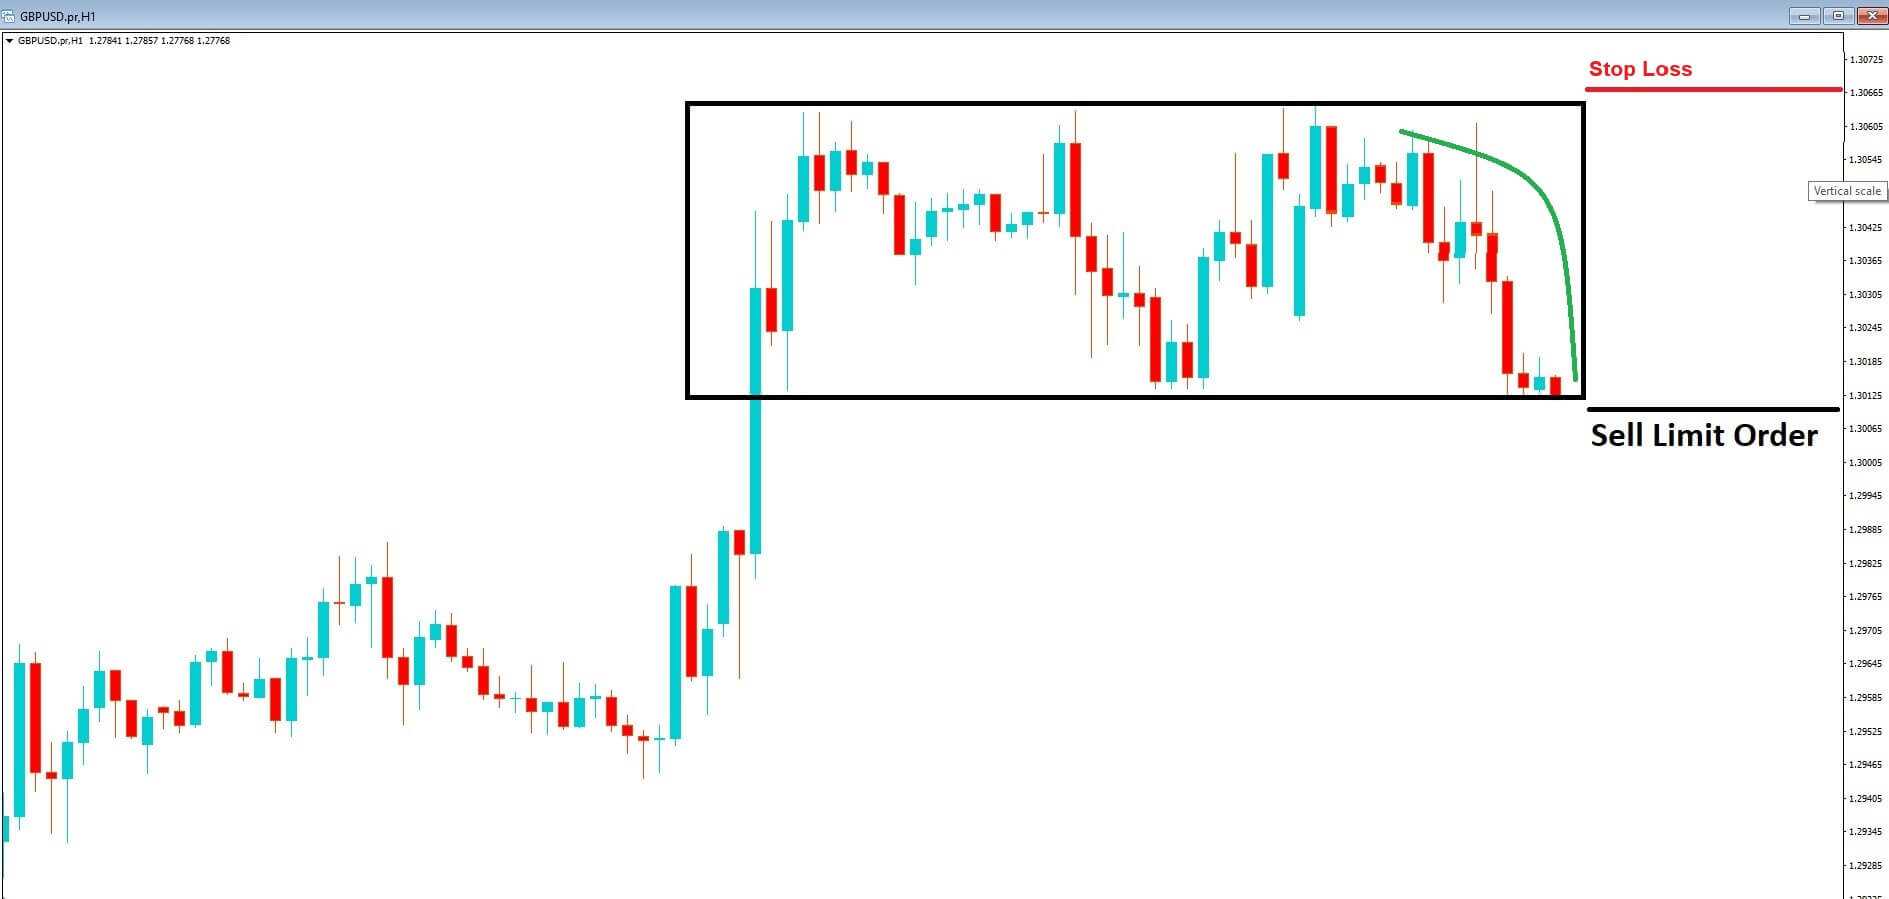
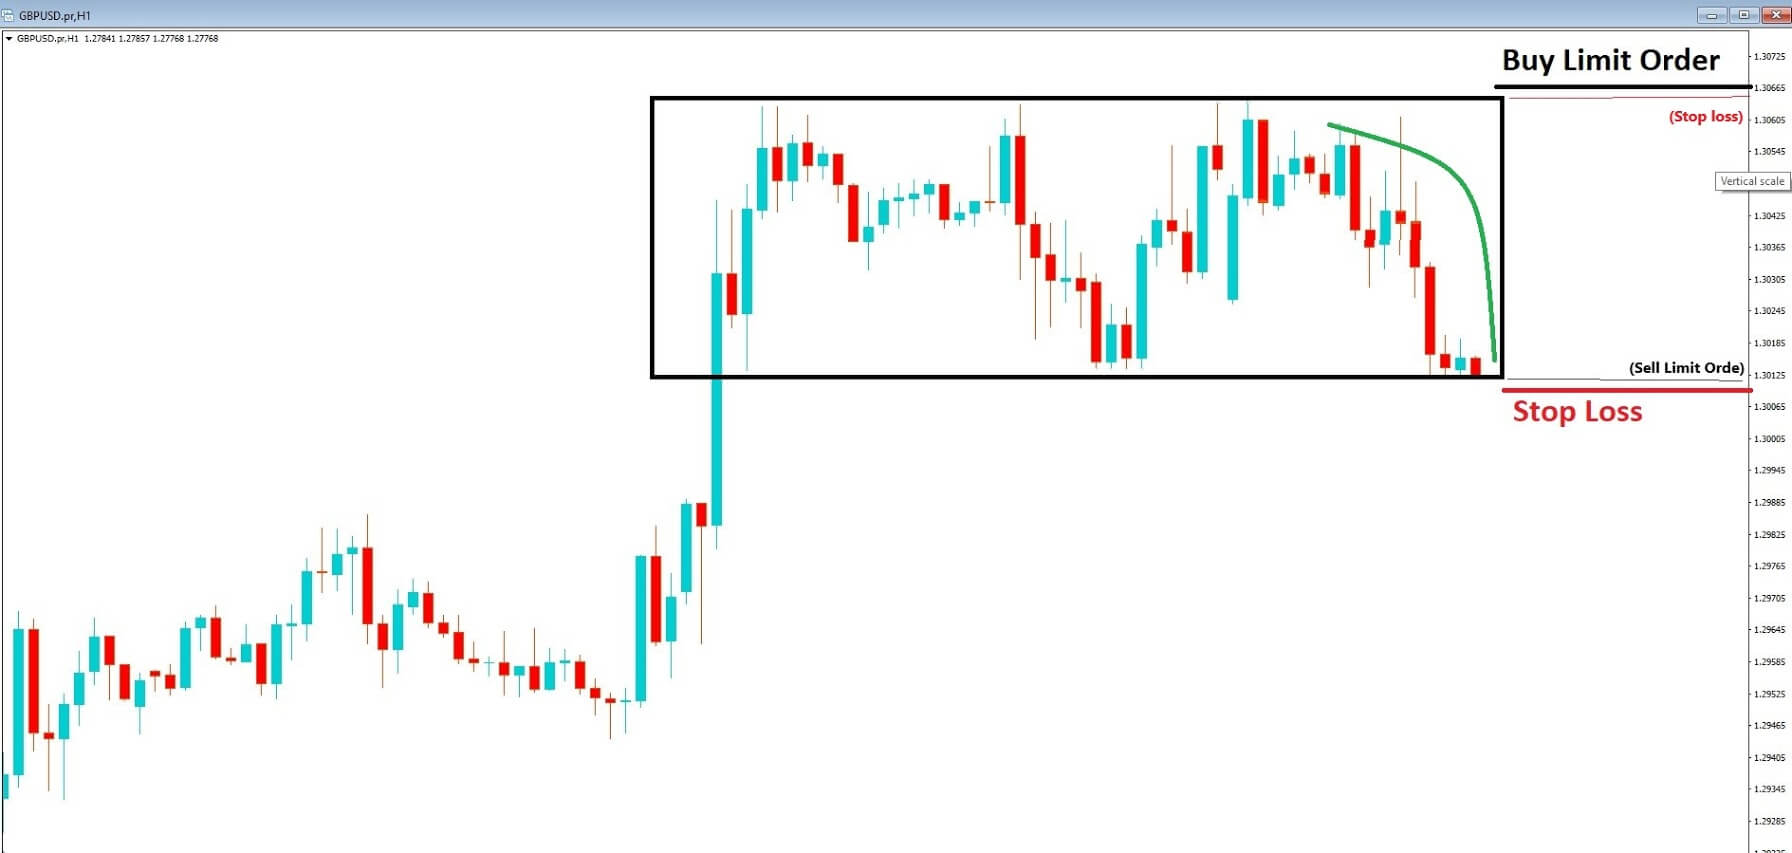
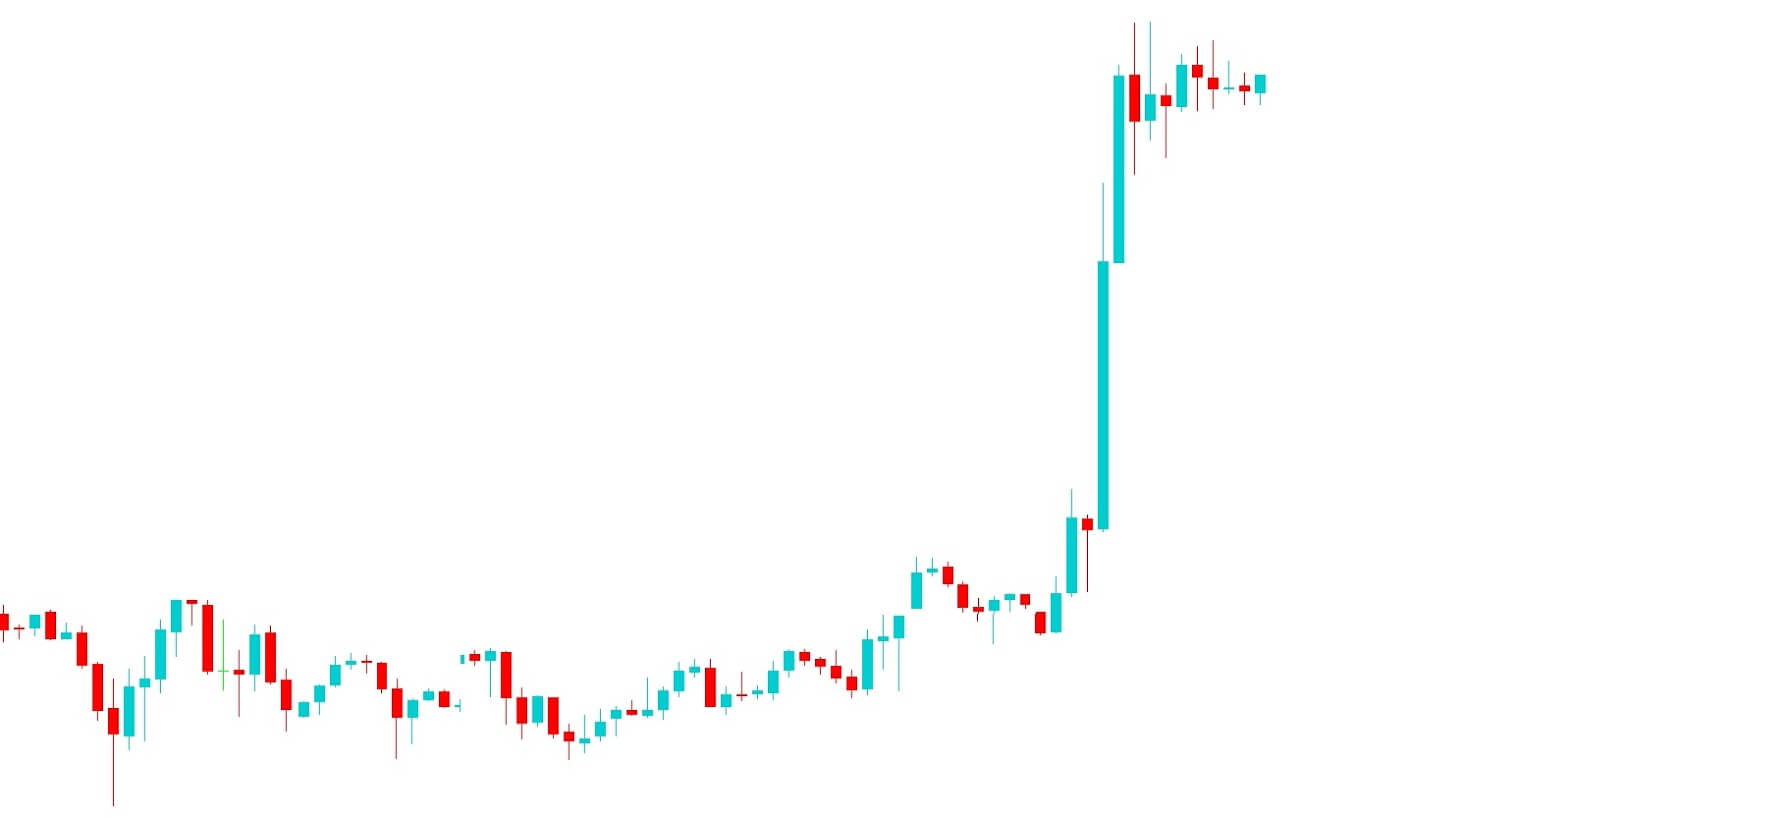
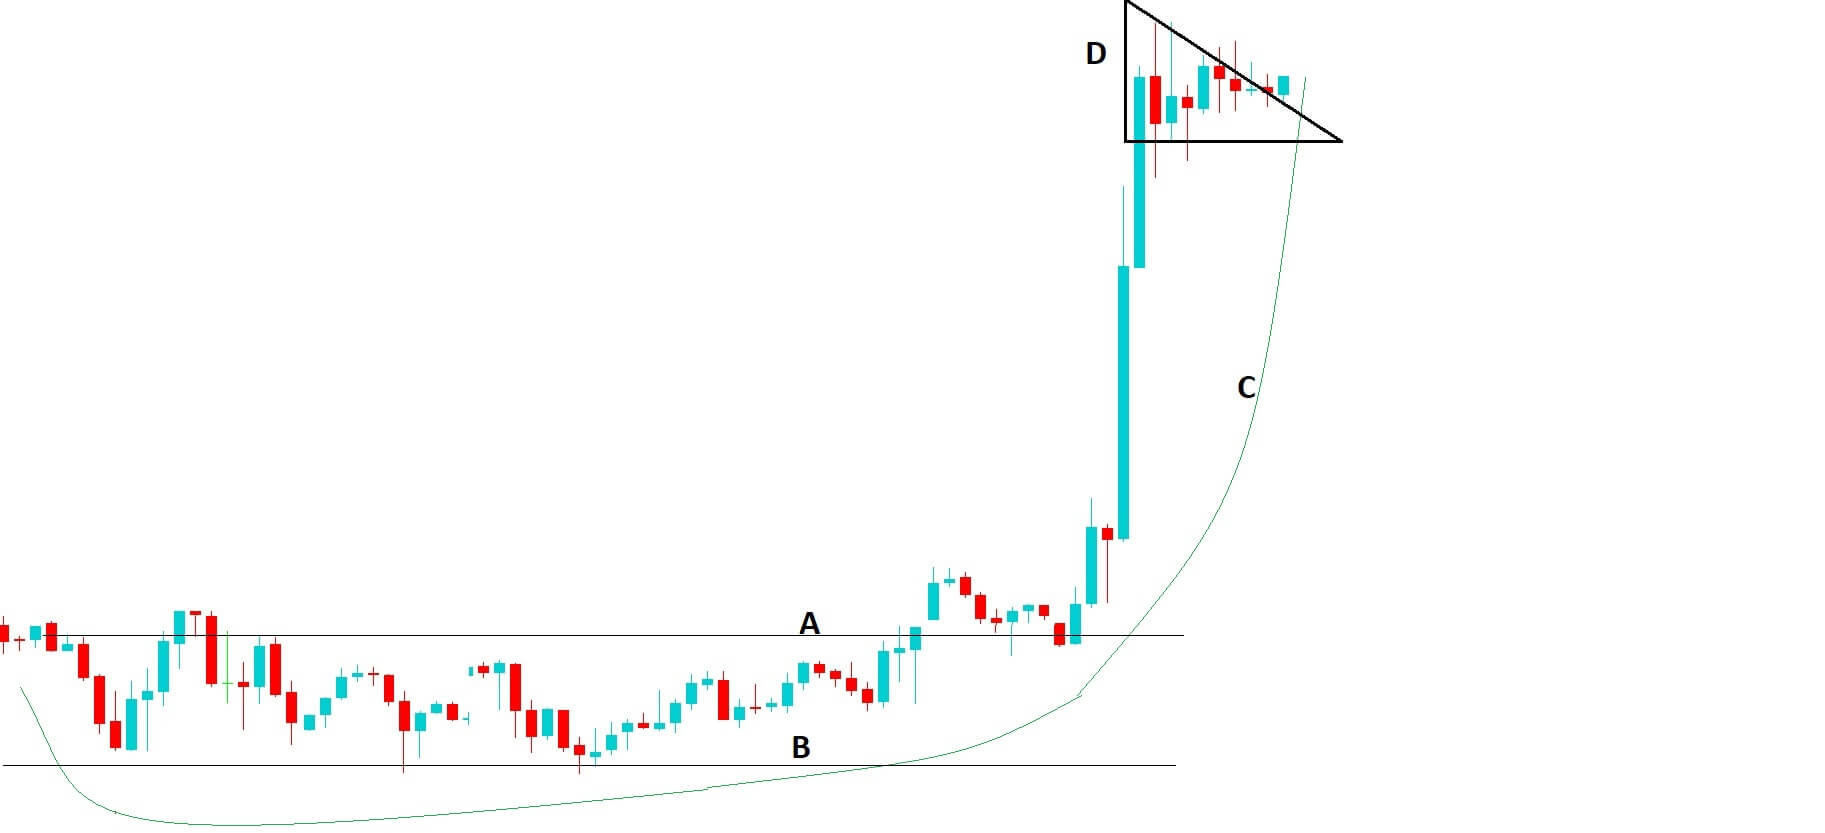
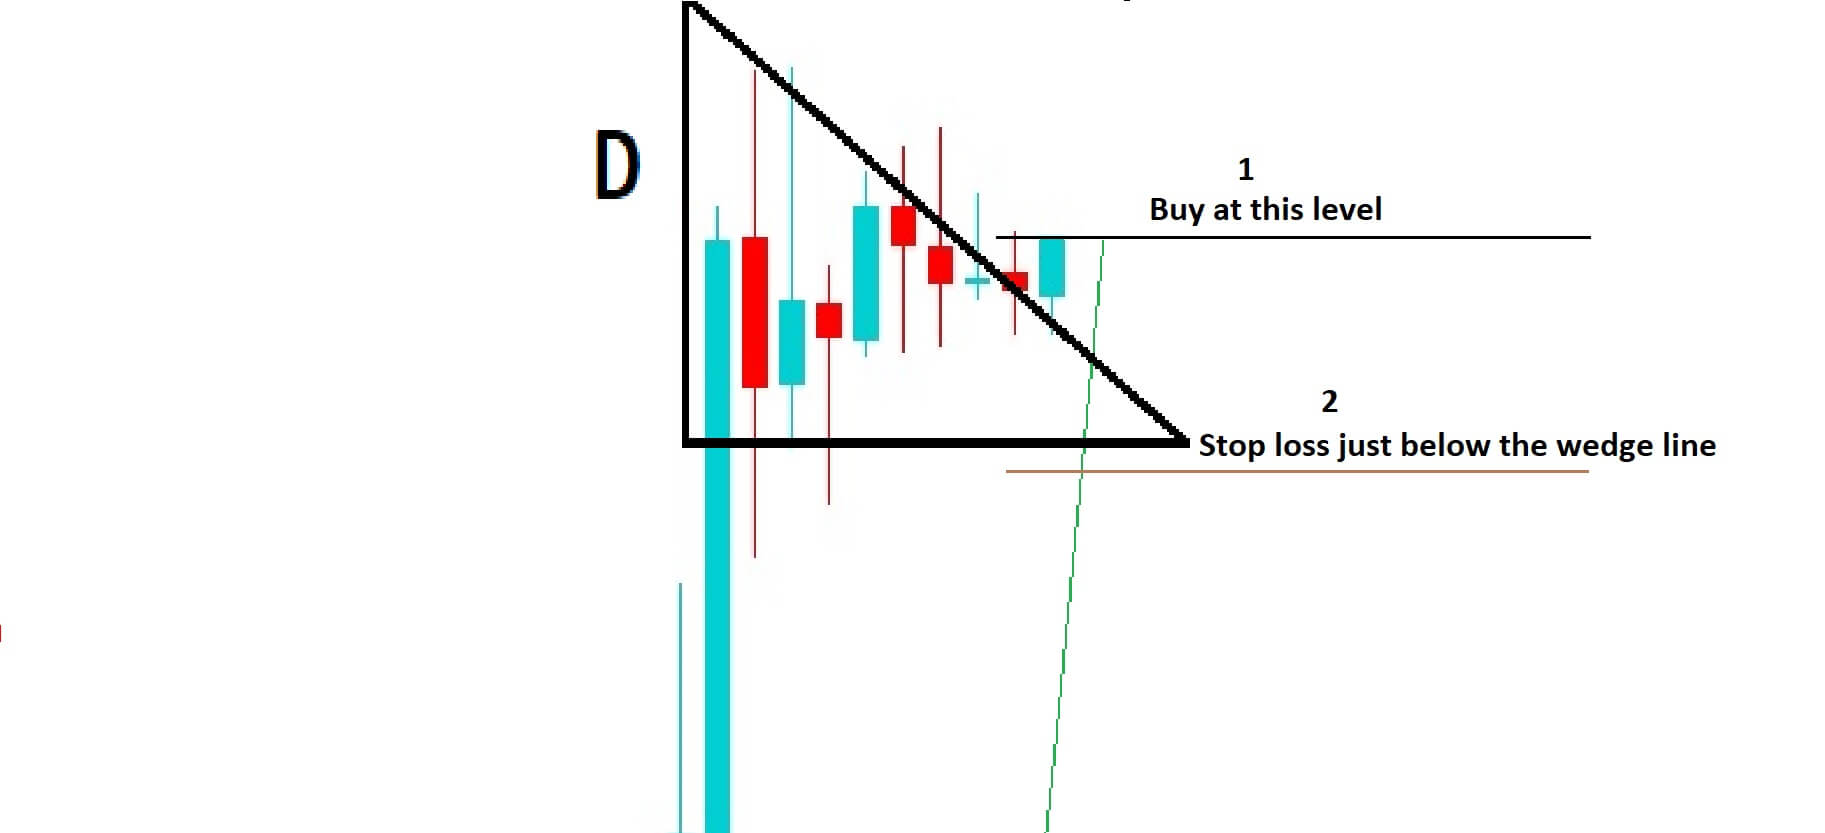
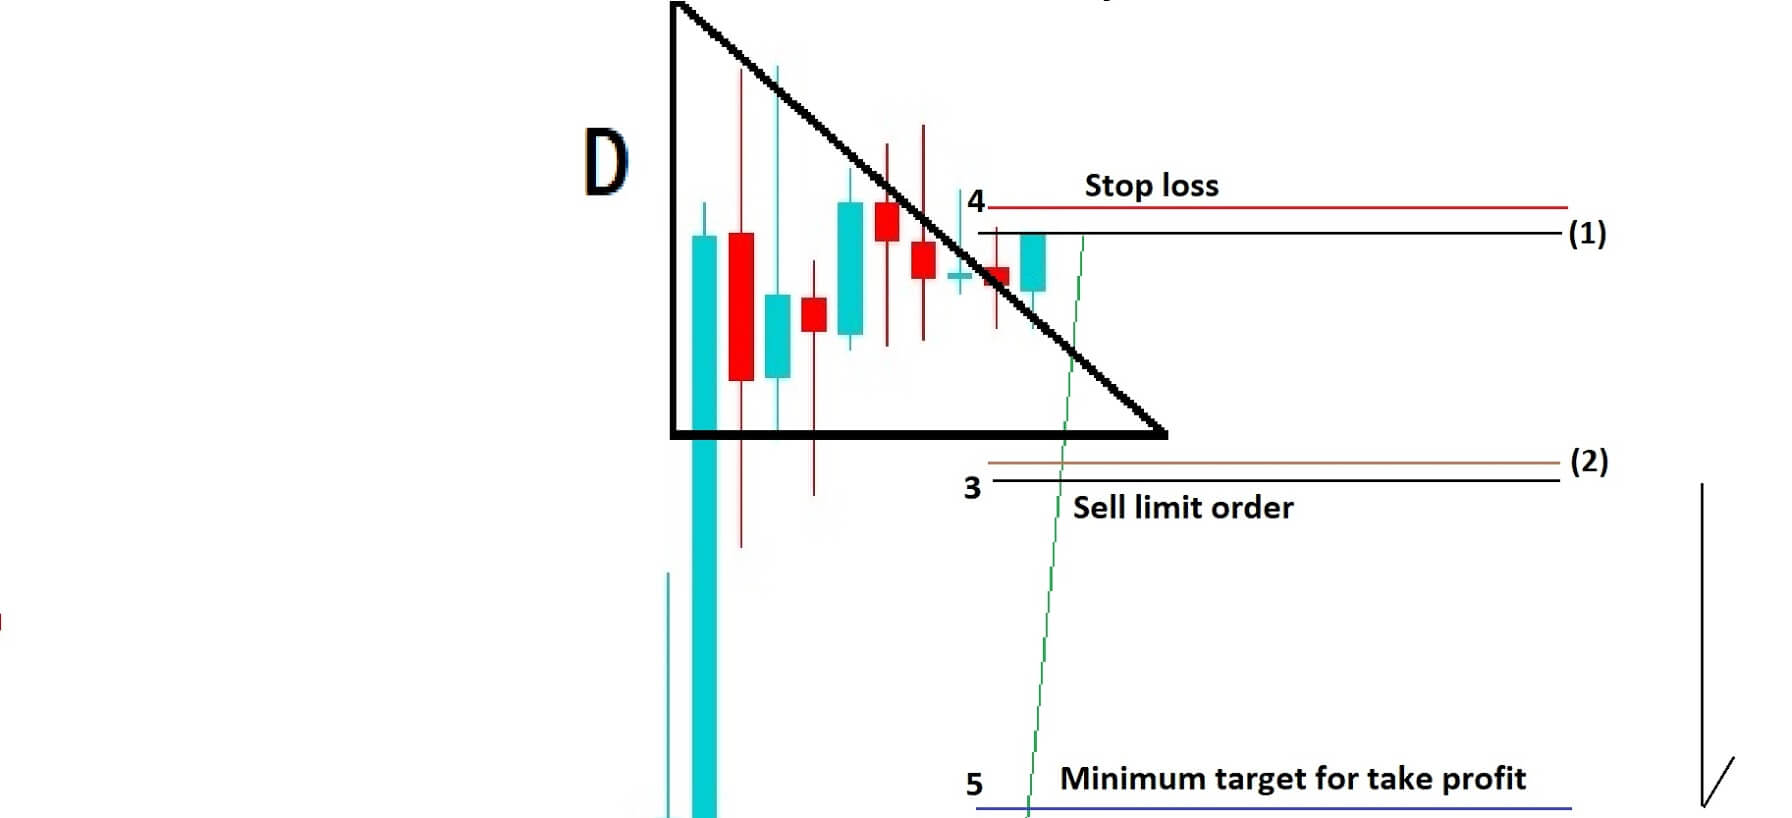
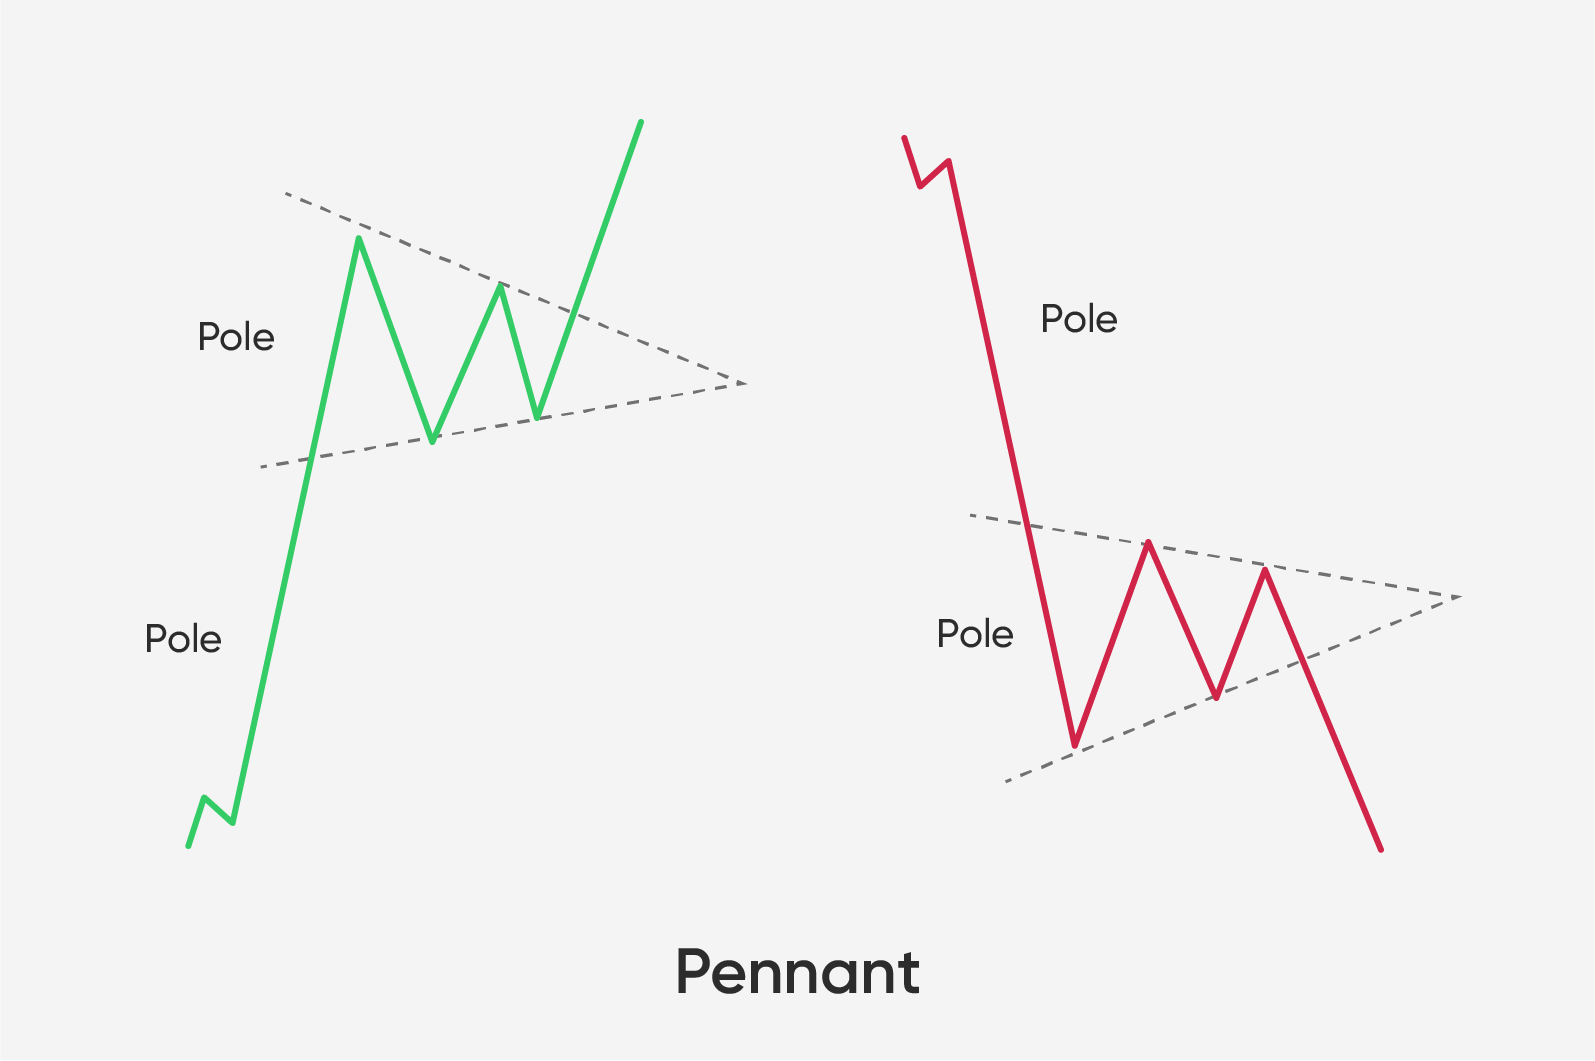
The pennant formation is a formation that looks much like a flag pattern but is triangular in shape. These formations tend to appear at the halfway mark of a trend. When a pennant forms, the trading volume tends to contract, while increasing only after the breakout. To simplify it even further, pennants look like a small triangle sitting on a long pole.

Pennants are a variation of a flag pattern, which means that it is made up of a body and a pole, much like the flag. Just like with the flag pattern, the pole height can be used to create a price target after a five-wave breakout from the body of the formation.
They are associated with very mild volatility alongside limited price fluctuations, which differentiates them from flags and triangles.
Difference between a triangle and a pennant
While pennants are most similar to flag formations, it is quite easy to distinguish one from another. On the other hand, triangles and pennants can be mistaken for one another due to the similarity of the pattern if we are not careful. However, they have some key differences which can be used to determine which one is which.

Difference 1 – the Flagpole

The symmetrical triangle and the pennant both have conical bodies which are formed during a period of consolidation. The price consistently fluctuates between higher lows and lower highs, therefore creating two converging trendlines. However, the part which many people know but tend to miss during a live trading session is that the pennant includes a flagpole at the start of its pattern, which is not the case with the symmetrical triangle. The flagpole is a sharp move accompanied by heavy volume, which marks the beginning of an aggressive move to the upside or downside. Price then pauses and forms the body of the pennant, before breaking out.

Difference 2 – the Duration

Another difference between the symmetrical triangle and the pennant would be the difference in their durations. The pennant is considered a short-term pattern that forms over a period of hours, days, or weeks. A triangle pattern, on the other hand, can take much longer, sometimes months or years. If a pennant pattern lasts for several weeks, it can be considered as a triangle as the flagpole is no longer important.

Difference 3 – the Breakout

The breakout after a pennant formation should occur at or near the point of trendline converging, which is called the apex. However, symmetrical triangles usually break above or below the trendlines a bit sooner, namely one half to three-quarters of the way through the pattern. Therefore, triangles almost never reach its apex.

Using patterns in Crypto trading

Pennants are a universal formation, which means that trading using this formation should be no different than using it to trade other assets. However, due to the volatility of the crypto market, one has to consider the duration of the formation itself. As the crypto market is much more volatile, the pattern formations tend to resolve quicker. Pennant formations, when trading regular assets, are not considered important on extremely short time frames, while that is not the case with the crypto market. They also grow into a triangle only after 12-13 weeks of not breaking out with traditional asset markets, rather than just a few weeks with the crypto market.

Conclusion

Recognizing pennants while trading cryptocurrencies can, just like with any other formations, be an effective way to improve your odds of profiting on a trade by determining the direction of the trend as well as the profit target.

Categories
Forex Signals Forex Videos

Free Signal Service! Forex Academy Are Putting Our Money Where Our Mouth Is!


Welcome to our Brand-new Live Signal Table!


In its effort to help traders learn while profiting from the Forex markets, Forex Academy is proud to offer its users our premium Live Signal table at an unbeatable price: 100 percent free!

The fact it is free to all who subscribed to our notification service does not mean ours is a C-quality service. We have a team of top traders who will continuously watch the market to deliver top-quality trade ideas for you. The resulting trades can be monitored live in our signals section, which will show you the current situation of live trades and the total pip count gained or lost by our traders.


Table guide

In the image, we can see the information provided:Date/time shows the Date and time when the trader created the signal. But that does not mean the signal is live. That will depend on the order type of the signal.

We can create several order types. These are shown in the Order Type column.

The different orders are the following:

Spot buy, Spot Sell: these two are market orders. In this case, the signal is live at the moment shown by the Date/Time column.

Buy Stop, Sell Stop: These are pending orders meaning the order is pending until the price reached the stop level. The price on a buy-stop order is placed above the current market level, whereas a Sell-Stop order is placed below the current market price. a Stop order is a usual way to capture a breakout.

Buy Limit, Sell Limit: These are also pending orders.  In this case, a limit order intends to capture an entry at a pullback of the price. That means a buy limit order is usually below the current price, and a sell limit is above the current price.

To recap: If the order is spot, the signal becomes live immediately. If the order is pending, it is, well, pending, and it will be live at the moment the stop or limit condition is fulfilled.


The Asset column tells the information of the currency pair

The Method column will link to the article explaining the trade idea, which will describe the technical details and main levels. We also will include the risk per lot, mini- and micro-lot, so you can adapt the position size to your current trading account balance.

Then the table shows the price entry, stop-loss, and take profit levels. This will completely define the trade.

The R/R  column is the Reward-to-risk ratio. This is a key metric for the long-term profitability of any system, and we like our signals to show ratios higher than one, preferably two or more. However, if the likelihood of the trade is high, we can present R/R of 1.


Price shows the current live price of the assets of the table. Closing Date/time will show the closing time of the trade. If the trade is closed, the price column will display its closing price. If the trade is still open, the field shows nothing.

The Pips column shows the total pips gained or lost.. If lost, the price box is red-colored. On assets with positive pips, the box is green-colored. The figures shown are updated in the current live trades. On closed trades, it shows the final pip count.


The Notifications

Our interested users can subscribe for notifications for free, as said earlier. The members of our subscription list will receive push notifications for the following events:

When a new signal is published

When a pending signal becomes live

When a stop-loss is hit, and the trade is closed

When the take-profit is hit, and the trade is closed

When we manually close the trade


How to subscribe

The subscription is quite simple. You don’t need to supply any information. Just click the notification bell located at the bottom right of the Signals page and you’re done. It will touch you every time there is a novelty in the Signals section, as mentioned earlier.

Do not doubt and subscribe!

Categories
Forex Videos

Forex! How To Make Money During The Coronavirus At Home


How to earn a living during the Coronavirus while stuck in isolation

There is no shying away from the fact that we are currently living in unprecedented times. With governments across the world instructing businesses to close their doors, forcing people out of their jobs, as well as being ordered into self-isolation, which will leave many people facing huge debts, and many will go broke with some people losing their businesses and even their homes.


This is not fear-mongering; this is an absolute fact. The world is facing a global recession and a financial meltdown. And things will not improve until such time as the virus has been beaten and vaccines are made available. And because of the unknown nature of the virus and the fact that vaccines can take many months to bring to the market, the dilemma that faces the world is that this is too much of an unknown to be able to say when things will return to normal.
However people are adaptable and will search for opportunities to make a living, and the old adage “invention is the mother of necessity” springs to mind, and where people will reinvent themselves with new business opportunities and where because they will mostly be in isolation those opportunities can only arise online.
Therefore, isn’t it about time that you considered working in the forex industry? Because no matter what happens, the money markets continue to operate even during crises such as we are faced with at the moment.


The benefits of working in the forex industry are that you can set up a business quickly and with very little setup costs. Indeed, all you need is a decent computer and internet connection and then choose a broker who to trade currencies with, and whereby your initial outlay can be as little as $200 in order to start trading, although ideally, you would need to put up at least $1000 in order to be able to realistically begin to make a decent living.


The forex market is the largest financial market in the world and is open 24-hours a day five days a week and where anybody can participate. Even during this crisis many institutions and professional traders, all the way down to retail traders, make money by using chart patterns they see on their computer screens to tell them when currencies – which are always traded in pairs – are too high or too low against their counterparts and therefore may be ready to rise or fall. Traders simply bet on the rise or the fall in currency pairs in order to make a profit. Effective tools can be implemented to minimize losses.

The forex market is a global market and is not centralized, and therefore nobody owns it. Transaction costs are low, and here at Forex Academy, we have an abundance of educational material where you can learn all about trading in the forex market, and we can even show you how to open a risk free demo account to practice what you learn with us before you risk your money for real.

The many articles, posts, and videos have been written by professional financial traders who trade the markets even during these difficult times, and want to share their success with you so that you can have an opportunity during these dark times to learn how to successfully trade forex.

Categories
Crypto Videos

Maximise Profits By Trading Bull & Bear Flags In Crypto Trading

When it comes to consistently being profitable in crypto trading, the trend is definitely your friend. However, spotting the trend when it still in the early stages is very difficult, while running along with it all the way to the top is even more challenging.

More often than not, trends (both bullish and bearish) will pause their move briefly, which allows traders or investors to join the bandwagon. We saw this pause in many cases during the crypto market uptrends and downtrends. If a lot of new participants join, the asset price continues the trend. If not, we can expect a trend reversal.

Continuation patterns

A trader can use continuation patterns to spot trend extensions. These patterns occur in a variety of shapes, with some of the most popular being known as bull and bear flags.
A bull flag is a pattern that occurs during an uptrend when the price is trying to continue upward. On the other hand, the bear flag occurs in a downtrend when the price wants to go further down.

Each flag pattern has two main components:
The pole and The flag. The “pole” is a part of the pattern that signifies a strong impulsive move, which is backed by a surge in trading volume, as well as by the subsequent pause in the trend, which represents the “flag,” which resembles a falling or rising channel.

The flag pattern has shown to be an invaluable addition to a traders’ toolset. It is mainly used to calculate the target as well as the direction of the move. As an example, if the resistance breaks in a bull flag, we can be confident that the price will continue upwards and set the target to approximately the length of the pole. On the other hand, if the support of the bull flag is breached, we know that the pattern is invalid and that the trend continuation is unlikely.

Calculating the profit target

A cryptocurrency move after a bull flag breakout or bear flag breakdown usually corresponds to the size of the pole of the flag.
Therefore, the profit target is derived like this:
Bull flag breakout equals to the breakout price plus pole hight
Bear flag breakdown equals to from the breakout price minus the pole hight
Pole height equals to the pole high minus the pole low.

Example of the Bull Flag

Let’s take a look at Bitcoin (BTC) on a 6-hour chart, where it presented a bull flag breakout. Bitcoin cleared this particular flag resistance on Feb 20, 2017, which signaled a continuation of the rally. The rally ranged from the $917 (which was the low of the pole) to the possibility to go towards $1,228 (target measured by the pole height method brought us to $157, which was added to breakout price).
In this case, Bitcoin came just $10 shy of the predicted price target on Feb 24, 2017.

Example of the Bear Flag

An example of the bear flag would be Ethereum’s (ETH) 4-hour chart, starting Mar 17, 2018. Ethereum broke the flag support, which suggested the continuation of the depreciation from the $699 pole high. The target would be $463 if we used the pole height method, which got us to the $133, which were then deduced from breakdown price.
As the move confirmed, Ethereum was just $12 shy of reaching the exact target level on Mar 18, 2018.

Summary

Bull and bear flags can be utilized in strongly trending markets to predict the price target of the move. However, they do not always perform as intended. In some cases, they can present a so-called “false breakout,” which occurs when price breaches the boundary of the flag but quickly retraces.
The risk of false breakouts can be mitigated by waiting for a candlestick to close outside of the flag territory.


For more superb educational content please visit our website https://www.forex.academy/
Categories
Forex Videos

A Black Swan Event, No, It’s A Flock! – How To Trade During The Crisis!

A Black Swan Event, No, It’s A Flock

We are undoubtedly in the worst economic crash the global economy has seen since WW2, and the financial impact may be even more far-reaching. With the financial markets in turmoil and no end in sight, maybe we should pause and take a look at what’s happened over the last few weeks and see if it can give any pointers to future direction, especially within the forex space.
In January, in our video on How to guard your financial assets against the Coronavirus outbreak, we warned that stock indices across the globe would come under continued selling pressure. Although the virus was mostly contained to China, it wasn’t possible, at that time, to predict the terrible crash that we have seen. It was only really when the virus took hold of Italy and broke out in Hong Kong and South Korea, that market jitters forced investors to see the potential of this deadly outbreak and begin selling stocks. Nonetheless, anybody who heeded our advice may well have reduced their exposure to stocks and been financially better off as a result.

Example A

In our February video about How to trade the Australian Dollar and The Convid-19 Pandemic Black Swan Event, again, we called it correctly. With Australia heavily exposed in China, it was highly likely that the Aussie dollar came under extreme selling pressure against the Dollar and that is exactly what happened and where we have seen highs of 0.70 in AUDUSD to a sharp decline to 0.54

Example B

We also warned that New Zealand, whose GDP is heavily dependent on their exports into China, may find that their currencies come under selling pressure too. It has also seen a huge decline against the Dollar from 0.6750 to a low of 0.5490.

Example C

We warned that countries such as Japan and Switzerland would find that their currencies grew stronger due to their safe-haven status. And where USDJPY declined from 112.20 to a low of 101.00 initially, before reversing due to concerns about the virus on the GDP of Japan.

Example D

We saw USDCHF tumble from 0.9855 to a low of 0.9160 and warned that the Swiss National Bank would likely intervene in the markets to drive the value of their currency lower for export purposes. That is exactly what happened.
We also warned that all of this could only mean one thing for the US dollar: it’s directional bias will be to the upside. Again, that’s exactly what happened with the Dollar index at highs around the 102.00 level against the Forex Majors.

Example E

So where to from here? Well, let’s just take a look at the 1-hour chart of the GBPUSD chart from Friday, 20th March. The Arrows show that there was extreme price action, which amounted to over 1400 Pip swings in this pair for this one-day period. This is almost unprecedented in financial trading. It can only tell us that the markets are thinning in volume and leverage and that institutional traders will be largely standing on the sidelines because as the crisis deepens the UK government, just like other western governments, are closing down, albeit temporarily, businesses that produce gross domestic product income revenues. All of that income has suddenly evaporated and gone out of the window. We are now in a situation where governments are financially bailing out business sectors, and they are doing that through borrowing. The burden of the debt that will grow and grow, month after month, as the crisis continues, cannot be predicted, and in fact, the repercussions will be the basis of a secondary crisis which will emerge at the end of the epidemic, due to overburdening debt caused by a virus, while countries and their workforces get back to normal in order to reimburse governments’ coffers in the form of taxation.

And nobody can predict when this virus will be contained enough for the markets to steady themselves. It will only happen when good news emerges, and this does not look at all possible or likely in the short term.
Therefore as institutional and professional traders are waiting on the sidelines and reducing leverage, we would advise retail forex traders to also exert extreme caution in trading these markets while the current crisis persists.

Categories
Forex Videos

How To Use A Hedging Strategy To Trade Double Tops and Bottoms

How To Use A Hedging Strategy To Trade Double Tops and Bottoms

In this video, we are going to show you how to set up a hedging strategy to trade double tops and bottoms. The idea is to set up two trades simultaneously where one trade will act as an immediate execution trade, and where all the technicals are telling us that price action will go in a certain direction. And the second trade will act as an insurance policy should price action ignore our technical analysis setup, and in which case, we will then capture price action as it moves in the opposite direction.
In the following examples, we are looking for price action reversals, which will form the basis of our technical analysis; and therefore our belief is that we will be looking for price action to have peaked, or bottomed out, and then reverse. Our secondary trade, which will act as an insurance policy, will be set up on the basis that price action has simply pulled back and then continues in the direction of the original trend.
Before we move ahead with our setups, let’s quickly remind her selves of the kind of setup we are looking for a double top scenario.

Example A


Example A, shows us that for a double top formation we need a peak, followed by a pullback to what is referred to as a neckline which acts as a line of support, followed by a second peak which must be at the same exchange rate as the previous peak, and then confirmation of the double top pattern occurs once price action breaches the neckline for a second time.

Example B

Example B, The reverse is true for the double bottom scenario. We have a bottoming out of a pear followed by a reversal to a neckline, which acts as an area of resistance and where price action forms a second bottom at or around the same exchange rate as the previous bottom and then a reversal back to the neckline, which previously acted as an area of resistance and where price action punches through and this line which then acts as an area of support before we see a continuation in the reversal of price action, which confirms the double bottom pattern.

Example C


Example C, the following is how we set up the double top hedge. First of foremost, we need to wait for price action to pull away slightly from our second peak and go short at this point with a stop loss a couple of pips above whichever peak was the highest of the move. Should price action continue lower than our neckline, the double top formation will be confirmed, and we can ride the downward move. If price action reverses from the support line, this will confirm an area of consolidation in which case we can bring into play a protective stop out in front of our entry, and at least we will not have lost any money on this trade.

Example D


Example D, The hedging strategy set up is where we place a buy limit order a couple of pics above the stop loss from the first trade, with a slightly larger stop loss which must be a couple of pics below show the previous support or neckline, and in this case, we expect that price action will continue with the original upwards trend. For this trade, we must have a minimum target equal to the amount of pips that were lost in trade one in order to keep our profit and loss in check. However, naturally, we want to let the trade run on as much as possible.

Example E


Example E, In the double bottom hedging strategy, we will simply need to reverse the trade setup for the double top. In which case, we would go long as soon as price action reverses from our second bottom line. With a tight stop loss a few pips below the lowest point of both bottoms. If price action then goes on to reverse back from the neckline to form a third bottom, we can close the trade out with a small profit. But the double bottom confirmation pattern will be confirmed once the neckline is preached, and price action continues in an upward trend.

The hedging strategy consists of a sell limit order just below the stop loss of the first trade and where the stop loss for hedging strategy must be a couple of pics below the neckline.
This hedging strategy should be reserved for timeframes or 15-minutes, and above this is where we will find the most amount of pips to be made. This is not to be considered as a scalping strategy.

Categories
Crypto Videos

Make Huge Profits Market Pattern Trading In Crypto (Head and Shoulders, Triangles, Wedges) Part 1/2

Market pattern trading in cryptocurrencies (Head and Shoulders, Triangles, Wedges) – part 1/2

Finding ways to predict the future price movement of an asset has always been incredibly hard, no matter what asset you are trading. Cryptocurrency trading differs slightly from trading other assets, as it is more volatile, much younger, and susceptible to fear of missing out as well as fear, uncertainty, and doubt.
Although the number of factors that influence the price of a cryptocurrency is almost immeasurable (reaching milestones, partnerships, security breaches, new regulations, etc.), combining this knowledge with the usage of other methods, such as trend detection can be quite profitable.

No matter how volatile the prices of cryptocurrencies may be, at times, experienced traders can spot distinct movement patterns that allow them to predict the direction of the price movement. This guide will explain the fundamentals of three patterns that traders look for when trading crypto on various exchanges.

Head and shoulders pattern

The head and shoulders pattern is a price formation that, to an inexperienced trader, look like a baseline with three peaks and nothing more.
However, if we spot that the middle peak is higher than the other two, which are similar in size, we can deduce that it is, in fact, the head and shoulders pattern.

In technical analysis, a head and shoulders pattern is a sign of bullish-to-bearish trend reversal. It is regarded as one of the most reliable, if not the most reliable trend reversal patterns.
As the cryptocurrency market is extremely volatile and bulls and bears constantly switch in terms of market dominance, the head and shoulders pattern would appear after the market has been dominated by bulls.

After the first price stagnation (which is the Shoulder 1), and the price reaches a new high (which is the head), it still may be possible that the pattern will not form and that the bulls will push the price even higher. However, after the price goes down for the second time, bulls often try to push it up again (which is the Shoulder 2). If they don’t succeed and the price stops at the price level similar to the one of Shoulder 1, it becomes evident that bears are taking over the market.

The target price in this reversal is equal to the distance from the neckline to the peak of the head but in the opposite direction.
When deciding whether to trade the head and shoulders pattern, traders should not just assume that the pattern is going to play out. Instead, they should be patient and wait for the decline after the right peak to reach the neckline. Only then can they think of taking a position.
Reversed head and shoulders
Traders should also look for the reversed head and shoulders pattern, which plays out the same way a regular one does, but in the opposite direction. This pattern marks the end of the bear season.

Check out part 2 of our pattern trading guide, where we will cover various triangle formations as well as wedges.

Categories
Forex Videos

Develop An Unbeatable Forex Trading Strategy – Round 1

Develop An Unbeatable Forex Trading Strategy

Example 1: In this session, we are going to be discussing trading strategy as this is something that new traders find difficult to develop and implement without deviation.


Any forex strategy should be a systematic step-by-step procedure for how and when to use specific tools when a sequence of analysis needs to be developed.
Typical components of any strategy should include the following:


Example 2: The types of analysis tools we will be using. Whether it’s technical, fundamental, or both, it is something that will always be personal and based on your preferences. Now, although preferences are important specific analysis tools will have a generally higher success rate, and you should take some time to learn out of your comfort zone to improve on your weaknesses. You should have a clear order setup before you as to when and how you apply these analysis tools.


Example 3: next, you will want to have a clear picture of the timeframes, and trading windows will need to use. It’s no good trading an unsocial trading window that encroaches on your sleep and day-to-day responsibilities, and in addition, we want to use the same timeframe to implement our analysis tools while considering the type of trader we want to become. For instance, scalpers will rarely use the daily time frame because they are looking for quick in and out trades based on the technical analysis of the lower time frames.
For the longer time frame Traders, it would be beneficial to scan through the pairs that you are interested in trading in order to ascertain the key levels of support and resistance enable to drill down using your technical tools to look for potential trade entries and exits.
No matter what type of trader you want to be, it is important to consider fundamental factors which might impact on your trading, or assist your decision-making such as economic data releases, interest rate decisions, and key political events. In which case, you want to keep an eye on the economic calendar for the day or even week ahead.
We want to establish what high probability trades are available based on our technical and fundamental analysis. When developing a trading strategy, we need to implement all of these features and stick to them rigidly in order to achieve consistent trading profitability. Should any part of the strategy fail for any reason, we will need to make adjustments accordingly in order to make the trading strategy more fail-proof.


Example 4: What types of orders will you be using. If you are unable to be available during the times where you would normally need to trigger a buy or sell, you must make use of pending orders. If you’re trading news and have plenty of time on your hands, you may want to enable one-click trading to quickly enter the market based on data releases. This will all factor into your larger plan, and you should write down every detail. The purpose of strategy development is to increase your probability of success through research, development, and application, just as any other commercial business would go through in their model.


Example 5: We can’t talk about developing a successful strategy without looking at risk management in great detail. Risk management is the key most important aspect of a financial traders toolbox. Trying to determine what your risk appetite is while training can initially be very difficult.


Example 6: You need to consider your available balance, the pair being traded, pip worth, lot size, and other factors. You should never be trading with money you actually need because this will play with your emotions and put enormous psychological pressure on your trading, especially when things are not going your way.
Those who consistently make money in forex trading might not necessarily have more winning trades than losing trades. A part of being a consistently winning trader is knowing when to let the losing trades go and exit quickly, with as little loss as possible, while optimizing those winning trades and letting them run on as long as possible, through careful trade management, in order to maximize the amount of pips to be one. This comes down to the risk to reward ratio and to accept losses in accordance with your strategy. And as well as accepting your profits in accordance with your training strategy. Remember, we are looking for a consistent strategy without deviation. A common mistake of new traders is to quickly take profits and let losing trades run. As a consequence of this, they need to accept a higher risk to reward ratio than professional traders. Professional Traders will typically use a set percentage of risk on every single trade. The larger the accounts size, the smaller the percentage of risk should be. For example, you could have a trade with a risk to reward ratio of 1 to 3, where one equates to 3% of your bank. You could think to take that 3% and split it into three entries. Those three entries may have varying profit levels.


Example 7: Let’s look at the strategy checklist and add any of these components to your own strategy if you have not done so already. Be patient, test your strategy on a demo account over a period of 2 to 3-months and tweak and adjust as necessary because if it doesn’t work on a demo account, it certainly will not work on a real money account.
Successful Traders will look at the amount of money they can lose as well as the money they can make. Do not fall into the same trap as many Traders and simply bury your head in the sand when you are needed in a losing trade. Stop losses are the best way to implement against trades that run away from you. Having a frugal mindset will protect you against losses and bad decision making.
In every trade that you enter, you must have two things on your mind: at what point do you get out if it becomes a losing trade and at what point do you get out of a winning trade.
One thing is for sure when trading, there will be trades that you get stopped out of, and they then turn around and become what would have been winning trades, there will be trades that you will be stopped out of, and they will continue to have moved against you, and you will be grateful for your stop loss, and there will be trades that you get out of having taken your profit, only for them to continue on for hundreds of more pips. This is all a part of trading. It is all about sticking to

your methodology and trading strategy, making money consistently, looking for the next set up, and fighting on. Do not dwell on losses, do not dwell on what might have been, simply carry on with your strategy and remember the old adage: if it ain’t broke don’t try and fix it.

Categories
Crypto Videos

Master Trading Cryptocurrencies Using The RSI Indicator

Trading cryptocurrencies using RSI indicator

RSI, which is an acronym for the Relative Strength Index, is one of the most popular technical indicators used in the analysis of any financial markets. It is often used for cryptocurrency trading as well.

It was created in 1978 in John Welles Wilder’s book that carries the name “New concepts in technical trading systems.” Wilder was a former mechanical engineer who abandoned his job in order to focus on the financial markets.
He wanted to create indicators based on mathematical analysis by finding a simple yet effective tool to visually represent market movements. The RSI indicator is what came from his research, and this indicator is one of the most widely used indicators to date.

RSI indicator – explained

This indicator is based on quite a simple concept. The stronger the relative price, the greater the market’s upward closures compared to the market’s downward closures. The opposite is also true.

RSI is considered an oscillator that is used for measuring the speed as well as the direction of price movements. That’s why it is also a “momentum” indicator. Contrary to some other indicators, RSI manages to overcome the momentum-related problems that can occur when abrupt movements of the market cause a sudden reversal of the trend.
RSI uses a band of oscillation that ranges from 0 to 100. It also allows for visual comparison with predetermined constant levels. It is based on a simple mathematical formula that requires only one input parameter, which is the number of periods that we are taking into consideration.
In his book, Wilder recommended that 14 should be used to get the best results.
As with all the other oscillators, if a short time-period is used, the sensitivity of the oscillator might be too great, and traders may get false signals.

Using RSI in crypto trading

Trading cryptocurrencies using RSI is not much different than trading any other asset. When the price moves up quickly, the RSI indicator will enter the “overbought” area. The opposite is also true.
It is important to say that the longer the time frame used, the more accurate the data is. Bitcoin has almost never had a false signal on the higher time frames.
Wilder designed this indicator with the aim to spot reversals. RSI will show alert zones set at 70 for overbought and by the value 30 for oversold. However, it is not uncommon to see zones moved to values 80 and 20.
A cryptocurrency trader, this indicator should NOT be used by itself, but rather alongside using the knowledge of candlestick and pattern analysis as well as some other indicators.

Categories
Crypto Videos

Using Bollinger Bands To Capture Consistent Profits Part 2

Trading cryptocurrencies using Bollinger Bands (part 2/2)


The rules of Bollinger Bands

John Bollinger is still quite active in the financial space, while his bands have 30 years of market testing. The first thing that Bollinger makes clear is that both highs and lows are relative. While the upper band signifies highs as they relate to the standard deviation, the lower band does the opposite. The terms “high” and “low” have to be used in a relative sense. This relativity can be derived from a variety of different indicators.
Bollinger stressed that each indicator has to be viewed in isolation before trying to use it in conjunction with something. Momentum, volume, sentiment, as well as many more things can be derived from Bollinger bands; however, they might not necessarily relate to one another.
He once said: “For example, a momentum indicator might complement a volume indicator successfully, but two momentum indicators aren’t better than one.”

Bollinger bands have proven to be a successful indicator if employed in a wide range of financial settings since they are simple by nature. They are made for trading equities, indices, exchanges, commodities, as well as futures. Cryptocurrencies were not there when this indicator was made, but they fit the space between the gray areas of these financial tools.
Bollinger Bands and are also flexible with regard to the time period, as long as the period that is examined contains enough details to present a meaningful view of the market.

How to use Bollinger Bands

Cryptocurrency traders, as well as investors, can use Bollinger Bands in several different ways.
The first we have to look at is the volatility of a given coin we are trading. Bollinger bands compress when standard deviations are low, which is signaling us a period of low volatility. They tend to do the opposite when volatility increases.

While this can have several meanings depending on the coin we are trading. We can look at the volatility and try to pinpoint the possibility of a breakout.
Bollinger Bands capture somewhere around 90% of the price action in a given cryptocurrency. When the price movement dives above or below a set Bollinger Band, we have to pay attention. When the price moves above the band, the coin is likely overbought, and it is possible that it will correct shortly. If, on the other hand, a price moves below the lower Bollinger Band, the coin is possibly oversold.

Movements at the Bollinger Band boundaries (upper or lower) can also be used to determine short-term price direction. If the upper band is cracked, but the price corrects to a level just at or below the upper band afterward, it’s a sign that the prices are generally moving up. The opposite is also true.

Conclusion

Bollinger bands present an easy way to visualize the cryptocurrency market price movement. In simplest terms, it shows when it is a good idea to buy or sell an asset.
However, Bollinger Bands are simply one of the many tools in a trader’s toolkit, which means that the rules are not written in stone. To confirm their decisions based on Bollinger Bands, many traders are relying on volume indicators or oscillators such as RSI or MACD before entering a position. Independently confirming trends by using other tools rather than only using the Bollinger Band system is more reliable than using just Bollinger Bands to come to a certain conclusion

Categories
Forex Videos

How To Profit From Double Top Formations In Forex

How To Profit From Double Top Formations In Forex

In this presentation, we will be looking at the technical analysis chart pattern known as a double top. Being able to recognize this formation or pattern and the information it provides us with will help to trade more effectively.

Double top patterns one of the many pillars of technical trading structures and should be incorporated into your trading knowledge base. Double top identification and understanding can further enhance your technical analysis when trading the forex market,y helping us see more than just support and resistance levels.

Example A

So what exactly is a double top? It will include two high points within the market, which generally signify an impending bearish reversal. There will usually be a decline in price between two high points. After the first peak has formed, there will be a retracement to a certain degree, before another rally to the upside. The second peak usually forms at the same level or slightly below the first peak, although occasionally it might breach the level of the first peak before price action reverses.

Example B (OR EXAMPLE C)

Here we can see that after a rally to the upside to peak one, price action reverses to our line of support line, often called a neckline between the two peaks, before the second push higher to peak number 2, and where price action reverses from this area, suggesting unsustainable buying pressure and that we should expect a reversal. And where price action goes on to breach the previous level of support, with a strong bearish candlestick, this is confirmed as a double top formation. And where price action subsequently comes back after some brief consolidation, with mixed small shaped candlesticks suggesting a lack of direction and where the previous level of support becomes an area of resistance and hence the continuation downwards which adds to our belief and support for this technical setup.

Example D

On the flip side, we have the double

bottom formation. This setup is identical to the double top in its theory and execution of trading. However, it is simply in reverse, In which case the exact same rules apply, But it is simply the mirror image of the double top. In this case, we would expect a bullish signal once the neckline is broken.

Example E

So here, for example, we can see a push down in price action to our first bottom, before price reverses to the neckline, which acts as an area of resistance, and where price subsequently comes down again to our second bottom, and where price action again returns to the neckline and breaches it and where this prior area of resistance becomes an area of support, and where price action continues to the upside from.
So to sum up, we are looking for two peaks at a similar height and where price action reverses between them to a neckline or area of support, which subsequently becomes breached after reversing from the second peak.
Secondly, we should make sure that the peaks are not too small because we prefer them on larger time frames of 15 minutes or higher because that is where we would expect larger amounts of pips to be made from this successful trade setup. This type of setup should be used in conjunction with a stochastic or ma CD to support double top or double or bottom formation.

One of the biggest problems with technical trading is that sometimes these patterns appear obvious in hindsight and that quite often we will miss opportunities and of course this can be very frustrating when you are always missing the mark. These patterns appear on our chats and often can be difficult to decipher when the market is moving, and with the pressure of placing trades sometimes, we simply miss these setups. There are two ways of going about solving this problem, and both have their pros and cons. We can either anticipate the formation before it occurs or wait for confirmation to trade the potential reversal. This will always be down to your appetite for risk, your personality as a trader, and your competence at understanding the nature of the forex market. Reactive traders who are playing the safer game have the advantage of simply seeing the pattern occur and trading it accordingly with the downside to this, which is that part of the trade has already been missed. This can equate to larger potential stop losses and less pips being made as the move continues.

Traders who have gotten into the sell or buy during the second peak or bottom phase of the setup will enjoy the comfort of having tighter stop losses, which should be placed a few pips above or below the first peak or first bottom. And of course, they will be able to claim more pips.

As with anything in forex trading, these things are a matter of trial and error and consistency, and therefore practice and observation will pay dividends in the long run.

Categories
Forex Videos

Master The Forex Hedging Strategy With Head and Shoulders Formations!

Hedging Strategy With the Head and Shoulders Formation

In this video, we are going to show you how to use money using a hedging strategy, which is a continuation in the series. On this occasion, we are going to be looking at the head and shoulders formation and try to take advantage of a price action reversal with this shape.
The trade is constructed in two parts with the idea of hedging, which is to maximize the potential for trading opportunities in either direction of price action. However, initially, we want to set the trade up with our tried and tested technical analysis methodology, and in the event that for some reason price decides to go against the chart, we will have a second opportunity to catch the move in the opposite direction. And so we will have trade one, which goes with technical analysis and trade two, which acts as an insurance policy in the event things do not go to plan.

Example A


Example A is a very typical chart pattern that traders see on their screens on a daily basis. This is the formation of a head and shoulders, where initially we have price action rising, followed by the head and shoulders formation and then price reversal.

Example B

Let’s drill down a little further in example B. Here we can see that price extended higher from the left- hand side of the chart where we subsequently have a peak formation, or the left shoulder, followed by a slight pullback in price and then a continuation higher, which forms the head, before we see another pullback and then another move higher where the price action completes the formation of the head and shoulders shape.
We can also see the neckline, which acts as an area of support that is qualified by price action bouncing off it on at least two occasions. Traders will keep a close eye else for the neckline to be breached, which will offer a high probability of price action reversal to the downside.

Example C


In example c, we are going to set up our first trade. We are going to go short when price action moves under the neckline, and place a stop loss a couple of pips above the highest point of the head. Technical analysis offers a high probability that the price action will continue lower from this point with this particular formation. We should be looking for price action to come down to at least the previous low of the initial move higher on the left-hand side of the chart.

Example D

Example D is our secondary trade setup. The insurance policy if you will. Should our first trade fail, and we get stopped out, we will have already set in place a limit order to buy the pair at or slightly above the stop loss of trade one, in order to capture what will be a continuation in price action to the upside. We must place a stop loss a couple of pips below the neckline, and we should be looking for price action to continue upwards and, at the very least, cover the loss of our first trade. This can be done by carefully managing the position. This type of setup is better suited to time frames of 15 minutes or above because we are looking for trends, and this is where the larger amount of pips will be found.

Categories
Crypto Videos

Using Bollinger Bands To Capture Consistent Profits Part 1


Intro to using Bollinger Bands in cryptocurrencies (part 1/2)

The wild movements of a typical cryptocurrency price chart can definitely look bewildering at first glance. While it is easy to see the general direction of a trend for any given crypto, the confusion really sets in if you zoom in to a smaller time frame and take a look at all the peaks and troughs that actually make up that trend line.

Intro to Bollinger Bands


Simple moving averages are used to describe the average price of an asset over a period of time while using exponential moving averages will give more credence as well as arithmetic weight to newer prices. Both of them are intended to filter out the hourly and daily bumps that make up a price chart. They are also making trends as well as patterns more immediately obvious.

The system of using moving averages was further refined by a financial analyst as well as author John Bollinger in the 1980s. He introduced Bollinger Bands to the world. Bollinger bands are nothing more than a system of computing bands (high and low) above an asset’s moving average by using standard deviation.

Bollinger bands are also being used to examine exponential moving averages, unlike the Keltner channel’s examination of simple moving averages. The way Bollinger Bands are used provides the measurement tool with much more sensitivity to certain changes in the market.
Bollinger Bands and Crypto

When speaking about the notoriously volatile cryptocurrency market, Bollinger Bands are used quite a lot. They are mostly used in predicting possible breakouts as well as identifying key times to enter or exit the market. This use-case is particularly useful for day traders (rather than long-term investors), who often have to make quick and tough calls with incomplete information so they could retain their profits. If they make only one significant step in the wrong direction on just one cryptocurrency, they can eliminate days or even weeks of carefully harvested small gains.

More on how to use Bollinger Bands to improve your cryptocurrency technical analysis in part 2 of our guide.

Categories
Forex Videos

Master Forex Spreads Quickly To Increase Profits – Forex Tips & Tricks

Master Forex Spreads Quickly to Increase Profits

Today we are going to be looking at spreads in reference to the forex market and some of the points to remember when choosing a broker having carefully considered the trading spreads they offer and eventually helping you to decide which trades you make according to the tightest spreads available.

Example A


So, what is the spread? All foreign exchange currency trading is done in pairs are the prices for each pair and are quoted as currency exchange rates.

Example B

Prices are quoted in quote boxes similar to this one, where the relative value of one currency unit is termed in the units of the other currency in its pair. In this example, the British Pound is being quoted against the United States Dollar and is where each currency has a three-letter quote, so here it would be GBP USD.
To simplify this, the spread always reflects the price for buying the first currency of the pair, in this case, the Pound, with the second currency, in this case, the USD.

The exchange rate that is supplied to a trader willing to purchase a quote currency is called a BID, and it is the highest price that the currency pair could be bought at. The selling price of the quote currency is called the ASK, and it is the lowest price that a currency pair will be allowed for sale. The difference between the Ask and the Bid is termed as spread. Essentially, the reason for the existence of the spread is so that brokers can take a cut. It can be applied instead of charging fees on your close trade positions, although some brokers may charge a small commission separately after the trade is closed.

Spreads are typically measured in pips and measured using the fourth decimal place in a currency quotation. There different types of spreads available in forex trading with different brokers provide let’s take a look at these two examples to May better understand your options.

Example C

When choosing a broker, you will want to consider the types of spreads they offer typically. This will be a fixed spread, or it might be a variable spread. With the fixed spread, the difference between the Ask and the bid price remains constant during normal periods of activity in the trading day. This can, however, widen slightly at times of extreme volatility. Fixed spreads are phenomenal in terms of knowing where you are at all times. With this option, you can determine your costs before entering your trade. Therefore it allows you to have better foresight in terms of your finances. This type of spread is preferred by professional traders because it means that brokers cannot manipulate the spread in their own favor throughout the trading day.

Next, we have variable spreads. This type of spread does not remain constant. Spreads fluctuate in line with market conditions during the day and especially during high levels of volatility and are also affected by liquidity in the market. The benefit of having variable spreads is that sometimes the spreads can be much tighter than fixed spreads and are better suited to frequent traders, for example, scalpers and intraday traders.

Some brokers will offer kept variable spreads, and these can often be considered to be the best of both options depending on how high the cap is.

Categories
Crypto Videos

CNBC Is Always Wrong About Crypto – The Laughing Stock That Became A Indicator For Winning Trades!

Is CNBC always wrong about crypto? The CNBC reverse indicator!

Media has been covering cryptocurrencies in-depth for a couple of years now, with many crypto analysts, enthusiasts, and non-believers appearing on air. However, one channel stands out if we talk about cryptocurrency analysis and reports, and that is CNBC.

Bears, bulls, and CNBC

Jacob Canfield, a cryptocurrency analyst, and trader, noted how various tweets that CNBC posted and that is about Bitcoin going up or down coincided with exactly the opposite price movement. He posted his research in a submission on a popular website TradingView.

Canfield said that “Almost every single CNBC bullish tweet we’ve seen has been at the top of almost every single rally, giving traders a very strong sell signal. On the other hand, with every bearish tweet CBNC posts, it has been a clear tell of a short reversal as well as the end of a rally”.
As previously mentioned, CNBC is one of the most vocal mainstream outlets regarding Bitcoin and cryptocurrency in general, featuring daily price movement coverage as well as events regarding crypto. It has dedicated hosts that include the investment manager Brian Kelly.

CNBC reverse indicator

Based on the history of the posts, Canfield says, CNBC can be used as a reverse indicator. When used in such a manner, it had around 95 percent accuracy at the time the research was posted.
Canfield continued his analysis by saying: “With every bearish tweet CNBC posts, we typically see a 30% return on average.” If we pair this indicator with a few more indicators, we can create a pretty good strategy that covers price action, volume as well as market sentiment.
Based on this 30% average return expectation, the CNBC reverse indicator is an amazing indicator to use when gauging market sentiment and when to think about long or short positions. This indicator held up well over time as the CNBC news is showing almost the same levels of inaccuracy as they showed at the time of posting this analysis.

Following the post, the CNBC television reportedly contacted Jacob Canfield and invited him to be a guest at one of its crypto-related news segments.

Categories
Crypto Videos

Crazy Crypto Profits Using The Ichimoku Cloud Indicator – part 2

Trading crypto using Ichimoku Cloud – part 2/2

Market structures that suit the Ichimoku Cloud

Ichimoku Cloud is mostly useful in trending markets. It won’t perform well or produce much relevant info in ranging markets. When the market is ranging, the cloud will constantly be swapping between red and green, yielding very little valuable information. The same will happen on short time frames, which is why Ichimoku Cloud shouldn’t be used on these.
Ichimoku cloud strategies that involve other indicators.

There quite a lot of trading strategies that involve Ichimoku Cloud. However, the important thing to understand is that, even in trending crypto markets, Ichimoku Cloud is almost never used alone. Typically, traders will combine it with other indicators.
Indicators that pair well with the Ichimoku Cloud should provide some way of identifying support-resistance levels based on the asset volume. Using a volume-based indicator alongside Ichimoku is beneficial because the cloud takes price action cycles into consideration while disregarding volume completely.
Popular indicators to use with Ichimoku in cryptocurrency trading
Volume
StochRSI, MACD or any other momentum oscillators
Fibonacci retracements
Bollinger Bands

Ichimoku Cloud cryptocurrency settings


Many people ask if they should use alternative settings for Ichimoku Cloud for trading cryptocurrency markets.

Ichimoku Cloud works with timely moving averages, so with crypto trading, it follows reason to set timespans considering the fact that cryptocurrencies are being traded 24/7/365.
While the traditional Ichimoku cloud settings are (9, 26, 52, 26):
9 would represent a week and a half of regular trading
26 is the number of trading days in a typical month (30 minus 4 Sundays)
52 represents two months of trading days
Traders should create a special Ichimoku Cloud setting for cryptocurrencies as the market is open 24/7 (20, 30, 120, 60):
7+3.5 = 10 (due to the low volume on Sunday), or double that for longer-term trend capture
30 days in a month rather than 26
2 trading months in crypto are 60 days instead of 52 days

However, some traders reject this special Ichimoku Cloud crypto setting. Their reasoning behind that is that the cloud period lengths are meant to capture a certain time period and that it doesn’t matter whether it represents a week. This opinion is less popular as it seems a bit ignorant to disregard the day of the week movements and how certain days influence the market.

Categories
Forex Videos

Crazy Crypto Profits Using The Ichimoku Cloud Indicator – part 1


Trading crypto using Ichimoku Cloud – part 1/2


Ichimoku Kinko Hyo is a well-known indicator that seems complex to many traders but actually isn’t. Once you know how it works, it makes your crypto-trading decisions easier and faster. Mastering Ichimoku Cloud trading will really bring you one step closer to the main goal of trading, which is making high-probability decisions in a relatively short time span.
Ichimoku Cloud indicator – definition
Ichimoku Kinko Hyo is translated as the “one look equilibrium chart.” It was created with a specific purpose, which is to enable quicker decision making in trading. Ichimoku Cloud is one of the main indicators offered at websites such as TradingView.

Ichimoku Cloud lines – explained

The Senkou and Kumo
“Senkou span” represents the borders of the filled cloud, which is known as the “Kumo cloud.” This span is filled with green color when the market is bullish, while it is red in bearish markets.

Senkou lines represent major support/resistance areas, and they attract the price. Using these lines, traders set their entries, exits, and stops. However, they are mostly used as additional information alongside some other indicators.

The TK lines and Cross
The Ichimoku Cloud also consists of the Tenken and Kinjun lines, or “TK lines.” These are the balance lines, basically fast and slow MA’s.
As they are moving averages, traders will look for crosses when they search for trend reversals. Because of the names of these lines, the Cross is called “TK cross.” However, TK lines are also important, even when there is no cross in sight. They can signal that the price of a cryptocurrency is neither overpriced nor underpriced if the price sticks around them. On the other hand, if the price action happens very far from the TK lines, it shows that the price is way out of balance and that a pullback is likely. It is important to note that this indicator by itself is not a trigger to open positions expecting a pullback.

The Chinkou

The “Chinkou” span is an indicator that is a lagging one. It is used to confirm trend strength. When the Chinkou line is above the candles, it means that the market is strong. On the other hand, if the Chinkou crosses below candles, it’s a bearish market.

When there is strong action while the lagging line crosses the candles, the trend is slowly weakening and becoming undecided. This tells traders to look for a reversal.

Reading Ichimoku Cloud


Ichimoku cloud Bullish signals

In order to have a strong bullish signal, everything in this indicator must occur above the Kumo cloud, namely:

The price action has to remain above the Kumo cloud.

The Chinkou line has to stay above the Kumo
Tenken has to cross Kinjun above the Kumo – if this Cross occurs inside the Kumo, that’s only slightly bullish.

Ichimoku cloud Bearish signals

In order to have a strong bearish signal, simply reverse everything said about the bullish signals:
The price action occurs below Kumo
Tenken and Kinjun have to be crossing
The Chinoku line has to stay below the Kumo.
If none of these is happening yet, it most likely means that the market is undecided, sideways, or waiting for direction.

Check out part 2 of Trading Cryptocurrencies using the Ichimoku Cloud to learn about cryptocurrency setups using this indicator as well as to learn the popular indicators that get along with Ichimoku well.

Categories
Crypto Videos

The Fear & Greed Index Indicator! The Best Way To Identify Crypto Market Reversals part 2!

Trade cryptocurrencies using Fear and Greed Index – part 2/2

How to use the Fear and Greed Index to predict market reversals!

The Fear and Greed Index tends to reverse when it approaches “Extreme Fear” territory, while it is a bit less reliable when it approaches “Extreme Greed”. The “Extreme Fear” is the moment when fear transitions into very early and slight signs of greed. At that point, it reverses to the upside directly into greed territory, as opportunists start putting their money into the market.
If people feel greedier towards Bitcoin reversals when the market sentiment is at extremely fearful levels, will Bitcoin’s price follow to the upside?

The reversal points have plotted analogously to the BTC/USD’s price chart on the Fear & Greed Index.

Extreme Fear” levels on the Fear and Greed Index have always resulted in upswings and bullish reversals in Bitcoin’s price. Every time the Fear and Greed Index reached near-extreme levels of fear, a price reversal in Bitcoin’s price came. Extreme fear towards Bitcoin (and most top cryptos) has historically translated into a financial opportunity for the ones that decide to invest.

One big reversal was the mid-December of 2018 when the fear was extreme. At that point, Bitcoin bottomed at $3,200 before starting its new upswing.

Conclusion

The Fear and Greed Index is a great indicator to use when predicting when a bottom has formed on the Bitcoin chart. It surely is a great additional indicator that can show where and when a rally could approximately occur.
Although it won’t tell us exactly at which specific price point a reversal will happen, the Fear and Greed Index is certainly a valuable tool when it comes to timing a shift in market sentiment.
If history is a good teacher (and history does repeat itself), it is likely that people’s feelings towards Bitcoin are shifting dramatically sooner rather than later.

Categories
Forex Videos

Forex Scalping The 5 Minute Time Frame Like A Pro! Easy Money!

Scalping with the 5-minute time frame!

The methodology in this presentation is to use the 5-minute time frame on the EURUSD and the GBPUSD pairs during lulls in the market. Such lulls or quiet periods tend to occur after the American session and just before the Asians come to market. During the Asian market session traders typically tend to focus on domestic currencies that affect their own countries’ GDP, such as the yen and Australian and New Zealand Dollar. Therefore if the timing is correct, opportunities will present themselves to scalp or look for trades with expectations of only making or losing a few pips at a time in this type of scenario. Should trace spill over into the Asian session, financial institutions will be taking positions with our peers, and volatility will increase, but our technical analysis set up and tight stops should protect us from heavy losses.
And although present market conditions are extremely volatile due to the coronavirus, eventually, the markets will calm down, and opportunities will present themselves to try and make money in calmer markets with this methodology.

The first part of our setup is to observe periods in trading that have not been volatile in the run-up to the closing of the American session. We are looking for periods of consolidation and sideways trading in our two pairs, which should spill over into the Twilight Zone between the American session closing and the Asian session opening.
We want to keep our chart set up to a minimum with as little indicators as possible because they tend to be quite laggy on the 5-minute chart. Price action and Bollinger bands are the key behind this setup.

Example A


Example A shows the GBPUSD pair on a five-minute chart, and the period between our two vertical lines shows the time zone we are targeting specifically, and please note some brokers use different times on their charts, such as ours, which is two hours ahead of UK time.
First of all, we can see that price action has been very muted in the run-up to the time we are focused on, and should this be the case, there is no reason why you should not enter this trading methodology sooner, should you wish.

Example B


In example B, we have added the Bollinger bands with a period of 13 and deviation set at the standards default of 2.0.
The most critical parts of this setup is that the Bands must be moving sideways.

Example C


In example C, we can see that price action spikes outside of the Bands at position A, where we have gone short and placed a tight stop loss a couple of pips above the previous high as denoted by our Horizontal line. And when price touches the bottom of the Bollinger band, we need to exit the trade. If price begins to move higher inside the band, which it does at position C, we would enter a buy trade with a target of the upper band and with a stop loss a couple of pips below any low in this consolidation period. In which case, our exit would be at position D.
There are conservatively 15 pips within our highlighted period and a total of over 50 pips within this consolidation period, as presented on the chart as price tops and bottoms from the tops to the bottoms and back of the bands. Tight stops keep losses to a minimum with this setup.

Categories
Crypto Videos

The Fear & Greed Index Indicator! The Best Way To Identify Crypto Market Reversals?

Trade cryptocurrencies using Fear and Greed Index – part 1/2


It’s a well-known fact that emotions move markets. Greed drives prices up, while fear drives them down. Human psychology always ends up being predictably irrational because a lot of people tend to react very similarly in certain situations.

If people behave almost the same way in certain situations, it is possible to make money trading by just being a contrarian. As an example, Baron Rothschild made his fortune by buying when others panic-sold. His philosophy was relying on “Buying when there’s blood in the streets.”
John Templeton once said to “Invest at the point of maximum pessimism.”
This rings true simply because – the greater the fear — the larger the opportunity for profit.

The Fear and Greed Index

If we conclude that a trader can be profitable by acting contrary to how others are acting, then it is important to pinpoint moments of fear as well as moments of greed.

This strategy is quite simple:
If others are greedy – be fearful.
If others are fearful – be greedy.
One well-known tool that measures cryptocurrency market sentiment is the Fear and Greed Index.

The Fear and Greed Index measures cryptocurrency market sentiment by aggregating data from various sources and generating them into one number, which is on a scale of 0 to 100. A value of 0 is known as “Extreme Fear,” while the opposite (a value of 100) represents “Extreme Greed.”

The data that the index uses is compiled daily. You can also glean the data of the Fear and Greed Index on a daily, weekly, monthly, as well as yearly basis.


Tendencies that show in the Fear & Greed Index

Extreme fear is a place where the first signs of greed are created. As we can see from the graph above, fear can quickly spiral out of control. However, every time the Fear and Greed Index is close to or below the 10 mark, the value of the index quickly reverses to the upside.
This brings us to the conclusion that every time high levels of fear dwells in the minds of traders and investors, opportunists use this market climate to their advantage. Following the ways of savvy investors such as Warren Buffet, Baron Rothschild, or John Templeton, these “bargain hunters” get greedy when others were fearful.
However, just like fear can quickly gain momentum, so can greed. And since emotions move markets, extreme fear drives prices down, while greed drives them up.

Check out part 2 of our Fear and Greed Index guide to learn more about how to use this tool to predict market movement.

Categories
Forex Videos

Forex Hedging Using The Elliot Wave Setup – How To Win Trades Whatever The Outcome!

Hedging using the Elliot Wave setup

Continuing with our hedging strategy series. Today we are going to look at setting up two trades. One Which involves using the Elliott wave Theory of technical analysis, and should this prove ineffective, we will also be setting up a secondary hedging, or insurance based trade, in the event that our first trade does not go according to technical analysis.

While hedging comes in many forms and strategies, the methodology behind this type of hedging is that we want to carefully set up a trade based on tried-and-tested technical analysis, and where, in this particular case, price action may be set for a sharp reversal, but turns unexpectedly, in which case we will be able to catch the move in the opposite direction. In which case theoretically we win no matter which way price moves. Therefore this strategy works best when markets have consolidated or reached highs or lows, which seem right for reversal or continuation in price action but where the consolidation squeeze should cause a burst in volume in either direction.

Example A


Example A, Let’s quickly remind ourselves of the theory of the Elliott Wave, which consists of an impulse wave that is usually composed of 5 sub-waves that move in the same direction followed by a corrective wave composed of three subways that move against the previous trend.

Example B


Example B, Here we can see the Elliot wave in action. After a consolidation period, we can see the Elliott wave as denoted by 1 2 3 4 5 6 pattern, with higher highs and higher lows and where we would expect price action to begin to fade with our three-part full pull back as denoted by the A B C technical pattern we have drawn as an estimation onto our chart.
Therefore, if the Elliot Wave theory holds true in this case at position A, we would see a decent in price action in line with our A B C expectation, and if not, we would expect a price action continuation up to position 7 in continuation of the original upward trend.

Example D


Example D, This is the first part of our hedging strategy in which case we are going to go shorts at position A, which represents her 50% pullback between position 6 and 5, and at which point should be the beginning of the three-wave counter move in the opposite direction of the trend upwards should the Elliott wave Theory hold at this point we will capture some decent down movement, especially if this setup is used on a 15 in 30 or 60 minutes chart.
We must set our stop loss at a couple of pips above position 5, which would mean that the Elliott wave theory has not held out on this occasion, and that price could be set in a continuation upwards of the original trend. However, should position 5 on your chart be a round number and what is also called a big figure number such as 1.3400 which you might see in the USDCAD pair, or 1.300 in the EURUSD pair at the time of writing, then price action might find this as a level of resistance and fall anyway. But as the theory would be negated, we would suggest you consider this and think about exiting the trade and waiting for another Elliot Wave set up. In either case, stop losses should not be more than 20-30 pips.

Example E


Example E is our hedging strategy. In the events that the Elliott wave fails and price action continuous, we must set a buy limit order a couple of pips above the previous trade’s stop loss in order to capture the move from position 6 to position 7 and beyond. If possible, we should monitor this move closely, because as an insurance policy, we need to at the very least make the same amount of pips.i.e. 20 to 30 that we lost in the first trade.

Categories
Forex Videos

Forex Limit Order Hedging Strategy – Making Cash Hand Over Pip


Limit Order Hedging strategy

This video continues in the series showing you how you can make money by using hedging strategies to take advantage of breakouts and reversals in the market, no matter what direction. And while there are many different styles of hedging strategies, in this series, we are focussing on a simple way to maximize opportunities while increasing the chance of profitability, no matter which way the market moves and if used correctly, you will be able to utilize this in your own methodology.
While the following is risky – just like all trading, we will show you how to keep setups tight, while implementing clear and precise technical analysis that professional traders use every day in the Forex market. This strategy consists of two parts, the initial trade, and a backup trade. We have eyed an opportunity with multi-month lows for the EURCHF pair.

Example A

Example A is a monthly chart of the EURCHF pair, and we can see that the Euro is falling heavily against the Swiss franc. This is due to the flight to safety, whereby the Swiss franc is seen as a safe-haven currency during the Coronavirus pandemic.

However, the Swiss National Bank will be very unhappy about their currency being so strong and are threatening to intervene in the money markets to correct this. We can also see from this chart that we are approaching lows that have not been visited for five years. Therefore with the threat looming of the Swiss National Bank intervention, and previous reversals from these levels, we can hypothesize that although the continuing risks of the virus are still prevalent, there could be an argument for imminent price action reversal, particularly because of the current strength of the Euro and where the EURUSD is currently riding high around the 1.13 level.

Example B


Let’s take another look at this chart as in example B. While we may see some further downside in the EURCHF pair, our particular area of focus will be on the key 1.03 level. Previously price action found support at this level for several months. We are going to look at putting in a buy limit at the 1.03 level, with a tight stop loss, which, if triggered, we will also implement an immediate sell limit order to target the 1.00 key psychological trading level, which is parity.

Example C


Example C is a one-hour chart of the EURCHF pair, and our setup for the first part of this trade. We have placed a buy limit at the key 1.03 level with a tight stop loss at the 1.0270 level and a profit target of the current trading range around the 1.0550 level.

Example D


Example D, Now let’s look at our backup or insurance trade in the event that price continues to fall in the pair. We want to to set up a sell limit order at the 1.0270 level which is our previous stop-loss, and this time we need a slightly wider stop loss on this new trade at 1.0310, in case the key 1.03 level is initially targeted from our entry, and where we believe it might possibly become an area of resistance before price action reverses again and where will be looking at a target of 1.000 or parity in the pair.
On the second trade, we should be looking to implement a protective profit stop at around 1.0240 level in order to, at the very least, cover the loss from our first trade.

Categories
Crypto Videos

Crypto Lending The Superior Way Of HODLing Part 4 OF 5


Crypto Lending – Stay away from these platforms (part 4/5)


Not all crypto lending platforms are created equal. While it may be nice to earn interest on your cryptocurrency holdings, it’s not that nice to lose them or get them stolen somehow. While most people invest in cryptocurrencies to earn a profit, not many pay enough attention to the security of their holdings.

This part of the Crypto Lending guide will show two lending platforms that people should consider avoiding. This, of course, does not mean they are unusable. However, these lending platforms have critical flaws that might impact your holdings in a bad way.

XCOINS is a company founded in August 2018 by Sergey Nikitin. Nikitin decided to leverage PayPal and make this operation work. XCOINS lenders allow people to borrow their BTC funds; in return, they get monthly PayPal payments at various predetermined interest levels.
The main problem here is that XCOINS uses PayPal. This makes a lot of room for scams due to how PayPal operates in this domain. Someone can use XCOINS to borrow your BTC, go to PayPal and claim they never got it, and then file a payment reversal with PayPal, which will almost guarantee their funds back.
XCOINS explicitly announced that, in this case, there is no help or support whatsoever from XCOINS. Solely for this reason, XCOINS is a walking red flag when it comes to lending. On top of that, the platform is not exactly the best when it comes to good interest rates on crypto lending.

Salt lending platform made the news for being the first and only crypto lending site of that time. The company was founded in March 2016 by Shawn Owen. It quickly gained much popularity through its ICO. However, while their ICO promised many things (such as loans in many US states where there is no legal ability for SALT to provide such services), they never came through.
Ever since the public saw that many promises did not come to fruition, the project started experiencing more and more speed bumps. They have been under investigation by the US SEC for not declaring their ICO as security. This is not only a problem for the owners, as it can lead to the freezing all of their users’ assets. While they are working on this, the SEC pointed out to many red flags. On top of that, the founder and CEO Shawn Owens has stepped down from his position.
If we compound all this information, we can clearly see that SALT is currently far off from being a safe lending platform.

Check out the fifth (and last) part of our Cryptocurrency Lending series, where we will talk about various scams as well as about what cryptocurrency lending platforms could bring us in the future.

Categories
Forex Videos

Master Forex – Hedging Strategy Using Buy & Sell Limit Orders

Hedging strategy using buy and sell limit orders

This video is a follow on from Hedging – Making money no matter which way the market moves and Hedging Strategy Via The Ascending Pennant Chart Pattern.

The idea in this series is to incorporate a secondary backup, or insurance policy type trade, in order to maximize the possibilities of breakouts from well-known, tried, and trusted chart patterns that professional traders use. And these setups are better suited to the 15-minute, 30-minute, and 1-hour time frames, where you might expect a larger amount of pips to be made in a trending, or reversing market.

Example A


Example A is a 1-hour chart of the GBPUSD pair, but this set up works with any forex pair.

Example B


Example B shows that after an initial push higher, price action consolidates in a sideways move and this consolidation is confirmed by at least two attempts to push higher than a horizontal line of exchange rate where price action is rejected and which acts as a line of resistance and at least two pushes lower on a separate horizontal line of the exchange rate which was met with a line of support.
While this see-sawing between the resistance and support levels may continue for some time, one thing is for sure, that eventually, price action will either break to downside or break to the upside.

Example C


Now let’s look at Example C. This is where we will set up our first limit order. Firstly, price action appears to be fading to our support line, as defined by the green line. This fading of price action means that we are more likely, at this point, to see a breach of our support line and a continuation in price action in a downwards direction.
Therefore we have placed a sell limit order a couple of pips below the support line with a stop loss a couple of pips above the resistance line.

Example D


Now we must turn to example D, which is our secondary backup buy limit order, which we believe would be a good insurance policy should price action break the resistance line and move in an upward direction.
In this situation, we simply set our buy limit order a couple of pips above the line of resistance with a stop loss a couple of pips below the area of support.

The idea regarding our hedging strategy is to prime everything in readiness for where we believe the price action will go due to our technical analysis and also to set up a secondary trade in the reverse direction as a backup or insurance policy in case price action reverses in the opposite to the direction where we believe price action will go.
Obviously, it is possible that both trades could be executed and therefore we would advise that you keep an eye on the trade and should both trades be executed and where one triggers a stop loss, the profit target from the secondary trade should be at the very least the amount that was stopped out on the first trade, in order not to adversely affect your profit and loss.

Categories
Forex Videos

Forex Hedging Strategy – The Ascending Pennant Chart Pattern

Hedging Strategy Via The Ascending Pennant Chart Pattern

Today’s video is a follow on from our: Hedging – Making money no matter which way the market moves. So be sure and check that out if you missed it. The theory in this series is that we are looking to maximize successful trading opportunities from areas in price action that are likely to accelerate in either direction. And by covering both eventualities, we create a situation where we can capture the breakout in either direction, even if our initial trade goes against us.

There are various types of hedging, such as selling equities in favor of buying gold or buying one currency pair while simultaneously hedging the position by selling another pair, which might be seen as acting in confluence, in order to spread the risk.
But this is a different style of hedging, where we essentially set up two trades in the opposite direction, while incorporating tight stop losses and where trade one is based on a high probability of a correct move based on our technical analysis and where trade 2 acts as a backup trade, or insurance policy if the market reverses against our technical setup, which, unfortunately, can happen.

Example A


Let’s look at example A. This is the basic pattern you would expect to see on an ascending pennant pattern.

Example B


Now let’s take a look at this setup in a little more detail in example B. Initially we can see that there has been a period of consolidation, where price action is conforming to an area of support and resistance at positions A and B, and where price action remains above a key moving average, which is gradually moving higher, in line with price action, which eventually breaches the area of resistance at position A and a short while after finds support at that level, before continuing higher.
At the top of our charts, at position D, we have a wedge shape formation, which confirms our bullish Pennant chart pattern. Price action has consolidated within the wedge and is beginning to break out from it in an upward direction. From this setup, we would have very good technical grounds to believe that the buyers have got hold of this pair at the current time and that break from price consolidation within the D shaped wedge is likely to be higher, in continuation of the overall trend.
Had you not already been buying into the trend, this is the point at which you might want to seriously consider buying the potential continuation.

Example C


In Example C, we are going to implement our hedging strategy with an immediate buy order at position 1, and a stop loss at position 2.

Example D


In example D, we are going to set up our backup trade in the event that our first trade reverses.
First of all, we are going to put a sell limit order just below the stop loss of our first trade at position 3, and we will place a stop loss for this second backup trade just above our entry of the first trade at position 4. We need to place a take profit at around the area or position 5, which would be equal to at least the amount that we lost in our first trade in order to rebalance our profit and loss. In this a hedging strategy, we have covered all the bases regarding strict observation of technical analysis, and we have carefully placed our orders in order to capture the breakout from this ascending

pennant set up. We have also carefully mitigated against the risk of a price reversal by incorporating a backup trade.

Categories
Crypto Videos

Crypto Lending The Superior Way Of HODLing Part 2 OF 5

Crypto Lending – Where to lend your crypto? (part 2/5)


This part of the Crypto Lending guide will cover Nexo and BlockFi, two of the three platforms that we will show as good examples of how a lending platform should operate.

Nexo is a company founded in 2017 and is backed by Michael Arrington, the founder of TechCrunch. It has nearly 200,000 customers and even got covered by Forbes. The platform has back payments in 45 Fiat currencies.
Nexo Wallets are provided by BitGo. Therefore, users who borrow or lend Bitcoin or any other cryptocurrency are insured for up to $100,000,000.00. The insurance is backed by Lloyd’s bank. This amount is, however, for the total company in case it gets hacked or goes bankrupt. NEX allows its lenders to have their earnings deposited every single day, rather than having to wait for a week, month or more. They have an interest rate of 8%, with the option to withdraw anytime.

When it comes to user experience, they are top-notch. On top of that, this company constantly strives to get better and makes new beneficial partnerships quite often. When it comes to cons, there aren’t many. However, one comes to mind. Even though borrowers can withdraw in any of the supported 45+ fiat currencies, lenders are allowed to deposit only stablecoins and fiat currencies. Nexo is currently working on supporting BTC and ETH deposits, but they didn’t make any projection regarding the time of realization of this project.

BlockFi is a company founded by Zac Prince and Flori Marquez. It has raised over $20 million of capital from various firms. The company is young and growing at a fast pace. The company offers a 6.2% interest rate on BTC lending and 3.3% on ETH lending, compounded. Granted, this rate is only for deposits under 10 BTC and 100 ETH. The rates for larger amounts of crypto drop severely. When it comes to borrowers, they get a 4.5% interest rate by using the platform.

There is no minimum deposit, and all your crypto holdings are stored with Gemini. Gemini acts as a 3rd party depository trust that is a licensed custodian with insurance. It has a perfect track record when it comes to preventing hacks and fund losses.

When it comes to cons, there are a couple we can think of. The first one only applies to people that want to lend larger amounts of crypto. BlockFi offers digressive interest rates, meaning that the rates decrease to 2.2% and 0.2% for deposits larger than 10 BTC and 100 ETH. BlockFi also offers fewer choices of cryptocurrencies people can earn interest on as it supports only BTC, ETH, and GUSD. The last con would be that the platform is not FDIC insured (though Gemini – which protects BlockFi user’s assets – has a strong track record for security).

Check out part 3 of our Cryptocurrency Lending series, where we will cover Celsius Network as the third good option for crypto lending.