Order Types
The pre-internet era for the institutional foreign exchange currency market was fairly limited by today’s standards for institutions who wanted to buy and sell currencies.
https://youtu.be/g9XBIBW31kU
Order Types
The pre-internet era for the institutional foreign exchange currency market was fairly limited by today’s standards for institutions who wanted to buy and sell currencies.
Order Types
The pre-internet era for the institutional foreign exchange currency market was fairly limited by today’s standards for institutions who wanted to buy and sell currencies. Back then, the market was known as the Spot Forex market. This is because most trades were done on the spot. A bank would call a broking house, or another institution directly and ask for an exchange rate on a currency pair in a given amount. If the price was right, the trader would hit the bid or the offer by saying, Mine, or Yours. The trade was done instantly, or on the spot. A fairly average trade size would be $1 – $10 million per ticket, a sizable amount.
So banks in the institutional Forex market would typically use money broking firms who would supply them with various exchange rates pertaining to the currency pairs the bank was interested in trading. This is where the bulk of the liquidity was, because it was quicker for a trader at a bank to call a broker, who in turn would be simultaneously taking orders from over 100 other banks in the major trading hubs, such as the city of London, for example.
Banks would have direct lines to the brokers and often had squawk boxes on both sides for quick contact. It was much less time consuming for a bank to speak to one or two brokers than it was to call around all of the other banks one by one.
However, in the late 1980s, banks decided to try and do away with broking firms due to the high amounts of commissions the brokers were charging, and with the advent of increasing technology, the first screen-based ordering FX systems hit the market.
Now, rather than the bank calling brokers, or other banks directly, they would simply place their orders onto a computer-based trading platform, where a growing number of other institutions would also place their bids and offers until trades were executed automatically by the trading platform which price matched the orders.
This was the advent of pending orders in the Forex trading arena. Thanks to this evolutionary period, retail forex traders are now able to enjoy various types of trading orders for their convenience, including the provision of capital protection orders, known as a stop loss, and orders to enter the market at a future exchange rate, which might be above or below the current one.
And so traders can use a market execution order, which is the same as the on the spot order, or right now, where a trade is executed instantly by accepting the bid or offer on a current exchange rate, as seen on a trading terminal. In this example, traders accept the best available price at the time of execution. Obviously, for this type of order, the trader needs to have instant access to his or her trading platform terminal, which is not always convenient in a 24 hour a day, five days per week market.
Traders are also able to place a stop-loss order on their trades, which will guarantee that should the exchange rate move against them to a chosen level of acceptable loss, then the trade will
automatically be stopped at the chosen exchange rate. This might be slightly greater due to price action slippage in volatile market conditions.
Traders are also able to take profit orders: this is known as a pending order and is placed onto the trading terminal and is designed to automatically close out the trade and thus bank the profit from winning trades, and this must also be set at a pre-determined exchange rate. This is extremely useful for traders who may not have the ability to be sat at their trading terminal, perhaps due to other commitments, or during overnight trading sessions. This facility can be used to close out the entire trade, or in increments. Pending orders are extremely convenient and allow traders to enter a trade, either long or short, at a future exchange rate, which would be above or below the current available exchange rate.
Example A
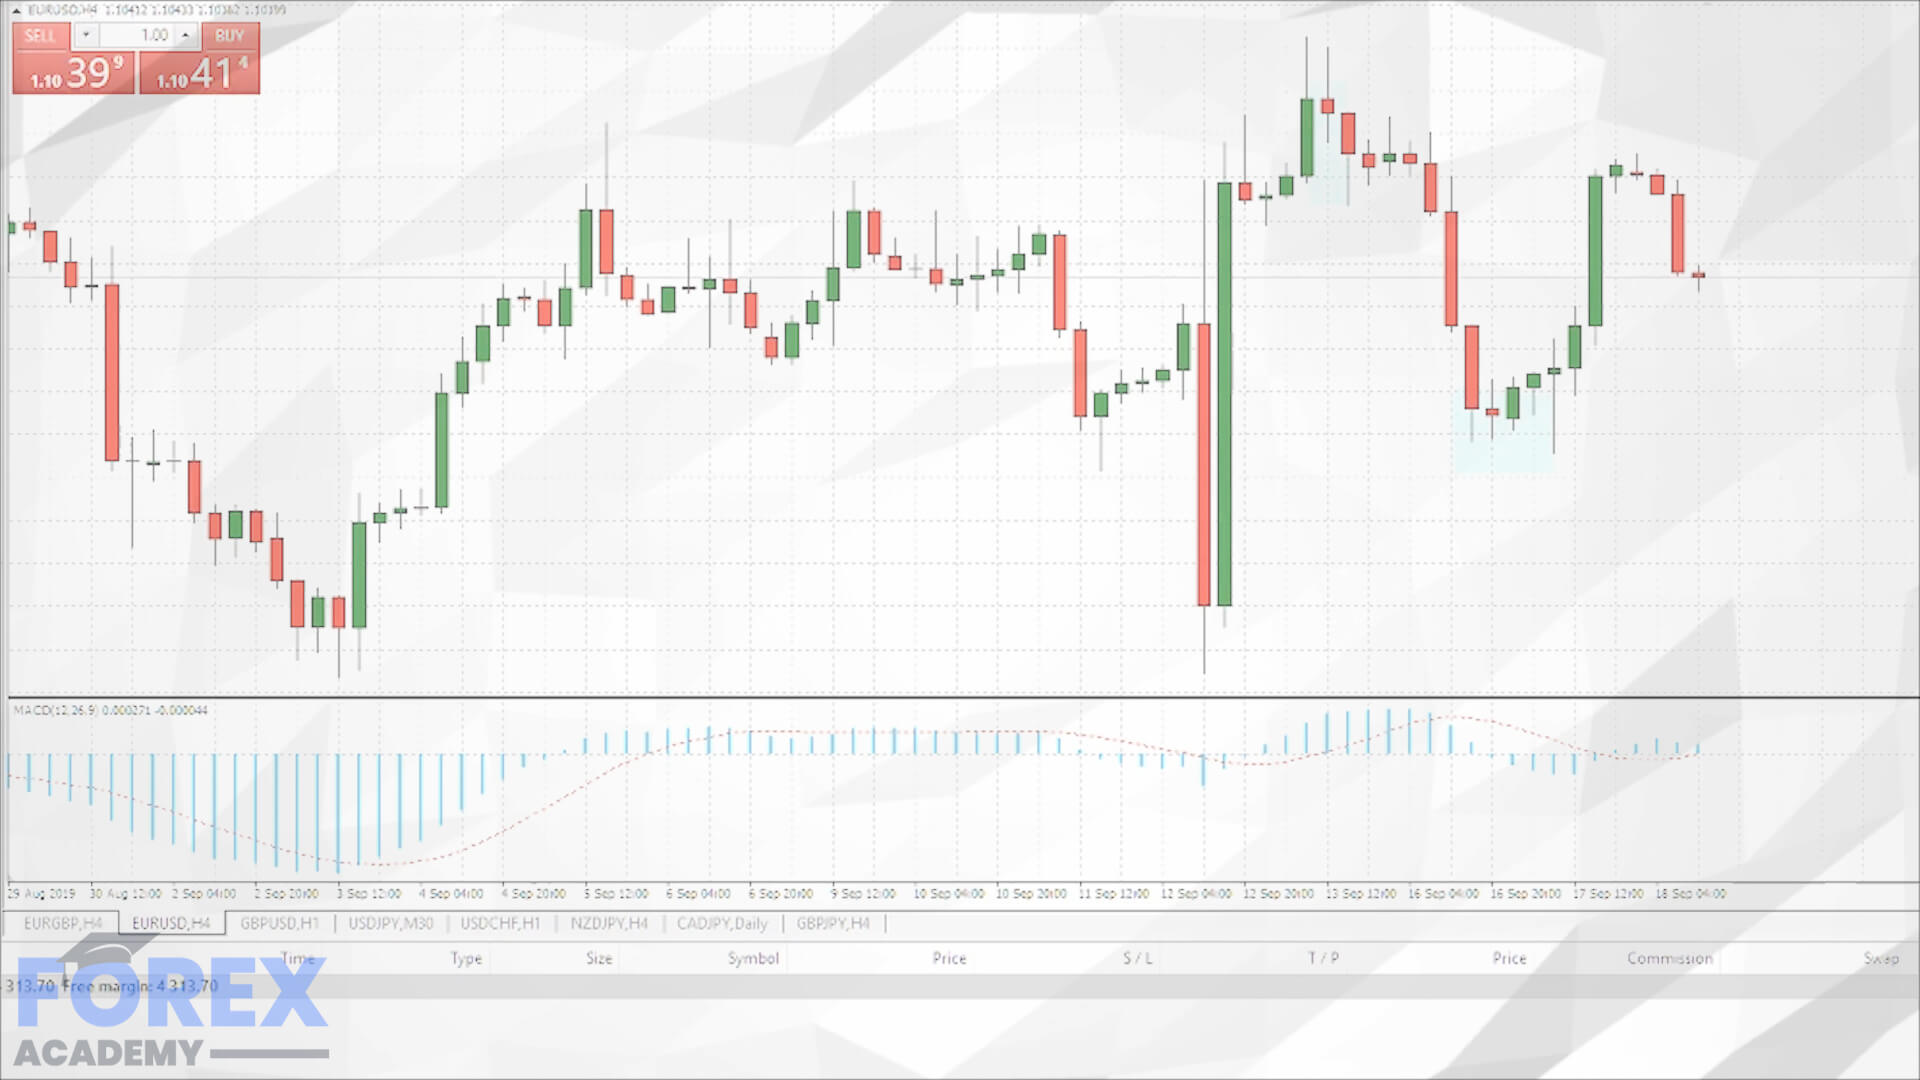
In the example ‘A,’ we can see the Metatrader MT4 platform, terminal. This is the EURUS pair.
On this market-leading platform, a trader will enter the volume or size of the trade. In this example we are trading with 0.10 size, which is one-tenth of a standard lot, or approximately €1 per pip in this example. We have also chosen market execution, which means that should we hit the red, sell box, or the blue, buy box, we are choosing the exchange rate, which is highlighted just above the box. So, we would be selling 1.10808 or buying 1.100811.
This example is set up as an instant sell, where the stop-loss has been set at 1.1150 and with a take profit target set at 1.0850 to the downside.
Example B
Let’s now look at the example ‘B.’ This is the same EURUSD pair. Here we have decided to use a pending order. And the order we have chosen is a buy limit order. The current exchange rate is 1.10898, as seen on the Y-axis to the right of the chart. And we have decided to place an order to buy this pair, should the exchange rate move up to 1.1100. We have also placed a stop loss at 1.1000 and a take profit at 1.1300. This trade is also good until manually canceled, or as per the expiry date which has been set at the 8th of November 2019, and at 12:21 in the afternoon.
In this example, we have increased the volume or size of the trade to 1 standard lot, which is the equivalent of €10 per pip. This would give us a profit of 200 pips, or around €2000 Euros, or approximately there or thereabouts of your designated account currency. Should the trade lose, we would be automatically stopped out at 1.100 with a potential loss of €1,000. Although the beauty of the MT4 platform is that traders can manually change their orders once executed by dragging trade order lines which appear on the screen once a trade order has been placed.
This trade represents a win-to-loss ratio of 2 to 1, which is fairly standard within the trading community.
To reverse this trade order to a sell limit, we simply highlight the buy limit box and change it to sell limit and adjust our stop loss and take profit accordingly, on the basis that we would then be expecting this pair to move lower.
https://youtu.be/WjSZjstY_O0
What is cryptocurrency margin trading?
Margin trading is a way of trading assets where traders use funds provided by a third party. Margin accounts allow traders to trade
https://youtu.be/WjSZjstY_O0
What is cryptocurrency margin trading?
Margin trading is a way of trading assets where traders use funds provided by a third party. Margin accounts allow traders to trade
What is cryptocurrency margin trading?
Margin trading is a way of trading assets where traders use funds provided by a third party. Margin accounts allow traders to trade with much bigger capital, which can, in turn, bring bigger profit. Margin trading allows its users to leverage their positions. Users get to borrow a certain multiple of their original assets, which essentially amplifies their trading results. Amplifying trading results makes margin trading interesting in low-volatility markets such as Forex markets. However, they have their place in cryptocurrency trading as well.
In traditional markets, the additional funds are provided by an investment broker, while cryptocurrency markets work by traders offering the funds. In return for their investment, they earn interest. Some cryptocurrency exchanges also provide margin funds by themselves to their users, but that is far less common.
How does margin trading work?
The first thing that has to happen in a margin trade is that the trader commits a percentage of the total order value. These funds are better known as the margin. Margin trading accounts are used to exploit the feature that is leveraged trading. Leverage is the ratio of borrowed funds compared to the margin. As an example, a $1,000 trade with 100:1 leverage requires a margin of $10.
Different trading platforms offer bigger or smaller leverage, based on their capabilities as well as the asset class they are trading. Stock markets usually trade with a 2:1 ratio, while Forex trading can have leveraged trading of up to 200:1. Cryptocurrency trading platforms offer trading of up to 100:1.
Margin trading offers its users the feature to open both long and short positions. A long position is a bet that the asset’s price will go up, while a short position is a bet that the asset’s price will fall. Trader’s assets act as collateral for the borrowed funds for the duration of the position. If the market moves against the position, brokers have the option to liquidate the position. Margin trading is riskier than regular trading due to the leverage it offers. Margin trading cryptocurrencies brings the risk even higher due to their inherent volatility.
Pros and cons of margin trading
If we talk about advantages, the most obvious one is the profit-making potential. Leveraged positions can quickly result in larger profits as a bigger relative value is traded in the position. Margin trading is also useful when diversifying, as traders have the option to open many positions with relatively insignificant capital. The last advantage is simply the ease of use. Margin traders don’t have to shift large amounts of funds to the margin account.
If we talk about the advantages, we have to talk about the disadvantages of margin trading. Leveraged positions can, if not properly managed, bankrupt an account in a matter of seconds. Overleveraged trading that goes against the position will quickly lead to the liquidation of the funds. It’s extremely important to exercise caution while trading with leverage. Any form of stop-loss is also advised.
Margin funding
Trading is a task that requires a lot of research, knowledge, and intuition. Many people do not have the skillset or the risk tolerance to engage in margin trading. However, they still want to make a profit off of the whole margin trading idea. The way for them to profit from leverage trading is margin funding. Some trading platforms and cryptocurrency exchanges offer an option for users to invest their money to fund the margin trades of other users. This process has a set interest rate, which is quite low. However, so is the risk associated with the investment.
Conclusion
Margin trading is a useful tool for risk-averse traders that want to amplify their profit-making potential. If used properly, this method of trading can have an amazing effect on the profit size. On top of that, users interested in diversifying should also look into margin trading.
However, this method of trading amplifies potential losses as well. The risk it inherently brings is not for everyone.
Mastering Price Action
Price action is the fluctuation in currency exchange rates, which are constantly moving up or down, relative to the exchange rate, and where these
https://youtu.be/CHB3qXad2N4
Mastering Price Action
Price action is the fluctuation in currency exchange rates, which are constantly moving up or down, relative to the exchange rate, and where these
Mastering Price Action
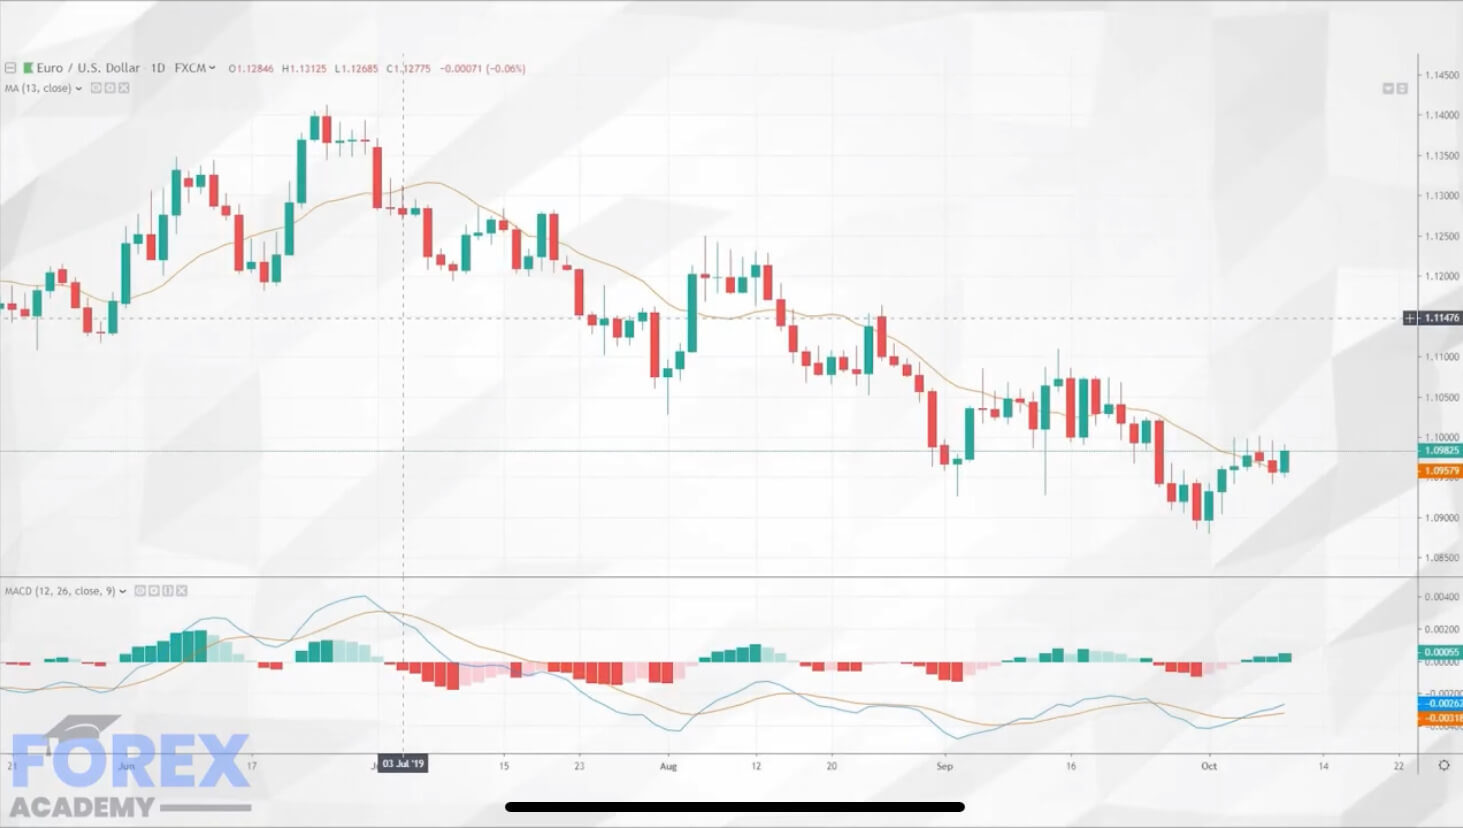
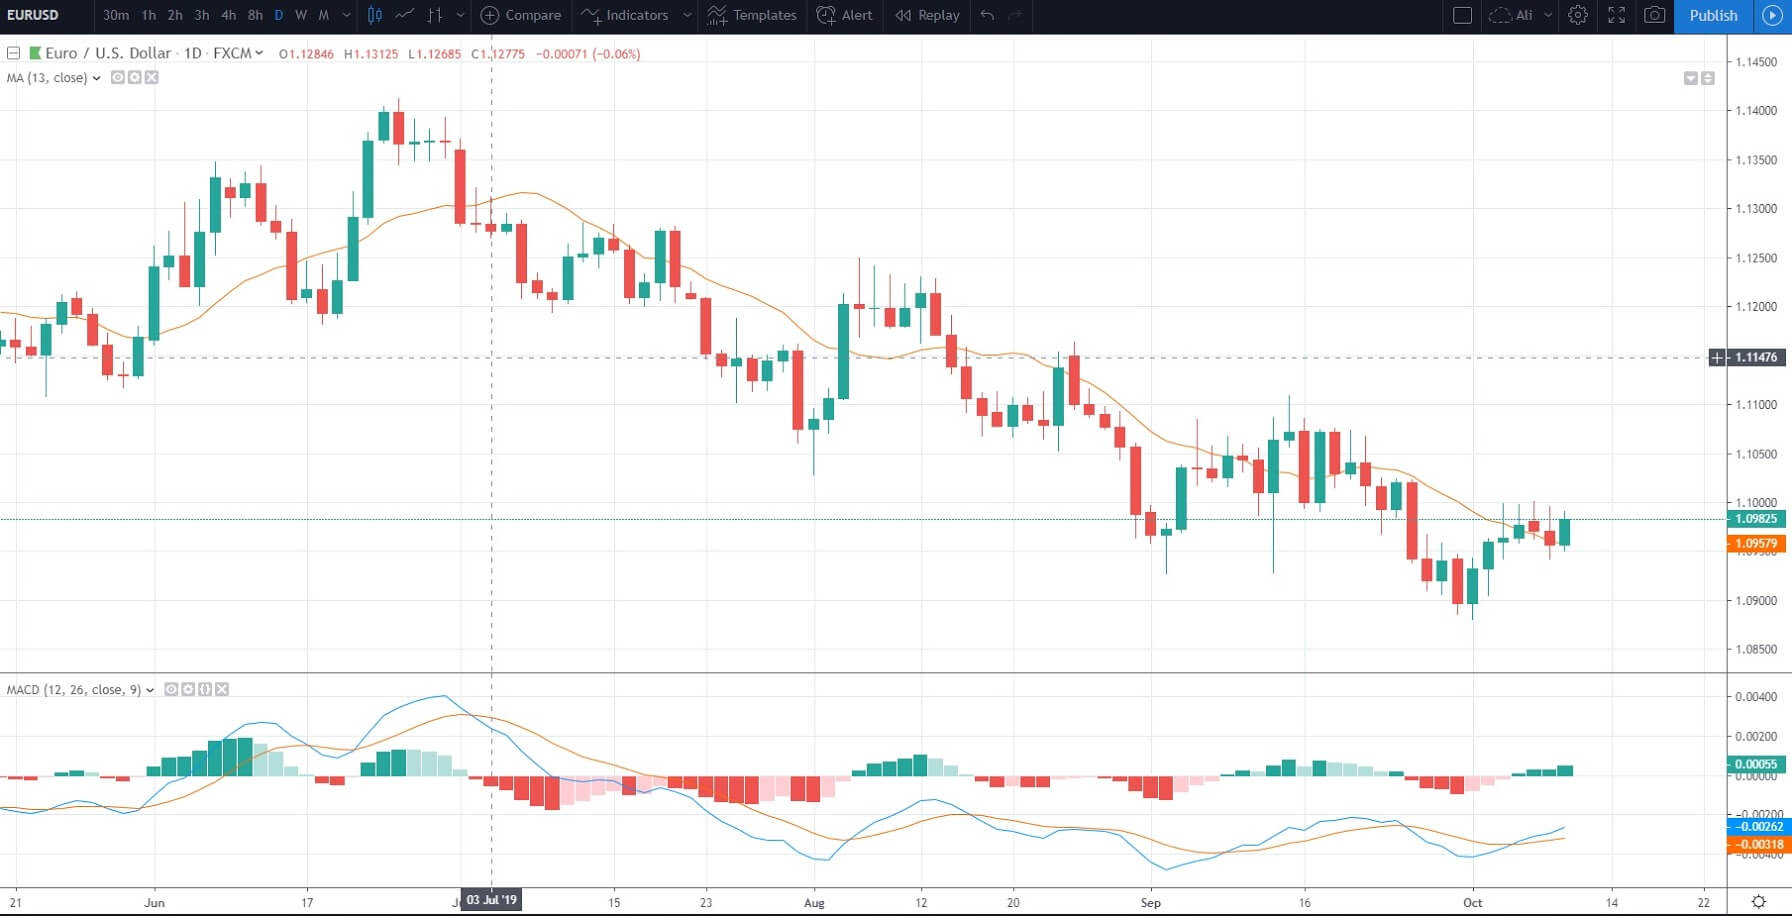
Price action is the fluctuation in currency exchange rates, which are constantly moving up or down, relative to the exchange rate, and where these movements form trends, which are typically called ‘bullish,’ where price action moves in an upwards direction, or bearish when price action moves in a downward direction.
However, currency exchange rates do not move in a straight continuous line. Therefore, Traders use technical analysis tools in order to decipher the direction of price action on their charts.
By carefully selecting technical analysis tools Traders are able to drill down further into the fluctuations of exchange rates and where it becomes much easier to identify when a particular price action move is about to stall and reverse direction.
Example A
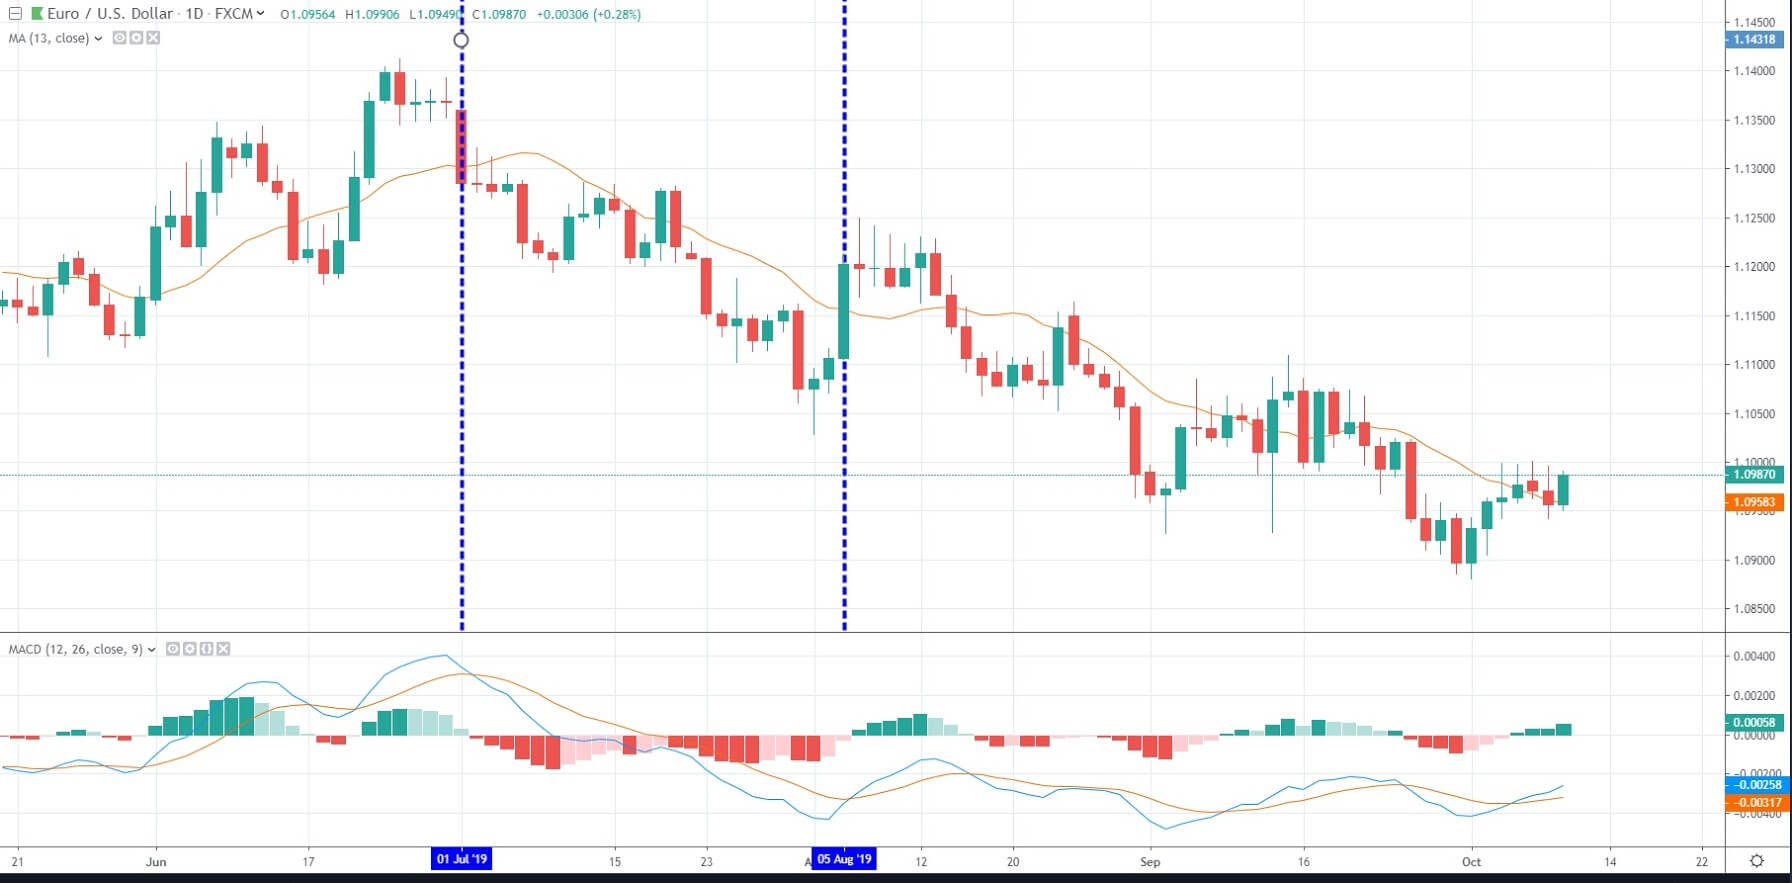
Let’s look at the example ‘A.’ This is a 1-hour chart of the EURUSD pair. Always read your charts from left to right, because they tell a story of where price action has been, and where it is likely to go in the future. In the chart, we are using Japanese candlesticks, and where are the green candlesticks denote bullish price action, and where red candlesticks show a bearish price action.
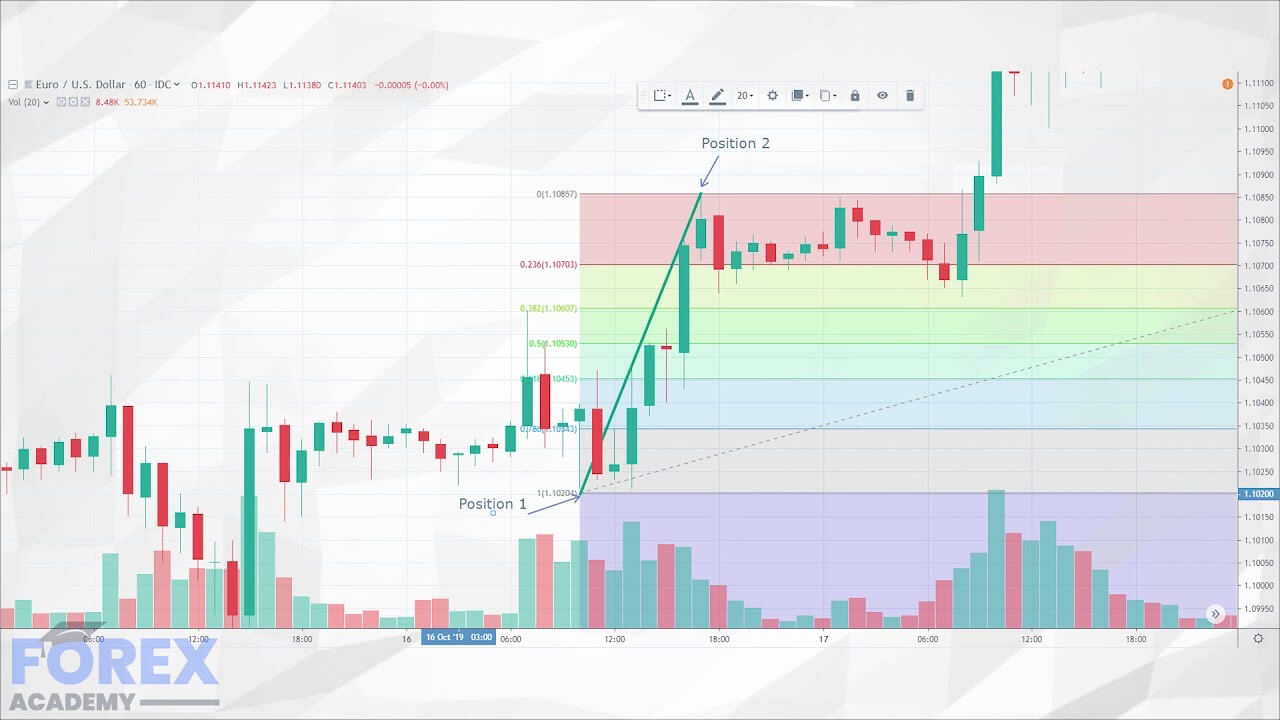
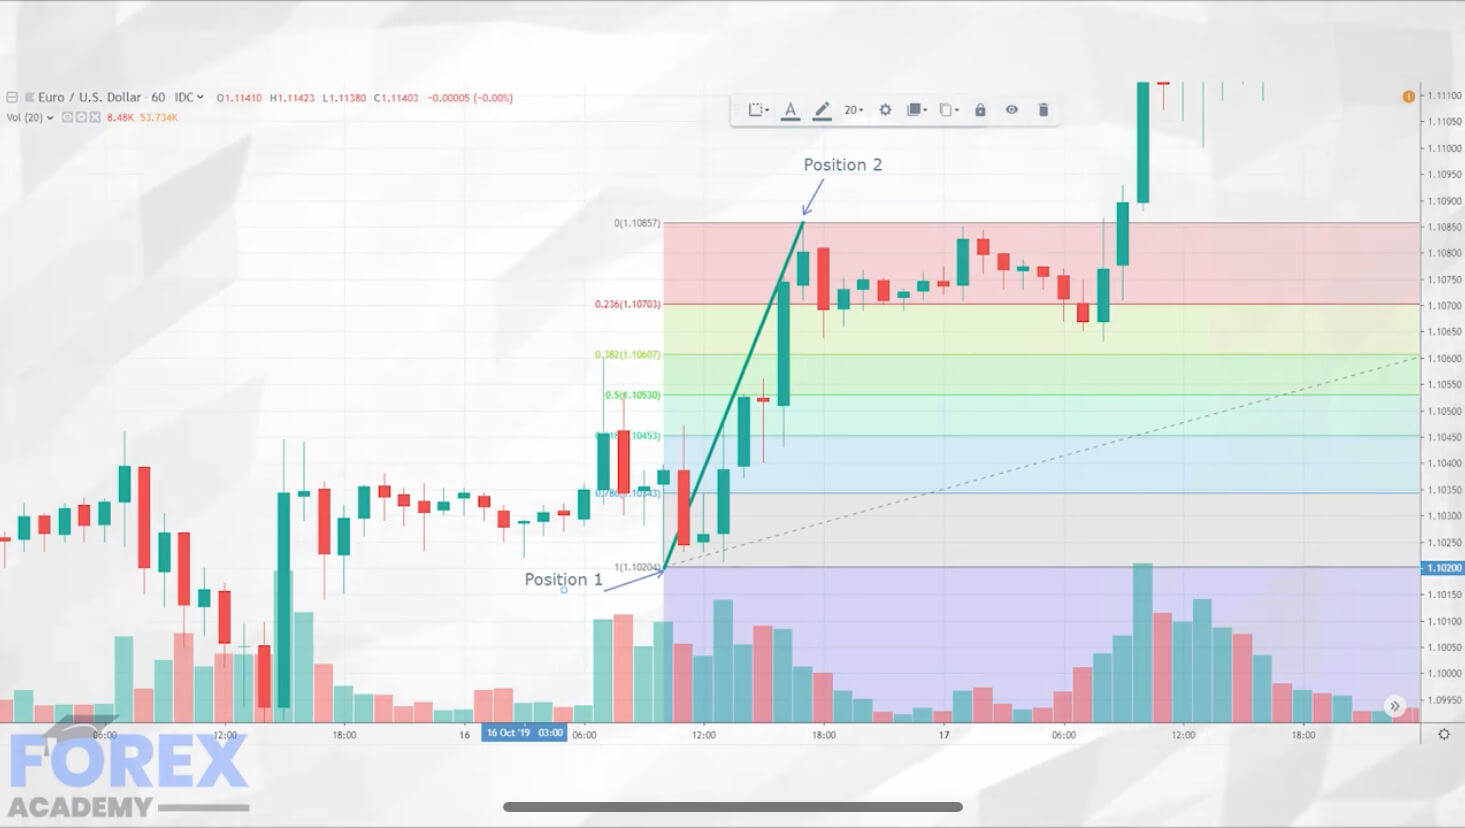
Example B
Now let’s look at the example ‘B,’ which is the same 1-hour chart of the EURUSD pair. And like other professional technical analysis traders, we have added a few lines which highlight some interesting areas on the chart, and which would have led to several trading opportunities.
First of all, we note a strong bullish move at position 1, where we see predominantly bullish candlesticks. However, this price action trend to the upside fades, and where we have drawn in a ceiling, or level of resistance marked ‘A.’ The bulls have essentially thrown in the towel. Some traders would be taking a profit at this stage, and price action begins to fall lower. This is a period of consolidation. But it is not long until the bulls regain control again, and an overall trend forms to the upside, as per the arrow at position 2, until price reaches our resistance line marked ‘B.’ Importantly, this line is the 1.10 exchange rate, a key level.
Incidentally, note that our resistance A-line causes some confusion for traders until price action reaches the key 1.10 exchange rate. While some see the resistance continuing to hold, it eventually becomes the beginning of support line ‘B.’
The overall move from the beginning of position 1 to the top of position 2, which is our key 1.10 exchange rate, is around 100 pips, a fairly substantial move. Again, bull traders will be looking to cash in and take a profit at this level while assuming that there will be limit orders in place here to go short at this level and therefore drive the price action lower. And that is exactly what happens as per arrow number 3, where sellers take a hold, and price action moves lower to our secondary support level marked support ‘B.’
Price action then begins to fluctuate between our support level B, and our resistance level ‘B.’ During this phase, technical Traders will be wondering if price action can breach the key
resistance level at 1:10, and where that might become an area of support at which point bulls would be expected to come in and drive the market to the next level of resistance.
After three consecutive attempts to breach the key 1.10 resistance level, bull traders at position 5 fail to reach the 1.10 level and they begin to fear that price will again be rejected at the 110 level, and price action pulls back to support level B, which is then breached, until price action finally finds support at level ‘A’.
During the time frame of this chart, from the 2nd to the 9th of October, 2019, we are presented with clear buying and selling opportunities with the EURUSD pair, simply by the use of Japanese candlesticks and a few trend lines that we have added to our chart to identify support and resistance levels. We can see sideways price action where traders are uncertain if there will be a complete reversal in the upward trend, and there are clear lines of interest, such as the 1.10 exchange rate.
And so, support lines become lines of resistance, and these fluctuate throughout the day depending on the level of liquidity and also market sentiment and other factors based on fundamentals of the relevant currencies within the pair.
Simply by understanding that these lines exist and where traders are driving the market too, and fears of where reversals lurk will give you a better understanding of mastering price action.
What are cryptocurrency exchanges?
Cryptocurrency exchanges are online platforms where users can exchange one cryptocurrency for another. The exchange rates are based on the market value of the
https://youtu.be/00atGAtjm_c
What are cryptocurrency exchanges?
Cryptocurrency exchanges are online platforms where users can exchange one cryptocurrency for another. The exchange rates are based on the market value of the
What are cryptocurrency exchanges?
Cryptocurrency exchanges are online platforms where users can exchange one cryptocurrency for another. The exchange rates are based on the market value of the given assets at that moment in time. Most cryptocurrency exchanges allow for crypto-to-crypto exchange, while some even allow trading fiat for cryptocurrency and the other way around. An important thing to notice is that cryptocurrency exchanges are not cryptocurrency wallets or wallet brokerages. Cryptocurrency wallets and wallet brokerages allow their users to buy and sell a small range of popular cryptocurrencies.
Types of cryptocurrency exchanges
There are four main types of cryptocurrency exchanges:
Traditional cryptocurrency exchanges
Cryptocurrency brokers
Direct trading platforms
Cryptocurrency funds
Traditional Cryptocurrency Exchanges
Traditional cryptocurrency exchanges are all exchanges that act like the traditional stock exchanges. Users can buy and sell their assets based on supply and demand, which creates market prices. The exchange acts as a middleman in the process and charges trading fees for transacting. While most of these exchanges only exchange cryptocurrency, some allow users to trade fiat currencies for cryptocurrencies.
These exchanges can be centralized and decentralized. Centralized exchanges are run by third parties and hold their user’s keys. They act as support and problem solvers. Decentralized Exchanges (DEXs) operate by trading that is based on smart contracts. There are no centralized third parties, and the wallet keys remain in the hands of its users. While decentralized exchanges sound like a better option, they are often slow and do not support fiat trading.
Cryptocurrency Brokers
Cryptocurrency brokers are website-based exchanges that allow its users to buy and sell cryptocurrencies at a price set by the broker rather than the market. This price usually has a premium on the market price. The exchange is between the buyer or seller and the broker acting as the other party. Coinbase and Shapeshift are good examples of cryptocurrency brokers. For the slightly higher price, brokers offer ease of use and convenience in general.
Direct Trading Platforms
Direct trading platforms offer peer-to-peer trading between buyers and sellers, and they don’t use a fixed market price. They let sellers dictate their exchange rate while buyers find sellers they like and perform an over-the-counter exchange. Many decentralized exchanges work this way, but most of them still fall under the traditional exchange category. LocalBitcoin.com is a great example of a centralized peer-to-peer exchange that allows fiat-to-crypto exchange.
Cryptocurrency Funds
Cryptocurrency funds are professionally managed cryptocurrency asset pools. These funds allow users to buy and hold cryptocurrency via their services. GBTC is a prime example of cryptocurrency funds. Cryptocurrency funds let its users invest in cryptocurrency without ever having to purchase or store it by themselves. On the other hand, the bought cryptocurrencies are only there as an investment and cannot be used.
Conclusion
There are many forms of cryptocurrency exchanges, but they all try to achieve the same goal: customer satisfaction. While some focus on the ease of use, others focus on the options that they provide. Crypto-trading beginners will most likely want to use traditional exchanges or brokers.
What is proof of stake, and how does it work?
The proof of stake system is a consensus protocol that came as a response to the shortcomings
https://youtu.be/iVWWsAGB0K0
What is proof of stake, and how does it work?
The proof of stake system is a consensus protocol that came as a response to the shortcomings
What is proof of stake, and how does it work?
The proof of stake system is a consensus protocol that came as a response to the shortcomings of proof of work. It is attracting a lot of attention as of late, with Ethereum switching its consensus protocol from proof of work to proof of stake. Proof of stake is nothing more than an alternative way to verify transactions on a blockchain.
How does it all work?
Proof of work and proof of stake works very differently, even though they are trying to do the same thing. The proof of work system has its users validate transactions and create new blocks by solving a “puzzle,” which requires some computational power. On the other hand, a proof of stake consensus algorithm requires the user to show ownership of their funds to validate transactions.
When it comes to proof of stake system, the creator of a new block is picked in a pseudo-random way. The block creator has more chance depending on the size of their “stake.” In the proof of stake system, blocks considered forged or minted rather than mined. Nodes who validate transactions and create new blocks with this system are not miners, but rather forgers.
To validate transactions and create blocks, a forger must stake their funds. Their holdings are being held in an escrow account, which acts as collateral for any potential fraud attempts. If a forger tries to validate a fraudulent transaction, they lose both their staked holdings and their rights to participate in the process. This way, the proof of stake protocol incentivizes forgers to validate only non-fraudulent transactions.
An important thing to note is that most proof of stake projects already created and distributed their digital currency units already. When this is the case, the forgers receive transaction fees instead of new cryptocurrency as rewards. This is considered true only if the cryptocurrency cannot inflate itself by minting more and more coins.
Block selection methods
Proof of stake consensus algorithm needs a way to select future forgers. There are two main ways to do so:
Selecting a user randomly
Selecting a user based on their coin age.
Selecting a forger only by the size of their account balance would go against the whole premise of cryptocurrencies, and is a bad idea. That way, people with more funds would get richer, while the ones with fewer funds on their account would be hindered and have less control over block creation. To counter this problem, these two methods have come up as the most popular and reasonable.
Randomized block selection
The randomized block selection method is just what it sounds. The method seeks a user that offers the lowest hash value regarding the size of its stake. As all stake sizes are public, each node can predict (with high probability) whether they will be selected to forge the next block.
Coin age-based selection
This system is a bit different than the randomized block selection one. It selects the next forger based on the ‘coin age’ of the node’s stake. Coin age is a multiplier of the number of days the funds have been staked and the number of coins that are being staked. Coins must be staked for 30 days before they can compete for block creation. Users with larger stakes have an advantage, but so do users who have staked for a longer time. Once a user forges a block, their coin age is reset to zero. After a node forges a block, they must wait at least 30 days before creating another block. This mechanism promotes decentralized forging while maintaining a power balance between large stake forgers and lower stake forgers.
Advantages of proof of stake
Proof of stake is a much more environmentally friendly and efficient consensus algorithm than the proof of work method. The electricity and hardware costs are much lower due to how the method is made.
Unlike proof of work system where a 51% attack is performed by obtaining the majority of hash rate, proof of stake attackers would be required to obtain 51% of the cryptocurrency to perform the attack. Even though performing a 51% attack is possible, forgers with the majority of funds would not risk their money to perform such an attack. If the cryptocurrency price drops due to the attack, their holding value would also drop.
Conclusion
Proof of stake is a consensus algorithm that is created as an answer to the disadvantages of proof of work. It offers a unique way of validating transactions and creating blocks, and it is gaining popularity. With that being said, the Proof of Stake algorithm is not better than Proof of Work on all fronts, and each project should consider both methods before picking the one they like.
In the area of financial trading and in particular within the Forex market, the movement of a currency pair, or price action, does one of
https://youtu.be/HrRYAGZk848
Trading Breakouts
In the area of financial trading and in particular within the Forex market, the movement of a currency pair, or price action, does one of
Trading Breakouts
In the area of financial trading and in particular within the Forex market, the movement of a currency pair, or price action, does one of three things: it moves up, it moves down, or it moves sideways. Within these types of moves, especially when the price action is moving up and down, we will find trends forming. We also find pullbacks, or price reversals, continuations, slowdowns in volatility, and pauses and hesitations, which are also known as periods of consolidation. Typically at these times you might see very small movements, where price moves sideways in a narrow range. In other words, currency exchange rates in the Forex market do not travel in a continuous straight line. And this is what makes trading so difficult to predict.
Each time you pull the trigger and execute a trade, and especially as a retail trader, you are up against institutional traders, including sovereign wealth funds, hedge funds, governments and their central banks and high net worth individuals, all of whom might well have a different price move expectation than yourself and be trading in the opposite direction, i.e, against you!
This is why it is so important to learn the peculiarities, twists, and turns, the dynamics and unpredictability of the Forex market. And the best way to do this is to study your charts and to study the markets and to practice on a demo account. In other words, learn the ropes, find the best time of day to trade that suits your trading style and methodology, try to determine when the aforementioned big guns are all likely to be singing from the same hymn sheet, in other words when the majority are trading in the same direction.
One of the most popular and rewarding styles of trading the Forex market is identifying breakouts. This type of trading relates to technical analysis only. That Is not to say that we can take our eyes off of the fundamentals, because these events can be triggered by economic data releases. However, after periods of consolidation, where price action becomes narrow and congested, and show a lack of direction, traders look for potential breakouts to test new levels, and these events regularly occur purely on technical analysis, alone.
Because breakouts are so popular, price action can be extremely volatile at these times. It’s almost as if everybody pounces to trade at the same time and either buys or sells a particular currency pair because their charts tell them so. This tends to cause strong moves, as price breaks out of bottlenecks and where quite often those entities who are trading counter to the breakout may be stopped out of their trades. This is often because breakouts regularly happen at, or close to, round numbers. At these levels, traders tend to place their stop losses or limit orders to buy or sell. This can often result in a spoof breakout, where price action breaks out of a period of consolidation only to reverse quickly and start a trend in the opposite direction. And therefore, some breakouts can be short-lived, and which are also known as false breakouts.
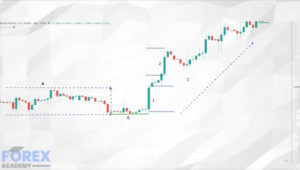
Example A
Let’s turn our attention to example ‘A.’ This is a 1-hour chart of the EURUSD pair. Always read your charts from left to right, because it tells you a story of where price action has been, and where it is possibly going to go in the future.
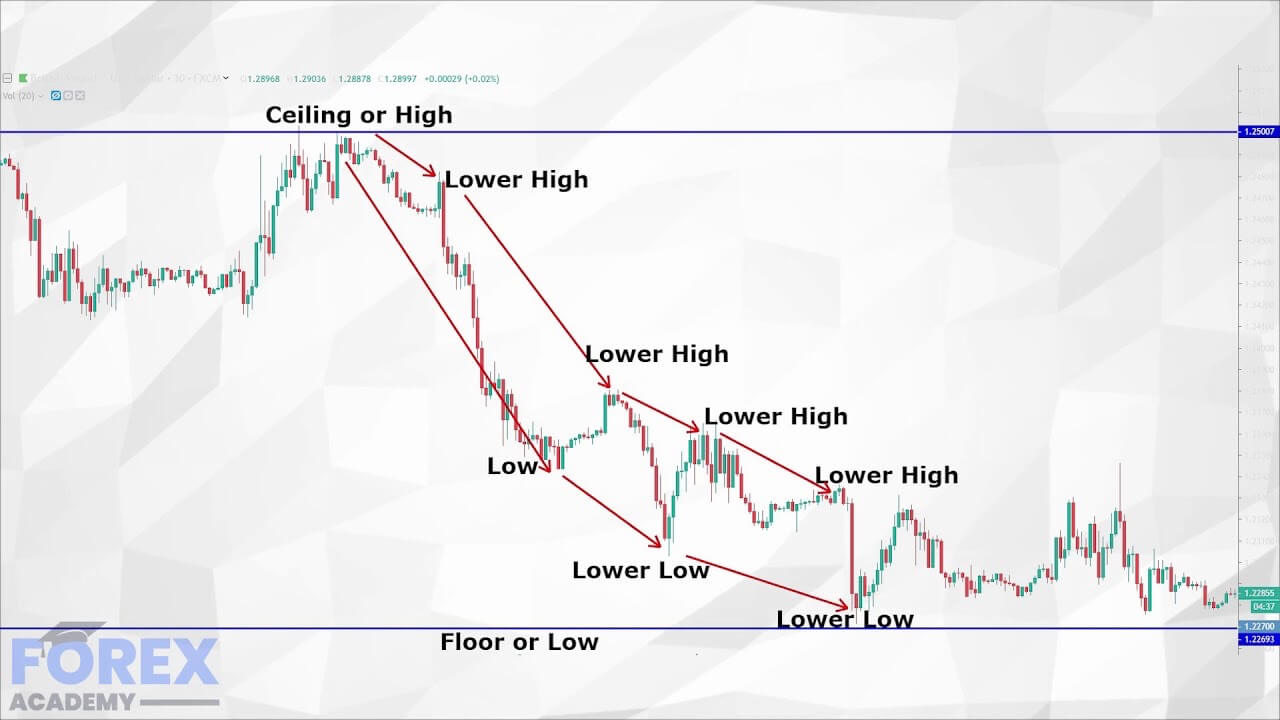
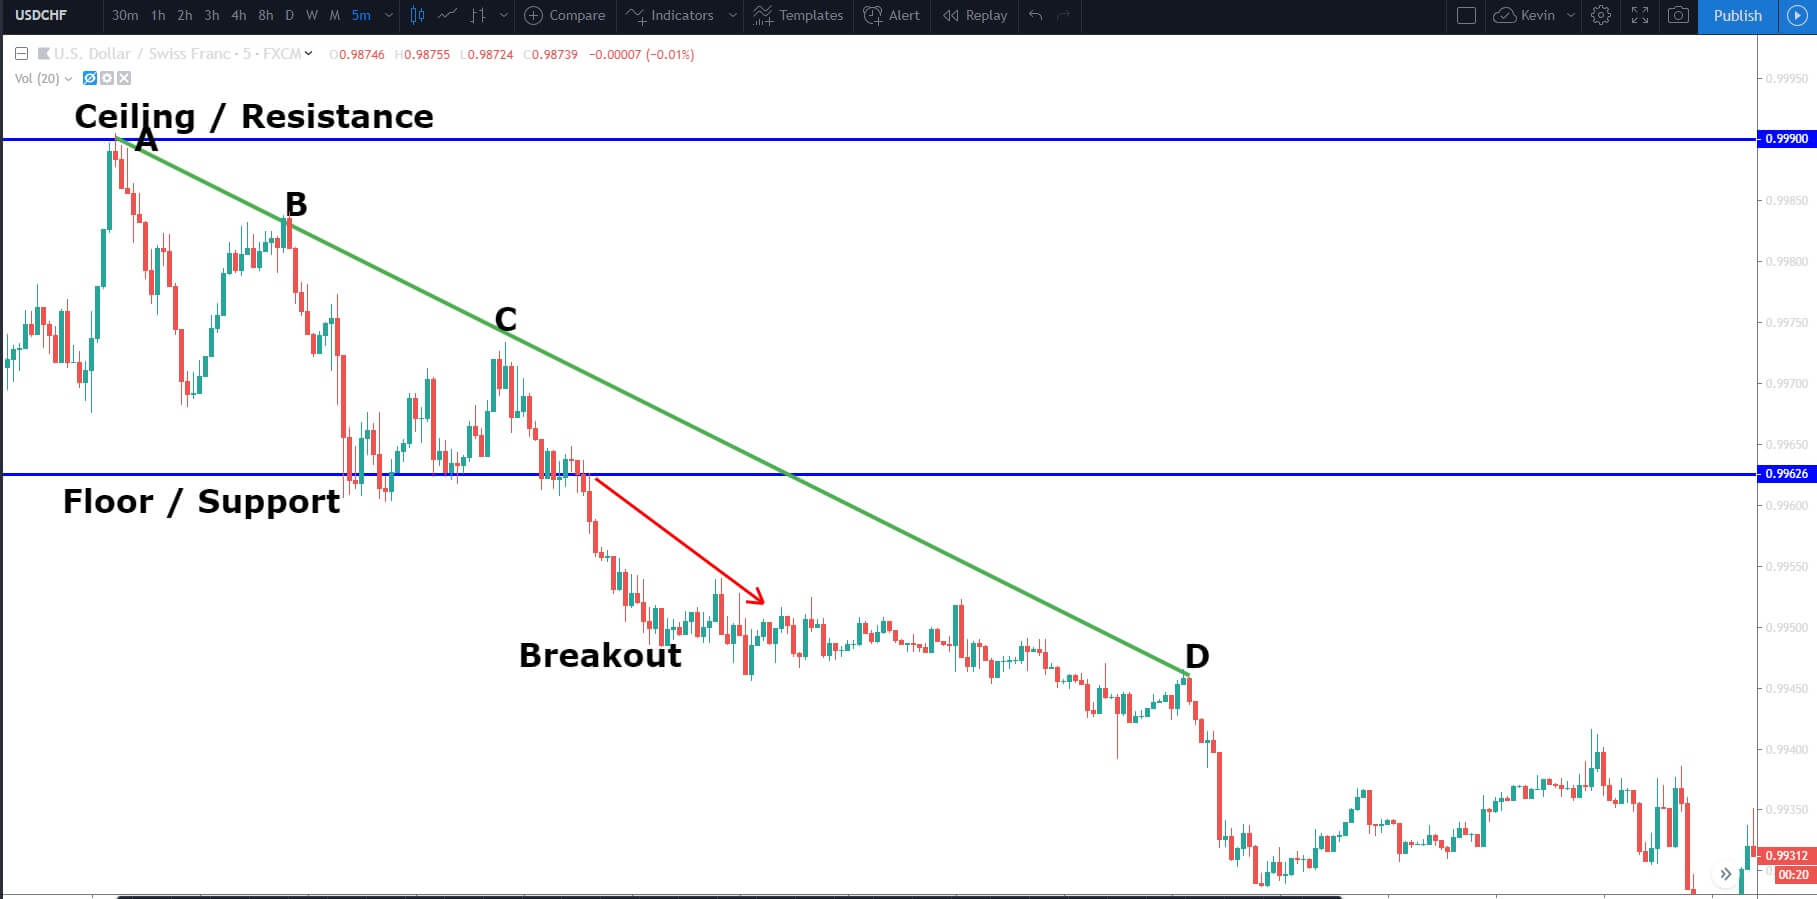
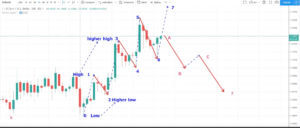
In this example, we can see that we have drawn a horizontal line at position ‘A.’ This has become an area of support; it is effectively a floor. Although we have a high, as marked at the position marked 1, and where price action moves back to our floor, the second move higher at position 2 becomes a lower high than at position 1. This tells us that the market is running out of momentum to the upside, and where indeed price action returns to the floor after this push higher falters. And then, price action forms a new lower high at position 3. This now tells us that bull traders have effectively thrown the towel in, and then, when price again returns to the floor, we see a breakout, as marked by the X, which punches through the floor, or support level. Therefore, this would have been the breakout candlestick that traders were looking for In order to go short on this pair.
Price action continues to move to the downside. However, we now see a new floor at position C, and a new ceiling at position B. And where price action consolidates in a sideways trading fashion.
In the example ‘B,’ we have moved the charts along to the next session. Price action continued to trend sideways between the ceiling marked ‘B’ and the floor marked ‘C’ until it becomes a second breakout occurs and where price action punches through to a new floor marked ‘D’ and where the previous floor, ‘C’ has now become a ceiling.
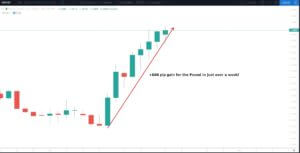
Again, price action returns to a consolidation or sideways momentum, until, eventually, at candlestick marked X – a series of strong bearish candlesticks form another breakout to the downside. Had we entered a short trade at the first breakout to the downside in example A, we could have realised a profit of over 180 pips.
An important lesson to learn from this section is that breakouts often occur when price action punches through floors and ceilings, and which are also known as levels of support, being the floor, and resistance being the ceiling.
So keep an eye out for possible breakouts and especially at key technical levels when support and resistance levels begin to fail. They will be far stronger in momentum after extended periods of consolidation.
https://youtu.be/-7oS9SphVkE
Trading Price Momentum
One of the biggest keys to understanding how trading in the forex market works is to know how momentum affects price action. Traders need to
https://youtu.be/-7oS9SphVkE
Trading Price Momentum
One of the biggest keys to understanding how trading in the forex market works is to know how momentum affects price action. Traders need to
Trading Price Momentum
One of the biggest keys to understanding how trading in the forex market works is to know how momentum affects price action. Traders need to gauge the market extremely carefully as price action can turn in direction, in a split second, based on a momentum occurrence, such as an economic data release, market rumours, and economic news commentary. It is essential that traders have contingency plans in place in the event of huge momentum moves. This could be by implementing stop losses, limit orders, hedging strategies, but importantly, being aware of market conditions and potential events that might cause huge liquidity and momentum shifts in price action.
Causes of trading price momentum are such things as government elections, war, OPEC meetings, and announcements pertaining to oil prices, commodity forecasts, government policy, currency devaluations, exchange rate pricing, debt defaults, market collapse, the US Federal Reserve, political referendums and economic data releases. During these events we will usually find a great deal of speculation due to market sentiment, risk-on and risk-off events, institutional investments including position-taking, and stop-loss activity.
The big players cause the big moves because of their size and liquidity, and they typically include hedge funds, sovereign wealth funds, governments, and their central banks. When these guys come to the market, it is not unusual for them to trade in sizes of over 100,000 US dollars per pip in the Forex market. This type of size causes market makers – that’s those who provide the bids and offers – to very quickly adjust their liquidity support in the market, which further adds to the momentum.
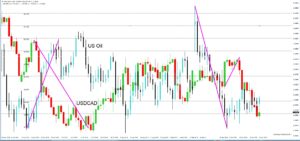
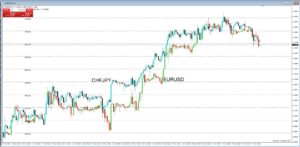
Example A
Let’s take a look at the example ‘A,’ this is a 1-hour chart of the USDJPY pair covering the last couple of days. At position 1, we note a huge spike higher in the pair with the 1-hour candlestick breaching the Bollinger bands, whilst spiking through an area of resistance caused by the sideways trading of this pair, and which reaches across, to the left of our chart. Even though the Federal Reserve cut their short-term interest rate by 25 basis points – the third cut this year – which caused this market reaction.
One might have thought that the US dollar would have lost ground against the Japanese Yen because of a lowering in interest rates, which, of course, is less than appealing to investors holding dollars. However, traders took into account that the subsequent forward guidance speech given by Federal Reserve Chairman, Powell, gave no indication that further interest rate cuts were imminent this year. Also, Federal Reserve governors voted 8 to 2 in favour of the cut. This shows that there is some conflict within the Federal Reserve regarding monetary policy.
Indeed the next hourly candlestick shows a pullback in this pair, thus negating the 30 or so pip move to the upside. This spike would have caused many institutions to suffer from a stop loss as price action moved above the key 109.00 level, while traders tried to decipher the implications of the rate cut, and what messages could be gained from Fed Powell’s speech.
Now let’s turn our attention to position 2, we can see a strong bearish candlestick just below position 2, which was a result of a news release stating that a Chinese official reported that the long-awaited part 1 of the Chinese & US trade agreement might not be signed next month as per market expectations. The Chinese official also stated that there was a risk that the deal may collapse due to what they said was a divisive attitude to the agreement by President Donald Trump.
These are just two examples of how price momentum can cause huge amounts of volume and volatility, and whereby in a relatively short time frame, we can see swings in the price action of over 100 pips in this example.
Example B
Let’s look at example B. This is a one-hour chart of the US DOW Jones 30. In position 1, we can see a surge in the price action to the upside after the announcement of the 25 basis points rate cut. This is important because US companies can borrow money more cheaply with lower interest rates. We subsequently see a slight pullback of price action inside the Bollinger bands and a consolidation to position 2. The bearish candlestick at this point takes out most of the previous day’s bull trend as soon as the rumour from the Chinese official that the US-China trade deal could collapse. The upshot of these two events was a 400 point swing in price action!
Here at Forex.Academy, we always advise traders to be aware of potential momentum moves in price action. This can only be achieved by having a good overall market awareness, and learning the art of expecting the unexpected, and by having contingency plans in place in the event of such events.
https://youtu.be/obpfVVZY02M
What is Bitcoin halving?
Before explaining Bitcoin halving, we need to know how Bitcoin mining works. Each time a block is verified by submitting a correct answer to
https://youtu.be/obpfVVZY02M
What is Bitcoin halving?
Before explaining Bitcoin halving, we need to know how Bitcoin mining works. Each time a block is verified by submitting a correct answer to
https://youtu.be/obpfVVZY02M
What is Bitcoin halving?
Before explaining Bitcoin halving, we need to know how Bitcoin mining works. Each time a block is verified by submitting a correct answer to the equation, new Bitcoins come as a reward. Satoshi Nakamoto set up two major rules for the proof of work protocol:
Bitcoin’s maximum supply is finite. It is limited to 21 million and cannot be changed.
The number of Bitcoins generated per block and distributed as a mining reward halves (decreases by 50%) every 210,000 blocks.
How long until Bitcoin rewards halve?
As one block is found every 10 minutes on average, 210,000 blocks would be found in approximately four years. The mining reward for solving the block puzzle will halve by 50% every four years. Bitcoin’s first mined block rewarded the miner 50 Bitcoin. Two halvings after, and we are in the present, where each block grants 12.5 Bitcoin. Next, halving will reduce that amount to 6.25 Bitcoin and so forth until there are no more Bitcoin to be mined. When there are no more Bitcoin to be mined, miners will be compensated through mining fees.
Why is halving created?
The explanation of the creation of halving events lies in the law of supply and demand. If coins are mined too fast, the supply will rise too fast, and there will be a lot more Bitcoin in circulation. This will, in turn, devalue the currency.
Vitalik Buterin, the lead developer of the Ethereum project, explained the need for halving to occur is to keep inflation under control. Additionally, he explained that “One of the major faults of traditional fiat currencies controlled by central banks is that the banks can print as much of the currency as they want, and if they print too much, the laws of supply and demand ensure that the value of the currency starts dropping quickly.”
When Will the Next Halving Occur?
As previously mentioned, each block takes 10 minutes to generate on average. Taking that into consideration, we can estimate the next block halving event to occur somewhere around June 2020. Many websites track block generation and estimate when the reward halving will happen exactly. They even have countdowns that let people know the date and time of the estimation.
One important thing to mention is that some people noticed that each block takes only 9 minutes and 20 seconds on average to generate, instead of the presumed 10.
How Will the Bitcoin Halving Affect Bitcoin’s Price?
As block halving essentially reduces the further supply of Bitcoin, many people will ask whether the price will be affected by this event. Sadly (or fortunately), no one knows. The 2016’s halving event had no major effects on the price at that time. A week after the event, Bitcoin went from $650 to $675.
However, even if there are no apparent signs of price change, economic principles of supply and demand still work. Either the price will increase after the halving, or the current price already includes the speculation of what’s about to happen. Conclusion
Bitcoin is a scarce asset by design. The specific rules, such as a limited supply of 21 million Bitcoin as well as an inflation reduction “tool,” which is the halving event, make sure that Bitcoin becomes even more valuable over time. The Bitcoin halving event should not be considered as a date at which the price of Bitcoin skyrockets, but rather a tool which keeps inflation in check. This is one of the main attributes of Bitcoin and one that separates it from fiat currencies, which are inflationary by nature.
What is proof of work cryptocurrency mining?
Cryptocurrency mining is a process that is used to verify cryptocurrency transactions and add them to the blockchain ledger. Cryptocurrency
https://youtu.be/gp8YlNAaD1g
What is proof of work cryptocurrency mining?
Cryptocurrency mining is a process that is used to verify cryptocurrency transactions and add them to the blockchain ledger. Cryptocurrency
What is proof of work cryptocurrency mining?
Cryptocurrency mining is a process that is used to verify cryptocurrency transactions and add them to the blockchain ledger. Cryptocurrency mining has been a topic of discussion ever since Bitcoin started getting popular. On top of that, the mining itself has grown exponentially in the past couple of years.
This article will try to explain how proof of work mining works as well as its pros and cons. Proof of work mining in-depth. Proof-of-Work (PoW) is the original consensus algorithm in a blockchain network and is the consensus algorithm that Bitcoin uses. Proof of work is used to confirm transactions as well as create new blocks to the blockchain. By using PoW, miners compete against each other to complete transactions on the network, and the first miner to complete it gets the block reward.
The main working principle of Proof of Work is a complicated algorithm that requires a lot of computation power to use. Transactions get bundled in blocks that require verification. The verification process is nothing but miners competing to solve a mathematical puzzle before the rest of the world. Whoever solves the puzzle first, gets rewarded. The answer to the PoW puzzle is called hash.
The more the network is growing, the harder it is to solve a puzzle first and submit the hash to the consensus algorithm. The algorithms need more and more hash power to solve as speed is a major factor in mining. This becomes a problem because harder mathematical equations are good to prevent DoS attacks and spam but also slow down the puzzle-solving itself, therefore slowing down the network.
This problem is solved by adjustable mining difficulty. How complex a puzzle solely depends on the number of users, current mining power, as well as the network load. In Bitcoin, network difficulty is adjusted every two weeks.
Where is proof of work mining used?
Proof of work is used in a lot of cryptocurrencies, with the most famous one being Bitcoin. Bitcoin was the project that laid the foundation for this type of consensus.
Besides Bitcoin, another large project with PoW is Ethereum. Given that almost three-quarters of all cryptocurrency projects are tokens made on the Ethereum platform, it’s safe to say that the majority of cryptocurrencies use the PoW consensus model.
Why use a Proof of Work consensus algorithm?
The main benefits of the proof of work consensus algorithm are:
The anti-DoS attacks defense
Low impact of stake on mining possibilities.
Anti-DoS attacks defense – PoW imposes some limits on performing certain actions in the network. These actions require a lot of computational power as well as time. This brings the costs of the attack too high, which renders attacks of this kind useless.
Mining possibilities – The PoW algorithm does not care about how much money a wallet has to mine. All that matters is the amount of computational power and how fast a node can solve the puzzle. This prevents whales from being in charge of making decisions in the name of the network just because they hold a lot of funds.
Proof of work disadvantages
The Proof of work consensus algorithm also has several disadvantages. The main disadvantages are:
Huge expenditures
“Uselessness” of computations
51 percent attack.
Huge expenditures – Mining currently requires highly specialized computer hardware to achieve the effectiveness of solving complicated equations. This specialized mining hardware consumes large amounts of power to run, and people are starting to question if the power spent is justified.
“Uselessness” of computations – Besides using a lot of power (mostly electricity), miners also use quite a bit of computational power that could maybe be used elsewhere. Even though this computational power guarantees network security, it cannot be applied anywhere else.
51 percent attack – Small proof of work algorithms are extremely vulnerable to this kind of attack, while Bitcoin may be large enough to be immune to it. 51 percent attack, also called a majority attack, is when a user or a group of users control the majority of mining power, which gives them the power to control most network events. These attacks are considered obsolete as they are easily spotted by the public, and the new blockchains created in the process are rejected.
Mining pools
As it has been previously mentioned, the block reward is given to the miner who solves the mathematical equation first. However, the chances of finding a solution to this problem as a single miner are now slim to none. This is why miners are joining their computational power in hopes of solving the puzzle as a unit and sharing the reward fairly. This is how mining pools are created. These pools are, as the word implies, pooling of resources by miners to split the reward equally among everyone in the pool according to the amount of work they contributed.
https://youtu.be/-UweJmM32L4
Chart Patterns
Chart patterns, or technical analysis, is how traders determine possible future price action direction by incorporating ‘technical’ tools onto their PC screens. The resulting patterns they
https://youtu.be/-UweJmM32L4
Chart Patterns
Chart patterns, or technical analysis, is how traders determine possible future price action direction by incorporating ‘technical’ tools onto their PC screens. The resulting patterns they
Chart Patterns
Chart patterns, or technical analysis, is how traders determine possible future price action direction by incorporating ‘technical’ tools onto their PC screens. The resulting patterns they see on their screens, including the current exchange rate of a Forex pair, while factoring in volume, time of day, recent and future economic data releases via fundamental analysis, provide an effective way of gauging future price action direction.
Forex trading only took off in the retail sector in the early 2000s. Before that, and largely thanks to the advent of the internet, technical trading was almost unheard of in the institutional Forex market. Today, retail Forex traders take for granted the myriad of available technical trading platforms such as the; Metatrader MT4 platform, Trade Station, Currenex, Ctrader, etc. These incredible platforms, which are mostly free to retail Traders, would have been an institutional traders dream come true in the 1970s, 80s, and 90s. Back then, traders, technical analysis depended on plotting exchange rates into a notebook or on a spreadsheet. However, time and technology have moved on, and the internet has allowed liquidity to increase exponentially year on year. People can now make a reliable living by trading in favor of recurring patterns that they see on their computer screens. It is quite amazing that many economies around the world are often affected, both negatively and positively, by exchange rate fluctuations because of patterns on traders’ screens which tell them to buy or sell.
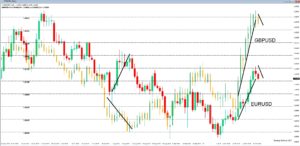
Example A
In the example ‘A,’ we can see a 1-hour chart of the GBPUSD pair. In the chart, we are only using Japanese candlesticks. We advise that you always read a chart from left to right because it tells a story. Traders typically draw their own trendlines, and that’s what we have done here. In this diagram at section ‘A,’ we can see that there has been a bearish trend. This was followed at section B’ buy a pull-back or consolidation and then continuation to the downside. This produced an upside-down V formation, which traders look for when considering a possible continuation in the downward trend. However, price stalls in section ‘C,’ which is littered with small candlesticks. Price action then slips into a sidewards momentum. These smaller candlesticks, some of which open and close at the same exchange rate, tells traders that there is a lack of liquidity in the market during this phase. Section ‘D’ is a continuation to the downside, and where price action has gone through the support line, we drew in at section ‘C.’ The continuation is short-lived, and we had a bullish pullback, again with the v-shape formation clearly evident. However, the bearish engulfing candlestick marked ‘E’ takes out all of the candlesticks in Section ‘D’ telling traders that a large amount of liquidity has gone through at this point and that the sellers are in command. Subsequently, we see price action continue to fall.
Example B
In example ‘B’ we have added Bollinger bands to our chart. Bollinger bands were developed by John Bollinger, whose book on the subject, “Bollinger on Bollinger Bands” (2001), was transcribed into over 11 languages and is widely used in the trading community. Bollinger bands plot deviations from the exchange rate onto a chart that materialize as two lines, one either side of the and outside of price action. The theory is that over 90% of price action will remain within the bands. Therefore, traders look for certain aspects to occur during the formation of the bands to help them with their trading decisions.
During the sell-off at section ‘A’ we can see that the bands are widening while moving in a downward direction. However, as volatility gains, price moves outside of the bands. But we can see that price action moves back inside the Bollinger bands to begin the V formation at section B. During the consolidation period at section ‘C,’ we can see that the bands move together to form a narrow tunnel. Typically traders will expect larger liquidity entering the market during times of bands expansion from a narrow contraction, and during the bottom of section ‘D,’ we see an increase in liquidity which pushes through the Bollinger bands, only for the bulls to buy the pair back inside. Subsequently, we see that the bearish engulfing candlestick marked ‘E’ pushes through the Bollinger bands to the downside, before buyers bring the pair back inside again. Price action then continues to the downside, while staying inside the Bollinger bands, until the bottom right-hand side of our screenshot, where we can see some tails piercing through the Bollinger bands, only for price action to pull the candlesticks back inside.
In diagram ‘D,’ we have added another favorite tool as used by technical traders: a moving average. The blue line is a 14 period, simple, moving average. It calculates the highest point and the lowest point of each of the previous 14 candlesticks and plots the average measurements on the screen in the form of a line. In our example we can see that once price action falls below our moving average at section ‘A’, it begins to form an invisible area of resistance, where price action moves up to it on a number of occasions at sections ‘B’, ‘C’, ‘D’ and ‘E’ before price action continues to the downside. Trainers typically use several moving averages on their screens in order to determine price direction, consolidation, continuation, and price reversal areas.
There are hundreds of technical analysis tools available to Forex traders. However, the more you have on your screen is not necessarily more of an advantage! In fact, too many analysis tools may hamper your trading by clouding your judgment. The best technical tool will always be the price action itself, which is a leading indicator. So, here at Forex.Academy, we recommend that you do not overload your screens with technical analysis tools. Keep things as simple as possible when deciding which technical tools to implement in your trading style and methodology.
What is an STO?
STO is an acronym that stands for security token offering. Crowdfunding in cryptocurrencies started with ICOs, while STOs came as a necessity. Similar
https://youtu.be/VJBM8X5p-mY
What is an STO?
STO is an acronym that stands for security token offering. Crowdfunding in cryptocurrencies started with ICOs, while STOs came as a necessity. Similar
What is an STO?
STO is an acronym that stands for security token offering. Crowdfunding in cryptocurrencies started with ICOs, while STOs came as a necessity. Similar to an ICO, an investor exchanges their funds and gets a token in return. However, there are differences between ICOs and STOs. Unlike an ICO, a security token represents an investment contract in an underlying investment asset, such as stocks, bonds, funds, real estate investment trusts (REIT), or even other cryptocurrencies.
Any financial instrument that bears some type of monetary value is considered a security. This means that, simply put, securities are investment products that are backed by real-world assets. A security token, therefore, represents the ownership information of the aforementioned investment product, rather than having inherent value by itself. Investing in traditional assets can now be improved by recording the investments on the blockchain rather than being written on a document.
As many people try to describe ICOs and STOs by comparing them to the IPOs, we will do the same. STOs are a hybrid between ICOs and the more traditional IPOs because of their overlap with both methods of investment fundraising.
STO vs. ICO
These two offerings are quite the same, but the token characteristics are different. STOs are asset-backed and are required to comply with regulatory governance. Most ICOs, on the other hand, have their tokens declared as a utility token. Tokens utility gives users access to the native platform or their decentralized applications. The purpose of the coin, therefore, is its utility and not its investment properties.
Due to not having to comply with any regulation whatsoever, the barrier to entry for companies to launch an ICO is much lower. Launching an STO can be quite a difficult task, as the intention is to offer an investment contract under securities law. Therefore, the platforms launching the STO have to have their project comply with the regulators from day one.
STO vs. IPO
STOs and IPOs have quite a similar process (once again), but STOs issue tokens on a blockchain while IPOs issue share certificates on traditional markets. Although both IPOs and STOs are regulated offerings, IPOs happen only when private companies that want to go public. Through the IPO process, they raise funds by issuing their company shares to accredited investors.
When it comes to STOs, tokens that represent a share of an underlying asset are issued on the blockchain to accredited investors. These assets can very well be shares of a company, but they can also be any other form of asset, such as a share in the ownership of a property, fine art, investment funds, etc.
STOs are also more cost-effective than IPOs, as they do not have to deal with brokerages and investment banker fees. IPOs, however, have to. STOs would still need to pay lawyers and advisors, but they wouldn’t have to pay people for access to the market. The administration that happens after the STOs fund-raising finishes is also more cost-effective than those of an IPO.
STO regulation
As with ICOs, STO regulation very much depends on individual jurisdictions. The United States Securities and Exchange Commission (SEC) is surely the biggest and most vocal regulator on the issue of how a security token is defined. They are also one of the key factors in deciding whether or not certain tokens are utility or security tokens.
ICOs will be considered a security if they fall under the definition of an investment contract, the SEC stated. This definition comes from the Howey test, which states that:
“An investment contract is (1) an investment of money (2) in a common enterprise (3) with a reasonable expectation of profits (4) to be derived from the entrepreneurial or managerial efforts of others.”
Tokens that pass this test by qualifying for all of the attributes are security tokens. If they fail the test, they are utility tokens.
The world’s outlook on STOs
The world has not agreed on its stance on STOs yet. Many countries have even banned STOs, while other countries are not yet clear on how to regulate STOs.
As an example, Thailand’s Securities and Exchange Commission concluded that Thai-related STOs launched in an international market break the law. However, in an article by the Bangkok Post, deputy secretary of the Thai SEC indicated that the commission has not yet decided how (and if) to regulate STOs.
Conclusion
Tokenization of securities is certainly a step forward in terms of technological progress. However, the road will not be a smooth one. Countries will have to decide on how to regulate STOs for them to reach their maximum potential.
Candlestick formations – The display of price information
There are many different ways that a trader can have access to the price of an asset.
[embed]https://youtu.be/pCh8iSCS8kk[/embed]
Candlestick formations – The display of price information
There are many different ways that a trader can have access to the price of an asset.
Candlestick formations – The display of price information
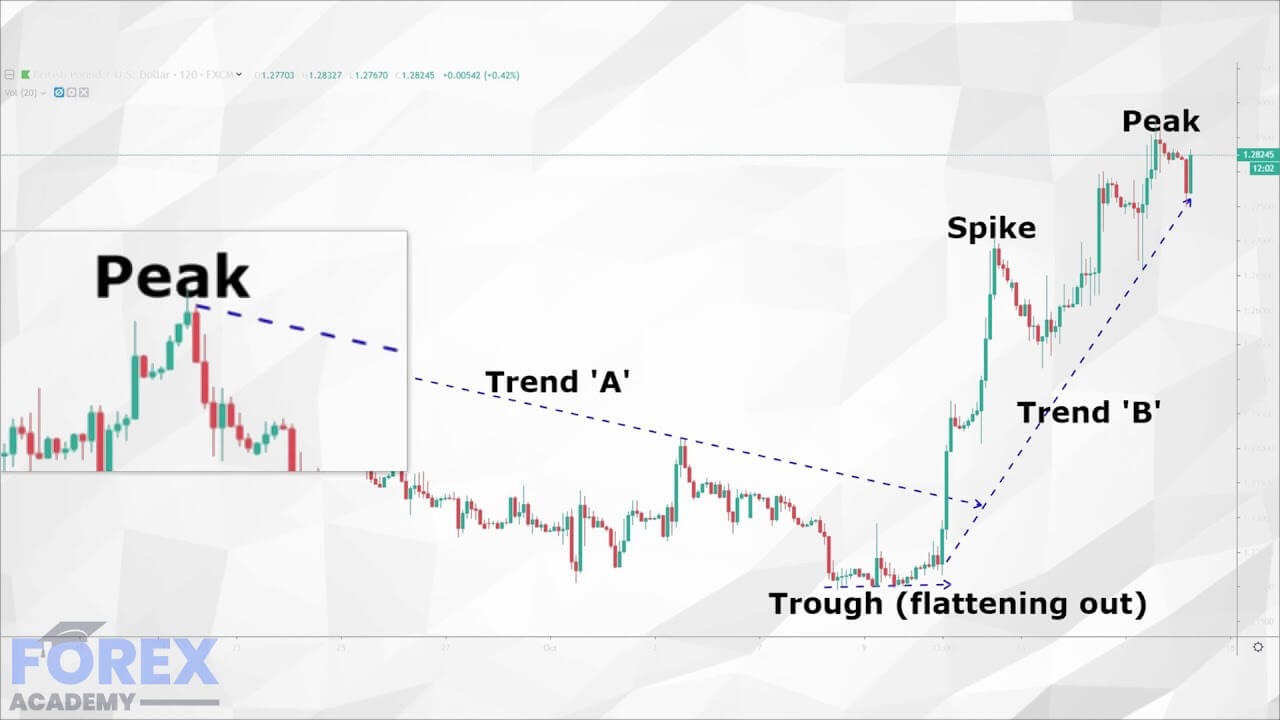
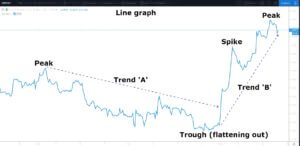
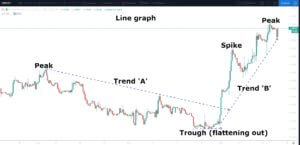
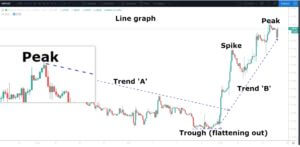
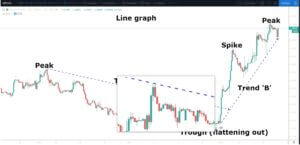
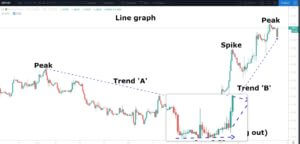
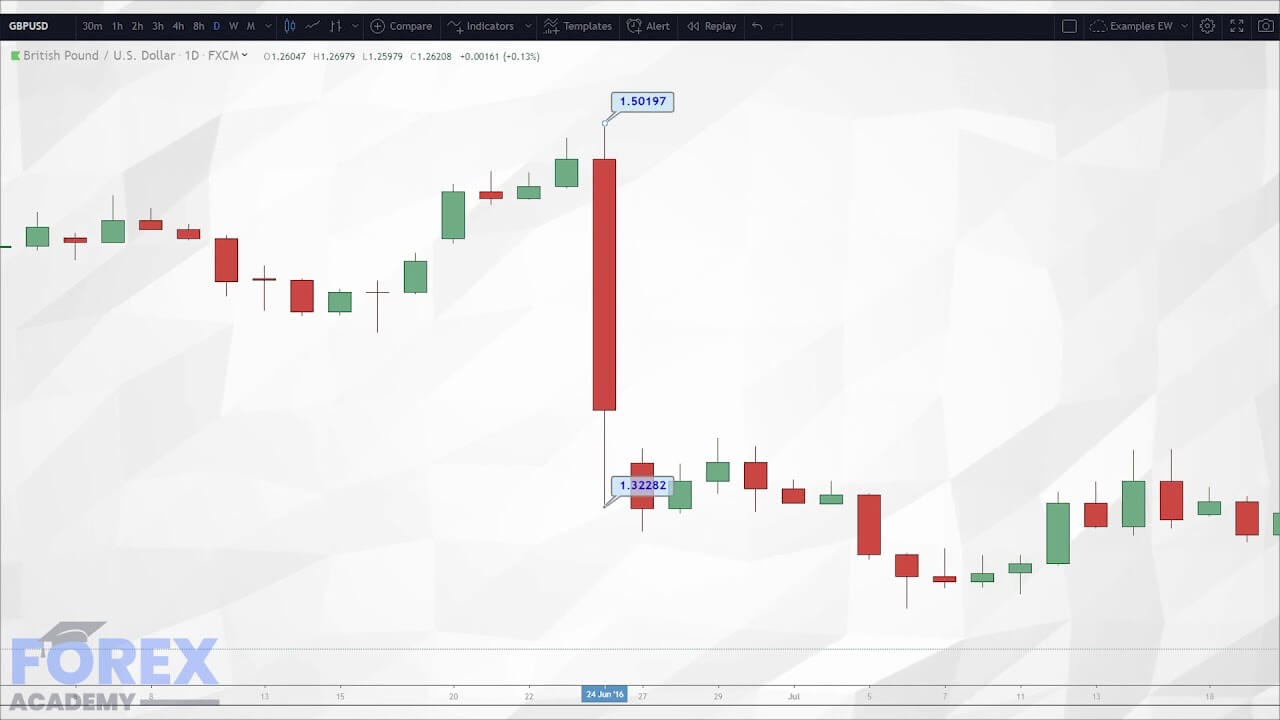
There are many different ways that a trader can have access to the price of an asset. In the Forex market, the most common ways that traders monitor the movements of exchange rates are by using line graphs, bar charts, Renko charts, tick or ticker tape charts. And one of the most popular ways of deciphering price movements is the Japanese candlestick.
Let’s look at some examples of exchange rate price action via three commonly used technical analysis tools.
Example ‘A’ is a basic line graph of the daily time frame of the GBPUSD pair, as denoted in the top left-hand corner of our chart. Time frames are shown here too. At the bottom of the chart along a horizontal axis, we can see time and the date, and the exchange rate of this pair is shown in the vertical axis on the right-hand side of the chart.
The line graph converts the price action of a currency pair onto a continuous line on a chart. As you would expect, the line goes up and down and sideways. However, just by looking at the line graph alone, it would appear to be almost impossible to try and ascertain future movements by this tool.
Example ‘B’ is the same daily time frame of the GBPUSD pair, but this time we are looking at a bar chart. Each bar opens at the beginning of the given timeframe, and in this case, opens and closes every 24 hours. Each bar consists of three lines: A vertical line to the left of the horizontal line, which denotes the opening of the bar; the vertical line which tells the trader the up-and-down movement of price action during this time frame; and another horizontal line to the right of the vertical which tells the trader where price action finished.
Let’s now turn our attention to example ‘C’: The Japanese candlestick. Each candlestick opens and closes along a vertical line. Again, this is the daily time frame of the GBPUSD pair. The candlestick offers a much greater visual representation of the exchange rate and therefore presents many opportunities to a trader with regard to potential future trends. The Japanese candlestick is the most widely used technical tool used by traders across the globe.
Japanese candlesticks were invented in the early 15th century by the Japanese government of the time. They were used to record price movements on Japan’s rice exchange. At this time, rice was not only the primary dietary staple, but it was also a unit of exchange.
Example ‘D’ is a typical candlestick shape that traders see regularly on their charts. We have marked the points where the candlestick opened and closed. If the candlestick closes above the exchange rate at the point of which it opened, it is considered to be a bullish candlestick. If it closes below the exchange rate at the point of opening, it is considered to be bearish. Candlesticks can also open and close at the same exchange rate.
However, in this example of a bullish candlestick, we can see a wick at the top of the candlestick and also one at the bottom. Therefore, a trader can determine that after opening, price action initially falls before reversing and rising to the top of the time frame, before falling again back to the close. In this case, we have two wicks, one at the top and one at the bottom. A trader can tell the total exchange rate covered by the candlestick by measuring between the low and the high points and also see pullbacks and reversals. The same principle applies to a bearish candlestick where price action is measured over the whole length of the candlestick, but where traders easily identify the opening and closing of price action for each time frame.
Each candlestick will have a different sized body and wicks dependent on the amount of volume going through at any given time. The basic principle is that the longer the body and the shorter the wicks, the stronger the volume. Traders are able to read the many different types of candlesticks, which are all given names, in order to depict the strength of a trend and volume in the market at any given time, and these will help them to predict trend formations, reversals, and consolidation of the exchange rate of any particular pair.
Diagram ‘E’ provides us with a snap-shot of a 1-hour chart of the GBPUSD pair, where candlesticks are used to show price action. In section ‘A’ of the diagram, we can see that the price action is fairly flat and trading in a sideways motion. However, candlestick number 1 pushes below the trend line and forms the basis of a downward move. The candlestick is also bigger than those preceding it, and the wick at the bottom is small, denoting strong volume to the downside.
After a period of uncertainty, price action becomes stronger to the downside, as denoted by the large candlesticks numbered 2 and 3. Price action continues the downward trend, however buyers push up price action at number 4, which is called a reversal hammer, and where indeed price action reverses to section ‘B.’ We now have a series of smaller candlesticks which denotes a thinning in volume, and where we can see some candlesticks open and close at the same exchange rate, telling traders that neither the buyers or sellers are in control at this particular moment in time.
Candlestick number 5 tries to push the trend to the downside, but reverses and forms a reversal hammer shape, and where we subsequently see price action move to the upside as per candlestick number 6 and 7. But we then see a trend reversal in candlestick number 8, which becomes an engulfing candlestick because it is larger than both 6 and 7. The strength of this candlestick denotes a potential increase in price action to the downside by taking out the previous two candlesticks, and we see further movement to the downside before price rises again. Incidentally, we have another price reversal hammer in section A where we have placed an X.
Here at Forex.Academy, we strongly recommend that you learn as many candlestick formations as possible because they are very commonly used within the trading community, and therefore this will give you an edge in your trading.
What is an ICO?
An Initial Coin Offering (ICO) is a crowdfunding method where idea creators issue a cryptocurrency and offer it to the general public in
https://youtu.be/q-CZPKHlvY4
What is an ICO?
An Initial Coin Offering (ICO) is a crowdfunding method where idea creators issue a cryptocurrency and offer it to the general public in
What is an ICO?
An Initial Coin Offering (ICO) is a crowdfunding method where idea creators issue a cryptocurrency and offer it to the general public in return for the project funding. ICOs are mostly used in underfunded projects. Investors usually have the option to pick Bitcoin or Ethereum as a payment method. However, in some cases, fiat currency is also accepted.
People invest in Initial Coin Offerings when they believe in the project and what it could do for the world. On top of that, successful projects would have the demand for their token increased, causing the price to increase. In other words, investors are hoping to get a good return on investment (ROI) as early supporters of that particular cryptocurrency project. Most ICOs offer their tokens at a discounted price to the early investors.
ICOs are compared to IPOs (Initial Public Offerings) on a regular basis. However, this comparison is quite deceptive and untrue. IPOs happen when established businesses go public and sell partial ownership shares in their company to raise additional funds. On the other hand, ICOs are mainly used as a fundraising mechanism for projects that have an idea but no funding or development (or they are at early development stages). Additionally, buying tokens during an ICO does not grant ownership of the company.
How does an ICO work?
ICO tokens are created on a cryptocurrency platform (in most cases, the Ethereum platform), and they have to follow the platform’s guidelines. In Ethereum’s case, following the ERC-20 token standard is obligatory. Along with Ethereum, other platforms support the creation and issuance of digital tokens, such as Stellar, NEM, NEO, Waves…
Taking the ERC-20 tokens as an example, a company will use the Ethereum’s smart-contract feature to create and issue its digital token. The token will have to fully comply with the ERC-20 protocol, which defines a set of rules for it.
The ICO starts once the tokens are created. The founders now need to convince the general public to invest in their project by participating in the ICO. The technical characteristics of the token, as well as the company’s goal, are described in a whitepaper, which is completely public and free for anyone to read.
Why do ICOs exist?
An ICO can be a very effective method of crowdfunding to reach a certain development goal. Startups can now have a project idea and no funds to start with, but an ICO will (if the project is good enough) help raise sufficient funds for the project to start. This gives a chance for good ideas to thrive even without enough capital, just by making it public and letting people choose whether to support it or not.
While new companies and startups represent the majority of ICOs, this does not have to be the case every time. Many large companies are just realizing how interesting the ICO market is. The public is also slowly beginning to understand the power of decentralization offered by cryptocurrencies. For these reasons, big companies are now doing their own ICOs to launch new projects on a blockchain-based system. They do it to decentralize their business as well as raise capital. This particular practice is better known as a “reverse ICO.”
ICO regulation
The growing number of ICOs (especially during the ICO boom of 2017) attracted the attention of regulators all over the world. They are trying to see how to classify ICOs and which regulations they should impose. If we are talking about the US, the SEC (US Securities and Exchange Commission), as well as CFTC (Commodity Futures Trading Commission), are trying to conclude how to approach the regulatory framework for ICOs and cryptocurrencies.
ICO sector regulation is still in the early stages, and most countries are uncertain on how to approach the subject. That’s the reason that there is no uniformity across countries. Some people argue that more regulation will bring legitimacy to the industry and make it even better, while others say that regulation goes again everything that cryptocurrencies are and that ICOs should be unregulated.
Some jurisdictions have declared all ICOs illegal, while other issued warnings to all potential investors to perform their due diligence before investing.
Conclusion
After the ICO boom of 2017, the number of ICOs has drastically reduced. However, the ICO industry is not a dying one. ICOs will continue to be a new and great way of funding new projects with great problem-solving ideas.
https://youtu.be/jjOGFmqCyno
Buying Rumour & Selling Fact – Forex Fundamental Secrets
When it comes to trading the markets, there are three main tools that traders use to in order to
https://youtu.be/jjOGFmqCyno
Buying Rumour & Selling Fact – Forex Fundamental Secrets
When it comes to trading the markets, there are three main tools that traders use to in order to
Buying Rumour & Selling Fact – Forex Fundamental Secrets
When it comes to trading the markets, there are three main tools that traders use to in order to try and gauge direction within the financial markets: fundamental and technical analysis, and trading based on sentiment. Within the scope of fundamental analysis lies a critical area based on market rumors, which are rife in all the various sectors that make up the financial markets.
Buy the rumor, sell the fact is something you may have heard of, but in any case, rumors tend to abound in all of the financial markets and these often present opportunities to buy and sell or hold assets. The saying, buy the rumor and selling news first entered the financial markets when traders picked up on chatter or news reports in the equity market that a company was doing better than expected and that this would be reflected during the earnings announcement season. This could lead to a better share price for the company and also better dividends. And therefore, this would lead traders to believe that the stock was undervalued and result in speculative buying of the stock, hence pushing up its share price. Speculative buying also results when rumors are going around that a company was about to merge or be taken over.
Another area in the equities market that is affected by rumors or hearsay is mergers and acquisitions. Sometimes CEO’s of companies will not make this type of information readily available to the marketplace during the negotiation stage, However, a secret meeting between the two heads of firm’s could be exposed by the media, and whereby investors speculate that a merger or takeover is imminent and this could cause a flurry of buying or selling of stocks in the two companies. But this could also cause selling in other companies – in the same sector – which might suffer because of a perceived diminished market share, in the event of such a merger or takeover.
On the flip side, rumors might surface that the company is not performing well, and this might lead to a sell-off. Therefore our adage of buy the rumor sell the fact can also mean the opposite, depending on the magnitude of the rumor, and especially if it subsequently turns out to be false, and which can cause extreme market volatility.
Buy the rumor and sell the fact works differently in the Forex space because obviously, we do not have mergers or acquisitions. However, analysts will speculate that governments are intending on raising or lowering interest rates. Traders might then take the analysts’ comments on board and start trading a particular currency pair in favor of the analysts’ report, which is just another way of saying rumor.
In recent years and especially with the advent of Twitter, the Forex market has become much more susceptible to buy the rumor sell the fact. This is partly due to the fact that news reporters are often well placed with governments’ lawmakers to obtain unofficial – as yet unreleased – information that could affect the economy of a particular country, and thus the value of its exchange rate.
Another area that has had a dramatic effect within the Forex market is the style of the presidency pertaining to the United States of America. President Donald Trump has his own unique style of governing. He regularly tweets on such things as his preference for low-interest rates in the United States. This type of comment often flies in the face of the Federal Reserve, and it is not uncommon for him to tweet on factors pertaining to the economy, such as imminent economic data releases, even occasionally tweeting in a somewhat biased manner about highly sensitive and anticipated non-farm employment results, which are of course subject to an embargo.
One of the biggest problems that retail traders face, within the Forest market, is that price action, while driven by rumor, is reliant on market perception of the reality of the anticipated news release. At this point, the markets might think that the current exchange rate warrants such levels, or perhaps that there has been an overall exaggeration at which point a sharp reversal in price action might occur. Another danger is that traders who have ignored price action based on rumor, then enter the market expecting a continuation in trend, only to be thwarted by a reversal due to traders who got in during the early stages of the rumor then deciding to take their profits and causing a potential reversal or consolidation.
As well as rumors in the financial markets, another all too common a feature nowadays is fake news. It is not unheard of for fake Twitter accounts to be opened purporting to relevant players, such as respected analysts and reporters, and whereby fake news is released into the market which can greatly affect price action having been inadvertently being picked up in good faith by major news channels and filtering its way into to the market. While this type of fake news is generally quickly shot down in flames, that is not to say that it has not already caused extreme volatility in the process.
That is why here at Forex.Academy, we recommend that traders be mindful of rumor and speculation in the Forex market and trade with the necessary caution at such times. Always be prepared and expect the unexpected!
Buying & Selling The Forex Market – The Path To Financial Freedom
There is an old adage in the financial markets: buy at the bottom and sell at the
Buying & Selling The Forex Market – The Path To Financial Freedom
There is an old adage in the financial markets: buy at the bottom and sell at the
Buying & Selling The Forex Market – The Path To Financial Freedom
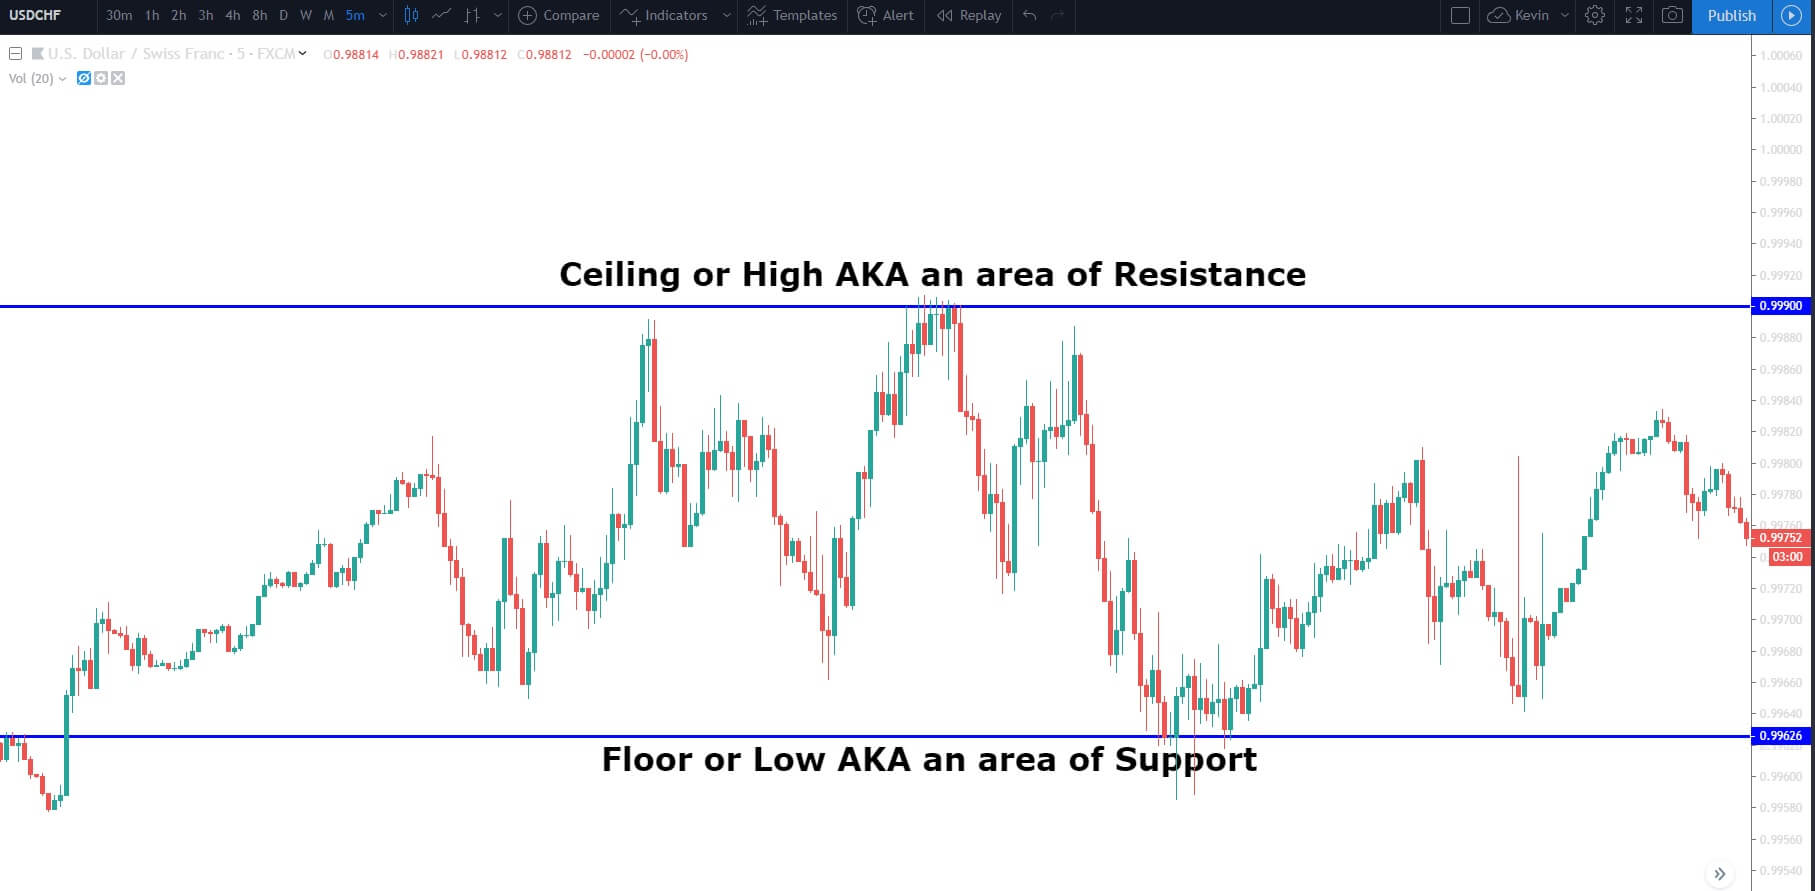
There is an old adage in the financial markets: buy at the bottom and sell at the top.
This might be better applied to the second-hand car or housing markets than the financial markets. In truth, it is meaningless in the Forex market, but it has strong connotations.
Within the Forex market, a currency pair, in theory, has no top and no bottom! Rather one currency can be valued against another currency as having an intrinsic value that fluctuates either below, above, or at parity with the counter currency within the pair being traded.
Therefore within the Forex market, we have a multitude of various levels that can be broken down into floors and ceilings, which are also known as areas of support and resistance. And so as traders, we look to buy and sell currency pairs from areas of support up to areas of resistance, or to sell them from areas of resistance to areas of support. We then look for continuations or signs that we should exit our trades.
The absolute best way to ascertain where these areas of floors and ceilings are is by way of technical analysis. Traders then use trend lines and other technical tools on their charts in order to highlight where the price action of a pair will bottom or top out and reverse. Of course, traders would love to execute a trade and have it roll on in their favor for a couple of hundred pips every trade. In reality, it hardly ever happens like this. Even the most reliable technical analysis, set-ups will not work 100-percent of the time. What really matters most is that a trader’s methodology or style means that they consistently win more trades than they lose and that each winning trade is greater than each losing trade. And therefore, traders must incorporate tight stop losses while utilizing their tried and tested trading criteria.
Now let’s break down a buy trade to its bare bones. But before we do so, let’s just go back to our adage for one moment: buy at the top and sell at the bottom. As traders in the Forex market, we have to establish where the multitude of tops and bottoms are in order to give us an advantage in our trading. When you break trading down into its base elements, traders simply like to push an asset as far as it will go. In other words, in Forex, they buy a currency pair until it runs out of steam and stalls at a ceiling, and then after a period of consolidation, they will either continue buying it, or they will reverse the process and start selling it far as they can.
Example A
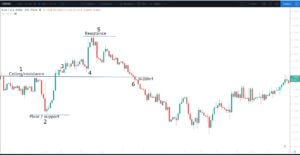
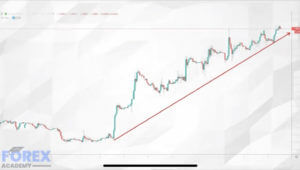
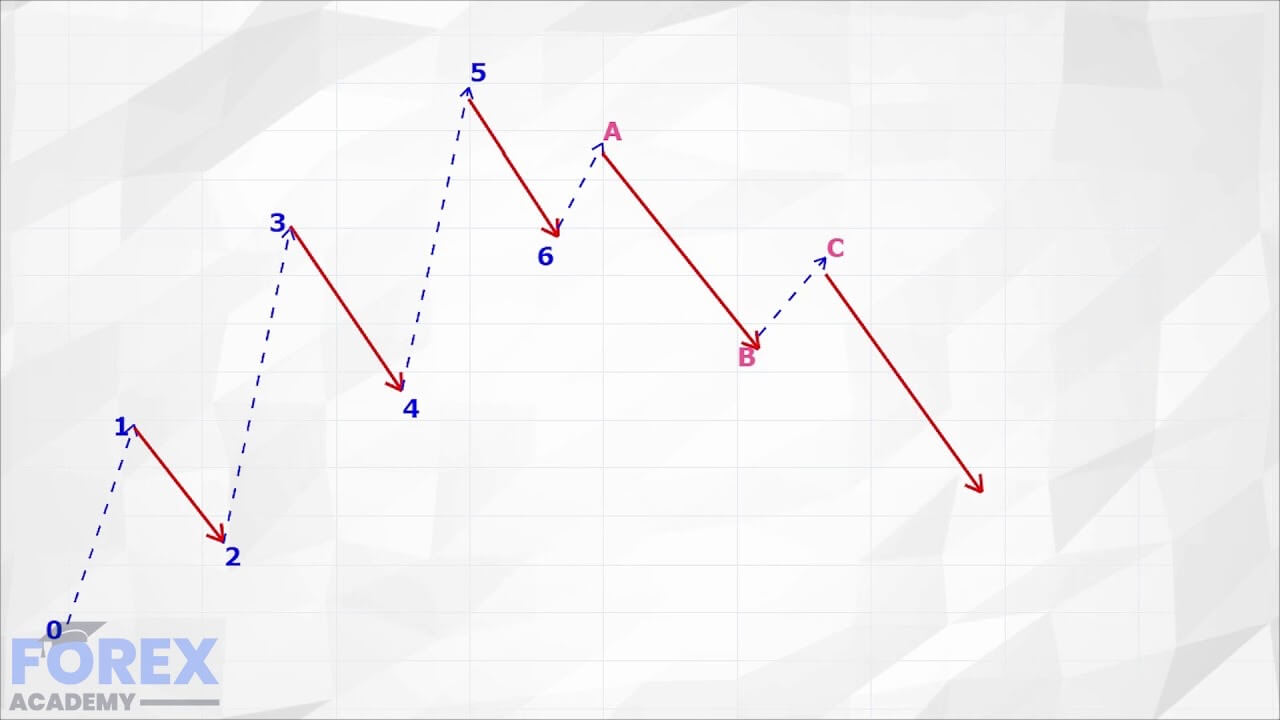
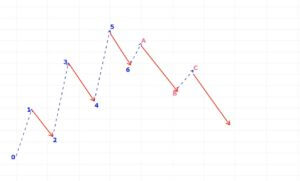
Let’s turn our attention to example ‘A.’ This is a 4-hour chart of the EURUSD pair. Always read a chart from left to right because it tells a story. Here we can see that price action was unable to go rise above the ceiling or resistance level at position 1. Traders then pushed the pair down by selling it to the area of support at position 2. Price action then goes up to the previous ceiling, and this time punches through at position 3. Price action moves a little bit higher before falling back at position 4 and where our previous ceiling has now become an area of support. Traders now start buying the pair all the way up to another area of resistance labeled 5. When they could not push it any higher price action moves down to the previous area of support at position 6 and this time punches through. We then find a continuation trend to the downside.
Example B
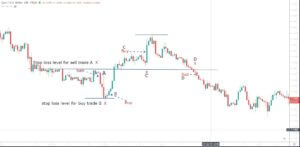
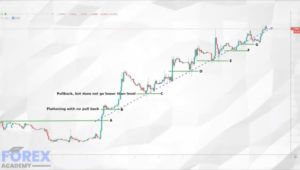
Let’s take a look at the example ‘B,’ which is the same as our previous chart of the EURUSD pair, but where we have Incorporated some potential buy and sell levels. Again, using our levels of support and resistance, we are looking for opportunities when the market pulls away from these levels. At position ‘A,’ we find that the market is moving below the area of resistance, which presents a selling opportunity and where a stop loss marked ‘X’ is placed just a few pips above the resistance line.
When price stalls to the downside, we are presented with a buying opportunity at position ‘B,’ and where our stop loss should be placed a few pips underneath the lowest candlestick at the support area.
At position ‘C’ price action fails back to the support area, we get a second buy opportunity as marked by the arrow and where traders would typically place a stop loss just under the previous resistance level and which has now become a support level. Now it could be that traders are still long having bought the pair at position ‘B.’ But later in the chart, when buyers lose momentum we see price action fall below the support line we have a sell opportunity at position ‘D’ and where our stop loss should be placed a few pips above this level of resistance.
So when it comes to buying and selling a currency pair, we look for defined areas of support and resistance and, more importantly, areas where traders push through these levels, which is typically when we might see a continuation in price action in either direction.
https://youtu.be/YVwz52RR7UE
Using Volume As A Form Of Technical Support – Forex Tips & tricks
One of the problems for retail Forex traders is that there is no tool currently
https://youtu.be/YVwz52RR7UE
Using Volume As A Form Of Technical Support – Forex Tips & tricks
One of the problems for retail Forex traders is that there is no tool currently
Using Volume As A Form Of Technical Support – Forex Tips & tricks
One of the problems for retail Forex traders is that there is no tool currently available that tells them how much volume – in terms of currency amount – floating around in the market at any given time. The Forex market is not like the stock market, where we can see amounts of stocks and shares being bought and sold. Although some brokers will tell you what percentage of the traders are either long or short on a currency pair, it doesn’t give you the whole of market volume. And because there are so many market makers and so many brokers out there, it is impossible to determine the amount of volume – in terms of currency – in the market at any given time.
Therefore traders have to use their technical analysis to establish when volume is high and low in the market. One of the best ways to establish volume is to look at the size of Japanese candlesticks. For example, the longer the candlestick – and especially those which have very short wicks at either end – usually means a large volume of currencies are being simultaneously bought and sold, pertaining to the particular pair a trader is focused on.
Logically, the times when traders are more likely to see large volumes going through in a pair is likely to be around the times of economic data releases, in particular, those relating to GDP, interest rate decisions, employment, imports and exports, and manufacturing.
We might expect to see smaller candlesticks and, therefore, smaller amounts of volume in a pair in areas of price congestion, price consolidation, and also quiet times in the market, such as time zone overspills.
Let’s look at the example ‘A’
This is a 4-hour chart of the GBPUSD pair, also known as Cable. We have split the price action in this period into three sections marked, ‘A,’ ‘B’ and ‘C.’ In area ‘A,’ price action has gravitated to the bottom, which is a key level of support at the 1.22 exchange rate. This is technically a period of consolidation and sideways trading because no trend has been allowed to develop to the upside or downside. Let’s now turn our attention to the area ‘B,’ where the candlesticks are very small and where price action is merely fluctuating around the 1.22 to level. The candlesticks are very small, and this can only mean one thing: that volume is thin in this area. Now let’s take a look at area ‘C.’ We have marked the first candlestick as number 1 and where price action has accelerated away from the 1.22 level to just above the 1.24 level; again, this is a key level. We also note that there are small wicks at either end of the candlestick. This candlestick has also taken out or engulfed the preceding candlesticks in areas A and B. This is a strong move to the upside, and was a lot of volume has gone through during this 4 hour our time frame. Candlestick number 2 is also a large candlestick, although it does have a small wick at the top denoting a decrease in volume towards the end of that period. The strong push higher with candlestick 1 and 2 confirms large volume, which kicked off what turned out to be the beginning of a trend higher in this pair.
Traders need to be mindful of potential areas of support and resistance while factoring in economic data releases, which could subsequently reverse or cause a continuation of a trend in price action.
Useful tools to be able to gauge support and resistance during technical analysis are; Fibonacci retracement, stochastic overbought and oversold, and being mindful of possible Elliott waves forming.
One key area to focus on in order to fully understand volume in the markets is an understanding of the psyche of institutional traders.
Let’s imagine that an institutional trader comes to his or her desk at 7 AM in the morning, bright and breezy, and looking for the earliest opportunity to make money for their investment firm.
Now, this guy or girl may be on a salary of over €/£/$100.000, for example, and also gets a big fat annual bonus cheque. This puts them lots of pressure to make money.
Therefore at the beginning of each session, whether it be the USA, Asia, Europe, or the United Kingdom sessions, you will find that volatility usually picks then. Therefore Forex Traders, we need to be mindful that volatility equals volume, and the greater the volume, the greater the risk of larger swings in price action.
https://youtu.be/9ON1S4_EMaM
Cryptocurrency Coin vs. Token
Before we jump into the comparison, let’s start with understanding the definition of cryptocurrencies. Cryptocurrencies are digital currencies that are secured with encryption. This
https://youtu.be/9ON1S4_EMaM
Cryptocurrency Coin vs. Token
Before we jump into the comparison, let’s start with understanding the definition of cryptocurrencies. Cryptocurrencies are digital currencies that are secured with encryption. This
Cryptocurrency Coin vs. Token
Before we jump into the comparison, let’s start with understanding the definition of cryptocurrencies. Cryptocurrencies are digital currencies that are secured with encryption. This encryption is created by using cryptography, which is simply the use of encryption techniques to secure and verify the transfer of transactions.
Bitcoin is considered the first decentralized cryptocurrency. It is powered by blockchain, a public ledger that records and validates all transactions that happen on it. Even though Bitcoin was not the first cryptocurrency, its creation is extremely important as it is the first distributed and decentralized one. The creation of Bitcoin managed to start a whole market of other cryptocurrencies (coins and tokens) that are regarded as cryptocurrencies even though most of them do not fall under the definition of a “currency,” but rather try to solve a different problem in society.
Cryptocurrency Categorisation
As previously mentioned, the term cryptocurrency is not completely accurate for most cryptocurrencies. In order for a cryptocurrency to be considered a currency, it technically needs to represent a unit of account, a store of value, and a medium of exchange.
These currency characteristics are inherent within Bitcoin, and since the whole cryptocurrency industry started with Bitcoin’s creation, the rest of the cryptocurrencies began being called currencies. In order to better understand the nature of cryptocurrencies, there are a couple of categorizations. We will talk about the most common one today. Cryptocurrencies can be separated into:
Coins (Altcoins), Tokens.
Coins
Alternative cryptocurrency can also be called altcoins or simply “coins.” Altcoin simply refers to coins that are not Bitcoin. Most altcoins came to life as a fork of Bitcoin, built using Bitcoin’s original protocol with a couple of changes to its underlying codes. These changes are, even though seemingly small, what actually sets these new coins apart from Bitcoin, as they offer a different set of features to it.
A concept of modifying open source codes to create new coins is called hard forks, while a change to a code that does not create a new cryptocurrency is called a soft fork. A few examples of altcoins that came from Bitcoin’s code are Namecoin, Litecoin, Dogecoin, Bitcoin Cash, Bitcoin Private, Auroracoin…
However, not all altcoins came from Bitcoin’s code. There are altcoins that have created their own Blockchain as well as a protocol that supports their native currency.
These coins include Ethereum, Ripple, Bitshares, NEO, Waves. What sets altcoins apart is that they each possess their own independent blockchain. This blockchain is where all transactions of their native currency occur.
Tokens
Tokens are considered a representation of an asset or utility that resides on top of another blockchain. Tokens do not have their own blockchains as altcoins do. They can represent basically any asset that is fungible and tradable. This could range anywhere from commodities to loyalty points.
Creating a token is a much easier task than creating a coin. This is simply because the code from a particular protocol does not have to be modified in order to create a token. Platforms such as Ethereum or Waves offer certain guidelines which, if followed, allow anyone to create a token. Creating tokens is made possible through the use of smart contracts. Smart-contracts are programmable computer codes that are self-executing as long as the terms are met. They don’t need any third-parties to operate.
As tokens built on the same blockchain have the same template, they share many characteristics. This provides a standard interface for interoperability between tokens, which allows people to store different types of tokens on a single wallet. A great example is the ERC-20 standard on the Ethereum blockchain, which has been used to create over a thousand tokens. Most (if not all) of these tokens can be stored on ERC-20 wallets.
Tokens are mostly created and distributed through an Initial Coin Offering (ICO). An ICO is simply a way of crowdfunding where developers fund their projects through the release of a new token or a promise of a token. The ICO market has been filled with successful as well as very unsuccessful projects. There were also a lot of scams on the market as people were buying anything and everything during the time of the cryptocurrency price boom of late 2017. Nowadays, the ICO market has died down compared to 2017 but is still active. However, people are a lot more cautious when it comes to where they invest their money.
Final Thoughts
The main difference between coins and tokens is in their structure, where coins are separate currencies with a separate blockchain, while tokens are cryptocurrencies that operate on top of an already-made blockchain.
When it comes to the number of coins and the number of tokens, the majority of cryptocurrencies in existence are tokens as they are simply easier to create.
https://youtu.be/wbbNvtabkSo
Why do we need private cryptocurrencies?
One of the most essential features, as well as one of the main reasons that cryptocurrencies were invented, are the anonymity and
https://youtu.be/wbbNvtabkSo
Why do we need private cryptocurrencies?
One of the most essential features, as well as one of the main reasons that cryptocurrencies were invented, are the anonymity and
Why do we need private cryptocurrencies?
One of the most essential features, as well as one of the main reasons that cryptocurrencies were invented, are the anonymity and privacy features. The fact is that most people do not care enough about privacy and anonymity as they believe that these features only important to fraudsters and criminals. However, ordinary people do need privacy to protect their everyday life.
The past decade has brought us various cryptocurrencies that try to fix specific problems in society. Privacy coins became increasingly popular because they provided privacy features that other cryptocurrencies only could not.
What are privacy coins?
Privacy coins are cryptocurrencies that encrypt its transaction by using a technology called “zero-knowledge verifications” or similar private technology. When a blockchain has privacy, its users can transact on it with complete anonymity as well as keep their wallet balances completely private.
Some of the most popular privacy coins include:
Monero
Zcash
DASH
PIVX
Verge
Particl
Bitcoin Private…
Let’s touch upon some important things about privacy itself as well as privacy coins (both good and bad).
Privacy matters
Keeping user’s information private lessens the risk of monitoring, surveillance, or even manipulation coming from governments or any other authority. The more is known about a user, the easier the person becomes to monitor and control. Living in this day and age leaves us exposed to various data mining technology as well as another form of information collector technology that can be used and abused.
Privacy is the only thing standing between people and external control, personal attacks, companies, and other individuals. When it gets ignored and marginalized, it allows third parties to collect your data. Every web search on a search engine or social media post acts as an information carrier which can be accumulated over time to make a detailed digital profile.
It’s about the freedom of thinking and expression
Every human being should be guaranteed freedom of thought and expressing themselves. This freedom is a necessity, but it has lately been entirely blurred by censorship and third-party control. Privacy gives people enough protection for them to feel free and be themselves.
It’s personal – Financial Safety and Reputation
Neglecting your financial privacy can attract various forms of fraud, theft, and danger. The same thing applies to cryptocurrencies as well, as most of them are only pseudonymous but are also quite transparent. The wallets whose private keys leaked have been hacked, damaged, or infected with malware.
The list of exchanges that have been hacked is ever-growing, as they are the easiest to break into. All of the funds are stored on a few addresses as centralized exchanges keep their customers’ keys to themselves. Privacy coins are here to help manage risk when it comes to any attempt of fraud or theft.
If we move away from finance, we can also include reputation as a significant factor that requires privacy. Every person on this planet has things they wouldn’t want the public to know or see. Some personal information is just not meant for being on display. Privacy features help people stay anonymous and safe from any information theft, which could result in reputation damage.
Privacy is even more than personal
Talking about privacy is often associated with only the privacy of an individual. However, that should not be the case. Privacy is only real when it’s applied to the whole system of network users as well as exchanges. One user’s carelessness about security could potentially leak information that extends further than most people imagine. That’s why secure systems, rather than secure individuals, should be a priority.
Privacy coin disadvantages
Privacy coins bring a solution to all the problems mentioned above. However, they also bring some drawbacks to the table along with the advantages that they offer.
Various governments, as well as external authorities, are frightened that privacy coins offer the perfect mechanism for concealing criminal operations. Offering the option for untraceable money and information transfers can be a threat to security. Robert Novy, Deputy Assistant Director of the Secret Service’s office of investigations, announced that privacy coins are “one of the greatest emerging threats to U.S. national security.” On top of that, Japan (which is usually quite open to cryptocurrencies) has put a blanket ban on any cryptocurrency exchange, which allows its users the obfuscation of its transactions.
The evidence suggests that financial regulators are undoubtedly anxious and afraid of how introducing full privacy could affect their control over the system. They are slowly but steadily crafting policies that will shape the future of using privacy coins.
https://youtu.be/MctYxXifbes
Correlated Market’s – Understanding Which Pairs Affect Each Other
When we talk about correlation in the financial markets, we are looking for assets across all the financial classes
https://youtu.be/MctYxXifbes
Correlated Market’s – Understanding Which Pairs Affect Each Other
When we talk about correlation in the financial markets, we are looking for assets across all the financial classes
Correlated Market’s – Understanding Which Pairs Affect Each Other
When we talk about correlation in the financial markets, we are looking for assets across all the financial classes, such as stocks, Forex, bonds futures, commodities precious metals and oil, etc., which trade positively or negatively against each other, either for brief or sustained periods. And so in Forex trading, we seek other currency pairs or other assets from these classes to assist us in our trading decision making, especially when we know that we can rely on correlation due to historical reliance.
As an example, in the stock market, we often find that if a major bank announcers a large loss due to underperformance you might find that there is a knock-on effect in the banking sector, causing bank stocks to fall due to the fact that the market perceives a correlated risk in this sector. This was particularly true in the 2008 market crash. Stock market traders might consider trying to counter this by buying stocks in utilities companies and firms that manufacture consumer staples, which are usually seen as more safe haven stock. In this example, traders look for positive correlation by buying utilities and consumer staples producers, and negative correlation in selling banking stocks in order to balance their portfolios.
There are many ways to measure correlation, and the larger the financial institution, the more complex measurements are used to define values in correlation, such as; Correlation Brownian motions, The Binomial correlation coefficient, Copula correlations, and others.
The basic measurement is called a Correlation Coefficient and is calculated within a range between -1 and +1. A perfect positive correlation has a correlation coefficient of +1, where currency pairs will move in the same direction 100% of the time. A perfect negative correlation is measured at -1 and means that the two currency pairs will move in the opposite direction 100% of the time. And if the correlation is 0, the two currency pairs are said to have no correlation and will act independently of each other.
We often find positive correlation within the precious metals sector, where silver will move either up or down in line with gold. An example of a negative correlation would be between gold and the US dollar. If we think about this logically, gold is valued in US dollars, and therefore for if the price of gold is rising, it stands to reason that the value of the dollar must be falling in value. Therefore some Traders will buy gold when the value of the dollar is falling and vice versa. See example ‘A.’
When looking for correlation on equities we find a positive correlation between the Dow Jones, the NASDAQ 100 and the S&P 500, and this is because these indices are priced in dollars and when the US economy is strong we would expect that these three indices are correlated positively to the upside, and vice versa when their economy is weak. Also, if the US has a strong economy and, therefore, we experience positive correlation between the indices, then we might expect this positive correlation to spill over into global equities. Again the opposite would
apply in a US downturn.
Another area we would expect to see positive correlation would be the bond market and especially when it comes to US and German 10 year treasury bonds, which typically move in sync with each other. Another positive correlation is seen in the oil markets where US, Canadian, and European oil stocks are heavily correlated, being supply-driven, and where the price is affected by the global economy outlook.
Great, so we know that correlation exists in the market and that traders use correlation to adjust their portfolios, but how can it help us in the retail Forex market? First and foremost, the fact that we know it exists already helps us because now we can use it as a tool or leading indicator in order to support our trading view of a particular currency, for example, USDCAD. This pair is heavily influenced by the fluctuations in the oil market. We can see this in action, in the example, ‘B.’
Here we have overlaid the USDCAD pair with US oil on a daily chart. The magenta trend line helps to define areas where USDCAD and especially when the price of oil is moving higher from the 10th to the 12th of June 2019, and the opposite is true between the 18th September to the 4th October 2019.
This is because a major contributor of the Canadian economy GDP is their production and subsequent sale of oil into the global oil market. Therefore when we find the price of oil tumbling, we might see the value of the Canadian dollar to fall in relation to the US dollar due to a negative correlation.
Also during the last few days, we have seen a rapid appreciation of the British pound to US dollar and whereby this rally was followed by the Euro against the US dollar which acted as positive correlation between the two pairs, and which largely came about because of positive sentiments regarding the eurozone and United Kingdom withdrawal agreement. See example ‘C.’
Where we see negative around the beginning of August 2019 and positive correlation during mid-October 2019. Correlation can be seen in the most unexpected places, such as, for example, ‘D,’ between the CHFJPY and EURUSD pairs, so it’s worth looking out for examples by studying your charts regularly.
The thing to bear in mind when it comes to correlation in the financial markets is that the markets have an ebb and flow to them, and things are constantly changing, and therefore correlation between assets should be seen as a fair-weather friend who comes and goes when they feel like it.
https://youtu.be/urtMhx5oBls
Assessing Directional Bias – Predicting Long Term Trends
Directional bias and personal bias, i.e., the feeling that the markets will either go up or down, should not be
https://youtu.be/urtMhx5oBls
Assessing Directional Bias – Predicting Long Term Trends
Directional bias and personal bias, i.e., the feeling that the markets will either go up or down, should not be
Assessing Directional Bias – Predicting Long Term Trends
Directional bias and personal bias, i.e., the feeling that the markets will either go up or down, should not be confused because they are two entirely different factors relating to trading.
When it comes to personal bias, a lot of traders are right, but not necessarily at the right time! In fact, one of the safest bets in trading is that traders who hang on to trades that are going against them, because they have a biased opinion of the market, are the types of traders who regularly lose money. Therefore, the longer you hang on to a losing trade because of your biased opinion about the market, the more likely you are negatively affect your win to loss ratio.
There is an old saying in the market is; buy the rumor and sell the fact! And rumors abound in the markets. In fact, more so now than ever before, and especially with the advent of Twitter and the myriad of news release platforms. Indeed, it will probably have been from one of these that you formed your biased opinion in the first place.
Another problem with personal bias, and especially when it comes to retail traders, is that at what level do you define the value in a given exchange rate? A level that might seem correct to you might not be the same level as a large hedge fund, or institution, or, more importantly, a sovereign wealth fund or government!
When it comes to directional bias, traders want to see that their technical tools are working hand in hand with fundamental analysis and sentiment. After all, when we are all singing from the same hymn sheet, so to speak, this is when primary trends tend to develop.
So, if you do have a personal bias towards the market direction, the best time to run with that (to open Spot trades) is when you have the technicals, fundamentals, and sentiment backing you up. In other words, wait for the market to come to you and don’t go chasing it!
Let’s take a look at example A. This is the British pound against the US dollar, also known as Cable. The best way to read a chart is from left to right because it tells a story. In this particular chart of the 1-hour time frame, we can see that price action levelled off at the 1.22 exchange rate. Prior to this, directional bias was to the downside for this pair. This was due to the fact that Britain is getting closer to the 31st of October deadline, where it could possibly leave the European Union without a withdrawal agreement in place, thus crashing out, which would have been detrimental for the British economy. But at the point on the chart where the upward arrow has commenced, the European Union agreed to reopen the Withdrawal Agreement negotiations and thereby potentially opening the door to a managed divorce between the UK and the eurozone. Market sentiment changed at this point. Fundamental analysis also changed at this point because when the United Kingdom voted in the 2016 referendum to leave the European Market, the danger was that we would leave without a deal, and this caused the depreciation of the pound. However, with a mutually beneficial Withdrawal Agreement in place and backed by a strong economy, the pound was heavily perceived by the markets to be undervalued and, therefore, ready for a bull run.
The subsequent strong push higher in Cable to the 1.24 level and the lack of a pullback from that exchange rate meant that technical traders could see that everything was in position for a continuation in directional bias to the upside. And so from the 1.22 level, it was a case of when to get in and buy into the potential bull run during pullbacks and corrections.
Let’s go back to our chart and take a look at example ‘B,’ where we have added a blue trendline and some areas of support and resistance. The first thing to point out is that a previously a ceiling, just below trendline ‘A’ has been breached to the upside. Price action continues to just above trendline ‘B,’ where we see a slight pullback and then a flattening of price action. Level ‘B’ then becomes a level of support. This came about shortly after an announcement by the European Union to reopen the UK Brexit Withdrawal Agreement and enter into fresh negotiations. Price action continues to surge before pulling back to the area of support marked ‘C.’ Price continues to move up to various points or resistance before pulling back to areas of support found at ‘D,’ ‘E,’ ‘F’ and ‘G,’ thus providing traders with a strong directional bias the upside. Each level of support is defined by the blue trendline, which is drawn at the base of the pullbacks and where this trendline acts as a simple moving average.
Here at Forex.Academy, we strongly recommend you incorporate your own trading style and methodology with technical and fundamental analysis and market sentiment and let the trend be your friend.
Confidentiality and privacy (financial and in general) are becoming more and more important nowadays as the world has pretty much given up on privacy
https://youtu.be/o0-w9g9TVxw
Anonymity in cryptocurrencies
Confidentiality and privacy (financial and in general) are becoming more and more important nowadays as the world has pretty much given up on privacy
Anonymity in cryptocurrencies
Confidentiality and privacy (financial and in general) are becoming more and more important nowadays as the world has pretty much given up on privacy with the expansion of the internet. Cryptocurrencies have given users an option to protect their financial privacy. These cryptocurrencies are based on cryptographic protocols that act as security methods. By utilizing these protocols, all the transactions are safe, irreversible, and do not contain any personal information whatsoever.
Privacy and anonymity are one of the most important factors that lifted cryptocurrencies in the eyes of potential users. However, we have to make a distinction between “anonymity” and “pseudonymity” and what they represent, as well as which cryptocurrencies possess these features.
Simply put, anonymous transactions are transactions that can’t be connected to any person/user. But are cryptocurrencies anonymous?
Bitcoin’s anonymity
Bitcoin is often described as anonymous because people can send and receive transactions without actually revealing their identity. However, the truth is a bit different.
Even though Bitcoin does not tie an identity to a person, all Bitcoin transactions are stored publicly and permanently on the Blockchain. This means anyone can see anyone’s balance as well as transactions. Even the identity of the user behind an address can be cracked down if an address is used to purchase goods or services outside the “system.”
Most blockchains aren’t truly anonymous but rather pseudonymous, and that includes Bitcoin. Transacting in Bitcoin is like writing under a specific pseudonym. If the pseudonym is ever tied to one of the transactions, everything done under that pseudonym is also tied to the account.
People may say that full privacy is what they want, but pseudonymity and having no anonymity is exactly the argument against people saying that Bitcoin can be used for illegal transactions. However, if full and complete privacy is required, then people should turn to a branch of Cryptocurrency called “privacy coins.”
Private cryptocurrencies
Unlike Bitcoin, every transaction involving so-called “privacy coins” obscures the digital addresses of the sender and the receiver. Not only that, but the network also obscures the value of the transaction. This feature offers privacy coin users near-total anonymity.
We will cover a few privacy coins with the biggest market capitalization to show what they have to offer to the market:
Monero;
Dash;
Zcash.
Monero
Monero is the biggest privacy coin by market capitalization. This is most likely due to a lot of people believing that this cryptocurrency is the most anonymous coin on the market. Monero is based on CryptoNote, a privacy protocol that implements ring signatures which obfuscate payments in order to ensure anonymity when both are sending and receiving funds.
However, throughout time, Monero has evolved far beyond CryptoNote. The development team behind Monero combined CryptoNote’s ring signatures with Greg Maxwell’s Confidential Transactions to create Ring Confidential Transactions (RingCTs), which only obscure senders but also hide the transaction amount. Monero is constantly improving and implementing new features, such as giving its users the option to hide their IP address and geographic location through garlic encryption and routing.
Dash
Dash, previously known as Darkcoin, came to life as a fork of Bitcoin in 2014. Even though Dash includes privacy features, this cryptocurrency also tries to achieve other features such as Portability, Inexpensiveness, Divisibility, Speed.
When talking about Dash’s privacy features, its users have two options. Dash gives you the option to send funds PrivateSend or through a regular network. PrivateSend implements a feature called “CoinJoin,” which mixes the sent funds with other people’s PrivateSend funds before sending them to the recipient. The coins that a recipient receives are not in any way associated with the wallet from which the transaction was initiated.
Zcash
Zcash is another extremely popular private cryptocurrency. It utilizes a feature called Zero-Knowledge Succinct Non-Interactive Arguments of Knowledge (or simply zk-SNARKs). Zk-SNARKs validate the transaction without ever having to reveal the details of the transaction. This feature makes it possible to send ZEC, Zcash’s currency, while the sender’s address, the recipient’s address, as well as the amount is never compromised or revealed.
Even though Zcash developers built this cryptocurrency on the original Bitcoin code base, these two cryptocurrencies have very little in common today. One significant difference between Bitcoin and Zcash is that Zcash is run by a for-profit company called the Electric Coin Company. This company receives 10% of all the mining rewards, which is regarded as a “Founder’s Reward.” These funds are then used to support further development of the project.
Conclusion
It’s no secret that Bitcoin isn’t actually anonymous, despite what various public figures might claim. Its pseudonymity makes its transactions vulnerable to being tracked by governments and intelligence agencies. However, Bitcoin’s privacy features are steadily increasing.
With Bitcoin’s improving privacy, it is possible that cryptocurrencies such as Monero, Zcash, and Dash may become obsolete. This will, however, happen only if Bitcoin offers anonymity alongside with superior store of value.
https://youtu.be/Bq-hXid26j4
Fundamental Analysis part 2 – How to Read the Markets
Risk-on & Risk-off
This section follows on from The Biggest Fundamental Events Analysis & Case Study. Shakespeare said
https://youtu.be/Bq-hXid26j4
Fundamental Analysis part 2 – How to Read the Markets
Risk-on & Risk-off
This section follows on from The Biggest Fundamental Events Analysis & Case Study. Shakespeare said
Fundamental Analysis part 2 – How to Read the Markets
Risk-on & Risk-off
This section follows on from The Biggest Fundamental Events Analysis & Case Study. Shakespeare said that All the world is a stage. When it comes to the financial markets, everything is interwoven, from forex, commodities, including gold and oil, equities, treasury bills, corporate and government bonds, futures contracts, and, more recently bitcoin. In other words, in order to be able to read the Forex market, you must understand that all of the individual sectors play a role in your trading.
Trading can then be broken down into two categories: traders and investors. Subcategories include retail traders, who are typically day traders, where they open and close positions during the day with no overnight positions. But, there are also swing traders, who may hold a position from days to a couple of weeks, and then there are position traders (investors) who have a more long term view and may have open trades which run on for months, if not years. The latter will typically be large hedge funds, financial institutions, sovereign wealth funds, and governments.
Therefore, position traders and investors tend to have a long-term approach and usually the financial clout to be able to weather the ups and downs and storms which prevail in the financial markets. A typical institutional investor might involve a trader who takes long term positions in the equity markets while managing retirement funds.
Here in the retail Forex market, traders typically range from scalpers, who prefer to be in and out of a trade within minutes, if not hours, and also day traders and swing traders.
All of this is fine, but what does it mean for a retail Forex trader? Well, it means that in order to be able to read the Forex market, it is highly advisable to know what is going on in other trading environments within the financial markets.
One way is to try and gauge the current sentiment, and there is an old adage in the trading community, which you will hear a lot of risk on and risk-off. This is dependent on the perceived risk of an asset – or a group of assets – by traders and investors.
So, when risk is seen as low, or risk-off, investors and traders seek higher-risk investments, such as stocks AKA equity investments, which will typically provide better returns.
And when the risk is seen as high or risk-on, traders and investors seek more lower-risk assets to invest in, such as selling assets, for example, equity portfolios, and moving into cash on deposit, or by buying treasury bonds AKA T-bills. This essentially means that retail forex traders need to up their game in order to be aware of how all these types of traders can very quickly liquidate positions in one market and jump into another.
Here are a couple more examples of risk-on: if the equity market is falling sharply and perhaps bond yields are low, traders tend to start buying gold and precious metals, which usually have less fluctuations, and are seen as a less long term risky asset. This has especially been true over the last couple of years, where prices have been overall moving higher.
Another example would be with regard to all of the uncertainty surrounding Brexit during the last couple of years. And especially at the time of writing, where the pound has been extremely volatile – with huge swings and an overall gain of some 800 pips gain in Cable – as we can see in example A – which took place in the last few days alone. Therefore, some traders will have avoided trading the British pound and instead opted to buy the Yen or Swiss Franc via related currency pairs, and which tend to be seen as safe-haven investment assets in times of turbulence in the Forex market.
And a great example of risk-off would be when Donald Trump became President of the United States and where his policies regarding business were perceived by the US equity market as being conducive to growth in the US economy and where the equities market there and specifically the Dow Jones Industrial Average went on to one of the biggest rallies ever seen in a global stock market.
Here are a couple of examples where one asset class is heavily influenced by another asset class. For example, the Canadian dollar – which is also known as the Loonie – is heavily influenced by the price of oil. This is because Canada derives a large portion of its gross domestic policy from its production and subsequent sale of oil. And so with all of the current uncertainty in the global economy and signs of a slow down, the price of oil has declined over recent months, and the knock-on effect has resulted in the sluggish exchange rate of the Canadian dollar.
Another area is the continual spat between the United States and China regarding their trade deal negotiations, which have been running on and on. This has caused a slowdown in the commodities sector, and the knock-on effect here has caused problems for Australia who’s gross GDP is largely made up of their commodities exportation.
Another country which is suffering because of this ongoing trade war dispute is New Zealand, whose GDP is mostly derived from selling dairy products, meat, wood, and machinery into China.
Therefore, Forex traders have a responsibility to at least be mindful of what is going on in other markets, due to the fact that this risk-on and risk-off which goes on in the financial markets can cause sudden and extreme volatility in the Forex market, due to traders coming out of one asset and jumping into another.
https://youtu.be/4_V91nsbhJM
What are stablecoins?
Cryptocurrency and blockchain both have the potential to change how we see the world. However, cryptocurrencies are still young and too volatile on every single
https://youtu.be/4_V91nsbhJM
What are stablecoins?
Cryptocurrency and blockchain both have the potential to change how we see the world. However, cryptocurrencies are still young and too volatile on every single
What are stablecoins?
Cryptocurrency and blockchain both have the potential to change how we see the world. However, cryptocurrencies are still young and too volatile on every single time-frame. Crypto investors have become millionaires overnight, only to lose a sizable portion of the earnings just a month or two later. Even though some see volatility as an opportunity, it mainly shows how cryptocurrencies are still unreliable and how their price is not yet determined by society. This is how the idea of stablecoins came to life.
Stablecoins are cryptocurrencies that have a much more fixed price when compared to the regular cryptocurrencies. The fixed price most often comes from pegging stablecoin’s price to other assets such as the US dollar or gold. This lets stablecoins retain most of the attributes of a cryptocurrency (transparency, security, privacy, etc.) without extreme volatility. Stablecoins were created with the intention of people using them, just like any other cryptocurrency. They are meant to be a simplistic, stable, easy to use, scalable, and secure means of transactions.
Many stablecoin projects have been released lately. This so-called “stablecoin invasion” brought at least 57 stablecoins to the market, according to a recent report. Out of the 57, Paxos Standard (PAX) and Gemini Dollar (GUSD) have even been approved and regulated by the New York State Department of Financial Services.
Why do we need stablecoins?
Stablecoin is a cryptocurrency that was created with the aim to mimic traditional, stable currencies. A stablecoin is collateralized to the value of an underlying asset, which can vary from one stablecoin to another. Many stablecoins are pegged to certain fiat currencies, such as the US dollar or the Euro, while other stablecoins are pegged to other kinds of assets, such as precious metals, real estate, or even other cryptocurrencies.
The primary characteristic of stablecoins is that they are not subject to the extreme price volatility that affects other cryptocurrencies. Stablecoins leverage the benefits of cryptocurrencies (transparency, security, immutability, fast transactions, low fees, privacy, etc.) while keeping the expected value that the market expects from it in order to be a viable means of payment as well as a unit of account
Stablecoins can be used in many cases to improve the state of finance all around the world:
They could benefit many industries and individuals that need to make international payments quickly as well as securely. Stablecoin users could range from migrant workers that want to send some money back to their families all the way to big businesses looking for a more efficient way of paying their international suppliers.
Many people all across the globe are underbanked, meaning that they don’t have sufficient access to mainstream financial services. People in underbanked communities can transact using stablecoins.
Stablecoins could help in areas where economic uncertainty is a regular concern, and inflation is extremely high. Using stablecoins will bring safety to its users as it will have no notable inflation regardless of the local laws, news, or conditions.
Using stablecoins globally could drastically improve the financial industry. This could range from cross-border lending to financial planning. Broadly, this could transform those involved with applications across the cryptocurrency space, such as traders, investors, and blockchain-based businesses.
Stablecoins are mainly used as a safety net for crypto investors at the moment. By acting as a safe haven in the event of a market crash, cryptocurrency investors can move their funds from regular cryptocurrencies into stablecoins without ever having to move their capital back into fiat currencies. This reduces exchange costs and cuts back on time required to leave cryptocurrency positions.
Types of stablecoins
There are four types of stablecoins based on how what they are backed by:
Fiat-backed stablecoins;
Commodity-backed stablecoins;
Cryptocurrency-backed stablecoins;
Stablecoins with no collateral (algorithm-backed stablecoins).
Fiat-backed stablecoins
Fiat-backed stablecoins are backed by fiat currency in a 1-1 ratio. This way, the stablecoin’s value always stays roughly around $1 (as most stablecoins are backed by USD). Fiat-backed stablecoins are the most common stablecoins.
Some of the most popular fiat-backed stablecoins are USDT (Tether), TrueUSD (TrustToken), PAX (Paxos), etc.
Commodity-backed stablecoins
Commodity-backed stablecoins backed by any interchangeable commodity. These stablecoins could be backed by oil, precious metal, or grain. Most commodity-backed stablecoins are using either gold or oil as their collateral.
Some of the most popular commodity-backed stablecoins are DGX (Digix) and Gcoin (G-Coin). Cryptocurrency-backed stablecoins
Cryptocurrency-backed stablecoins backed by other cryptocurrencies, usually the ones with the largest market caps. These stablecoins almost always use Bitcoin or Ethereum as their collateral. They can, however, be backed by more than one cryptocurrency to avoid extreme volatility. Crypto backed stablecoins are usually overcollateralized as they need to take into consideration the price fluctuations of the native cryptocurrencies.
Some of the most popular cryptocurrency-backed stablecoins are DAI (Maker DAO), bitUSD (BitShares), and sUSD (Synthetix).
Stablecoins with no collateral (algorithm-backed stablecoins)
Noncollateralized stablecoins are stablecoins that are not backed by any asset. Instead, they use certain algorithms to adjust the supply and demand of the stablecoin itself. That way, they can keep the stablecoin’s value stable.
Some of the most popular non-collateralized stablecoins are CarbonUSD (Carbon) and kUSD (Kowala).
Conclusion
Stablecoins bring a completely new aspect of complete stability to cryptocurrencies, but will that be enough for them to become popular and widely-used? Only time can tell.
Cryptocurrencies are becoming a global phenomenon, and it is becoming more apparent that they are not just a phase
https://youtu.be/-XxXbXc5zh8
What are hardware wallets and how to use them?
Cryptocurrencies are becoming a global phenomenon, and it is becoming more apparent that they are not just a phase
What are hardware wallets and how to use them?
Cryptocurrencies are becoming a global phenomenon, and it is becoming more apparent that they are not just a phase, but a thing that might actually change the world. The more people invest in digital assets, the more important it becomes to have a safe way to store the crypto portfolio. The current cryptocurrency wallet market is huge, and picking the right one can be tricky. The sheer supply of wallets on the market can cause “analysis paralysis” with the potential users. This article will hopefully help people make the right choice in picking their wallet.
Hardware wallets
A hardware wallet is a special type of Bitcoin wallet (as most wallets are so-called software wallets). Hardware wallets are special because they store the user’s private keys in a secure hardware device. This is providing a major advantage over standard software wallets as it grants its user much-needed security.
More and more companies started offering hardware wallets, but the two companies that always stay one step ahead in features and marketing are Ledger and Trezor.
Ledger
Ledger was created launched in 2014 by eight cryptocurrency/security experts. As previously said, Ledger is one of the two most popular hardware wallet companies, with the other one being TREZOR. That being said, there are a lot of companies offering their iterations of hardware wallets, but these two came out on top due to what they have to offer to their users (in terms of hardware, features, and pricing). Ledger currently offers three hardware devices:
Ledger Nano S – Small and secure;
Ledger Nano X – Ledger’s upgraded version of the Nano S, more features but also bulkier;
Ledger Blue – tablet-like device with a touchscreen. It offers the most options and features, but it is also the priciest out of the three.
All of the Ledger devices are multi-currency wallets as they support over 1,000 cryptocurrencies. They do, however, are slightly different. The difference comes in the form of which coins they support. Ledger Nano S and Nano X support the exact same cryptocurrencies except “The Validator” cryptocurrency, which Nano S supports. Ledger Blue offers support to less cryptocurrencies but offers more features overall.
Ledger Live
All Ledger devices are powered by software called Ledger Live, which acts as its main wallet. The Ledger Live app/program is supported by these operating systems:
Mac OS;
Windows;
Linux;
iOS;
Android.
Ledger Live natively supports only 22 cryptocurrencies, but that’s far from what it can do. Ledger devices offer support to far more cryptocurrencies by using the Ledger Live feature of integrating other wallets. That way, Ledger live can integrate third-party wallets that offer support to other cryptocurrencies. Less popular cryptocurrencies and ERC20 tokens are supported by Ledger only by integrating their respective wallets. Ledger supports smaller and less popular cryptocurrencies by integrating MyEtherWallet and MyCryptoWallet in most cases.
When all adds up, Ledger supports over 1150 cryptocurrencies, which makes it a multi-currency wallet by definition.
Trezor
Trezor is a hardware wallet created by Satoshi Labs in 2012. This company is also responsible for several well-known cryptocurrency projects (such as Slush Pool – a Bitcoin mining pool and CoinMap – a map of establishments that accept Bitcoin). Trezor has been developed by Satoshi Labs CEO and CTO, which go under the pseudonym Slush and Stick.
Besides Ledger, Trezor is currently the other most popular hardware wallet in the world. Trezor has two options to choose when it comes to hardware wallet devices:
Trezor One – has buttons to operate it; Trezor Model T – a newer version, has a touchscreen but is pricier.
Trezor hardware wallet, unlike Ledger Live, offers native support to over 1000 cryptocurrencies right off the bat. There is no need for integration of any wallet whatsoever. This makes Trezor wallet the only wallet in the industry that offers native support to all ERC20 tokens. Even though most users do not seem to care whether the support comes natively or by the integration of other wallets, this should be a significant thing. This feature alone greatly improves on the wallet security, making it safer than other hardware wallets.
Many wallets offer support to more than one cryptocurrency, which gives them the right to be called “multi-currency wallets,” but Trezor shows the true meaning of the word.
Conclusion
Hardware wallets should be used for their safety and security, as well as their sturdiness and durability. Each and every cryptocurrency investor (no matter how insignificant their funds are) should think about investing in buying a hardware wallet. As for the ultimate decision of which hardware wallet is better: Ledger, TREZOR, or some other company’s wallet, there is no final answer. It mainly comes down to the personal preference of the buyer themselves.
https://youtu.be/eLaFiGWCs3U
Assessing Market Conditions
No matter which markets you trade, but in particular the Forex market, trading conditions change constantly depending on a number of factors, including the time
https://youtu.be/eLaFiGWCs3U
Assessing Market Conditions
No matter which markets you trade, but in particular the Forex market, trading conditions change constantly depending on a number of factors, including the time
Assessing Market Conditions
No matter which markets you trade, but in particular the Forex market, trading conditions change constantly depending on a number of factors, including the time of day the time, the time of the month, and even on an hour by hour basis. This is dependant on both fundamental, technical, and conditions based on sentiment.
Example: on an hour by hour basis because the Forex market has peak trading ours during the European, London and US session – where most volume is going through the market – daily; due to fundamental news release and a change in market sentiment, monthly, because hedge funds typically like to rebalance their portfolios at this time and also on a quarterly basis.
When these factors are taken into consideration, they transfer onto a trading chart as range-bound, which are also known as consolidating markets; breakouts, where markets begin trading outside of a consolidation zone, and we’re these breakouts typically turn into trends. All of these conditions present trading opportunities.
Example ‘A’ is a diagram of a range-bound market, with support and resistance (highs and lows). These areas are also sometimes called; floors and ceilings and where price action will typically move up and down within these ranges. Sometimes traders refer to this as sideways trading.
Example ‘B’ shows a breakout of a previously ranging market, and where a floor or ceiling has been breached and where price action advances outside of the range. We have added a trend line A, B, C. D, where price action to the upside has begun to fade, and wher moves have been limited to this new are of resistance. Incidentally, the line continues to be a support move for the breakout at area D, which again proves to be a barrier for the bulls!
Example ‘C’ shows a trending market. In this type of market, traders look for repeated signs, such as in a bull market (ascending) market and where each high is higher than the previous high, and where each low point (pullback/retracement) is higher than the previous low. The correct terminology is: higher highs and higher lows.
Example ‘D’ in a bear trend (descending) market, the reverse applies, and now traders look for lower highs and lower lows.
So, we know what we are looking for: range-bound, breakouts, and trends, in which case, when is the best time to be looking to trade them?
Let’s consider that you live in the United Kingdom and you want to trade the pound against the US dollar, AKA Cable, trading this pair at 11 PM (Sun-Fri) would not be a particularly good idea, because the European, London, and US markets will be closed at this hour, and the Asian region traders will be coming to market. This could mean that Asian traders have a different view than the other regions, regarding the value of the pound against the US dollar, or and which could be the start of a trend reversal. This could go against technical analysis as inherited
from the aforementioned markets.
Another reason could be that typically Asian markets at this time might be more focused on their own domestic currencies, such as the Yen, Australian and New Zealand dollar, for example. This would, therefore, have the effect of potentially leaving cable with little volume and, therefore, flat. Therefore, for the best time to trade the Cable would be during the European session, including London.
Another thing to be mindful of is the immediate, or near-term financial, economic calendar, especially when it comes to interest rate decisions, gross domestic product GDP releases, and on a more topical note event surrounding Brexit.
However, because currencies are traded in pairs, it is also highly advisable to observe the financial calendar releases for the counter currency, in this case, the US dollar.
We would also recommend caution when trading any of the major currency pairs when an unrelated pair is about to have an economic-related news release as this could impact the counter currency, and which may have a knock-on effect and impact on your trade.
Her is an example: let’s say that you are buying Cable, and the European Union announces an unexpected ten basis point interest rate reduction. This could cause the value of the Euro to fall and cause the US dollar to rise sharply. Thus potentially resulting in a knock-on, or adverse effect on your trade, where you need a weaker dollar and stronger pound.
Please also note that range-bound markets, breakouts, and trends will have a completely different complexion depending on the time frame that a trader chooses to trade with. For example, a 1-minute time frame, which is typically used by scalpers, or intraday traders, tends to be more frantic than a 1-hour time frame, and will also typically offer less movement in terms of pips. Hedge funds, institutions, and governments tend to hold longer views and therefore use longer time frames such as daily, weekly, and monthly set-ups.
Price action is a discipline of identifying price action trends (up and down movement) reversals, support, and resistance via technical analysis on a trading chart during a
Mastering Price Action
Price action is a discipline of identifying price action trends (up and down movement) reversals, support, and resistance via technical analysis on a trading chart during a
Mastering Price Action
Price action is a discipline of identifying price action trends (up and down movement) reversals, support, and resistance via technical analysis on a trading chart during a specified period of time. Price action analysis is used in conjunction with global news events and economic data releases, which act together in order to influence exchange rates.
Most technical traders profit by devising a strategy which actually combines both price action, fundamental analysis, and their overall understanding of technical analysis. All these factors work hand-in-hand with each other.
Different tools can be applied to a chart to make trends in price action more obvious for traders. And where technical analysis formations and chart patterns are derived solely from price action.
Example ‘A’
Example ‘A’ is a 2-hour line graph of the British pound against the American dollar, also known as Cable. Let’s disregard the comments on the graph and simply focus on the actual line graph itself, which denotes the up and down movements – or price action – of the exchange rate of this currency pair. If we only used this line graph to trade this particular pair, we would find it extremely difficult to know when to open a trade in any particular direction. It simply looks chaotic and random!
However, looking a little more closely we can see a peak on the left hand side of the chart which occurs at the 1.2567 exchange rate level, before price action descends to the 1.22 level, which is a key level, and where we might expect to find some potential support, (a floor in this example) and where indeed the price flattens out here and which marks the end of trend ‘A’.
Price then moves higher throughout trend B and where we see a couple of spikes, some pullbacks, and then a continuation to the peak of 1.2850; another key level (in this case, a potential ceiling).
Example B
In example B, we have changed the line graph to Japanese candlesticks, a style of technical analysis which is more widely used in the trading community and which is much easier to read in terms of potential fading of price action and therefore possible opportunities to enter the market more easily.
Here we can see for example that our initial peak on the left-hand side of the screen showed a high, as denoted by the green (bullish) candlesticks, which was replaced by a red (bearish) candlestick – which was larger than the preceding two candlesticks – and was a warning to traders of a potential pullback, or a reversal of price action.
Indeed price begins to fall before almost returning to trendline ‘A’ and then continues the momentum to the downside. Eventually, the price action returns to our trend line before continuing the move lower by way of a series of falls and pullbacks and where trendline ‘A’ has become a simple moving average.
After the price action flattens out at the 1.22 level, we are able to identify a move higher and where the larger candlesticks (a sign of a strong trend) move above the trend line or simple moving average, and this starts a price action reversal. When price crosses the extended trend line ‘A,’ this becomes a signal of a new trend, and indeed trendline ‘B’ becomes a simple moving average to the peak of 1.2850.
Example C
Now let’s look at candlesticks a little more closely. In example ‘C’ we have magnified a section of price action in order that we can analyze the candlesticks in more detail. Note that price action, as denoted by the green candlesticks, is in an upward trend. The last green candlestick in this sequence is called an upside-down hammer. This has a smaller ‘wick’ at the bottom, a small ‘body,’ and then a longer wick at the top: Hence the term upside down hammer. At its height, the price has moved to the highest point and then pulled back before the next candlestick opens. The subsequent candlestick is a descending candlestick with a long body, and one small wick at the top, and where the candlestick is longer than the preceding two bull candlesticks. This type of Candlestick is an engulfing candlestick (it engulfs the previous ones), and often sets the precedent for any subsequent move; in this case lower.
Example D
In example ‘D’ we can see that the bulls have been in control of the price action and moved the exchange rate up to trendline ‘A.’ However the subsequence candlestick is a bearish candlestick, which engulfs the body of the previous candlestick, and where price action begins to trend lower. In the middle of the sequence, we see another hammer shape candlestick, but this time it has a longer wick at the bottom, and traders have taken advantage of this and move the price higher. Many of the candlesticks in the remainder of this sequence are very small, and this usually denotes that there is a lack of volume at the present moment in time.
Example E
Now we turn our attention to example ‘E,’ where we have magnified the price action around the key 1.22 area. Many of the candlesticks we see have small bodies, and where some of the candlesticks have small wicks; these types of candlesticks are called ‘spinning tops’ and usually denote a lack of direction and a lack of volume in the market. Towards the end of this sequence, we can see that the last two bullish green candlesticks open above the preceding ones, and both of these have long bodies with small wicks, which ingulf the previous candlesticks from the beginning of the move in this highlighted sequence. They form our new bullish move, which we have called trend ‘B.’
Therefore, the candlesticks become a much better tool to read price action. Suddenly the chaos and randomness ebb away! Remember, the larger the candlestick, the stronger the trend. Candlesticks are the best available tool for mastering price action. They are a leading indicator, and when combined with other technical analysis tools will help you get an edge in your trading! We will identify more Japanese candlesticks later in our course.
https://youtu.be/V-NOeyfY8I0
How to send and receive altcoins through multicurrency wallets?
In order to send or receive a cryptocurrency, first, you need a cryptocurrency wallet that supports that cryptocurrency. Many
https://youtu.be/V-NOeyfY8I0
How to send and receive altcoins through multicurrency wallets?
In order to send or receive a cryptocurrency, first, you need a cryptocurrency wallet that supports that cryptocurrency. Many
How to send and receive altcoins through multicurrency wallets?
In order to send or receive a cryptocurrency, first, you need a cryptocurrency wallet that supports that cryptocurrency. Many wallets that support quite a few cryptocurrencies are currently on the market. The decision of which wallet to use comes down mostly to which cryptocurrencies the wallet supports. If more wallets support the wanted cryptocurrency, then the decision comes down to smaller features such as user interface, the option to reduce/increase transaction cost etc.
Sending and Receiving Cryptocurrencies
After deciding which wallet to use, all that’s needed is to put in the public address recipient when sending cryptocurrencies or to send out the address to the sender as a recipient. This can often be as easy as scanning a QR code and typing in the cryptocurrency amount.
Of course, the process of sending and receiving cryptocurrencies can differ slightly between wallets as each wallet has a different interface. However, there are a few general guidelines that are the same with all wallets:
Log into your wallet – Some wallets may have a 2FA (two-factor authentication), PIN code, phone verification or other kinds of security options enabled;
Go to the send/receive screen depending on whether you are sending or receiving cryptocurrency (that’s simply done by clicking the tab or button that says “send” or “receive”);
Choose whether you want to send or receive cryptocurrency. It is important to know that even though wallets can support many cryptocurrencies, each address is bound to one cryptocurrency (unless the coins are Ethereum tokens or a part of a similar ecosystem). This means that Bitcoin can only be sent to a Bitcoin address, Litecoin to Litecoin, XRP to XRP etc.
When sending: Enter the public wallet address (of the corresponding cryptocurrency) of the recipient and choose the amount that you want to send them. The specified amount should also include transaction fees. After double-checking and confirming that the address is correct (as a mistake cannot be undone after sending), click send and the transaction is done.
When receiving: Receiving cryptocurrencies is as simple as sharing the public wallet address (for the coin that will be sent) with the sender. It is even easier in person, as the sender can scan the QR code right from the recipient’s wallet.
Cryptocurrency transaction tips and tricks
Before sending a lot of cryptocurrencies, it’s good to try sending a small amount to the address as a test to make sure everything is working properly.
Sending and receiving cryptocurrency on/from exchanges might be a bit different than how simple wallets work. Sending between exchanges will require using the “withdraw” and “deposit” buttons on the exchange which will be located right next to the token. Each exchange has its own protocol which has to be followed. This means that directions must be followed carefully, as exchanges might require senders to include a message in the transaction or to send a whole number of the coin/token. They will also most likely require some form of transaction verification (2FA, email verification or phone verification).
Crypto-to-crypto exchange lets its users turn one cryptocurrency into another. Using a platform such as Shapeshift could be helpful if the transaction should happen in altcoins but all you currently have is Bitcoin.
You should not be afraid if the transaction does not appear on the recipient side instantly. Sending cryptocurrency may take some time for the transaction to go through (especially if the sender is sending from an exchange wallet, in which case it may take some time for the transaction to be included in a “transaction batch”). The sent transactions can be almost instant, but they could also take a few minutes or even hours (depending on the traffic). Most wallets, however, have the feature where users can see their pending transactions.
ERC20 tokens
ERC20 tokens are cryptocurrencies made on the Ethereum protocol and they are a bit different than other altcoins. These tokens are compatible with the Ethereum protocol as they follow the ERC20 guidelines. To send any ERC20 token to another wallet, the sender has to hold enough Ether to cover the transaction fees. Transaction fee depends on the complexity of the transaction. This fee is called Gas.
Other than the fact that each ERC20 wallet needs to have enough Ether to cover transaction fees, there is no other difference from the other altcoins wallets.
Conclusion
One big thing to point out when transacting cryptocurrencies is to never share private keys. Private keys should be differentiated from public keys and should never be seen by anyone other than the account owner. Sharing it would be the equivalent of sharing the wallet password with a stranger.
In a previous presentation, we explained about the three styles of trading Forex: fundamental and technical analysis and trading with market sentiment. In this presentation, we are going
https://youtu.be/QJfL6aiZvqo
In a previous presentation, we explained about the three styles of trading Forex: fundamental and technical analysis and trading with market sentiment. In this presentation, we are going
In a previous presentation, we explained about the three styles of trading Forex: fundamental and technical analysis and trading with market sentiment. In this presentation, we are going to look at the significance of fundamental analysis in more depth.
Fundamental analysis is the way that traders try to analyse the economic, social, and political events in a country, in order to ascertain it’s exchange rate with another country’s currency. Therefore traders will be interested in the gross domestic product GDP and growth potential of a country, along with other factors such as its unemployment rate, debt, inflation, and monetary policy. In the case of the US dollar and the Euro, in particular, traders will also be trying to gauge the supply and demand of these currencies.
Of course, in the real world, all of these factors are extremely fluid and change constantly, and therefore, traders are continually battling to determine the value of one currency against another; in other words, the currency exchange rates.
Therefore when a country releases economic data, especially interest rate changes, GDP announcements, and in the case of the United States, unemployment changes in the form of Non-Farm Payrolls – which are normally released on the first Friday of each month – these data releases will be greatly anticipated and can dramatically change the value in a country’s currency and thus related exchange rates. Thus we often find dramatic Forex market moves caused by the increased volatility surrounding such events.
Case study 1: –
On the 23rd of June 2016, the British people voted in a referendum to leave the European Union: Brexit. This sent shock-waves through the financial markets and resulted in the British Pound plummeting in value against its peers.
In the example ‘A,’ we can see a huge, red, bearish Japanese candlestick descending from a high of over 1.50 to a low of 1.32 against the US dollar, during overnight trading, post the referendum result. The subsequent uncertainty regarding this decision caused the Pound against the US dollar – also known as Cable – to fall to a low of 1.19. Indeed we are still seeing extreme volatility due to the fact that, some three years later, this matter has not yet been
concluded.
While many traders correctly predicted that the British public would indeed vote to leave the European Union and shorted Cable, and made a hefty profit as the Pound sank, traders who were ‘long’ of the pair faced huge losses and where Stop Loss orders would have faced immense slippage due to the extremeness of the fall.
In Example B, we can see some of the extreme moves in Cable from a high of 1.50 before the Brexit referendum to lows of 1.19 and swing highs to 1.43 post the referendum.
Obviously, fundamental events like these don’t happen often. However, let’s look at another fundamental event which caused huge market volatility.
Case study 2: –
The country of Switzerland lies in the heart of the Euro area and does a great deal of international business with Euroland. The Swiss National Bank SNB is responsible for monetary policy for Switzerland but declined to join the European Union, preferring to remain an independent trading nation and retain its own currency: the Swiss Franc CHF.
Because of Switzerland’s geographically closeness to Europe and the significance of trade
reliance, on the 6th September 2011 – due to extreme volatility in the financial markets – the SNB announced it wanted to depreciate the EUR:CHF currency (or to cap it at) exchange rate of EUR:CHF 1.20, so as to remain competitive with regard to trading with the Euro area.
However, on the 15th January 2015, the Chairman of the Board of the SNP, Thomas Jordan unexpectedly announced it was removing the cap. The result in the effective 1.20 peg being removed, without market notice, caused chaos in the Forex market.
In example C, we can see a huge fall in the value of the Euro to the Swiss Franc from 1.2 to 0.96 on our chart, while some brokers were seeing falls to as low as 0.85. Many hedge funds made huge losses, and individual traders were made bankrupt along with the broker Alpari Trading, who could not cover losses it sustained in the devaluation crisis. Remember, this event was a bolt out of the blue, with many commentators accusing the SNB or gross
negligence.
The upshot is that trading on fundamental news releases can present some fantastic trading opportunities. However, novice traders are strongly advised to stay on the sidelines during these events for the following reasons; 1) Increased possibility of huge fluctuations in exchange rates, 2) price action acting in contradiction to technical analysis. 3) price already factored into fundamental news releases, resulting in little price action movement. 4) market disappointment, resulting in unexpected swings in price action, 5) a lag In price action while markets assimilate data, and where this can often cause price spikes and reversals.
Therefore, unless a trader is highly skilled with regarding to trading on fundamentals only, our advice would be to take note off data releases and then wait until such time as the markets have returned to the normal ebb and flow, and then continue with trading via technical analysis!
Leonardo Bonacci, AKA Fibonacci, was a mathematician, born around 1170, and became known for developing the Fibonacci sequence: where each number is the sum of the two preceding
https://youtu.be/WssOy8yCqTs
Leonardo Bonacci, AKA Fibonacci, was a mathematician, born around 1170, and became known for developing the Fibonacci sequence: where each number is the sum of the two preceding
Leonardo Bonacci, AKA Fibonacci, was a mathematician, born around 1170, and became known for developing the Fibonacci sequence: where each number is the sum of the two preceding ones, starting from 0 and 1. Such as; 0, 1, 1, 2, 3, 5, 8, 13, 21, 34, 55, 89,144, and on to infinity.
From this theory, the ancient Greeks founded the Golden Ratio, AKA Golden Section, Golden Mean, and Divine Proportion (proportions) where many things in the universe and in nature can be measured by such Golden Ratios.
In Forex, the most commonly used Fibonacci ratios are: 38.2%, 50%, 61.8% and sometimes 23.6% and 76.4%. These ratios are better known as retracement levels and are used in technical analysis to help traders establish support and resistance levels and areas where a trade might turn in direction.
Traders simply place their Fibonacci retracement tool onto their chart and set position ‘1’; the lowest point in a move and then drag the tool to position ‘2’, the highest point of a move. The tool will automatically open retracement levels on the chart showing dividing lines with individual ratios of 23.6%, 38.2%, 50%, 61.8%, and 100%. The idea is that the swing high on the trader’s chart will be followed by a pullback or retracement, and then the trader must decide at which level, if any, the price action will stall and then continue its upward move. For example, if the pullback falls to the 23.6% and then continues higher (above our initial high point), this would be considered a strong bullish move. A slightly weaker bullish move would be indicated by a pullback to the 38.2% retracement line. Therefore, the shorter the pullback, the more likelihood of a stronger push higher and continuation of the trend. See our article, Introduction To Elliot Wave Theory – Accurately Predicting Forex trends.
This above set-up is used for a bullish move on a Forex pair. If the trader wishes to look at a bearish move, he/she simply places position one at the highest point in a move and drags position 2 to the lowest, in which case the opposite applies to the original set up.
Let’s look at example A: –
This is a 5-minute chart of the EUR:USD pair. We have brought our Fibonacci tool on to the screen at the lowest point of the move (1.0990) as denoted by the X and then dragged it to the highest point of the move (1.1044), as denoted by the second X. The tool has opened six vertical levels on the screen: 0, 23.6, 38.2, 50, 61.8, and 100. These show, in percentage terms, the level of pull back from the lowest point to the highest point. What is evident by the green candlesticks is that there was a strong push high early in the move and then price action entered a ‘sideways’ move before pulling back to the 23.6% line, and then after a move higher, price action pulled back to the 23.6% line and then moved lower, stopping briefly at the 38.2% level before finding support at the 50% retracement level (1.1018) before moving higher. Had a trader bought the pair at the 50% retracement, where price action clearly stalled, they would have seen an 18 pip move to the upside. If this was to be used on every trade and consistently yielded the same results a couple of times a day, it would prove to be an immensely powerful trading tool.
However, we strongly advise not to solely trade with a Fibonacci tool for the following reasons. That initial spike higher in the EUR:USD pair in example A, from 1.0990 to 1.1044, was the result of an unexpected news flash release where the European leaders had agreed on an initial draft acceptance verbiage relating to a breakthrough in the Brexit negotiations, and a possible way forward. These types of news releases are inclined to be put down to rumor and conjecture and can often cause spikes and rapid reversals in price action.
Therefore, while Fibonacci is a very useful way of reading and predicting moves, we will always advocate that they are used in tandem with other tools, such as up to the minute news releases
information (being informed), Stochastics (overbought and oversold) indicators, Bollinger bands and focus on key exchange rate levels, especially round numbers. Also, always be mindful of economic new release schedules, which can also adversely affect price action.
https://youtu.be/XhmvsixpJAM
What are altcoins?
Altcoins are, simply put, the cryptocurrencies that launched after Bitcoin. Altcoins are made to either do the things Bitcoin does but better or to fill
https://youtu.be/XhmvsixpJAM
What are altcoins?
Altcoins are, simply put, the cryptocurrencies that launched after Bitcoin. Altcoins are made to either do the things Bitcoin does but better or to fill
What are altcoins?
Altcoins are, simply put, the cryptocurrencies that launched after Bitcoin. Altcoins are made to either do the things Bitcoin does but better or to fill some other gap in the market. Bitcoins’s success created a whole industry where people are trying to solve world problems using blockchain and cryptocurrency tech. As Bitcoin itself is not a complete project yet, some altcoins are trying to become a “better version of Bitcoin.” Others want to improve other industries and have no intention of being Bitcoin’s competition. As the term ‘altcoins’ represents all other cryptocurrencies other than Bitcoin, there are thousands of altcoins out there.
Why are non-Bitcoin cryptocurrencies called “Altcoins”?
“Altcoin” is a word combined from the words: “alt” and “coin.” “Alt” is a short term for “alternative,” while “coin” is a jargon term for cryptocurrency. Together, they represent alternative cryptocurrencies as they are not Bitcoin. However, many (if not all) altcoins are influenced by Bitcoin in many ways. While many came to life directly by forking off from Bitcoin’s blockchain, others created their own blockchains.
Many altcoins are built on the framework provided by Bitcoin, which means that most of them have similar characteristics. They have a peer-to-peer network and use Proof of Work concept to incentivize transaction validation through mining. However, there are a lot of altcoins, and almost all of them have a special feature or a set of features that differentiates them from the rest. They differ from Bitcoin with a range of variations which range from including different validation incentive algorithms to security and anonymity features.
The first Altcoins
The earliest notable altcoin is Namecoin, and it was almost an exact copy of Bitcoin. They had the same code as well as Proof of Work algorithm. They also had the same maximum amount of coins, namely 21 million coins. Namecoin was created in April 2011 with the main purpose of improving on privacy features. Namecoin tried to make user domains less visible, which allowed them to mine using their own .bit domains.
Namecoin was not a successful project, but many others were. Current leading examples of altcoins are :
Litecoin;
Ethereum and
XRP/Ripple.
Right after Namecoin’s launch, Litecoin came out and was branded as the “silver to Bitcoin’s gold.” Litecoin is another project that is extremely similar in code and functionality to Bitcoin. However, Litecoin differs from Bitcoin in several essential ways: It allows mining transactions to be approved four times faster than Bitcoin and has a supply that’s 4 times bigger. It also uses a different proof-of-work algorithm than Bitcoin that’s called Scrypt.
As of October 2019, there are more than 3,000 cryptocurrencies available over the internet, and they are all considered altcoins, except Bitcoin. New cryptocurrencies can be created at any time and by anyone. However, not all of them are successful. Many of them will not find their place in the market and will eventually fail, as many older cryptocurrencies already did.
Biggest Altcoins explained
Ethereum
Companies such as J.P Morgan Chase, Microsoft, and Intel gathered up in order to create the fiercest rival to Bitcoin in terms of market capitalization, Ethereum. The main purpose of Ethereum was not to directly compete with Bitcoin but to rather program binding agreements (which are called smart-contracts) into the blockchain itself. This incarnated into the now-popular smart contract feature that many cryptocurrencies use.
It should be noted that Ethereum is not just a currency as it did not copy its code from Bitcoin. It is also a blockchain platform that’s powered by its cryptocurrency: Ether. Ethereum has the potential to revolutionize many industries with its smart-contract feature as these contracts can be used to improve how we store medical records, how we do property sales and leasing etc.
XRP/Ripple
XRP attracted a great deal of venture capital during its inception, as it was the first cryptocurrency that had a plan to revolutionize the banking industry rather than turning it upside down. This altcoin startup managed to raise $50 million from banking institutions, gathering $90 million in total funding. The project is even backed by Google. XRP has a unique feature of allowing transacting with any unit of value, from fiat currency to frequent flier miles.
Ripple tries to improve the outdated SWIFT transfers, which are costly and slow. Using XRP would lower the total cost of international settlement by enabling banks to transact directly, instantly, and with a certainty of settlement. XRP quickly took its spot as the 3rd largest cryptocurrency and 2nd largest altcoins on the market.
However, many influential people think that XRP is not a real cryptocurrency and that all its value lies in the company that created it instead of the cryptocurrency, which was not being used all that much. Only time will tell whether this statement is true or false.
Litecoin
Former Google engineer Charles Lee created Litecoin in order to improve on how Bitcoin is used. His idea was that Bitcoin should be considered the “internet gold” while Litecoin would be used for smaller purchases as it was faster and cheaper, but less safe due to its network size. The block-generation speed is improved dramatically, and this resulted in much faster transactions. This speed, however, makes Litecoin’s blockchain much larger and more prone to producing orphaned blocks. Litecoin is often used for testing Bitcoin’s new features and their value.
Conclusion
While the altcoins mentioned above are out there to perform useful tasks (example: acting as a testnet capacity or offering greater anonymity than Bitcoin). There are, however, many other altcoins that are created to scam people and are completely driven by speculation. Not all projects are created equal, so check all the fundamentals before investing and beware.
The Wave theory was discovered by Ralph Nelson Elliott during the 1930s, where he discovered that stock market movements could often be predicted
https://youtu.be/ggI4kZ2ecSo
Introduction To Elliot Wave Theory
The Wave theory was discovered by Ralph Nelson Elliott during the 1930s, where he discovered that stock market movements could often be predicted
Introduction To Elliot Wave Theory
The Wave theory was discovered by Ralph Nelson Elliott during the 1930s, where he discovered that stock market movements could often be predicted by a series of trends movements and reversals. Elliott Wave theory is, therefore, a methodology which technical traders use to identify trade entry and exits.
These movements consist of impulsive waves, followed by corrective waves. An impulsive wave is usually composed of five sub-waves (1–2–3–4–5) that moves in the same direction as the trend. A corrective wave is composed of three sub-waves (A-B-C) that moves against the trend.
Let’s turn to example A:
In this example, we can see an Elliot Wave formation. We can see that price action moves from position 0 to position 1 (an impulse wave), with I pull back from position 1 to position 2 (a corrective wave) and where this move is less than 100% of the previous upward move. We subsequently see another impulse wave higher from position 2 to position 3, with I corrective wave, or pull back, from position 3 to position 4 and where this pullback was less than 100% of the move higher from position 2 to position 3. And where this process is continued from positions 4, 5. However, from position 5 we see our pull-back to position 6, but when the subsequent impulse wave higher fails to carry on the momentum above position 5 and fades at position A. We now have scope for an A, B, C corrective move lower.
Now let’s look at example B:
In this chart example of a 4 hour moving time frame of the EUR:USD pair, we can see that on the left-hand side of the charts – where I have denoted an X – price action seems to have bottomed out and then makes a move to the upside, as denoted by the candlesticks. We then see sidewards moving price action until the market reaches point 0. We then have a move up towards the top of the previous price action period in question before moving higher again and peaking at position 1, or the beginning of our impulse move. This had previously been a period of consolidation and where traders will have been waiting to enter trades on a possible breakout from this range, either upwards or downwards.
From position 1 price pulls back, or moves lower (a corrective wave), to position 2 and then moves higher to position 3, while breaking the ceiling above position 1, which was the end of the consolidation period. This shows momentum building to the upside and a possible bull trend forming. From here, we see a further corrective wave lower to 4, followed by a continuation higher to position 5 and where this price action has formed the basis of a classic Elliot Wave movement. This bull trend will be further confirmed if price action moves higher than where it is currently situated to reach position 7 ( the continuation of a Bull trend). However, if the price action stalls, traders may see a trend reversal forming and that would be a confirmation that the wave formation is dominating this move and where price action might move from its current position on the chart at A to a fall to position B, C and lower; a corrective wave.
Traders also read these moves as being sequences of highs and lows, such as a higher highs as shown by position 3 being a higher high than position 1, and where position 5 is a higher high than position 3. They also look for higher lows, such as position 2 being a higher low than position 0. The reverse terminology is used for downward trends.
It is also important to consider that these moves are all forms of stepping stones and can be seen by other technical charts as the result of being overbought or oversold or having reached significant areas, such as key round numbers that traders typically like to trade to and from.
Always remember that technical analysis is simply that: analysis! Technical traders mostly use indicators that form after price action movements have happened, and therefore, these indicators
typically lag behind the market. And while they can be very reliable in terms of establishing trends/patterns, they can never be 100% reliable due to the myriad of permutations going on in the Forex market at any particular given time. The absolute best indicator will always be the current exchange rate, AKA, as price action.
What is Distributed Ledger Technology, and how is it different from Blockchain?
Blockchain is becoming more and more accepted as a concept in the world of finance nowadays.
https://youtu.be/xFVjQv3cuYw
What is Distributed Ledger Technology, and how is it different from Blockchain?
Blockchain is becoming more and more accepted as a concept in the world of finance nowadays.
What is Distributed Ledger Technology, and how is it different from Blockchain?
Blockchain is becoming more and more accepted as a concept in the world of finance nowadays. The idea of blockchain has been explored by a greater audience every day, with even traditional centralized financial institutions are taking an interest in what blockchain can offer.
However, most of the traditional financial institutions have started to use another term alongside blockchain: the distributed ledger technology. Articles, as well as corporate statements, seem to use terms “blockchain” and “distributed ledger technology” interchangeably. This article will try to explain that there is a difference between the two terms as well as what the difference is exactly.
Distributed ledger technology
Distributed ledger technology, or DLT, as some people may call it, is a database of records that aren’t stored or confirmed by a central body. This database is then spread across several nodes. Each node saves an identical copy of the ledger, therefor making it decentralized. Each participant node of the network works independently from one another.
The distributed ledger technology ensures that each node updates independently. The nodes vote on each update to ensure that the majority of the nodes agree with the conclusion reached. This voting process is called consensus. Distributed ledger technology dramatically reduces the cost of trust.
With that being said, distributed ledger technology may sound just like blockchain, but it is not.
Distributed ledger technology offers the implementer to have more control over how it is, in fact, implemented. While distributed ledger technology is technologically decentralized and relies on similar consensus guidelines as blockchain, it offers its owner to dictate its structure, purpose, and function.
This technology can be considered the first step towards a blockchain, but they won’t necessarily make a chain of blocks. A distributed ledger can be stored across many servers, which then communicate to ensure the most accurate and up to date record of transactions is maintained, without the need to create blocks.
Blockchain
Blockchain is, in fact, a form of distributed ledger technology. However, blockchain has very specific technological features.
Blockchain ensures cryptographic signing and linking groups of records of transactions in the ledger.
This way, blockchain forms a chain, which is where it got the name from. Depending on the specifics of a certain blockchain, the public is given the opportunity to give their opinions on how it is structured and where it is headed.
Bitcoin can be considered a true example of a blockchain user. It shows how a blockchain should run. Bitcoin is completely open, and anyone can contribute to its code and give their opinion on how to improve it. Meanwhile, distributed ledger technology only has part of it decentralized. The governing portion of the ledger is completely centralized.
Distributed ledger technology and blockchain are not interchangeable
Even though every blockchain is a form of a distributed ledger, not every distributed ledger can be considered blockchain. The two terms cannot be used interchangeably as they represent similar, but not the same things.
With that said, some organizations, corporations, and institutions may prefer distributed ledger technology over blockchain. The Bank of England is considering distancing themselves from the volatility associated with blockchain by supporting distributed ledger technology. Many corporations also might prefer the idea of a decentralized ledger so they could keep matters in their hands while using the word blockchain to capitalize on the public’s interest.
https://youtu.be/J0uzUe-fR4A
How to send and receive Bitcoin
Bitcoin is one of the biggest, if not the biggest financial innovation in this century. The technology behind Bitcoin has the potential
https://youtu.be/J0uzUe-fR4A
How to send and receive Bitcoin
Bitcoin is one of the biggest, if not the biggest financial innovation in this century. The technology behind Bitcoin has the potential
How to send and receive Bitcoin
Bitcoin is one of the biggest, if not the biggest financial innovation in this century. The technology behind Bitcoin has the potential to improve the world’s financial system as well as solve many problems. Some of the conveniences that Bitcoin offers are fast, cheap, safe, and secure transactions, all while removing third-party intermediaries and putting the power back in the hands of the people. Using Bitcoin, anyone can send value anywhere in the world in a blink of an eye.
However, as Bitcoin is still a new concept, many people do not know how to make a wallet, send or receive it. Hopefully, this article will help with that and make things easier to understand.
How to get a Bitcoin address
In order to get a Bitcoin address, you must create a Bitcoin wallet. Bitcoin wallets are, simply put, software used for sending, receiving, and keeping Bitcoin. Each wallet provides the user with a private and a public key. A public key is a way to confirm ownership of an account and of the address that sends and receives funds. A private key, on the other hand, is a “password” that signs transactions, and it is related to the public key.
A Bitcoin address is a version of a public key that acts as an “account number.” This Bitcoin address can be used by anybody to send Bitcoin to your wallet.
There are many wallets on the market, each bringing their own features. The two most important distinctions to make are:
Hardware vs. software vs. paper wallet;
Exchange wallet vs. a regular wallet.
Hardware wallets are a safer alternative to software wallets as there is an actual device that is used to store the wallet keys. This way, users are more secure as these devices are safer from security breaches that can happen to phone-app wallets or computer program wallets. They are a bit more costly, but anyone that has cryptocurrencies should be as safe as possible, no matter how much value the wallet holds.
On the other hand, paper wallets or “cold storage” wallets are a mechanism that stores Bitcoin offline. They are made by printing the private keys as well as Bitcoin addresses onto paper, making it impossible to hack. Physical wallets are considered the safest way to store Bitcoin.
Exchange wallets are wallets that let you keep, send, receive, and exchange funds on an exchange. This is considered the most unsafe way of storing Bitcoin (or any cryptocurrency) as the wallet keys are not in the hands of the end-user, rather in the hands of the exchange. Storing funds on an exchange is not advised, as it is far safer to store them anywhere else. Exchanges should only be used for trading and exchanging funds and not for simply storing cryptocurrencies, no matter how user-friendly it seems.
How to Receive Bitcoin
Once a wallet is created, receiving Bitcoin is fairly straightforward. Every wallet will have a receive tab where an address will be shown:
Using this address, anyone can send funds to the wallet. Wallets also provide their users with a QR code which can easily be scanned, which makes in-person transfers that much easier.
Once the sender puts in the receiving address and specifies the amount, the receiving account will be credited with the amount sent. It may take some time to confirm that transaction by the network.
How to Send Bitcoin
While all wallets are different, they all are pretty much alike when it comes to sending Bitcoin. Clicking on the “send” tab will lead the user to a page asking for a receiving address, amount of funds to send, and transaction fees. Not every wallet has the feature to let their users choose transaction fees themselves, but it is becoming a core feature in almost every wallet, so it is included in the guide.
Once the recipient’s address has been put in, the sender should choose the amount that they wish to send, as well as transaction fees. Choosing a transaction fee comes down to the urgency of the transaction itself. If it needs to arrive as fast as possible, the user will choose a higher transaction fee, which will incentivize the miners to verify it faster. If time is not as important, users have the option to choose a lower-than-usual fee which will make transactions cheaper, but slower. Once everything is set, clicking the send button will finish the transaction.
Summary
Every wallet has its advantages and disadvantages, so it all comes down to personal preference. Choosing a wallet should be based on security, ease of use, and its other features. All of Bitcoin wallets can send and receive funds, so any wallet a user chooses will be a good choice (as long as the other features suit the needs of the user themselves).
As far as sending and receiving Bitcoin, it is (as proven above) extremely easy, which is one of many features Bitcoin has to offer. Hopefully, this guide will show people that they should not be afraid to step into the cryptocurrency world.
There are two main ways that retail Forex traders are able to have enough financial capacity to access the
https://youtu.be/0nOkoGCTolM
Leverage & Margin – Key Principles Of Forex
There are two main ways that retail Forex traders are able to have enough financial capacity to access the
Leverage & Margin – Key Principles Of Forex
There are two main ways that retail Forex traders are able to have enough financial capacity to access the Spot (instantly executed trades opened on the spot) retail Forex markets in the United Kingdom: one is to spread bet, which is classed as gambling and where you bet on a currency pair going up or down and where you pay no income tax on your winnings. The other way is to trade Contracts for Difference (CFD), and where your winnings are subject to capital gains tax and any losses can be offset against taxable income.
Retail Forex traders who trade via CFDs are able to gain market access due to a system of leverage (AKA margin ratio). Therefore, a trader with a fairly modest trade account of £1000 pounds is able to effectively borrow/control up to 30,000 units (AKA volume) of the base currency, or £30,000 pounds in order to trade the Pound against the US Dollar. This also depends on the pair’s exchange rate (GBP:USD where the Pound is the base currency. A base currency has more value than the counter currency on a unit by unit basis).
In this example, this would equate to approximately £3 per pip movement while trading in GBP:USD should the trader decide to take on the maximum allowed leverage ratio of 1:30 while utilising 3 mini lots per trade (100,000 units is equal to one standard lot, 10,000 is one mini lot and 1,000 is one micro lot).
But it wasn’t always like this: due to the the high number of novice retail traders (70% official statistics) losing all their deposited funds after just six months of trading, leveraged CFDs were restricted in 2018 by the European Securities Markets Authority (ESMA), in order to protect retail CFD Forex traders. ESMA imposed limits on regulated brokers who provide retail CFD Forex trading of 30:1 for major FX pairs and 20:1 for non-major pairs. Before this brokers were able to offer leverage of up to 1:500.
Therefore, leverage provides traders with the ability to trade large amounts of currencies for very little outlay. However, leverage is a double edged sword; because, by its nature it can greatly help to amplify winnings, but, it also increases the risk of substantial losses! One of the biggest reasons why retail traders losie their money is due to a lack of understanding and the misuse of leverage.
Margin
A Margin requirement is the amount of capital in an account that will be set aside in the form of a deposit, by the broker, in exchange for leverage, each time a trade is opened. Margin is calculated by the trader’s level of leverage and is effected by floating profit and loss and can therefore fluctuate up and down. Also, the more open trades the more margin will be set aside by the broker. Should traders open too many trades, or their account start to incur losses, they are more likely to receive a margin call from their broker as they approach their margin limit (a request to put more funds into their account to bring the margin into line) which would only happen in the event that the overall account position was running at a loss, assuming there were more than one trade open. If traders ignore margin calls they run the risk of their trades being closed out by the broker.
Margin call example
A trader wishes to buy EUR:USD with an account size of €1000 and buys 1 mini lot of 10,000 units with a leverage of 1:30, his/her margin is calculated as 10,000 divided by 30 = 333.
Therefore, the traders margin for that trade would be €333.00. If the trader loses money on the trade and comes close to the required margin of €333.00 in their account they would face a margin call / request to add further funds into the account. If the trader refused or neglected to do so, the broker would close the trade on their behalf.
Typically a traders platform will show a running profit and loss in the form of; account balance and fluctuating equity (this will differ if trades are open), the margin being taken up by open positions, free or available margin, and margin level shown as a percentage.
Leverage and margin requirement differ from one asset class to another. But, consistency and careful risk management is essential while considering how to factor these into your trading.
The Forex market dances to the beat of its own drum! Unlike investing in the stock market, where stock prices tend to
https://youtu.be/AZKeGuszjrg
Market Analysis – Know Your Market!
The Forex market dances to the beat of its own drum! Unlike investing in the stock market, where stock prices tend to
Market Analysis – Know Your Market!
The Forex market dances to the beat of its own drum! Unlike investing in the stock market, where stock prices tend to go up and down depending on the performance of an individual company, the movement of currencies in the Forex market is wholly more complicated:
For example, all currencies are traded in pairs, such as the British Pound against the US Dollar, or the Euro against the Pound, etc. Therefore, not only do you have to be fully aware of the fundamental economics of one country’s currency, but you also have to be aware of the fundamental economics of the counter country’s currency of the pair you are trading. The two styles of investment are like chalk and cheese!
When it comes to knowing the Forex market, there are three major factors to consider when trading: Fundamental analysis, Technical analysis, and Market sentiment. Let’s look at these three in more detail: –
Fundamental analysis is the way of studying a particular country’s currency by analysing economic, social, and political forces in order to gauge the current and future outlook of that country’s economy and, therefore, the current and future strength of its currency.
Technical analysis is the study of price movements of a particular currency via the analysis of charts and where certain technical tools are used in order to study historical price action in order to predict future price movements.
Market sentiment Is the overall feeling that traders have regarding a particular currency and where that sentiment might be in contradiction to technical and fundamental analysis of a currency and may therefore cause a trader to abstain from a trade (or to trade counter to his/her indicators) even though the technical and fundamental indicators are telling him/her to pull the trigger.
A good example of market sentiment would be that at the time of writing the British pound is currently being bought against most of the other major currencies, including the US Dollar, the Euro and the Japanese Yen, even though the fundamental indications are that Britain’s economy is slowing and could be exiting the European Union at the end of this month (31st October 2019) without a deal (withdrawal agreement), which could be catastrophic for the British economy. Technical indicators also show that the Pound could move further to the downside, especially against the US Dollar. However, the current market sentiment Is that Britain may find a last-minute deal in order to exit the European Union with an agreement in place, and this would be very good for the British economy in theory, and therefore, the Pound.
And so if the above three components are the major drivers of the Forex market, we should be good to go, yes? Unfortunately not, if only it was that easy! Unfortunately, market sentiment also changes from region to region. For example, the Asian region may have a different market sentiment/outlook from the European or American regions, depending on those markets’ industrial and commercial sectors and their economic activities, including the buying and selling of commodities and goods and services.
Also, the Forex markets operate 24/5, from Sunday night to Friday night (GMT), and market volume and volatility varies from region to region and the different time zones. And as a note of caution, a trader opening a trade at 9 PM (GMT) based on his/her technical analysis, just as the American session is fading, and before the Asian session opens, runs the risk that market sentiment in the Asian area might be contradictory to the US region and therefore adversely affect the outcome of their trade.
Here is an example of how to have a better understanding of trading activity and currency volumes and volatility in the various time zones. Traders are fairly predictable creatures, and most traders work for banks or large financial institutions. These guys and girls are able to independently
move the market with their trade size, which is much much greater than that of retail traders. A retail trader might typically trade a few Pounds/US Dollars or Euros per pip, whereas an institutional trader will be in the hundreds of thousands, if not millions per pip. They are usually paid large salaries and are all under pressure to make money for their firms. Therefore, what we usually see is greater volatility in the Forex markets when they arrive at their desks and especially at the beginning of a new session in a particular region because the traders are fresh, eager, and take advantage of the regional time cross over.
Another time of increased volatility and currency volume in the market Is during periods of economic data releases in the various countries. Price action during these times can be extremely volatile, and the reaction of the market can often fly the face of market sentiment, technical and fundamental analysis, as traders try to decipher economic data release information and how it might impact on a currency’s exchange rate.
With the Financial Crisis in 2008 knocking at the doors of world finance, an anonymous individual known by the name
https://youtu.be/mOliwz08XbY
What are the main attributes of a cryptocurrency?
With the Financial Crisis in 2008 knocking at the doors of world finance, an anonymous individual known by the name
What are the main attributes of a cryptocurrency?
With the Financial Crisis in 2008 knocking at the doors of world finance, an anonymous individual known by the name “Satoshi Nakamoto” invented the first cryptocurrency, Bitcoin. With the cryptocurrency came a publication of a white paper titled “Bitcoin: A Peer-to-Peer Electronic Cash System.” Only a few people got interested in this life-changing event initially, but as time passed, more and more people realized how important this invention is. Many people could not even imagine a global decentralized monetary system.
Interest in Bitcoin and other cryptocurrencies skyrocketed in the past few years. However, many investors and supporters do not know what a true cryptocurrency should be, which caused a lot of new so-called cryptocurrencies to immerge. In order to truly believe in the cryptocurrencies and what they represent, it’s important to understand the fundamental aspects of both cryptocurrencies and blockchain technology.
Characteristics of an open blockchain
Andreas M. Antonopoulos, an author, speaker, educator, and one of the world’s Bitcoin and open blockchain experts, said that five characteristics that a truly open blockchain must be: Open, Public, Neutral, Censorship-resistant, Borderless.
A true cryptocurrency does not know about borders and does not discriminate. A transaction is a transaction, no matter who it comes from. It is irreversible and cannot be stopped or changed once the sending is over. It should be neutral, and it should be completely open. Its code should be free to be seen and used by anyone. One beautiful thing about cryptocurrencies is that they are constantly improved by its users, rather than the government or corporations.
Many companies tried to start their blockchain projects and created their cryptocurrencies. However, their systems are closed and governed by the makers rather than the users. These projects should be differentiated and separated from the true cryptocurrency projects which stand on a different side of the field, representing decentralization.
Cryptocurrencies that do not possess these characteristics are either centralized, non-immutable, influenced by a third-party, or a closed system. Therefore, they are not what a true cryptocurrency represents, but just use the hype created around the crypto and blockchain sector to gain fame and quick money.
Characteristics of a cryptocurrency
Besides the five major characteristics that a cryptocurrency must possess, it has to have these characteristics as well to be considered money.
Demand
The value of a cryptocurrency is directly related to its demand. Put simply, the greater the demand, the higher the value. Demand can be based on many traits that a cryptocurrency offers, but it has to also come naturally from real buyer’s interest.
Usability
Each cryptocurrency is made with a purpose. They can act as money or have some other utility. The more usable a cryptocurrency is, the more people will be interested in it. It is one thing to have demand based on profit expectations and a whole another thing to have people buying a cryptocurrency to use it.
Transferability
A cryptocurrency has to be fast and cheap to use, or it will not be accepted by the market. Many cryptocurrencies have built their entire project around them being fast, cheap, and safe. Another thing is also how fast a cryptocurrency can be exchanged for non-cryptocurrency money.
Ease of Acquisition
Cryptocurrencies are mainly acquired by mining, purchases, and through faucets and other reward systems. The easier it is to acquire a cryptocurrency and a lot of it, the less valuable it will be. However, price increases should not be considered a primary objective when investing in crypto, rather their usability and the market gap they are filling.
Community
As cryptocurrencies are open systems that build their value purely around the support of their users, the community behind it can greatly impact its growth. Having a powerful and big community behind the project gives it credibility.
Security
Cryptocurrencies are secured by the cryptography codes. Every owner should have their private key. Another thing to consider when looking for how safe a cryptocurrency is is its mining system. The more people mine it, the harder it is to perform network attacks. That’s why Bitcoin is still the safest cryptocurrency around.
Hello and Welcome to this latest installment of on-demand courses by Forex.Academy. In this particular course, we’ll be unveiling the mysteries behind Candlestick Formations, outlining how they can
https://youtu.be/MIu9orTEOtc
Hello and Welcome to this latest installment of on-demand courses by Forex.Academy. In this particular course, we’ll be unveiling the mysteries behind Candlestick Formations, outlining how they can
Hello and Welcome to this latest installment of on-demand courses by Forex.Academy. In this particular course, we’ll be unveiling the mysteries behind Candlestick Formations, outlining how they can be used to supplement the training decisions of technical traders. Just before we begin, please do take a quick moment to read through the disclaimer and note the financial risks which are involved in trading the financial markets. Please do feel free to pause this recording so that you are familiar with our disclaimer, and we shall proceed to go through exactly what is involved in this particular course. Hopefully, you’ve had an opportunity to go through this.
Right, let’s look now at the course outline. What we do is we pride ourselves on blending theory with practice. What we look at is the display of price information in itself. We’ll introduce you to what’s called Japanese candlesticks. We’ll look at the history of those candlesticks and the origins. We don’t need to break down into quite considerable detail in terms of the anatomy of a Japanese candlestick, we’ll look at how different time frames can impact the information that we as traders use. We’ll look at the different types of Candlestick Formations. And there are many, many different types. They vary from bullish candlesticks to bearish and also neutral candlestick formations as well. Then we’ll look at the link to charting patterns. Obviously, technical trading is identifying patterns of price movement and the purpose of this particular course is to identify the use of Japanese candlesticks within their overall charting picture. It’s important we do link the two. Then we’ll look at some tools that can be used to assist with decision making on a MetaTrader 4 platform. And we’ll finish the theoretical side of this course by looking at the impact that an understanding of Japanese candlesticks can have on your ability to manage risk and therefore protect your capital. We’ll finish as we always do with a session on the practical application of candlestick formations. We do hope you will enjoy that at the end of this course.
Okay. Let’s begin with the display of price information. Price can be displayed in a variety of different ways. Now, some of those ways include originally more of a ticker-tape type of display of price information. For example, there we’ve got the gold. This happens to be the price information of the gold market, and you can see the price is quoted there on the left-hand side, $1333.72, in this case, because it’s backed by the US dollar. And what we can see for the duration of this is that we’re currently on a daily basis, we’re seeing an increase in the price of $15.32. This is an increase of 1.16% in this particular market. That’s just useful information that we, as traders, can look at that information and we can identify right well currently prices moving to the upside, and we can therefore potentially be able to make decisions off the back of that information. Now in addition to the ticker tape, there’s also things like bar charts which gives you very, very simplistic information. Just an example currently up on the screen now, which will, broadly speaking, give you a very basic understanding of entry prices, exit prices, highs, and lows, or should I say open and closed prices along with high and low prices, as well. It’s just a basic form of what we’ll go on to look at in more detail very shortly, which is candlestick formations. In addition to bar charts, we’ve also got line charts. A lot of these different displays of price action can actually effectively give you similar information. But it’s displayed in very, very different ways. And of course, Renko charts as well. There’s pros and cons associated with each of these forms of price information.
I guess the question you need to ask yourself it is which should you choose? In reality, it doesn’t really matter. It is often a personal decision in terms of how you like the information presented to yourself. Now, they all do have pluses and negatives. I won’t necessarily go into the positives and negatives of each particular type. But what is of vital importance is that you can clearly identify the price movements of a chart in line with your own trading strategy. That’s really the important part to take away from this. However, by far, the most commonly used display of price used by traders globally is, without doubt, the Japanese candlestick price chart. That’s the essence of this particular course.
To give you an introduction to Japanese candlestick formations, I’d like to draw your attention to this chart which we’re just going to put up on the screen. Within the nature of this chart, and I just want to just draw your attention to the fact that this is a dollar related daily timeframe as you can see up the top left-hand corner there, and along the x-axis you will find the relevant date associated with the price information currently up on the screen. And, along the y-axis you will find the price movement. What we’re looking at is the price movement over a particular period of time. Now that gives us some fantastic opportunities for technical traders. We can see that the price is, at this particular time frame, is effectively towards the top left of this particular chart. And, we can see what the price is currently at this particular time frame and we can see therefore what is happening to price between those two timeframes. And that this is why technical charting is really useful. Because we can use a number of techniques necessary to get a feeling and understanding for what’s happening to this market.
To just give you a very quick overview, what is clear to see is this market is moving to the downside. We’re in what’s called a bear market. However, this is where our understanding of Japanese candlestick formations can come into its own. Because at every stage within this particular price movement to the downside, the information that’s displayed through price, and as a result, Japanese candlestick formations, can give traders real significant edge in terms of making their trading ideas and executing their trading plan. And that’s really some of the profound benefits that an understanding of Japanese candlestick formations can have. I just want to draw your attention to a specific part of this particular chart. I’ll just bring that up on the screen. Just looking at this particular price action we can see what price action has occurred prior to this point. It’s just largely, I hope you would agree, it’s definitely on the bearish side. Meaning prices are moving to the downside. That’s effectively what we’re seeing. Now, even within this small sample of this price action, we can make certain assessments of what’s going on with this price. We clearly see that as the market moves lower, it then moves into a period of sideways moving consolidation. And we can actually physically see that play out because of our understanding of Japanese candlesticks, where this market really struggles to break above or to break below these levels. And that’s because we’ve got a comprehensive understanding of Japanese candlesticks. But then something really important and significant occurs. I just want to draw your attention to this particular candlestick here where we get a continuation to the downside. And we can see that with volume and momentum pushing prices lower. And it’s price action like that that can give us as traders a real advantage and a real edge in understanding firstly a broader understanding of price movements on a technical price chart. But it’s the use of Japanese candlestick formations that can really give you a significant edge in terms of making decisions when you’re trading these markets. So that’s just a very brief introduction to Japanese candlestick formations, just the basic principle about how they exist within technical charting.
Let’s now just take a couple of steps back and we’ll have a look at the history of Japanese candlesticks. Let’s start at the very beginning. In the early 15th century, the last feudal Japanese military government, which were referred to as the Shogun Tokugawa, unified Japan by pacifying and peacifiying the 60 different ruling Daimyo Feudal Lords. Now, this uniform unification was quite important. What it did was enabled more freedom to be able to trade between the provinces of Japan. To just sort of give you a bit of an image, you know, these this would be a typical image of a Shogun now. That led to some significant developments. What we then saw in the early 16th century was records actually showed that charts were used for the very first time in Japan. And the use of those charts was to record the price movements of the Japanese rice exchanges. Rice was not only the primary dietary staple of the Japanese people, but it was also essential to the Japanese economy because it was used as a unit of exchange also.
It all effectively started with rice. At that particular time, there was as many as 1,300 rice traders working in the Dojima Rice Exchange in Osaka, Japan. And as trade started to develop and volume started to increase, receipts from rice warehouses were accepted as a form of payment, at which particular point the first futures contracts were effectively traded. And that’s quite significant because from this particular era came a very brilliant rice merchant and his name was called Sokyu Honma, or Munehisa Homma for many in India in the West. Munehisa Homma was widely acknowledged as being, and is broadly known as being, the godfather of candlestick charting. Homma himself became such a successful trader that he developed a series of rules which were called the Sakata Constitution.
Now to just touch upon that. When trading the Sakata Constitution, which many, many traders followed, and its Five Methods, traders could now analyse price movements and be able to identify patterns which exist in the financial markets, or in the market of the rice exchange. This would then help them to identify very, very simple trends in the market and therefore increase the chances for increased profits. This is the beauty about technical charting and our understanding of Japanese candlesticks. That is effectively what it allows us to do. Just to conclude this particular session action, you know, the birth of Japanese candlesticks effectively gave traders the ability to extract some very, very useful information which they could then use to make more informed decisions when trading. And it all started with the beautiful rice, as you can see up on screen. That’s just hopefully giving you a comprehensive understanding of the origins of Japanese candlesticks.
Taking that on just a step, I think it’s useful that we do cover the anatomy of a Japanese candlestick. What I’m going to do is just start with what’s called bullish Japanese candlestick. And this simply means that when we see this on a price chart it means that what we’re experiencing is price moving higher, or, price moving to the upside. To isolate one of these Japanese candlesticks, just to show you what it looks like, it would look something similar to what you’re seeing up on-screen on the left-hand side. Now, it has some very, very important characteristics which I do want to elaborate on. The first one, if we just refer to this particular price point down here, and we’re just talking about the bottom edge of this quite large rectangle, the price that’s quoted when we look at Japanese candlesticks, if it’s green in color is actually the open price. And that is really, really significant. All of these candlesticks open and closes at various different times depending on the timeframe that you’re looking at. It’s important to note that each and every candlestick that’s green in color means that prices are moving higher. And it will effectively mean that the open price is at the bottom edge of the rectangle. Let’s just say for argument’s sake, the price at this level is $185. Now let’s also look at another very, very important part of the anatomy of a Japanese candlestick, and this is referred to as the closed price. What we’re talking about is the top edge of a particular Japanese candlestick, and the fact that it’s green in color means it’s bullish. And it’s very important to note that each and every candlestick has what’s called an open price, but also closing price. Whatever time frame you’re looking at, whatever time that particular market closes, it’ll print a particular price. That closing price is quite significant. Let’s just say for argument’s sake we’ve had an increase in price over the course of the day from $185 to $195. We’ve seen a nice explosive move to the upside.
1540
However, there’s two more aspects to a Japanese candlestick, each and every candlestick, that you need to be aware of. And that simply means the first one is that each candlestick will have a high price. Let’s say for example, over the course of this candlestick the price peaked at $200 before pulling back a little bit and then closing at the $195 level. So, it records the high price. And then the final piece of this jigsaw is that each and every candlestick, especially a bullish Japanese candlestick, will have a low price. This is the lowest price that this market will have achieved over the course of this time period. Let’s say the market opened at $185. We had a bit of a pullback initially where prices pulled back to $180 before a nice explosive move to the upside, making a high, and then pulling back to close. That’s effectively, the information that this can give traders is quite profound. It’s very, very useful if we see a candlestick that looks something similar to this, then we would expect a continuation to the upside. That’s the information that it can give us. And the size of this green body is quite significant, and it will determine how much momentum exists in a market at any particular time period, and point in time. So, the size of this does have an important role to play. Now, this is a bullish Japanese candlestick. In addition, we also have bearish Japanese candlesticks. And this effectively means that prices are moving lower. What we will see now very shortly is the same for price points, however in reverse. We’re going to start as we always do with an open price. This particular market, having broken to the upside, and closing at $195, now looks like it’s beginning to reverse. Because the open price is, once you get a close price on one particular candle, the next candlestick will open with that same price. However, what we’re seeing with this next candlestick is actually the opposite. We’re seeing the prices close much, much lower to the downside. In this case, we’re actually getting a complete reversal of price action. Where prices are opening at 195 and over the course of this candlestick it actually closes much, much lower at a $185. Now in the meantime, it does also print a high price in this market. Let’s say that’s the $200 level once more, before making a nice extended move lower, creating a low price in this market, $180, before we get that same pullback before this market actually closes. What we can clearly see with this price action is we’re seeing a really nice explosive move to the upside in a bullish candlestick pattern and a really nice explosive move to the downside on a bearish candlestick. These are the important things to note and just identify as well. On a bullish Japanese candlestick, you’ll see the open prices at the bottom edge. Whereas on a bearish candlestick you will see the open prices at the top edge of the rectangle. It’s just the opposite applies. And the same for the closing prices. The closing prices can be located on a bullish candlestick at the top edge. And the closing prices can be identified at the bottom edge of the rectangle if this is a bearish Japanese candlestick. Hopefully, that makes sense.
1950
What we will do now is we’ll have a look at the importance of the real body. As we’ve alluded to, the difference between the open price and the closing price of the corresponding markets, you know, is represented as the real body of any particular Japanese candlestick. Whether it’s a bullish candlestick where the open is at the bottom and the close is at the top, the difference between the open and the close and this bullish candlestick, is the real body. And the same for a price action to the downside. The open price is much higher, the lower price is lower, and the difference between those two is the real body in this situation. Okay, moving on then. The closing is often the most important piece of information. The close of a particular candlestick is very, very important for us. It concludes the trading session. Whatever that time period happens to be – whether the timeframe of the candlestick is an hour, whether it’s a 4-hour, whether it’s a daily, weekly, or monthly timeframe – the close gives traders some very, very useful information as it gives an insight into market sentiment.
It’s also worth noting that most technical indicators use the closing prices as the basis for their calculations. That’s very, very important to bear in mind as well, and you’ll see that when it comes to using technical indicators. They’re often based on the closing price. It is of significant importance not just to technical traders who read charts, but also to technical indicators as well. Now the size and the color of the real body can provide useful clues regarding potential price moves. If we’re seeing a series of green candlesticks it means we can expect continuation to the upside. If we get a green candlestick followed by a red candlestick it can mean that potentially we might experience a correction in this market. Or, perhaps even, a reversal depending on the information that we get. That is just touching upon the real body of a particular Japanese candlestick, or, in Japanese is referred to as Jittai. That is effectively the real body of any given candlestick.
In addition to the real body we also, as you can see, we can have a shadow. The reason why they’re called Japanese candlesticks is they can often look like candlesticks. However, we often can get a wick to the upside or to the downside, or, as it’s referred to, as an upper shadow. Which is, in Japanese, is Uwakage. And to the downside we would be looking for the lower shadow or wick, and excuse me if my pronunciation is a little bit off, but, Shitakage. It’s a word that I’ve always struggled with. However, there’s no need for you to actually know that at all. It’s just we emphasize the origins of these candlesticks which is Japanese in nature. What we need to do and identify as traders is, the information that we can glean from upper and lower shadows could be quite significant. They are important. The upper shadow represents the area above the real body, and the lower shadow represents the area below the real body. That’s really what you need to take away. It’s the length of the upper and/or the lower shadow which can give traders valuable information regarding potential price moves. For example, we can certainly see a small wick like this on a lovely green candlestick would signify continuation to the upside. Whereas if this closed, so we open at this price here, if the market pulled right back and we saw a close at this market, more around this level down here just for example. If this market closed at that level down there, then the wick would actually be excessive and that could potentially mean that what we’re likely to get next is a bit of a reversal in this market to the downside.
The information that can be gleaned from our knowledge and understanding of Japanese candlesticks can be really, really important. It can give you as a trader some real significant edge trading these markets. So that’s just a bit of an overview in terms of the anatomy of a Japanese candlestick. In terms of the four price points – the highs, the lows, the open, and the close prices. And also, the real body, and of course the shadow to the upside and the shadow to the downside as well.
Bearing that information in mind, we shall now look at some of the different types of candlestick formations. It’s important to note that Japanese candlestick formations come in all shapes and sizes, however each and every one of them can give a trader valuable information with regards to future price moves. There are three categories of candlestick formations for you to embrace.
The first one is Bullish Candlestick Formation. These can be broken down into three different categories we could have Single Bullish Candlestick Formations. We can also have Two Candle Bullish Candlestick Formations. And of course, Three Plus Candlestick Formations. And that just refers to the number of candlesticks that are involved in that piece of analysis. Without confusing you too much, we also have the same when it comes to Bearish Candlestick Formations. We’ve got Single, Two Candle, and Three Plus Candlestick Formations to consider if we’re looking for what would be regarded by traders, as being those that are proficient in technical analysis and understanding price charts, as being Bearish Candlestick Formations. In addition to price action moving to the upside and price action potentially moving to the downside, we also have neutral candlestick formations. Now these can be interpreted as giving neutral price information. But they can gain also significance when these form part of other candlestick formations. In their own right, they can remain somewhat neutral. However, when we start seeing that the price action, which has come before it, and after that particular neutral candlestick formation, then it can then give us some very, very useful information. Often when we see these, we as traders, we look to pause and to just consider what might occur next and allow the market to determine that decision-making process. All we need to do as traders is be prepared for all eventual outcomes and we can do that in a very consistent way.
We have bullish candlesticks, bearish, and neutral candlestick formations to consider. We’re actually going to go through each form one at a time. I thought that, we thought it’d be quite useful for you to see the variations of Single Candlestick Formations. And all of these have implications for bullish price action. Meaning, when we see these sorts of setups, we can look to stack the odds in our favor in terms of having an understanding, in terms of what might happen next, which is all what’s very, very important for us as traders.
We’ll start with the Hammer on the left-hand side and we’ll work across the screen. The candle that is of real interest to us, and don’t forget these are Single Candlestick Formations. Meaning we’re getting price action clearly moving to the downside one period at a time. And then lo and behold the candle gives us, it prints this particular candlestick. It means we see the low price. We can see the high price in this market. It just so happens to be the open as well. And we can see the close of this market. There’s quite an extended gap between the low and the close, and that gives us some real valuable information as a trader. When we see price action like this, traders consider this fairly bullish in a downtrend. Meaning, we’re very likely to get a little bit of price action as a result back to the upside in a market like this. That’s what we can expect from a hammer. You know, it is important to know the names of these different candlesticks. But there’s so many of them, and all we’re discussing in the next few slides is the major candlesticks. There’s many, many more, however. Probably there’s too many variations. Some, you know, a lot, of these major candlesticks can have real profound impacts on the markets. And there’s others which would just probably confuse traders to some degree as well. We’ve just highlighted some of them, the most commonly used candlestick formations, and we’ll explain the anatomy of the actual Single Candlestick Formation itself and what traders can glean from that information.
When we see a Hammer and it also there’s it’s commonly known that you know this sort of single candlestick formation can hammer out a bottom of a market. So, you’re getting that quite explosive move lower. The market puts in this candlestick and this gives fantastic opportunities for traders to start pushing this price higher. Therein lies the potential for us as traders to see this kind of price action and then act accordingly. If you decided to buy above the high of this, it has the potential to give you a significant risk reward potential to the upside if you see this kind of price action.
Moving along then to an Inverted Hammer. This time, as you can see, we’re going to focus very very carefully on the anatomy of this particular candlestick just in here. It’s just middle one that we’re really focusing on. What we’re seeing is that again that price move consistently, make new lows. We can clearly see that price action is moving lower and what we see then is an Inverted Hammer. It’s the same as the Hammer, it’s just the actual hammer end is at the bottom of the shadow rather than at the top. But for all intents and purposes when we see this price action it’s referred to as an Inverted Hammer. And what the signal that that sends to traders when they trade is that is potentially considered bullish in a particular downtrend. Again, we are prone to this kind of price action and there’s no guarantees that this market will behave like that. But you are stacking the odds in your favour if you can identify this price action and perhaps you… we’re going to look at the approach to risk management very shortly. But what you’ll often see is a reversal in prior action. And it’s not guaranteed every single time. It’s just you’re probably stacking the odds in your favor more by utilizing your understanding in this way.
Moving on to a Dragonfly Doji now, so what we’re seeing in this market again is this market continued to move to the downside and on this occasion, we make a low in this market. But as you can see, we get a bit of a reversal on price action and what this is telling us is the open and the close of this market is exactly the same however, and the high should I say. There’s a lot going on here with this candlestick. The market opens, it moves to the downside. There’s a complete reversal, and a rejection of these lows, and we get buying pressure coming into this market to such an extent that the open, the close, and the high of the market is exactly the same price, or very, very close to being the same price. Again, what you’re likely to experience is that the longer the lower shadow signals are, the more potential for upside movement. When this appears at the bottom it is considered to be a fairly strong reversal signal. Looking for Dragonfly Dojis can give traders a real advantage and as a trader you can make that decision to look to drive that price back to the upside. So that’s Dragonfly Doji Single count Candlestick Formations.
We’ll just finish the fourth one, which is bullish spinning top. This one I want to draw your attention to this middle candlestick just in there, and we’re getting some bullish price action now on this particular situation and we get to see a brand new high in this market. However, the market at some point sort of reverses to make a considerable low and it struggles to get back up to those previous highs. That effectively, is referred to as a Spinning Top and it’s a Bullish Spinning Top just because it’s got a significant bullish, it’s green in color, so it has a bullish connotation to when we see this on a price chart. So, the size of the shadows can vary and are probably less important unless they’re quite extreme. And if we see this kind of price action, and certainly if we get a break above the high price, then we’re very likely to see continuation and is viewed by traders as being quite bullish in an uptrend. It’s important that we do see the bullish price action prior to this candlestick and if we get a break above the high, we’re very likely to see a continuation to the upside. And this is how traders utilize these formations to understand exactly what’s going on with price, and what is the likeliest next in these markets. That’s just an overview of four of the main Single Candlestick Formations.
3550
What we also have is Two Candlestick Formations, as well. Again, we shall go through these one at a time. We’ll start on the left-hand side and we’ll look for Bullish Kicker Candlestick formations. Now we’re effectively looking for two candlesticks. It’s not a single candlestick that can give us the information, it’s actually what’s going on in the relationship between two different candlesticks. What we mean by that is we’re seeing in this example we’re seeing price move lower and then we see this candlestick printed. This is candlestick 1 for us, and we’re also looking at this one just above. And what information does this kind of price action give us? What I’ll do is I’ll just place this 2 just above this particular candlestick just so that you are comfortable in terms of which two candlesticks we’re referring to. We can see on this fourth bearish candlestick that price is closed lower it’s very, very bearish in this particular market. But on the very next period or the next day, if this is a daily timeframe, what we can see with the next candlestick is that we close down here, however we open significantly higher. In fact, we open above the previous candlestick. If this is the open of the previous day, we can see the open is just above it, however the closed price is quite significantly lower than that particular level. We see the close of this candlestick, we see the open. But we also, most importantly, see the open of the new candlestick. And in a situation like this it’s regarded as being very, very bullish indeed. It’s considered bullish when the next green candlestick gaps to the upside. So, there’s a gap in there and it just means that a lot of the sellers have been blown out of the water. Those that look to buy markets like this will look to aggressively push higher. Again, not every single case. But certainly, the odds would be stacked in your favour if that is the case more often than not.
Moving on then to a personal favourite of mine which would be Bullish Engulfing. Here what we can see is again we can see quite consistently a series of markets. These don’t necessarily have to move in a linear fashion, these could be a little bit erratic. But what’s important to take away of this is the previous candlestick. I’m looking at Candlestick 1, and also the very next Candlestick 2. And it’s these two candlesticks which interest us. What we can see is this market open lower and we can see that the close of this price is significantly higher. And what it does is it completely engulfs all of these candlesticks. They’re completely engulfed by one day of price action, if this happens to be daily timeframes. Whatever this period is, it doesn’t necessarily matter. When you see a print of a candlestick like this, it effectively blows all these candlesticks out of the water and we get to see some real dominance in this market. What this means is quite bullish if we see a bullish engulfing two candlestick formation which exists. We need to engulf the previous candlestick and if that occurs to multiple candlesticks, that’s even better, and it adds more credibility to the trader and certainly more confidence in that market. It’s considered a major bullish signal in a downtrend if this market is moving lower, we get a Bullish Engulfing, and we can often see some really nice explosive price action to the upside. And I’ll show you some practical examples of this very shortly.
Moving on then to Bullish Harami. In this situation we’re getting some quite considerable selling pressure. You can see its kind of an inverted Bullish Engulfing. But we’re seeing a complete dominance to the downside until we get this. Again, in this situation we’re looking at Candlestick 1 and we’re looking at the very next, Candlestick 2, and we can see that that price opens, closes, high and low is all contained within the price action of the previous candlestick. What this does, as far as sellers is concerned, is put a question mark in their mind. Would they expect to see further continuation to the downside once we get a bit of a Bullish Harami in this situation where we’re actually getting a close much lower and we’re getting the open much higher within that candlestick? That creates a bit of doubt in the minds of sellers. And it gives bullies a fantastic opportunity to look to capitalise on this price action, look to get into this market, and look to drive this price higher. This is stacking the odds in your favour again to the upside if you identify a Bullish Harami in this way. It’s considered a bullish signal in a downtrend.
That’s the Bullish Harami and we’ll just finish the Two Candlestick Formations by just reviewing what’s called a Piercing Line. What we’re seeing in this particular candlestick, and again, I would like to I would like you to draw your attention to these two candlesticks in here, one bearish, one bullish. I just put those numbers just above these candlesticks, and what we’re seeing is price action move consistently lower. And the fourth candlestick here is what is of interest to us. We’re actually seeing the next candlestick open much lower, and the price action actually pushes lower. We’re clearly operating in a price action that would be conducive to sellers until price starts to reverse, and we start getting this little bit of buying pressure coming in. And what’s often identified is 50% of the previous candlestick is really what’s quite important. What we’re seeing is we’re actually getting a close of this market above. We’re seeing before our very eyes a bit of a rejection of the previous price action having made new lows. A lot of this starts to stack up in the minds of a trader, certainly those that are looking to buy this market and they’re seeing the rejection to the downside. They’re seeing the market open lower, which is quite bearish, and we’re seeing a reversal of that bearish price action. And we’re actually seeing the market close above 50% of the previous candlestick.
44
With all this in mind, and what this has great potential for, is some nice explosive price action to the upside, and start printing new highs from these levels. So, it’s considered a bullish reversal signal when it opens lower but closes back above halfway of the preceding candlestick. These are just metrics, it’s roughly 50%, but you know you don’t have to be too precise with that. But you just got to be open to the fact that it’s a clearly defined reversal signal and we’re very likely to get some bullish price action off the back of a piercing line. Those really are your two candlestick formations to the upside where you’re likely to get some bullish price action off the back of them.
Let’s finish the Bullish Candlestick Formations and we’ll look at Three Plus Candlestick Formations. Now, you know we’ve identified four main Three Plus Candlestick Formations. there are more out there. But these will certainly give you a very comprehensive understanding in terms of what is going on in these markets if you’re able to identify these candlestick formations. We’ll start again on the left-hand side by looking at the Morning Star. What we’re seeing in this kind of price action is price consistently moving lower. The reason why we’re looking at a Three Plus is that it can contain three or more candlesticks, effectively. Now, we’re looking at this first candlestick, this second one just in here, and we’re also now looking at the third candlestick for us to get the information that we need to really act and to utilize this information. What we’re seeing is three days of bearish price action, if this was a daily timeframe. And the fourth candlestick actually gaps down lower. But it doesn’t continue lower. As you can see, we have a green body which is actually bullish in nature. What we’re seeing is effectively a reversal signal even though this market is gapped lower. We’re clearly seeing the close of this market and the open considerably lower. This is effectively the gap in this market. that is not to be ignored.
When we see these gaps, you know, what price action do we see next? And we see the fact that, in fact the open of this market is even lower than that. This is the gap which is quite considerable and what we see price action do next is make a new low, and then all of a sudden, it actually becomes quite bullish where we actually close higher. And then that extended that is extended in the third candlestick and then you’re very likely to see that for subsequent candlesticks. It’s just being a little bit patient, you’re seeing this price action. It might be more prudent for you to get into a Morning Star after the third candlestick which is actually closed. And that can give you the very important information to be able take this market higher. Now there’s all sorts of variations with this third candlestick. It can close much, much lower and that might mitigate the potential for such a strong reversal signal. So, we need to see some bullish price action off the back of the gap, lower. This price action is considered a major reversal signal in a downtrend. The market has to be moving to the downside and if we see this price action with two and three, we’re very likely to see continuation to the upside, in this example.
47
Moving on to Bullish Abandoned Baby. Again, just to identify that this market is moving lower and the three mark, the three candlesticks, we’re really interested in are these three, as you can see. When we go to the first candlestick we can see, we see a normal sort of consistent move lower. We are in a downtrend and what we see is an Abandoned Baby. All of these names are weird and wonderful. You know you don’t necessarily need to memorize all of these different types of candlestick formations. But what you do need to understand and comprehend is that you know when you see price action like this it can look and it can become very, very bullish. What we’re seeing is a considerable gap lower where this market again gaps down quite considerably. We’re seeing a really significant gap in this particular example; however, it doesn’t continue lower. We get a little bit of a reversal pushing to the upside and then the very next day, if this is a daily timeframe, the market actually gaps again to the upside. Without confusing you too much, we get two gaps in this market and this is very, very bullish indeed if we get this kind of price action. We’re getting two gaps in this market and then we need to literally wait and see what happens to the third candlestick. And if the conditions are right, then you’re very likely to experience a considerable reversal in this market. It’s considered a major bullish signal in a downtrend. That is a Bullish Abandoned Baby.
Moving on then to Three Soldiers. What we’re seeing now in this particular situation is continuation to the downside, as you can see. And the three candlesticks we’re looking at in particular would be… this market continued to move lower, and it’s these three candlesticks that get to offset a lot of the bearish price action in the action in the candlesticks which came before it. What we’re looking for here is three long green candle sticks with consecutively higher closes in a downtrend. And this is considered a very, very, not a significant, reversal signal in this market. We’re getting really quite significant price moves to the downside. But then this particular market fails to make a new low and we actually start printing three consecutively higher you know long green candlesticks. In this situation it’s the size of the candlestick which is quite important and as you can see these are three significant bullish candlesticks which means that if we can mitigate most of the previous price action then it’s looking considerably, significantly, bullish to the upside in this situation. So that’s Three Soldiers in a downtrend.
The the final Three Plus Candlestick Formation is Three Line Strike. This is, as you can see, sort of fairly similar to a Bullish Engulfing if you see this in a downtrend. What we’re needing to see is we’re kind of looking at, and this is why it’s Three Plus, we’re kind of looking at these three bearish candlesticks and then we’re seeing the fourth candlestick which completely blows these three previous candlesticks out of the water. It’s considered a major bullish reversal signal when in a downtrend. You can clearly see that opportunities to buy perhaps above the high would constitute continuation to the upside in price action like this.
Okay, so that concludes an overview of the different types of Bullish Candlestick Formations. I’ll take off those scribbles and we’ll move on with the presentation. We’ll look into this time Bearish Candlestick Formations. Again, as you can see, a lot of these names are very different, there’s aspects which are similar. A lot of these are very similar to the Bullish Candlestick Formations, just they’re actually more bearish than bullish. When you identify opportunities like this in the market, you should be looking for opportunities for these markets to be moving lower, in this case. And we’ll start again with the Hanging Man, and again this is a Single Candlestick Formation. Again, what we can see is a little bit of a reversal in this situation. It’s kind of the opposite of a Hammer. What we’re seeing now is price action squeeze higher and we’re seeing this one candlestick, just in here, which opens above and then starts to push much, much lower, create a low in this market, pullback, and is still looking a little bit on the bearish side. And if we get continuation the following day then what we’re likely to see is a nice a nice move lower. The lower shadow should be at least twice as big as the body. And that’s an important aspect of this market. If we’re saying the body of a Hanging Man, it would need to be at least one third of the overall range of this market. Meaning you want to see a long lower shadow, at least twice as long as the body, otherwise it means something slightly different.
It’s whether a market conforms to this type of price action which will determine what your steps are, what potential trade ideas you could look to execute. As you can see we’re getting a little bit of a reversal price action off the back of a Hanging Man. It’s just called a Hanging Man just because it gives the appearance on a chart, you know if this is a man’s head, then he it gives the appearance that it looks like he’s hanging there. Okay so it’s a bit morbid, but it is referred to as a Hanging Man.
So, in addition, moving on to a Shooting Star. We’re seeing quite bullish price action as you can see. We make a brand-new high which is obviously great at the time, however we start to reverse this price action and actually we open at this level and we close much lower. That is significantly bearish and what it means is, this is now a Shooting Star and it’s considered a significant bearish bit of price action in an uptrend. What we’re needing to see this time is market looking like it’s just about to roll and it could give you fantastic opportunities to take this market lower if you see price action like that.
55
Moving on then to Gravestone Doji. We’re seeing this market push higher on this occasion. And on this occasion, we’re looking at this candlestick in here. Again, this middle one just in there. That’s what we would be looking at. And again, the Gravestone Doji candlestick means that this market pushes higher. But as you can see it rejects the high, starts pushing to the downside, and this time it’s a very similar bit of price action to the Dragonfly Doji which is quite bullish. Now, the Gravestone Doji is actually quite bearish. I’m going to just remove this here, hide, so it doesn’t confuse you. We’re actually now seeing the low-priced the open and the close all at the same level and this is very, very bearish and can give traders fantastic opportunities to actually look to take this trade actually to the downside. When this bit of price action appears at market tops it is considered to be a reversal signal and quite a significant one at that.
So, moving on then to Bearish Spinning Top. We’re seeing this market continue. It’s the opposite of a Bullish Spinning Top where we get a bit of indecision in this market you know; this is the candlestick we’re looking at. We get a bit of indecision in this market; it has the potential to reverse. A break above these highs could potentially mean that we could be reversing to the upside. However, what we actually see is the market continued pushing lower. That is actually quite important where we can see continued sort of bearish price action. What should be taken note of is the previous price action which has been quite bearish, and also the size of the shadow itself to the upside or the downside can vary somewhat. And you’re really needing to see the continuation of prices pushing lower. And under the circumstances like this, this is quite a Bearish Spinning Top. You’re likely to see prices move to the downside.
Okay, those are the Bearish Single Candlestick Formations. Moving on then to the Two Candlestick Formations and we’ll start with the Bearish Kicker. Which is the opposite of a Bullish Kicker. We’ll start with this one first. We’re getting we’re seeing consistent price action to the upside. The candlestick we are looking at is this candlestick in here, and also this second candlestick here. And what we’re actually seeing is the market close so much higher, and it actually gaps lower. We actually open considerably lower than the close of the previous candle and it actually gaps lower. It actually opens beneath the open of the previous candlestick. That is quite significant and quite bearish in its own right. And off the back of that you’re very likely to see continuation of prices pushing lower. it’s considered bearish when the next red candlestick gaps to the downside. It’s the fact that we’re experiencing a gap and the nature of this second candlestick is red in color and quite bearish. Meaning we’re very likely to see price action squeezing lower.
Okay, moving on now to a Bearish Engulfing. This is considered a major bearish signal in an uptrend. Again, you know these are personal favorites. I do like to see price action squeeze higher. So, this is Candlestick 1, and this is Candlestick 2 that we are interested in. And actually, this engulfs this bearish candlestick. It engulfs the previous price action of all three candlesticks. But the previous one is a starting point, and if it engulfs more candlesticks than that, then it can just add more conviction to the trades that you’re looking to take. And as you can see, the open and the close blow these bullish candle sticks out of the water. And we’re going to we’re very likely to see continuation of prices moving to the downside. When you see a Bullish or a Bearish Engulfing Candlestick you should sit up and take note of that price action because you’re very likely to see some significant opportunities off the back of it. It is considered a major bear signal in an uptrend. You’re getting prices moving higher, you’re getting reversal signal, and you’re very likely to see prices push lower.
Okay, moving on to Bearish Harami now. These candlesticks, like we saw in the Bullish Harami, in this occasion is pushing higher and we see price action contained within the previous candlestick. This is kind of stick one that we’re looking at this is candlestick – we can see that the price action is contained comfortably within the range of the previous number one candlestick which is quite bullish, and the nature of the Harami is bearishness in this situation. And what you’re likely to see in a situation like that is continuation of price action actually to the downside. It’s considered a bearish signal in an uptrend. That’s something for you to consider. A Bearish Harami.
We’ll just finish the Two Candlestick Formations by looking at a Dark Cloud Cover. This is an interesting bit a bit of price action. What we’re seeing in a situation like this is that this is very much considered a bearish reversal signal when it opens higher but closes back below halfway of the preceding candlestick. That is significantly important. What we’re seeing is price action look quite bullish where we’re getting this this little move to the upside. It’s quite similar to the Piercing Line. But what we see is prices open higher, which is bullish at that particular point. And what we are looking at is Candlestick 1, and also Candlestick 2. What we need to see is prices push higher and then a bit of a reversal of that particular price action. However, it’s important that approximately the market reverses quite considerably so that we break below the roughly the 50% level on Candlestick 1. And that’s really structurally quite important because what you’re likely to see when you see setups like this is a continuation to the downside. It is considered a very bearish reversal signal when it opens higher but closes back below halfway of the preceding candlestick. And you’re very likely to be able to capitalize on a bit of a price move to the downside in this market if you’re trading a Dark Cloud Cover. Okay, so that covers some of the major Two Candlestick Formations.
We will finish the Bearish Candlestick Formation action with looking at Three Plus Candlestick formations. We’ll start as we always do on the left-hand side looking at an Evening Star Formation. What we’re looking at here is some bullish price action or what we should be looking for is some bullish price action. The three candlesticks we’re very interested in is one, this little candlestick up here, and then the third one in play there. And potentially subsequent candlesticks as well. But we work with these three for the time being where we get a close of the candlestick number one. We get a considerable gap higher in this market and that’s quite important because that’s referred to as an Evening Star. And what we’re seeing is in fact I’ve kind of done it again. But what we’ll do is we’ll work with the level at which this market opens, which is that high of the rectangle on a bearish candlestick. We’re getting a considerable gap in in this market. It’s important to consider that prices have gapped to the upside. But we’re getting a bit of a reversal price action. We’re looking like we’re going to close this particular gap. And potentially, if it breaks lower then we’re likely to get continuation to the downside. When we see an Evening Star it’s considered a major reversal signal in an uptrend. We’re very likely to see that bit of price action look to squeeze lower in a market like this.
Moving on this time to a Bearish Abandoned Baby rather than a Bullish Abandoned Baby. We’re seeing the market look quite bullish which is making new highs, the market gaps up. The gap is quite interesting. I’ll put G for gap. But the market fails to make considerable highs and actually starts to reverse. The close of Candlestick 2. I’ll put 2 in here, and then number 3 down at the bottom. The close of Candlestick 2 is quite significant because if we get a smaller gap it doesn’t matter the size of the gap necessarily. But in this example, we’re getting a smaller gap. But we’re getting continuation with Candlestick 3. And that’s the important part of a Bearish Abandoned Baby is that you’re seeing this abandoned baby here at the top. But now you’re getting some quite, these are quite good, bearish signals for us as traders to try and take advantage of. And it’s considered a major bearish signal in an uptrend. Okay, that’s the Bearish Abandoned Baby.
Moving along, let’s have a look at the Three Black Crows. This is similar to the Three Soldiers in a Bullish Candlestick Formation. What we’re getting this time is some initial bullish price action. What’s interesting for us to look at in this situation like this, is a bit of an unraveling of those of previous bullish price action with three very, very bearish candlesticks. What we’re looking for here is three long red candle sticks with consecutively lower closes in a downtrend. This is considered a significant reversal signal when you see price action like this. You’re very likely to see continuation to the downside if you see Three Black Crows. They mitigate against a lot of the work by the bulls in this market, where price action is pushing higher. Now, these three back-to-back Black Crows are very likely to give extended opportunities to the downside and become quite bearish.
And just the last one, an Evening Doji star. This is what we’re currently seeing up on screen now. Again, the three candlesticks that we’re looking at is Candlestick 1, Candlestick 2, and also Candlestick 3. And what we’re seeing is some bullish price action pushing prices higher. We can see that the close of candlestick number one is quite significant and certainly pushing higher and the open absolutely gaps to the upside on Candlestick 2. There is a bit of a gap to the upside, which you may think looks quite bullish, but what we see is we get actually a bit of indecision in this market. We can’t push higher; we can’t push lower. The open and the close price of Candlestick 2 is actually the same. What it, it puts it some indecision in the minds of those buyers because now they’re there, they’re looking at this price action, and they’re actually anticipating opportunities for sellers to enter this market and to drive prices lower. At which case, if we see Candlestick 3 start to move to the downside, then that, for all intents and purposes, signifies a significant reversal signal in what was an uptrend. It is considered a very very major bearish reversal signal. When we identify it in an uptrend prices have to be moving to the upside, we need to see the Evening Doji Star and then we need to see price action look to reverse. Then that can give us some fantastic opportunities to the downside. Okay, so that’s an overview of Bearish Candlestick Formations.
There’s one set of candlestick formations that we need to look at, and that is those candlestick formations which are Neutral in nature. These candlesticks are very much neutral by nature but can gain significance when they form part of other candlestick formations. It’s actually what often precedes it and then comes after these candlesticks is what can give us some very very useful information. We’ll start by a very popular candlestick which is called a Doji Candlestick. Now, for all intents and purposes, when we see these candlesticks on a price chart it creates some indecision. Meaning it’s largely neutral. We don’t know whether buyers or sellers are in control of this particular market. It’s very, very neutral in nature. But what we’re seeing technically is the market open. It doesn’t matter whether it’s moved higher or move lower. Let’s say for example it’s moved higher. We’ve made a new high in this market. We’ve also pushed lower and made a new low and price comes back to close at the same level as the open. This is the anatomy of a Doji Candlestick in this situation. These largely Neutral Candlesticks have long shadows but very smaller or non-existent bodies. The size of the shadow can vary greatly. We can have normal Dojis and we can have a long-legged Doji Candlesticks as well and that just sort of tends to give the impression of some considerable extended indecision in markets, depending on the size or the difference between the highs and the lows in markets like these. The size of the shadows can vary and can vary quite dramatically. But they really do gain importance when they form part of other formations. And what we mean by that is if the next candlestick starts to push to the upside, then that lends itself to some continuation in prices looking to push higher. The same to the downside if we start breaking the daily lows, then you’re very likely to see a price action move lower. That’s effectively what can happen with these price moves, you can have prices moving higher or you can also have potentially prices moving lower off the back of what is a Doji Candlestick. So that hopefully gives you a bit of an idea. But you know traders do understand these candlesticks as more like indecision candlesticks rather than neutral. I do bear that in mind as well.
Moving on then to Spinning Top Candlesticks. These are quite similar to Doji Candlesticks however the main difference is the real body, which you can see from a bullish perspective and also from a bearish specific perspective. These largely Neutral Candlesticks have long shadows. But very, very small bodies, as you can see. Now the size of the shadow can vary again quite considerably. These can be quite extended, or they can be quite short, and they gain as well importance as a part of other formations. The same thing applies. If we get price action breaking above the high, we’re likely to see continuation to the upside and a break beneath the low we’re likely to see price action move lower. And the same for a Spinning Top which has a bearish viewpoint to it we’re likely to see prices squeezed lower and we are also potentially likely to see prices move higher. It actually depends on what comes next. And we also want to take note of what comes before it you know if we’re seeing some bullish price action, we might get continuation, or we might get reversal. It’s really identifying what comes before and then making decisions in terms of what we’re likely to see next. Those are Spinning Top Candlesticks.
Moving on then to Marubozu Candlestick Formations. As you can see, as opposed to a Doji Candlestick, where the high and the low, and the open and the close, should I say are exactly the same, the opposite of that would be a Marubozu Candlestick. Where the open and the low price, the open and low, and the close and the high. That’s what we’re seeing in a bullish Marubozu and it’s the opposite way around. Now we’re seeing the open plus the high price and the close plus the low. That’s what we’d want to bear in mind when we’re talking about Marubozu close is that we’re getting the highs in the close and the opens and the lows which is virtually the same price. A normal or long candlestick with no shadow meaning the high price and the low price represent the opening and closing prices of the respective Japanese candlesticks. That’s just an explanation of what we’re seeing. We’re just seeing an accumulation of prices stacking up. And these are always quite interesting because again we’d be interested to see whether from the close whether this market starts to move lower or whether we start getting extension pushing higher. We can actually it can actually work both ways off a candlestick like this either to the upside we’re likely to see prices push higher off that level or also potentially push lower. That’s the situation regarding Marubozu Candlestick Formations. And again, in their nature, all of these three are relatively neutral or create indecision let’s say for technical traders. But it all can contribute to a coherent approach to trading these markets.
Let’s move on then and we’ll look at you know different time frames and the different information that can be gleaned from looking at different time frames. Now, it is very important to note that you can view candlestick formations in different time frames. The larger the time frame normally, the more important the signal can become. And to show you this I’d like to bring up a price chart. Let’s review a live chart to explain this in more detail, excuse me, let me take that back and let me get up the price chart here for you. What we’re currently seeing on chart right now and if we do our technical analysis, we can see there’s effectively a double bottom here. There’s potentially a little bit of the potential for this market to eventually maybe squeeze higher. We’d be looking at these levels in here to see if we get a bit of a push higher. Now we’ve just had a pullback off these levels. That’s quite interesting, so you know this market could very easily you know look to squeeze higher or could look to squeeze further lower as well. We want to bear that in mind. We can quite clearly see over the course of this time frame, and a this is an hourly candlestick, each one of these candlesticks that you’re currently seeing up on screen represents various different information on an hourly basis. We can see our Doji candlesticks and we can see the price action of this hour. We can see nice big extended continuation candlesticks. We can also see you know Bearish Engulfing and there’s a whole myriad of different types of candlestick formations that we can use.
Now to just sort of highlight and show you, and this is a live chart currently, we can do our analysis on this time frame. I want to go through the time frames and look at higher time frames and see how the picture starts to change. You can see that we’re kind of getting a bottoming out of this market. We’ve kind of created a double low on an hourly timeframe. Let’s look at it on a on a four-hourly chart. You can see this this convergence down here at the bottom of this price. We’re struggling to break beneath this level here above the 131 level. And this is the EURJPY. Now, each of these candlesticks represent four hours of price action. You can get your Marubozu Candlestick on a 4-hour chart which is the open and the high is exactly the same as the close and the low, which you would expect continuation, which we see we get a little bit of a pullback and then we get continuation to the downside. And you get your Bearish Engulfing in there as well and you get this sort of grinding price action, you know squeezing prices lower. We’re currently struggling to break beneath the 131 roughly down at this bottom right hand corner. We might see some continuation pushing higher. But generally, prices moving from top left to bottom right.
The timeframe that you look at is of significant importance to us as traders because our impression can change slightly depending on the timeframe that we look at. We take this information on to a daily timeframe and now we can actually see, we can conduct a little bit of technical analysis. We can see that this level is quite important. We can see our Bearish Spinning Top Candlestick and we can also see our Hanging Man which is not quite made the low. But you can see this Hanging Man which is actually today’s candlestick. Let’s see what happens what we’re seeing is a bit of bearish price action which precedes it. Really, we would be looking to see, what happens next would give us some really interesting information. We can give that some very, very interesting very easy and straightforward candlestick fashion candlestick analysis and technical analysis to this chart, to give us a little bit more information. But you can see we’re on the back end of a quite considerable move lower and we’re getting a bit of a rejection of prices moving lower in this situation. You can therefore make decisions based on different time frames. Based upon the different opportunities that may exist. You might find some buying opportunities on an hourly chart, whereas if you can move up the time frames, you can see sort of a little bit more clearly.
You can see that we’re actually now looking at a weekly time frame. We’re in a significant bull run basically since 2016. Prices are moving higher over this particular time frame and we’re seeing a bit of consolidation around these levels which just coincides with our very briefly drawn level of support around the 130-147 level and we’re getting just prices just gathering around this level. When you go through the different time frames, you can then see again we’ve got a Bearish Spinning Top, and it all depends on what happens next. And if what happens next puts a bit of indecision in a trader’s mind, then it can give opportunities for traders to actually look to take this price even higher. It can very much, when you go through the time frames and you look at Japanese candlesticks, it can very much give you a different impression in terms of the information that you need. Now again, you go even higher than that. And without the need to confuse you to any great extent, you can see that we’ve got a Bearish Engulfing. On a monthly timeframe if you if you happen to be trading really, really long timeframes, you would expect continuation to the downside. We’ve got highs, we’ve got lows, we’ve got swing highs again. This could be a high of this market on the top left-hand corner. We have a lower high, and now we have another lower high once more. And when you mix that with your understanding of Japanese candlesticks and perhaps Bearish Engulfing, and we’re seeing the same again, we’re just likely to get some continuation in this market pushing prices lower. That’s how you can use different timeframes and your understanding of Japanese candlesticks and if we get a break beneath the monthly low, then we would expect and anticipate, on a monthly timeframe, for this market to move lower.
Of course, your approach to risk may deviate somewhat and I shall explain that very, very shortly. But that’s hopefully just explained to you that how different timeframes can impact the decisions that we take as traders.
Okay, and just to link and I’ve kind of just alluded to it, but it’s also important to note that candlestick formations do not necessarily need to stand alone when it comes to decision making as a trader. They can form part of a much, much bigger picture. For example, you can often, you can often see a situation on a price chart where you identify a candlestick formation. But it forms part of a bigger charting pattern. As a result, the idea is for you to use the information a price chart can give you to formulate trade ideas. It’s effectively looking to put all these things together. I just want to share this chart with you, it’s a static chart. We’re getting some price action pushing higher, we can see that we get a bit of a pullback in this market, and then we push considerably higher withso.me considerable momentum. When we look at a price chart like this, we can see that we’ve had some rejections here to the upside and it’s a very, very poorly constructed Bearish Spinning Top which has the potential to see these prices move lower. However, it would certainly look to create a bit of indecision. We’re not necessarily suggesting that you need to trade all of these decisions or you can even make money on all of them you may do for a particular period of time.
But you need to take into account you know a lot more information perhaps previous price action and seeing how things develop and unfold. But you’re getting quite a number of very sort of bearish price action in markets like this. You’re getting a triple top which is important, and another sort of charting pattern that we can see would be a kind of a Head & Shoulders. You can see the symmetry moving across this price action. If I just draw sort of fairly simple lines you can see that we have our shoulders here and you could see that this could formulate a fairly easy to identify head, followed by another shoulder. And it’s the symmetry of price action like that which can give us really, really useful information. If we’re coming to the price action like this where we’re getting a bit of a Spinning Top, and a bit of price action which is looking kind of like a Shooting Star, slightly bigger Shooting Star, then you know all of these price actions don’t necessarily need to conform to any great extent. They need to be variations of candlestick formations that you identify followed by a Bearish Spinning Top. And then, that’s just very likely to see continuation of prices moving lower before you get your major Bearish Engulfing Candlestick which is quite bearish looking to take this market lower.
But from a from a technical perspective we can look to put information together in a very coherent manner to decide what we should do with these markets. We can have charting patterns, we can have our Head & Shoulders price action, and if we blend that nicely with our understanding of these candlesticks, we can look for really, really prime opportunities to get into this market with the view to look to sell it and look to capitalize. And then when other charting patterns start to materialize, you can formulate an extended trade plan on that basis. That’s just hopefully linking our understanding of Japanese candlesticks which can be standalone decisions that traders can make. And if you can blend them in with charting patterns, because the you know Head & Shoulders, in this example, is quite bearish in its own right. You can put your understanding of Japanese candlesticks, and your understanding of charting patterns as well, you can put those together and formulate a really useful approach to trading.
Let’s have a look at some technical tools now that can be used to assist with decision making. Let’s take a look at some of the technical tools that you can use on a live price chart. I’ll bring up our live price chart again and we will move this along a chart. We can see this price chart up on screen, and some of the tools that we can use, we can certainly label certain bits of price action in here. What I’m going to do first is just identify this price action on this chart. And I’m going to identify, or isolate should I say, these three bits of price action. When we identify, and what we’re looking for, is almost big-picture moves. We’re looking to see you know what occurs in these levels. Is there anything that I can identify from this that can give me useful information? The answer to that question is sometimes it might do, sometimes it might not, you know. This is where skill and experience starts to come in. We’re looking for these major highs and major lows, and identify, can any decisions be made off the back of this can we see rejection on numerous candlesticks and can we see potentially some bullish price action entering this market.
I’m going to look at these three in turn and then as this market sort of clearly breaks to the downside, can we see anything that we that we can suggest that might be significant to us when we trade. This is the principle and the approach that traders are going to take with regards to formulating trade ideas. And this is where our understanding of Japanese candlesticks can come in quite nicely. Just to identify, we’ll have Candlestick 1, Candlestick 2, and we should also look at Candlestick 3. What you can do when you identify these interesting situations on a chart, we can sort of utilize some of these tools up here. You can put a little text box in here and Candlestick 1 for us and would be a Shooting Star. Put that in there. What I’ll do as well, I’ll just change the format. You can change the color, you know, it’s a Shooting Star, it’s bearish in nature. And maybe just reduce the size down a little bit. We could put that in here. You can identify that particular chart, we’ll have a look at chart number two. We put another label onto that. This is a Bearish Spinning Top, if you can see that chart in there now. What we can do is we can slide this, sorry, I just move the chart ever so slightly. So there we go. So that can be charting pattern number two, and we can look at Candlestick 3 there and we can place that in there. And we can look and assess the characteristics of that particular candlestick, and it’s actually, what we see, there’s a couple of sort of bearish candlesticks in there. You have a Bearish Engulfing and also a Gravestone. All of these are as you can see, let me just move this across. Just these two candlesticks in here, Bearish Engulfing, I’ll just bring it down the bottom there you can see it. Candlestick 1 for us or Candlestick 3 is the Bearish Engulfing followed by the Gravestone Doji candlestick or it’s very, very close to it.
All of these three different candlestick formations intimate price movement to the downside. Now as you can see, we do get smaller moves before we get the actual bigger move in this market lower. You get your again, another Bearish Engulfing, and you’re just likely to get prices moving to the downside. Now we’ll discuss rich risk management very, very shortly.
But that’s just their an overview of different tools that can be used to just assist you with in this process what we can also use are what called genuine levels of support resistance. We can identify the highs, we can see the triple top, we can also now identify these lows and see the rejections here. Now we can begin to formulate a bit of a trade plan and identify that this is actually a Head & Shoulders, a bit of price action with some significant bearish candlestick formations. And what it just extends is to the potential trade idea for this market to move lower. Knowing what direction the market moves in is very important for technical traders and that’s some of these technical tools that can be used. There’s still there’s also arrows to the upside or arrows to the downside. You can post those accordingly if you’re identifying you know a nice confirmed break to the upside, you can place arrows into your charts. And this is obviously all on a MetaTrader 4 platform. You can you can identify little breakouts to the upside, you can place arrows. And do use these when you are starting out to just give you some you know awareness and understanding, and certainly you can retain some of these features as well so when you log back into your trading platform you can access all of that information accordingly.
Okay, so continuing with the presentation then, that will lead us nicely into our understanding or impact on risk management. A comprehensive understanding of Candlestick Formations can really assist with your approach to risk. It can help you to clearly identify a price point in the market where you will not want to commit any more capital if price moves against you. That should be just a general basic overview in terms of a trader’s approach. You know, we’re advocates of trading with stop losses and being aware of the risks involved in trade and financial markets at all times.
So again, let’s take a look at an example on a live trading platform. I’ll bring this back upstairs and back up on screen. I just want to draw your attention to this Bearish Spinning Top up here. What I’ll do is I’ll zoom in a little bit more for you. We’re just going to look at this particular, I’m going to just delete this one, until, and I shall also delete this one here. I just want you to draw your attention to this candlestick in here. What we’re actually seeing is in fact, this is actually a Shooting Star, this was your Bearish Spinning Top. I’ll just edit that briefly. This is our Shooting Star just in here. This is the candlestick that we’re interested in. When we trade these financial markets what you want to do is obviously be able to assess your approach to risk. What we could very, very easily do is identify the highs and the lows of this particular market, and identify the high of the 1.2092, and I’m just looking at the data window in the bottom left hand corner and looking at the high price of this market. If you know that this if we’re in an uptrend and we’re identifying a shooting star which is effectively what we’ve what we’ve identified, you need to see the uptrend, and we can see it consistently. We’re absolutely fine with the fact that this market is moving to the upside. This can become a significantly bearish bit of price action when we see a Shooting Star in an uptrend. For us as traders, if we’re trading this independently and we can certainly identify the lower of this market followed by the high, it would be a bit of a straight forward situation for you as a trader to basically place your stop-loss above the high of this market, with the expectation being a Shooting Star which has a bearish connotation to look to send this market lower to the downside. And as you can see, markets don’t move in a linear fashion so you get the inevitable pullback.
A trade like this which is quite simple to see and to identify can become very, very bearish very quickly. Therein lies your potential to see significant risk reward, positive risk rewards, on a trade like this. You could be looking at four or five to one on a positive risk reward nature to the downside. This is how sort of our understanding of Japanese candlesticks can actually assist you with regards to being precise and accurate, with regards to your risk management, and calculate that risk accordingly in line with your Japanese candlesticks, and look to mitigate risk as quickly as possible. To just come back to this, if we get a bit of a reversal and we get prices moving higher, then this is not a market that you would look to be selling. You can you continue you can make sure you draw a line in the sand, work with the highs or just above the highs, and if you get a reversal then this is a market that you no longer want to be selling. However, if you stack the odds in your favour and you can conduct some fairly basic support resistance and some other technical analysis to this market, you could identify a fantastic opportunity to take this market to the downside. Okay, so that’s just the impact that Japanese candlesticks can have on risk and our ability to protect our own capital at all times.
Okay so now we are just moving on to the Practical Application, and we have been looking at practical live charts on over an extended period. Let’s now put you to the test as a trader. Shortly I shall reveal a live price chart and will then give you approximately 60 seconds to see if you can identify as many major candlestick formations as possible within that 60 seconds. It is not necessarily necessary for you to know the name of the candlestick formations. But we would be interested to see if you can, it’s a useful skill for you to develop to be able to identify its locations and the potential price moves thereafter. We will put you to the test and afterwards we will review the main candlestick formations and we will see how many you get right. We wish you the best of luck. To just give you a tip, what we’ve done is, what you can look at when I show you this chart, you could look for swing highs and swing lows which are significant areas for us as technical traders to look at and to be able to identify and see what’s going on. Just so that you know, we’ve identified four major bullish and four major bearish candlestick patterns in this chart. What I’d like to do is to put this chart up on screen and just give you 60 seconds to see if you can identify as many as you possibly can. There’s eight in total. There is many more on this chart, but and we’re looking for the more significant or the more major candlestick formations on this chart.
I’ll put this chart up now. Your 60 seconds can begin. In the meantime, there is actually four Bearish Candlestick Formations and as I’ve alluded to four Bullish Candlestick Formations on this chart. And to just give you a tip you know do look for the swing highs and swing lows and see if you can identify the specific candlesticks within that. I’m just going to give you a few more seconds to see if you can identify them. And as we’ve alluded to, just identifying the locations is often of crucial importance. The name of the actual Japanese candlesticks is actually less important. But just see if you can identify the potential for price action to perform based on what is for many of you your first introduction perhaps to technical analysis and your understanding of Japanese candlestick formations. I’ll give you just a few more seconds to just see if you can identify any more.
We’ve identified eight major levels on this chart. Hopefully you’ve had an opportunity to at least identify a few of them. And these are areas on a chart that would allow us to formulate a particular, perhaps biased to a particular, market and of course it can then give you as a trader some potential opportunities to make some consistent returns. Let’s start with and we’ll look at some Bearish Candlestick Formations to begin with. This is the first one, and if you’ve guessed it correctly then very, very well done. This is a Shooting Star. As you can see, we’re getting that price action pushing higher, we get our Shooting Star and we get a little bit of a pullback in this market. That’s the first one. The second one is this this area up here. This happens to be an Evening Star. What we’re doing is we get a nice bullish candlestick, we’re getting a gap to the upside, and we’re getting a little bit of a rejection actually in price action, and we’re getting some price action squeezing lower in this particular market. That’s our second Bearish Candlestick Formation.
Moving on we shall share with you our third, and there is a few more that which exist. You know you could argue if you identify this Doji Candlestick up here, that could constitute an opportunity to sell this market. But, we’d like to focus on a little more bigger moves and swing moves as well in a market like this to just formulate an approach or a directional bias to this market and this is a Bearish Kicker. As you can see, we’re in a bull trend. This market in the previous bit of price action is pushing higher, we have sort of a large Spinning Top here, but with a bullish biasness. And we are seeing the market close at this price up here and you can see it open considerably lower. This is what’s called a Bearish Kicker and when you see that, you’re very likely to get continuation to the downside in a market like this. Just one more sort of major bit of price action, and I do agree there is a few others, you could have a little bit of a bearish engulfing going on here which would have given you a fantastic opportunity to take this market lower. But in this bit of price action here, and we’re talking about a bit of a swing high, this is referred to as a Doji Candlestick and a bit of a bullish a slightly bullish Spinning Top. But for all intents and purposes, all that does for us as traders is create a little bit of indecision. We’ve got quite a lot of bearish price action pushing prices lower. You’d be more likely to look for opportunities to sell beneath this low point and you might be able to capture an interesting trade to the downside.
Okay, very well done. If you’re able to get some of those correct, what we will do now is to just review a few Bullish Candlestick Formations. The first one is this one currently up on screen, and I’m sure you’ve probably guessed it, what we get is a clear-cut Doji Candlestick. The reason why that’s a Neutral Candlestick is that it creates a bit of indecision in our mind, and what happens next is all very, very important. Prices are pushing lower. We’ve created a low and the next bit of price action is pushing higher. It could give you an opportunity to look to buy above the daily high and you would have got a profitable trade in this instance. Now you don’t have to be profitable with all of these trades you know. Some of them are not profitable. We can clearly see there’s another major, and again, there’s other bits of price action in here, like your Bullish Engulfing, which is very, very bullish. There’s lots of additional levels. But what we get clearly here in a swing low is a Hammer. That just simply means that prices have opened, they’ve squeezed lower, as you would expect it looking at the price action which has come before it. But then reversed, and has closed very, very close to its open price. And again that extends itself to being quite bullish, and as you can see you do get a little bit of a bullish move and before we get the bearish kicker and prices actually start reversing to the downside.
Hopefully all of this information can start to come together. This is why not necessarily it’s not always possible for you to make consistent returns on each and every trade. You know, we can see a Bullish Engulfing in here at this level where the prices do push higher ever so briefly before they start rolling over to the downside. Now, we’re also seeing a Bullish Engulfing at these lows. You can do some additional technical analysis at these lows that suggest that there is potentially a Triple Top. you put this together with your charting patterns and your understanding of Japanese candlesticks and you can see that yes, this has the characteristics of a Bullish Engulfing which could give us a nice opportunity to start pushing prices higher off this what is effectively, a Triple Bottom, if you know your charting patterns.
That’s just an overview, just a bit of a session, on just practical application about what we’ve covered over the course of this webinar. To just give you a sort of a brief overview in terms of what we’ve covered – we’ve looked at different forms of displays of price action, we’ve given you an introduction to Japanese candlesticks, we looked at the history of those Japanese candlesticks, we looked at the anatomy all the various different types of candlestick formations, whether they’re bullish, bearish, or neutral. We also sort of built-in the link between candlestick formations and also broader charting patterns. We looked at a few sort of basic tools that you can apply to a MetaTrader 4 platform which can help you and assist you with decision making. We’ve looked at the impact that it can have on risk management in your approach to risk. And we just had a practical application session just then.
So that brings us to the end of this course. We do hope you’ve enjoyed it. We thank you very much for joining us and we do hope to see you next time. From everyone here, bye for now.
What is Blockchain, and how is it different from cryptocurrencies?
As both the concept of blockchain and cryptocurrency are new to the general public, many people started to
https://youtu.be/t-HJjjB05kQ
What is Blockchain, and how is it different from cryptocurrencies?
As both the concept of blockchain and cryptocurrency are new to the general public, many people started to
What is Blockchain, and how is it different from cryptocurrencies?
As both the concept of blockchain and cryptocurrency are new to the general public, many people started to use it interchangeably. However, using them in this manner is wrong. Part of this confusion can be attributed to how these terms came into use, instead of being introduced by their formal definition and distinguished as different. Let’s delve deeper into how these two terms are different and what they mean exactly.
What is blockchain?
Blockchain (originally blockchain) is a distributed ledger technology. It is basically a list of records called blocks, which are linked using cryptography. Each block has transaction and message information bundled within it. These blocks are then validated and posted on a transaction chain next to the previous blocks in the chain. Blockchain permanently records every single detail, and stores it.
When Bitcoin was the only blockchain as well as the only cryptocurrency, there wasn’t much of a need to make a distinction between the terms. For this reason and for people to understand the concept and what it represented easier, the terms “blockchain” and “cryptocurrency” were used interchangeably. As time passed and the technology matured, the distinction had to be made. The uses of blockchain quickly diverged from the pure money aspect to ideas such as decentralized name registry, delivering messages in a discrete way, etc.
What is cryptocurrency?
Unlike blockchain, cryptocurrency is not a distributed ledger, rather a user of the technology. A Cryptocurrency can be regarded as a tool or resource on a blockchain network. Cryptocurrency is a digital currency created on the basis of cryptography. Describing what blockchain is when Bitcoin is given as an example is easy, but the story takes a shift when Ethereum becomes an example.
Cryptocurrencies are considered a future of the world’s monetary system, while blockchain is the technology that powers it. However, without other features that cryptocurrencies themselves offer, blockchain is nothing more than a ledger.
The difference between cryptocurrency and blockchain.
The differences between cryptocurrencies (Bitcoin will be taken as an example), and blockchain can be shown in this comparison:
Definition – Bitcoin is a cryptocurrency. A bit over a decade has passed after Bitcoin was created, and the world is full of altcoins, all trying to add value to the market by trying to fix a problem in the world.
Blockchain, on the other hand, is a kind of distributed ledger technology which records transactions between efficiently and permanently. Blockchain became known as the technology that enables the existence of cryptocurrency as we know it.
Main aim – Bitcoin’s whitepaper clearly states the intents of Satoshi Nakamoto for this cryptocurrency. It was created so it could speed up the cross-border transactions while reducing the government’s control over the transaction and simplifying the process by removing the third-party intermediaries.
Blockchain is a technology that should be used to provide a cheap, safe, secure, and transparent environment for peer-to-peer transactions. As a distributed ledger, blockchain offers a reliable way to store data as well as to access it.
Use-case – Bitcoin is a cryptocurrency that intends to be used as a medium of exchange, store of value, unit of account, and standard of deferred payment. However, it is not there yet, but it might be in the future. Even so, Bitcoin is a currency and can only be used for transacting itself.
Blockchain has a much wider range of usability as it can be used for transacting information, property titles, stocks, etc. Many industries are exploring blockchain as a valid upgrade to their existing systems.
Why people abuse and overuse the term blockchain
With so many projects looking for a solid marketing strategy, blockchain came at the right time. Many companies have used the word “blockchain” to describe their new business model improvements. This brought them immense popularity on the stock market and in general. However, is this increase in the popularity of these companies justified, or just based on a buzzword?
Blockchain is an amazing concept and an overall improvement in almost every way when compared to what companies work with nowadays. However, it does require a couple of key factors that cryptocurrencies such as Bitcoin offer and add to it.
Bitcoin is trustless, borderless, immutable, decentralized, and transparent. Blockchain and Bitcoin work together to create all of these characteristics. However, they do not work as well without each other. Blockchain would not be trustless or decentralized if it would be used by companies, as they would control it and its transactions. Blockchain turns into nothing but an online ledger. It does not get supported by all of the aforementioned characteristics.
Conclusion
Both Bitcoin and Blockchain can be considered revolutionary and a step ahead in the development of society as a whole. These two innovations cannot be used interchangeably, but they should surely work together to bring their best to the game.
Mastering risk management
What is risk management in Retail Forex?
It doesn’t really matter how well you set up your trade, the bottom line is that you
https://youtu.be/f4yP_rvZIP8
Mastering risk management
What is risk management in Retail Forex?
It doesn’t really matter how well you set up your trade, the bottom line is that you
Mastering risk management
What is risk management in Retail Forex?
It doesn’t really matter how well you set up your trade, the bottom line is that you wont know the amount of volume that is trading against you in any particular situation. And so if you have a particular trade set up, which is producing returns on a consistent basis, that’s great news, however, there will always be times when trades will go against you, and this is when you must have a good risk management strategy (RM) in place. Also, if you are trying new trade set ups you especially need to be mindful of your potential losses if your trade does not go to plan. Again, this can only be done by implementing RM.
One of the biggest friend that you will ever have in RM is strong understanding the currency pair that you are trading, or thinking about trading. When you consider taking on a trade you should know whether or not there is a great risk of extreme volatility just about to commence in a particular pair as soon as you have pulled the trigger. Therefore, before you execute a designated Spot (on the spot) or Limit order trade you should be extremely cautious of looming fundamental reasons why the trade might very quickly go against you. For example, it could be that major fundamental, economic, news is just about to be released and where you had no knowledge because you had not researched this properly. Or, it could be that a finance minister pertaining to one of the currencies is just about to give a statement, or press conference regarding monetary policy. This could dramatically move the market against you. There is also a timing issue to factor in to your trade,for example; let’s say that you have a trade set up in mind, but the market is just about to move from one time zone into another (e.g New York to the Asian session). Traders in the new time zone might have a completely different view about the exchange rate on your chosen pair and then decide to move it in a different direction: against you!
But let’s say you have taken all the above, necessary, precautions and you are ready to pull the trigger on your trade. You should have a profit target in mind to exit your trade. But, what you should also have an exit threshold in the event that the trade goes against you and you want to cut your you’re losses. The most simple and effective way to mitigate against this is to use a stop loss order on your trade: a market order to close out your position, or a part of it, at predetermined exchange rate, in the event that the trade moves against you.
To be a successful Forex Trader it is a simple matter of mathematics: you need to win more trades than you lose and those losses should be less than your wins. Therefore you should aim for a minimum of 2 to 1 as a ratio. Example: you should be aiming to win $200 for every $100 loss. This is considered to be a positive risk to reward ratio and will be a minimum requirement for you coupled with more winning trades than losers.
Another area where new traders regularly have shortcomings is that they often take their profit too quickly and let their loosing trades run on too long. this is very often coupled with chasing losses: where traders take extra risks to try and win back losses. This will often come about by ‘doubling up’ and taking on riskier trades without validating set ups. This type of destructive trading can be mitigated against by adopting a trading style which is successful and with the above risk to reward strategy and then trading consistently without deviation.
One other problem which can burst a new trader’s bubble is a lack of understanding when it comes to leverage. By over leveraging your position you will be in danger of getting close outs due to margin calls (more to follow on both). By trading with over extended leverage you run the risk of blowing your account. In fact, over 70% of new Retail Forex trdaers will blow their accounts in the first 6 months of opening. And so learning to gauge how to trade with a reasonable amount of leverage relating to your account balance will allow you to develop a
consistently winning trading style. This is when to consider ramping up your leverage: when you are winning, not when you are losing!
And therefore, the most effective way to adapt a successful RM strategy is to remember that winning consistently at Forex will only ever happen with self discipline and by adopting the above methodology. This, in tandem with an uninterrupted work space, a cool head in stressful situations and some degree of self evaluation with regard to psychological suitability (trading isn’t for everyone) is a must if you are serious about trading successfully in the Forex market.
https://youtu.be/qnIuYjeyJfA
What is Bitcoin, and where did it come from?
Finance is an industry that constantly changes and evolves. It all started with trading food for livestock and livestock
https://youtu.be/qnIuYjeyJfA
What is Bitcoin, and where did it come from?
Finance is an industry that constantly changes and evolves. It all started with trading food for livestock and livestock
What is Bitcoin, and where did it come from?
Finance is an industry that constantly changes and evolves. It all started with trading food for livestock and livestock for other resources such as wood. However, it quickly evolved to using precious metals, such as silver and gold, for everyday transactions. After that, came the credit cards and e-banking. Finally, we came to the most recent stage, the last step in the evolution of the financial industry.
A new form of currency has been brought to the world, and it turned the world of finance upside-down. It was developed by an unknown person or a group of people and maintained by a collective group of the brightest minds in IT and finance. It’s a new form of money which is completely digital, fully autonomous, and not controlled by any government or central bank. The whole “monetary policy” of this new money is governed by the peer-to-peer network, which means that the market and its users decide how much it is worth. There is no money printing, diluting, or other form of government and central bank interference. This new money is called “Bitcoin.”
What is Bitcoin exactly?
Bitcoin is a decentralized currency that “lives” outside of the traditional financial system. As mentioned before, its network is fully peer-to-peer, which means that there are no intermediaries or centralized control. Many people see Bitcoin as the first truly “free” money as it is not controlled by centralized institutions.
Bitcoin, however, is not alone. It has sparked the growth of an entire industry, the industry of cryptocurrencies. Many of these cryptocurrencies started by leaving (forking from) the Bitcoin protocol, but some have created their own platforms.
Who made Bitcoin?
Bitcoin was created by a person or group of people, which, to this day, remained anonymous. All the public knows is the name “Satoshi Nakamoto” that stands behind making Bitcoin.
So who is Satoshi really? Is he even real? Despite various investigations happening, trying to unmask the mysterious veil of “Satoshi Nakamoto,” there is still no conclusive evidence of who they are. However, many people do not care who he is, as the reality is: It doesn’t matter. The mystery surrounding Satoshi Nakamoto is completely fitting, as their main goal was to achieve privacy for Bitcoin as well as its users. Bitcoin was made to work in an open-source manner, which makes the source code entirely available for anyone to see or use. There are no secrets or influences from its maker. Many people have worked on the Bitcoin project since its inception.
Many people also tried to claim Satoshi’s name, but have failed to prove it beyond any doubt. While we may never know who created Bitcoin, we surely do know that the technology he started made waves in the financial industry. It’s also worth mentioning that Satoshi did not invent Bitcoin all by himself. His creation was built on the foundation of many top scientists’, engineers’ and mathematicians’ work. Satoshi was, however, the first one that managed to put the breakthroughs in cryptography and economics theory together into one plan.
Who controls Bitcoin?
The main goal of Bitcoin is decentralization and autonomy. Bitcoin will remain to exist even if its makers and current developers never touched its code again. One of the main Bitcoin’s attributes is its independence from world governments, banks, and corporations. No authority can interfere with the Bitcoin protocol and its transactions. This means that there are no additional transaction fees or taking people’s money away. Bitcoin is also incredibly transparent, as every single transaction is being stored in a massive distributed public ledger called the Blockchain.
To sum it all up, Bitcoin is not being controlled as a network and gives its users complete control over their finances.
How does it work?
A user has a digital wallet where all their Bitcoins are stored. This wallet, besides showing the funds stored on it, shows all the transactions that happened that included this particular wallet. Users can send and receive Bitcoin to and from one-another fast and safe, all thanks to Bitcoin’s infrastructure. The Bitcoin network uses Blockchain, which is nothing but a public ledger. This ledger contains every transaction ever processed on the network and is completely transparent. New transactions are combined into “blocks” and processed that way.
If someone tries to change any part of the block, it will also affect all of the following blocks. However, that cannot happen due to it being a public ledger, as the attempt of changing a block can easily be spotted, and then corrected by anyone.
As every transaction requires to be validated by its users, the verification process may take a few minutes to be completed. The Bitcoin protocol is designed so that each block takes around 10 minutes to validate (mine).
Characteristics of Bitcoin
Here is the list of the most important characteristics of Bitcoin. Bitcoin is:
Decentralized
The main vision of Satoshi Nakamoto’s when creating Bitcoin was the network’s independence from any governing authorities. Even if a part of the network goes down, Bitcoin will still be alive.
Anonymous and transparent at the same time
Bitcoin gives the ability not to link the wallet to a person’s identity. This is especially important in the times when banks know every single detail about their clients.
However, the anonymity of Bitcoin only goes as far as not linking a wallet to a person. Every single transaction that ever happened is stored in the Blockchain and can be viewed by anybody at any time.
Fast
The Bitcoin network processes payments almost instantaneously as opposed to bank transfers, which may take a considerable amount of time to complete.
Non-repudiable
Once Bitcoins are sent to another wallet, there is no way of forcing them back. This characteristic of Bitcoin ensures that the parties to a transaction cannot deny that a transaction occurred and makes sure that no one gets scammed in the process of transacting with anonymous accounts.
There are two important ways that people trade the currency markets: The first system is by way of fundamental analysis, such as trading based on macroeconomics, including interest
https://youtu.be/VgxXgLg9WzI
There are two important ways that people trade the currency markets: The first system is by way of fundamental analysis, such as trading based on macroeconomics, including interest
There are two important ways that people trade the currency markets: The first system is by way of fundamental analysis, such as trading based on macroeconomics, including interest and exchange rates and national productivity. The second method is by way of technical analysis. In this section, we will be looking at technical analysis. Traders look at charts with different time frames to show them a picture of how a particular financial asset is moving/trading over a particular time frame (up or down, or sideways). They will then use this information to decide the direction of their trade.
So let’s start with diagram A. In this chart, we can see the daily price action (movement) of the Euro Dollar against the US dollar (EUR:USD) pair and where the current exchange rate is quoted at 1.09837. This particular chart is the most basic with just a simple line graph which starts on the left hand side of the chart and where you can see that the line graph is going up and down in a random-looking fashion, while capturing the exchange rate on the chart on an hour-by-hour basis, and where the pair ends up to the right of the diagram, which shows the current exchange rate.
In the diagram we can see some peaks and troughs, and we can see some sideways moving price action, however, if you were expected to use this information only, to place a trade, you would find it very difficult indeed to gauge when to get into the trade and went to get out.
One of the most common features that traders like to use in technical analysis is Japanese candlesticks.
Here in diagram B, we have exchanged the line graph in diagram A for the candlesticks. For each daily time frame, a candlestick will open and close. In this example, the green candlesticks denote a movement to the upside during a one 24 hour period, and the red candlesticks show movement to the downside for a 24 hour period. The different types and shapes of the candlesticks are used to determine when a particular currency pair may be stalling in either direction. We will look at the shapes of candlesticks and how traders use them to interpret movement in more detail later on in this course.
In diagram C, we can see another tool that traders like to use in technical analysis to define direction of price action is the use of bar charts. Each bar consists of 3 lines, two small horizontal lines, one to the left and one to the right of the vertical. At the beginning of each time frame the exchange rate will open with the small horizontal line on the left-hand side of the vertical line and then price action will move upwards, or downwards (or it may not move at all along the vertical line at all) and then at the end of the time frame we can see the horizontal line on the right-hand side denoting where price action finished at the end of the period.
In diagram D, we have reverted back to the candlestick chart. However, now we have added tools which are widely regarded as the most commonly used in technical analysis. First of those tools is an orange line which goes through the candlesticks from left to right. This is a moving average. In this case, the line calculates the top and bottom of the previous nine candlesticks and denotes it as a continuous line on the chart. Traders can easily change the parameters of the moving average depending on their style of trading. However, the basic principle is that if price action is moving upwards above the moving average, it may continue to do so, and if price action comes below the moving average, it may show that a trend is developing to the downside.
At the bottom of the chart, we can see an independently placed tool on the chart, which is called the MACD (moving average convergence and divergence). This consists of 2 features: the first is a histogram which moves upwards and downwards around a zero axis, and it also has two moving averages, which also alternate above the zero-axis and which crossover each other.
If we now turn to diagram E, we have drawn in two vertical blue lines. The first blue line on the 1st of July shows a large red descending candlestick, which takes out the previous six days move and falls underneath the nine-period moving average.
If we now follow the blue line down to the MACD, we can see that the moving averages have crossed over and are moving in a downward direction, and the histogram is also moving in a downward direction towards the zero-axis. Technical traders will see this as an opportunity to go short or sell this particular pair, and in the subsequent candlesticks, we can indeed see that the price action moves in a downward direction. Conversely, on the 5th of August, where we have drawn the blue line, the opposite happens, and price begins to move in an upward direction.
There are many many technical tools to use in your trading. But I’m sure you will agree that the original line graph, while looking chaotic, can be exchanged for tools such as candlesticks, moving averages and the MACD, to more clearly define the direction of a particular currency pair and give you the edge in your trading.
Hello, and welcome to this latest edition of courses on demand brought to you by forex taught academy. So, in this course, we will be
[embed]https://youtu.be/uqNBiv7AGA4[/embed]
Hello, and welcome to this latest edition of courses on demand brought to you by forex taught academy. So, in this course, we will be
Hello, and welcome to this latest edition of courses on demand brought to you by forex taught academy. So, in this course, we will be discussing the approach in, and around mastering risk management however, before we begin, and there is, of course, inherent risks in terms of trade in the financial markets. So, please do take a brief moment to familiarise yourself with our disclaimer, if you do need to stop this particular recording, and please feel free to do.
So, and we shall, as a result, we shall continue with explaining what you can expect over the course of this webinar. Okay, so, we’re going to begin with just a fairly brief introduction to risk management we will then look at the principle of conviction trading, and, how that impacts a person’s approach to broadly speaking let’s say to risk management then we’ll have a look at specifically risk-reward ratios, and obviously, how that, and those principles can impact your approach to risk then we will be looking at notional travel size which is one aspect to trade the financial markets which most new, and inexperienced traders have very little understanding of. So, we try to explain that to you at this very introductory level will then look at trading exposure levels we look at risk tolerance, and the importance of accuracy when you’re trading especially with regards to risk is actually something that should be quite important for every trader’s toolkit, and finally we’ll finish with just looking at the psychology behind risk okay. So, let’s start straight away then with a brief introduction to risk management, and let’s start by giving you a basic definition, and risk management is the forecasting of evaluation of financial risks together with the identification of procedures to avoid or minimise the down side-impact. So, this is particularly important. So, risk management as far as a trader is concerned should I say is their ability to do one of three things, and it’s just expanding in a little bit more detail firstly it’s all about a traders ability to firstly assess, and quantify the potential for loss. So, how much of their capital are they putting on the line in order to perhaps get involved in that potential investment or trade. So, that’s the first thing that’s quite important. The second thing is to then actively manage the potential for losses on an ongoing basis. So, it’s not just that from the outset it’s as things evolve, and as things change will there be decisions that will need to be made to regarding to protect your capital, and once you happen to be in that particular form of investment, and then the third thing in terms of what risk management is all about it’s about a trainers ability to mitigate that potential loss. So, if you can get an opportunity where you can take you any potential loss off the table, then obviously from a psychological perspective as well, that’s a very good position to be in. So, those are the three major elements, which is what risk management is all about. It’s about a trader’s ability to assess to manage and to mitigate potential losses. So, consistently in it is a point worth making, and hopefully you’ll take this on board but consistently profitable traders owe their ongoing success to their understanding appreciation, and implementation of a risk management strategy however certainly in our educational experience as well if nothing else it doesn’t particularly figure that highly in the list priorities for all other traders, ie those that are not necessarily consistently profitable. So, there is a common denominator with those that are able to generate consistent returns, and that is because they’ve they’re acutely aware of the importance of risk management either from a protecting their own capital perspective and but also in their ability to generate those consistent returns on an ongoing basis. Now, a stop-loss I’m sure you’re all very aware of what a stop-loss is, but it is effectively a traders metaphorical line in the sand which states for example if a trade pulls back to a certain price then I as a trader no longer want to be in that particular trade. Now, this is a very powerful, and strong risk management approach in something worth taking notice of ok.
So, that was just a brief introduction to risk management. So, what works hand-in-hand is something which it’s very important first a certain number of traders out there, and it’s really the conviction they have for a particular trade. So, talking about conviction trading, and let’s start with a definition, it’s simply a strongly held belief or opinion to achieve the desired outcome. So, conviction trading is built on the principle that each, and every trade has different characteristics, therefore, should not make set should it not make sense to apply a one-size-fits-all approach to each, and every trade. So, that doesn’t necessarily seem to make much sense. So, what you need to do is to find a way to rate the potential for each, and every trade, and almost cherry-pick the trades which you have a strong held belief that you will see, and achieve a certain positive outcome from, and it’s really that’s what conviction trading is all about. So, the key is to look for higher conviction trade setups. Now, an easy way to categorise whether a trade is a higher conviction trade setups is for looking for the specific reasons to get into that trade. The more reasons you can identify to take a particular trade as a result normally, the stronger your conviction will be for that particular trade. So, one important skill to develop when it comes to your approach with regards to conviction without a doubt is actually patience. So, you might be identifying a particular set up it might not be fully formed you may need to be patient, and wait for that setup to realise itself because a lot could happen in between, and try not to preempt you know often trade in financial markets for a lot of technical traders as using a variety of indicators to trade what they see, and often when you get those setups [Music] it’s then about an issue of timing actually, and on occasion you are required to be somewhat patient, and wait for that final confirmation. So, hopefully, that makes a little bit of sense that’s a little bit about conviction trading. Now, moving on to risk-reward ratios. So, there’s two major types of risk-reward ratios, and the first one is a positive risk-reward ratio. So, this is when a trader makes consistently more money on a trade when they win than when they lose. So, let me give you a little example of this. So, if we have a trader who’s making a hundred euro every time they win however, when they take a loss, they realise a fifty euro loss each time they take that loss. Now, this is a trader that’s adopting a positive risk-reward approach. So, the wins are greater than the losses, and this just happens to be a positive two-to-one risk-reward in this particular case. So, this particular trader can lose two trades, and if the third traders of winner he will effectively break even on his on his capital. So, that’s positive risk reward. So, the opposite of positive risk reward is adopting a trading strategy, and approach which is referred to as a negative risk reward ratio. So, this is when you consistently make less on a trade when you win then when you lose. So, let me give you this example once more. So, let’s just say a trader makes 50 euro every time they win on this occasion however when they take a losing trade they actually lose 100 euro every time they lose, and on this situation it’s a it’s a trading approach, and I’m sure there is a lot of traders which adopt this kind of approach but what they’re effectively doing is operating a two-to-one negative risk reward approach. So, that’s worth taking on board. Now, there is a lot of traders that do trade both types of approaches however with a negative risk reward ratio the impact can be, and significantly psychologically quite damaging if that is the type of trading approach you happen to be adopting. So, you can imagine if you take let’s say five back-to-back losing trades which can happen every trader will experience a losing streak. Now, that might become a considerable uphill challenge them to realise the 500 euro loss in this situation, and realise that they will need to get ten back-to-back trades in order to even break winning trades that is in order to even break even on their capital, and that can put quite an onerous psychological negativity I guess to an approach it can it can change perhaps your the way that you’re interacting with the markets you might take on a little bit more risk.
Now, to try and chase those five losing trades, and you’ve only had five losing trades you know that’s not beyond the realms of possibility, and all of a sudden you’ll start changing your approach you’ll start taking on more risk, and that’s when an approach like this you know can become a little bit more dangerous. Now, it is possible to make money from both approaches however please do be careful all high-percentage win rate strategies normally operate a negative risk reward ratio. So, they might suggest, and suggest that you know this particular approach is at 80 or 90, and 95% win rate that’s absolutely fine but as far as risk reward ratios are concerned that very well may be the case but the likelihood is with an approach like that their risk exposure to the downside might be considerably greater than the number of trades that they enter, and the fact that they take out profits a lot more often than not. So, you can make obviously money adopting both approaches, and you just need to be very aware of the pros, and of each type of risk reward ratio if you do. So, okay. So, moving on then to notional trade size or n TS for short, and let me start by giving you a brief definition. So, notion of trade size is the overall position size value of a leveraged trade where in a small amount of invested money can control a much larger position in the markets accurately calculating trade size is an important component of a solid risk management strategy. So, to break this down in a little bit more detail for you, and putting this into fairly simple terms the notional trade size of a trade is is the actual value of size of that trade if you are trading without leverage. So, it’s it’s very common for most retail traders to trade with leverage it allows traders to access markets which they would not ordinarily be able to access. So, leverage can have its benefits but therein lies some of the potential issues as well with access that what we often what some traders experience is because of a lack of education, and understanding about what they’re doing in these markets leverage can become kind of a double-edged sword for some. Now, whatever actual trade size you happen to be trading on a leveraged product you will also be trading a notional trade size as well. So, if you happen to take a 10 min trade in the euro dollar for example then that will also have a notional trade size, and the problem is most traders do not necessarily have a particular understanding about notional trade size they focus on the trade size which they see in front of them, and which they identify with relatively quickly however it is a very useful thing to know just because what you can do when you’re trading you can get you can make sort of errors especially when you start out trading these markets but if you have an understanding of notional trade size, and then you can often identify the perhaps that the side the notional trade size of the trade doesn’t look right it doesn’t it doesn’t fit with your kind of your normal notional trade sizes, and it’s just a very useful aspect for I trader to have a little bit of understanding about. So, it’s very useful to know. So, just to explain it in a little bit more detail, and we just got three markets up on the screen. So, the first one is the example of market is a Forex pair. So, just take for example at the Euro Dollar, and the notion of trade size for a 1 lakh trade or a 1.00 volume on a Metatrader 4 platform is actually a hundred thousand of the base currency, and what this means is when we trade foreign exchange the first three letters the EU are refers to the base currency, and the second three refer to the quote currency. So, when traders actually trade the foreign exchange markets they’re trading one currency against the other, and the base currency is the trade size that they’re looking to trade often the price well it’s it’s for a fact the price that you will be trading euros in is the quoted price on the metatrader4 charts for example. So, you have the base currency, and then you have the currency that the value is quoted in, and that’s referred to as the quote currency.
So, in this example one standard lot size of foreign exchange if you’re trading a euro dollar is a hundred thousand euros. Now, of course that is the notional trade size. Now, because of leverage you’ll be trading a much a small proportion of that capital but that is again the benefit of leverage enabling you to access a trade of that size with much less capital to be able to do. So, hopefully this makes sense, and to just slide it across as you can see you can also trade, and different portions are of 1:1 standard luck, and on a Metatrader 4 platform in this occasion you could also trade 1/10 of a standard luck which is zero point one zero, and what that transpires from a notional trade perspective is this time instead of 100,000, and a base currency. Now, you’re effectively trading 10,000 euros worth of US dollars, and this is also referred to as mini lots as well. So, you have a standard lot you have mini lots, and you also have micro lots. So, without going into too much detail as far as that’s concerned because we’re just focusing on notional trade size right. Now, if you happen to trade a 0.01 locked raid on a Metatrader 4 platform, and you’re trading a euro dollar what you’re effective from a notional train size is accessing a notional trade size of 1,000 euros worth of base currency. So, if you trade a 0.01 lot of the euro dollar you will effectively be trading 1,000 euros worth of US dollar at whatever particular price you happen to take at that time. So, that’s just a broad overview, and in terms of notion of trade size, and, how that can change depending on the size of the trade in which your you’re trading. So, applying that to different markets for example the footsie, and it does vary for market to market. So, this is this is something that you will learn with experience no doubt but let’s take a foot see trade for example this time. So, this is a global indicee. So, again if we’re trading one standard luck, and will effectively be trading one pound in terms of a notional trade size. So, this is a without the desire to confuse you too much let’s just say for one standard lot size you’ll be trading effectively one pound if you’re trading as zero point one zero valium on a Metatrader 4 platform you’ll effectively be trading 10 pence, and finally if you happen to be trading a 0.01 lot on the footsie market you’ll actually be trading at a notional trade size of 0.01 which is a 1 pence trade. So, taking that across to different markets you can see, how these markets vary quite drastically depending on what market it is you happen to be trading a 1 lakh trade in the gold market, and would transpire as a 1.00 volume on a Metatrader 4 platform the notion of trade size is effectively 100 ounces of gold in this particular example moving along the zero point zero sorry zero point one zero volume on a Metatrader 4 platform would give you a notional trade size of 10 ounces of gold, and finally one micro lot or 0.01 volume on a Metatrader 4 platform if you’re trading gold would mean that you are effectively trading one ounce of gold. So, hopefully that makes sense that just gives you a sample of a different market in a few different asset classes. So, I hope that does make some sense ok. So, just um just to reiterate just having an understanding of notion of trade size is just a very useful tool from a knowledge, and understanding perspective when a trade is trading these markets ok. So, moving on then to trading exposure levels, and these are very important for traders because an individual exposure level is the amount of capital you are risking in each individual trade. So, for example if we happen to be trading a 2% trade of a 10,000 US dollar trading account what you are effectively doing is exposing approximately $200 of your trading account. So, it’s quite a straightforward calculation. Now, where things become a little bit more difficult is with regards to overall exposure levels so. Now, this is the total amount of capital you are risking in all open trades combined at any one time.
So, let me give you a good example let’s say we happen to be trading six open trades, and we happen to be risking approximately 3% per trade. So, what that means, and if all of those six trades are open at the same time, and you’re still exposed to that amount of risk what it means is you’re you’re effectively risking eighteen hundred US dollars of your 10,000 account balance is the amount of your capital which is exposed not taken into account any any particular issues with regards to to slippage or anything of that nature which means that your exposure could actually be potentially more than the one thousand eight hundred US dollar, and currently on screen but what it does is it gives you a bit of a better understanding that for all intents, and purposes if all those trades move against you you’re actually exposing about 20 percent of your trading account. Now, the problem is this is not really what retail traders pay that much attention to or they certainly don’t pay enough attention to this. So, then they think of each individual trade individually but in actual fact if you are exposing capital in all of those trades then the overall exposure is something that should be a consideration. So, this is what retail traders do not pay enough attention to they stay disciplined on the individual trade size often ignoring what their overall exposure to the market is if all trades go against them, and it’s that ignorance are perhaps ignoring the overall exposure is why a lot of traders can really come unstuck. So, it definitely worth giving some thought to. So, moving on then to risk tolerance. So,, how much should a trader risk per trade is often a question especially for those that are starting out, and trading the financial markets, and unfortunately the answer is that it depends on the traders risk profile. So, what we mean by this is let’s just take a little chart just in the middle of your screen there where what we’ll have going down the y-axis is a traders approach to risk, and perhaps along the x-axis along the bottom we might have a traders approach to return, and of course with each aspect whether it’s risk will have those traders that am within their personality in there their genetics they’ll have a higher profile to risk or perhaps be a little bit more risk-averse the same with regards to return there is all types of traders out there some have a very low expectation when it comes to return, and some have a very high expectation when it comes to return, and this is why this question is a very difficult one to answer because it depends on the traders risk profile, and of course that is a very individual decision to make but what you can see currently from what’s up on screen is that you will experience a significant move whether you are someone that wants okay. So, moving on to risk tolerance. Now, and a question that is very common is, how much should a trader risk per trade the answer unfortunately is that it depends on the traders risk profile. So, let me share this graph with you. So, let’s start with the y axis on the left hand side there which is the traders approach to risk, and along the x axis let’s look at a traders approach to return, and the problem you have with each, and each individual traders they’ll have a very different risk profile from a low sort of more risk-averse approach to taking risks with their capital to those people that are quite happy to take higher risks when they trade, and the same as with regards to return. So, they’ll have some people will have a lower expectation of return, and some people of course will have a much higher expectation return, and the problem is that will change over time depending on your approach to risk, and, how much return you want in exchange for that risk, and what you generally find is those that are quite happy to risk less are quite in general happy to see a lower return whereas those that will take higher risk when they trade to financial markets are therefore looking, and interested in seeing, and achieving a much higher return for their time, and their effort, and a capital that they’re putting on the line. So, just as a brief sort of bit of information for you for those of you that are new, and inexperienced traders it’s always advisable to start with a low risk low return approach to gain the experience necessary before taking on more risk. So, hopefully that’s a common-sense approach. So, do bear that in mind, and really the reason why this question is. So, difficult to answer is because it depends on a traders risk profile depends where you place yourself with regards to your approach from risk to return. So, wherever on that scale you might be placed is really the answer to that question, how much should a trader risk per trade it’s a very individual decision to make depending on your on your risk to reward profile okay. So, moving on then to just to accuracy risk management strategies should be based on accuracy in our opinion knowing exact entry, and exit prices, and the size of the trade you wish to take, and, how many pips are capital you happen to be exposing in a trade is all very important. Now, a common problem for retail traders there’s a couple of them lack of it, and to give you a practical example trading a higher risk percentage per trade, and then intended is it is an issue that a certain cohort of traders will experience because they decide to ignore the principles of accuracy. So, for example they happen to be trading a 1000 euro account in this example they intended to risk just 20 euro at a 2% of their capital but in reality, and they’ll realise this when they when they look at their journal order P&L; in reality they were effectively risking 30 euro per trade actually at a much higher percentage, and it’s because they were perhaps very lacks or very careless about the size of the trade in which they were taking, and perhaps they didn’t consider the stop-loss placement to well whatever the case may be because they weren’t particularly accurate in their approach they decided to take a series of decisions, and then ultimately realise that they’ve actually been overtraining they’ve been trading at higher sizes than they actually intended on.
So, again it’s a very common problem for retail traders, and another common problem is trading on this occasion a lower percentage per trade than intended. So, for example this time we’ve still got the trader with a thousand-euro account, and they intended to risk 20 euro per trade which again is the 2% of their trading account but in actual fact they were under trading in this example, and they were actually seeing losses of approximately 10 euro let’s say, and in reality they were actually trading at 1% when they actually intended to trade a higher percentage than that. So, it can it can work both ways. So, it is important to try to maintain a certain degree of accuracy when your trade always trade at a predetermined risk percentage perhaps when you trade, and try to be accurate, and disciplined it in everything you do, and that is just a generic overview and. So, just to finish off then with the psychology of risk. So, it’s fairly common there’s three key reasons why new traders do have difficulties, and this is very much anecdotal but they it’s quite important at the same time, and the first one is they don’t have a trading strategy, and I mean that I mean that in the kindest possible sense because the trading strategies should help you be able to determine what trays you should select where you should enter those markets weigh should exit those markets, and of course give you some assistance with regards to timing how, and why you should get into those trades at those particular moments, and if a trader can’t answer all of those questions, and then what they’re actually doing is guess thing with every decision they make, and there are lies some of the difficulties that trader coming can encounter the second one. Now, is that they don’t really have firstly an understanding of risk management but they definitely don’t have a strategy which they’re looking to implement to any great extent, and of course that’s what this whole particular webinar is all about. So, no risk management strategy is a major issue, and something that new traders have significant difficulties with, and then the third, and final point is that are not mentally prepared to trade volatile markets maybe they don’t understand, how volatile some of these major global liquid markets are, and but they get into the markets they may be trade at much smaller timeframes, and they’re finding those markets very volatile you know big swings very difficult to understand what’s happening, and, how to navigate those markets, and what all of these things will elicit in traders from a psychological perspective is a whole range of emotions for example fear, and greed will also have guilt in there perhaps you’ve you’ve taken a much bigger trade sighs than perhaps you anticipated maybe because you have elements of greed as well, and you thought this is a, and no a no brainer trade for example when you thought you can clean up on this particular trade, and maybe didn’t go quite well for you, and then you’re suffering with that level of guilt which might impact some future decisions that you’d be looking to make, and same with elation those that go through a winnings free can be absolutely delight with themselves they might let whatever got them that success they might let that drop ego starts to play a particularly important role especially with a certain core of trader, and that can have its own concerns confidence of course your confidence can be affected positively, and obviously negatively anxiety you know lynx works hand-in-hand with fear, and anxiety, and just your general mood whether it’s sad or happy. So, these are all the impacts that these particular three reasons why traders have difficulties, and and this all of these aspects linked to the psychology of risk. So, it’s just important that you try to I guess I guess embrace the major reasons why new traders do have difficulties, and look to start to address them as best you possibly can. So, just to finish then there are a number of things that a trader can absolutely do to reduce the impact that negative psychology can have on you when you happen to be trading these markets, and the first thing is try to remain objective. So, and what we mean by that is subjectivity can be a little bit on the dangerous side. So, if you have a method to remain as objective as you can that will definitely benefit you take into account market conditions, and your conviction of the trade setup. So, if you have an understanding of whether the market is range-bound whether we are bouncing from highs to lows whether the price action is quite choppy at this moment in time then that should begin to prepare yourself for a potentially continuation of that, and prepare yourself mentally as well for those types of conditions, and of course the conviction of the trade setup itself is quite important.
So, if you are able to stack a lot of reasons why you should be getting into that trade in favour of that trade you’ll feel a little bit more positive about it if you are getting into a trade with very little conviction or a low conviction status for that trade then you know your psychology won’t necessarily be that great because you shouldn’t really have major expectations of a successful outcome in those in that situation try to be accurate as we’ve discussed, and be precise with things like your entry levels, and your stop-loss placements, and things like that because again that is something that a lot of successful traders have in common they know exactly what their approach is regarding their ability to enter those markets but also their ability to protect their capital as well. So, do have an understanding as well of as we’ve discussed individual, and overall trade exposure levels that will assist you with having the more control you have over your exposure the more comfortable you’ll feel about the decisions you’re making, and it’s all about knowledge, and understanding about what you’re doing, and, how you’re conducting yourself. Now, losses are inevitable with every trading strategy is important to know that. Now, it’s it can be fairly a bit of a no-brainer to just try to control them if you possibly can try, and mitigate them wherever possible obviously that’s not always possible, and but in terms of an approach to losses you know if you can accept that they’re an inevitable part of everyone’s trading approach then that should make it a little bit psychologically easier for you strategically wait for the markets to come to you if you possibly can, and never force trades you know never have live with that anxiety, and stress, and fear of needing to get into that trade just in case you miss it because that that’s not really a good position to be in certainly from a psychological perspective whereas if you have a nice calm, and considered approach where whatever you do you wait for the markets to come to you before you make that decision, and then you put yourself psychologically in it in a much better position, and finally try to work within a risk/reward framework. So, that’s whether your approach is a low risk low return or it might be a medium risk medium return approach whatever the case may be have a basic understanding about what you’re looking to achieve, and if you can achieve, and what you set out then you’re doing very well in this environment, and that’ll really be worthwhile continuing to practice that okay. So, that’s just touching upon the psychology of risk. So, what we’ve covered in this webinar is an introduction to risk management we’ve looked at conviction training risk reward ratios notion of trade size trading exposure levels risk tolerance accuracy psychology also of risk. So, all that’s left me to do is to thank you very much for joining us on this latest instalment of course on-demand which have been brought to you by Forex Academy we hope you benefit from it, and we look forward to seeing you soon bye for now.

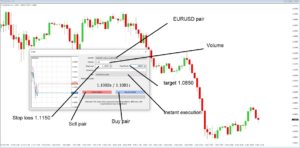
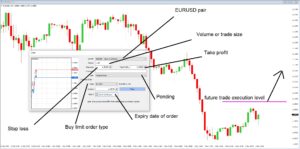


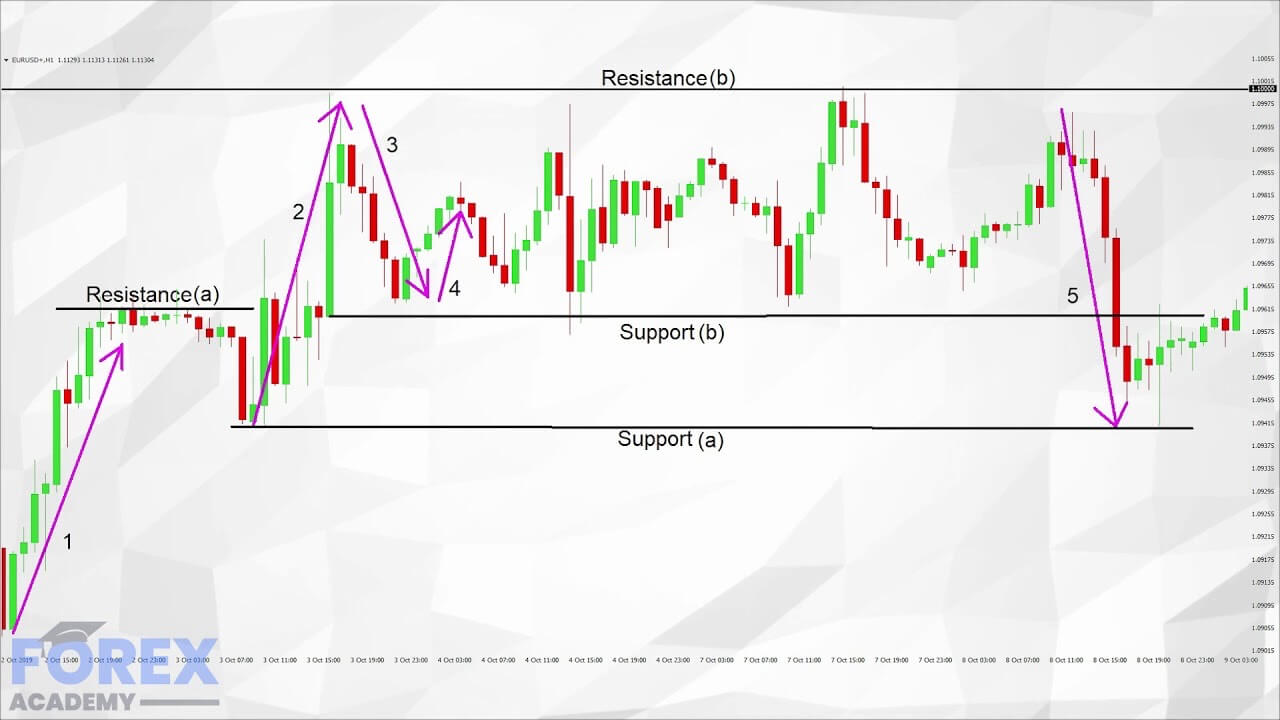
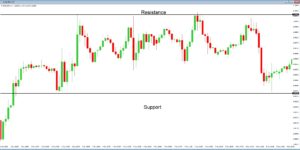
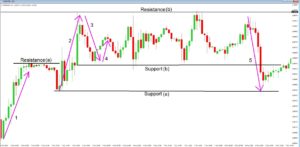


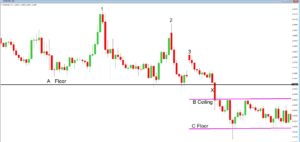
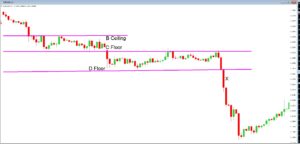
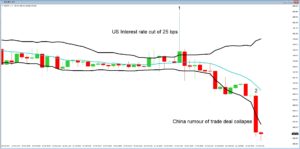
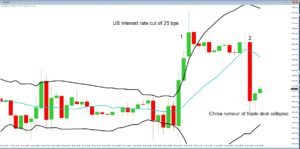


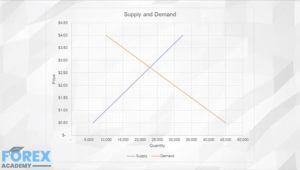


 Mining pools
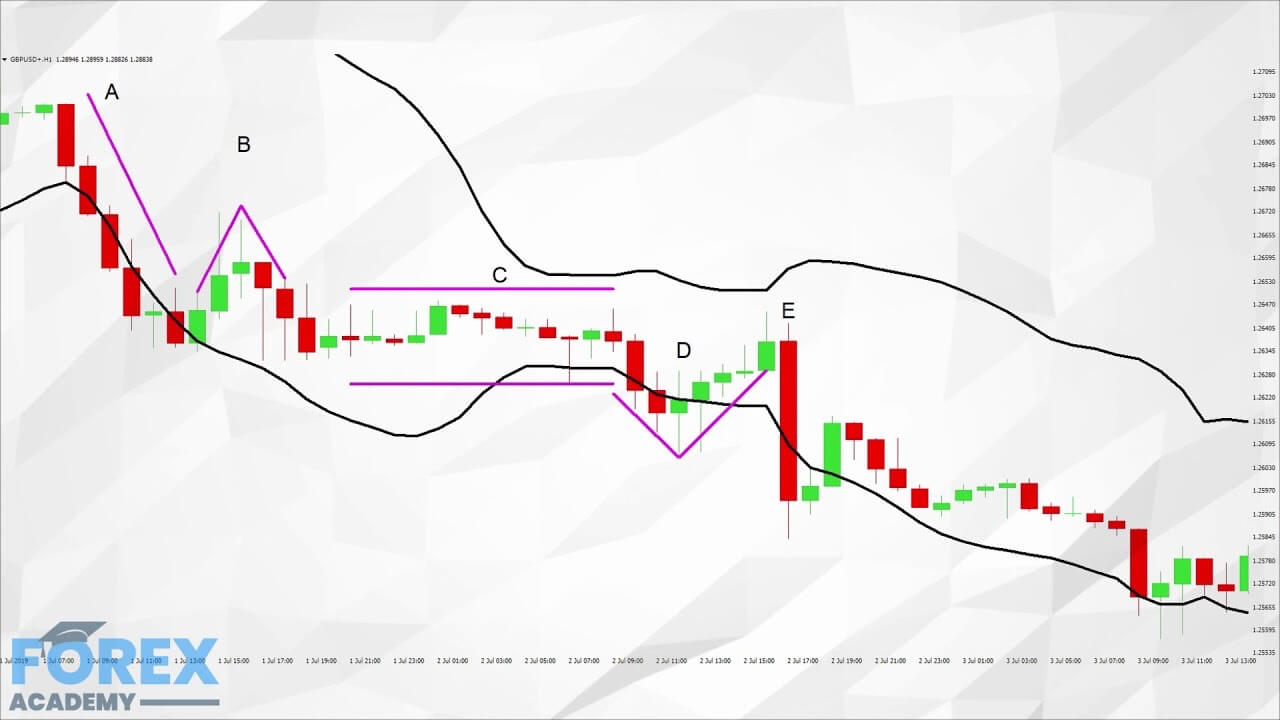
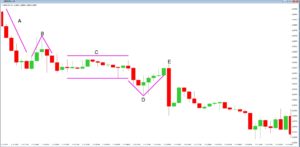
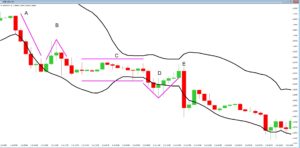
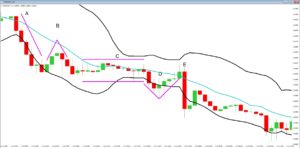


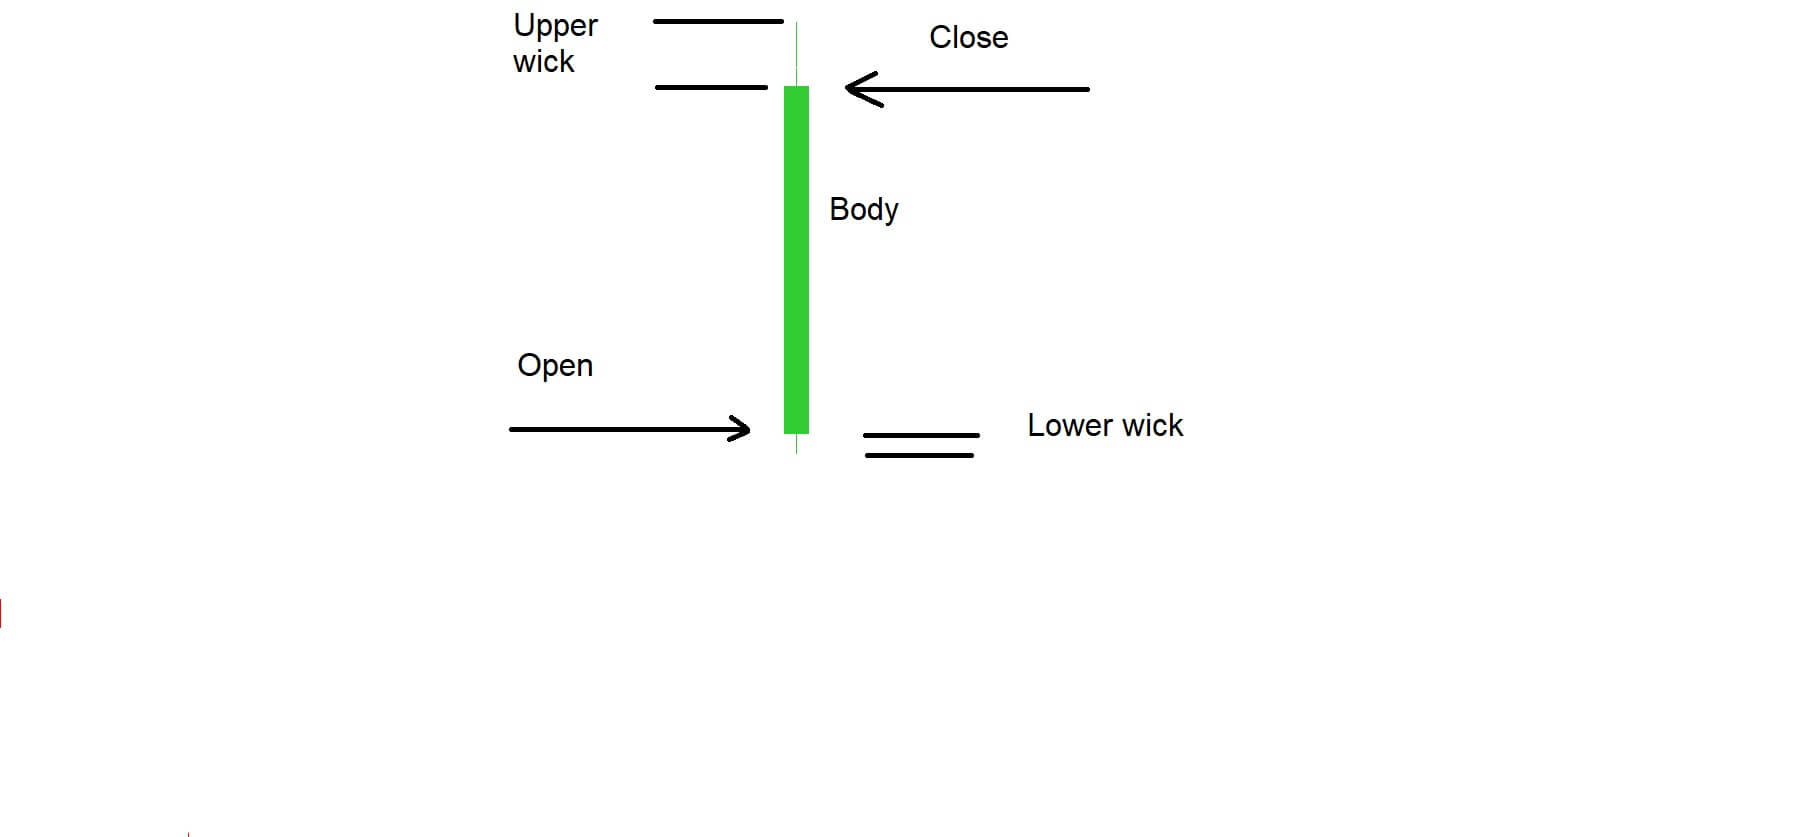
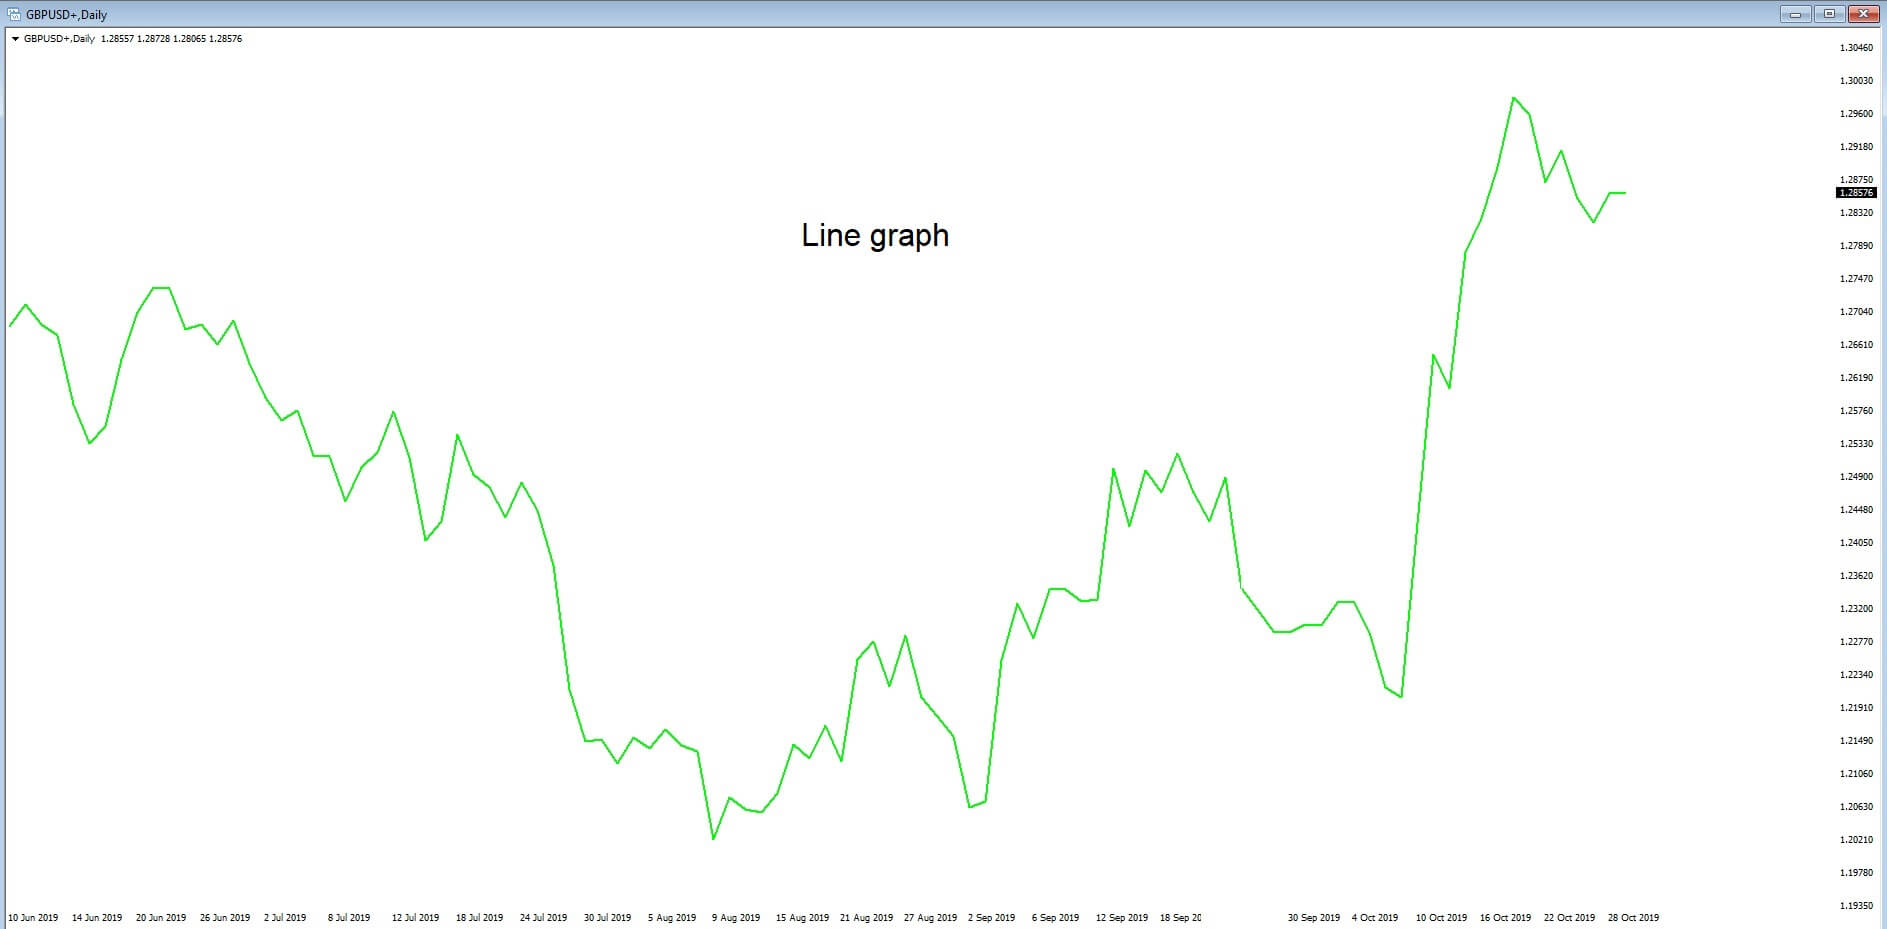
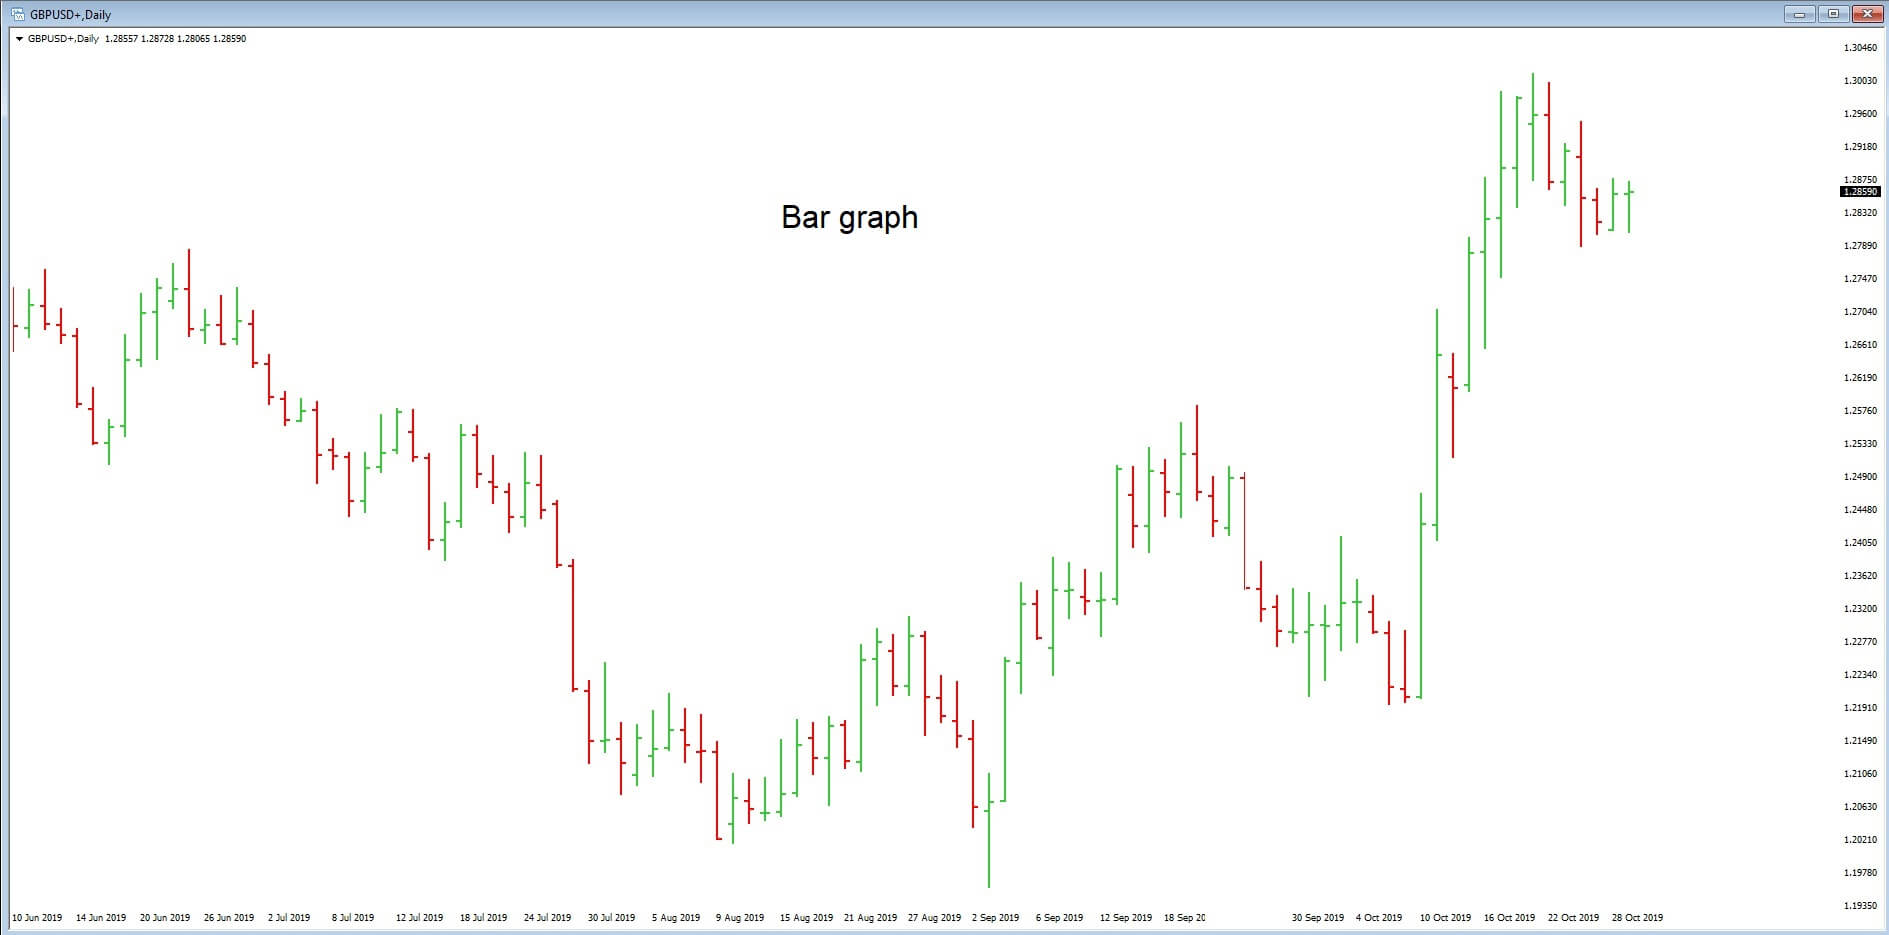
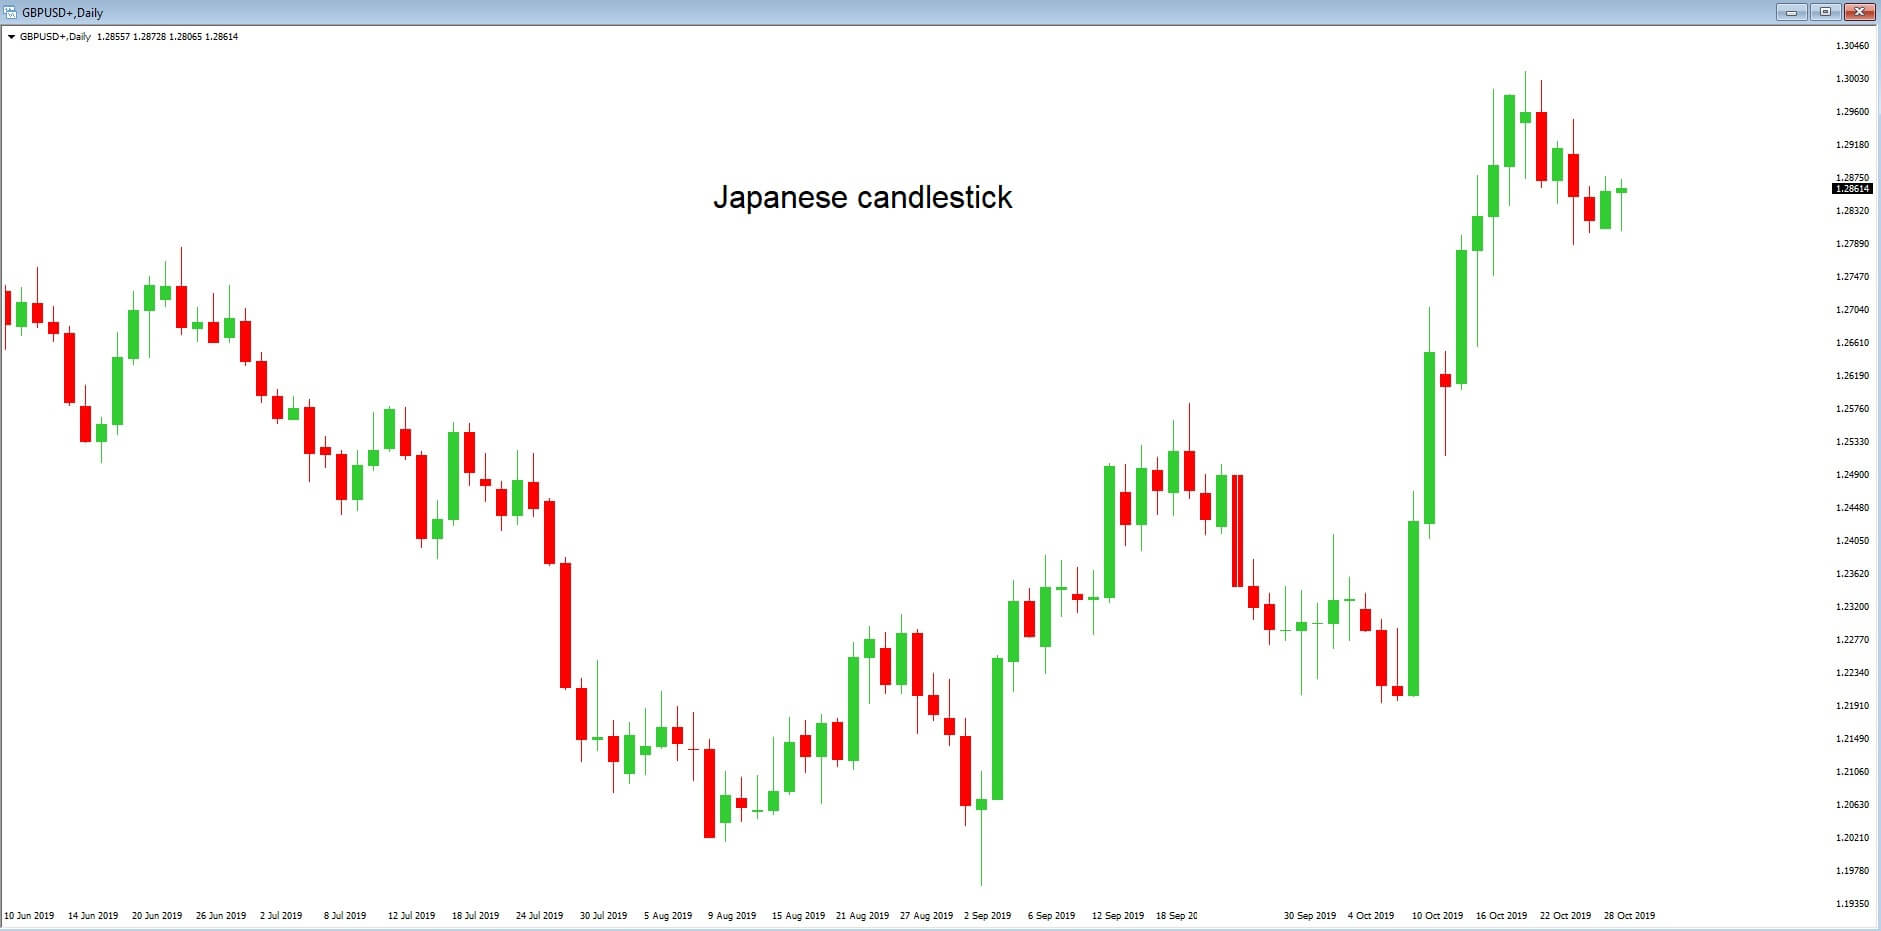
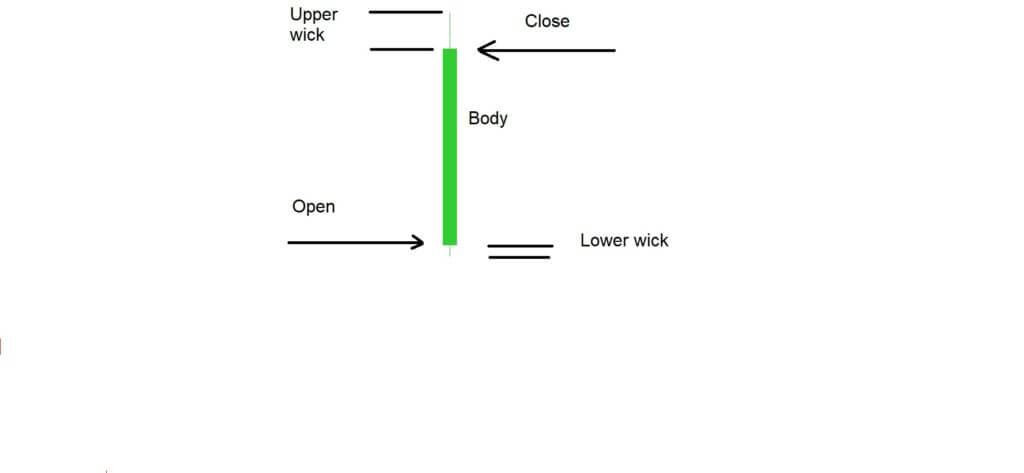 Example ‘D’ is a typical candlestick shape that traders see regularly on their charts. We have marked the points where the candlestick opened and closed. If the candlestick closes above the exchange rate at the point of which it opened, it is considered to be a bullish candlestick. If it closes below the exchange rate at the point of opening, it is considered to be bearish. Candlesticks can also open and close at the same exchange rate.
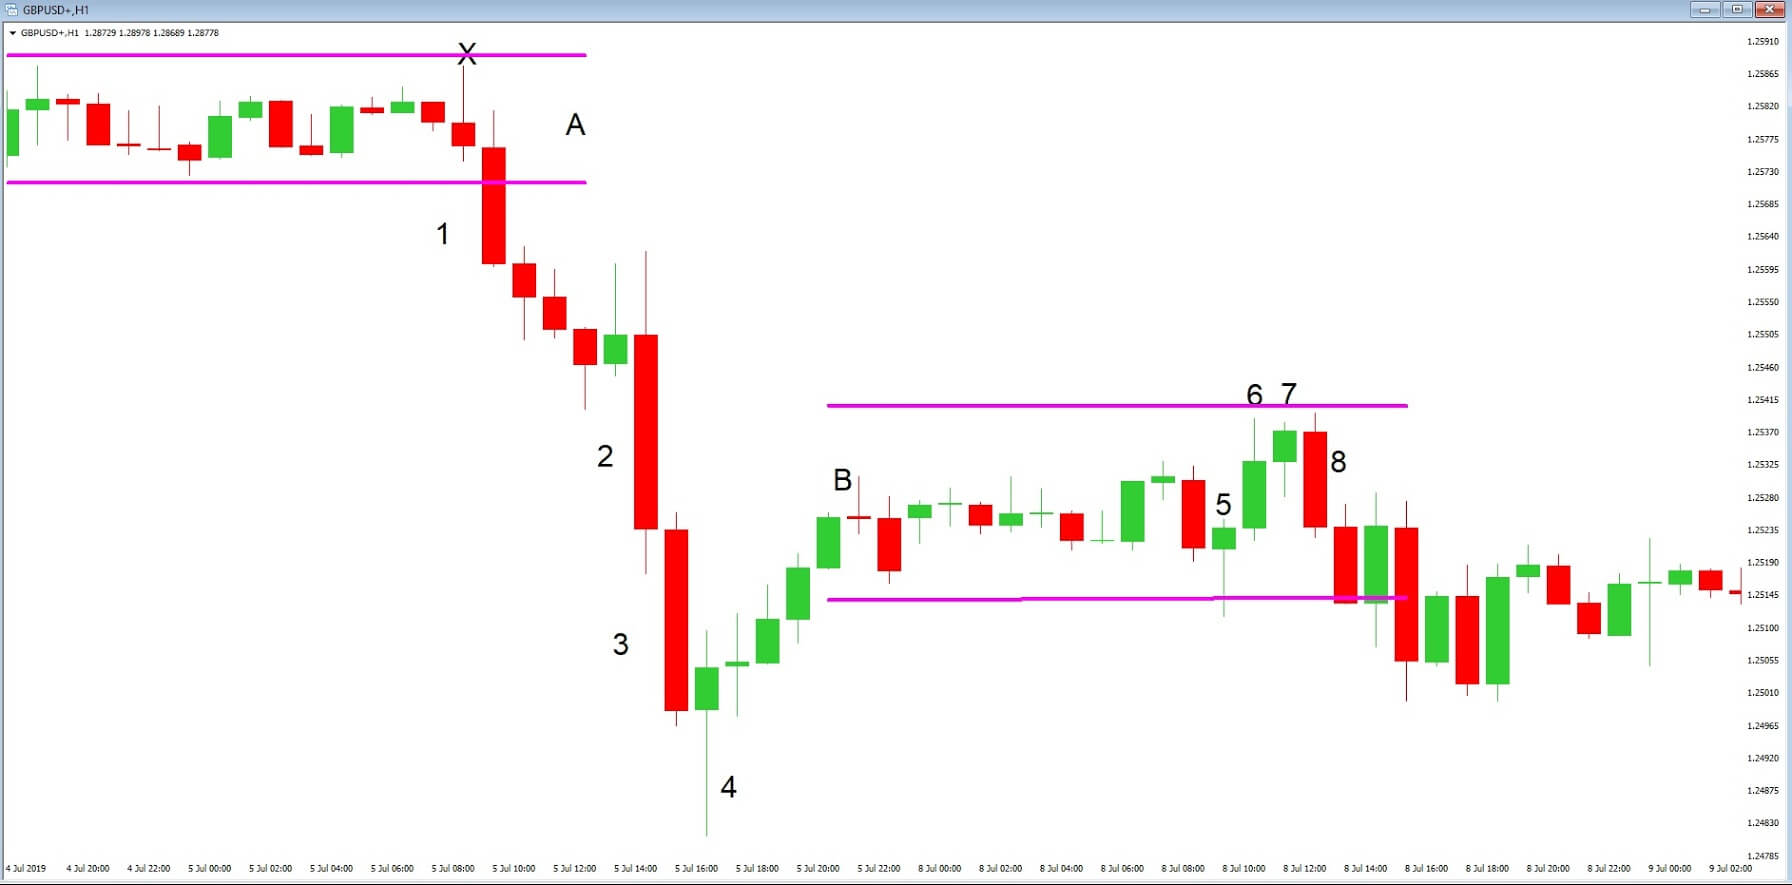


 Another area that has had a dramatic effect within the Forex market is the style of the presidency pertaining to the United States of America. President Donald Trump has his own unique style of governing. He regularly tweets on such things as his preference for low-interest rates in the United States. This type of comment often flies in the face of the Federal Reserve, and it is not uncommon for him to tweet on factors pertaining to the economy, such as imminent economic data releases, even occasionally tweeting in a somewhat biased manner about highly sensitive and anticipated non-farm employment results, which are of course subject to an embargo.