Categories
Crypto Videos

Bitcoin Is Digital Gold & Not Currency: Mike Novagratz!


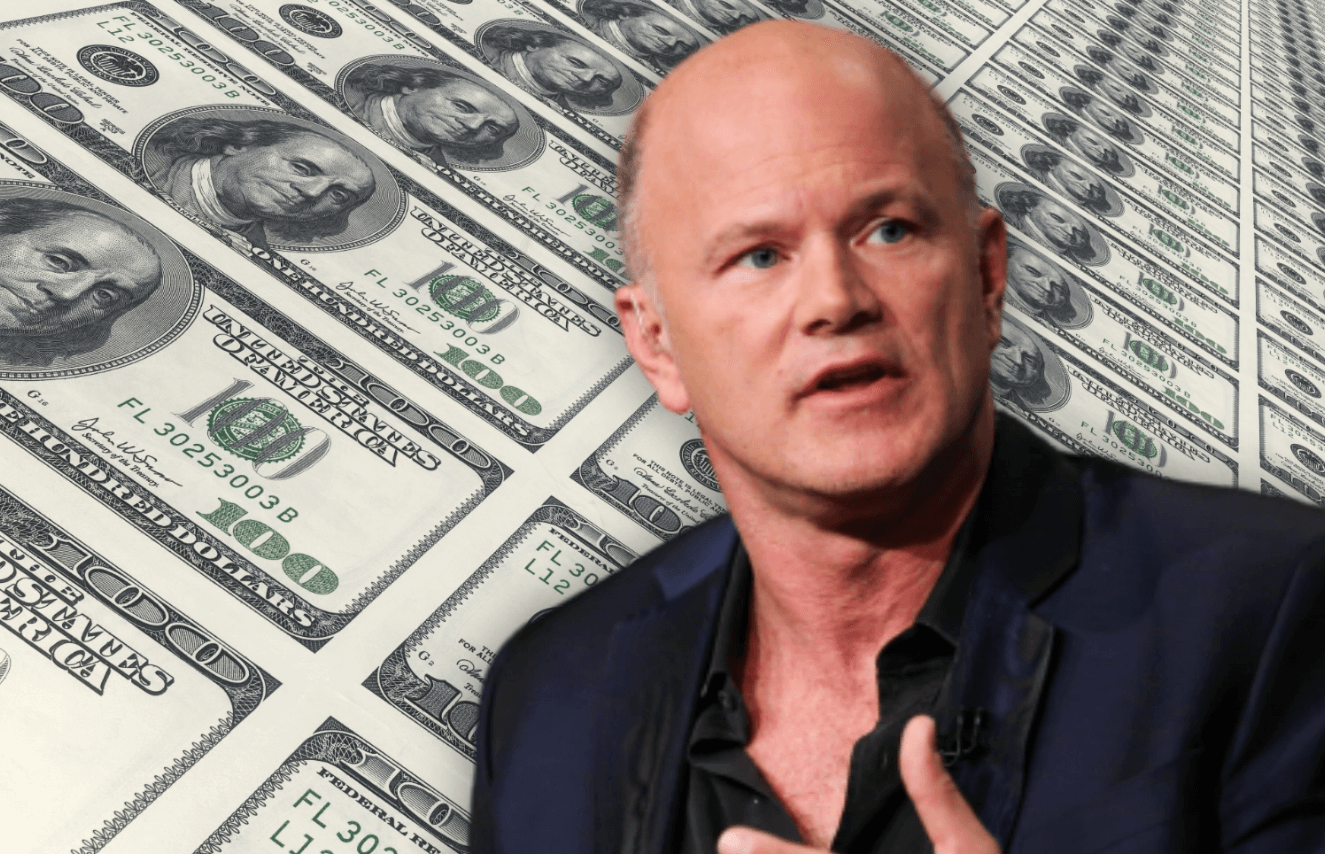
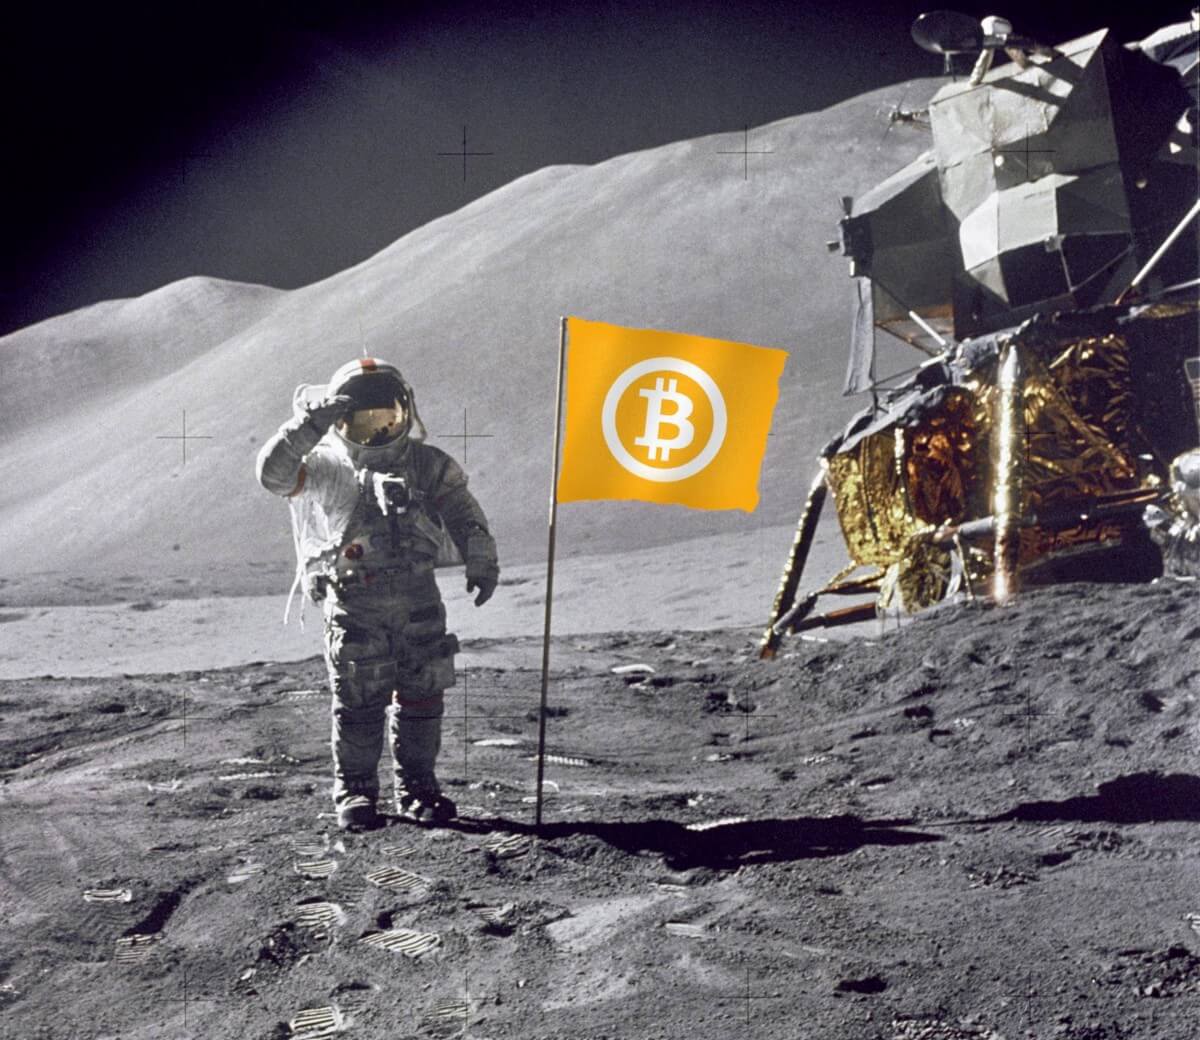
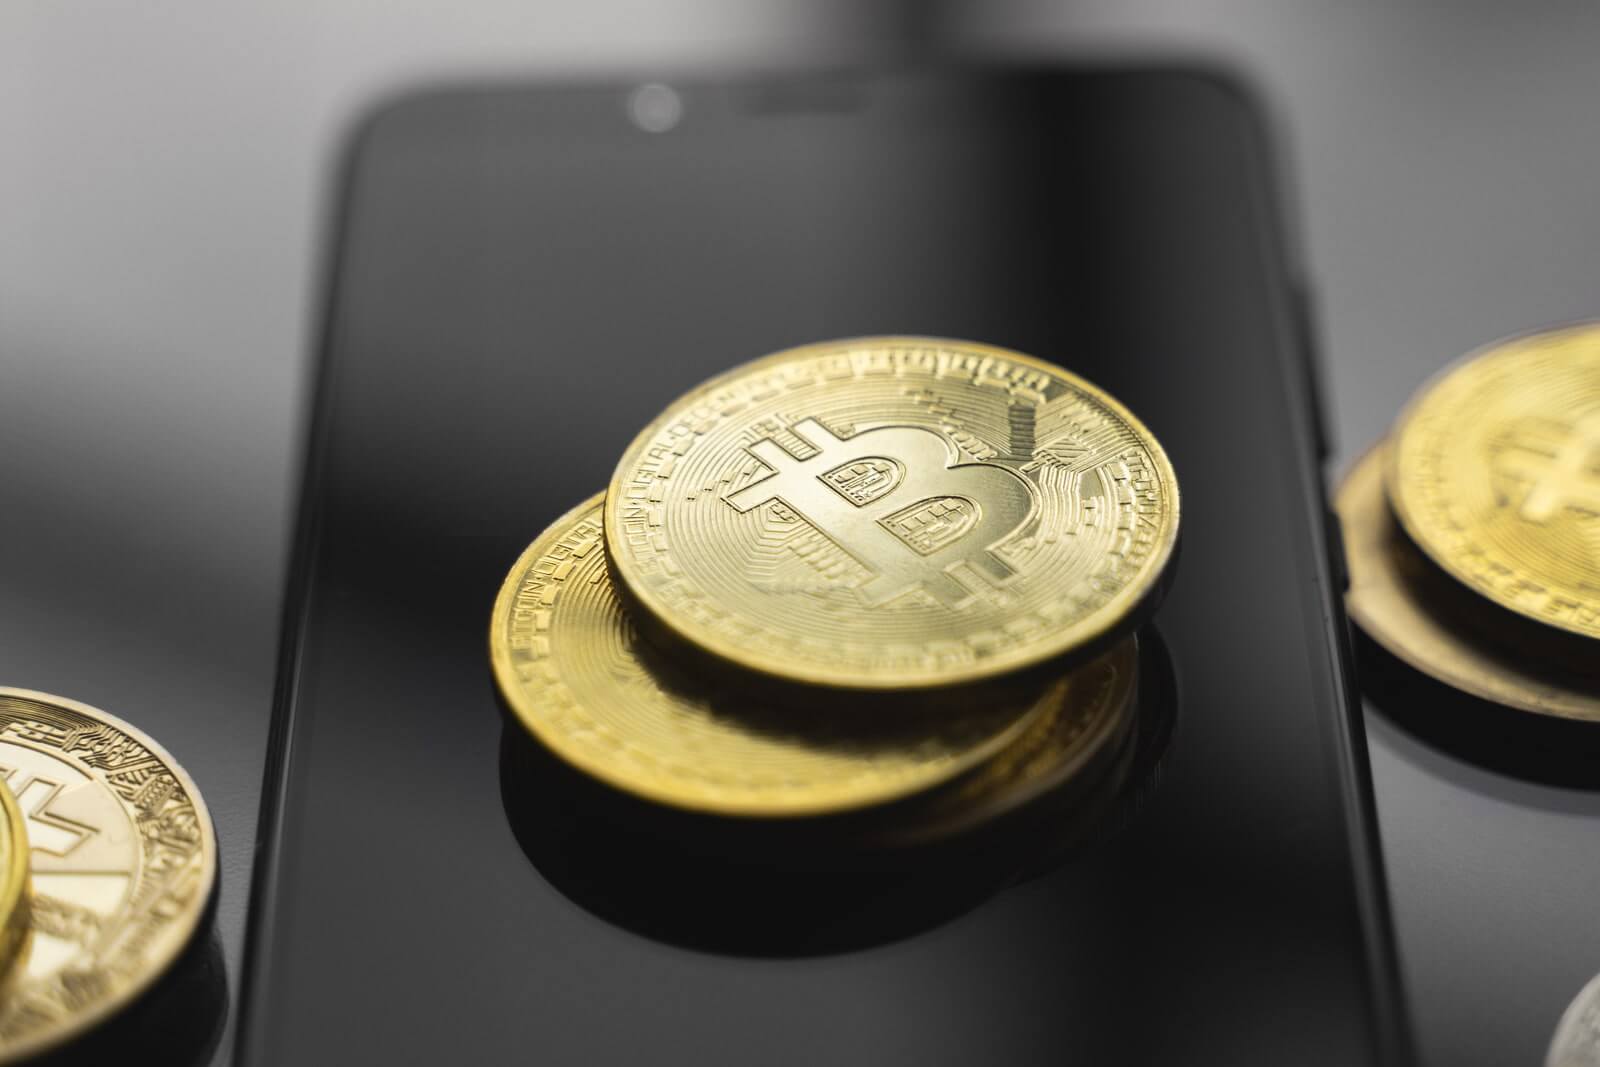
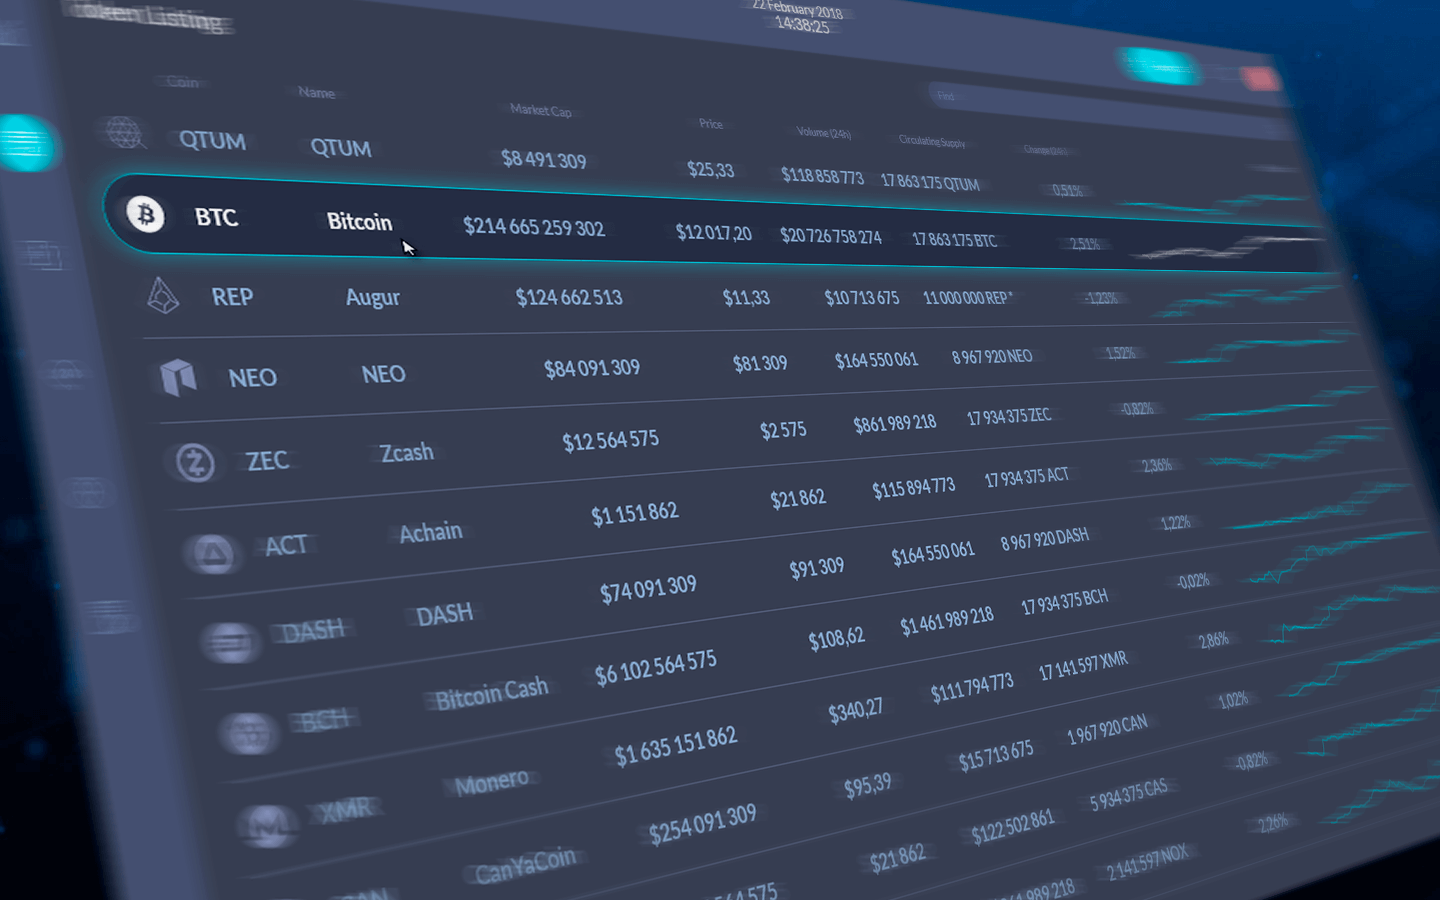
Bitcoin is Digital Gold, Not a Currency – Mike Novogratz

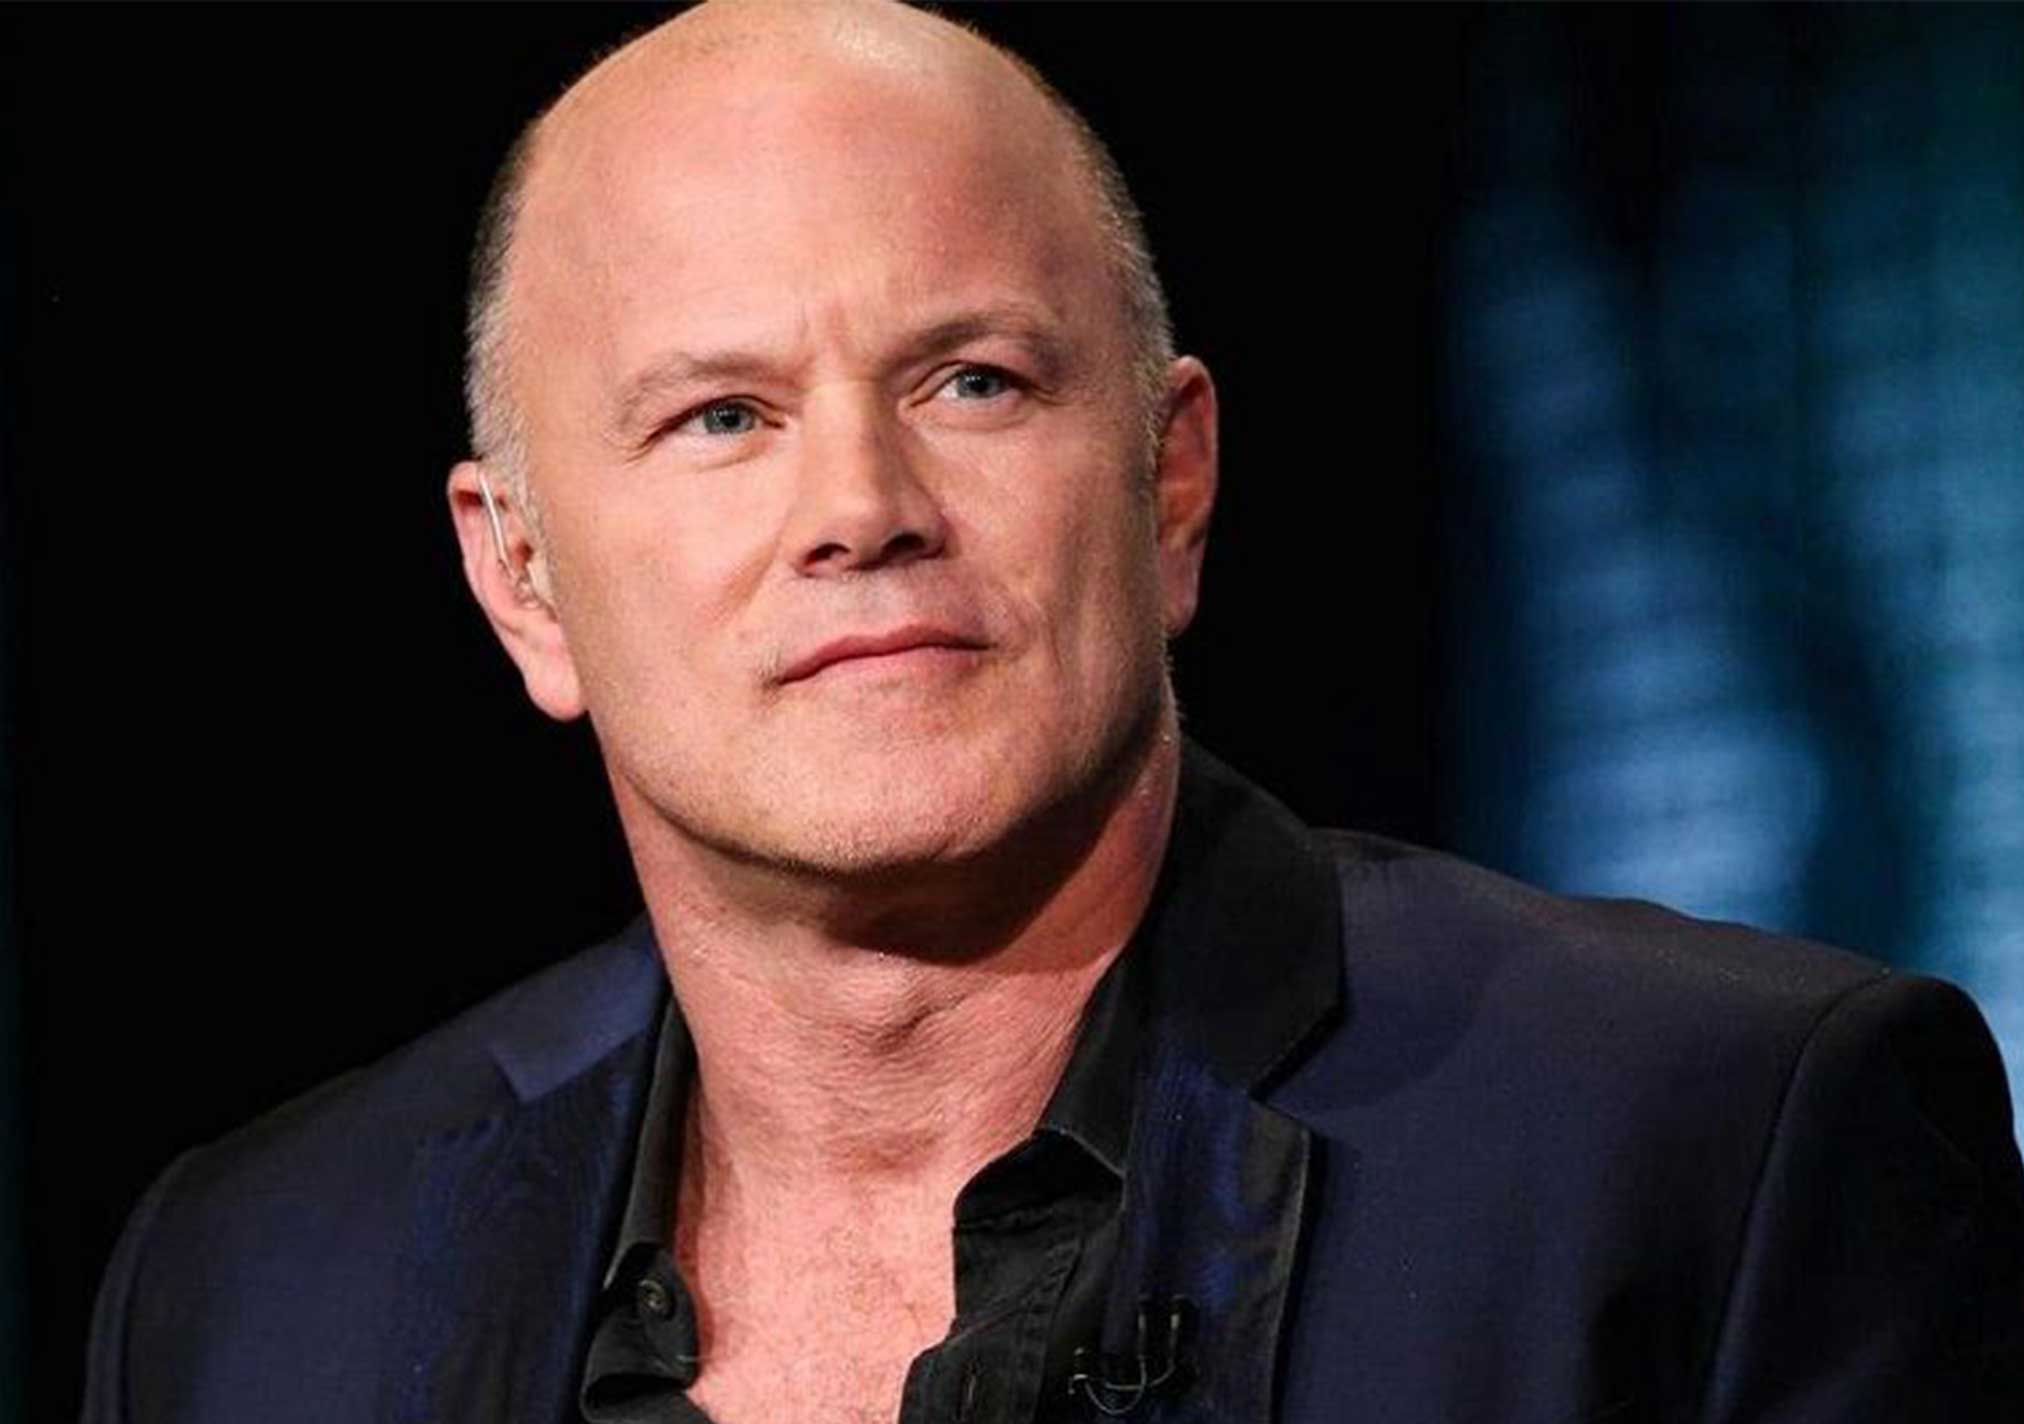
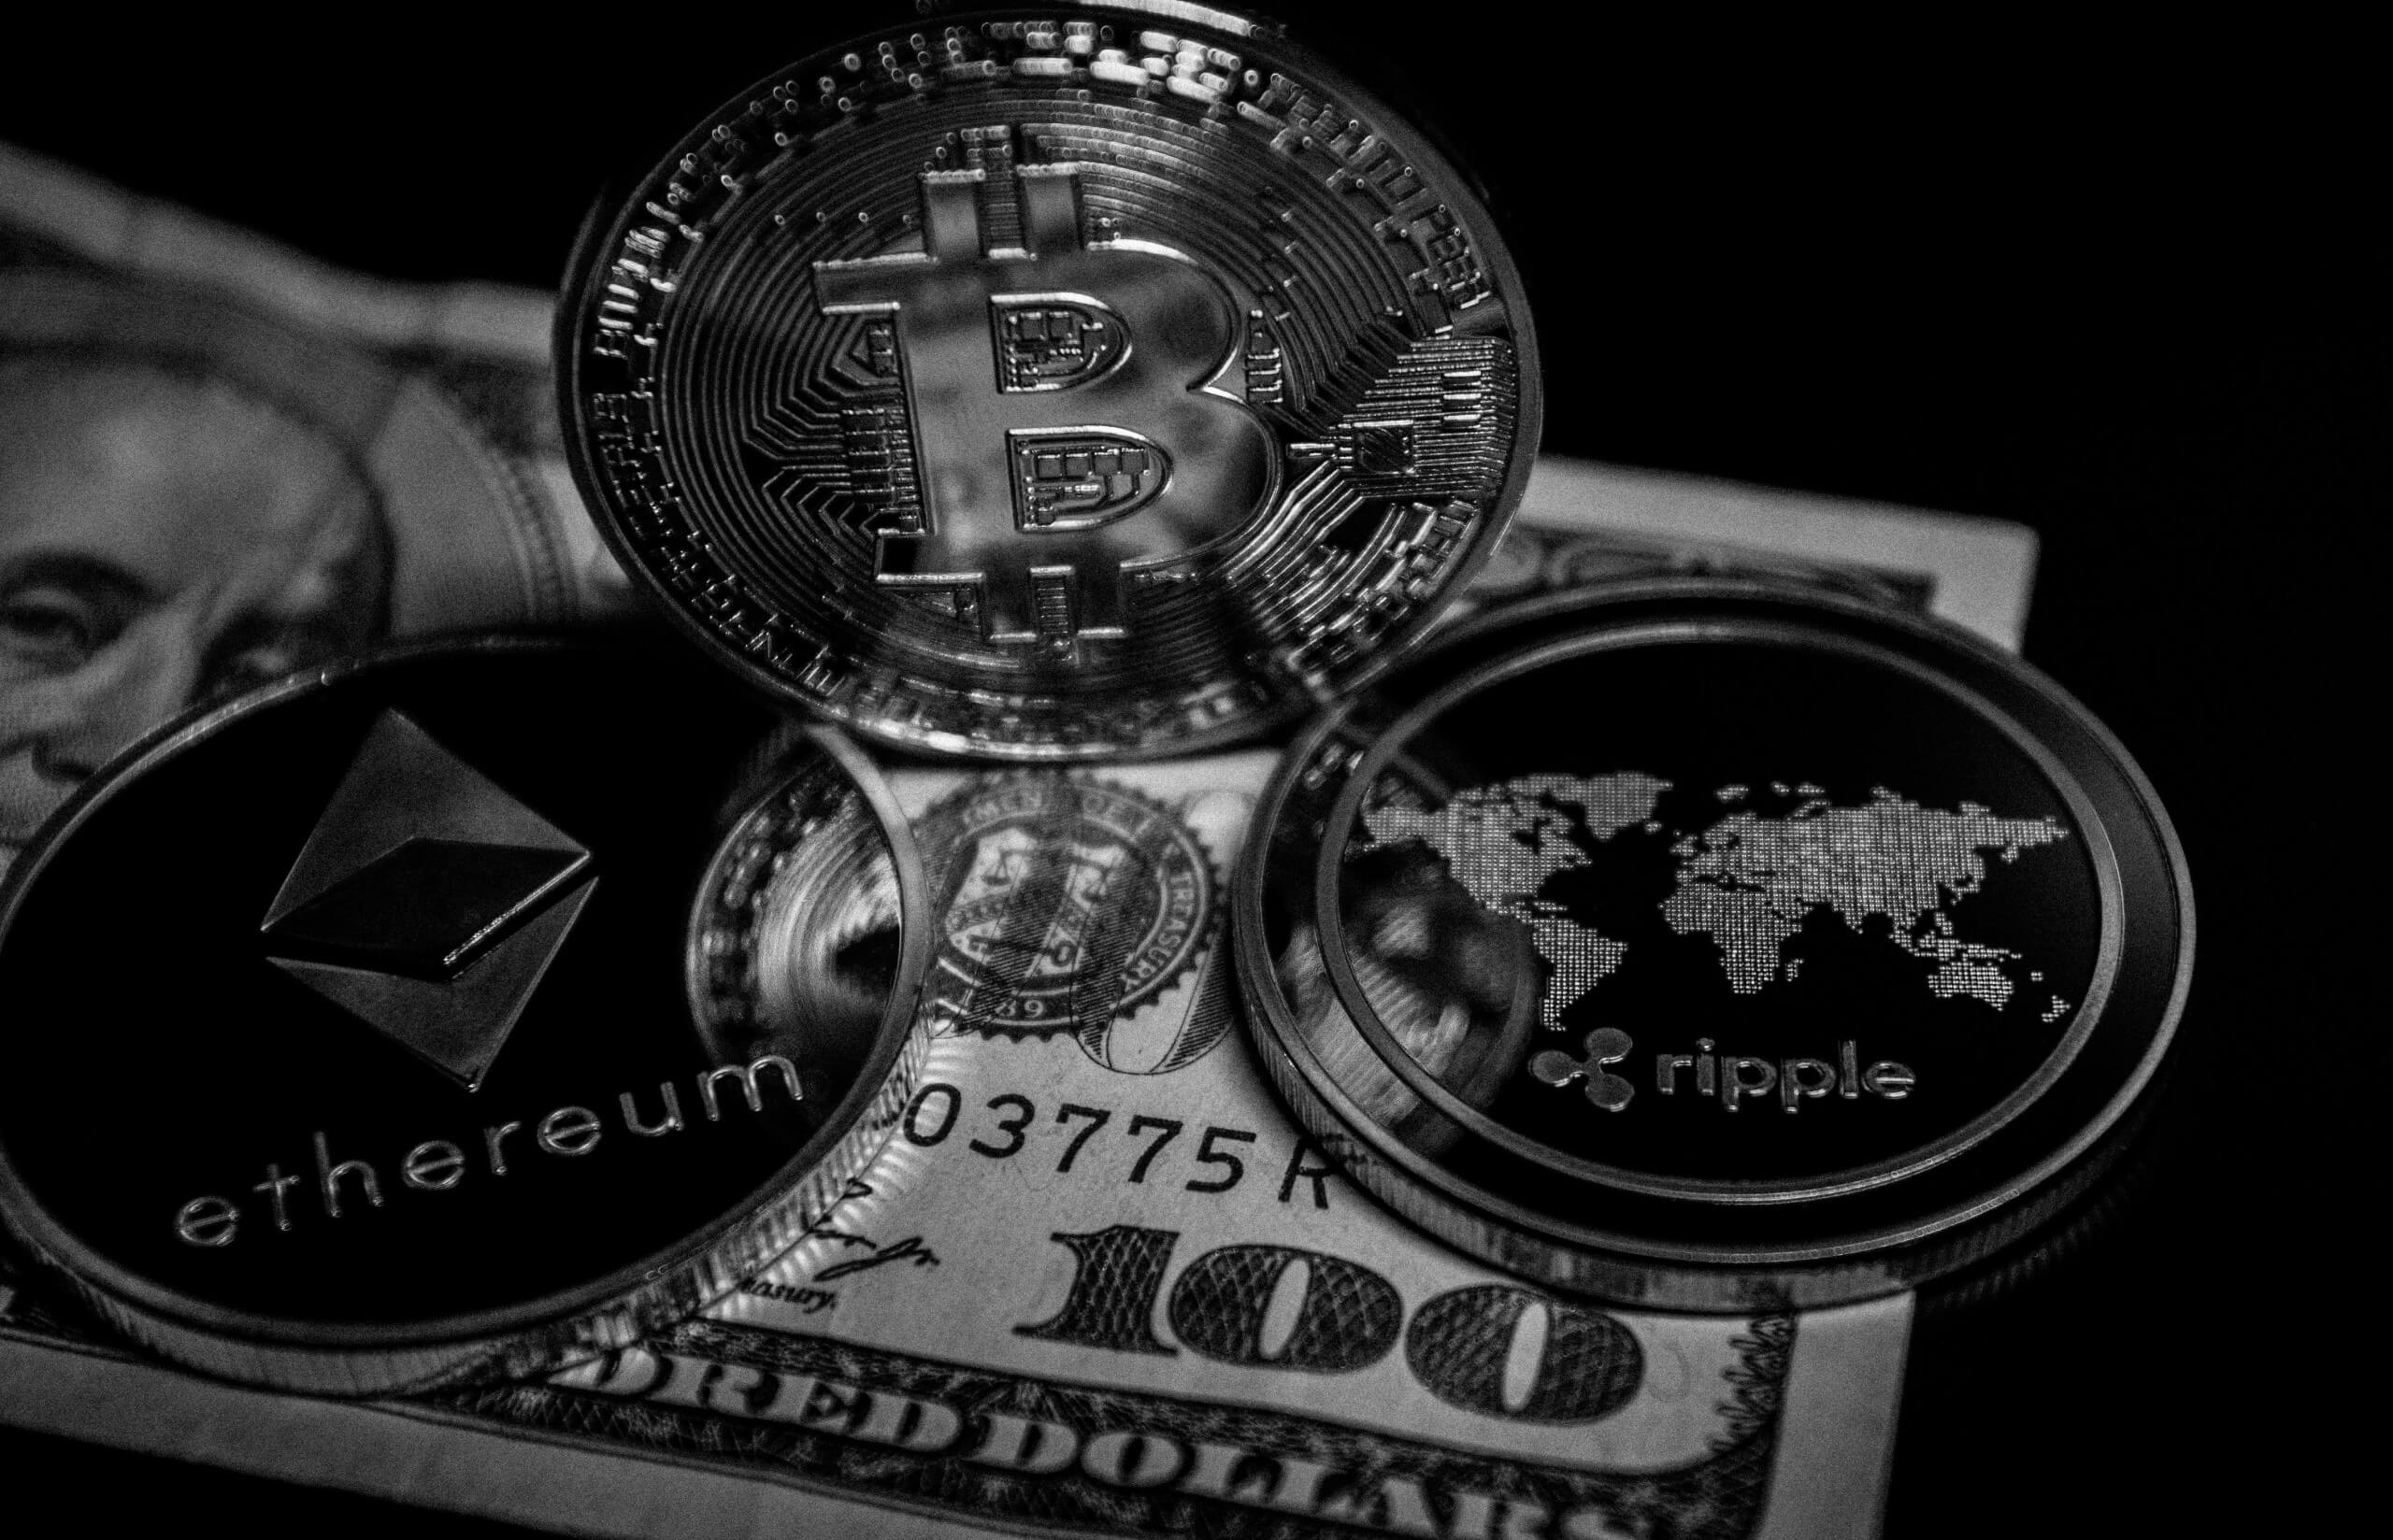
Billionaire investor Mike Novogratz has recently doubled down on a call that Bitcoin serves as digital gold rather than as currency, at least at the moment.
“I don’t think that Bitcoin is going to be used as a currency anytime in the next five years,” said Novogratz, Galaxy Investment Partners’ founder and chief executive officer, in an interview with Bloomberg TV. He added that Bitcoin is currently being used as a store of value, similar to gold, and that it will most likely remain that way for some time.

Crypto fans have argued that Bitcoin can serve as currency as they raised concerns about central banks worldwide printing money during the pandemic and about the potential for inflation to shoot much higher. They point out that central banks are looking into creating CBDC’s, their own digital assets, while China is at the forefront of development as it is already testing its digital yuan.
“And Bitcoin as a gold-like asset, as digital gold is going to keep going higher and higher,” said Novogratz. “As time passes, more and more people are going to want Bitcoin as some portion of their portfolio very soon, if they don’t want it already.”


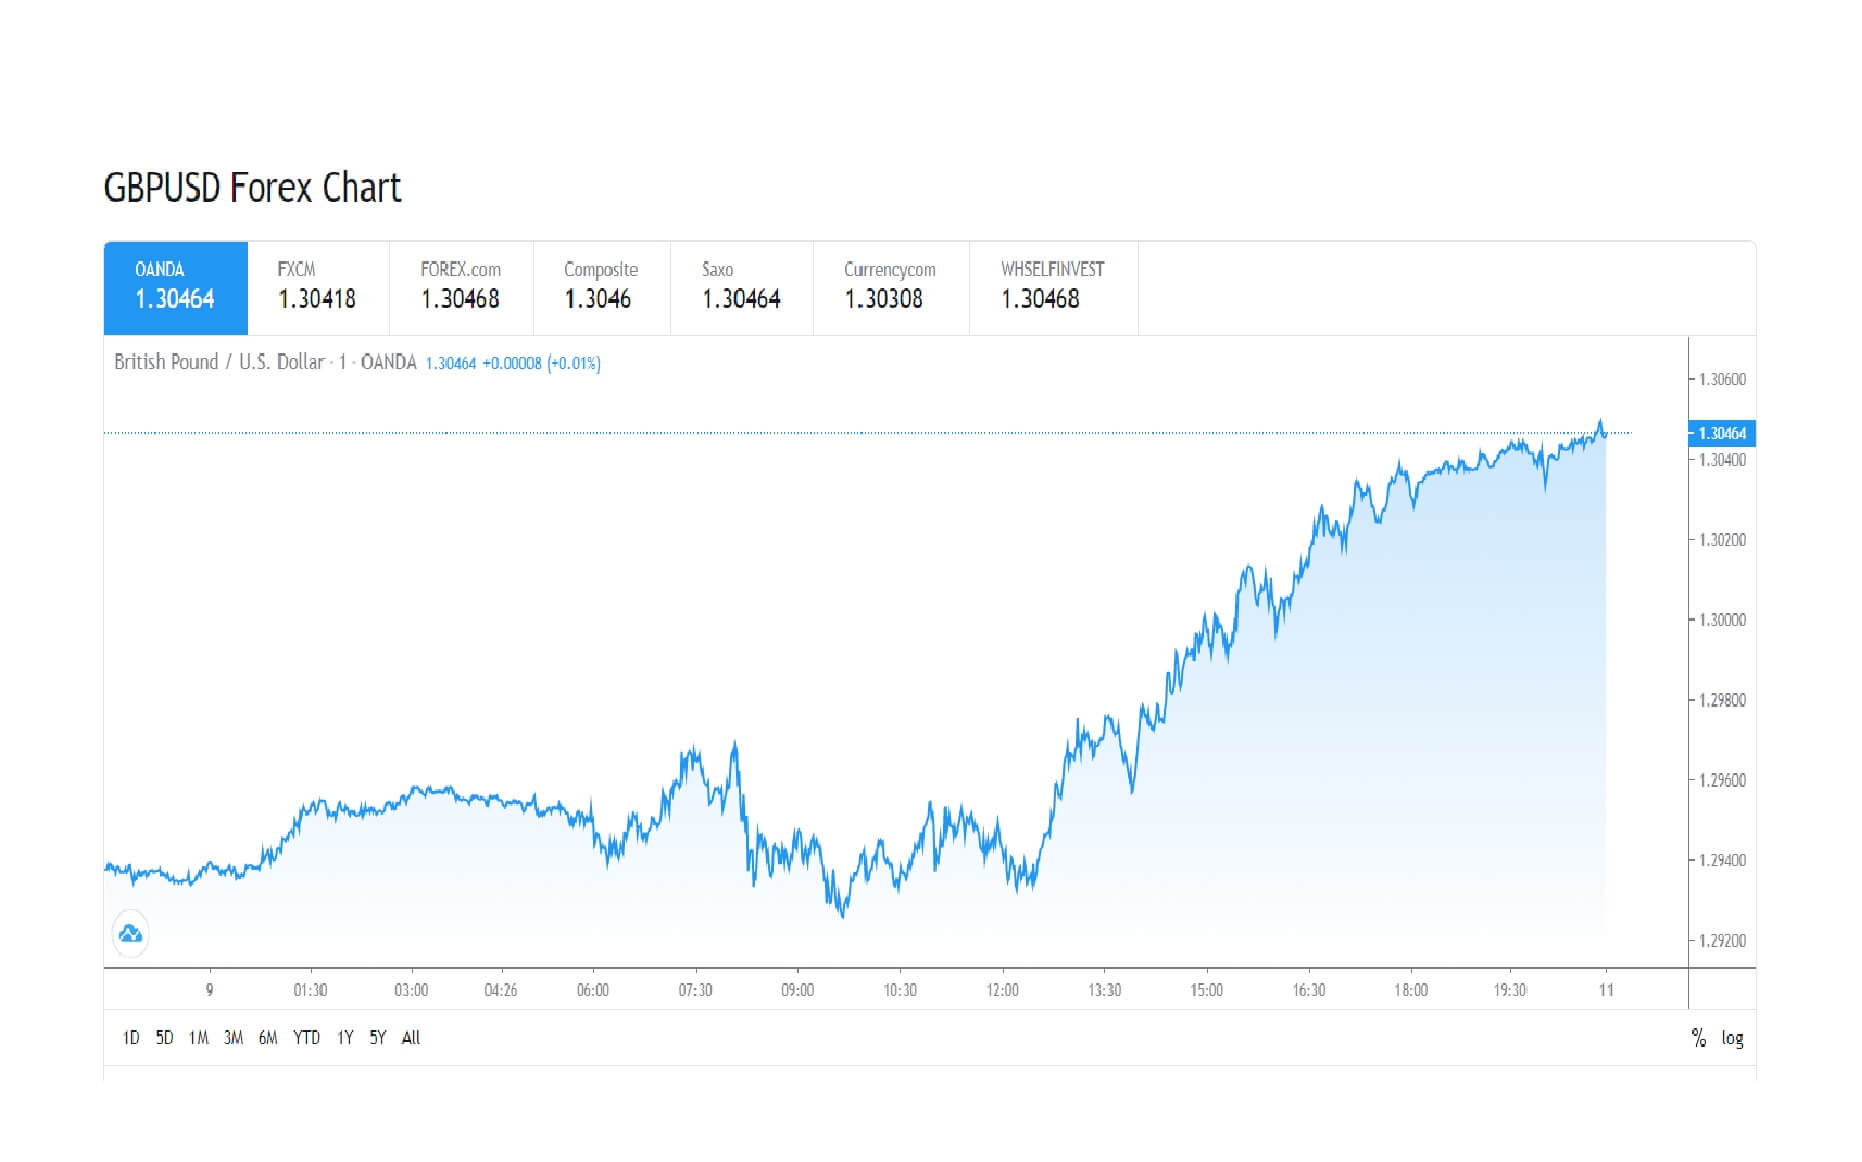
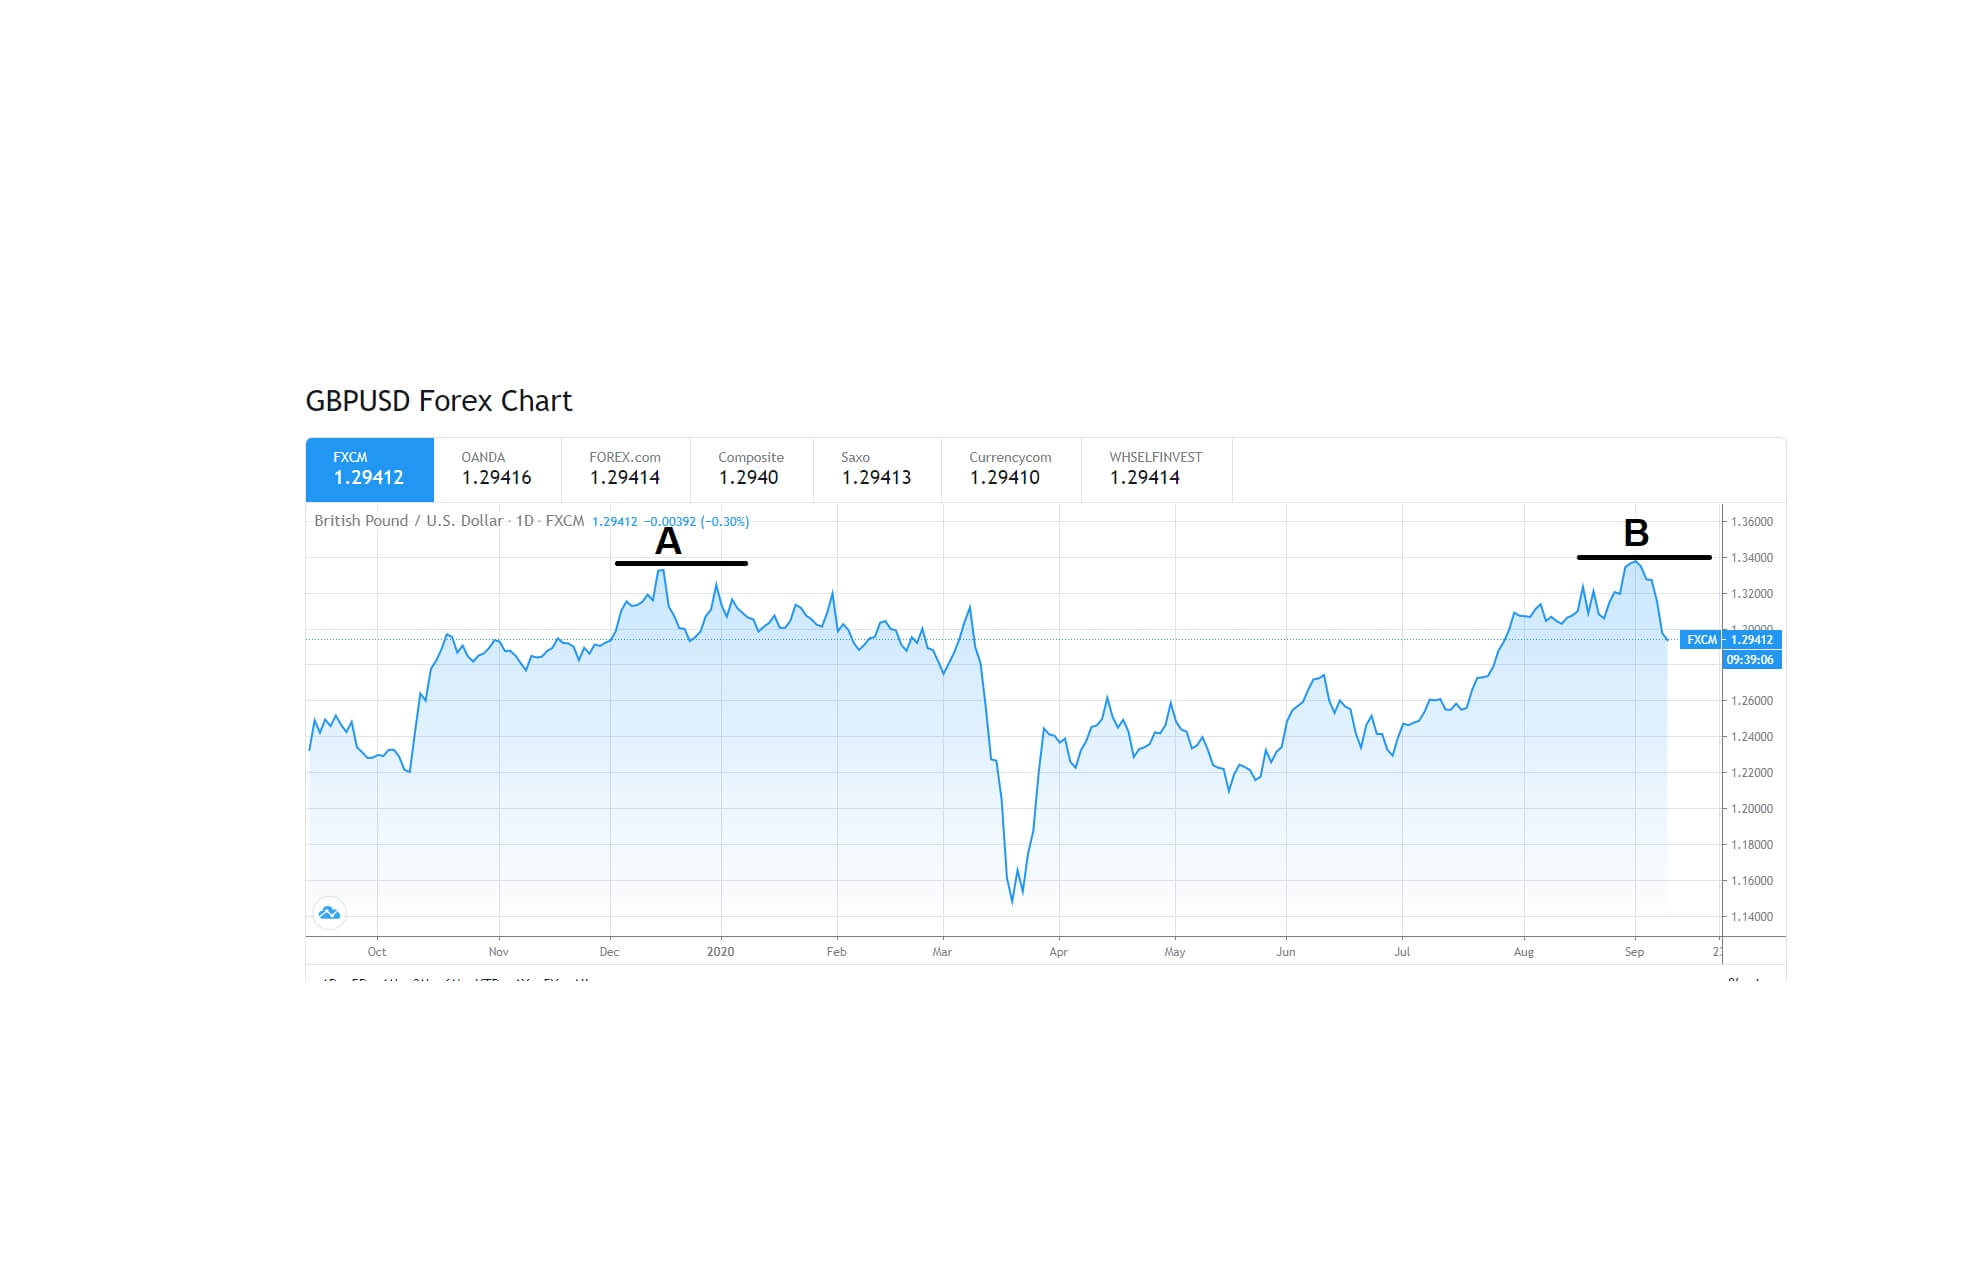
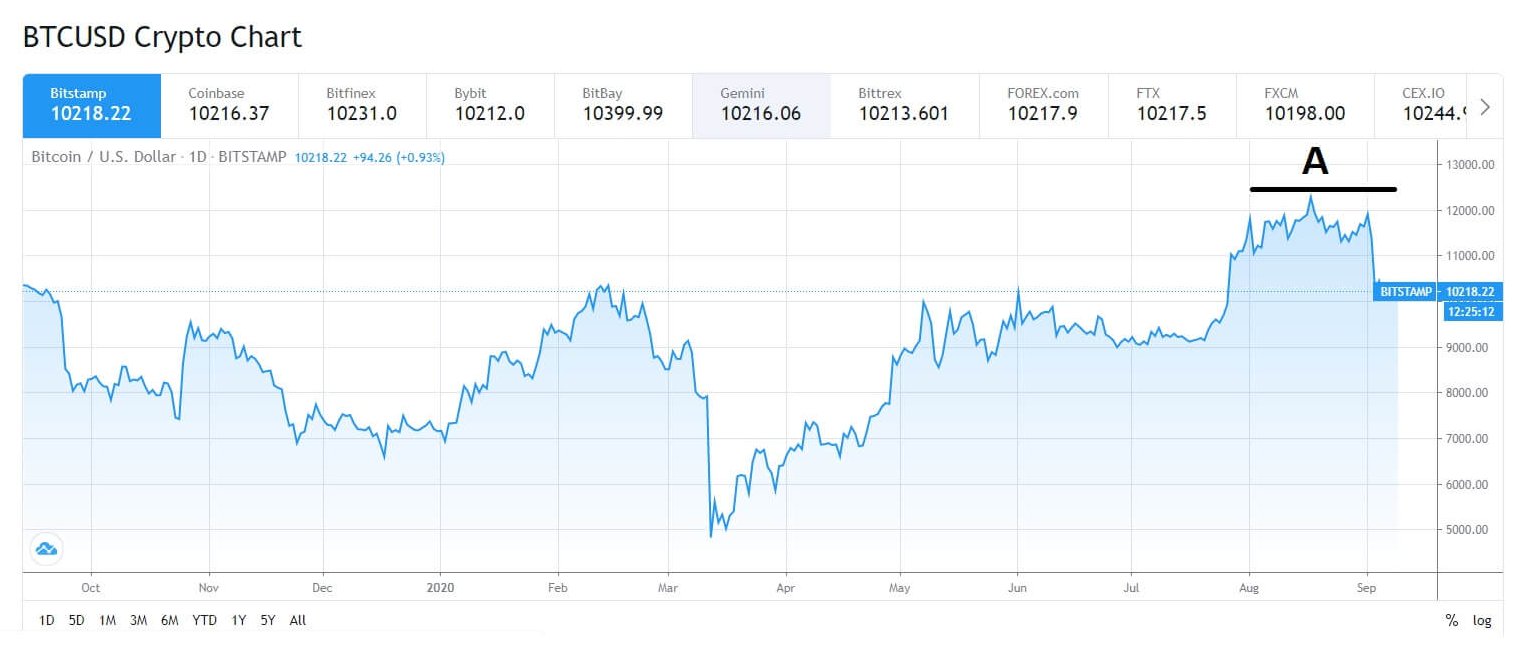
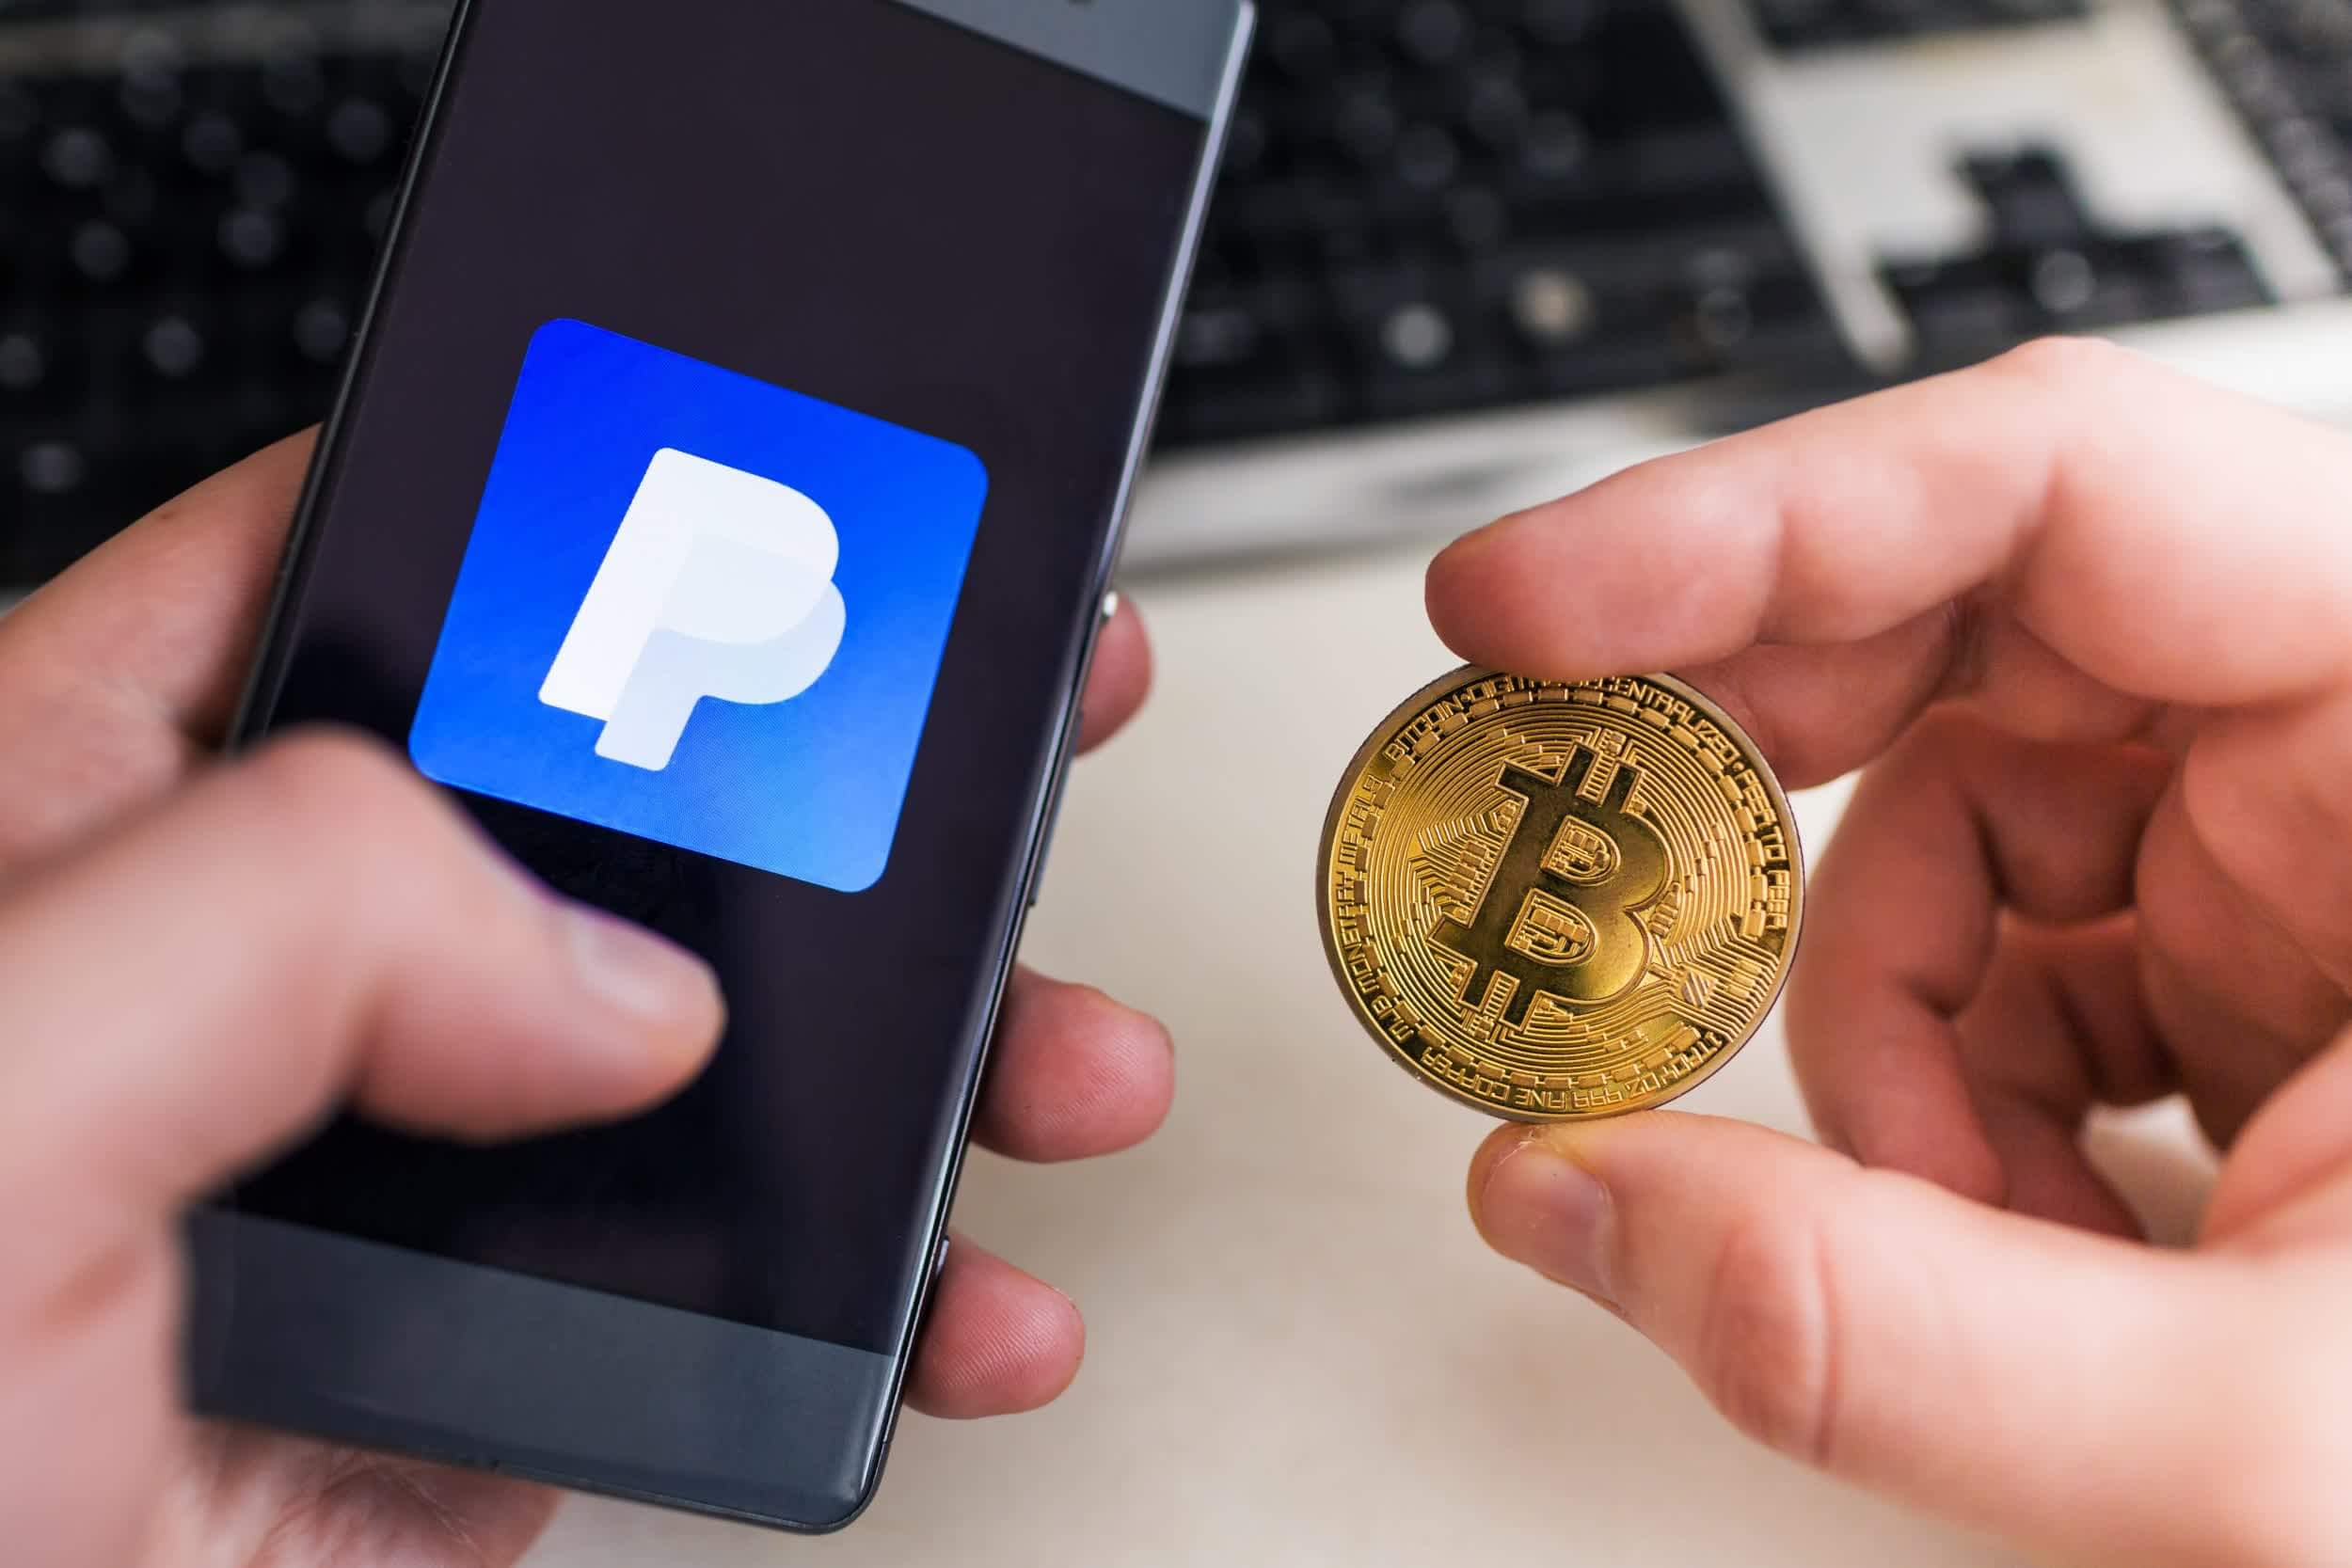
Bitcoin has rallied more than 93% in 2020, climbing beyond $13,000 and even reaching past $14,000 at one point, just a week after PayPal Holdings Inc. announced that it would allow its customers to buy, sell, hold, and eventually use cryptocurrencies. Bitcoin is currently preparing for a big move as it has recently failed to break the $13,900 resistance and stay above it with confidence.

Novogratz, as well as many other crypto fans, heralded the PayPal news as game-changing, mostly citing PayPal’s large user base that can be used to gain mass adoption. Customers on the platform will have the option to buy, sell and hold several cryptocurrencies, including Bitcoin, Ethereum, Bitcoin Cash, and Litecoin, as well as use these cryptocurrencies to shop at the 26 million merchants on its network, including its popular payment app Venmo.

Novogratz forecast that companies including Visa, E*Trade Financial, Mastercard, as well as American Express will follow PayPal’s initiative “within a year” and that they will offer platforms where their merchants will have the option to transact in stablecoins as well as non-stable cryptocurrencies.
“It’s no longer a debate of whether crypto is a thing, if Bitcoin is an asset, or if the blockchain is going to be a part of the financial infrastructure,” said Novogratz. “It’s no longer a matter of if, it’s when, and every single company has to have a plan very soon.”

Categories
Forex Videos

How To Protect your Forex Trade With No Stop Loss With The Use Of Hedging!

How to save a forex trade with no stop loss with the use of hedging!

Thank you for joining this forex academy educational video.

If you are relatively new to trading, you will no doubt understand what it is like to be in a losing trade, and what it feels like losing money, and seeing your profit and loss fall. It is uncomfortable
Unfortunately, this is all a part of trading. Losing is a part of winning. The most important thing is that you win more money than you lose in order to sustain a profitable account.
One of the biggest areas that new traders fall down is a lack of understanding of leverage and a lack of understanding of money management, and risk management, all subjects for another video.
And the biggest aspect where traders lose money is because of a lack of setting a reasonable stop loss in accordance with their account size, and where quite often new traders will lose all of their money in their accounts on a single trade.
This is purely down to poor risk management and not incorporating a tight enough stop loss. But what if you have been implementing strict money management and tight stops, but simply forgot to put one on a trade which is running against you and where you are starting to worry. What are your options?

Let’s say that you identified a potential short trade, for example on this one-hour chart of the GBPUSD where you noted areas of support and resistance in a wedge formation and thought that the price action would punch through at position A, because the pair was also overbought. The technical analysis is not important.

And so let’s imaging that you have gone short in half a lot at 1.2939, and you forgot to put a stop loss for whatever reason, and the pair has shot out of the wedge formation so the upside. What are your options?

You already know the answer to this option: close the trade, take the loss, learn the lesson, and move on.

Another option would be to hedge the position, should your account size allow you to do so. This would mean that you simply buy a half a lot – the same size as your short trade, as we have done here at position B, at 1.3075. In which case, you have two open positions in the same lot size, which are effectively maintaining the losing position balance. However, this gives you an opportunity to have think about the trade and consider other options to try and salvage some of your losing funds.
The most important thing for any trader is to protect his or her profits and not how messy it might look with regard to winning and losing trades.


If you feel that the trade is running out of steam to the upside and about to reverse, you have the option of going short again at position B, in this example, in a minimum of a half of a standard lot, and in the event that the trade falls back 50% of the way to your original open position you will have a net position, which you can either close both trades, or let it run back down to the original opening trade at position A, where you will be in profit, and manage that trade should it come lower, which might mean closing trade A out and letting the second B trade run on.

Another option is to buy a standard lot at position B, in this scenario, which is double your original size, and will have the effect of reducing your loss to zero and even turning into a profitable trade should it move higher to a point being approximately 50% higher than total spread of your losing trade, less your original spread and commission.
You then have the option that if and when the trade becomes net, to close out both trades, or just close the losing trade from position A, and let the B trade run on. Use a tight stop loss at the net position to protect your profit.
All of these options are risky and with the exception of the original hedge, require tight stop losses. Again, the most critical factor is the protection of your profits, and quite often these options will help you out of a trading nightmare. Although this scenario was based on an original short trade going wrong, it applies to a long trade and any financial asset.

Categories
Forex Daily Topic Forex for Beginners

How To Trade The Markets Now- Joe Biden The President Elect Is In Play!

Joe Biden President-Elect? How might the markets react long term?

Thank you for joining this forex academy educational video. In this video, we will be looking at the present, with Joe Biden of the democratic party as President-elect.

At the time of writing, Joe Biden would appear to have an unassailable lead in the US presidential elections. No doubt, President Trump will use every tool and trick at his disposal to try and hang on to power, including legal intervention in what he calls fraudulent voting, which, according to the press, is totally unfounded.
However, with votes still being counted in a handful of remaining states, and with Joe Biden well out in front, it would appear ear that he has one foot in the White House already.
What would this mean for the financial markets?
The Democrats, headed by Joe Biden, have lambasted Trump’s policies over the last 4 years. They will likely try and reverse many of the policies implemented by the Trump administration. One of the Democrats’ election pledges was to impose extra corporate regulation, taxes, and healthcare spending, all of which would be negative for the stock markets in the United States unless, of course, they are healthcare-related, or in the green sector, where Joe Biden has pledged to spend more money, to reduce greenhouse gases. Joe Biden has pledged to give the country a leading role in global efforts to curb climate change, a reversal in direction from the Trump administration where Donald Trump withdrew from the Paris climate agreement in 2017.
Another policy that has helped Joe Biden gain votes is his pledge to penalize companies, presumably by taxation, that moved jobs abroad. This will undoubtedly have been why the Midwest saw a surge in Democratic votes because it is the industrial heartland of America, the so-called Rust Belt.
In a twist, where investors might have bailed out of stocks due to a potential shift in policy under a new administration, with regard to higher taxes for corporations and more regulations, which would tie the hands of corporate companies and potentially affect their earnings capabilities, the markets have been airing on the side that a potential democratic party victory may be the quickest route to a generous government stimulus continuation package, and this of course, in the current economic uncertainties, would be a welcome thing.

In the lead up to the election, we can see here that the US dollar index, which is a measure of the dollar value against the basket of major currencies, the price has fluctuated between 92.00 and 94.00 since mid-August, with pressure currently to the downside at the time of writing.

One of the biggest gainers against the Dollar has been the Swiss franc, where the USDCHF pair fell below the 0.900 level on Friday 6th November as the franc was being bought as a safe-haven asset. The last time the pair hit this level was in 2014.

Another asset that is bought in times of uncertainty is the Japanese yen. Here we can see that also on the 6th of November, the USDJPY currency pair fell below the key 104.00 level to reach 103.37, and analysts will be looking to the low in March of this year where the pair fell below the 102.00 level and possibly a test of the 101.00 exchange rate.

And while the euro and pound have also made gains against the United States dollar, the Dow Jones 30 industrial index has flattened just above 28,000, as buyers try to figure out the actual winner of the presidential election, which as mentioned looks very much like Joe Biden, and what the democratic policies are likely to do for the American economy as previously stated.
Extreme volatility has prevailed over the last few weeks, and that is likely to do so in the following days and weeks until whoever actually wins the next president of the United States.
Longer-term, the markets will be looking at Democratic policies if they officially win the election and be looking for them, will they, won’t they, covid stimulus package to be agreed upon by the Democrats and Republicans.

Categories
Forex Videos

Pfizer Covid 19 Vaccine Fuels Market Volatility – Vaccines Used On Children Without Parents Consent!


Covid-19 Vaccine hopes fuel market volatility

In this session, we will be looking at the announcements on the 9th of November, where Pfizer announced they had successfully concluded a trial of their Covid-19 vaccination, which had the effect of reducing the infection rate by 90%.

The effect in the markets was immediate, and almost every asset class saw volatility while traders and investors saw the news as bullish. The Dow Jones 30 index took the brunt of the volatility, where it had been fairly steady after the US Presidential election with relative calmness, and not selling off as expected when Joe Biden won, it went monstrously bid, rising by over 1500 points to an all-time record high of over 30.000 before pulling back due to profit-taking.

The FTSE 100, which had also been flatlining, also punched above the previous 6.000 ceiling to record a 5% bull move.

The EURUSD pair saw a jolt of heaving buying to a high of 1.1920 before heavy selling pushed the pair to below 1.1800

And the selling pressure on the USDJPY pair, where the yen was being bought as a safe-haven currency, immediately lifted the pair over 200 points to 105.65. Traders had been anticipating a move lower within the channel shown here on the daily chart to a possible test on the 101.00 level.
While the use of an effective covid vaccine has been eagerly awaiting by the entire population of the world, the financial markets took the view that life will gradually get back to normal for all of us in the next few months. And this means that economies around the world will go back to full production and turn around the losses they have incurred over the last 12-months as they gradually get back to normal, thanks to the vaccine.

But the markets have a reputation of buying the rumor and selling the fact, and we wonder if things aren’t just a little bit overcooked. Why, may you ask, are we downbeat about this wonderful news. We would say cautious rather than downbeat, but let’s just take a look at the facts about the company behind this vaccine, and then we will leave it to you to decide whether people are looking at this situation through rose-tinted glasses.
Pfizer Incorporated is an American pharmaceutical company; it is one of the largest in the world. It’s got to be so huge by buying up competitors, which led to market dominance.

But its reputation has become tarnished along the way. It has been fined in the USA and other parts of the world, including Nigeria, for testing antibiotic drugs on Nigerian children without the parent’s consent, effectively using the children as human guinea pigs. The Nigerian courts settled $75M with an undisclosed amount being settled in the USA.
It received the biggest ever fine in US history of over $2B for mis-promoting medicines and giving kickbacks to doctors.
They also mislead regulators for defective heat valves where people died because of a lack of testing, resulting in a $10.75m US court settlement.
It was fined $60M for an ineffective diabetes medication, which caused severe liver damage killing patients.
They have paid $20M to doctors to promote their drugs.
The list goes on.
And yet the British government, who saw the Competition Watchdog fine Pfizer over £90 million, for ramping up an epilepsy drug by over 2000% to the NHS, have ordered 30 million doses of this new Covid vaccine, to be delivered by the end of the year which will be licensed for emergency use, initially.
With Pfizer producing the wonder drug that the whole world needs in just a few record-breaking months before specialists said that it would take 18 months to develop, we have the right to wonder if corners have been cut. Where no peer reviews have been done on the vaccine to date, in which case, drugs cannot be authenticated by third-party specialists at this time. And with such a dubious reputation, and where this drug will only be effective should be the whole population take it, I asked again, have we been looking at the situation with rose-tinted glasses? We certainly hope that the drug is effective, but with a criminal record as long as your arm, it is very wise to be cautious about this covid vaccine breakthrough.
Traders are advised to initiate very tight spot losses and expect the unexpected with his new layer added to the financial markets, mixed in with the US election President election, new levels reached in all assets, and many traders will be scratching their heads wondering where will things go next.

Categories
Crypto Videos

Microstrategy Will Hold $250 Million Worth Of Bitcoin For 100 Years!


This company will hold $250 million worth of Bitcoin for 100 years!

Microstrategy has announced that it has purchased a whopping 21,454 Bitcoin (worth $250 million) on Aug 11. The company’s CEO, Michael Saylor, announced publically that he will hold his company’s Bitcoin for 100 years, and that he has no intention of selling it.
This investment is now worth more than $290 million, representing a 16% increase in just over two months. On top of that, Microstrategy has purchased even more Bitcoin since.
In an interview with Real Vision CEO Raoul Pal, Saylor stated that the investment was not speculation, nor a hedge, but rather a deliberate corporate strategy with the goal of adopting the Bitcoin standard. The decision to invest over $250 million was discussed between its board of directors and the firm’s investors, as well as auditors.

Microstrategy decided to restructure its investment strategy in response to recent global economic uncertainty. The company is looking to explore assets better-suited to providing a long-term store of value, and they stated that Bitcoin is one of them.
After considering a variety of options and looking at it from a 100-year investment perspective, Saylor decided that Bitcoin was the only option. Taxes and fees kill almost all other assets, he concluded, and those that remain are instead severely crippled because they are controlled by either a CEO, government, or country.

Bitcoin, however, is evolving and gets harder, stronger, and faster over time, Saylor concluded. He described Bitcoin as a “hive of cybernetic hornets that are protected by a wall of encrypted energy.”
When asked about Ethereum as an alternative to Bitcoin, Saylor told Pal that it didn’t compare, as Ethereum is “still chasing after functionality.” He added that “it still has to be proven, as there are centralized competitors to it.”
Saylor’s bullishness on Bitcoin is clear, especially when he said that the fact that Bitcoin is so big when compared to all other cryptocurrencies, literally, “the market is screaming to you that this is a winner and that it’s eating the world.”

Saylor asserted that Bitcoin is the world’s best collateral and that it doesn’t even compare to gold or any other commodities in the long run. He said that if you hold $100 million in fiat currency for 100 years, you will lose 99% of it. If you held gold, you would still lose 85% at best.
Saylor described Bitcoin as an asset that is performing similar monetary utilities as gold, except better and without the fear of dilution.
Among many things he likes about Bitcoin, Saylor said that he thinks it’s important that anybody can inspect the fact that he owns the Bitcoin in one second and that it can be sent anywhere in the world for not even $5. He added that he could if he wanted, liquidate $100 million Bitcoin on “a Saturday afternoon.”

His thoughts about the crypto community were that many people believe he has weak hands, as they were saying that he will dump it very soon. However, Saylor added that the people calling him out don’t understand the mindset of long.
Saylor finished the two-hour-long interview by stating that his executives are paying close attention to developers in the crypto space and that any further opportunities will be exploited by him and his team.

Categories
Crypto Videos

The UK Bans Retail Investors From Using Crypto Derivatives!

The UK Bans Retail Investors From Using Crypto Derivatives Starting January 2021

The UK’s Financial Conduct Authority has banned the sale of cryptocurrency derivative products to retail investors. This move was followed by the statement that the ban will save its targeted customers £53 million (or $68.9 million) of losses each year. The ban will be in effect starting Jan 6, 2021.
In a statement that came out on October 6, the FCA declared that the sale, marketing, as well as distribution of any derivatives by any local or foreign company operating in the UK is banned. This includes contracts for difference, futures, options, and exchange-traded notes.
The Authority said that derivatives based on digital assets such as Bitcoin or Ethereum are “ill-suited for retail consumers due to the risk they pose.” The FCA outlined numerous risks that it considers are originating from trading such products, including a lack of “reliable basis for valuation,” possible market manipulation, as well as “extreme” price volatility.

It stated that retail clients generally lacked a “legitimate investment need to invest in these products,” as well as that the average retail investor did not fully understand derivatives trading. The ban was first proposed in July 2019, and it doesn’t affect the trading of cryptocurrencies such as Bitcoin, which are not FCA regulated, but only the derivatives of such assets.
Retail investors currently holding crypto derivatives will be allowed to keep them for as long as they want. Sheldon Mills, FCA’s interim executive director of strategy and competition, said that the significant price volatility, combined with the difficulties of valuing crypto assets reliably place retail consumers at a high risk of suffering major losses from trading crypto derivatives.

Shares of companies that offer the banned derivatives plummeted in London trading on Tuesday, Oct 20. CMC Markets dropped 2.8%, Plus500 fell 2.1%, while IG Group Holdings slid as much as 3.3%. An executive at Coinshares, a UK-based exchange that offers a variety of crypto derivatives, criticized the FCA’s decision. They also stated that the ban “will not result in more savings and benefits, but it will rather simply drive UK retail investors to unregulated crypto exchanges.”

The FCA ban can be seen as further evidence of the UK turning its back on innovation and on regulatory coordination with other jurisdictions,” said the aforementioned executive.

Categories
Forex Videos

FOREX – Will Fishing Be The Boot To The Throat For A Brexit Trade Deal? GBP Looking Bleak!

Will fishing scupper a Brexit trade deal between the UK and EU?

In this session, we will be looking at the topical issue of the ongoing Brexit talks between the EU and UK regarding the future trading arrangement, where the United Kingdom is seeking a new future tariff-free trade deal.

One of the reasons why the United Kingdom chose to leave the European Union was because of the pressure the government was put under by the fishing industry in the United Kingdom, who saw fish stocks depleting heavily because the EU has the right under the old agreement of fishing in British waters. A system of quotas dividing up specific stocks goes back to the 1970s, and the UK fishing industry says it was a bad deal for British fishermen. This has been very a very contentious issue for many years.

The British government wants to set a limit around the United Kingdom’s coast of 12 nautical miles, which will be an exclusion zone for EU fishermen to enter, without a formal new quota arrangement in place as a part of the future trading relationship.
Currently, under the Common Fisheries Policy, European boats are still allowed to fish in British waters, and British boats are allowed to fish in other European countries’ waters until the UK formally leaves the EU on the 31st of January 2021. Until then, it is still bound by the European Union rules pertaining to the fisheries policy.
The EU and UK are at loggerheads with regards to access to UK territorial waters, which are important because they offer a bountiful supply of fish.
The German and French governments have issued statements saying that they will not alter their position with regard to their firm stance on future access requirement to British territorial waters and where the two are trying to battle out a quota arrangement which would form a part of any future trading relationship.
Both sides say that the bridge is just too wide between what is being offered from either side in order to be able to move forward and close the future trade deal and where Britain has set a red line for the 15th of October, whereby if no such arrangement is set in place which would allow time for the agreement documentation and laws to be set in place, it would not be able to have everything done in time for the end of the current transition period. Boris Johnson has said he will walk away from a deal if talks are not completed by the 15th of October.

This is causing major volatility on the British pound as the 15th October deadline looms, and the pound is beginning to gain ground against the United States dollar and his firming against other currencies because traders and analysts and economists believe that the two parties will be able to come to an agreement in time. If not, the United Kingdom will leave the EU on the 31st of January with no formal agreement in place with the European Union and will enter into world trade organisation trading arrangements with the EU.

Other problems have also to be finalised, such as Northern Ireland where no border exists between the North and the South, which remains a part of the European Union, and which leaves itself open to the unchecked and unregulated movement of people, animals, and goods, between the two countries, and other areas including market standards and practices throughout the various sectors.
One thing is for sure volatility will continue you right up until the wire and potentially be locked beyond when boundaries are pushed, and potentially deadlines may have to be shifted if realistically some kind of deal can be done.

Categories
Forex Videos

Forex Fundamental Analysis For Novices – New Zealand Visitor Arrivals!

Fundamental analysis for novices: New Zealand visitor arrivals

In this session, we will be looking at fundamental analysis for novices and taking a look at the New Zealand visitor arrivals’ economic data release and how it might impact the New Zealand dollar.
If this is the first time you have seen one of our fundamental analysis or novices videos, we place a great deal of emphasis on the importance of regularly studying an economic calendar for the release, by governments and agencies, of economic statistics, which paint a picture of the health of an economy.

These economic data releases happened weekly, monthly, quarterly, or annually with regard to statistics, but also so provide important information for upcoming events such as key policymaker speeches, upcoming interest rate decisions, and other significant future events which may cause shifts in exchange rates for the various currency pairs.

Obviously, if you are trading a currency pair and are unaware of such key market-moving data releases, it might adversely affect the trade you are in, causing losses.
All professional traders keep a close eye on their economic calendar because it is another tool in their arsenal to help them make the right call when trading.

This is a typical economic calendar. Most reliable brokers will offer this free of charge on their Website.

Typically they will have a filter section so that you can look at past or future economic events or adjust to the various types of impact that events might have, such as low medium or high impact, and the various categories including events such as holidays 0 filtering out events such as holidays auctions bond auctions inflation, or interest rate data.

The critical components of an economic calendar are the day and date, the type of event, the time of the event, the country, the likely impact that that data release will have on a currency pertaining to that country, which might be low impact, medium or high, and where the higher the impact level, the more likely you will see volatility around that currency, post-release.
As we can see here, the information relating to the event is populated on the calendar just underneath the titles section.


The economic events we are interested in this session is the New Zealand visitor arrivals, the data of which will be released at 22:45 British summer time for the month of August, where the impact level is low, and where we can see that the previous release was – 98.5% and a consensus is – 114.9%. The consensus is put together by leading economists. Here we can see that they have a gloomy outlook for visitor arrivals for September and where the consensus is that the figure will be worse than the previous month year-on-year basis.

The visitor arrivals data is collated and released by Statistics New Zealand, which is the official data agency, and it shows how many people visited New Zealand. This is significant because tourism is a key part of the country’s gross domestic product, and they are heavily reliant on visitors, which is therefore important for the health of the economy.

This graph from 2010 to 2020 by the SNZ shows a steady number of visitors over the years until the pandemic hit and where New Zealand closed its borders to tourism in order to protect itself from the disease.

In this graph of the New Zealand dollar to the US dollar, we can see that in the middle of March, at the peak of the pandemic, the currency pair hit a low of 0.57 before bouncing back to its current levels of 0.6670, proving that although the economy is suffering from a lack of visitors, confidence is returning to the New Zealand dollar, because of the way the government has handled the economic fallout, but this also factors in a weakening US dollar, which has not been faring so well, and where the USA is still pretty much in the grip of the pandemic.
Upon release, a better than expected reading, i.e., more visitors, would typically be seen as positive for the New Zealand economy, and therefore the New Zealand dollar would move higher against the United States dollar and perhaps other pairs it is trading against, while a low reading would be negative for the New Zealand economy, in which case we might expect to see the New Zealand dollar falling against those counter currencies.

However, as previously mentioned, the New Zealand dollar is proving extremely resilient at the moment, and where we might consider that traders are confident in the government’s handling of the crisis, where the infection rate is extremely low, and where the long-term view is favorable for the New Zealand economy.

Categories
Forex Videos

Which Broker To Choose? A Or B Book Brokers? Is It In Their Interest For You To Loose?

A book, or B book – a trader’s choice

In this session, we will be looking at the difference between trading via an A book or a B book and why it matters in forex trading.

There are literally hundreds of brokers for new forex traders to choose from nowadays, and as growth continues in the forex market, which is the biggest business on the planet, it is not surprising that broker firms are cropping up all over the place, try to cash in on a slice of the action.


Most traders don’t consider how their trades and orders are executed. They tend only to focus s.com there trade-in and trying to make money.
Therefore, A book and B book is the last thing they think about. They simply trust that the broker they are dealing with has the right framework in place to be able to offer tight spreads and trades that are executed without glitches.

As liquidity and technology have advanced since the onset of retail forex trading, these issues have become more reliable, and with the ever-increasing dependency on social media, it is so easy now for new traders to research their broker of choice to find out if they have an adverse history, including complaints and bad recommendations from current or previous traders.

So, what is an A book in Forex?

Brokers who use an A book operation will pass your market orders either instant execution or pending into a liquidity pool of providers such as Banks as Deutsche Bank, Barclays Bank, or JP Morgan, for example, who then act as the counterparty on your trades.
This is also known as straight-through processing or a non-dealing desk broker, which you may have heard also referred to buy the name of an ECN broker.

Some traders prefer this route because they feel there is no conflict with their broker. They’re orders simply go into a pool where there is a huge amount of liquidity by third parties, which will typically act to provide tight spreads during the busiest hours of the trading day, particularly the European and US sessions. These liquidity providers have no details about the trader and cannot formulate counter trading strategies regarding potential trading styles, which could be detrimental to the trader.
Typically, A book brokers usually charge a commission on the trades, which is the fee that you pay when you open and close trades. This fee is somewhat negated by the tight spreads being offered by the deep liquidity pools in this model.

What is a B book in Forex?


Some forex brokers have their own dealing desks, and this is known as B book.
In this model, if you place a trade onto your platform, either as an instant execution or pending order, your broker is the counterparty for these trades. This causes concern for some traders who worry that the broker who offers this kind of setup may call spikes during volatile times to deliberately stop losses where they are booking the profit from such loss.
Also, there is a possibility that these types of brokers can use technology to set up trading recognition software in order to determine trading styles, which might then influence trades to their favor.

However, if we discount such practices, which may well have gone on during the early days of retail forex trading, but are not so prevalent nowadays, because brokers value their reputations and want to attract as many traders as possible, there are some advantages to trading with ab brook broker.

The main advantage for a trader is that this is typically where you will find and fixed spreads. These kinds of spreads are more favorable during out of market hours; such as after the American trading session in the run-up to the Asian morning session and after the Asian session leading into the European session.
B book traders will also typically offer tighter spreads on more exotic currencies, including cross currencies, where A book brokers may only be able to offer much wider spreads.
The things to consider are what type of instruments you are looking to trade, whether it’s a major currency pair, a cross currency or exotic pair, the time-zone you are trading from, and the spread, with or without the commission structure being offered by the broker. And of course, your type of trading style; for example, if you are a scalper, you want the tightest possible spread you can get, but if you are a long-term swing trader, this will not be so important to you.

Categories
Crypto Videos

Why Bitcoin Is suddenly Exploding – Investors HODLing Bitcoin For 2021 Bull Run!


Investors HODLing Bitcoin More in Anticipation of 2021 Bull Market

bitcoins upward trend growth chart vector

New data shows that Bitcoin’s current price action shows much higher levels of ‘hodling’  activity than the levels during previous bull cycles.
According to Willy Woo, a well-known on-chain analyst, an indicator called “reflexivity” has been on the rise in recent months. Woo explained that the reflexivity indicator measures Bitcoin investors’ tendency to hold their BTC as its price rises. This is essentially an alternative way to estimate the hodling activity of retail investors.


The next bull run may lead BTC above $20,000
Several reasons caused retail investors to hold onto their Bitcoin even more so than during previous bull cycles.
If Bitcoin manages to rally in 2021, most investors would see the event as a post-halving bull run. Historically, Bitcoin has rallied 12 to 15 months after each halving and managed to record a new all-time high each time. Based on Bitcoin’s tendency to rally after a halving, many retail investors might be holding it to avoid being priced out in case of a strong sustained rally.

Also, Bitcoin has shown a surprising level of resilience throughout several potential black swan events. After its initial recovery from the COVID-19 pandemic-induced crash in March, its price has stayed above $10,000 despite numerous negative events.
Looking at the most recent example, Bitcoin’s price went down slightly after the US CFTC charged the crypto trading platform BitMEX with violating the Bank Secrecy Act.
After CFTC’s announcement, BTC price instantly fell below $10,500 but quickly recovered to the $10,700 support level. According to Willy Woo, this is most likely due to the confluence of the two key factors. He then explained:

“Reflexivity represents the HODLers’ tendency to hold onto their crypto harder as price increases. While I had expected reflexivity to increase during the craze of bull markets, it looks quite constant from the last two cycles… However, this cycle is interesting, as reflexivity increases rather than static compared to the last cycles. Even though we now need more capital invested to get a similar % gain in price, more and more HODLers are holding even tighter than before.”

The US presidential election may push Bitcoin price higher


Industry executives and prominent investors in the crypto space foresee the upcoming US presidential election in November benefiting Bitcoin.
CEO of Three Arrows Capital Su Zhu said a Democratic sweep would almost certainly catalyze Bitcoin due to various macro factors. He also suggested that a Trump’s second term could also benefit Bitcoin. He wrote:
“Biden is extremely bullish for Bitcoin because the democrat blue wave will most likely usher in the unprecedented installation of MMT agenda with the corresponding dollar weakness and deficits. That being said, Trump is also bullish for Bitcoin, though to a lesser extent.”

As it stands now, Bitcoin is less affected by the negative news than by the positive ones, which is one of the main indicators for identifying a bull market. While we are not there yet completely, most analysts believe that 2021 will be a great year for Bitcoin, regardless of what happens around the world.

Categories
Forex Videos

How Forex traders factor in President Trump – The Enemy Of Predictability!

How do traders factor in President Trump?


Thank you for joining this forex academy educational video.
In this session, we will be looking at how President Donald Trump affects the financial markets and what precautions traders have to take since he came to power.
First of all, we need to remind ourselves that President Trump has never been a politician, he has never been a diplomat, and some members of the democratic party in the United States, and a lot of other people besides, might argue that he doesn’t have a diplomatic bone in his body.
President Trump inherited a fortune from his late father and made himself a name in reality TV. He has brought a certain element of reality TV to his presidency. Often his style is considered to be chaotic, argumentative, belligerent. He has been accused of lying, and the democratic party tried to have him impeached halfway through his presidency.

Certainly, there seems to be a great deal of animosity between himself and the speaker of the House, Nancy Pelosi, who, not happy with losing the opportunity to have him impeached halfway through his term in office, is now working to have him removed from office over concerns about his inability to run the office. Where, under the 25th Amendment, should she succeed, vice president Pence would take over.

This will only serve to cause more friction between the pair. And when Donald Trump’s cage is rattled, he tends to be reactive, which may be causing the delay to the proposed stimulus bill. The longer is stalled, the more it will adversely affect Americans and American companies. The current impasse between the republicans and the democrats is the difference between 1 trillion or 2 trillion dollars. Surely it would make sense to at least start with the smaller of the two amounts and build from there, rather than make people suffer.
And one has to ask if this is a personal vendetta because it certainly seems to be a power struggle. And of course, this is all a part of Donald trump’s leadership style: one day he says there will be a stimulus bill, the next day he says there will not be a stimulus bill until the US Presidential election is over. This, of course, affects the United States stock markets. The knock-on effect is felt by other global markets and numerous assets, including treasuries, bonds, and of course, it is also affecting the United States dollar and every currency traded against the dollar.

But singularly, the most disruptive way that Trump affects the financial markets is his use of Twitter. With a single tweet, Donald Trump can move markets dramatically, where in years past, high-level economic data releases have been subject to an embargo. President Trump will simply issue a tweet at any time he sees fit, the consequences of which can cause the financial markets to suffer extreme volatility, with some traders benefiting and, of course, many others losing money because of this style alone.
And so, if you are relatively new to trading, we suggest you add President Trump to your Twitter feed to keep abreast of his tweets, or better still, only trade when he is in bed asleep. Remember to expect the unexpected from him.

Categories
Crypto Videos

The Amazing Chainlink – Solving Real-World Problems!


Chainlink – Beginners Guide

During the long and hard crypto winter of late 2018, many projects failed to stay afloat, but during all this, Chainlink managed to actually keep growing and defied the bearish market. At the moment, Chainlink is one of the leading cryptocurrencies in the DeFi sector. How did it manage to grow as consistently, and what sets is apart?

Problem

Blockchains use math–cryptography and practically guarantee security, trust, and decentralization. However, the problem is that each blockchain is its own universe, which means that getting information from and to another blockchain would require a trusted source. To retrieve information about event outcomes or even something as simple as Bitcoin’s price meant that you are required to trust a source to tell the truth.

What is Chainlink?


Chainlink figured out how to get any type of information in and out of a blockchain while remaining secure and decentralized, but also trustless. Sources of data between the blockchain and the “outside” world, known as oracles, are no longer a single point of failure for a smart contract. Chainlink created a network of nodes that can provide information to and from the blockchain, which created a vital part of smart contract infrastructure as a result. This “blockchain middleware” meant that Chainlink oracles could provide essential information without sacrificing on decentralization or security.
Chainlink essentially created a secure bridge to the “outside” world.
To minimize the potential failure of the aforementioned oracles, Chainlink focused on the distribution of data sources, distribution of oracles, as well as the use of trusted hardware.

Origins of Chainlink

Chainlink was founded by the current CEO Sergey Nazarov and the current CTO Steve Ellis. The project started in Sept 2017, when the project raised $32 million in an ICO, thus creating 1 billion LINK tokens. In May 2019, Chainlink launched on the Ethereum mainnet. At the moment, Chainlink is the 7th largest cryptocurrency by market cap, as well as the largest DeFi cryptocurrency by market cap, and is very close to the $4 billion dollar mark.

Use Cases

Chainlink is different from most projects in terms of having real use cases, as it is demonstrated by its list of partners, with most notable being Polkadot and Synthetix from the crypto sector and SWIFT and Google coming from the traditional business world.
As an example, Chainlink could be used to send a real-world money transfer from SWIFT and via Chainlink. The proof the payment could then be sent back via Chainlink to SWIFT. This use of Chainlink by SWIFT has created a seamless interaction between the traditional world and the crypto world, all while minimizing the potential points of failure.

So how does it all work?

Chainlink can be defined as a decentralized oracle network that consists of purchasers and data providers. Purchasers request data, while providers return it in a secure way.
Purchasers select the data they want to obtain, while providers bid to provide that data. Providers have to commit a stake of LINK tokens when making a bid, which serves as proof that they are honest. Once providers are selected, their job is to bring the correct answers on the chain.

Chainlink uses something called “oracle reputation system” to aggregate as well as weigh the data provided. If everything goes well, providers get paid, and everyone is happy, but if the providers misbehave, they lose their stake.

How do you get Link tokens?

The Chainlink network uses an Ethereum-based ERC-677 token that inherits the ERC-20 token standard’s functionality while allowing token transfers to contain a data payload. This token protocol is also used for payment of data providers who are bringing and translating data into the blockchain.
Besides earning LINK tokens by being a provider, you can also buy LINK tokens on various exchanges, such as Coinbase, Binance, and Huobi.

The Future of Chainlink

Two of the key objectives Chainlink focused on to ensure the security of its network are the distribution of data sources and the distribution of oracles. Like all networks, Chainlink’s main goal is to add more people and operators to become more robust and valuable.

Categories
Forex Videos

Halloween Forex Week – Don’t Trade Until You’ve Seen This!

Halloween for forex traders – the scariest event on the calendar for a long time!

Trading in the financial markets is inherently risky. And professional traders will try and mitigate risk by using an economic calendar to either deliberately trade risky events such as interest rate decisions by central governments or gross domestic product announcements, etc. or to avoid them at all costs.
But now and then, risk events come along that truly worry professional traders and investors. The financial week commencing the 2nd of November 2020 has the potential to cause a tsunami of price action movements in financial assets, including currencies, stocks, and bonds, metals, cryptocurrencies, oil, and commodities. Essentially, everything that can be traded will undoubtedly see volatility during this week.

So why should traders be worried about this week?

The financial markets are in a state of flux with large investors and institutions looking to mitigates risky forthcoming events. This means juggling their portfolios in order to diversify against the risk of a huge stock market falls, especially in the United States should Joe Biden become the next president. This is due to fears that he will have a negative impact on the markets with regard to democrats’ policies, including higher taxation and increased regulations for businesses across the USA.

We have already seen increased volatility in the financial markets, especially with currencies where the US dollar has broadly strengthened against other currencies, especially the major currency pairs. While some of this may be attributed to the month-end readjustment by financial institutions and upcoming planning for year-end rebalancing, the bulk of this activity is due to the forthcoming and tightly contested key economic calendar event for this year, which is the US presidential elections on the 3rd of November.

This just happened to coincide with the Japanese monetary policy meeting minutes being released on Tuesday, as well as the Reserve Bank of Australia releasing its interest rate decision. While the election winner will not be announced on the same day, markets will be braced for when the announcement eventually does come. The completely different styles of presidency being offered by both parties are said to have positive and negative impacts for stock markets, with President Trump’s policies of low taxation and low corporate red tape seen as positive for the economy and where Biden’s policies are the opposite and thus create a negative sentiment for the economy.
This event, which is dynamic and has the potential to cause huge market swings on its own, but it happens to coincide with an increase in the Coved transmissions globally, and where a second wave of the pandemic is sweeping across Europe and the United States, where last week 70,000 cases of the infection were reported in a single day.

It also coincides with the United Kingdom, Germany, and France initiating lockdowns for their peoples to try and contain the virus. As if that wasn’t enough to contend with, financial traders have to keep an eye on the Brexit future trade deal negotiations, which are a critical junction, with just a few days remaining to allow the United Kingdom and European Union to agree on a tariff-free future trade deal. If they are unable to do so, the United Kingdom will exit the transition period at the end of December without a formal trade deal with its European friends, and this, coupled with the economic situation unfolding due to the coronavirus, will be seen as a boot on the throat of the ailing British economy, which is struggling because of the ongoing Covid crisis.

And if you have been looking at your economic calendar for the forthcoming week, the sea of red, in terms of high impact events, continues on Thursday with the Bank of England interest rates decision and the United States federal Bank interest rate decision also compounding nervousness for the jittery markets.
And as if it needed a cherry on the top, on Friday, the US non-farm payrolls for October numbers are released. Historically a huge market-moving event could cause spikes as volumes lessen due to risk and where this would impact liquidity, causing wide spreads.
The best thing is to trade with tight stops, expect the unexpected, and even better still, sit back if you don’t need to trade and watch this incredible week unfold.

Categories
Forex Market Analysis Forex Videos

Forex – New Zealand Dollar Set To Remain Powerful! How to Trade The Coming Weeks…


Is the New Zealand dollar bucking the trend?

Thank you for joining this forex academy educational video. In this session, we will be taking a look at some technical analysis for the New Zealand dollar.

As many countries in the western world are still in the grip of the Coronavirus pandemic, and with many western countries now seeing a second wave, New Zealand has managed to maintain a low infection rate.
The New Zealand dollar, also known as the kiwi, is a major currency and one of the top currencies traded against the United States dollar.

Other major currencies have seen huge swings against the United States dollar and other currencies. The kiwi has remained one of the best performers.

In this yearly chart, if we go back to the beginning of the year, we can see that the pair topped out around 0.6700 before being sold off heavily in the middle of march, and this was largely attributed to the United States dollar being bought as a safe-haven currency and before the pandemic really began to take hold in the US.

Since then, the New Zealand dollar has climbed up to record highs for the year to a peak in September at 0.6765, and although it is off of that high, a clearly defined line of support can be seen on the chart, and where this support line is moving higher, potentially offering a squeeze back to the resistance line and possibly beyond.
At the time of writing, the exchange rate was 0.6610, and with a high of 0.6765, it represents a fall from the high of only 155 pips.

If we now take a look at the EURUSD pair, we can see that while the NZDUSD pair was peaking at its high, the EURUSD pair was also peaking at a defined area of resistance at 1.1940. It subsequently pulled back to its current low of 1.1647, which may become an official support line if it moves higher, and where this move is -293 pips or almost twice the fall in pip value of the NZDUSD pair. This is another indication that traders believe the kiwi is worth buying.
This was further helped this week by the reserve bank of New Zealand, which stated that it would begin to cut back on its government bond purchases and that the economic activity was rising while the coronavirus was under control.
Safe-haven currencies saw some buying with continual downward pressure on the USDJPY pair last week, which tried to hit the key 104.00 level, and the US dollar also becoming a safe-haven currency, moving to fresh highs of above 94.00 on the DXY index, and yet again this did not cause a huge sell-off in the New Zealand dollar, as it held to the support line.

The week ahead is a monumental one with potentially a change in leadership for the US presidential office, and it is extremely difficult to predict where things might go from here. However, once the dust has settled, the economic indicators favor the New Zealand dollar, and we believe this will become a bid currency.

Categories
Forex Market Analysis Forex Videos

Forex & The US Presidential Election – How To Trade Biden VS Trump!

The US Presidential Election – what to expect from the Forex space?

Thank you for joining this Forex academy educational video. In this session, we will be looking at the upcoming US Presidential Election and what could happen in the Forex space in the run up to it and after the winner is announced.

It is a time of uncertainty in the global financial markets, with many Western countries seeing a second wave of the coronavirus, with massive unemployment and peaks and troughs in global gross domestic product, where no sooner can an economy begin to get back on its feet than a second lockdown offers the prospect of greater unemployment, more economic uncertainty and whereby governments are required to bail out their citizens and businesses with vast amounts of quantitative easing, which will see huge debt burdens emerge for generations to come.
Add to this the most contentious US presidential election ever, and it can only mean one thing: uncertainty. And traders and investors, including institutions, do not like uncertainty. It means that they have to diversify their portfolios in order to mitigate against risk.

The basic premise is that should Donald Trump managed to secure a second term in office, he has pledged to continue with the corporate reforms, and he has promised and to continue easing taxes. Whereas Joe Biden has promised to raise corporate taxes, and where he will undoubtedly increase liability on corporations with regard to further reforms and red tape, which has the effect of strangling the performance of the business. Not what you need in times like these.

Before the pandemic took hold in the United States, President Donald Trump was riding high with record-breaking high levels of employment, and record-breaking values in stock markets, largely because of his tax and corporate red tape roll backs and reforms. The investors loved him. He was undoubtedly one of the most successful presidents of all times in terms of the economic performance of the USA.

Fast forward a few months, and he could potentially go down as one of the worst presidents, and this has largely been down to what has been termed by many journalists, economists, and analysts, as well as great swathes of the population in the United States, has having lost grip of the pandemic to the point that he wilfully ignored the damage that it could do in terms of health to its citizens and to the health of the economy.

The polls suggest that he will pay the price and lose the election to Joe Biden.

And because we may see higher taxation and a rollback of reformed policies should Joe Biden become the next president of the United States, this is why we are seeing a pull-back in the US equities markets, and here we can see that the Dow Jones industrial average of the 30 leading companies had made incredible rebounds from the lows of middle of March when the pandemic really hit America hard, add where we almost saw a 100% rebound of the record-breaking high from February of over 29,000 for the index, on the basis that the market believed that the US federal reserve bank was handling the coronavirus well in terms of its interest rate policy and the amount of stimulus being offered by the government and hopes that a vaccine would quickly help the US to recover to pre-crisis levels and beyond.

In this yearly US dollar index chart, which measures the value of the US dollar against the most other widely traded currencies, the so-called majors, including the yen, euro, pound, Swiss franc, and Australian and New Zealand dollars, we can see that it found support at 92.00 in September, after heavily losing out against the majors, and more recently found support at 93.00 before pushing above 94.00. This is what we might expect as the US dollar has often been bought as a safe haven asset in uncertain times, and while the markets try to determine the amount of risk of the unknown, which is what would happen if Joe Biden and the Democrats took power. The dollar is also being bought and stocks sold because the democrats and republicans have not yet been able to reach an agreement on a much-needed extension to the financial stimulus aid package to help keep American firms and the public afloat.
Therefore, no stimulus deal could possibly now be agreed until after the elections, which will lead to more uncertainly, therefore more of the same for stocks and the dollar.
But if Donald Trump is elected for a second term, stocks should rally, and this might have the effect of a stronger US dollar and softer counter currencies, including the majors, perhaps with the exception of the British pound, but only in the event that the UK and EU manage to secure a free trade deal, and also perhaps with the exception to the New Zealand dollar, which is currently being very resilient to the recent upswing in the US dollar.
But if Joe Biden takes power, we would highly likely see extreme market volatility in all financial assets and where the fear of the unknown would offer no real directional bias for the markets in the short term. We also should look at the possibility that even if Biden swept to power, the markets might believe that he could handle the pandemic better than Trump, be less provocative to foreign powers – which could help investment in the USA – and this might also bring back investors into the equities space as a direct result. With the democrats then holding all the aces in Congress, a stimulus deal would be more likely to get through more quickly, and more stimulus should, theoretically, mean a softer US dollar, in which case traders will be looking for opportunities to short it against the majors in particular.
One thing is for certain; the markets are in for a bumpy ride. Traders, be warned.

Categories
Forex Videos

Forex Position Sizing 11 Part 2


Forex Position Sizing 11 Part 2

In Part I, we have discussed how position size should depend on the trading system’s quality and how that quality can be assessed. Then, we presented a practical method to simulate nine different systems with SQN from 1 to 5, to be used in our position size simulator. In part II, we will explain how to simulate 10,000 years of trades and the maximum position size required for a desired max drawdown level.

Risk of Ruin

The term “ruin” is usually associated with the burn-out of a trading account. In this case, we will associate it with the odds of reaching a determined level of drawdown. The level at which a trader no longer would trust the system or considers himself unfit to trade.
Since this drawdown figure is particular to every trader, we will consider drawdown points starting from 5% and up to 50% in 5% steps.

The study

We have designed a computer simulation using Monte Carlo resampling of the original 10,000 trades computed for every system created. The simulation will create 10,000 resamples of 500 trades, each simulating one year of activity, thus creating 10,000 years of market activity.
We initially created a range of position sizes, starting from 0.2% up to 10% in 0.2 steps. As we saw that the max position sizing was below 5%, we have created a second round using position sizes from 0.2% to 5% in 0.1% steps and defined as ruin if in more than 1% of the 10K simulations the max drawdown reached the predefined level (from 5% to 50%). The table shows the max position size allowed for a defined max drawdown (ruin).

We have made a second simulation using 10% instead of 1% as the trigger level. Thus, the later table summarizes 10% odds (1 in 10 years of activity) that the max drawdown of a system touches the predefined levels.


Discussion

Considering both tables, a novice trader should be cautious and go to the safe side while learning the job. Thus, If I were new to trading, I’d assume the system’s quality to be low for two reasons. One, My system is the combination of technical signals and my interpretation of them and random factors. Also, the theoretical results of a back-tested system are always higher than the real-time results. Two, being new in this field, I still do not know my psychological reactions to losing streaks and drawdowns.

Thus, my first choice would be SQN 1 and 10% drawdown using the second table, which gives me one year in ten of 10% drawdown and one in 100 years of a 15% drawdown, but usually much less than 10%. That will mean my preferred position size will be 0.5% risk on the current account balance. After achieving 100 live trades and experience with drawdowns, we should recalculate our strategy’s parameters and consider a new position size.

A trader with 2-3 years of forex experience would prefect his strategies and reactions to the market action. Thus, an SQN 3 system is within reach. He would also accept up to 25%-30% drawdown risk. For a trader like this, a 2.5% risk would be quite reasonable.

Successful traders with over ten years of forex experience, combining fundamental and technical analysis with his trained intuition, will likely reach an SQN 4 level and taking the slight risk of 40% drawdown. To successful traders, a position size of 4-4.5% is acceptable if they feel the right pair begins moving as they planned.

As we can see, your personal experience, risk tastes, and system performance are the variables you should consider when deciding which position size best fit your needs.
Finally, this study considers that the trades are made one by one; therefore, the position size should be split into the number of open trades usually taken by the system.

Categories
Forex Videos

Forex Position Sizing 11 Part 1 – System Quality and Max Position Size!

Position Sizing XI- System Quality and Max Position Size

In this video presentation, which will be made in two parts, we will analyze the role the quality of a system has over how much risk we can have on trades, and compute the position sizes needed to avoid surpassing a desired max drawdown level.
It seems quite understandable that the system’s quality is directly correlated to the amount of potential profits it can deliver. What is less evident to many traders is it is also related to the drawdowns, and thus, to the risk amount it can withstand before drawdown goes below the trigger point beyond which a trader feels it is too much.

Measuring the quality of a system

To evaluate the quality of a system, we need to acquire a certain amount of past trades, so as to have enough data points to apply simple statistical tests. It is recommended to have a minimum of 100 trades, although as more trades are collected, the statistical results would be much accurate.

There are several ways to compute the quality of any system. The more common takes the ratio of the mathematical expectation (ME) over its standard deviation (SD) multiplied by the squar e root of n, the number of trades. This method’s results, though, vary with the n. For the purpose of evaluating the performance of trading systems, it is better just to take the ME/SD ratio and multiply it by ten. This is the method proposed by Van K. Tharp, which he calls System Quality Number (SQN)

SQN = 10 x ME/SD

SQN makes the system quality evaluation Independent of the number of trades. The only requirement is to ensure a collection of at least 100 trades.

Normalising the data

Of course, for this method to have sense, the data collected has to be normalized. That means, all trades must be normalized to one trading unit, that is, all trades must be taken at the same position one lot ( or one mini, micro-lot). To further normalize it we should take the reward/risk ratio instead of the raw profits.

Let’s say we have a list of trades, made using the same position size. Thus the collection can be normalized with the following Python code:

loss = [ x for x in trades if x < 0]    # the collection of all losing trades
avloss = -np.mean(loss)    # taking the average of loses ( sign changed)
norm_trades = [trade/avloss for trade in trades]

Now, we have all trades normalized for the application of the average and standard deviation. Furthermore, the average obtained will reflect the expected one-dollar-risk average profit on every trade.

Position Size and Downside Potential

in our previous videos on position sizing, we have already shown that all things being equal, the position size is what determines the max drawdown of a determined sequence of trades. Being capital preservation the primary goal of every trader, knowing how much downsizing will deliver a specified system is critical to optimize the returns, but taking care drawdowns do not pass the psychological point beyond which the trader considers the system has failed.

Simulating a trading system

To generate a synthetic trading system of the desired quality, it is relatively simple in Python. All trading systems can be modeled by two parameters: The winners’ percent and the payoff, or average reward/risk ratio. To make it more standardized, we have set the percent winners in all the generated systems to 50%, modifying only the payoff.

We created nine systems with SQN figures from 1 to 5 in 0.5 steps. The first system is of low quality, but perfectly tradeable. In fact, we consider SQN 1 to be an average trading system. SQN 2 is already a very nice system. All systems beyond SQN 2 are great systems, and if by chance you own an SQN 5 type system, please keep it safe because it is a real gold mine.
The basic Python code to make 10,000 trades with 50% winners is:

t = np.random.binomial(1, 0.5, 10000) # Creating a random sequence of heads and tails

This is half the job. We need to add a payoff to complete it. In the case of SQN 1 this is the code:

payoff = 1.27
trades = [payoff * x if x > 0 else -1 for x in t ] # creating the W-L sequence


Please note that, even when we aimed at 50% profitable trades, the inherent randomness of the process resulted in only 49.09% of them profitable. Also, we used the same sequence for the payoff application and get the different SQN figures; this makes this analysis more robust, as only one parameter was changed.


Categories
Crypto Videos

New Wave Of Crypto Banks Will Destroy Fiat Banks in 3 years!

“Crypto Banks Will Eat Fiat Banks in 3 years — or even less” – Opinions of a CEO


Mark Binns, the CEO of BIGG Digital Assets Inc., believes that the future of crypto will be a bit different than what most people think. He believes that the crypto sector will become a safe, compliant, and regulated environment. He voiced his opinions in an article published by Cointelegraph, where he spoke of the future of crypto he imagines.
Binns said that a future where customers are going to be able to walk into any bank and gain access to credit products, investments, and savings accounts that can host both crypto-assets and fiat assets.

Kraken, a San Francisco-based cryptocurrency exchange giant, has become the first-ever cryptocurrency business in the US to become a bank. At the moment, being an officially chartered bank would mean that Kraken will be able to offer even more banking and funding options to existing customers than it is offering now. It also means Kraken Financial will be able to operate in multiple jurisdictions without any fear of having to deal with state-by-state compliance.

Kraken is currently working with Silvergate Bank in hopes of offering its US customers SWIFT and FedWire funding options. More and more partnerships such as this one will become the status quo in the future. Binns is calling out traditional banks, saying that now is the time for the ones lagging behind to start paying attention to the market development.


Silvergate Bank is one step ahead of the rest at the moment, as it is currently having almost 900 digital asset companies as clients. Those clients have made deposits of over $1.5 billion with the bank. While this is still a small amount of money in relative terms, clients dipping their toes in the crypto sector will almost certainly choose this bank. Consumers will most likely define a “full service” bank as one that offers financial services in fiat as well as crypto.

Blockchain forensics tools


Just like crime scene investigators can use a black light or fingerprint powder to detect all kinds of evidence, blockchain forensics investigators can do similarly to Bitcoin and other blockchains. People claiming that Bitcoin is completely private has been dispelled again and again. In fact, blockchain-based cryptocurrencies are much more open to investigative methods than regular fiat currencies. Binns said that, as it is certainly possible to uncover blockchain transactions’ origins, blockchain will become a part of the traditional banking system rather than “putting banks out of business.”

Blockchain forensics tools already exist. They allow investigators to follow digital paper trails across multiple addresses, wallets, transactions, blockchains, and other digital entities, all by using clustering and heuristics techniques. Companies in the blockchain forensics space are developing proprietary searching algorithms designed specifically to detect concealed funds’ origins. On the other hand, traditional fiat is still the currency of choice for most money laundering professionals, simply because it is very hard to track.

DeFi is not for everyone


The decentralized finance sector has been the hot topic of the crypto sector for a while now, as it holds virtually endless promise. While yield farming may be all the rage, the DeFi sector is so much more than just that.
Some examples of DeFi usage are:
 Allowing you to take technical and fundamental trading advice from experienced traders and only pay a fee if the call is correct.
 You can put your capital into various digital investment portfolios without having to pay fees to mutual funds.
 Investors can hold derivatives of their desired cryptocurrencies without having to switch between blockchains.
These innovations are just some of the opportunities that DeFi provides. As the market continues to mature, more DeFi projects will allow us to do things that we aren’t even thinking about right now.

However, there is one fundamental problem with all the benefits decentralized finance provides: the average banking customer isn’t going to engage with DeFi protocols for decades. While the most avid crypto enthusiast knows how to dig up the contract address of an ERC-20 token, then trade it on decentralized exchanges, and then invest that token through lending platforms or liquidity pools, the average person will still likely want to talk to a banker from time to time. On top of that, governments around the world are already working on their own government-backed digital currencies, which the average consumer will go for instead of DeFi, at least at first, and simply due to the trust people have in the government.

What if banks don’t comply?

Binns said that any bank that is still approaching cryptocurrency with fear over the next 18 months is at great risk of finding itself dead in the water, while Kraken and other banks that enter the market will create a huge advantage for themselves.

Categories
Forex Videos

UK FTSE looking to retest May’s low?

UK FTSE looking to retest May low?


Thank you for joining this forex academy educational video. In this session, we will be looking at the FTSE 100 index.

In this yearly chart, we can see the red highlighted low of 5,750, which was the low point from March having crashed down from January’s peak of just under 7,600 as a result of the Covid related pandemic causing the UK to go into lockdown. And while the higher peak shows a sharp rebound to 6,500 at the beginning of June, the value of the top 100 UK firms has been falling steadily since then to the current 6,000 at the time of writing.

Buy sharp comparison this is the Dow Jones industrial index yearly chart, showing a record high for the index in February of 29500 falling to a low of just above 18000 before a V-shaped recovery took it back to over 29,000, where practically 100% of the original crash was reversed. The NASDAQ fared even better, as did the S&P 500, both of which moved to all-time highs.
While it is impossible to suggest that the two economies are identical, the USA has enjoyed a bull run while the FTSE 100 has faded. And while the US economy is very slowly showing signs of a recovery, the numbers by no means suggest the economy of the USA is in a better shape than before the pandemic. So, what is the driving factor for one and effectively put the breaks on the other?

This can largely be put down to sentiment: the American economy is perceived to have the ability to achieve the same growth as before the pandemic, once the virus is defeated. Therefore, traders and investors have taken a long-term view that the US economy will recover and go on to see growth, and they are taking the risk that the stock market will reflect this at some point in the future. In other words, they see the economy catching up with the stock market rather than the traditional view that the stock market reflects the value of the economy.

However, investors in the British economy are slightly more subdued because of the worries that the British government and the European Union are at loggerheads heads with regards to any future trading relationship now that the UK has left the EU. This is because the European Union wants more regulatory alignment with Britain regarding its future trading arrangements and whereby financial services regulations need to be reflective of both economies and where, for example, safety standards and hygiene standards, remain level pegged, because the European Union has a duty to ensure that the citizens of the EU do not receive substandard services, or substandard food and food substances, or substandard electronics and motor cars and equipment, etc.

The EU has also placed pressure on the British government regarding fishing rights for the EU in British waters and where there seems to be no possibility of an agreement on this subject. And also another major stumbling block is the fact that Ireland is a part of the EU you and Northern Ireland is a part of the United Kingdom, and there is no border in place, in which case unchecked goods and services could move between the two areas, leaving the door open for infringements, including tax revenue losses and the movement of people without passports and livestock movements without regulatory checks by the EU. The whole thing is extremely complicated. But the bottom line is if these issues cannot be agreed upon in the next few weeks, there is a distinct possibility that no official trade agreements will be set in place, where the United Kingdom was hoping to have a free trade deal with the EU and in which case the UK will need to revert to world trade organization trading rules, which will be more expensive for the United Kingdom economy in the long run.
So where now?

The FTSE 100 is currently in a critical area, which is of psychological importance: 6,000. Should price action fall just under and then push up and find that the 6,000 area becomes a line of resistance, we could see price action fall down to the previous low of early September of 5,800 and, then, perhaps a retest of May’s low at just above the 5,700 level.

The longer that the EU and UK remain at loggerheads and cannot agree on a future trading relationship, the more chance we will see that this index will push lower and if the UK ends the transition period without a formal agreement at the end of December this year, the pressure will be on the FTSE 100 to fall even lower because we are still in the grips of the pandemic, coupled with WTO trading rules and no formal trading agreements in place with the EU or the USA, which will leave investors wondering how badly this will affect the British economy in the next 12-months.

Categories
Forex Videos

Forex! USDJPY Forecast – Support & Resistance Areas Explained!

Where next for USDJPY – Support and Resistance areas explained

Thank you for joining this Forex academy educational video. In this session, we will be looking at a daily chart of the US dollar Japanese yen pair and looking at support and resistance lines.

It has been a tumultuous few months for the US dollar Japanese yen pair. With a high in February of 112.00 down to a low a few weeks later in March of 101.16. Many investors will have been completely caught offside, and wins and losses for those who got it right or wrong will have been substantial.
When analyzed on the daily chart adding simple support and resistance lines, we see clear patterns emerging of price action and where the exchange rate forms peaks and troughs.
The fall in the pair from position A to position B was down to the coronavirus’s impact and where the Japanese yen is favored in times of such crisis due to its safe-haven status. However, this huge move had to become oversold, and of course, it did just above the key 101.00 level, and where we saw a rally back to position C, which incidentally is a step lower than position A. Typically, we find that institutional traders will pull out of a huge upside momentum trade slightly before a previous high, or a previous low if the situation was reversed because they fear that in this situation sellers are lurking at the previous high level, and that is proved when the pair pulls lower.


We then see a period of consolidation between positions D E and F. And a subsequent lower step to G and where the pair only manages a following high at position H, again a defined step lower than the previous high of position F.
Now things become interesting because price action fades in a tight consolidation period and at position 1 does not reach the previous high of position H and collapses down to position I. Again, we have a shift lower to position J and where we again see price not able to pull back to that resistance line at position 2, and price again begins to fade down to position K which incidentally is a double bottom formation aligned with position I.
These fading areas of price action are unable to reach previous highs, as shown by positions 1 and 2 and very strong telltale signs that price action is about to move lower. Obviously, the opposite applies. But with the USDJPY pair, we are looking for reasons to go short due to the overall fading trend and the nature of the yen being bought in times of uncertainty.


And with the market being extremely volatile right now and US elections only a few weeks, we can reasonably expect a continuation in the strength of the Japanese yen and, therefore, more movement to the downside in this pair.
Add these simple trend lines of resistance and support to your own charts and look out for fading price action to these lines, such as described in positions 1 and 2.

Categories
Crypto Videos

OneCoin Scam Getting It’s Own Movie & TV Show!


Kate Winslet Starring in a Movie About OneCoin

HOLLYWOOD, CA/USA – JULY 9, 2016: Kate Winslet star on the Hollywood walk of fame.

Even though the well-known OneCoin Ponzi scheme is still being processed through the courts, a movie on how this project came to be is in development. Not only that, but its lead star is the lead from the movie Titanic.
As reported by Deadline, a famous Hollywood actress Kate Winslet has signed on to both star and produce Fake!, a movie based on the unpublished book written by Jen McAdam and Douglas Thompson. McAdam, as a writer of this book and a victim of the OneCoin scheme, will produce the film.

Fake! will be written as well as directed by Scott Z. Burns, the man who helmed The Report, a political drama that was based on the CIA’s report on torture after the 9/11 event. He is also known for writing the 2011 pandemic movie Contagion, also starred by Kate Winslet.

OneCoin was founded in 2014 during the expansion of the crypto industry. It was created by Ruja Ignatova in Bulgaria. The project followed the typical structure of a multilevel Ponzi marketing scheme but had a cryptocurrency twist. It was promised OneCoin is the next Bitcoin, even though it wasn’t backed by a blockchain or a decentralized network. Despite several warnings coming from the crypto industry insiders and government agencies, OneCoin became one of the most popular projects, fostering an ‘us vs. them’ mentality. Even after OneCoin failed, it left the market with several “clones” which did pretty much the same thing it did, but with a twist here or there.


McAdam, who started a support group for numerous OneCoin victims, said that both she and her friends and family invested and lost over 250,000 euros, equating to around $300,000, before she learned its server was not even a blockchain and that it was all a scam.
Ignatova was charged with multiple charges, including wire fraud, securities fraud, as well as money laundering, on May 7 of this year, but she has not been seen ever since 2017. Her brother Konstantin Ignatova, an ex-executive in OneCoin, was also charged with the same in March of this year. He has since agreed to testify against his sister on the matter. Defrauded investors have sued OneCoin, alleging losses of up to $5 billion.

The movie Fake! is not the first artwork inspired by the OneCoin Ponzi scheme. A TV show coming from the British Broadcasting Corporation (BBC) about Ignatova and OneCoin is also in development.

Categories
Forex Videos

Fundamental Analysis For Novices – Foreign Investment In Japanese Stocks


Fundamental analysis for novices: Foreign investment in Japanese stocks


Thank you for joining this forex academy educational video. In this session, we will be looking at foreign investment in Japanese stocks.

If you are serious about trading, you must be responsible for knowing what factors are likely to influence the movements of exchange rates in the forex market. One of the biggest movers is the release of fundamental economic data, which is collated, released, and usually subject to an embargo by governments or professional economic statistician specialist firms.
Luckily for us traders, most of this information can be found on economic calendars, which are readily available by most brokers.

Keeping up to date with economic calendar events is just as important as placing the trades. Because if you are unaware of a high impact data release that might fall shortly after you place your trade, it could potentially have a negative impact and incur losses. Therefore, get into the habit of looking at your economic calendar every day and look out for what high impact data may be released in the following few days ahead. Most institutional traders will take a long-term approach based on data that may be released at these future times.
The most critical components of an economic calendar are the day and date, the time of the release, the type of event, the likely impact, which usually is measured as low, medium, and high impact, with the latter potentially causing extreme market volatility. The actual data will be populated on the calendar shortly after the embargoed release. And this can be compared to the previous data. Whether that is on a weekly, monthly, quarterly, or annual basis, and where typically there will be a consensus as to the actual data, which will have been put together by economic forecasters.

Here we can see that on Thursday, September 3rd, at 12:50 a.m. BST Japan issued its economic data release for investment in Japan stocks to August 28th and where this was a low impact event. There was no consensus, but we can see the actual and previous statistics based on yen amounts. The data was released by the Japanese Ministry of Finance. The data refers to the difference between investments in the Japanese stock market by foreign entities, and the ‘actual’ data on the calendar refers to the net difference between the inflow and outflow of those investments.
Although this is a low impact event, the balance between inflow and outflow of funds gives an indication of the strength of the economy and, more importantly, shows that overseas firms such as pension funds, government funds, hedge funds, and investors see value in investing.
Traders should be looking for a higher capital inflow if they want to be buying yen and a lower capital inflow to support trading setups for selling the yen against counterpart currencies, especially the US dollar.

Categories
Crypto Videos

BitMEX Lost Over 45k Bitcoin – Is BitMEX Going Down?


BitMEX Lost Over 45k Bitcoin Since US Government Charges; Other Exchanges Are Taking Over

More than 45,000 Bitcoin has been withdrawn so far from the crypto trading platform BitMEX since the US government levied charges against the exchange as well as its leadership. October 1 brought two crushing blows to BitMEX. First, the Commodity Futures Trading Commission and the Department of Justice brought charges against the exchange and its practices. Shortly thereafter, its founders (including the CEO Arthur Hayes) were indicted by the US government. As expected, the market reacted to the breaking news with a sharp decline across many cryptocurrencies in the sector.

This isn’t even the first time in recent months that the trading platform giant has contributed to a downward turn in crypto sector prices. The exchange first began losing its users’ trust following a blackout on Black Thursday, which, for a short period, prevented users from trading or retrieving their own assets. While users slowly moved away from the platform and withdrew over 100,000 Bitcoin in the six months between that event and these most recent charges, the exodus that happened after October 1 appears to be unprecedented in scale.

The data coming from Crystal Blockchain shows that, in less than 48 hours, the net outflows from the BitMEX platform have exceeded 45,000 Bitcoin, by no means a small amount. However, traders are traders, and the Bitcoin withdrawn from BitMEX didn’t just vanish, but simply moved platforms. Gemini and Binance appear to be the most prominent beneficiaries of these outflows, closely trailed by OKEx and Huobi. More than 20,000 BTC has been transferred out of the BitMEX platform and into the latter four exchanges.

It is yet unclear whether BitMEX will just disappear into the abyss of time like many failed crypto exchanges before it, or if the company will manage to find a way to comply with the government body and survive to trade another day and. Lance Morginn, CEO of Blockchain Intelligence Group and an ex-supervisory special agent at the Department of Homeland Security, said that the most likely outcome would be that BitMEX will receive monetary penalties. On top of that, BitMEX will most likely have to make a promise on the part of its executives that it will not engage in unlawful activities in the future. However, he thinks that BitMEX is too big to fall at the moment and that it is less likely that the company will just vanish.

Categories
Crypto Videos

The Only Sustainable Way To Make Money Mining – 76% of Crypto Miners Use Renewable Energy!

76% of Crypto Miners use Renewable Energy


Green planet earth with solar energy batteries installed on it

The rising energy demand to operate proof-of-work cryptocurrency mining, especially for Bitcoin, has been a hotly debated topic in the most recent months. However, interesting and unexpected news came from the research of the 3rd Global Cryptoasset Benchmarking Study performed by the University of Cambridge. This study shows that 76% of crypto miners actually use electricity from renewable energy sources as a part of their energy consumption mix.

The study found that more than 39% of the total energy consumed by proof-of-work cryptocurrencies such as Bitcoin, Ethereum, Bitcoin Cash, and others comes from renewable energy sources.
This finding contrasts with a previous study regarding proof-of-work crypto mining done by the same university, which found that only 28% of the total energy consumed for crypto mining came from renewable resources. Taking a look at the data from 2018, 60% of the miners used renewable energy sources as a part of their energy mix.
According to the latest study, the most common energy source for miners is hydroelectric power, with almost 62% of miners reporting that they are using hydroelectricity. Hydroelectric power is followed by coal and natural gas sources that take the second and third spots at 38% and 36%, respectively.

Crypto miners also reported that they use wind, oil, and solar energy, which are common but to a lesser degree than the aforementioned three sources.

The report also worked on dividing miner energy consumption by region, noticing that miners from Asia-Pacific, Latin America, Europe, as well as North America use close to an equal percentage of hydroelectric power when compared to electricity from other sources, such as natural gas, coal, wind, and oil.
Using coal as an energy source is most common in the APAC region, where it contributes almost an equal amount of electricity to crypto miners as hydroelectric sources. Miners from Latin America, on the other hand, reported that they do not use coal-fired electricity to mine cryptos at all.

The study also notes that miners from the APAC region contribute almost 77% of the Bitcoin hash power, all while using the lowest amounts of renewable energy sources. On the other hand, while North America adds only 8%of the total Bitcoin hash power, 63% of the energy consumed in mining Bitcoin in that region came from renewable sources. Europe is a bit behind North America, with close to 30% of its crypto mining powered using renewable energy. Europe contributes nearly 10% of the worldwide Bitcoin hash power.

While using renewable energy as a main or only source of energy for mining is still far away, more and more miners are starting to use alternative sources in search of cleaner and better ways to make a profit.

Categories
Crypto Videos

Forex Fundamental Analysis for Novices – Trading The UK Claimant Count!


Fundamental Analysis for Novices: The UK Claimant Count


Thank you for joining this oryx academy educational video for novices. In this session, we will be looking at with claimant count and studying an example from Great Britain to try and establish what it might mean for trading the British pound.

If this is the first time you have viewed one of our fundamental analysis videos and you happen to be a new trader, we recommend that you use a financial calendar every day in order to plan your trading activities around the fundamental economic releases which governments statistics departments and other economic specialist firms release on behalf of governments. These are usually released on a weekly, monthly quarterly, and annual basis. The majority are subject to a time embargo.
This is typically what you might expect to see on an economic calendar, and these are available by most broking firms.

The most critical components of an economic calendar are the day and date, the time of the economic statistical release, the type of event, and the likely impact that this release could have on the market, which typically has 3 levels, low, medium, and high. High impact economic data releases can cause significant volatility in the market post-release, and it is essential that you are not caught offside because you didn’t know it was happening. This could cause significant losses for you and therefore adds weight to the fact that you must use an economic calendar every day. The other information that the economic calendar will provide you with is the previous data release, a general consensus, which will have been put together by leading economists. The actual figure will be quickly populated on to the calendar shortly after its release. This information can then be compared to the consensus and the previous data release in order to try and establish if the information is better, worse, or the same for the particular country’s economy.

Here we can see that on Tuesday, September 15th at 7 a.m. BST, the Great Britain claimant count rate for August is expected, along with the claimant count change for August. These are both predicted to have a medium impact on the market. We can also see the previous figures for July. However, there is no consensus. Please note that this information will also be simultaneously released with unemployment and average earnings, and where traders will take all of the released information into consideration before trading in accordance with the data. Because the unemployment rate is a high impact event, we must take this into consideration even though the claimant count is set as a medium.

So, what is the claimant count? This statistic is released by the National Statistics body, and it is a monthly measurement of unemployment within the United Kingdom. It is essentially a barometer for the health of the UK Labour market. Traders will be looking for higher rates of employment because this means that the economy is expanding. In this circumstance, it means the UK is bouncing back from the covered pandemic and indicates that the UK economy is expanding. Therefore, traders will be looking for a lower number in the claimant count than the previous month, which is seen as bullish or good for the Pound, while an increase in the number of claimants is seen as negative and both bad for the UK economy and the Pound, which might fall against its counterparts.

Categories
Crypto Videos

RUON AI Digital Currency – Crypto In Space!

RUON AI digital currency certainly isn’t lost in space


Thank you for joining this Forex Academy educational video. In this session, we will be looking at the RUON AI digital coin and how the concept is helping people in need all over the planet.

SovereignSky, RUON AI, and Sovereignaid bring together space-based technology and blockchain in an AI app, which provides banking, chat in a social mobile application that will allow RUON AI to help disadvantaged people from all over the world; the aim is to eradicate extreme world poverty.

The concept is to run the technology from space, which really does take decentralized finance to a new level. Two microsatellites were launched from Vandenberg Air Force base on December 3rd, 2018, by Space Quest, their satellite strategic partner.

One of the principles is Tim Burke. Tim is a movie producer and has a love of Si-fi, so he is bringing his love for this into the real world. Tim used to be a producer on MTV and personally interviewed more A list of celebrities than anyone else. He counts many of them as his friends.

So, what is it? 

RUON AI is pronounced Are You On, and is a social app which is available on Android and IOS and received $20M Round A closing investment and expects to launch in Q4 2020 and are planning an IPO in 3 years.

It allows users to post on certain social media platforms using patented technology and where the user is paid in RUON coins. Users can also get paid in this way by selling products on social media hubs such as TikTok and Instagram, plus Amazon and Alibaba. The money can then be spent via a RUON debit card. Users get the option to divert a portion of their income to charity, and where they claim that at least 97% of that will go directly to the people who need it.

RUON AI has partnered with RUONwallet,  Open Transactions, and Zapple to provide a crypto-friendly bank with sort code connected smart card allowing users to spend Fiat currency digital assets and cryptocurrencies wherever MasterCard is accepted.

The Social Media platform is designed to make money for users while offering full privacy, encryption, transparency, and control over users’ data. RUON AI gives its users the choice to earn revenue using data points and splits the revenue 60/40 in favor of the user.
In December 2018, Sovereignsky launched the first of eight satellites to provide Wi-Fi connectivity to the third world. In December 2019, it was one of the first companies to successfully process a blockchain transaction in space for its mission to eradicate extreme poverty.

Other Partners in the venture include Stan Larimer, founder of Bitshares, Larry Castro founder and CEO of Stealthgrid, who has an awful lot of experience in quantum cyber security Technologies, JC Oliver, and Michael Taggart.

We look forward to bringing you more details about this exciting new digital coin in the future.

Categories
Crypto Videos

WARNING! Crypto Exchanges Are NOT Safe!

WARNING: Crypto Exchanges Are NOT Safe!


More than half of all the crypto exchanges worldwide have weak or even no KYC identification protocols — with exchanges in Europe, the US, and the UK being some of the worst offenders, according to a new study done by blockchain analysis firm CipherTrace.
CipherTrace conducted an analysis on more than 800 decentralized, centralized, as well as automated market maker exchanges, and concluded that 56% of them did not follow KYC guidelines at all, despite the anti-money laundering regulations. The highest number of exchanges that don’t adhere to the regulations are in Europe — a region known for stricter regulations. Also, 60% of European Virtual Asset Service Providers do not have sufficient KYC practices.

The US, UK, and Russia are the three countries that host the highest numbers of exchanges with weak KYC procedures. Singapore is also at the top of the list, both when it comes to weak and porous VASPs.


CipherTrace study also found that many exchanges do not even bother to mention the country of its origin on its website or in its terms and conditions. This lack of transparency appears to be deliberate, as 85% of these exchanges had a frail KYC procedure framework. This implies that some exchanges are purposefully hiding their jurisdictions to avoid registering or complying with any form of AML regulation.
The report notes that 70% of crypto exchanges registered in Seychelles have poor-to-none KYC norms, making the small island country a potential base for money launderers.

The study also examined 21 decentralized exchanges and found that a whopping 81% had either weak or no KYC practices. However, looking at the bright side, DEXs aren’t necessarily good venues for money laundering due to how they operate. CipherTrace noted that although $7.9 million of crypto stolen in the KuCoin hack was sold on the decentralized exchange Uniswap, it wasn’t actually laundered there.


Elliptic co-founder Tom Robinson said that “The hacker isn’t using DEXs to hide their tracks, but rather so they can sell their stolen tokens.”
DeFi projects offer a variety of traditional financial activities such as lending, borrowing, and earning interest. This means they could fall under the same regulatory framework as banks and other regulated financial institutions.
“DEXs offer financial activities, and are, by doing so, likely subject to various laws already, including securities law, and potentially banking and lending laws, and most definitely AML laws,” said SEC Crypto Czar Valerie Szczepanik in early October.

Dave Jevans, CipherTrace’s CEO, said he didn’t believe that DeFi protocols would accept regulations easily, but that he doesn’t think that DeFi can escape regulations for long.

Categories
Forex Videos

Forex & The Recent Market Drivers – What You Need To Know Trading The Next Few Weeks!

Recent market drivers


Thank you for joining this forex academy educational video. In this session, we will be taking a snapshot of the recent market drivers, which might explain the moves in bitcoin, the Dow Jones, and a couple of major currency pairs.

Festival we have the dollar index charts also known as the DXY, and where the dollar is measured against a basket of 6 major currencies, including the yen, the pound, the Australian dollar, the New Zealand dollar, the Swiss franc, the euro, and the Canadian dollar, and where the dollar index reached and high of 103.00 at position A, during the middle of March when Europe was in the grip of the pandemic and where the United States was not yet at its peak. We then see a low at position B, of 92.00, and where there is the dollar strength subsequently began to return, and now we can have a look at the possible reasons why.

Firstly we should take a look at the Dow Jones industrial average index whereby around the middle of February this year, Dow Jones hit an all-time record at 29,500 points, before crashing all the way down to 18,400 as the pandemic started to grip the United States. Although circumstances remain bad with the United States economy, the Dow Jones has rallied all the way up to a recent high above 29,000, almost approaching the previous record high, but where the fundamental economics do not match the previous rise from February. This may well have been a tipping point for traders who were already expecting a reversal in price action, and potentially we and see profit-taking at these levels.

Now let’s take a look at the GBPUSD pair, AKA Cable. In December, when Britain voted to leave the European Union, the pair was on a high at 1,3350 at position A. Still, when the pandemic hit, Cable went down to just above 1.1400, again we have seen an incredible rally all the way back up to a high at position B of 1.3380. And then a pull lower to the current level of 1.2950 at the time of writing. The shift higher can only be attributed to dollar weakness because the United Kingdom is still suffering from the pandemic’s fallout and where no agreement has yet been reached regarding a future trading relationship with Europe. The pair will likely find further weakness the closer the UK gets to a no-deal arrangement with Europe.


If we now turn our attention to the EURUSD pair, we can see that at position A, at the height of the pandemic in Europe, the currency pair was trading at 1.0600, before moving to a recent high of 1.1936, before falling lower to its current level at 1.1760 at the time of writing.
The sharp reversal in the Cable’s high at 1.3380 and EURUSD pair at 1.1936 can be attributed to the DXY reversing from its fall and bouncing off from its low of 92.00
The reversal of the DXY from 92.00 to its current level of 93.50 at the time of writing can be attributed to the reversal in the Dow Jones from an almost double top formation of a previous record-breaking high. The economic fundamentals are not working as in a normal stable market.

Let’s take a look at the bitcoin to the US dollar, which is currently trading at 10,230 but found resistance at 12,000 recently, and whereby this is no coincidence that this price rejection coincided with the DXY bouncing off of the key 92.00 level.

While some analysts will argue that the markets that we have looked at today are not correlated, either positively or negatively, the numbers and charts speak for themselves.
When trading, always try and factor in as many assets as possible to try and established which might be affecting the other and how that might, in turn, might affect the asset that you are trading.


Categories
Crypto Videos

Crypto Going Mainstream In 2021 As Paypal Adopts Bitcoin – Go Get Your Lambo!

Crypto Going Mainstream in 2021 – MAJOR Adoption by PayPal and Venmo


PayPal has officially confirmed on Wednesday, October 22, that it is entering the cryptocurrency market. The payments provider giant, with over 346 million active accounts all around the world, has pledged to make cryptocurrency not only an optional feature but rather “a funding source for purchases at its 26 million merchants worldwide.” PayPal also plans to expand this service to its peer-to-peer payment app Venmo in the first half of 2021.

The public already knew that PayPal was planning on moving into crypto in June, but the information came from anonymous sources, and nothing was certain. A month later, the Paxos exchange had been selected to act as support in PayPal’s crypto endeavors.
In a blog post that came out on Wednesday, PayPal said that the current pandemic had made it clear that people need digital payments of all sorts.
Starting in early 2021, PayPal’s customers will be able to instantly convert one of the supported cryptocurrencies to fiat currency, with no added incremental fees, PayPal said. Merchants will have no additional fees or integrations as all transactions will not be settled in crypto but rather in fiat currency at their current PayPal rates.

“Cryptocurrency simply becomes another funding source in the PayPal digital wallet, adding more utility to cryptocurrency holders, while addressing concerns surrounding volatility, cost as well as the speed of cryptocurrency-based transactions,” PayPal announced.
PayPal will initially have a $10,000 weekly buying cap as well as a $50,000 limit per 12-month period. All trades must be executed in US dollars, PayPal stated.

Everything sounds good… But!

As bullish the Bitcoin market has proven to be about this news at the moment, an initial review of the crypto services PayPal offers has a couple of cons. First off, the company will take a go-slow mindset, which is the complete opposite of how the markets reacted to the most recent adoption news. Critical caps limit who the buyers are, how much they can actually buy, and what they can do with their PayPal- sourced crypto. While this is not necessarily bad, crypto enthusiasts should take everything slow and with a grain of salt rather than instantly calling for the moon and ordering their Lambos.

However, there is completely bad news, rather than just a slight setback. PayPal is refusing to hand its customers’ crypto keys over, meaning that you own the cryptocurrency you buy on PayPal. Still, just like on centralized exchanges, you will not be provided with a private key,” PayPal casts this restriction as a loss-prevention tactic.
Another bad thing is that the users will not be allowed to send their crypto around or even withdraw it. PayPal stated that “you can only hold the crypto that you buy on PayPal in your account. The cryptocurrency in your account cannot be sent to other accounts on PayPal or off it.” This brought a lot of questions on whether PayPal’s crypto feature will have “paper Bitcoin” or if it will be covered by real cryptocurrency.


However, PayPal’s partnership with Paxos should be good enough proof that the crypto held on the payment provider will be the real deal. The New York State Department of Financial Services announced that it had granted the “conditional BitLicense” to PayPal, the first of its kind. The BitLicense was granted for a partnership with the Paxos Trust Company, enabling PayPal customers to buy and sell cryptocurrencies. Four DFS-approved digital assets that will be initially available are Bitcoin, Bitcoin Cash, Ether, as well as Litecoin, according to the DFS statement.
The service rollout also faces quite a few real-world restrictions. Out of the 50 US states, only 49 have coverage at launch, as Hawaii is excluded from the list.


Conclusion

Bitcoin and other cryptocurrencies rallied following this announcement, which is just one of several major recent mainstream corporate adoption signs in 2020. The PayPal event happened following Microstrategy’s $425 million Bitcoin investment, as well as a similar but more modest move by Square.

Categories
Forex Videos

Forex Fundamental Analysis For Novices – How To Trade Mortgage approvals!


Fundamental analysis for novices: Mortgage approvals


Thank you for joining this Forex academy educational video for novices. In this series, we will be looking at economic data releases by governments around the world, but specifically focusing on Western democracies and whereby this data acts as a barometer of the health of a country’s economy. In this session, we will be looking at mortgage approvals and focusing specifically on the United Kingdom.

If you are new to trading, one of the main reasons that new traders fail is because they are unaware of economic data releases, where governments release information in the form of statistics, which market analysts and traders use to value the health of a country’s economy. Such data causes various levels of impact on the financial markets, which is typically low, medium, or high, and where high impact data can cause a currency pair’s exchange rate to stop in its tracks and reverse, which is often detrimental to a trend and therefore may cause losses. By using an economic calendar, which is offered by most brokers, you will learn to use the data releases to your advantage and know when to trade and when to avoid the markets, especially at such time as high impact data is being released.

The critical components of an economic calendar are the time of the release, the type of event, the day and date, the likely impact that such data will have on the market, which is measured in 3 values, low medium, and high. The actual data will be populated on to the calendar very shortly after the data release and is typically subject to an embargo. The consensus, which is a value of the expected data release, is usually fairly accurate as put together by economists and analysts. And the previous data release which should also be used in conjunction with the consensus as a gauge. The larger the deviation between the actual release and that of the consensus will likely cause more volatility in the market, depending on the expected impact level.

Here we can see that’s on Tuesday the 1st of September 2020 at 9:30 AM BST, Great Britain will release data statistics for mortgage approvals for July, where the impact level is low, and where the consensus is 33.9 k and where the information that was released for June came in at 40.01 k. The data will be simultaneously released with market manufacturing PMI, net lending to individuals and consumer credit, plus M4 money supply.
Therefore, this information will be looked at holistically by traders, and because the manufacturing PMI is a medium impact, potentially there is room for greater volatility than just the information pertaining to mortgage approvals.

Mortgage approval statistics are released by the Bank of England each month and show the number of mortgages approved for July. This acts as a leading indicator for the housing market within the United Kingdom. Higher mortgage approvals mean that the economy is healthier and recovering from the pandemic. The higher the reading, the more positive for the pound, while a low reading is negative and shows that people are not confident with the economy and are therefore not buying homes. As such, this is bad for the pound and could see weakening against other currencies. As mentioned, always look at the whole basket of data releases rather than one single component.

Categories
Crypto Videos

Uniswap Monthly Volume Surpasses Coinbase!

Uniswap Monthly Volume Surpasses Coinbase; The DeFi Craze Continues


Data coming from Dune Analytics shows that Uniswap DEX has processed over $15.3 billion in volume in September only. In the same period, reports show that the centralized exchange giant Coinbase processed only $13.6 billion.

The significant spike in volume Uniswap had can be attributed to two major factors:
First, the explosive growth of the decentralized finance sector and yield farming of various governance tokens caused decentralized exchanges to thrive. Second, the launch of Uniswap’s own governance token has led to a frenzy on the platform.

The month of June marked the start of a DeFi governance token frenzy, with Compound’s COMP token being at the forefront of it. The process is relatively simple: DeFi users stake various cryptocurrencies and “farm” new governance tokens by doing that. The DeFi protocols that release the underlying governance tokens in a decentralized manner distribute them to the users who are staking funds. Once users successfully obtain the new tokens, they typically hold them until they are listed on a centralized exchange, where it could be easily sold.

Top cryptocurrency exchanges have to take various factors into consideration before listing tokens. The criteria for listing coins can include liquidity, developer activity, and track record. For new governance tokens and DeFi-related cryptocurrencies, it has proven to be a nearly impossible feat to meet those requirements.
Uniswap has, mostly for the aforementioned reasons, eventually evolved into the go-to platform when it comes to trading DeFi tokens, and the surge in total value locked in DeFi translated into intensified growth of Uniswap’s volume as well.

DEX Volume VS. Yield Farming

Uniswap’s volume has first surpassed Coinbase Pro in daily volume on August 30. Ever since then, it has continuously remained very competitive with the top US exchange. Uniswap creator Hayden Adams said in late August:
Wow, Uniswap’s daily trading volume is higher than Coinbase for the first time ever. Uniswap: $426M, Coinbase: $348M. It’s hard to express how crazy this is.” The consistently high performance coming from Uniswap occurred despite a very considerable slowdown in the yield farming craze. This suggests that, while the yield farming craze has been tamed, the uptrend of decentralized exchanges is sustainable over the long term.

The last couple of weeks brought a slight price drop of DeFi tokens, which also caused a drop in user activity in the yield farming space. The researchers at Dune Analytics are, however, not interpreting this as a bearish signal. Instead, they said:

“Despite the yield farming craze calming down, decentralized exchange volumes crushed old records in September, with $24 billion traded, up 100% from August. While the last few weeks were down when compared to the beginning of the month, all weeks in September were well-above the peak week from August.”

Ethereum analysts Anthony Sassano said that it also reflects the overwhelmingly positive sentiment that investors have for Ethereum. He said: “They told you that the decentralized exchanges on Ethereum were a fad – but they were so incredibly wrong. DEXs did $23.5 billion in volume in September alone! Betting against Ethereum has, is, and always will be a bad move.”

Categories
Crypto Videos

Crypto – Dash Is NOT A Privacy Coin!

Dash is NOT a privacy coin.

Dash was once viewed as one of the crypto sector’s top privacy-focused projects. However, it no longer operates under that classification, according to the Dash Core Group, the group overseeing Dash and its development.
When asked if Dash should be considered a privacy asset, Fernando Gutierrez, Dash Core Group’s CMO, said:
“No, Dash is a payment operator cryptocurrency, with a strong focus on usability, which includes speed, ease of use, cost, and user protection through optional privacy.”

Dash started off as a fork of Bitcoin all the way back in 2014. It was originally called XCoin, only to change its name to Darkcoin, and ultimately Dash. The asset positioned itself on the market as a privacy-focused asset and competed with the likes of Monero and Zcash. Its whitepaper even said that “Dash is the first privacy-centric cryptographic currency that is based on the work of Satoshi Nakamoto [the pseudonymous creator of Bitcoin].”
In addition to Dash, there were two of the market’s other main anonymity-based assets, Monero and Zcash, which came to life in 2014 and 2016, respectively.

As can be concluded from Gutierrez’s comment, Dash is no longer fully and mainly focused on privacy, but it rather only specifies that it has privacy as an optional feature. The asset’s optional privacy feature is called PrivateSend, giving its users the option of greater anonymity than they would have when transacting without it. The technology that Dash utilizes in its PrivateSend function is called CoinJoin, a technology that “complicates” transactions to the point of being extremely difficult for analytics firms to analyze the transactions.

The CoinJoin approach was introduced in 2013, essentially letting Bitcoin users mix their transactions into a group of transactions, therefore making any form of tracking difficult. Dash took this exact same approach and made it more convenient by making it a built-in option for Dash senders.


In recent days, privacy coins have faced significant scrutiny from governing bodies all around the world, as seen by the IRS’ bounty rewards of $625,000 for successfully cracking Monero. In order to mitigate the possible pressure from the government bodies, Dash Core Group pivoted from the privacy coin sector to the transaction sector, now stating that the privacy regulation doesn’t apply or threaten Dash in any way. Gutierrez added that Dash’s blockchain is public and that there is nothing to break or crack because Dash’s approach to privacy is fully probabilistic, not based on encryption like on projects like Monero.

Categories
Crypto Videos

Forex & The Brexit Conundrum!

The Brexit Conundrum


Thank you for joining this forex academy educational video.

In this session, we will be looking at the Brexit situation and how it is unfolding, and the disparity between the British pound and the FTSE 100 index.
Here is the FTSE 100 index and where we can see 3 peaks that are falling, from a high of 6,500 to the current level, at the time of writing, at 5,960: a gradual trend lower since June 2020

Here is a chart of the British pound against the United States dollar and where we can see during the same time period the pound has been extremely bullish against the dollar from 1.2200 to up to a peak of 1.3400 to its current trading range at 1,3284 at the time of writing.
This tells us a story that the pound is bullish, and this is largely due to US dollar weakness and where traders have been riding the wave upwards, following the trend, in a which has been fairly typical where US dollar weakness has been seen across the board and particularly with the other major currencies. So, we have bad continuing economics from the USA and bad US dollar sentiment.

However, if we revert back to our ftse100 chart, the same sentiments cannot be applied to the British economy, and this is typical because of one reason: fund managers do not act out of sentiment in the same way as currency traders so. Fund managers will typically take a more long-term view, and this, of course, must factor in the Brexit situation. And herein lies our conundrum: one set of traders is buying the pounds, and another set is selling UK equities, and mostly because of the risk of no trade agreement being reached between the European Union and British governments regarding a future trade deal. This has largely been put down to the European Union wanting more leeway regarding fisheries and European fishing vessels being allowed to fish in British waters and also so with regard to standards being maintained across the board between Britain and Europe within the financial services sector and other areas such as food. Both sides have red lines, which neither are prepared to budge from and where there seems to be a breakdown in the negotiations with Michel Barnier and his British government counterpart, David Frost.
Time is of the essence, and it is said that a deal must be reached by the end of October in order for the future trading relationships, including zero tariffs on either side, being implemented. Should an agreement not be reached, Britain will be left to trade outside of Europe on world trading organisation rules, which are not as favourable to Britain as they would be with no tariff arrangement with Europe.

Michel Barnier has made it clear that unless standards are unified across the board, and the UK are willing to move their red lines on fisheries, it could cause trading problems and frictions, even where buy British lorry drivers might not be allowed to pass through Europe.

So, where does this leave things? Pretty much hanging in the air. The strength of the pound belies the uncertainties regarding the future arrangements with the European Union. Both sides are up against it in terms of time, and if neither side will budge, there is a distinct possibility of a no-deal trade arrangement between the two nations.
And so what might we expect? If it comes down to the 11th hour, so to speak, and there is absolutely no trade agreement between Great Britain and the European, the party might be over for the British pound, which could suffer to the downside against counter currencies.
We might also see a further sell-off on the FTSE 100. AS time gets closer, it will be wise for traders to be extremely cautious while trading both of these assets. Incorporate tight stop losses and reduced leverage.

Categories
Crypto Videos

Beware of God Mode Admin Keys! Avoid Crypto’s That Have Room For Corruption!

Beware of the “God Mode” Admin Keys – What are DeFi Projects Even Thinking?


Review platform DeFi Watch shows that twelve out of fifteen of the most popular decentralized finance projects still have access to a ‘God Mode’ admin key. These full-access control keys allow developers to modify or replace anything in the smart contracts underpinning their projects, and even make adjustments to user balances.
While admin keys are a common thing early in the project’s life, they are defeating the concept of decentralization and rendering the whole project unsafe. While the “God Mode” keys have been justified as the way to protect users’ funds, and are mostly used with security features such as timelocks and multi-sigs, many analysts argue the validity of the claims.

Author and educator Andreas Antonopolous has defined a truly decentralized project as one that has no custodial control over the funds, adding that “This is a very important criterion. I think that’s the foundational criterion of decentralization.”
By that standard, most DeFi protocols fall well short. Out of the fifteen projects reviewed on DeFi Watch, only Uniswap, Makerdao, and InstaDapp have no admin keys associated with their product, while the remaining projects — which include Compound, Aave, DDEX, Nexus Mutual, Yearn Finance, and Synthetix — all have admin keys that allow varying degrees of control.
Aave’s admin key, which consists of just five members, only requires three of the five members to vote “yes” in order to make sweeping protocol changes. Aave, as the third among all DeFi projects by total value locked, should not allow such a form of centralization.
However, several projects, such as Compound, have implemented security features that protect the integrity of the admin keys, with many more projects planning to migrate to fully decentralized governance systems in the future.


While many users did state that Aave and other projects have been somewhat upfront about their admin keys, DeFi Watch founder Chris Blec said that DeFi protocols need to be completely explicit if they retain the option to possess the God Mode feature. He also added that even when projects acknowledge admin keys’ existence, only a few clearly outline the ramifications. As an example, while Aave claimed that they have the “God Mode” keys, nowhere does it say that ‘Aave can change your account balance.’
Synthetix smart contracts are, similar to Aave, fully upgradeable via the admin key, with the core team possessing the “vast power to do just about anything, including adjusting user balances and draining funds” – as DeFi watch stated. Despite Synthetix’s core team acknowledging the project’s centralization, the protocol has attracted immense funds and numerous investors.

Unlike Aave, Uniswap does not have any admin keys. Still, a blockchain analytics firm Glassnode has suggested that the DeFi project has essentially created their own unique backdoor through the distribution of their UNI governance token, which is equally as daunting.

The team potentially has immediate access to close to 40% of the entire supply, which is, at the moment, over double the amount held by the rest of Uniswap’s community. This would put them firmly in control of the whole decentralized protocol.
Once again, while having “God Mode” keys is somewhat a standard for new and emerging projects, it is expected for them to get rid of it or suffer the consequences of being deemed as a centralized project.

Categories
Crypto Videos

Crypto News – Founder of OKEx Exchange Arrested!

Founder of OKEx Exchange Arrested

OKEx suspended all withdrawals at noon on October 16. They stated that the reason for the withdrawal suspensions was their cooperation with an investigation. Eventually, the news about the reason for the investigation made it out to the public. It turns out that Mingxing Xu, the founder of OKEx, was arrested at least a week ago.

Although the OKEx team’s official announcement states that an individual in possession of the exchange’s private keys of the cold wallet is currently cooperating with a public security bureau in investigations. In short, this means that the person arrested is so important to the company that withdrawals could not happen without him around. Jay Hao, the CEO and co-founder of OKEx, stated that the issue was over a personal matter. He didn’t say much, and the whole announcement was very vague.


According to a recent report coming from Bloomberg, the Chinese police have launched an investigation directly linked to OKEx, but it’s still unknown what exactly prompted the investigation. The exchange has made several statements in which they were assuring clients that the funds are completely safe and other activities will continue as normal. One such announcement came from OKEx CEO Jay Hao, stating that: We understand that the suspension of withdrawals impacts our users’ experience on OKEx directly, and we wholeheartedly apologize for this.” He added that all other activities, such as deposits, spot trading, staking, derivatives, etc. remain completely unaffected.
However, while the OKEx team ensures its customers that everything is okay, analysts claim that Bitcoin’s most recent drop to the $11,300 support is caused by the market being afraid of another centralized exchange fiasco.

While many things are still unknown, it does seem that the arrest of Mingxing Xu might not be directly tied to OKEx and its operations. According to a non-official report that appeared online, Xu was already released on bail, while his arrest happened because he was ordered to assist in the investigation that was related to a backdoor listing of the European Group in Hong Kong in 2019.

Categories
Forex Videos

Forex Fundamental analysis for novices – Dallas Fed Manufacturing Index!

Fundamental analysis for novices: Dallas Fed Manufacturing Index


Thank you for joining this forex academy educational video. In this session, we will be looking at fundamental analysis for novices and discussing the Dallas fed manufacturing index.

Most brokers offer an economic calendar where you will see economic data release events that fall due daily, weekly, or even monthly.
It is critical that you know when these events are going to occur because many of them cause extreme volatility in the market and may affect any open trades or trades that you are about to take, while not realising that an event is about to happen and where these events might reverse price action, to your trading detriment. Professional traders plan around such events, and you should do the same so that you understand what is going on in the marketplace at all times.

The key components of an economic calendar are the day and the date, the time, the type of event, the impact, which is a barometer of the likelihood of the event causing volatility and which is normally low, medium, or high, and which is measured on this calendar with the strength indicator filling the box, the more likely volatility will occur, and where the high volatility impact releases will typically fill the box in solid red.
Also, the actual data box will be populated very quickly after the embargo announcements, and you can also see a general consensus of what the market believes the data is likely to be as compiled by market analysts and economists. And you will also see the previous data, whether that is for the previous week, month, quarter, or year.


Here we have scrolled forward to Monday the 31st of August, and we can see that at 3:30 BST, the Dallas Fed manufacturing business index for August was due to be released and where the impact value is low, there is no consensus available, and the previous figure was -3.
The United States Dallas fed manufacturing index pertains to the state of Texas, which is the second-largest state in America, with a gross state product of nearly 2 trillion$. Many of the top fortune 500 companies are domiciled in the state of Texas.

The index itself measures the performance of manufacturing in Texas, where the information is taken from around 100 businesses and is based on output orders, and prices, and employment within Texas. Therefore, it is an important indicator of the economic health of one of the largest states in America.

Although no the economic calendar impact box shows this as being low for potentially causing market volatility, the American economy is in a precarious position with the covid virus still highly prevalent across all states, and where the American economy is struggling to regain anywhere near the levels, it reached before the pandemic started.

Therefore, traders should be mindful that any information regarding economic activity in any of the States is likely to cause volatility. Traders will be looking for a figure better than –3, which would be considered to be strong for the United States dollar, which might firm, and if the number is worse than –3, it will be bad for the economy and where you might find the American dollar loses ground against the other major currency pairs.

Categories
Forex Videos

Forex Fundamental analysis for novices HICP!

Fundamental analysis for novices: HICP

Thank you for joining this forex academy educational video for novices. In this session, we will be looking at fundamental analysis for novices, and we will be discussing h I c p.

If you are new to trading, you will need to have access to an economic calendar, such as the one shown here, where governments around the world release economic statistics, usually weekly, monthly, quarterly, or annually, and whereby the financial markets look at these statistics in order to try and gauge the strength or weakness of an economy based on the release of this information. Such data releases can cause the relating currency of that country to stay the same or gain in strength, or lose value against other currencies. Therefore, it is vitally important that you understand how economic calendars can help your trading.

The most important aspects of an economic calendar are the time of the release, the type of event, the day and the date, the impact level likely to be received by the market, which is usually low, medium, or high, the actual data, which is usually subject to an embargo and will be populated on the calendar usually just a few moments after its release. The consensus, or what the market thinks that information is going to be based on forecasts formed by economic and financial analysts, and the previous data, whether that be weekly or monthly, etc.

Here we can see on the economic calendar for Monday the 31st of August 2020 at 8 a.m. BST that Spain will be releasing their harmonized index of consumer prices or h I c p data and simultaneously releasing consumer price index information for both month on month and year on year, and these are all preliminary readings.
Spain has the 13th largest economy by gross domestic product in the world, and because it is part of Europe, it is measured as the 6 largest EU member in Europe. The harmonized data is a component of the overall data for the eurozone. Therefore, because Spain is a relatively smaller component of the overall picture for the eurozone index of consumer prices, it has a low impact upon its release. The statistics are weighted and are used as a way of measuring inflation and price stability across the eurozone. Inflation is tightly monitored by the European Central Bank, which will have a benchmark target of around 2%, which is fairly typical for Western economies, although the United States has raised that bar slightly due to the ongoing pandemic and the devastating effect it is having in America at the moment.

Typically, a high reading is positive for the euro, and a low reading is negative. However, all economic data is taken very seriously due to the fallout from the pandemic, but economists and therefore the consensus reading is usually fairly accurate with the smaller member states, which typically means there are fewer shocks and again because Spain is a smaller member of Europe, it is unlikely to cause market volatility upon its release. Nonetheless, one should always be guarded, just in case.


Categories
Crypto Videos

Earn Passive Income With Yield Farming Part 2!


Earn Passive Income With Yield Farming – Part 2/2


While the previous part of our yield farming series talked about the definition, threats and opportunities of DeFi yield farming, this part will talk more about specific projects and what they offer, as well as how to choose the right project for you.

Compound and Aave

Compound and Aave are currently DeFi’s primary lending and borrowing protocols. These two platforms together account for over $1.1 billion of lending and $390 million of borrowing. The easiest and most straightforwards way of earning a return in DeFi is lending capital on the money market.

Aave generally has better rates than Compound, as it offers its borrowers the ability to choose a stable interest rate rather than a variable rate. The stable rate is, in most cases, higher for borrowers than the variable rate, therefore increasing the marginal return to lenders.

On the other hand, Compound introduced a new incentive for its users through the issuance of its COMP native token. Anyone that lends or borrows on the Compound platform earns a certain amount of COMP, translating into more rewards.

Security from Financial Risk

DeFi money markets work by employing over-collateralization, meaning that a borrower must deposit assets that have more value than their loan. When the collateralization ratio (which is the value of collateral divided by the value of the loan) falls below a threshold, the collateral is liquidated and instantly repaid to lenders.

Yield Farming Liquidity Pools

Uniswap and Balancer are the two largest liquidity pools in DeFi. They offer liquidity providers a reward in the form of fees for adding their assets to a pool. Liquidity pools are between two assets that are configured in a 50-50 ratio in Uniswap, while Balancer allows for up to 8 assets in a single liquidity pool.
Whenever someone takes a trade through the liquidity pool, liquidity providers who contribute to that pool earn a small fee to facilitate the transaction. Uniswap pools have offered liquidity providers healthy returns over the past year as decentralized exchange volumes picked up. However, optimizing profits requires investors to also consider impermanent loss, the loss created by providing liquidity for an asset that suddenly appreciates.
Balancer pools are somewhat mitigating impermanent loss, as pools don’t need to be configured as a 50-50 split between two assets. They can be set up in a 90-10 or 80-20 allocation to minimize impermanent loss. However, the risk cannot be completely eliminated.

However, there is a liquidity pool that completely eliminates impermanent loss. Curve Finance facilitates trading between assets that are pegged to the same value. As an example, there is a Curve pool with USDC, USDT, DAI, and sUSD: all stablecoins pegged to the USD. There’s also a liquidity pool that consists of sBTC, RenBTC, and wBTC: all pegged to Bitcoin’s price. As all of the assets are worth the same amount, there is no impermanent loss. On the other hand, trading volumes of those pools will almost always be lower than the regular liquidity pools like Uniswap and Balancer.

Incentive Schemes

The Synthetix project first introduced an sETH-ETH pool as the original incentives scheme, offering liquidity providers an added incentive of SNX rewards. While this pool has deprecated, this idea expanded to other liquidity pools.
Taking advantage of these incentives can show to be incredibly lucrative. However, investors should ensure that they aren’t earning a dud token, but rather something that holds value. Nobody wants to take part in an incentive scheme that gives rewards in tokens equivalent to BitConnect tokens.

What to Choose

For the slightly risk-averse investors who just want to earn a yield on their stablecoins, there are many options, with money markets or providing liquidity on projects such as Curve Finance being the best option for lower-risk interest. For those with large cryptocurrency holdings and want to use them to earn even more, liquidity pools such as Uniswap or Balancer are certainly a good choice. Added incentives on top of the regular rewards are just icing on the cake.

That being said, the perfect yield farm is different for each individual varies based on their amount of capital, the investment time horizon, as well as how risk-averse they are.

Categories
Crypto Videos

Earn Passive Income With Yield Farming!


Earn Passive Income With Yield Farming – Part 1/2

The hottest buzzword in crypto at the moment is surely “yield farming.” Yield farming allows people to earn fixed or variable interest simply by investing crypto in a DeFi project. As an example, investing in ETH is NOT yield farming, but lending out ETH on the Aave platform for a return IS yield farming. As the newest trend in crypto, investors are still a bit skeptical as they do not understand what it is and how it works.

Yield Farming – Explained

Yield farming is the practice of staking cryptocurrencies in return for monetary gain. While the expectation of earning a yield based on investments is nothing new, the concept of yield farming has arisen directly from the decentralized finance sector. The idea is that individuals can earn tokens in exchange for participating in DeFi applications. Yield farming is often called liquidity mining.

How It All Works

The precise mechanics of yield farming vary based on the terms and features of the individual DeFi application. Most projects started out by offering users a small share of the transaction fees in exchange for contributing liquidity. However, the most common yield farming method at the moment is to use a DeFi application and earn the project token as a reward.

This practice became popular during the summer of 2020 when Compound announced that it would start issuing its COMP governance token to both lenders and borrowers who use the Compound application. This was extremely well accepted, pushing Compound to the top of the DeFi rankings.
Since then, several projects created DeFi applications with associated governance or native tokens and started rewarding users with their tokens.
The most successful yield farmers try to maximize their returns by deploying more complicated strategies. These advanced strategies usually consist of staking tokens in a chain of protocols, intending to generate maximum yield.

Pros/Cons of yield farming

The benefit of yield farming is apparent immediately, and that is profit. Yield farmers who adopted a new project early have the privilege of benefiting from token rewards that can quickly appreciate in value. If they choose to sell those tokens at the right time, they can make significant gains.
Yield farmers generally have to invest a large sum of initial capital in order to generate any significant profits, with even hundreds of thousands of dollars being at stake. Due to the volatile nature of cryptocurrencies and especially DeFi tokens, yield farmers are exposed to the risk of liquidation, which occurs in case their project is plummeting in price. On top of that, the most successful yield farming strategies are extremely complex, meaning that the risk is higher if you don’t know all the yield farming space’s ins and outs.
Another risk of being a part of the DeFi and yield farming space is that the projects you invest in may have bugs that can crash the whole system, therefore rendering your funds non-existent. There have been several examples of such things happening, with the most prominent one being bZx, which suffered a series of hacks due to a single misplaced line of code.

Challenges and Opportunities

Almost every single DeFi application is currently based on the Ethereum blockchain, which creates two problems. The less important one is that, as Andreas Antonopoulos says, is that if projects support only Ethereum-based cryptocurrencies, they are slightly centralized in that manner. However, this is not as important as the next challenge, which is the overload of the Ethereum network. The network is currently struggling with a lack of scalability as it did not anticipate DeFi and its rapid expansion. As yield farming becomes more popular, Ethereum will get clogged up with more transactions, leading to slower confirmation times and skyrocketing transaction fees.

However, with new scaling propositions and alternative DeFi platforms, these problems aren’t fatal to DeFi, and the practice of yield farming could end up being around for quite some time.
Check out the next part of our DeFi passive income guide to learn how certain projects do business, how to earn passive income with them, as well as which project is the right for you.

Categories
Forex Videos

What The Japanese PM Shinzo Abe’s Resignation Meant For Forex!

Japanese Prime Minister Shinzo Abe resigns where next for the Yen?

Thank you for joining this educational video. in this session, we will be looking at the impact of the Japanese yen now that long-standing prime minister Shinzo Abe has resigned.


If we look at this one-hour chart of the US dollar Japanese yen pair from Friday 28th of August, rumours started to enter the financial markets during the European session that prime minister Shinzo Abe was about to resign due to ill health. The currency pair declined as investors sought to buy Japanese yen. Typically, when uncertainty surrounds a country, such as an important announcement that the long service serving prime minister was about to resign, you might expect the currency to the devalue.
However, the Yen is also seen as a safe-haven currency due to the American economy’s continuing uncertainties because of the ongoing pandemic and upcoming presidential elections. A lack of any kind of stimulus package being agreed on between the democrats and the republicans did not help the US dollar, coupled with the fact that the day before the Fed’s chairman, Jerome Powell, change policy with regard to allowing inflation target to move higher than the 2% benchmark that it had worked to for many years, thus allowing the potential for low-interest rates to remain at record lows for years to come.

On the flip side, we have a fairly strong and stable Japanese economy, which Shinzo Abe will be attributed for, being one of the longest-standing prime ministers in Japanese history. He was liked and respected around the globe, and his tight policy-making has proved an asset or the Japanese economy. He managed to negotiate a trade deal with America, which was beneficial to both countries and is proving successful, but he also stood up to China with regard to what the Japanese saw, as is an infringement on Japanese businesses being able to work within China. Although he stood up to the Chinese government, he did so without any animosity or threats. Such is the high regard that he was held as a statesman for Japan.


If we take a look at this monthly chart of the pair going back to September 2017, we can see that it has not been averse to large swings from lows of 98.00 to highs of 119.00, but where the general trend in the last 12-months has been towards a firmer Japanese yen.
While the Japanese economy will be reeling from its prime minister’s loss, the markets have not been acting adversely, possibly due to the previously mentioned fundamental reasons.

Therefore, it is highly likely that we can expect little change in sentiment for the Japanese yen. The general trend in the pair is lower as investors look to safe-haven assets, such as the yen, and while the market is currently in volatile mode, the downward pressure on this pair will likely remain for the foreseeable future.

Categories
Crypto Videos

Ethereum Is Still Not Ready For DeFi! – What Does This Mean For Investors?


“Ethereum Still Not Ready For DeFi” – Critics Claim

As almost every single DeFi project flocked to Ethereum, experts warn that the network is not yet ready to support the frenzy that is DeFi.
Martin Froehler, a former hedge fund manager, mathematician, and founder of Austrian crypto trading platform Morpher, said that although Ethereum is surely the “best thing the blockchain industry can offer” to DeFi, its current network capabilities are still not enough:
“Ethereum can, at the moment, only handle about 15 transactions per second, and has a block time of 15 seconds, which is an eternity in finance. As people go into DeFi, they have to interact with Ethereum, meaning that everyone interacting with it needs Ether on their wallets. That is a huge barrier to entry, which may slow down mass adoption.”

Froehler considers Ethereum to be the most decentralized smart contract platform. However, because the network still has issues, many developers have had to look for solutions to counter them.  Froehler then added:
“There is cryptographic proof for everything happening on the sidechain on Ethereum, meaning that people are able to trade without actually needing Ether. They don’t pay any fees while enjoying a settlement time of one second, and being completely independent of the many congestions that the Ethereum network may cause.”

Many industry players feel like Ethereum did not anticipate the DeFi hype properly and that even with the much-discussed upcoming network upgrade, Ethereum 2.0, it will still not be ready to service DeFi and its appetites.

Ethereum 2.0 is implemented in order to improve performance, but its high gas prices may just scare off new users. Sergej Kunz, CEO of decentralized exchange 1inch, spoke about the issue and said that the Ethereum infrastructure currently lacks the capacity to host the DeFi environment:

“You will have to rethink everything. It’s true that you can migrate smart contracts to the code, but that’s not scalable. To be able to scale, you would have to create standards and bring new protocols that are based on the new sharded architecture, something like NEAR, which is similar to Ethereum 2.0.”

Mounir Benchemled, founder and CEO of ParaSwap, pointed out that the sheer complexity of explaining how a layer-2 works to end-users “and the risk of not being able to actually pay the funds immediately to these users” cause a lot of concern. Benchemled added that it is not practical for all DeFi projects to instantly swap to Ethereum 2.0:

“For it to work, all applications would almost be required to move towards one single platform. While major projects might have consensus, there are other projects who have their own agendas, and it might be hard for them. New bridges will have to be built to allow interoperability.” Despite all the challenges ahead for the Ethereum blockchain, everyone agreed that “DeFi is here to stay.”

Categories
Forex Videos

The Forex Market reaction to Fed Powell speech & What It Means Going Forward!

Market reaction to Fed Powell speech 27 August 2020: The new framework

Thank you for joining this forex academy educational video. In this session, we will look at the extreme market volatility after federal reserve chairman Jerome Powell’s speech at Jackson Hole on the 27th of August.

The United States dollar has remained on the back foot this week with the DXY punching through 93.00. There was a lot of expectation for the US data on Thursday the 27th, especially the 2ND quarter gross domestic product, which came in slightly better than expected and also the initial jobless claims, which again was very slightly better than expected.

However, while that data had a fairly muted effect, keeping the euro US dollar pair just above point 1.1800. It was fed Powell’s speech on monetary policy, which really caused volatility in the marketplace, causing the pair to spike to a high of 1.1900 and a low 1.1759 while the market tried to digest the new policy and how it might affect the markets in general.
Whenever we get spikes and reversals after a policy shift from a major Western government, especially the USA, it is largely because analysts and economists are fairly split on whether or not the new policy will help or hinder the United States economy, and whether or not it is good or bad for investors.

The policy centers around the feds benchmark 2% inflation target and where it says it is now in a position for that to be over-shot to slightly above on occasions. This new policy, to tolerate inflation above 2%, is largely seen by the markets that the Fed will be holding interest rates lower for longer, possibly even years. This, of course, is not attractive for people who want to hold United States dollars. Although interest rates have been low for some time, to assist the United States economy rebound from the catastrophic effects of the coronavirus, the fact that we may see low interests rates in the United States for many years to come is not attractive to Dollar investors, and this is why we are seeing almost pandemonium in the currency markets. Most of this pertains to the US dollar.

So, what can we expect in the currency markets? Posted speech, the Asian session continued the US dollar sell-off, where great volatility has been seen in the market since Powell’s speech. The DXY index has been taking a major beating, and no end looks to be in sight. Therefore, we suggest traders’ limits risk by keeping stop losses tight and lowering leverage until market volatility decreases

Categories
Forex Videos

Forex Fundamental Analysis for Novices – US Construction spending!


Fundamental Analysis for Novices US Construction spending

Thank you for joining this fundamental analysis for novices’ educational video. In this session, we will be looking at construction spending data releases and, in particular, within the United States.


If this is the first time you have viewed one of our fundamental analysis videos for novices, please make sure you search for the many other videos in this series which will help you understand the importance of such data releases when they hit the market and which are usually subject to an embargo.
You should refer to your economic calendar every single day and make sure you plot your trades around these risk events.

The most important sections of an economic calendar of the time of day and date of the release the type of event. For example, here we can see that the first one on the list is the right move house price index month on month for August for Great Britain, which was due for release at 00:01 on Monday, August 17th, where the impact was low.

Most economic calendars will provide you with the likely volatility impact of such news releases, and these will typically be released as low, medium, or high impact. Here we can see that the strength of the impact is measured by a bar where low-impact is a third of the bar coloured in orange, a medium impact such as the EURO group meeting at 1:00 takes up a third of the bar in orange, and a high impact bar which we can see at 12:50 in the morning, where the Japanese gross domestic product was considered to be a high impact and where the bar was completely coloured in red.

Economic calendars will also show you the previous data, which could be weekly, monthly, quarterly, or annually, and they will provide you with a general consensus as compiled by market experts and economists, and of course, the actual release section will be populated shortly after the embargo.

Here we can see a recent data release of us construction spending, which came out on Monday, August 3rd, and was simultaneously released at 3 p.m. BST with other important United States data including ISM manufacturing employment and manufacturing orders and prices.

While the market will look at all of this information simultaneously, some of this has been covered in previous videos, which we would ask you to take a look at. Still, in this video, we will only be focusing on the construction spending component, which was month-on-month for June, where we can see here came in at – 0.7%.

The information is released by the United States census bureau and is a measurement of the total amount of spending in the United States for various construction types. Because it includes a residential component, it is useful for predicting new home sales and mortgages. A high reading is seen as positive for the United States dollar while a low reading he seen as negative or perish for the United States dollar.

While the impact indicator considers this to be of low importance, when taken into to context with the other data being released simultaneously, traders will need to take a holistic view, especially in the current economic climate where the pandemic is still in the grips of the United States at the time of writing this article and where even low impact data can cause shock waves and market jitters. In which place, it is better to be prepared for this and wait for the market to react to the news before spotting trends and trying to get on them.

Categories
Crypto Videos

Legitimate Passive Income Streams In Crypto -Airdrops Forks Burns Buybacks & Collectables Part 3

Earn Passive Income in Cryptocurrency – part 3

This part of the Cryptocurrency Passive Income guide will talk about one often forgotten way of earning money, which is at the right place in the right time. The focus of this part of the guide will be Airdrops, Forks, Burns, and Buybacks.

Right-time Right-place

While most passive income strategies recover preparation, work, skill, and taking risk, this one does not. All it takes is to either be lucky or bring yourself to the right place at the right time in order to collect the reward.

Airdrops

Airdrops are events when certain exchanges (or projects directly) send certain cryptocurrencies directly to your wallet. The amount sent varies based on your contribution to the project in terms of sharing, liking, etc.
Looking for airdrops in order to earn an income is quite a viable way, even though it is inconsistent. You never know how many projects will do the airdrop, nor do you know when that will happen too much ahead. This moves the long-term planning out of the game. Not many people consistently utilize airdrops as a way of getting additional income while they could. Ultimately, this is “free money” and should be taken seriously.

Forks

Forks are when a cryptocurrency splits into two versions of “itself” due to an update, upgrade, or disagreement between developers or the community. If you own the original cryptocurrency at the time of the form, you will receive the holdings on the new blockchain as well. The prime example of this was when Bitcoin forked into Bitcoin Cash.
Using forks as a way to generate passive income is as easy as holding a certain cryptocurrency at a certain time. There is no skill or risk involved. The main thing to care about when being involved in a form is deciding what to do with the then-received cryptocurrency. While it is sometimes better to hold both cryptocurrencies, you will most likely sell the cryptocurrency that has less community support.

Burns and buybacks

Burns and buybacks are quite rare but could be a good addition to the options you have when it comes to earning passive income with cryptocurrencies. Burns and buybacks are, as the name says when the cryptocurrency creators buy back the cryptocurrency from the current owners and then burn the supply.
The prime example of a buyback and burn is the Bitfinex exchange and its LEO token.

Bonus: Collectibles

There are certain blockchains that have created certain “games” through which you can earn a lot of money. One such “game” is Cryptokitties. This “game” has a supply of collectibles that “live” on the Ethereum blockchain. They can be collected, breed as well as sold.
Make sure to watch the rest of the Crypto Passive Income series, where we will talk about other ways of earning a passive income through cryptocurrencies.

Categories
Crypto Videos

Legitimate Passive Income Streams In Crypto – The Pitfalls & Successes Part 2

Earn Passive Income in Cryptocurrency – part 2

This part of the Cryptocurrency Passive Income guide will talk about crypto trading bots and how they work, as well as if they can be profitable.

What are crypto trading bots?

As the name suggests, they are automatic robot trading algorithms that trade for you. All you need to do is give them 24/7 internet access and a trading strategy, and they will do the work for you.

There are several types of bots available on the market, depending on what you want to do. They include regular trading bots that trade on the desired exchange as well as arbitrage bots, which make a profit off of the price difference between exchanges.

Are crypto trading bots profitable?

In order to start profiting from bot trading, you will ideally need a healthy stack of crypto to start with. If you are running an arbitrage bot, you would need cryptocurrencies on multiple exchanges. ,
While some people have made a fortune passively through these bots, many have lost their crypto investments as well. It all depends on how you adapt the bot to the market. There are strategies that work well for bullish markets but do poorly in bearish markets, and vice versa. For this reason, you need to develop or copy strategies and then switch them out based on the major trend.

Which trading bot to pick?

Quite a few crypto trading bots have recently emerged on the market, claiming they can ensure massive profits. While there is no doubt that utilizing machine learning can make a profit if done well, we can conclude that bots only enable the possibility of passive income while creating it has to do with you creating your own strategy (or copying one).

A couple of most well-known cryptocurrency trading bots on the market are:
Gunbot, which offers trading on eight different exchanges. It costs 0.02 BTC up to 0.15 BTC to buy it.

Haasbot is an automatic trading bot that comes with monthly subscriptions that start from 0.073 BTC.

Profit Trailer is a bot that specializes in average-down strategies. It starts at $35 per month.
Ultimately, you should pick your bot based on the exchange you want to use it on, the monthly fee as well as based on if the strategy you want to use is available on the particular bot.
Should you use a crypto trading bot?
The reality is that bots are here to work as tools rather than as fully independent entities that just earn massive profits. If that were the case, everyone would use them. Using trading bots can be extremely profitable, but only with the right strategies.

The best crypto trading bots that earn the best profits are certainly ones that you have never heard about, nor you will. Traders who use such bots have absolutely no incentive to share the information. However, there are many possibilities when it comes to earning a passive income through bots, and many strategies can be viable. Backtesting is a major key in finding the strategy that suits you and the market cycle at that particular moment.

Make sure to watch the rest of the Crypto Passive Income series, where we will talk about other ways of earning a passive income through cryptocurrencies.

Categories
Forex Videos

The Information On Oil You Need To Know! WTF!

What’s happening with oil prices?


Crude oil, which is sold by the barrel in the future’s market where buyers take delivery on a monthly basis, reached a peak of $65 per barrel just a few weeks ago.


The May contract, which expires today 21st of April 2020, had been hovering around the $20 per barrel level yesterday for one of the producers, West Texas Intermediate, or WTI. However, it became increasingly apparent that buyers for this contract were hard to come by because of a lack of storage facilities. And when the Chicago Mercantile Exchange or CME issued a warning statement yesterday that it was possible for oil prices to go into negative territory, it sent a shock through the oil markets.
While producers remained extremely eager to sell and buyers were left standing on the sidelines, and with just hours remaining until the May contract expired, panic selling set in and, as we can see on the graph, the price of a barrel of WTI, fell through zero into minus territory. And where this had happened for only the first time in the history of the crude oil market.


We can also see on the chart that the price did recover some upside to just over $1 per barrel, but where it currently hovers slightly underneath zero at around – $2 per barrel at the moment. This price action in crude oil is unprecedented, and, as I mentioned previously, has never happened before. So what exactly is going on, and what does this tell us about the oil and financial markets in general?

First, we need to take a step back just a few short weeks ago when the world was hit by the Covid-19 pandemic. People all over the world remain in lockdown, businesses are closed, the airline industry has almost flatlined, cars are off the road because nobody is going anywhere. And every one of these sectors uses by-products of oil in the form of petrol, diesel, gasoline, jet fuel, cooking oils, lubricants, plastics, etc. Springtime has hit the west, and with the warmer weather, we need less heating oil.
An old adage springs to mind, and has never been more appropriate: supply and demand: we have too much supply and too little demand. I think it’s safe to say that we just don’t need oil right now.

Storage facilities, including Cushing in Oklahoma in the United States, are at almost 80% capacity of barrels of oil, which are only trickling out to refineries, which are also busting to overflow with the by-products that they have produced including petrol and diesel, etc.
All the time I’m big oil-producing countries such as Saudi Arabia and Russia, the USA and others keep pumping out oil, in defiance of nations asking them to ease production and where the governing body, OPEC, seems not to have enough clout to force countries such as the belligerent Russia to do so.

However, when prices of oil go into negative territory, which many of us have never even considered before, a sudden realization occurs, that producers of oil, which falls into negative pricing during a futures contract, are forced to pay buyers to take oil off of their hands at the market rate. This will be extremely painful for oil producers, who are producing a product which they cannot store because of a lack of storage facilities, and where they are hiring – at great expense – barges, and cargo ships and huge tankers, many of which are languishing in ports and offshore while waiting to go into ports to be

offloaded, and which becomes a further expense to producers. Surely now the writing’s on the wall, and that the longer this pandemic goes on, the less oil we are going to need, and therefore we should expect production to fall even further.
But is there an underline message here? Well yes, this kind of unprecedented crash in a major financial sector, albeit a blip, will send out warning signs to investors that the financial markets remain extremely unstable during the virus pandemic, and that the longer this goes on for we should expect volatility to spill over into other markets such as stocks, currencies – and especially where those countries are producers and exporters of oil, is the United States, Canada, Russia Saudi Arabia, and oil, and of course markets will be keeping a close eye on future oil contract expires.

Categories
Forex Videos

Forex Price Action Noise! How To Analyse Timeframes!

aThe Problem With Price Action Noise

In forex trading, a term that is used quite often in technical analysis is market or price action ‘noise.’ Quite often, we find that price action in Any Given currency pair spends an awful lot of time sideways or consolidation motion. Or where price action seems to be rising and falling in small increments, but where these moves tend to form the basis of a trend. However, the lower you go on a time frame and especially with regard to the 1-minute and 5-minutes time frame, the more difficult it becomes in ascertaining exactly where the trend is going, whether it be a part of a bullish move or a bearish move or if it is a part of a consolidation phase.


Insert A: This is a section of price action on a 5-minute chart of the USDCAD pair. We have added two vertical bars because this is the period that we want to drill down on a little bit more.


Insert B: This is the same section, but we have added 2 points on the charts at position a and b, and where the interest rate differential is 64 pips. That is to say, had you gone short at position a the maximum you would have made had you got out at position B would have been 64 pips less your spread. And of course had you bought the pair at position A and still being in the trade at position B you would have been offside by 64, pips plus your spread.


Insert C: In this section, we have added our own channel, where we can see a lot of rise and fall and tight consolidation in periods where the price is contracting within the range, but this in itself would become difficult to trade, especially if looking for trends.


Insert D, Now scalpers, while incorporating technical tools such as statistics, might argue that a few pips could be made here and there possibly based on highs with higher highs and lower lows, etc.

Insert E, But this type of technical analysis can quickly fall out of kilter in areas such as where we have highlighted we suddenly have a lower or high which is followed by buy a higher low, where we would need a lower low in order for the pair to remain in a bearish price pattern.


Insert F. This is also complicated in the area where we have highlighted where we see candles grouped together, which are both bullish and bearish and where several are more wick than candle telling traders that neither bulls nor the bears have this pair under control at this time. This is market noise. And while such noise can be seen in all time frames, the trick is to move up to a higher one to find out where directional bias might be heading.


Insert G. However if we moved to a higher time frame, such as the 1-hour time frame here and again, look at the price action within the two horizontal lines we get some more clarity about what is really happening to this pair over the time period which we have highlighted.


Insert H, And here we can see that the price action is consolidating after a rally to the upside and where we have a V-shaped potential reversal pattern within our highlighted area.
There is an old saying which I’m sure you’ve heard of that sometimes you can’t see the wood for the trees. Well, this is a perfectly good example, where in order to avoid the noise of the lower time frames, we must always look to the higher time frames to try and ascertain what the general bias is, even if you prefer to trade the lower ones.

Categories
Crypto Videos

Legitimate Passive Income Streams In Crypto – The Pitfalls & Successes Part 1

Earn Passive Income in Cryptocurrency – part 1

People from all around the globe started investing in cryptocurrencies due to their great long-term potential in transforming the world both in terms of technology and wealth distribution. While most focus on instant big gains, some people would like to stay on the safer side and look for passive income in the crypto space.

There are many ways to earn a passive income with cryptos, and we will cover most of them in a series of videos. This video will show you how you can earn a passive income by utilizing the Proof of Stake consensus algorithm.

What is Proof of Stake?
Instead of investing the users’ computing power to process transactions, PoS transactions are validated by the nodes that stake their own coins as a form of insurance. Those that stake their coins are trusted because they have put their coins on the line, so they have no incentive to scam.

Everything is quite simple — just stake the coins by keeping them in your wallet, and you will receive rewards for this.
The process is, in terms of how you get passive income, very similar to the principle of bank deposits, which have a reward over the deposit time.

Choosing the right coin to stake
First off, the currency you want to select has to support the PoS. After you are sure that the particular crypto works on PoS, just hold that crypto in your wallet and give the wallet a 24/7 access to the internet. Being connected to the internet 24/7 is the only way for staking to work, as you need it both to validate transactions and receive rewards.

Pros of the PoS system

The key difference between Proof of Work and Proof of Stake is the formation of any block. While PoS has a random selection of block validators, PoW uses computing power, which chooses only the computers which solved the validation puzzle (the better gear you have, the more you will earn). This makes staking cheaper in terms of initial costs as well as the costs of running it.

Cons of the Proof of Stake system

When using staking for passive income, you should focus on two things:
Safety
Profit
There is a reason safety comes first. It doesn’t matter if the profit is big on paper if you lose it all in the end. You need to set your account up with 2-factor authentication, use only trusted software, and never disclose any personal info to third parties.
Besides safety risks, there are other risks, mainly regarding the price volatility. Since you get paid out in the staked coin, if it drops in value – you get less money.
Always take into consideration all forms of risks before stepping into any investment.

Which cryptocurrency should you stake?

There are many cryptocurrencies you can stake, but we will name a couple you could take into consideration.
Dash — one of the first large cryptocurrencies that introduced staking
Decred (DCR) — a cryptocurrency that uses a hybrid of PoW and Pos and considers decentralized management as its main priority
NEO – often called the Ethereum of China
Zcoin (ZCX) – works on user privacy and gives great returns (17% per annum)
Ethereum (ETH) — second-largest cryptocurrency in the world, that will soon switch to PoS.

Make sure to watch the rest of the Crypto Passive Income series, where we will talk about other ways of earning a passive income through cryptocurrencies.

Categories
Crypto Videos

How To Profit Trading Crypto With Elliot Wave Part 2


Elliot waves Crypto trading guide – part 2/2

The second part of the Elliot waves guide will talk about the use of Heikin Ashi candles, wave degrees as well as how to trade the Elliot wave in general.

Heikin Ashi and Elliot wave trading

If you seem to get confusing results from the chart, it’s most likely a miscalculation as far as following the rules of the Elliot wave go.

However, there is a way to track and read the chart better.

Heikin Ashi candles pair up extremely well with the Elliot wave pattern reading as they help recognize red or green candles that create a trend. This makes you respond to the market movement and distinguish trends easier.

Wave Degrees: The Waves Within Waves – explained


Each wave of the five Wave Elliott Principle consists of one larger timeframe wave. Each wave can consist of larger market cycles that even take decades to complete.

The degrees of the wave patterns have different names:
Subminuette: lasts minutes
Minuette: lasts hours
Minute: lasts days
Minor: lasts weeks
Intermediate: takes weeks to months
Primary: takes several months to a few years
Cycle: takes one to several years
Supercycle: takes multiple decades (40–70 years)


Grand Supercycle: takes multiple centuries
When it comes to cryptocurrencies, and knowing that it is a young market, large wave degrees do not exist yet. However, we have seen a pattern as big as Primary during the rise and fall of Bitcoin’s price in 2017 and 2018.
Trading the Elliot wave

Entries and Exit points

The best entry point would ideally be the start of the first wave. However, that is quite unrealistic as it can be hard to spot and recognize a wave so early. Most traders start at the bottom of the second or the start of the fourth wave. These waves are much easier to spot. As a word of caution, try not to ever buy near the top of the third wave or fifth wave.
The best exit point would be the end of the third corrective wave. However, timing this can be quite hard as these final waves might retrace to 100% of the initial pattern. For this reason, most traders choose a safer exit position, which is the place where consolidation breaks outside of the final corrective wave.

Conclusion

The Elliott Wave Principle is a highly useful chart pattern that is used by many veteran traders. It is mostly used to recognize the beginning and end of a certain trend.
Do your own research before attempting to buy and sell anything. Happy trading.

Categories
Forex Videos

Forex Chart Hopping! How To Be More Consistent

The Danger Of Chart Hopping

One of the biggest areas where new traders fall down is chart hopping.
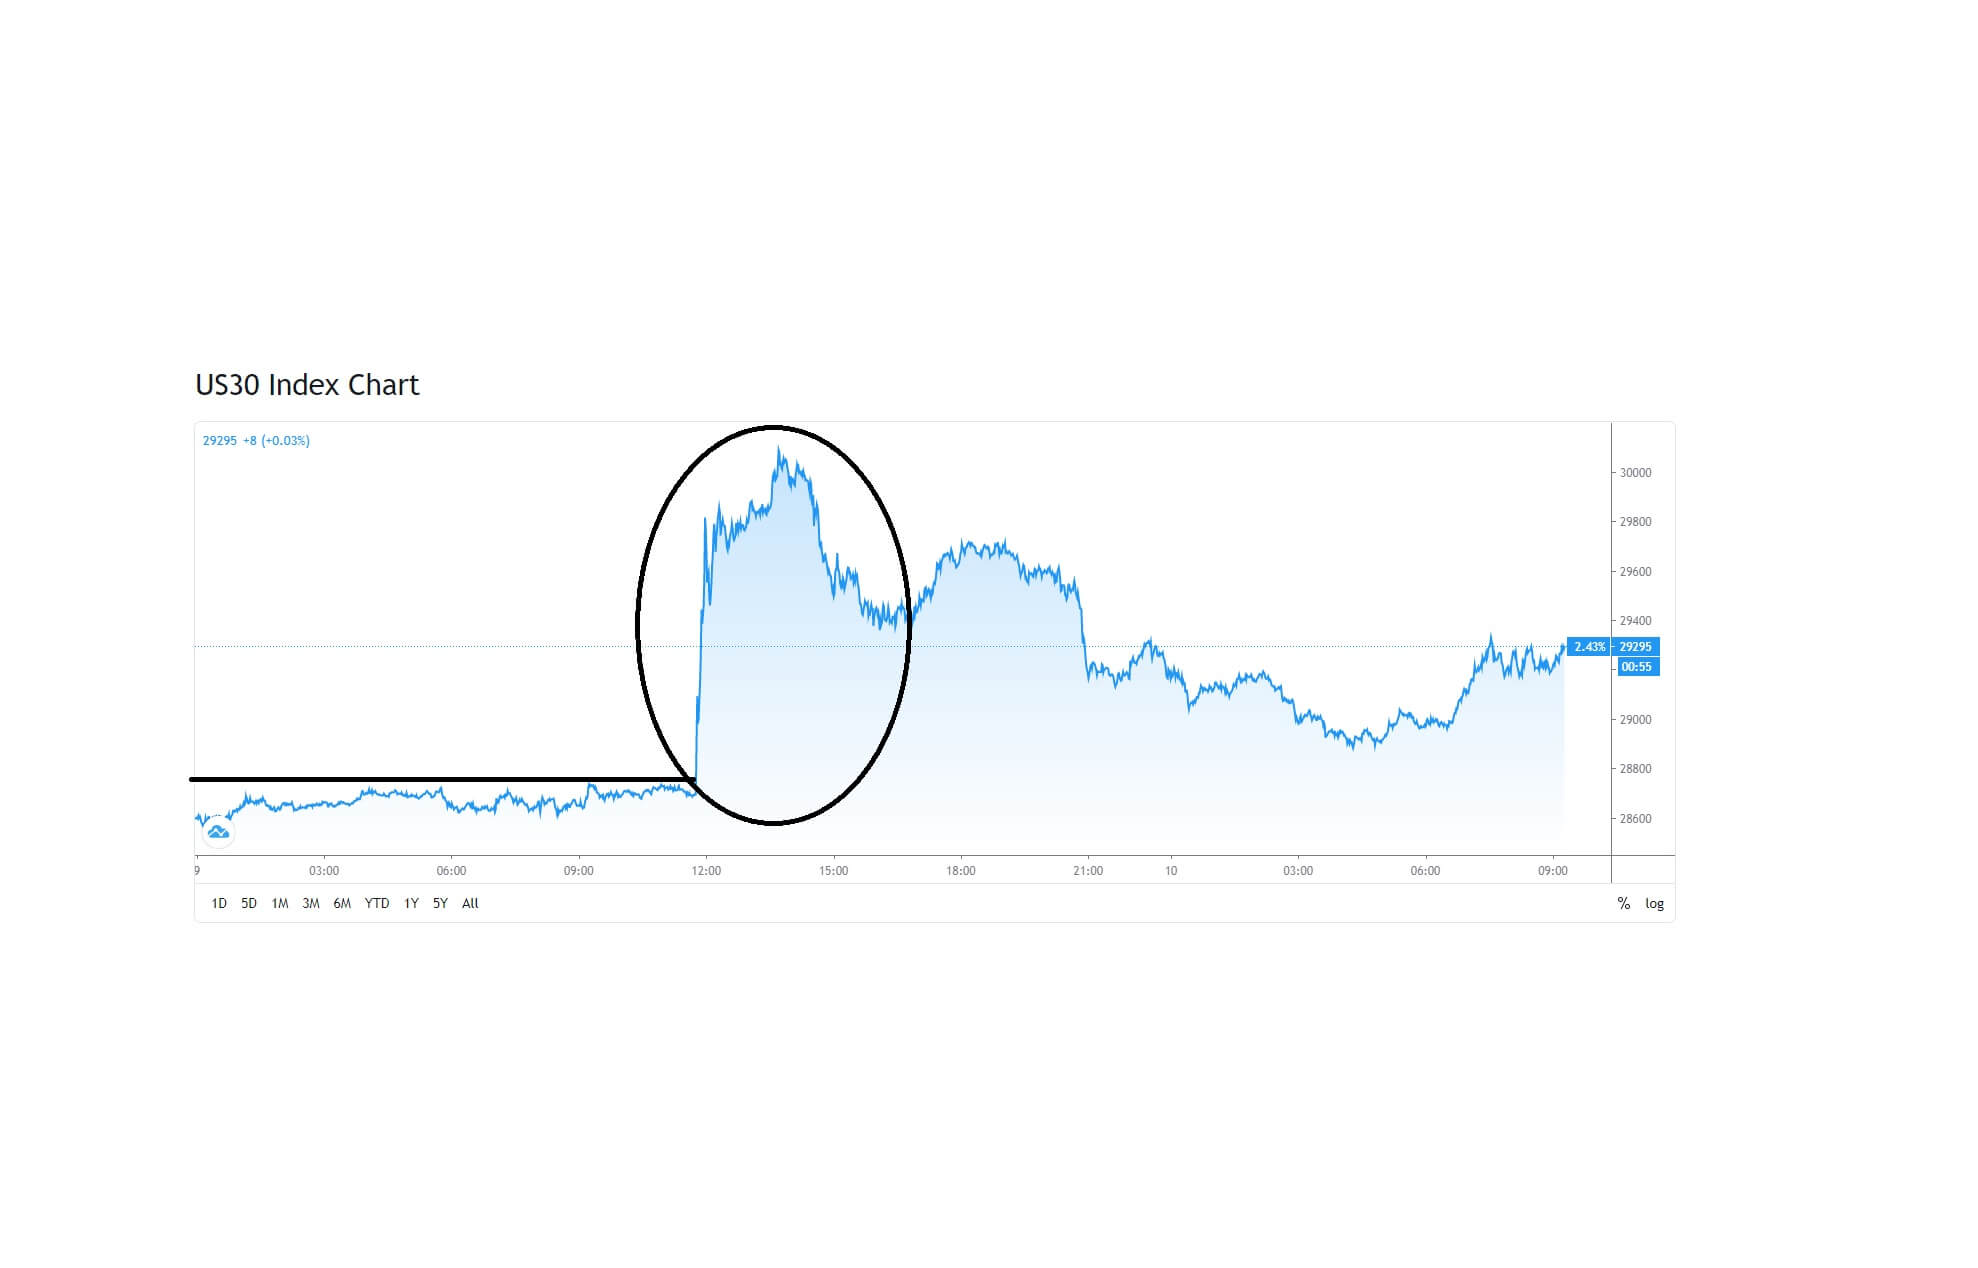
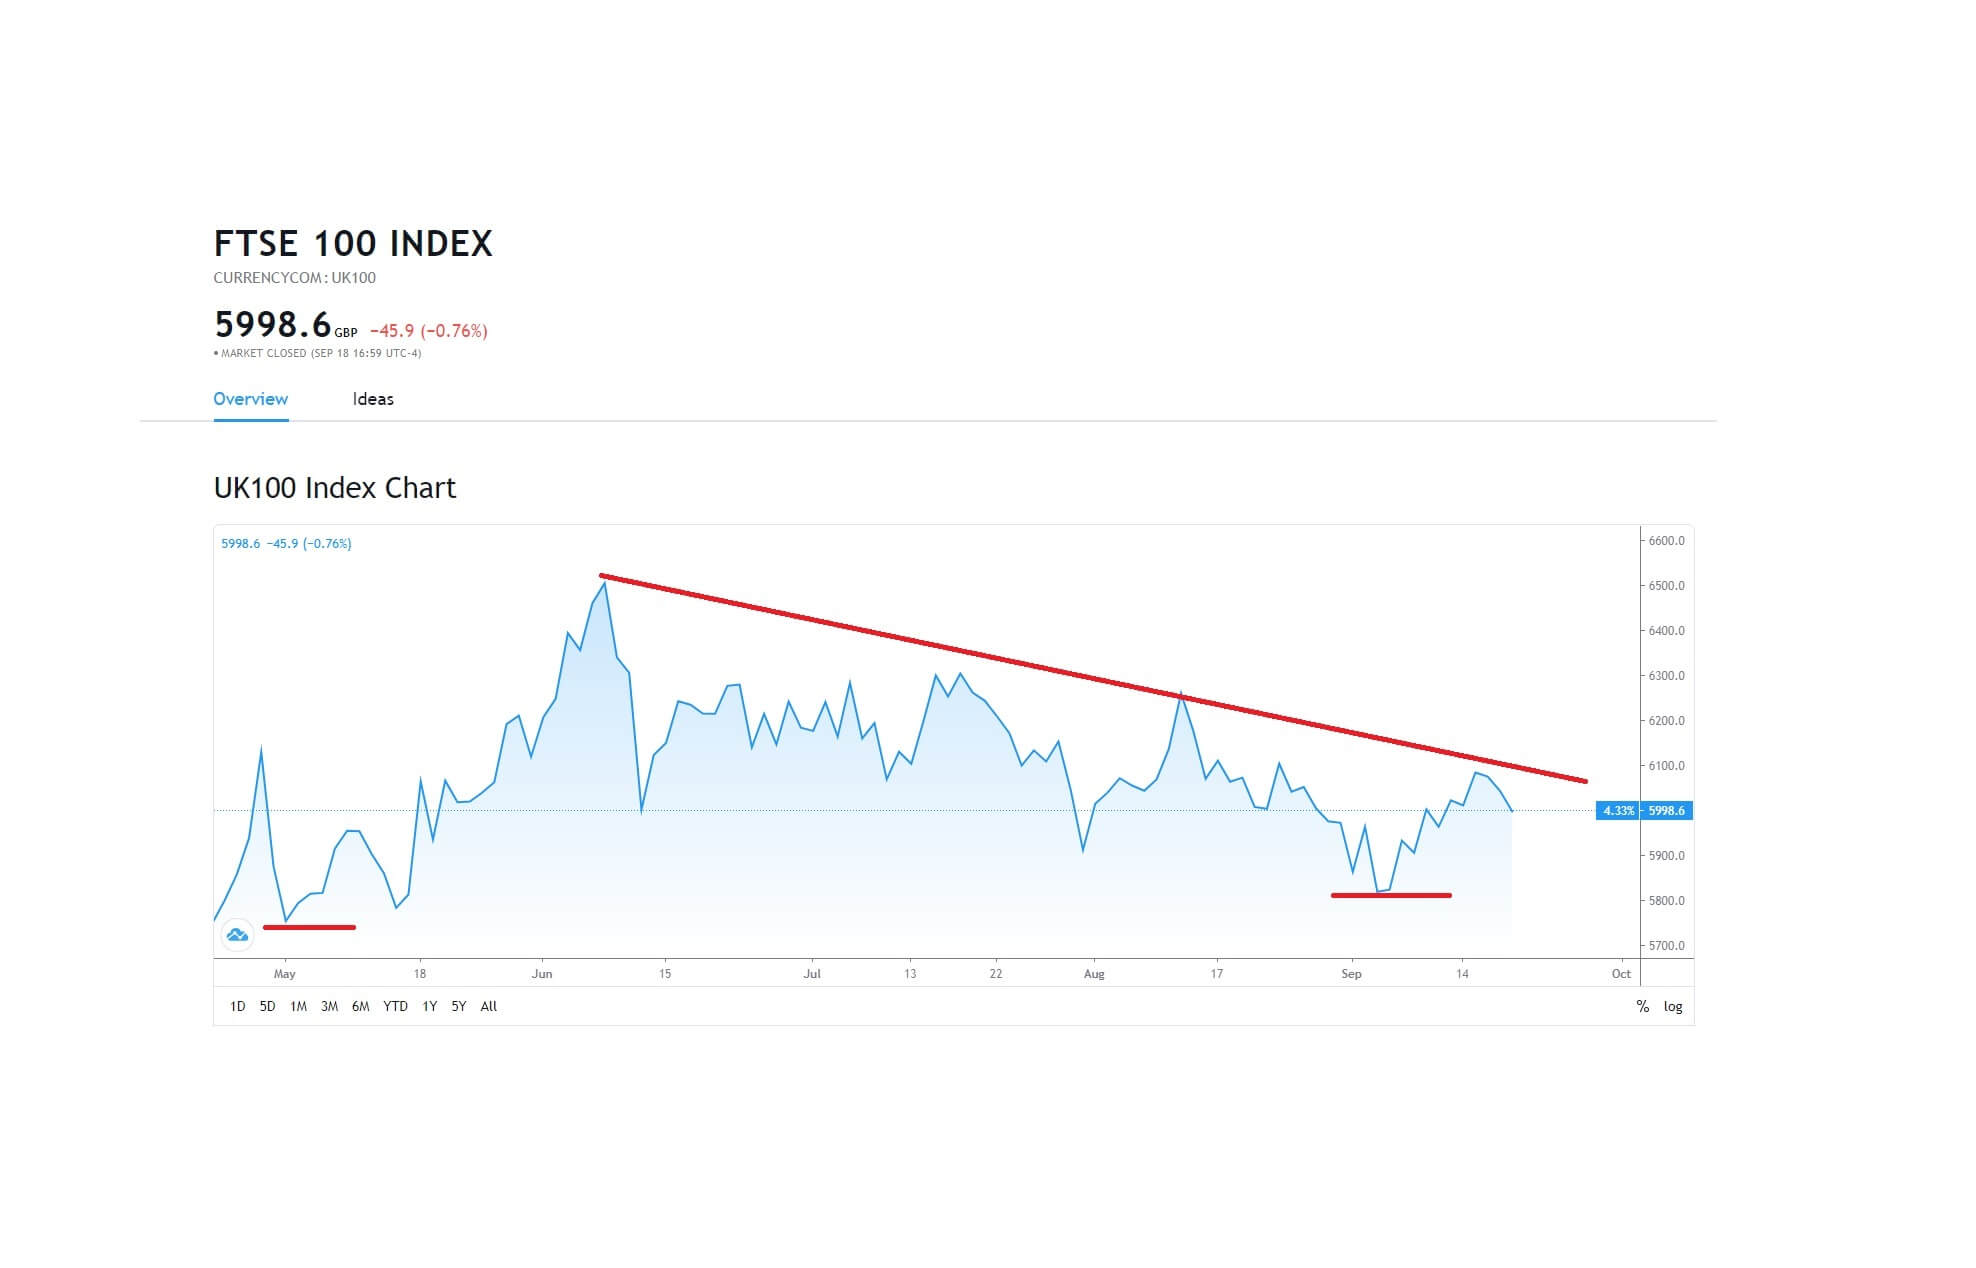
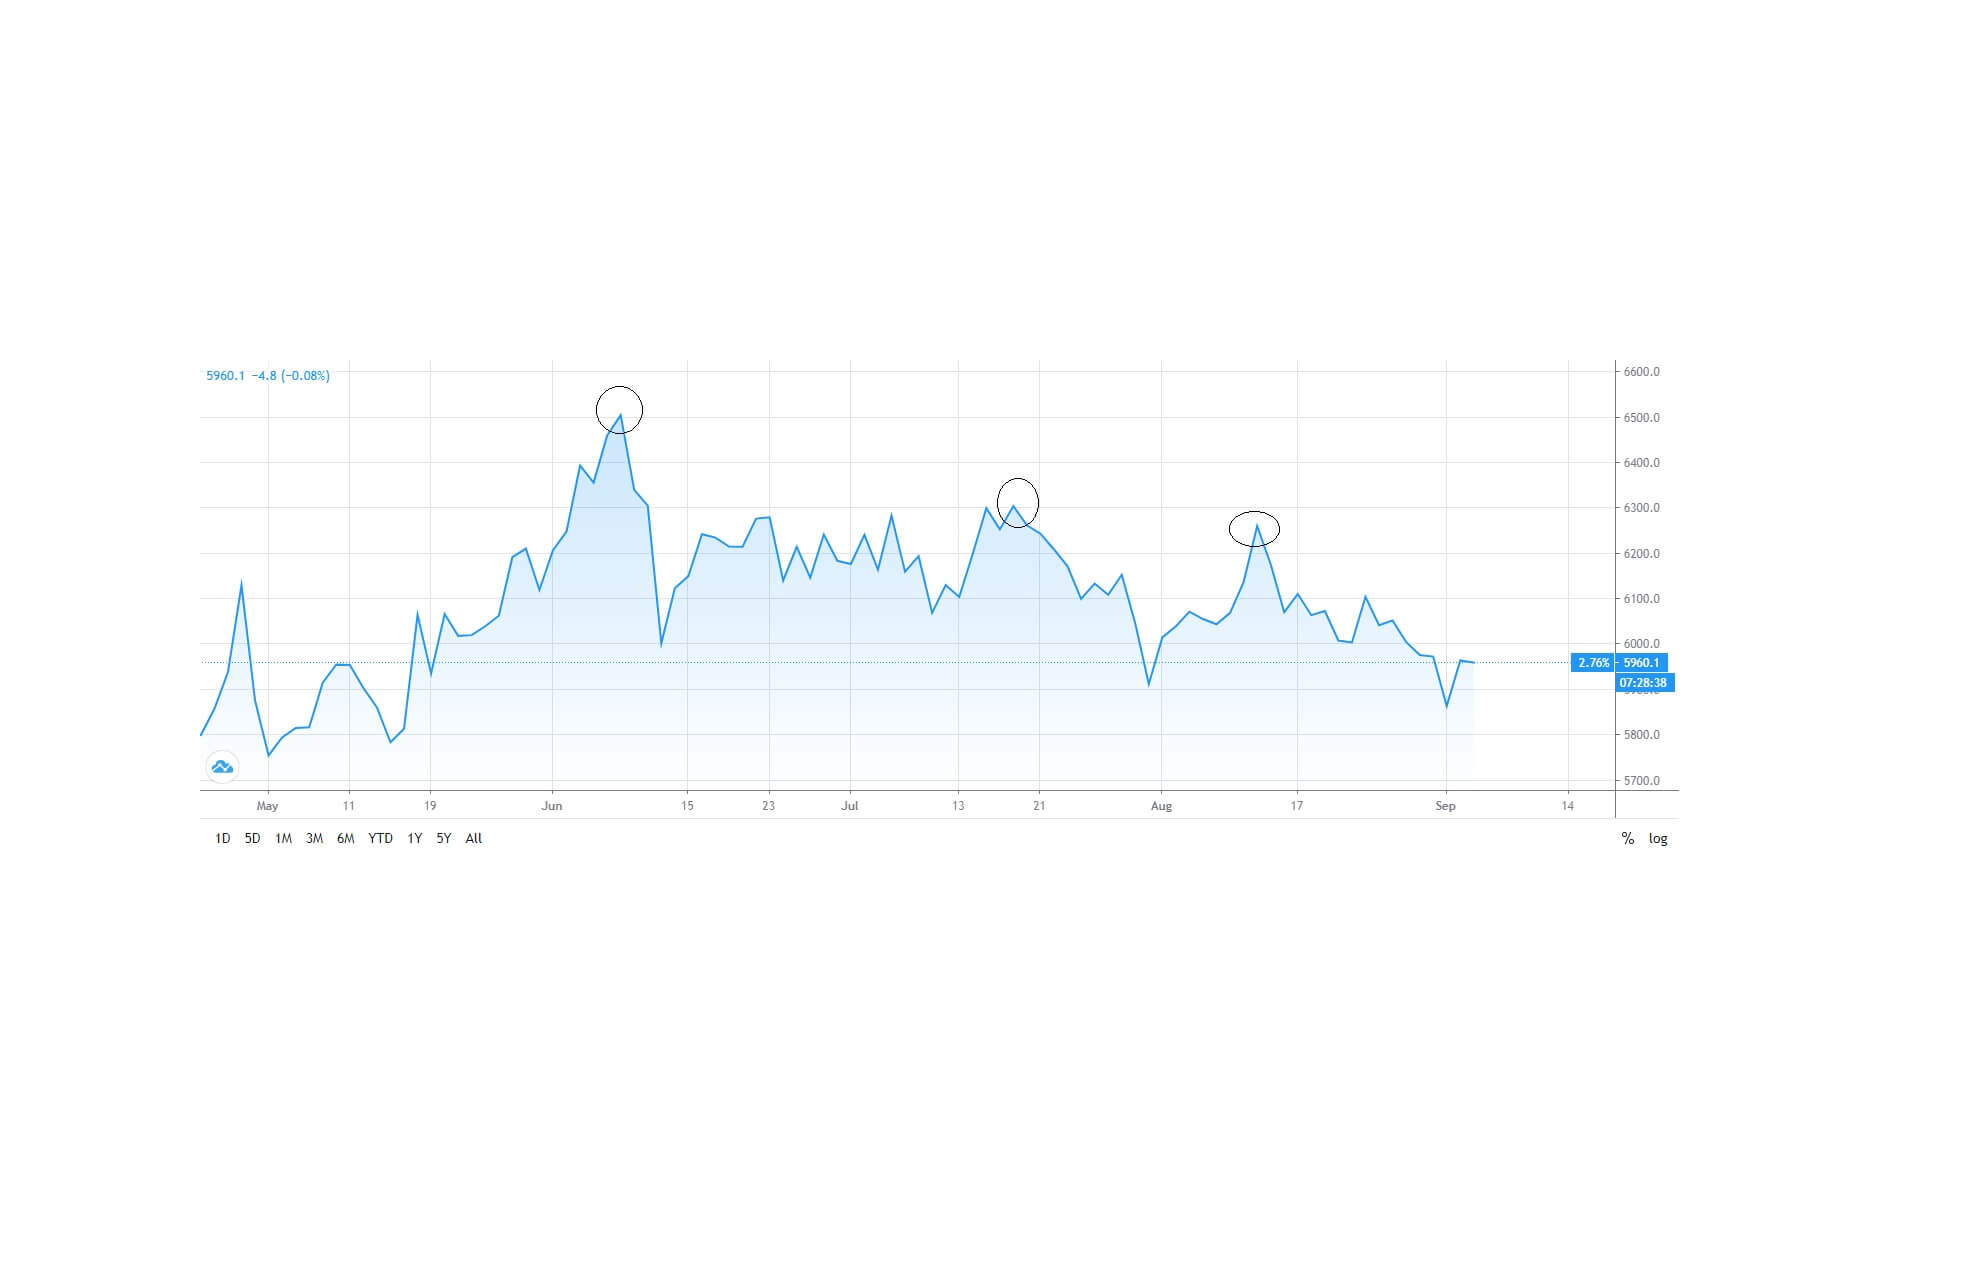
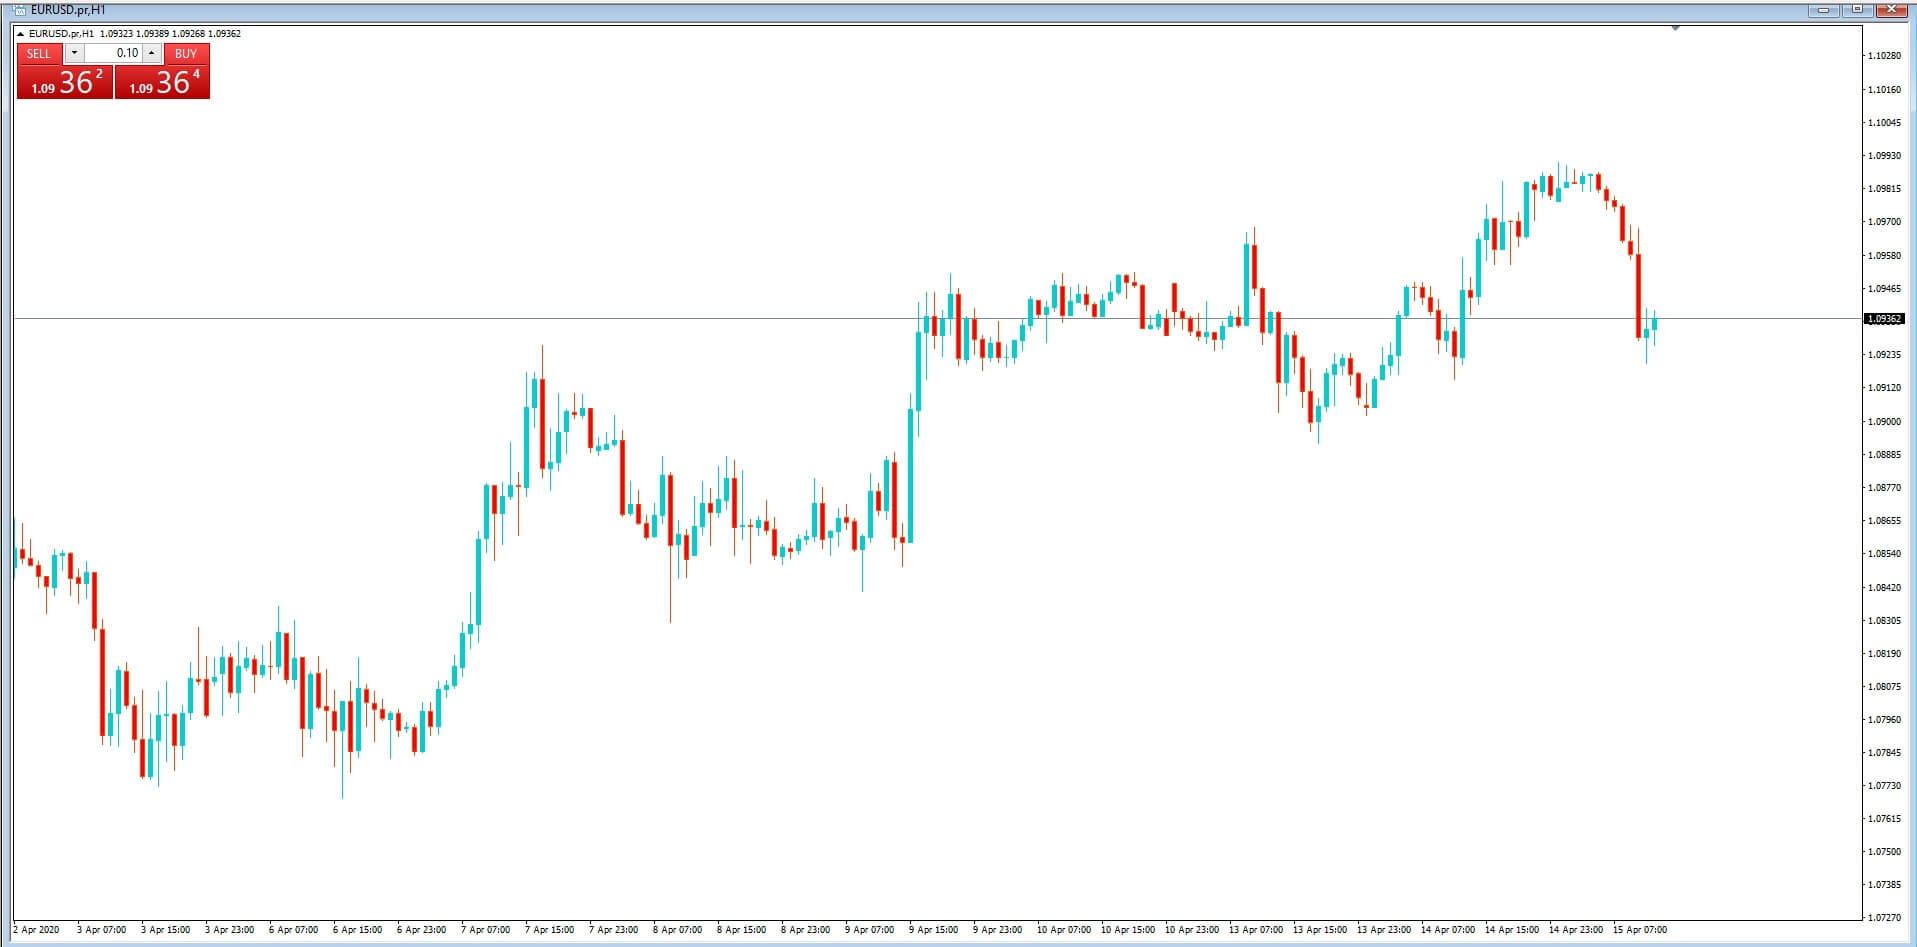
They flip flop from one chart to another looking for the opportunity which will give them a chance to bag a couple of hundred pips

without fully appreciating all of the dynamics involved in technical analysis.
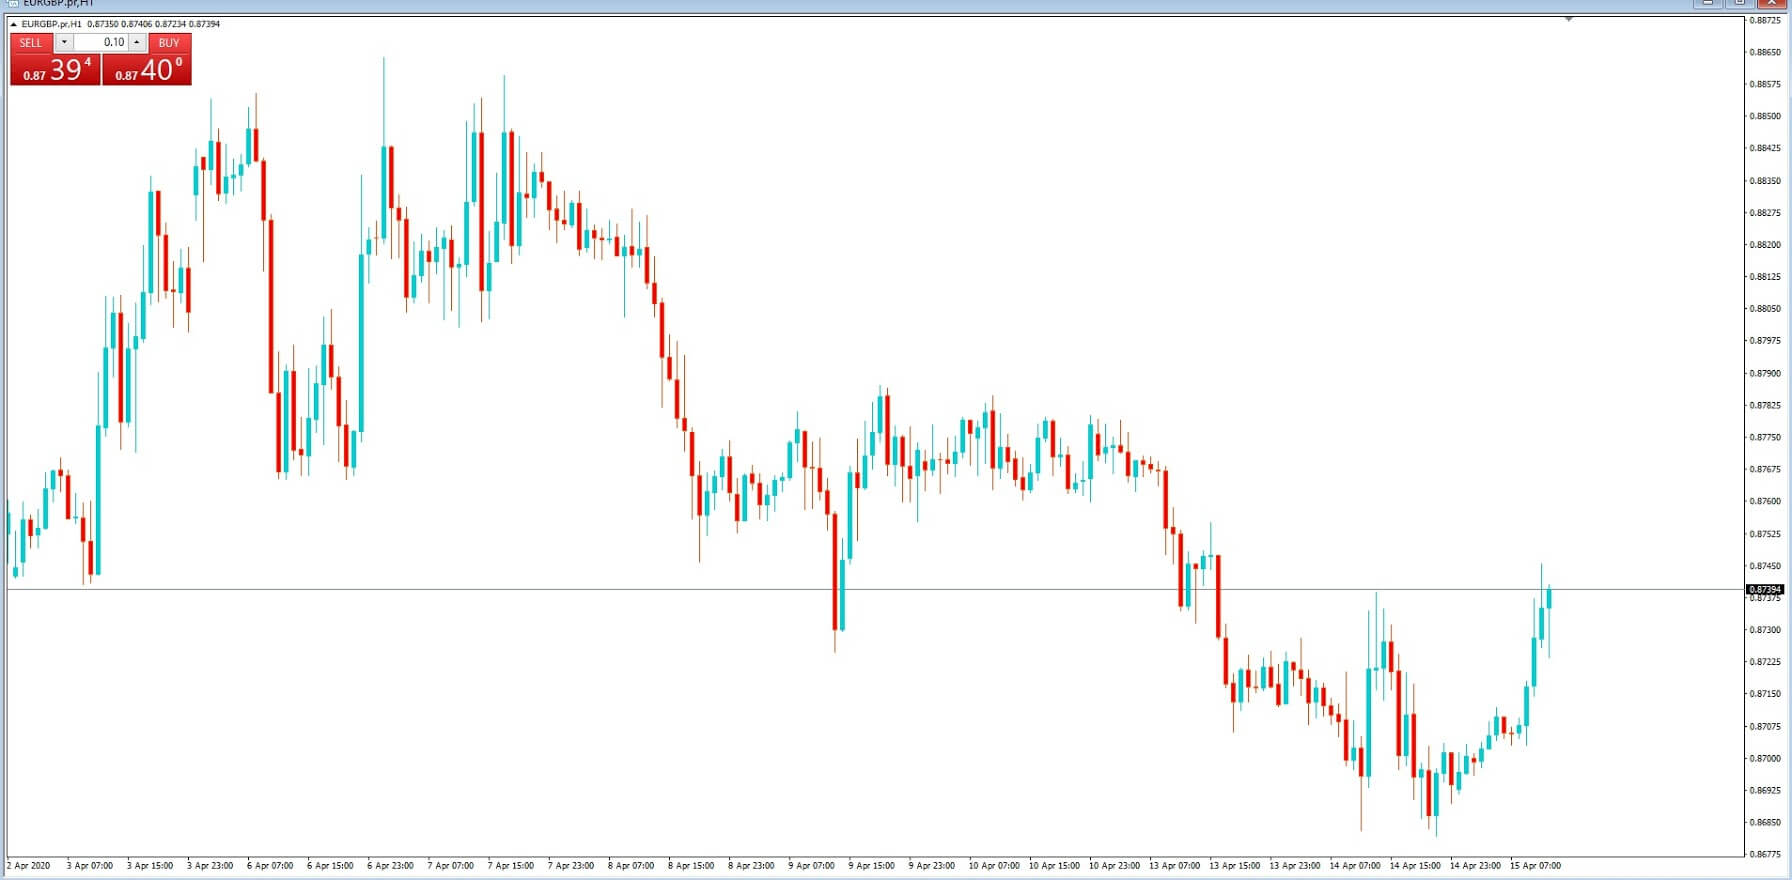
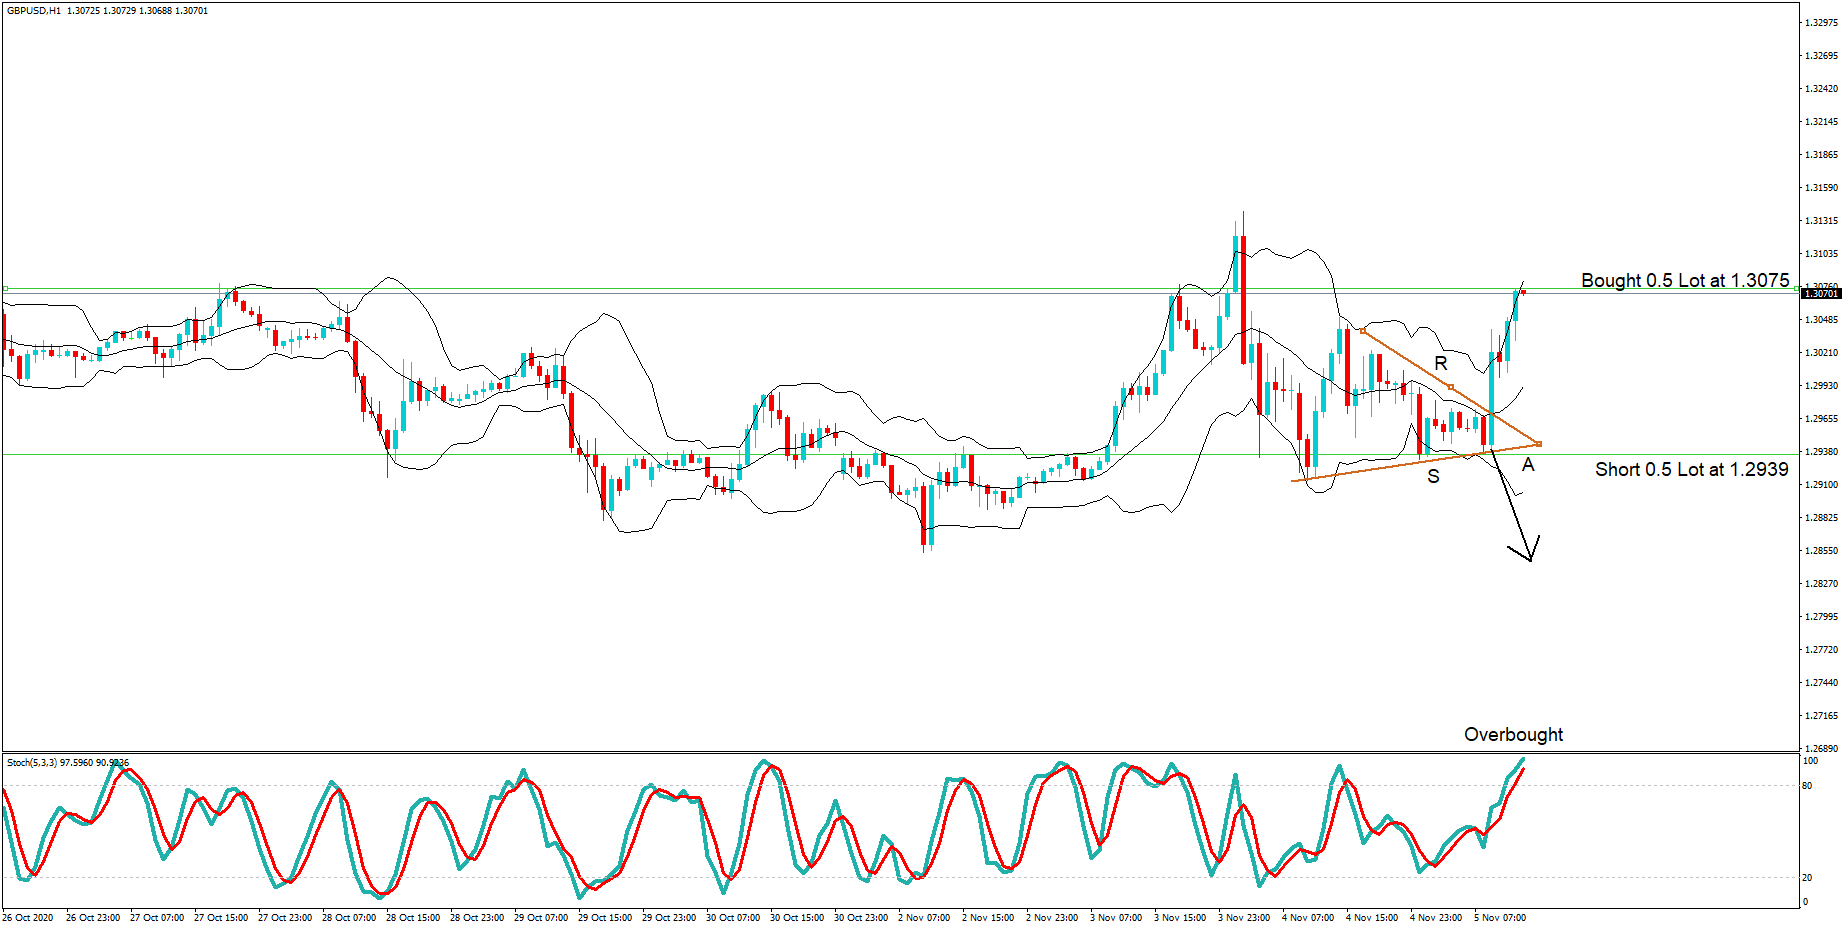
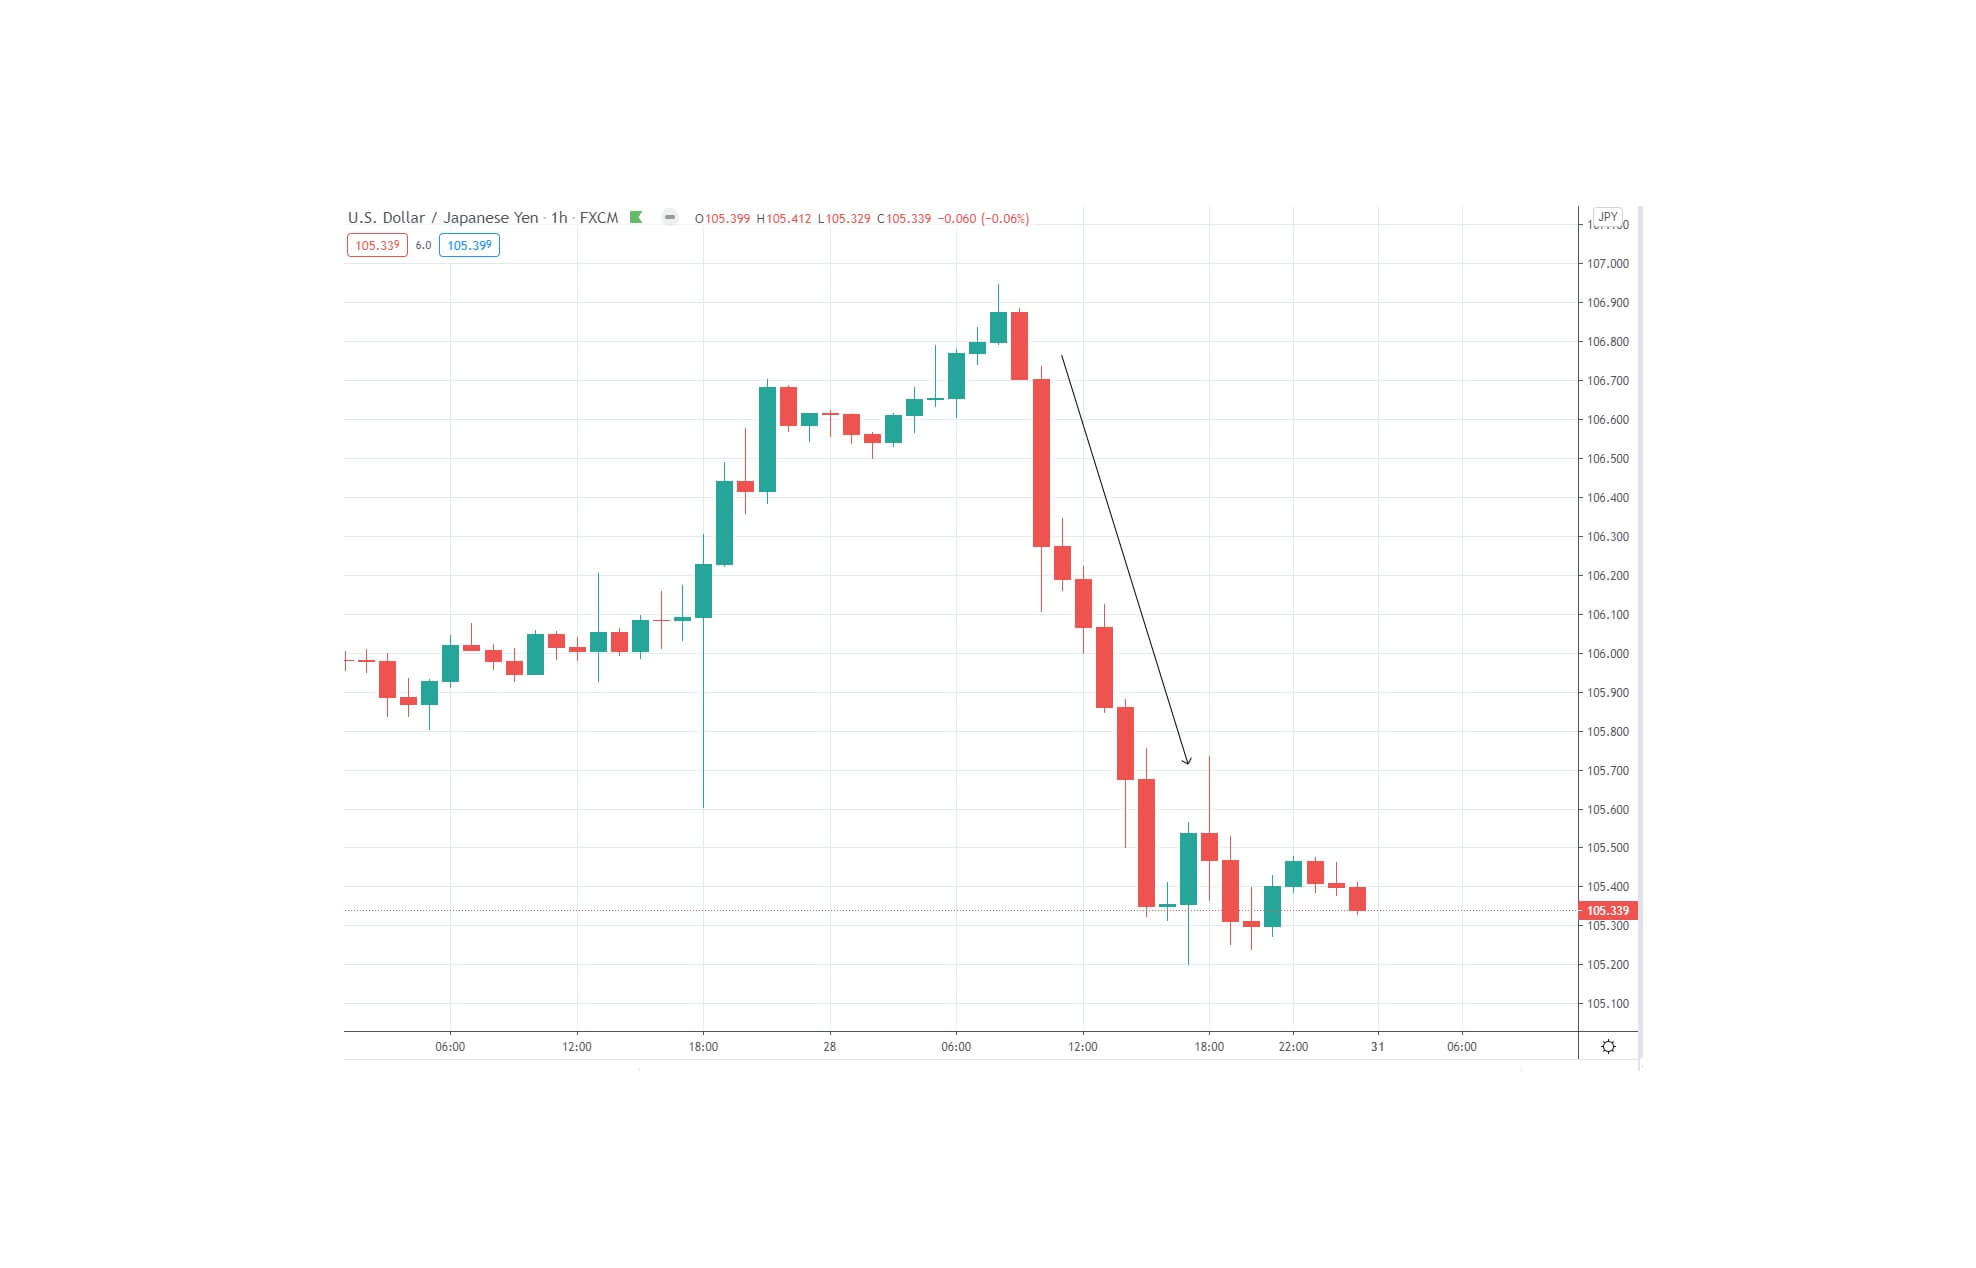
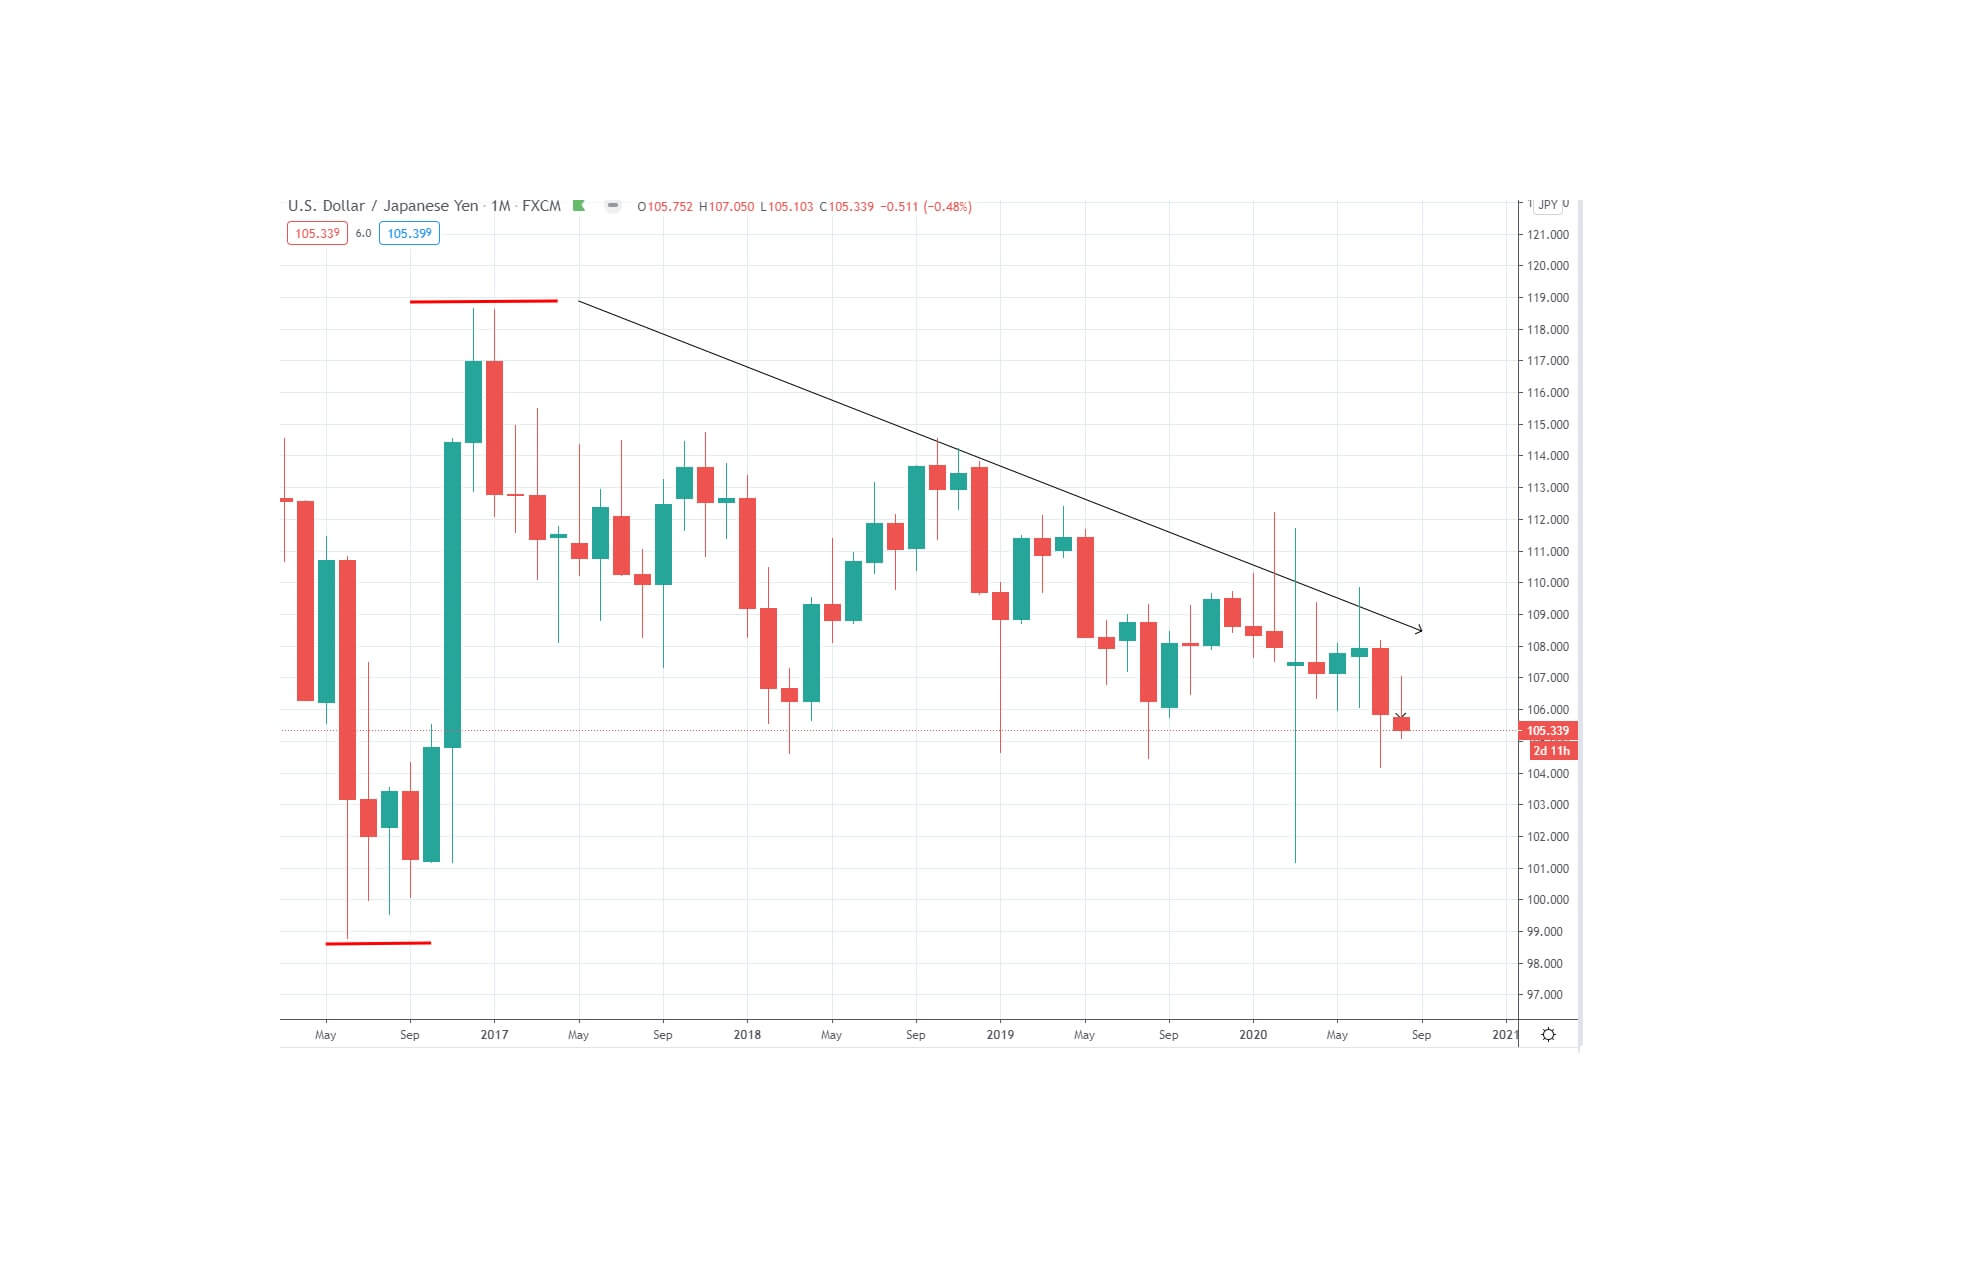
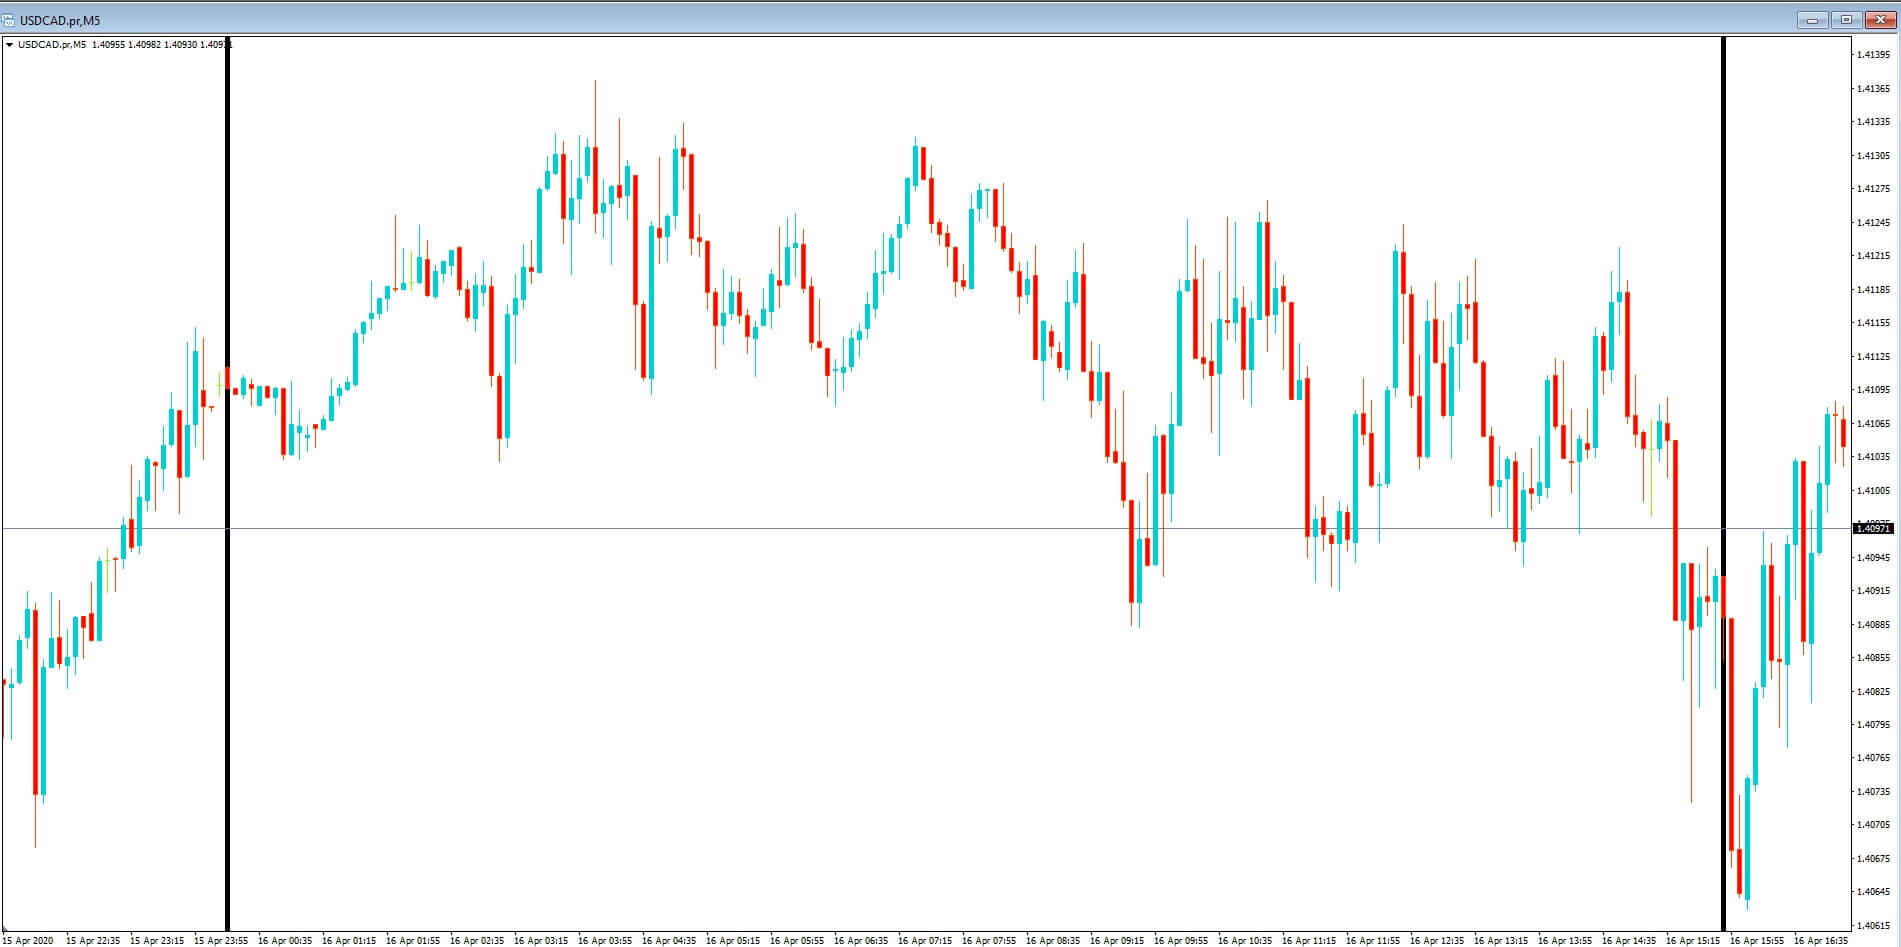
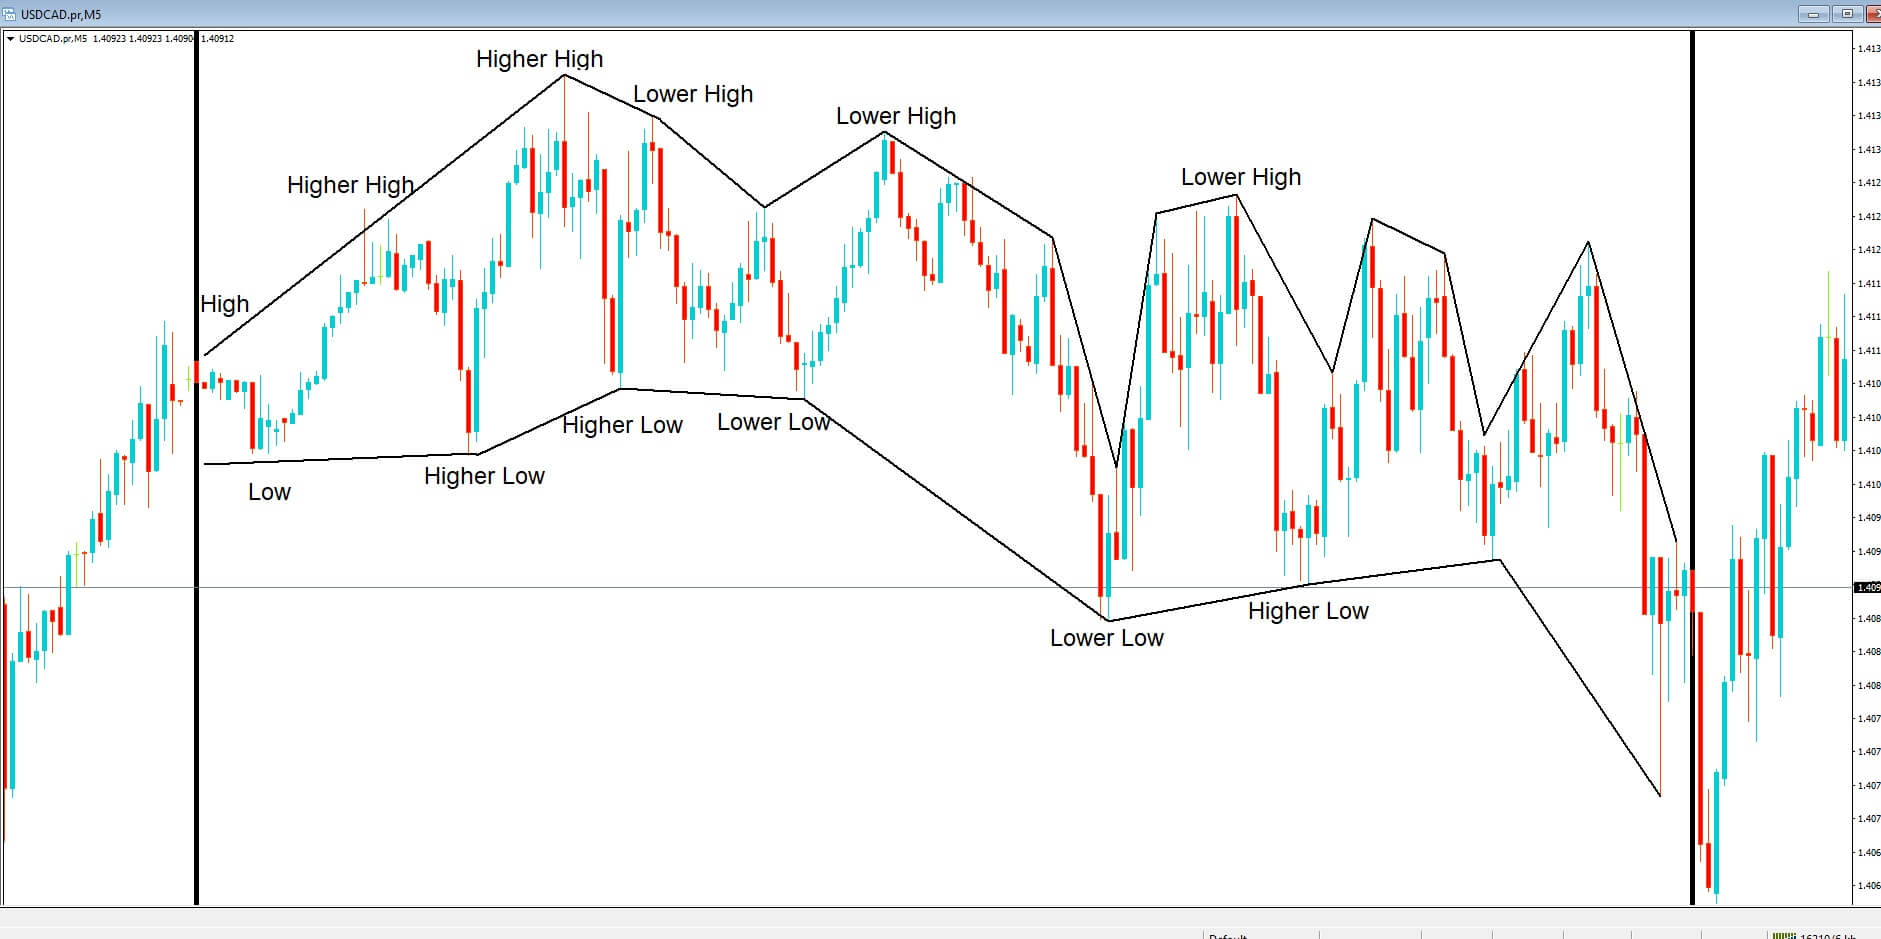
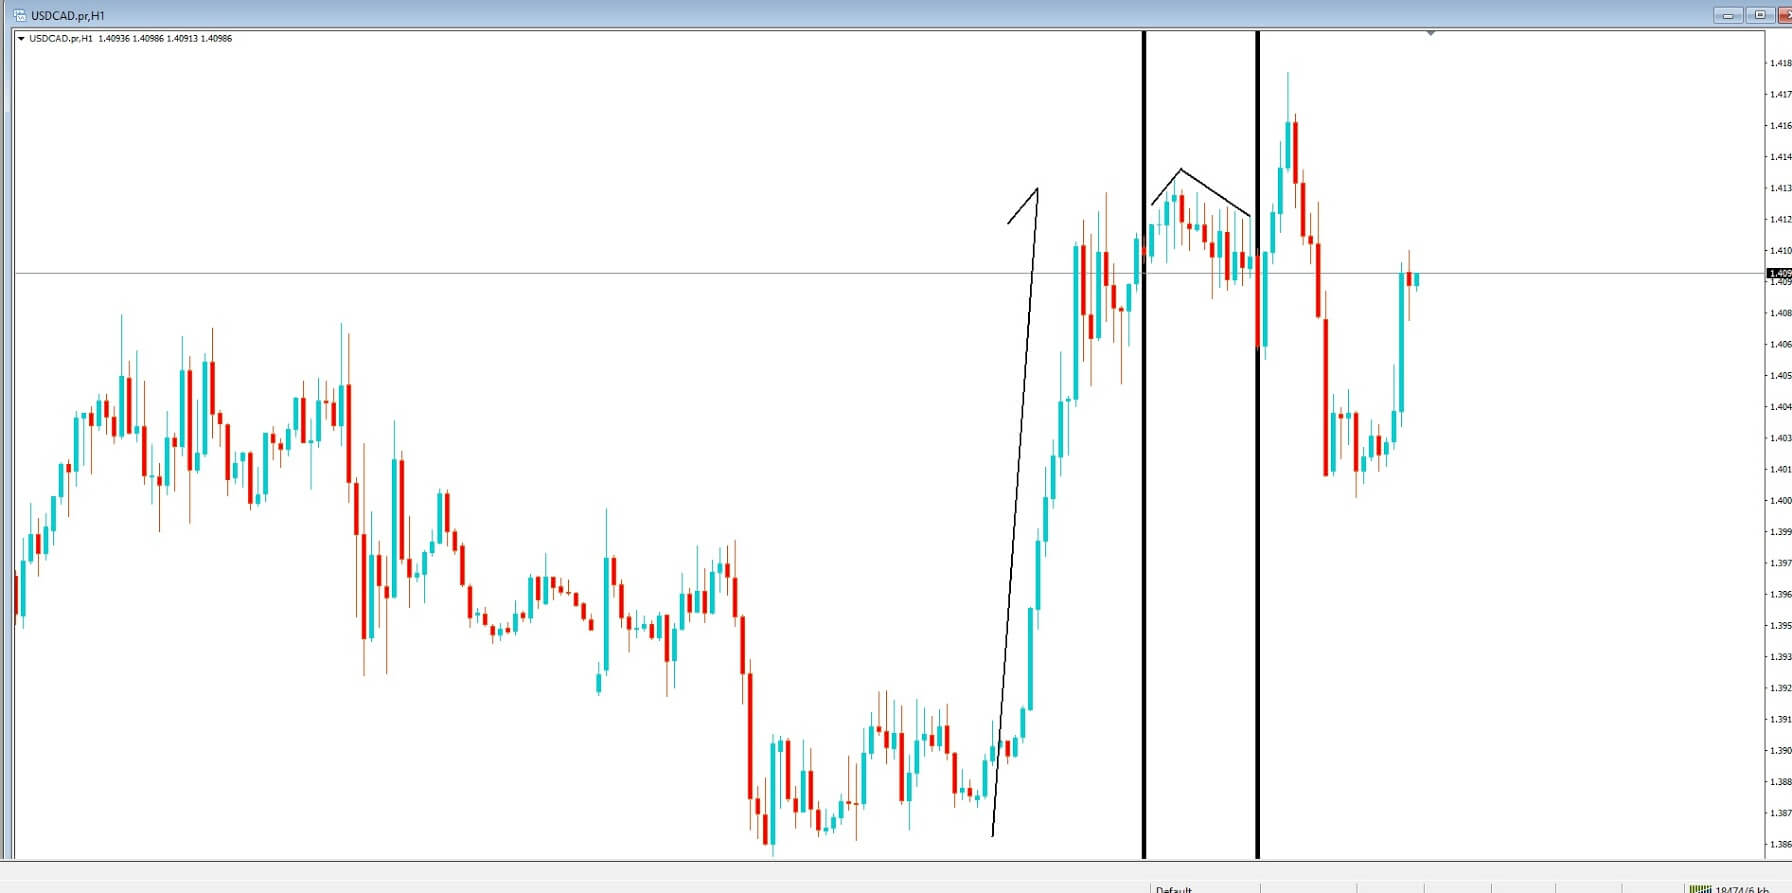
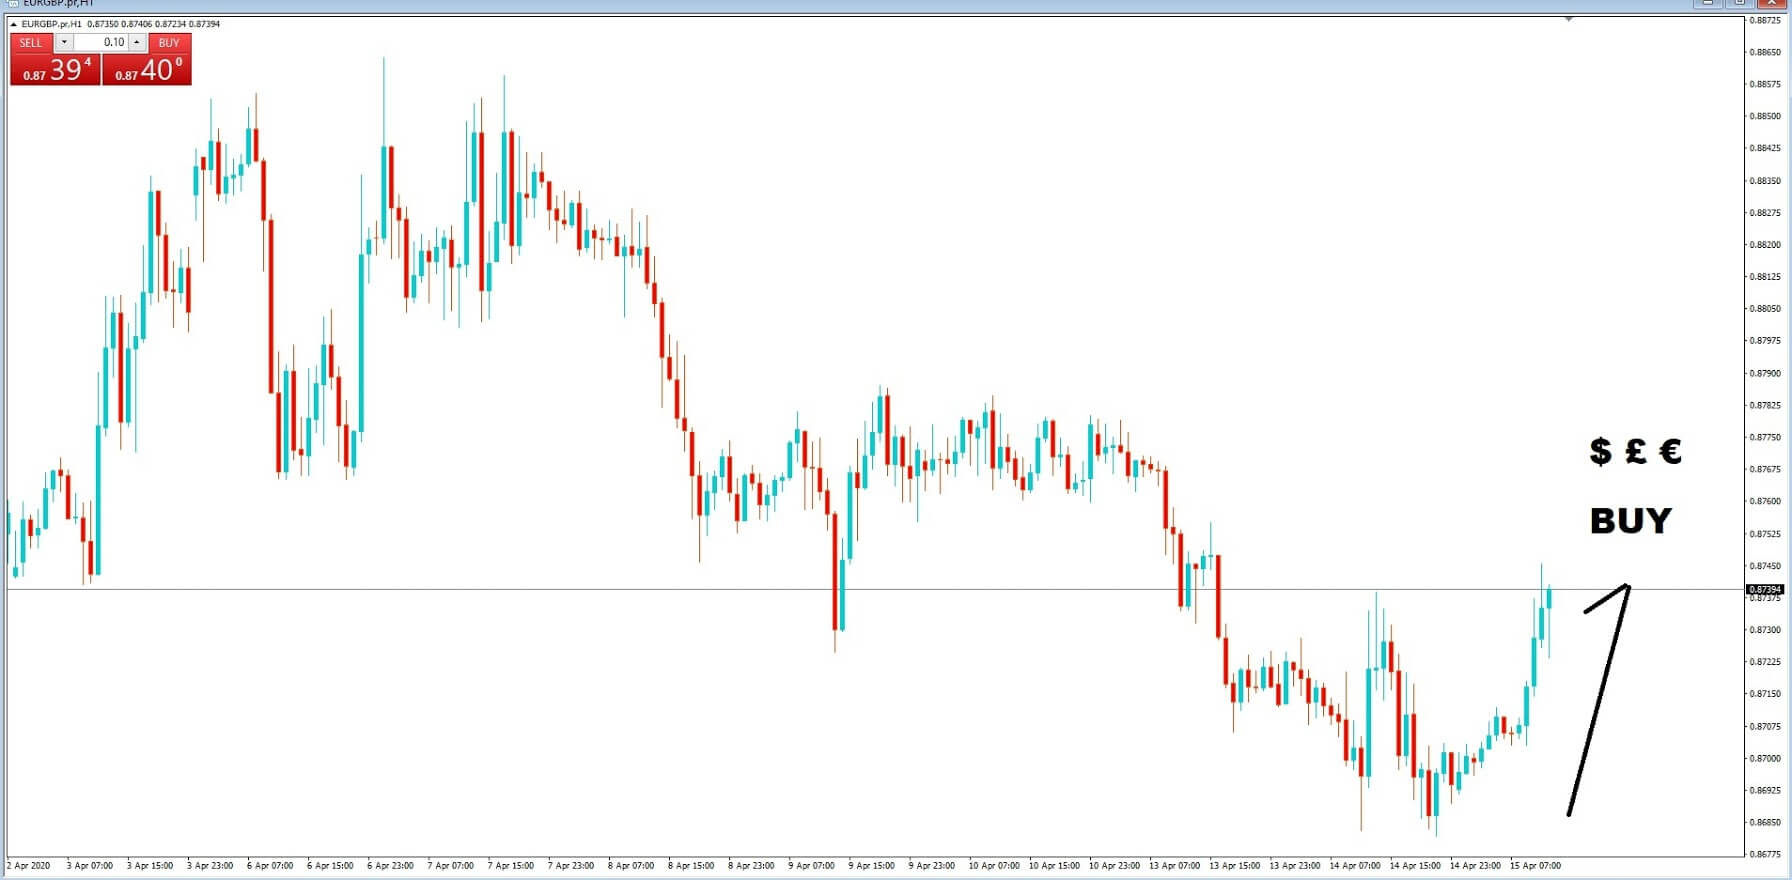
They think they spot a trend and jump right in and execute a trade, thinking only of the money they could make. They often make the mistake of buying at the top of the market or selling at the bottom. Think they may have spotted a trend, and perhaps they have, or it might be that some news has just come out, and they make a split second impulsive decision to buy or sell a currency pair simply based on what they’ve seen or heard.
And although they may indeed have spotted a nice trend, it could be that that trend is about to stop dead in its tracks and about to turn.
Such traders will not even bother to implement the most basic of technical analysis. It’s trading on a wing and a prayer and is tantamount to gambling.
No matter how much you think or believe that a currency pair may or may be trending, in any given direction, do not execute a trade until you have backed up your theory with tried and tested technical analysis methodology.

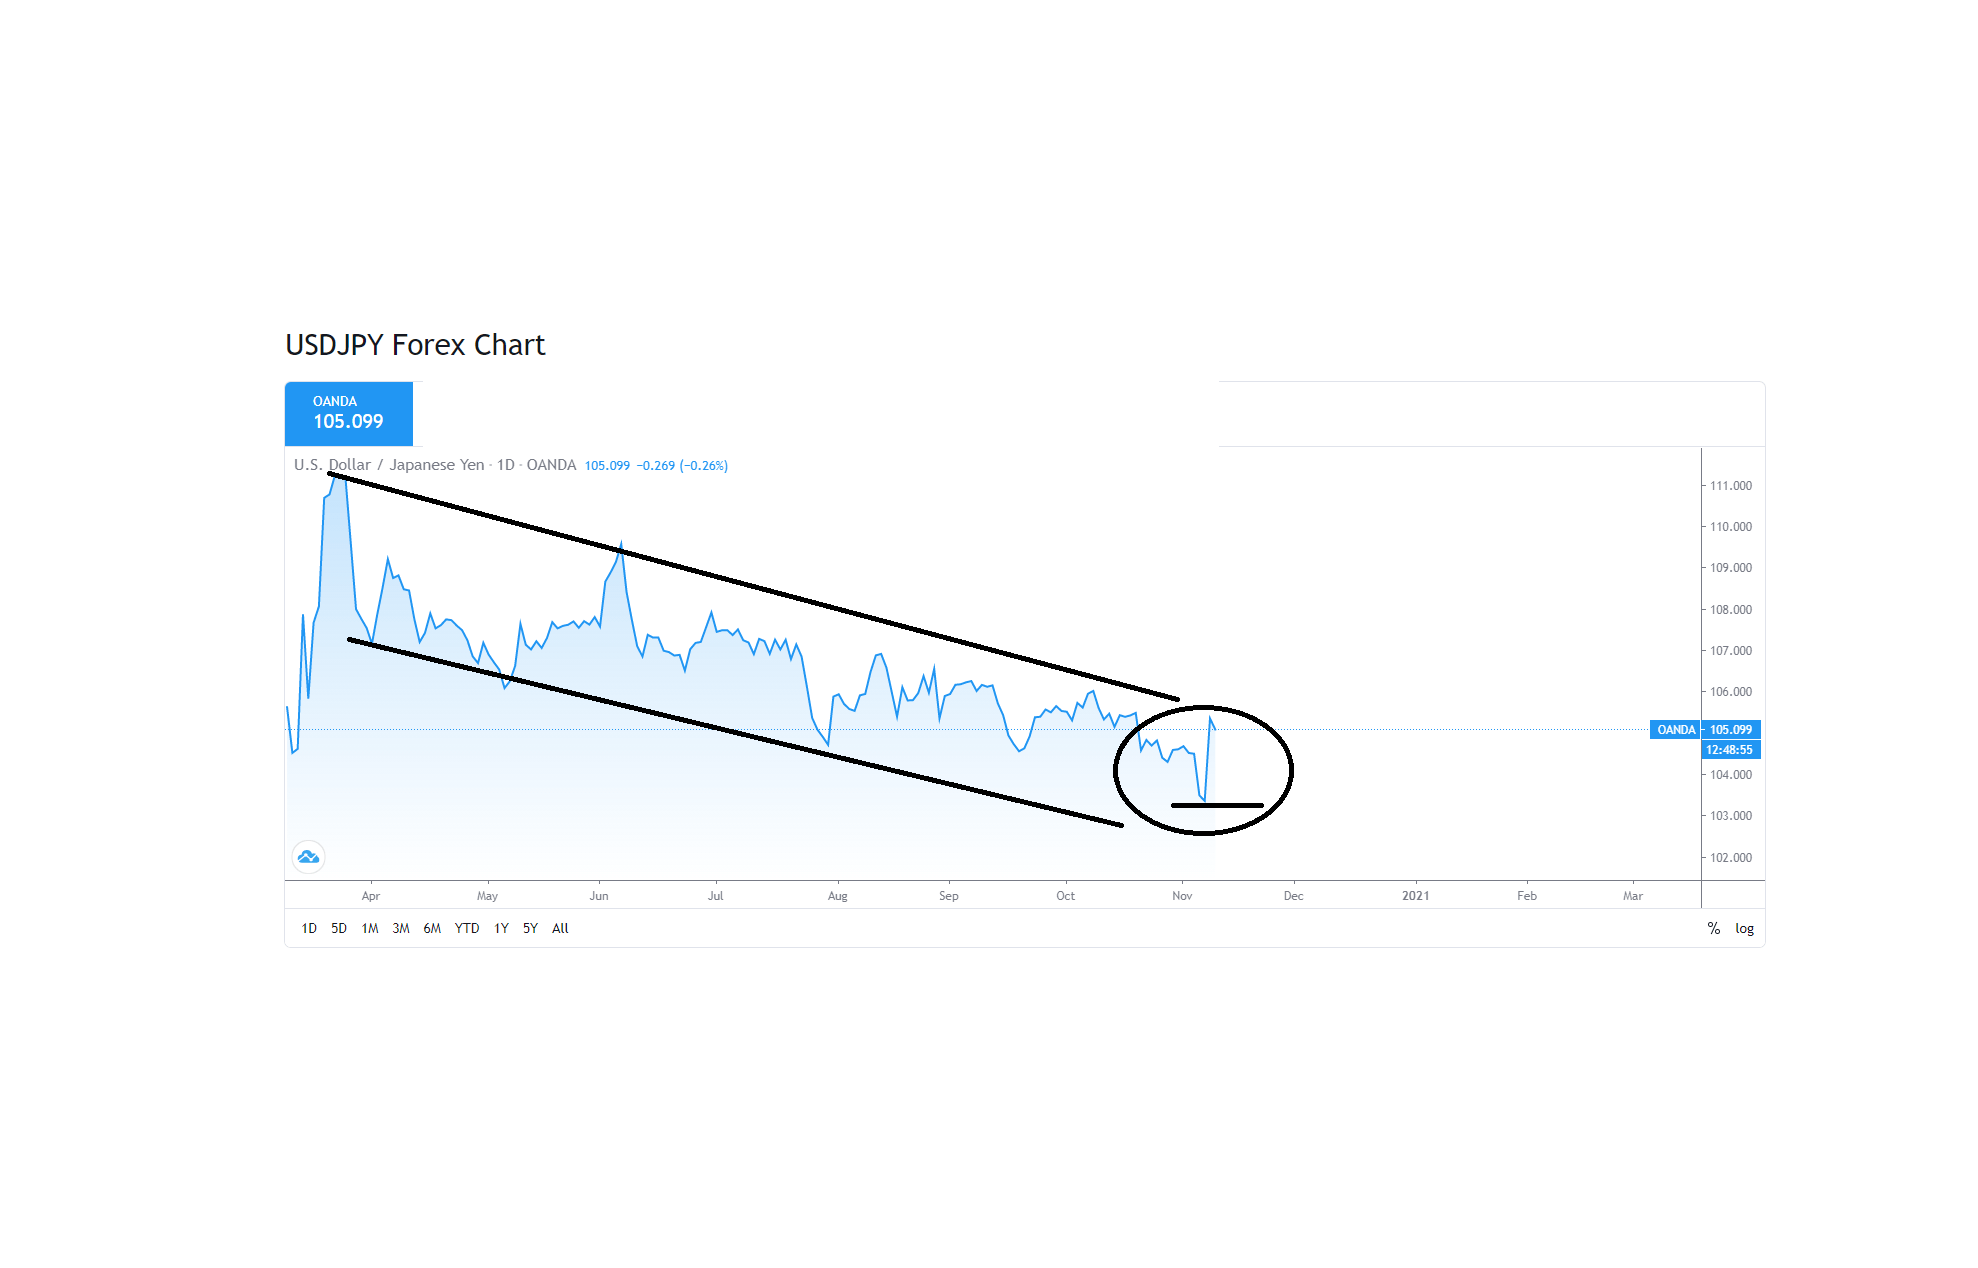
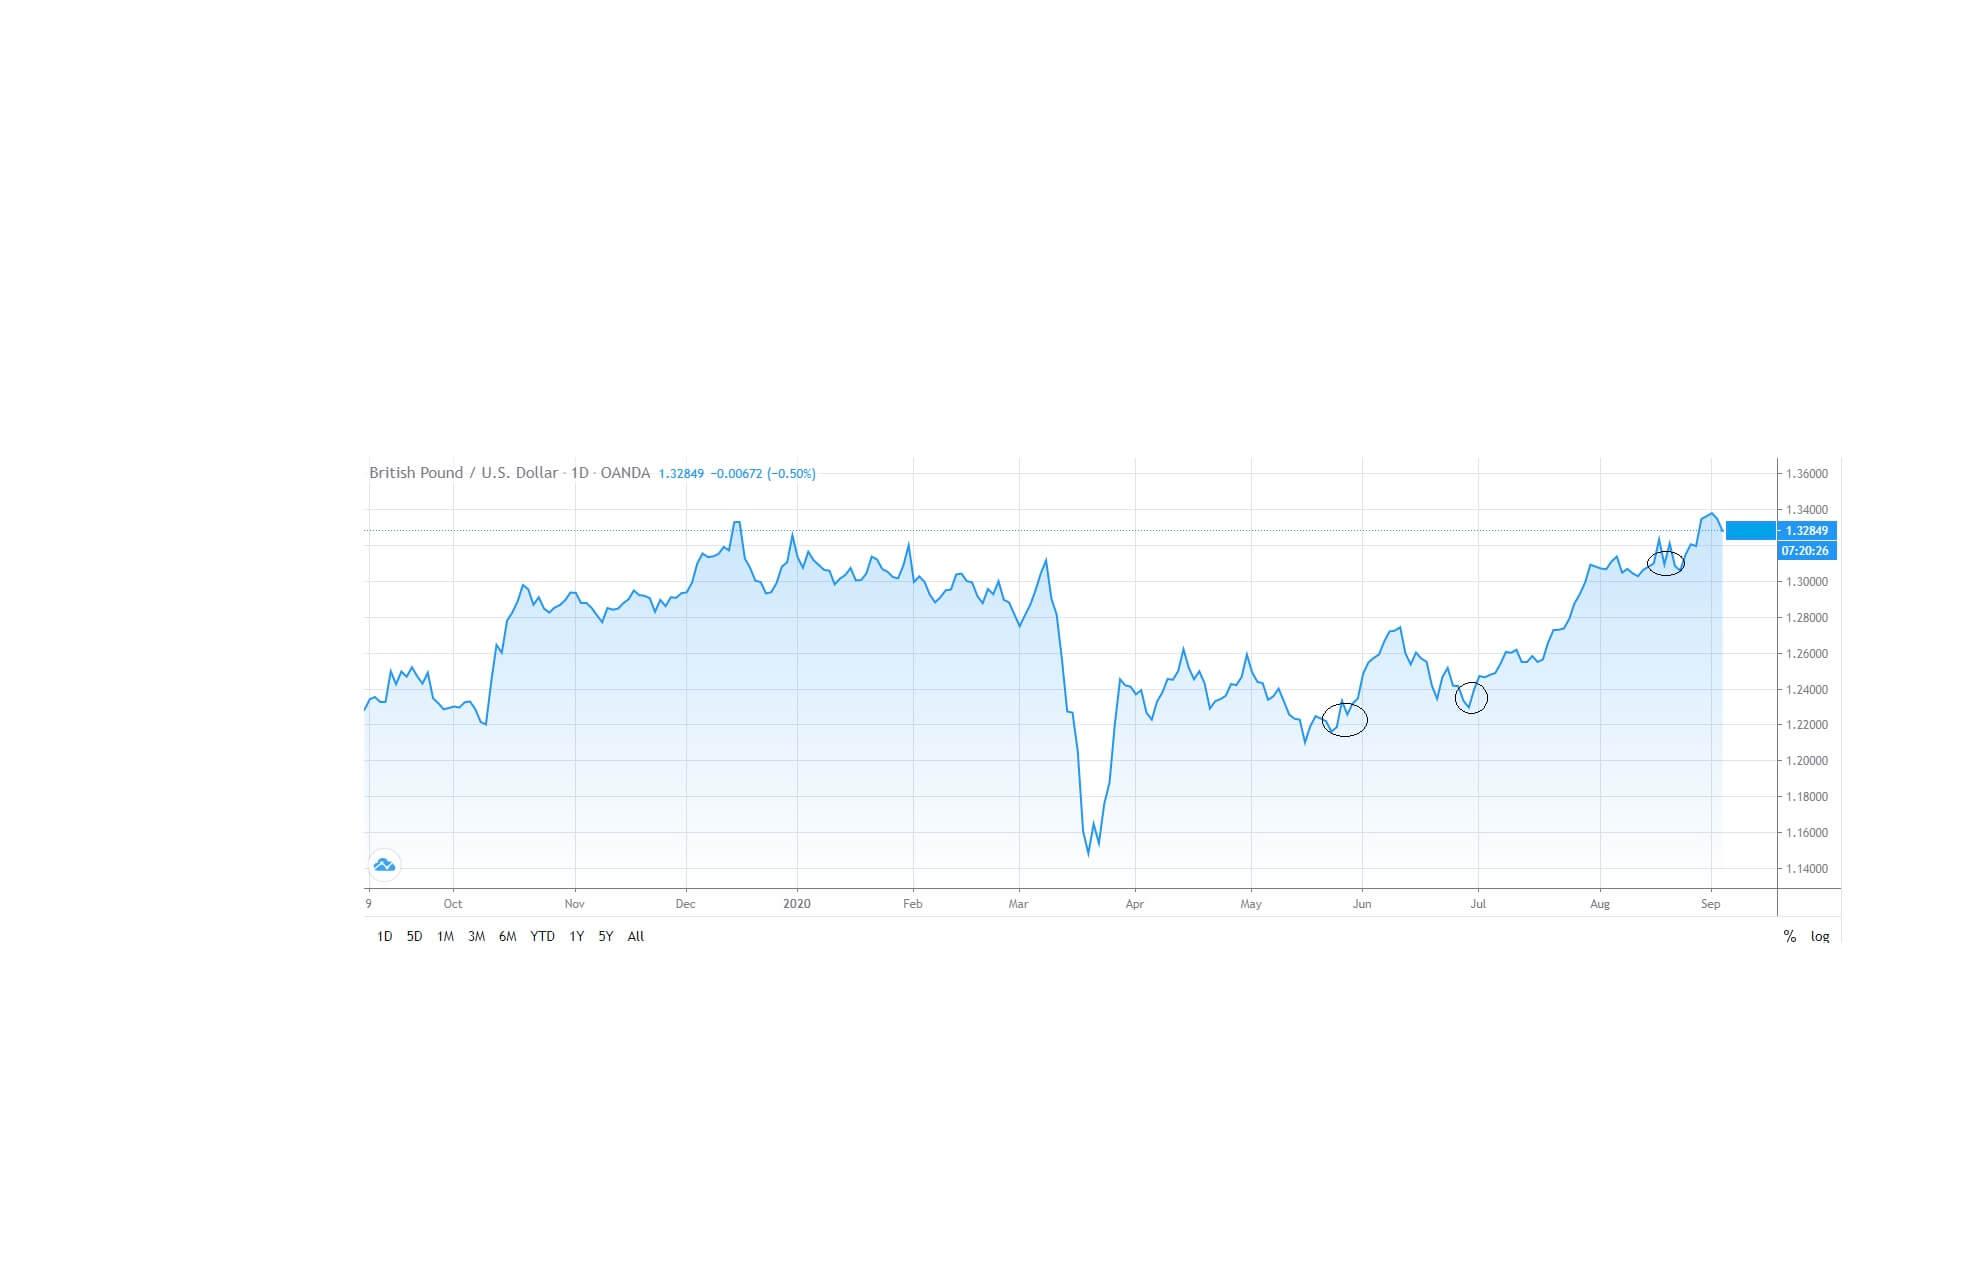
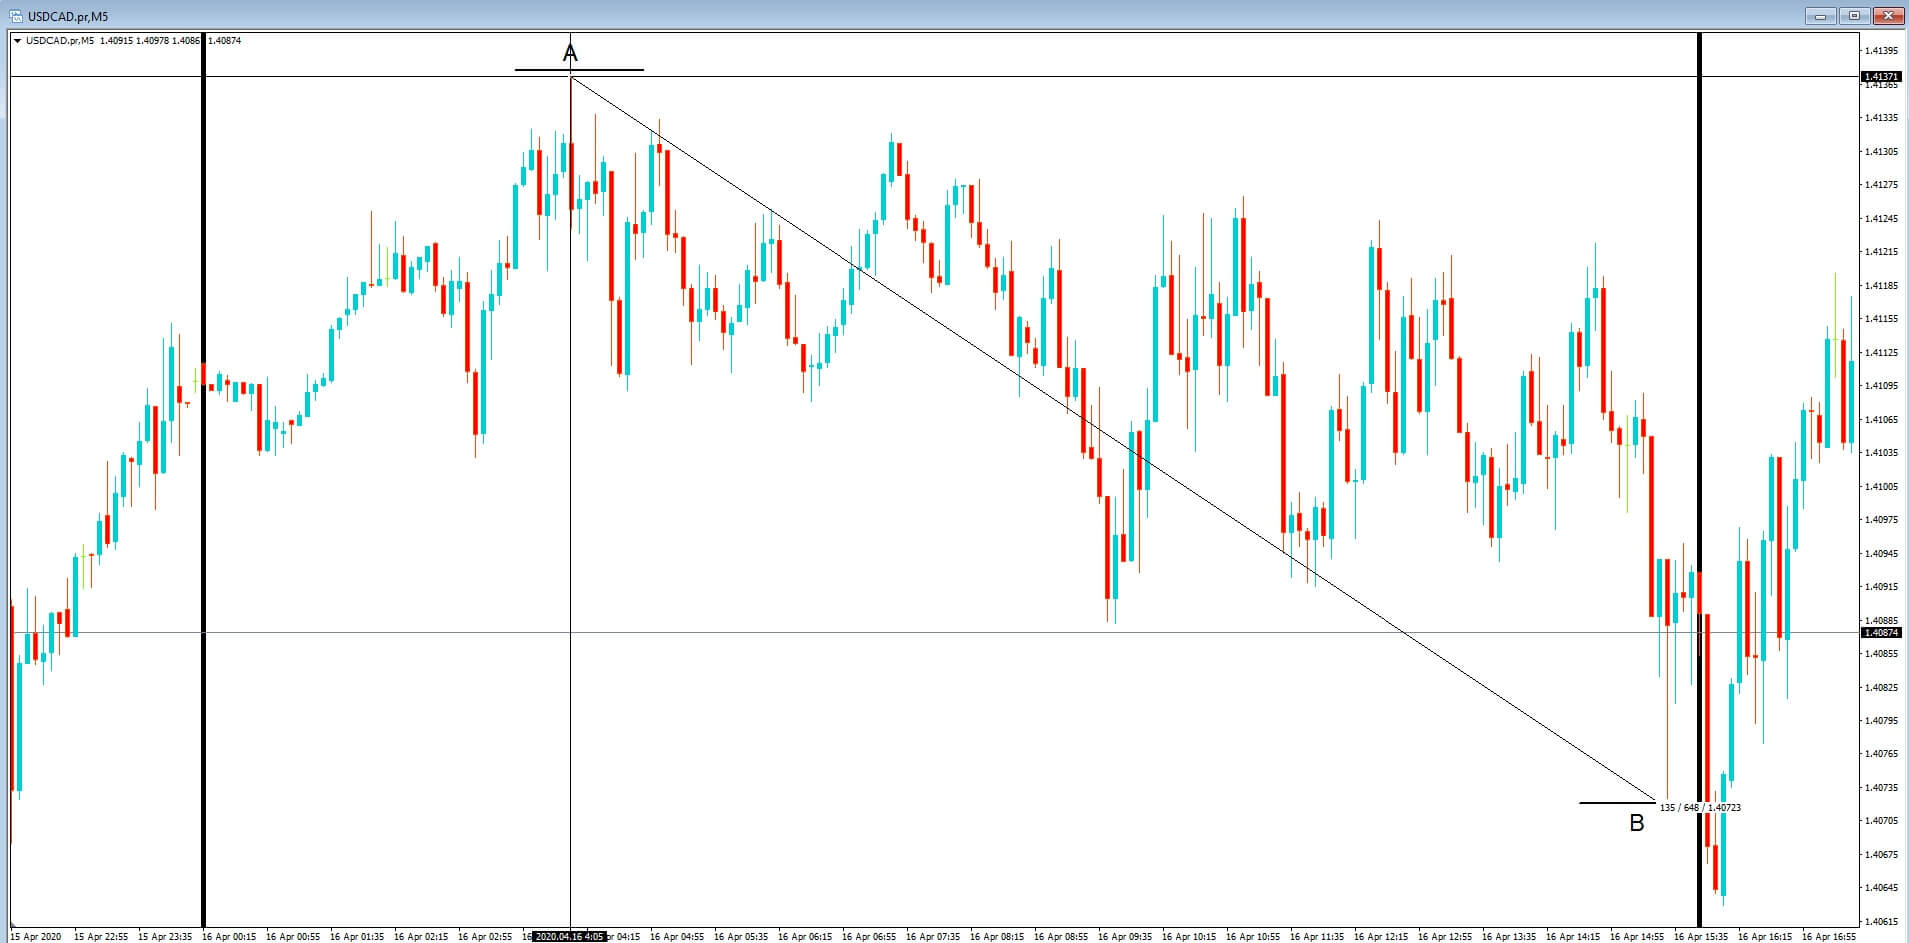
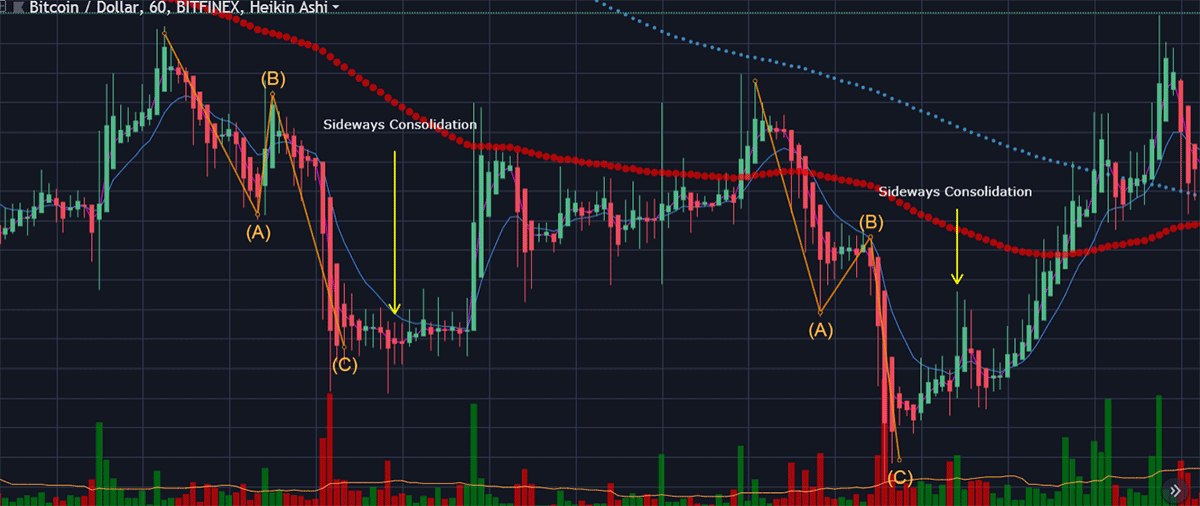
So when are trends likely to end? Why do trends finish reverse or go into periods of consolidation? Typically trends will start to fade and finish at the end of trading sessions, such at the end of the Asian, European or US sessions, where those traders had been buying or selling a pair based on their trading needs or beliefs pertaining to market conditions or possibly due to their balance sheet requirements or even because they are influenced due to their own country’s import and export requirements. They may have just seen a good trend and jumped on it, but when their session came to the end, they closed out their interest and took their profits.
Or it might be that they are rebalancing their portfolios by getting in and out of positions to cover market volatility in Risk on and Risk off scenarios. And where the sentiments of one session, which is ending may be completely different to the sentiment of those traders coming into a new session in a new country where they have their own various sets of requirements and beliefs about where currencies should be in relation to one another.
Of course, it could just be that trends fade for no apparent reason. It might come at the end of a 15- minute candlestick or an hourly or daily candle, which is enough to tip the balance and reverse a trend. Or it might be that a currency pair is deemed to be overbought or oversold due to technical analysis. Impending economic data releases is also another time when trains can stop for no apparent reason, or around the times when key policymakers are due to make policy statements or speeches.

One critical mistake is where traders will hop on a trend, which is absolutely great if they have done their homework and all the above mitigating circumstances are taken into consideration, but may not have factored in that perhaps a currency pair has already moved a couple of hundred pips in which case it is

quite dangerous to jump on and expect that trend to continue without some kind of pullback.
So our advice is: do not make impulsive trades based on hopping from one chart to the next. Always do your technical analysis research and make sure your timing is correct and that you have considered all of the above before you execute each trade.