
Trading cryptocurrencies using Bollinger Bands (part 2/2)
The rules of Bollinger Bands
John Bollinger is still quite active in the financial space, while his bands have 30 years of market testing. The first thing that Bollinger makes clear is that both highs and lows are relative. While the upper band signifies highs as they relate to the standard deviation, the lower band does the opposite. The terms “high” and “low” have to be used in a relative sense. This relativity can be derived from a variety of different indicators.
Bollinger stressed that each indicator has to be viewed in isolation before trying to use it in conjunction with something. Momentum, volume, sentiment, as well as many more things can be derived from Bollinger bands; however, they might not necessarily relate to one another.
He once said: “For example, a momentum indicator might complement a volume indicator successfully, but two momentum indicators aren’t better than one.”
Bollinger bands have proven to be a successful indicator if employed in a wide range of financial settings since they are simple by nature. They are made for trading equities, indices, exchanges, commodities, as well as futures. Cryptocurrencies were not there when this indicator was made, but they fit the space between the gray areas of these financial tools.
Bollinger Bands and are also flexible with regard to the time period, as long as the period that is examined contains enough details to present a meaningful view of the market.
How to use Bollinger Bands
Cryptocurrency traders, as well as investors, can use Bollinger Bands in several different ways.
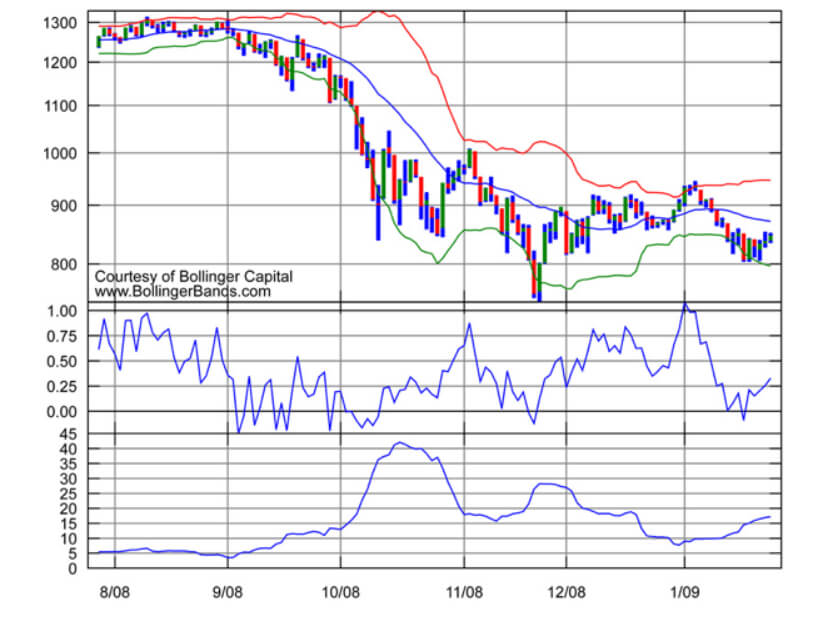
The first we have to look at is the volatility of a given coin we are trading. Bollinger bands compress when standard deviations are low, which is signaling us a period of low volatility. They tend to do the opposite when volatility increases.
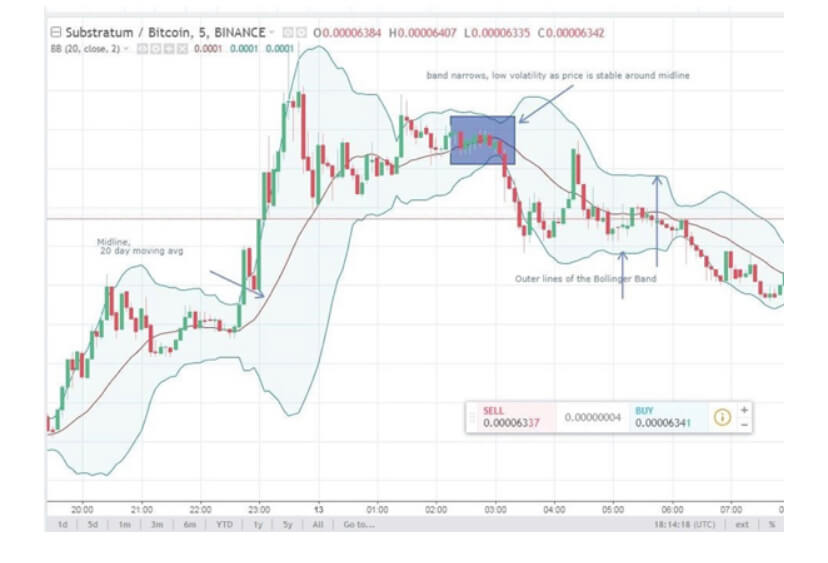
While this can have several meanings depending on the coin we are trading. We can look at the volatility and try to pinpoint the possibility of a breakout.
Bollinger Bands capture somewhere around 90% of the price action in a given cryptocurrency. When the price movement dives above or below a set Bollinger Band, we have to pay attention. When the price moves above the band, the coin is likely overbought, and it is possible that it will correct shortly. If, on the other hand, a price moves below the lower Bollinger Band, the coin is possibly oversold.
Movements at the Bollinger Band boundaries (upper or lower) can also be used to determine short-term price direction. If the upper band is cracked, but the price corrects to a level just at or below the upper band afterward, it’s a sign that the prices are generally moving up. The opposite is also true.
Conclusion
Bollinger bands present an easy way to visualize the cryptocurrency market price movement. In simplest terms, it shows when it is a good idea to buy or sell an asset.
However, Bollinger Bands are simply one of the many tools in a trader’s toolkit, which means that the rules are not written in stone. To confirm their decisions based on Bollinger Bands, many traders are relying on volume indicators or oscillators such as RSI or MACD before entering a position. Independently confirming trends by using other tools rather than only using the Bollinger Band system is more reliable than using just Bollinger Bands to come to a certain conclusion