

Trading cryptocurrencies using RSI indicator
RSI, which is an acronym for the Relative Strength Index, is one of the most popular technical indicators used in the analysis of any financial markets. It is often used for cryptocurrency trading as well.
It was created in 1978 in John Welles Wilder’s book that carries the name “New concepts in technical trading systems.” Wilder was a former mechanical engineer who abandoned his job in order to focus on the financial markets.
He wanted to create indicators based on mathematical analysis by finding a simple yet effective tool to visually represent market movements. The RSI indicator is what came from his research, and this indicator is one of the most widely used indicators to date.
RSI indicator – explained
This indicator is based on quite a simple concept. The stronger the relative price, the greater the market’s upward closures compared to the market’s downward closures. The opposite is also true.
RSI is considered an oscillator that is used for measuring the speed as well as the direction of price movements. That’s why it is also a “momentum” indicator. Contrary to some other indicators, RSI manages to overcome the momentum-related problems that can occur when abrupt movements of the market cause a sudden reversal of the trend.
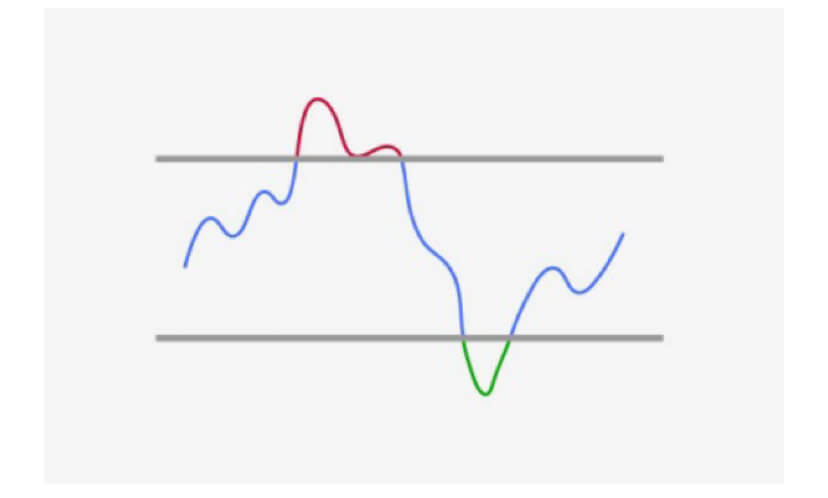
RSI uses a band of oscillation that ranges from 0 to 100. It also allows for visual comparison with predetermined constant levels. It is based on a simple mathematical formula that requires only one input parameter, which is the number of periods that we are taking into consideration.
In his book, Wilder recommended that 14 should be used to get the best results.
As with all the other oscillators, if a short time-period is used, the sensitivity of the oscillator might be too great, and traders may get false signals.
Using RSI in crypto trading

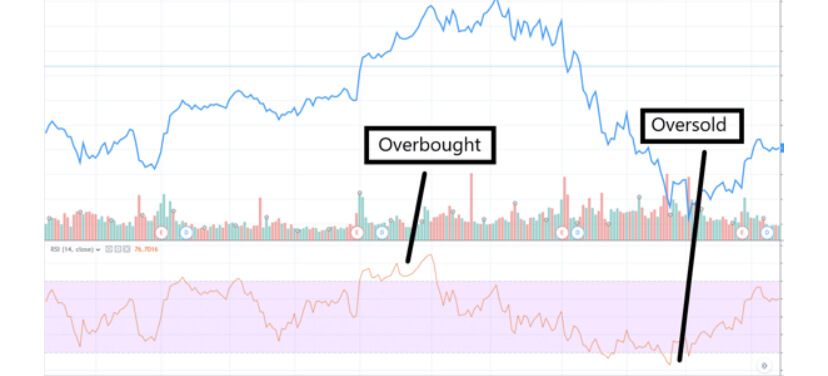
Trading cryptocurrencies using RSI is not much different than trading any other asset. When the price moves up quickly, the RSI indicator will enter the “overbought” area. The opposite is also true.
It is important to say that the longer the time frame used, the more accurate the data is. Bitcoin has almost never had a false signal on the higher time frames.
Wilder designed this indicator with the aim to spot reversals. RSI will show alert zones set at 70 for overbought and by the value 30 for oversold. However, it is not uncommon to see zones moved to values 80 and 20.
A cryptocurrency trader, this indicator should NOT be used by itself, but rather alongside using the knowledge of candlestick and pattern analysis as well as some other indicators.