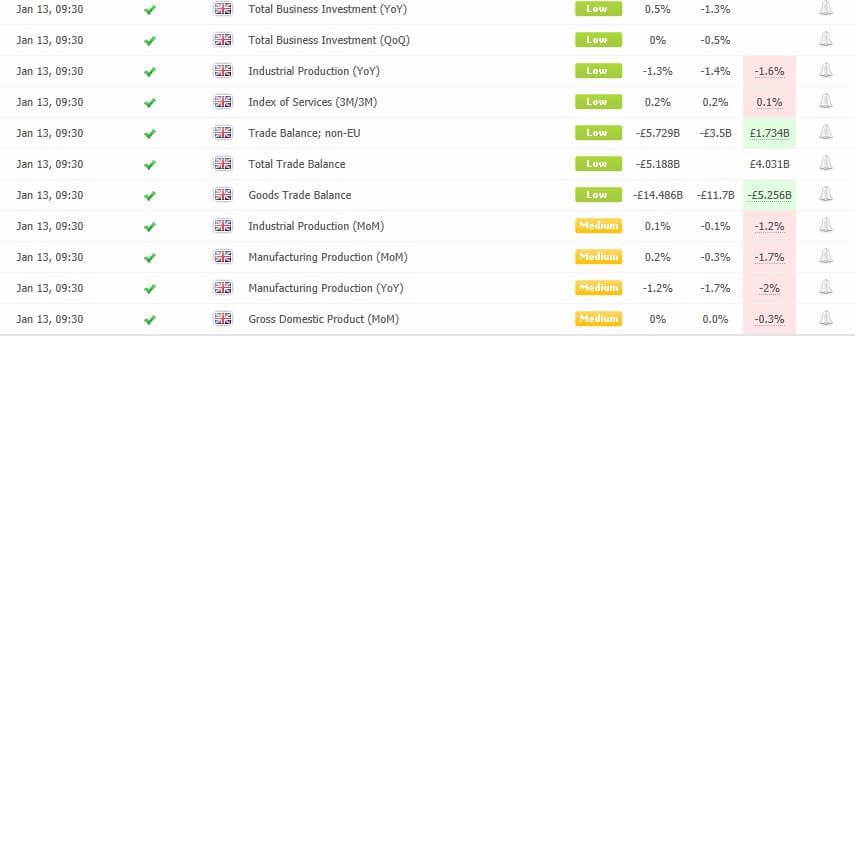
On the forex front, the U.S. Dollar Index rose 0.3% on the day at 97.61. The euro slid 0.4% to $1.1090. The British Pound dropped 0.5% to $1.3010, snapping a three-day rally. Official data showed that U.K. retail sales unexpectedly fell 0.6% on month in December (+0.6% estimated), fueling expectations of an interest-rate cut by the Bank of England.
The U.S. government bond prices declined further after the Treasury Department announced plans to sell 20-year government bonds later this year. The benchmark U.S. 10-year Treasury yield advanced to 1.834% from 1.809% Thursday.
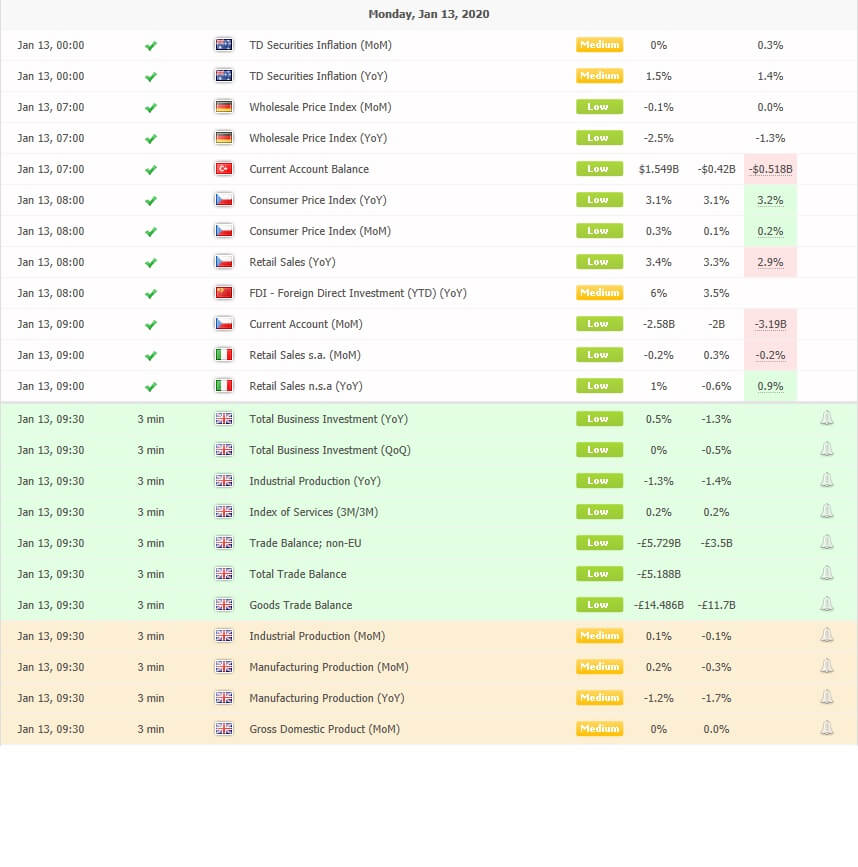
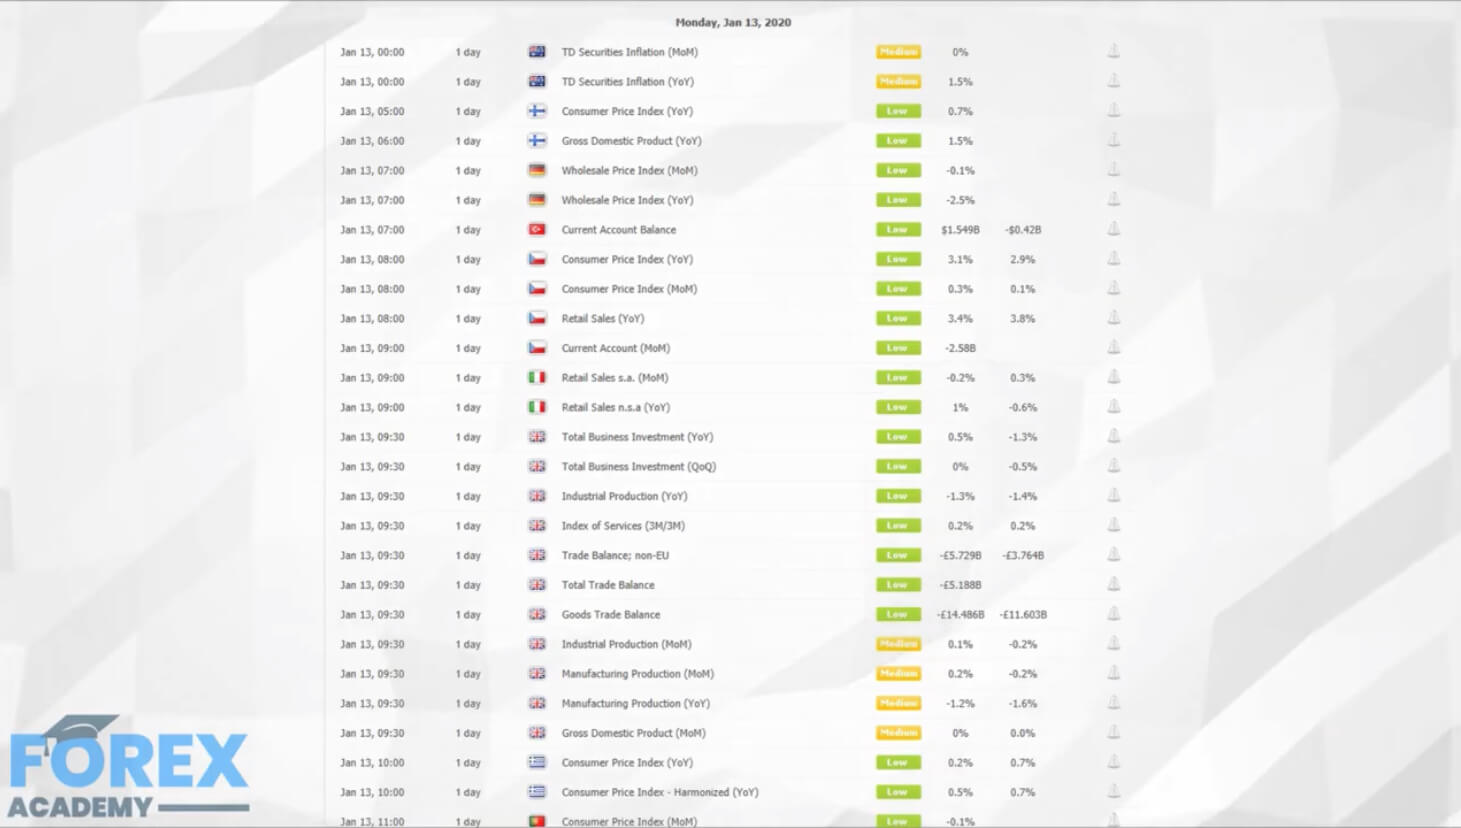
Economic Events to Watch Today
EUR/USD – Daily Analysis
The EUR/USD pair was closed at 1.10893 after placing a high of 1.11425 and a low of 1.10862. Overall the movement of the EUR/USD pair remained strongly bearish that day.
On Friday, the EUR/USD pair was dropped near its January low amid the broad U.S. dollar strength after the upbeat macroeconomic data.
The US-China phase-one trade deal was under whole focus week but failed to impress as it did not include the rolling back of tariffs in it, which was essential for boosting global growth. According to Trump, there would be rolling back of tariffs in Phase-two of a trade deal. The uncertainty from the trade front, as well as Brexit front, continued to weigh on the market.
On Thursday, the closely watched Retail Sales data from the United States exceeded the expectations and supported the U.S. dollar. The stronger U.S. dollar after December Retail Sales removed risk appetite from the market and dragged its rival currency Euro on Friday.
The upbeat data from the United States indicated that the economy was doing well then its significant counterparts and weighed on EUR/USD prices.
On Friday, from the European side, at 12:45 GMT, the French Government Budget Balance was announced for November, which showed a deficit of -113.9B. At 14:02 GMT, the Current Account Balance for the whole bloc was released, which also came in short of expectations as 33.9B against the forecasted 34.3B and weighed on Euro.
At 14:02 GMT, the Italian Trade Balance for November showed a decline of 4.87B against the expected 7.22B and weighed on single currency Euro. At 15:00 GMT, the Final Consumer Price Index (CPI) for the year remained flat at 1.3%. The Final Core Consumer Price Index from Eurozone for the year also remained the same as expected at 1.3%. Weaker than expected Trade Balance from Eurozone weighed on EUR/USD and dragged its prices near its month lowest point.
On the other hand, the U.S. dollar was in strength already due to Retail Sales data from Thursday and got even stronger after the release of Housing Starts on Friday. At 18:30 GMT, the number of Houses that started its construction in December exceeded the expectations of 1.38M and came in as 1.61M and supported the U.S. dollar.
The stronger U.S. dollar dragged further the prices of EUR/USD pair and gave the pair a strong bearish candle at the ending day of the week.
Daily Support and Resistance
- S3 1.1056
- S2 1.1101
- S1 1.1119
- Pivot Point 1.1146
- R1 1.1164
- R2 1.1191
- R3 1.1236
EUR/USD– Trading Tips
On the 4 hour timeframe, the EUR/USD is trading at 1.1096, having formed a bullish engulfing pattern. The bullish engulfing pattern is suggesting the odds of a bullish trend in the EUR/USD. The EUR/USD can show bullish correction until 1.1106 and 1.1112 before showing further selling.
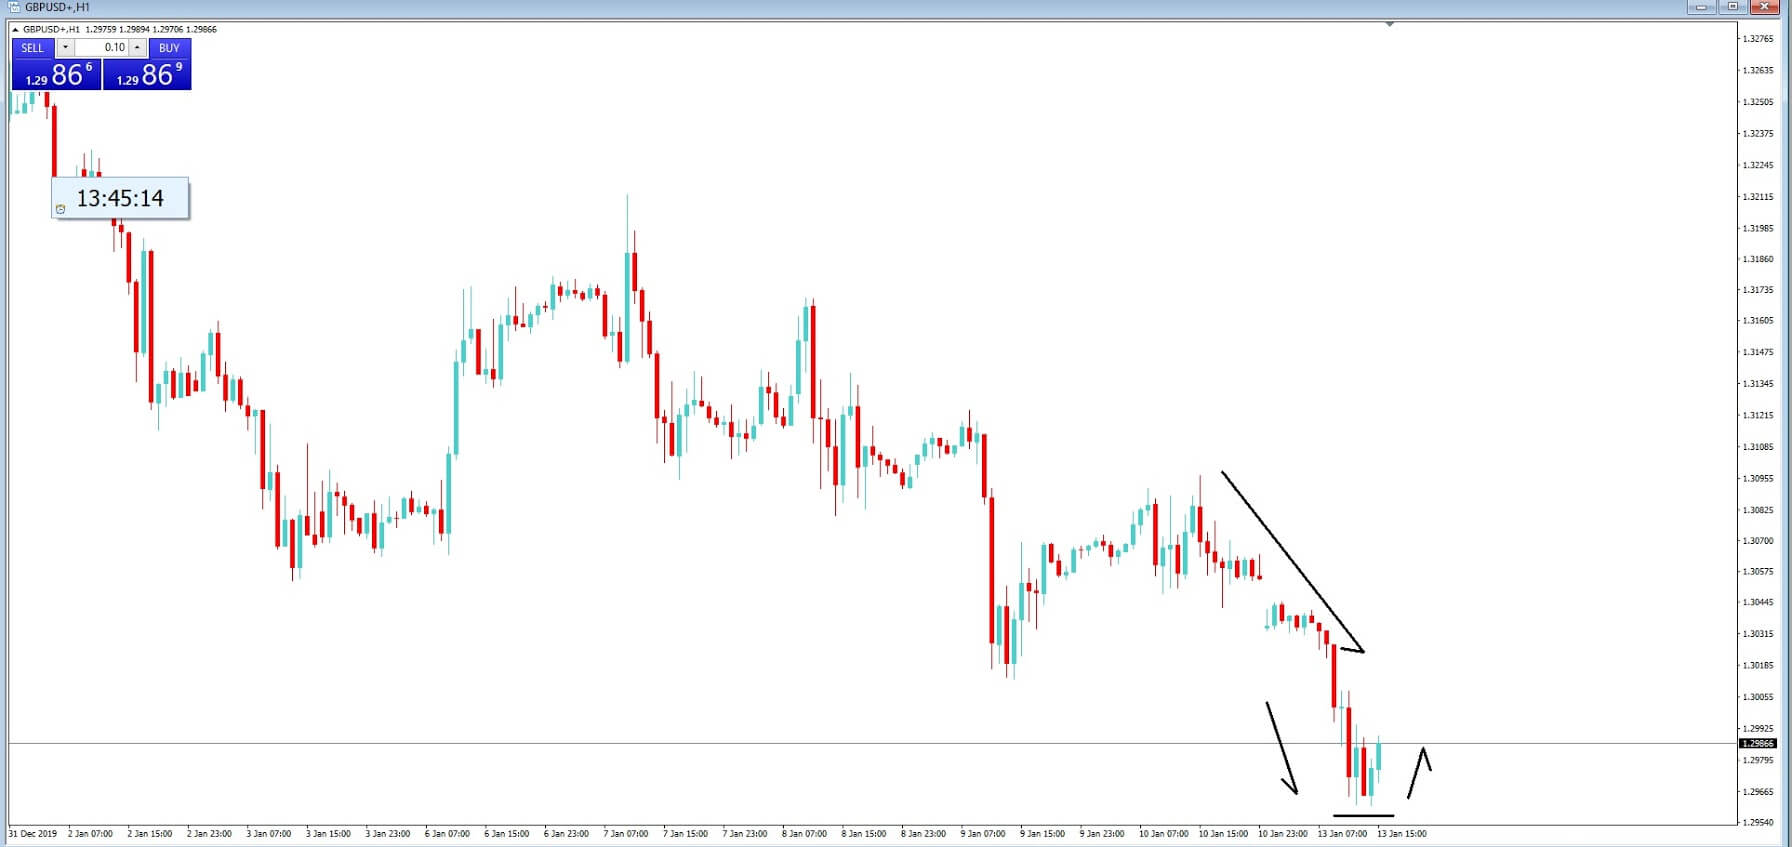
GBP/USD– Daily Analysis
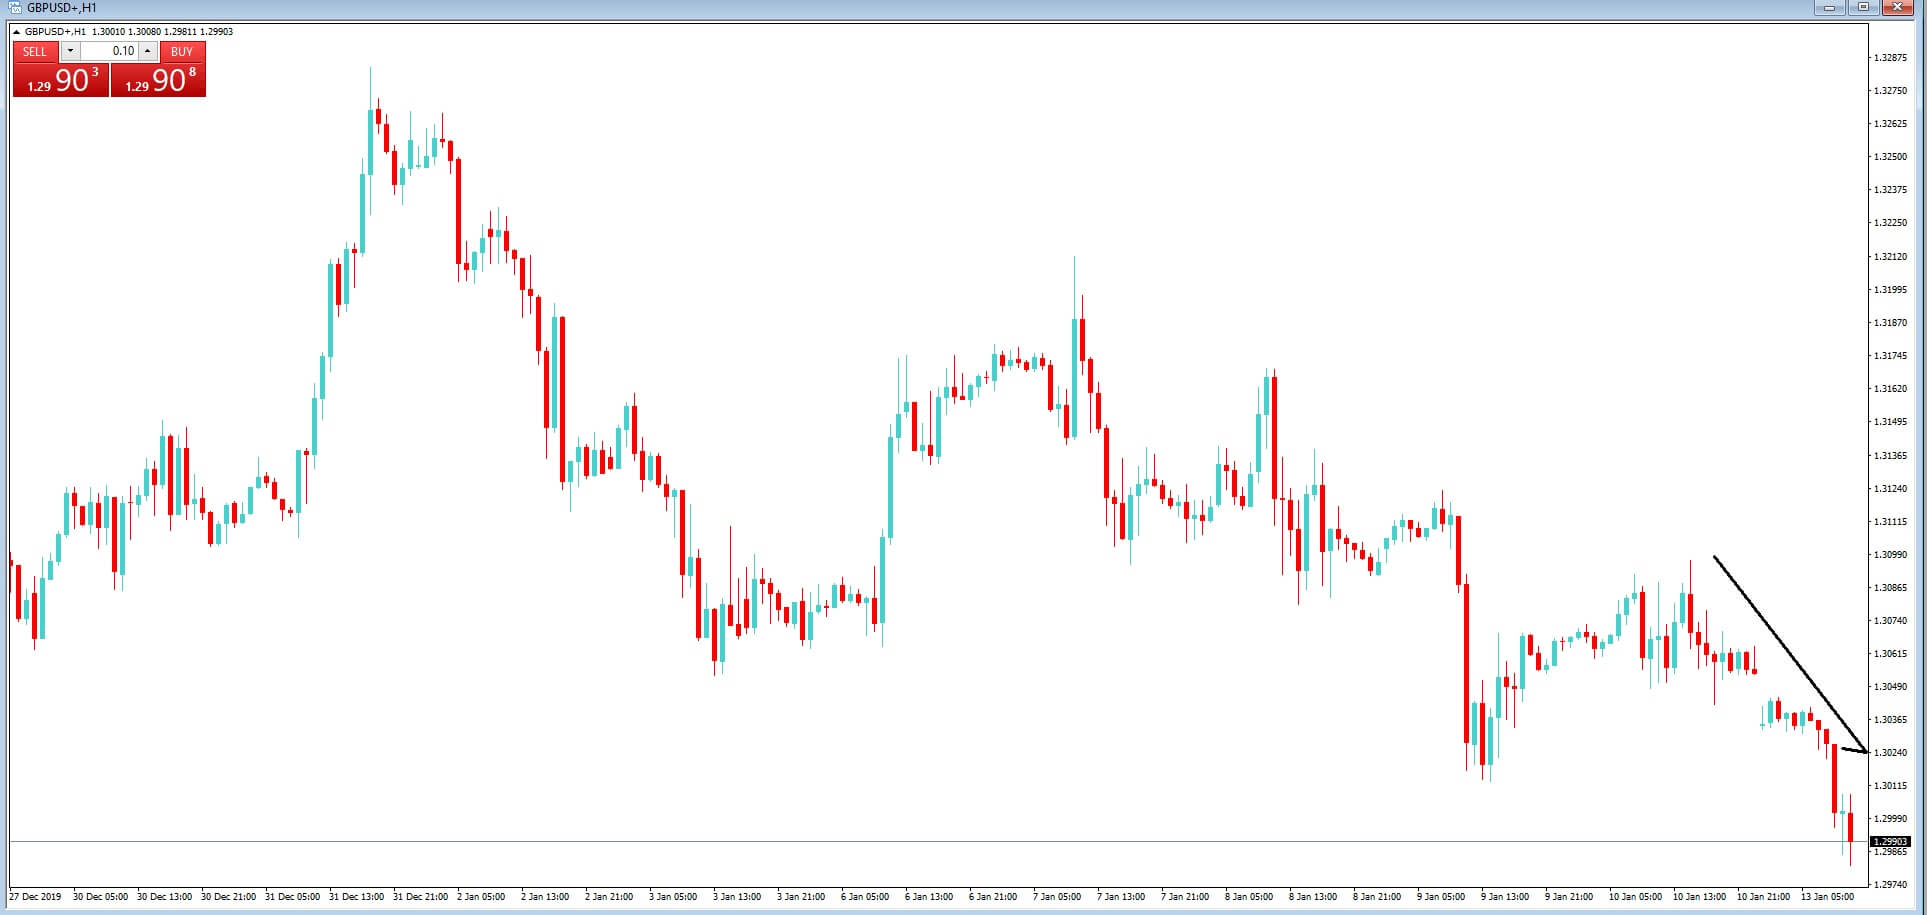
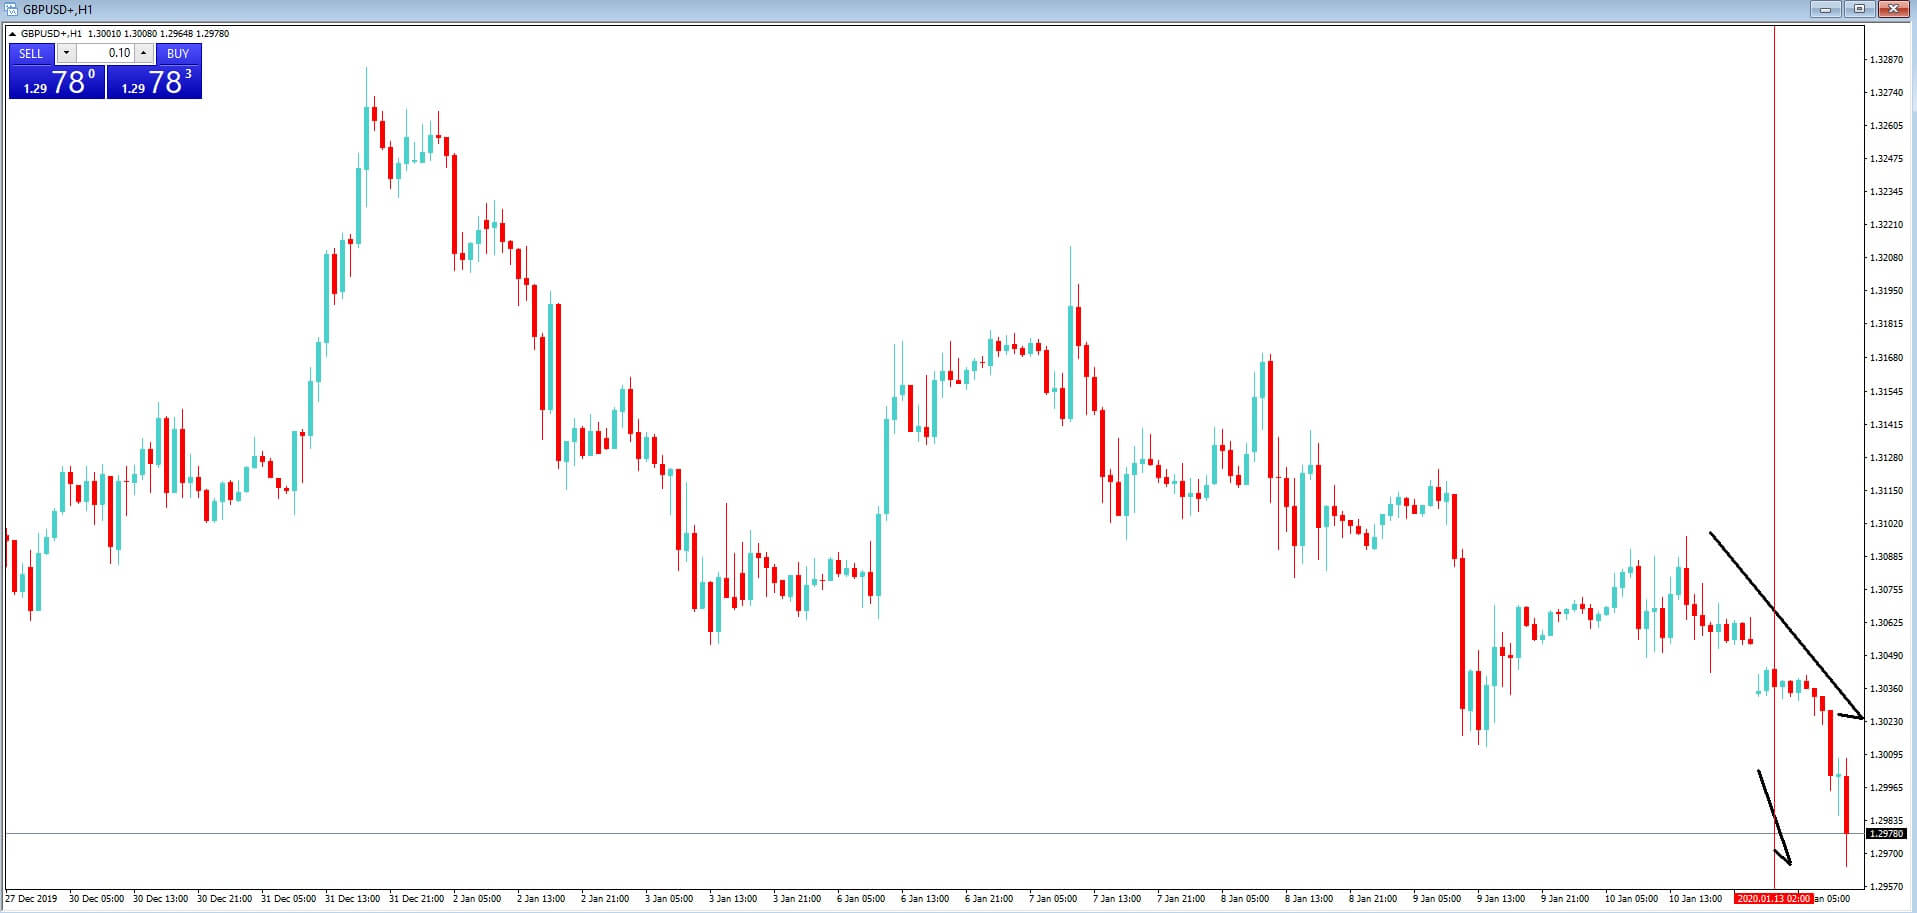
The GBP/USD pair was closed at 1.30094 after placing a high of 1.31187 and a low of 1.30076. Overall the movement of GBP/USD pair remained bearish that day. On Friday, the British Pound was lower against the U.S. dollar as the Retail Sales data from the U.K. came in short of expectations, and the U.S. dollar gained traction at the end of the week amid robust data.
The member of Bank of England Monetary Policy Committee, Gertjan Vlieghe, who previously was in favor of rate hike said earlier this week that he would vote for a rate cut in the next meeting if the data continuously show signs of weakness.
The chances for a rate cut by Bank of England increased on Friday after the release of Retail Sales from Great Britain. At 14:30 GMT, the Office for National Statistics from the United Kingdom published Retail Sales report for December, which showed that Retail Sales slumped to -0.6% from the expectations of 0.5% and weighed on single currency Pound.
The GBP/USD prices rose in the early trading session on Friday before the release of Retail Sales, which decreased the size of the decline in prices of GBP/USD after the publication of data. The pair GBP/USD fell to 1.30 level on the back of the 5th consecutive monthly decline in Retail Sales.
It should also be noted that in December, there were general elections in the United Kingdom, which could be a cause for the decline in Retail Sales as the political uncertainty could have weighed on consumer minds for spending on Christmas presents.
The next monetary policy decision by Bank of England will take place on coming Thursday, January 30. Only major data to be released by then from the United Kingdom is Manufacturing & Services PMI, which will also be released next week.
On the other hand, the U.S. dollar remained firm on the back of strong Housing Starts figures. At 18:30 GMT, the number of buildings that started their construction in December came in as 1.61M against the expectations of 1.38M and supported the U.S. dollar.
The member of the Federal Reserve Open Market Committee, Harker, also gave comments in favor of the U.S. economy. He said that the economy was doing well, and data will be monitored to decide the further fate of monetary policy and interest rates.
His comments also supported the upward trend of the U.S. dollar on Friday and added in the fall of GBP/USD prices at the ending day of the week.
Daily Support and Resistance
- S3 1.2946
- S2 1.3004
- S1 1.304
- Pivot Point 1.3062
- R1 1.3098
- R2 1.312
- R3 1.3178
GBP/USD– Trading Tip
On Monday, the GBP/USD pair continues to trade bearish as it tested and failed to violate the downward channel, which was formed on the 4-hour chart. At the moment, the GBP/USD pair is trading at 1.2078, and it seems to extend bearish bais until 1.2925.
The GBP/USD pair may find support around 1.2925 area today. Whereas, the RSI and MACD support the bearish bias. Let’s look for selling trades below 1.2980.
USD/JPY – Daily Analysis
The USD/JPY pair was closed at 110.161 after placing a high of 110.287 and a low of 110.046. Overall the movement of the USD/JPY pair remained bullish that day.
At 9:30 GMT, the Tertiary Industry Activity for November from Japan exceeded the market expectations and supported the Japanese Yen when it came in as 1.3% against the forecasted 1.0%.
At 2:00 GMT, the TIC Long-Term Purchases data from the United States for November was released by the U.S. Department of Treasury. The report showed a decline of 22.9B from the expected 34.5B and weighed on the U.S. dollar.
At 18:30, the Building Permits for December from the United States showed a decline to1.42M from the expected 1.47M and weighed on the U.S. dollar. However, the Housing Starts in December were increased to 1.61M from the expected 1.38M and supported the U.S. dollar.
At 19:15 GMT, the Capacity Utilization Rate from the U.S. remained flat at 77.0%. But the Industrial Production for December dropped and came in negative as -0.3% from forecasted 0.0% and weighed on the U.S. dollar.
At 20:00 GMT, the Prelim Consumer Sentiment from the University of Michigan came as 99.1, almost in line with the expectations of 99.3, and gave null effect to the U.S. dollar. However, the release of JOLTS Job Openings weighed on the U.S. dollar when it dropped to 6.80M against the expectations of 7.24M for November.
The Prelim Inflation Expectations from the University of Michigan increased in January to 2.5% from December’s 2.3%. The increased Housing Starts and Increased expectations of rising Inflation gave a boost to the U.S. dollar on Friday. The U.S. dollar was further supported by the comments of Patrick Harker, the President of Philadelphia Federal Reserve Bank.
Daily Support and Resistance
- S3 109.57
- S2 109.83
- S1 110
- Pivot Point 110.1
- R1 110.27
- R2 110.36
- R3 110.62
USD/JPY – Trading Tips
On Monday, the USD/JPY pair is trading with a bullish bias at 110.200 after consolidating in a narrow trading range of 109.800 – 110.150. Recently, the USD/JPY pair has formed Three While Soldiers pattern on the 4-hour timeframe, which typically suggests a bullish trend in the market.
The USD/JPY is now supported above 110.100, and we may see further buying above this level until 110.490 today. The USD/JPY may find a resistance level of 110.570. Moreover, the RSI and MACD are still staying in the buying zone. Today, I will be looking for buying trades over 110.1 levels with a target of 110.570.
All the best for today!