Categories
Crypto Market Analysis

Daily Crypto Review, Apr 6 – Bitcoin above $7,000 – but will it stay there?

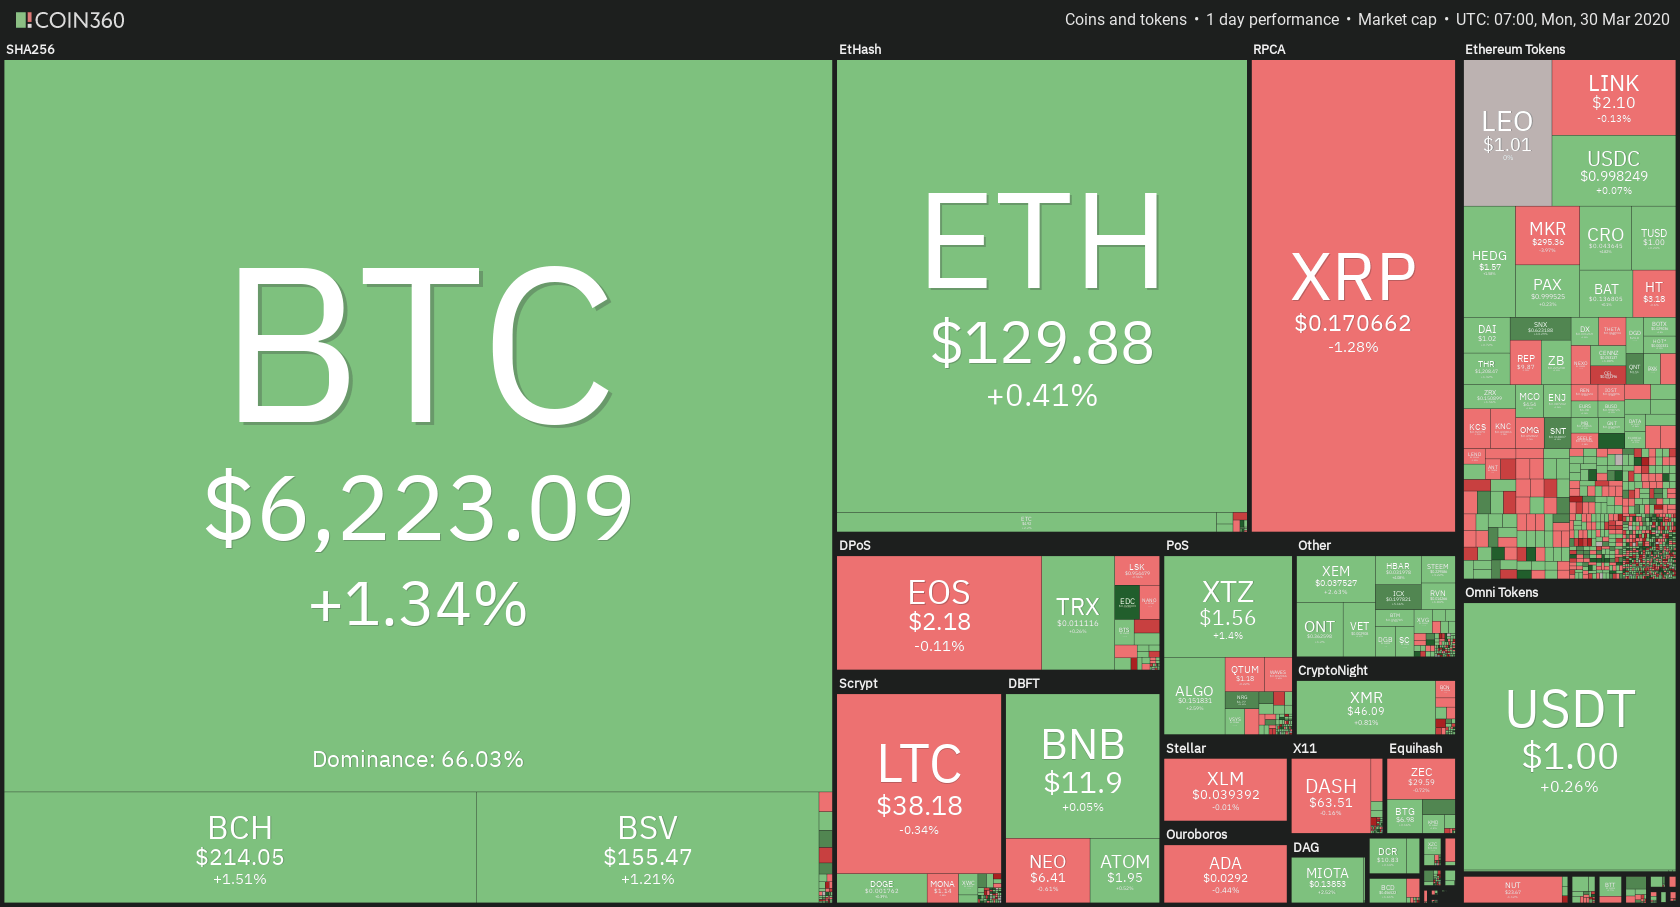
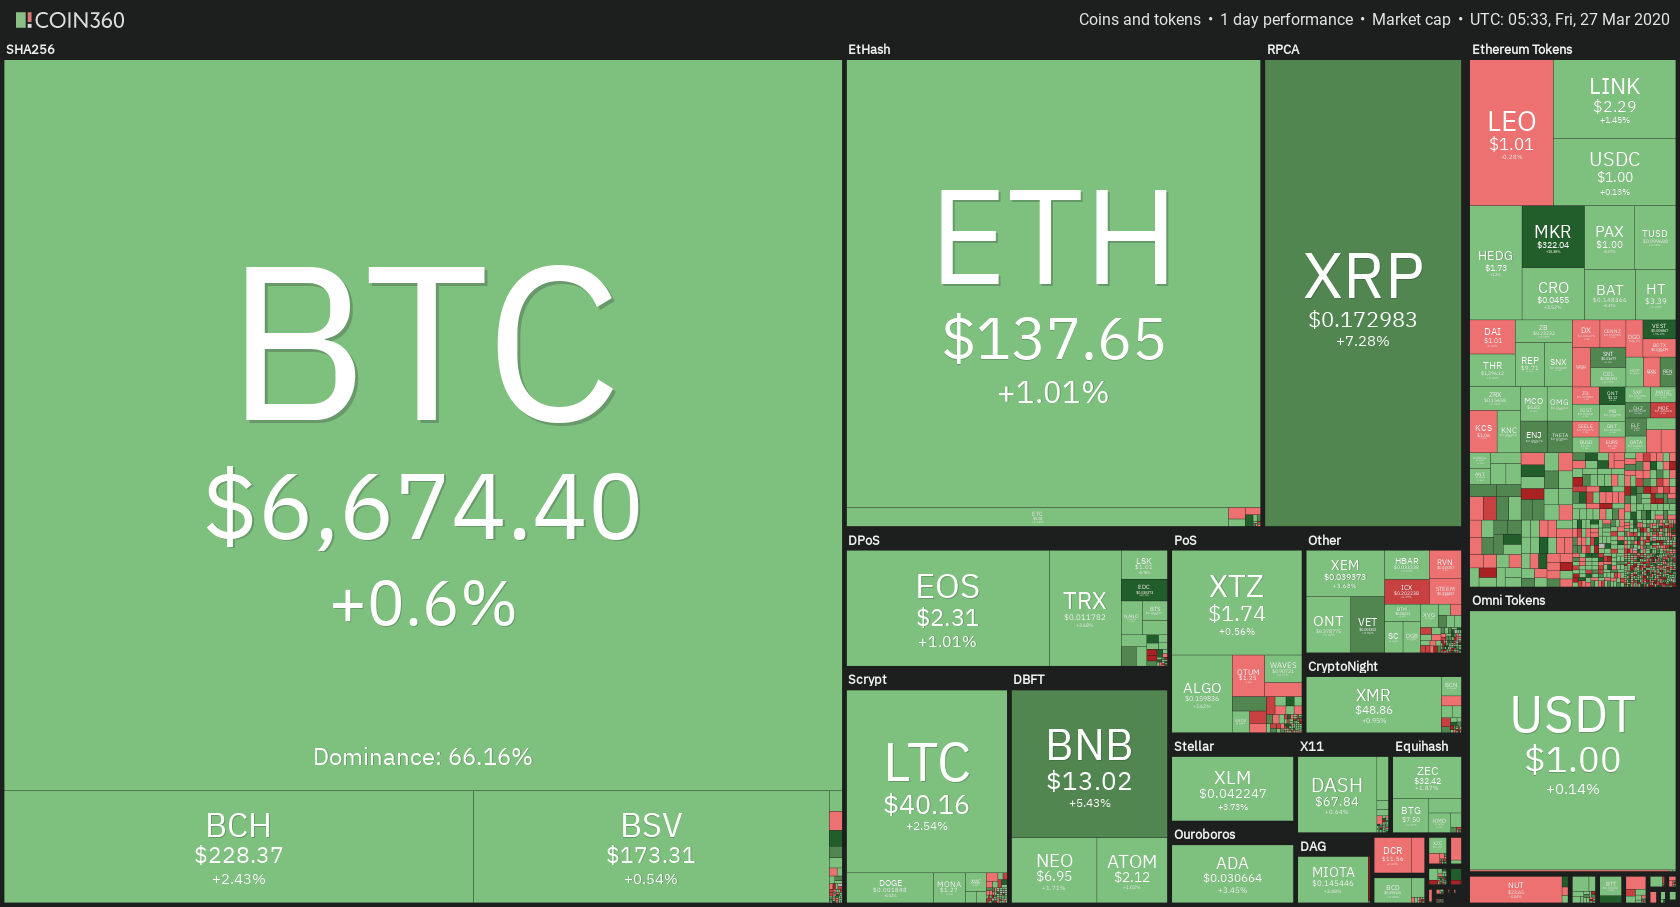
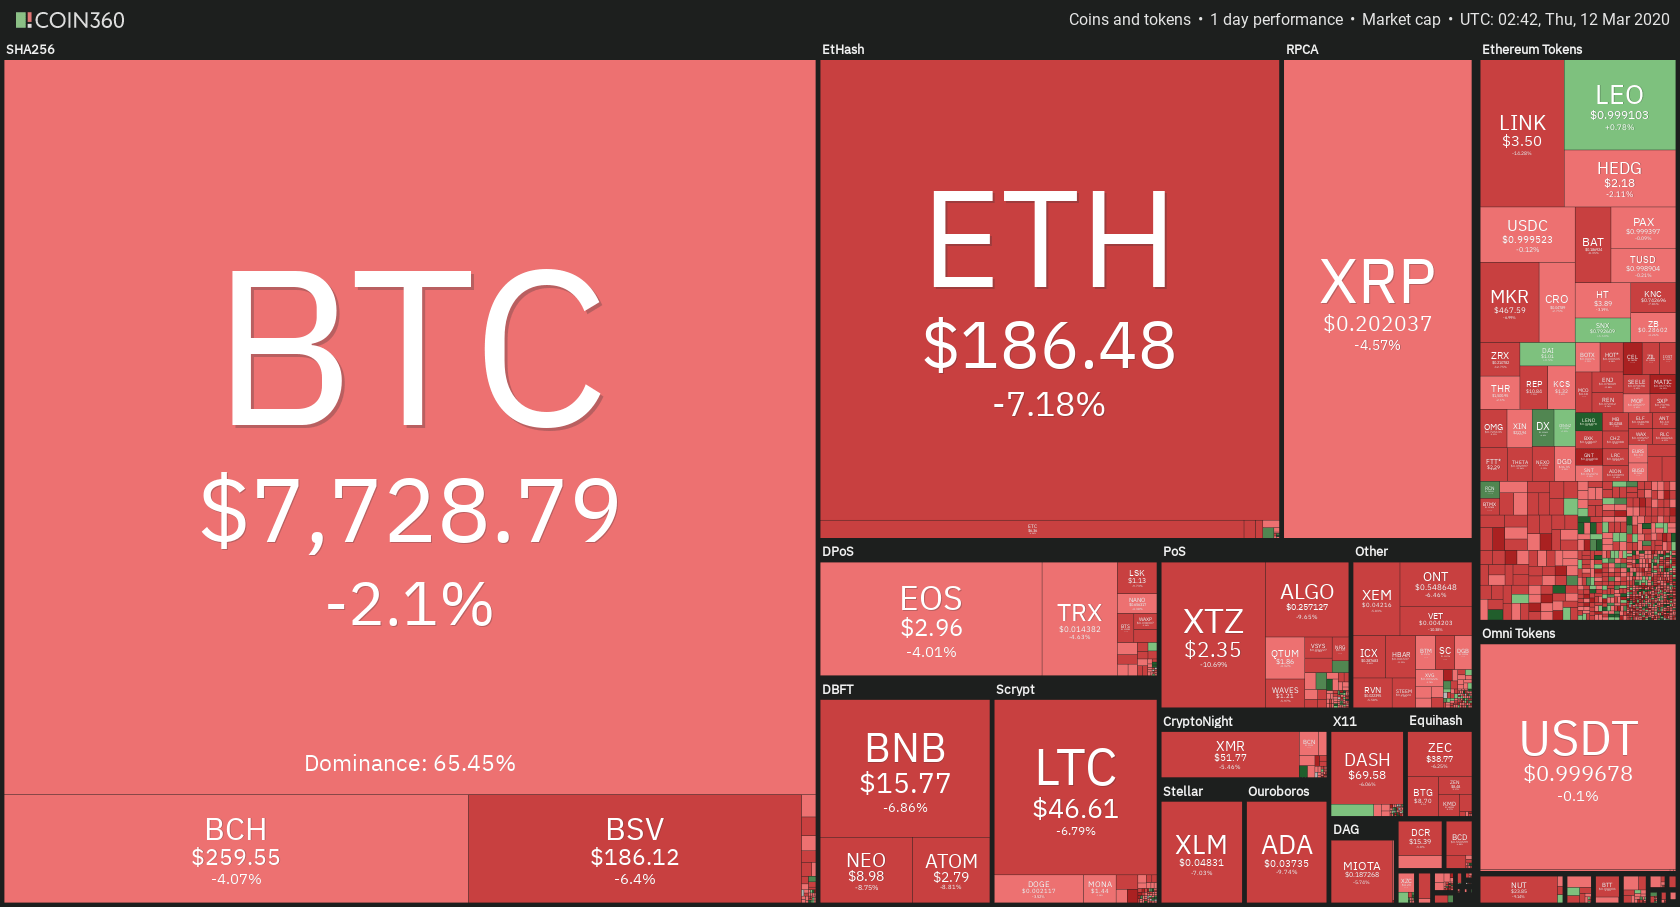
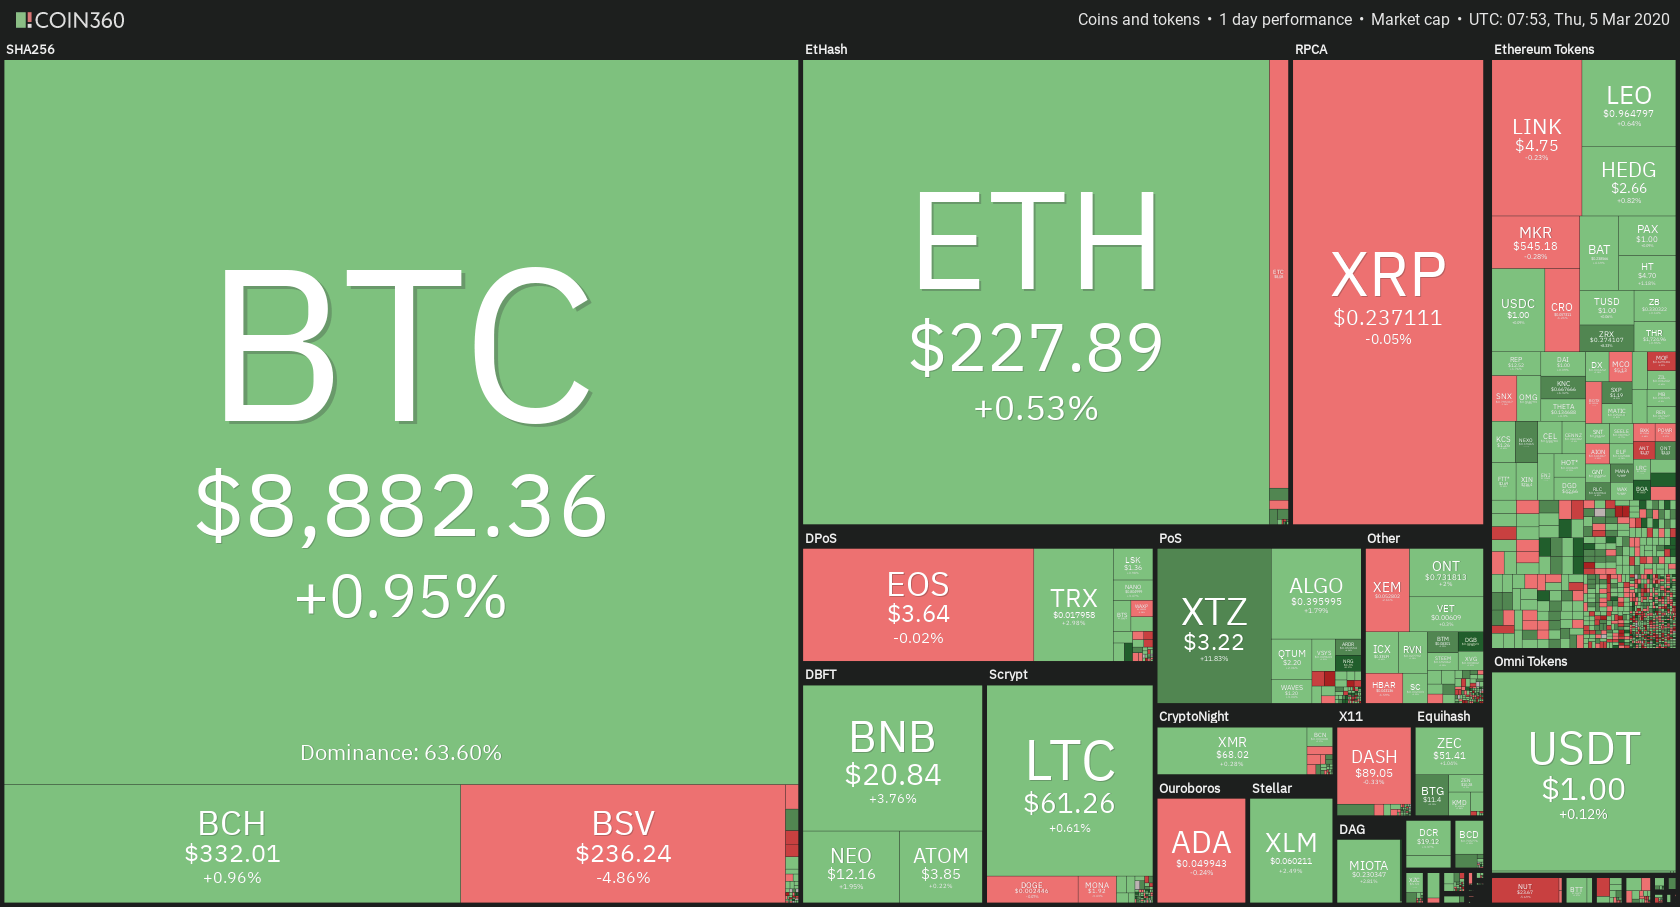
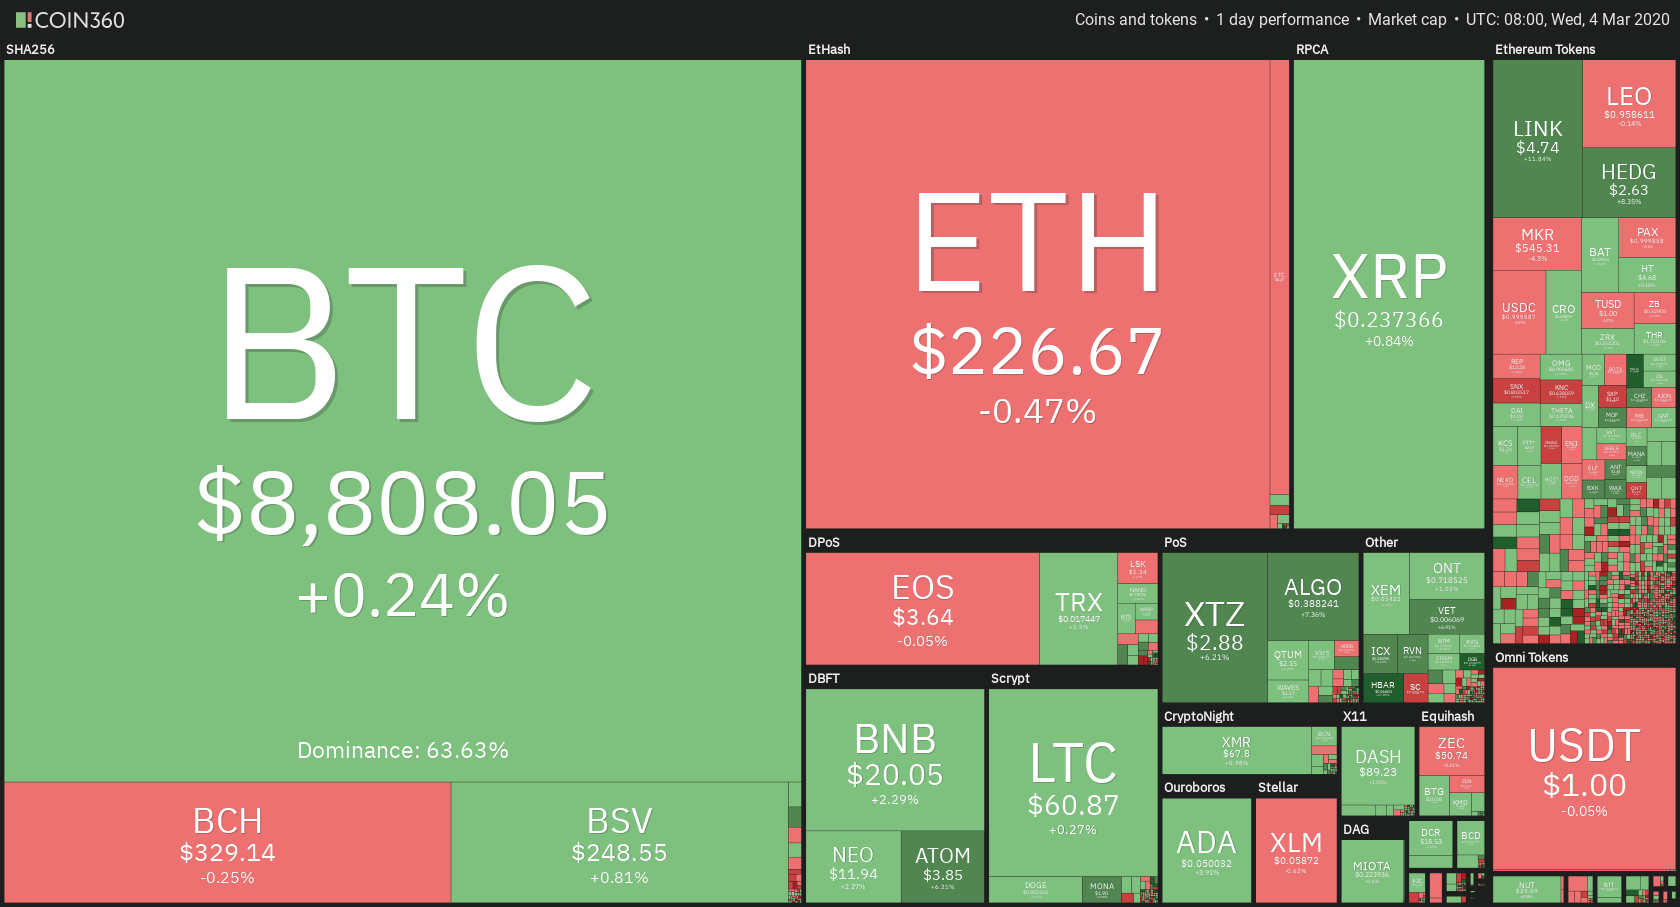
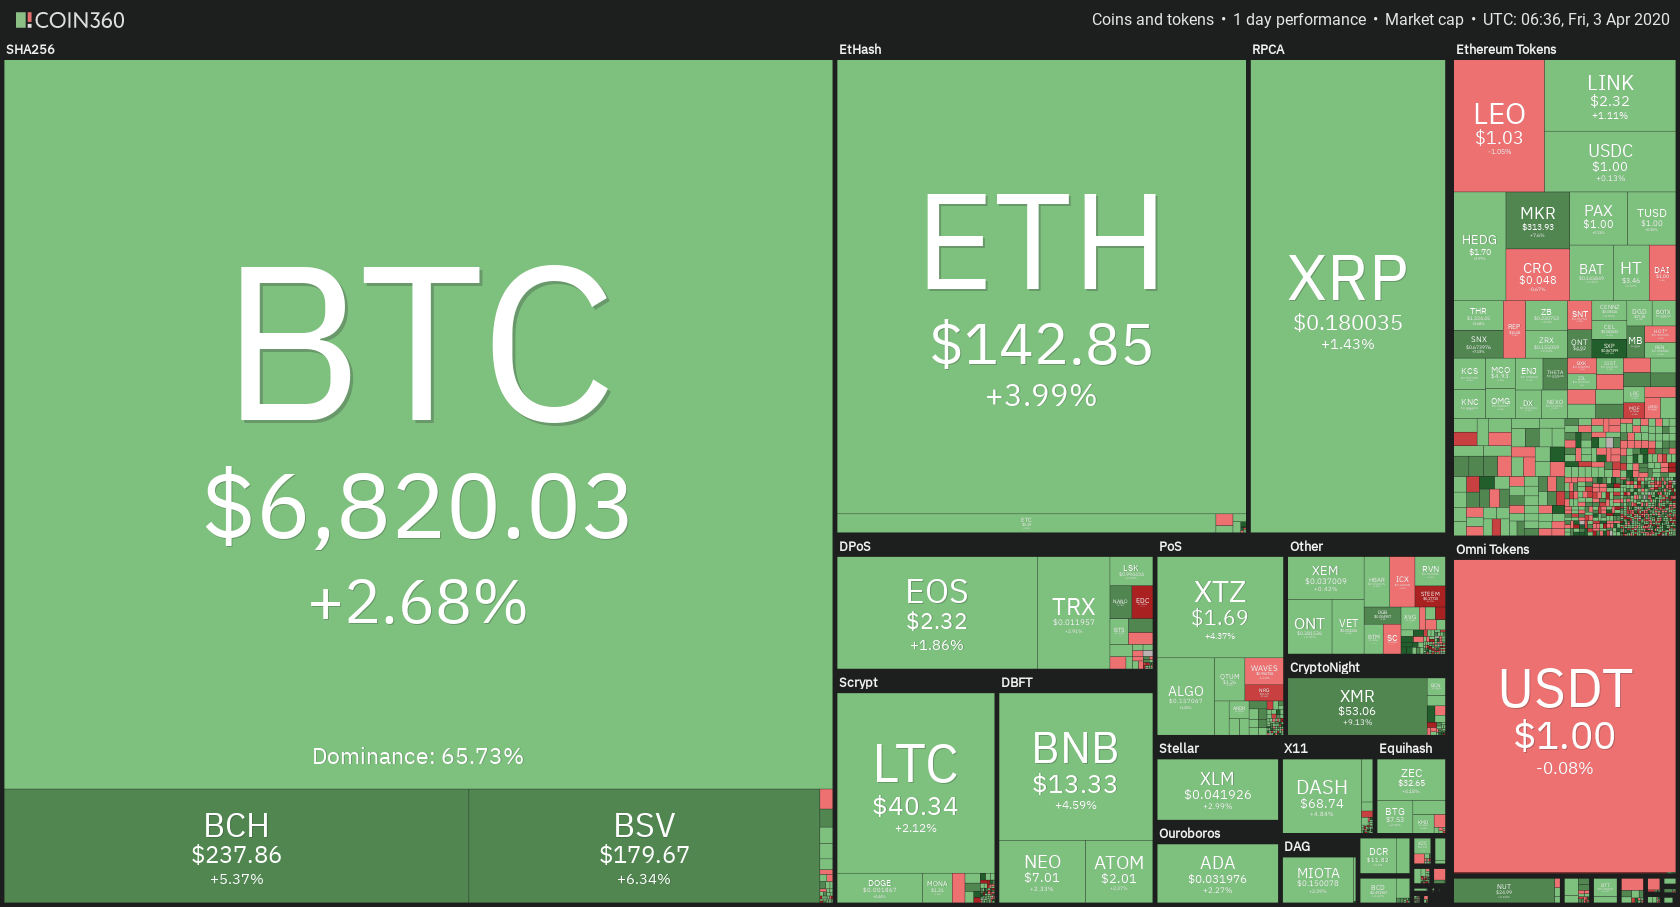
The cryptocurrency market had quite a good day as volume increased, and bulls gathered. Bitcoin led the market up to new highs and finally broke the $7,000 mark. It is currently trading for $7,067, which represents an increase of 4.33% on the day. Meanwhile, Ethereum gained 5.27% on the day, while XRP gained 3.39%.

Zilliqa took the position of today’s most prominent daily gainer, with gains of 16.97%. Steem lost 4.14% on the day, making it the most prominent daily loser.

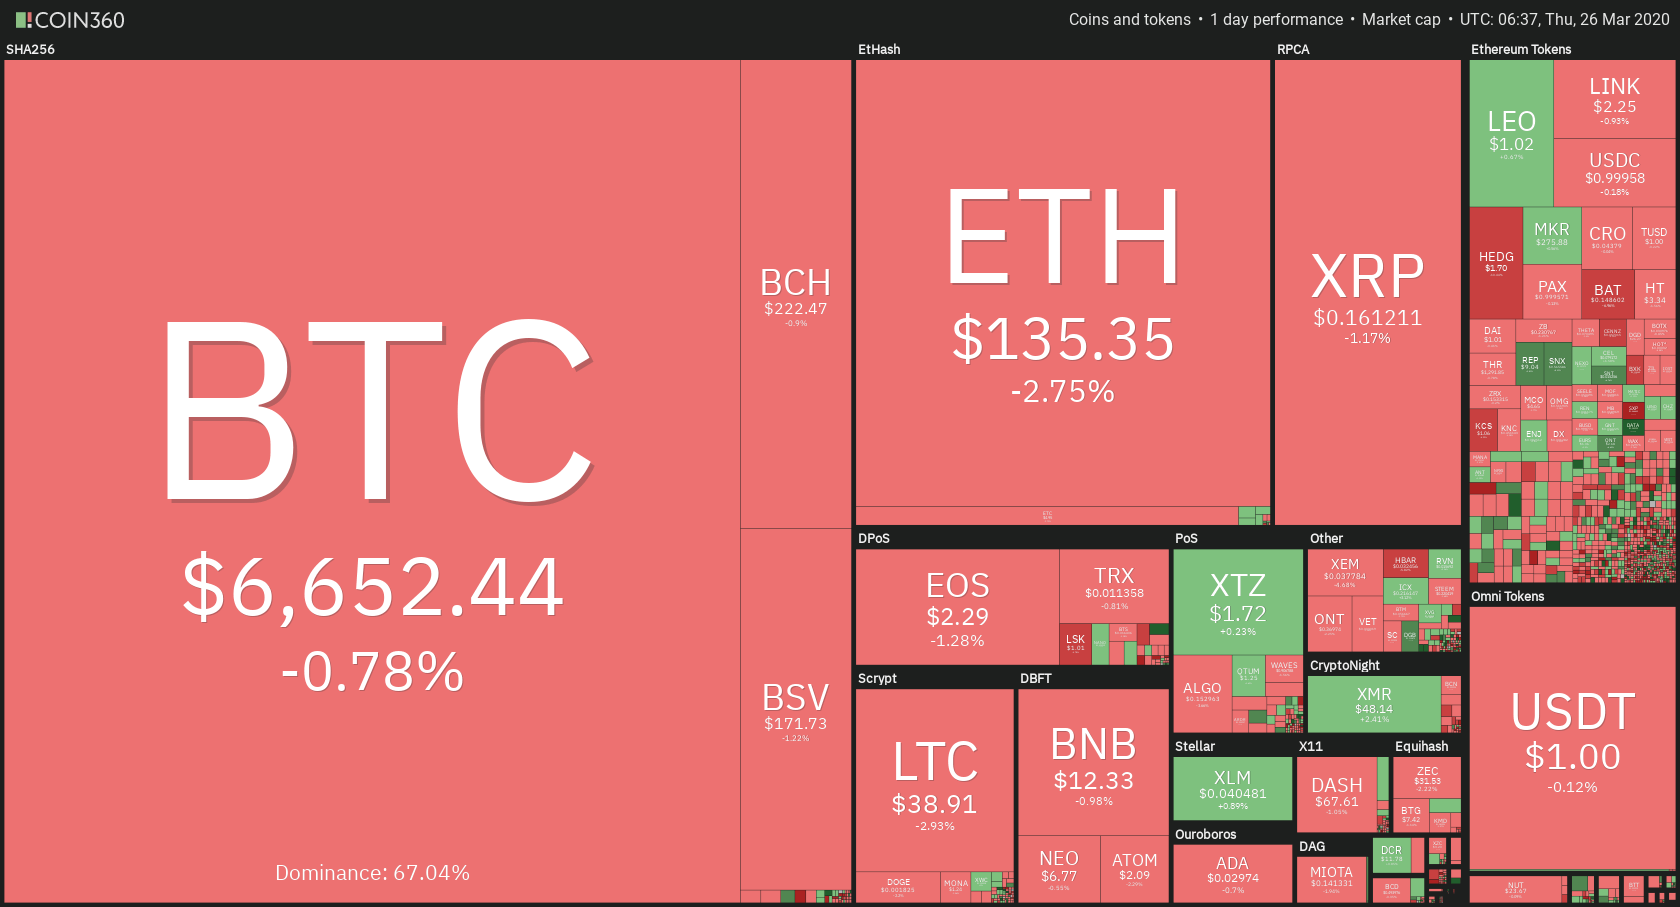
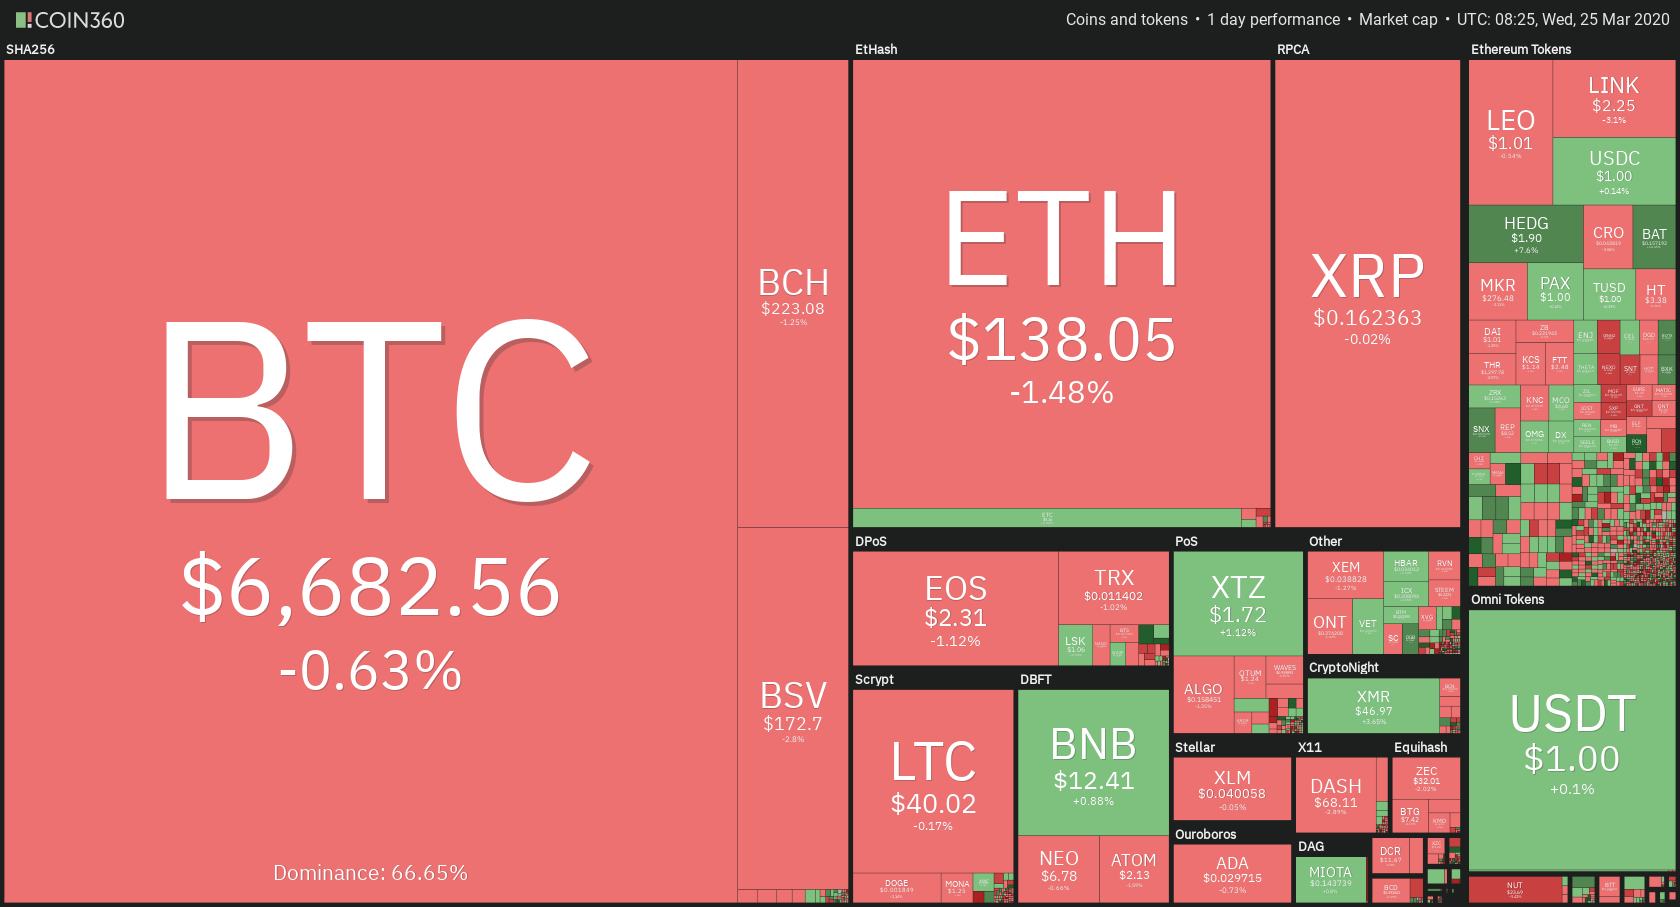
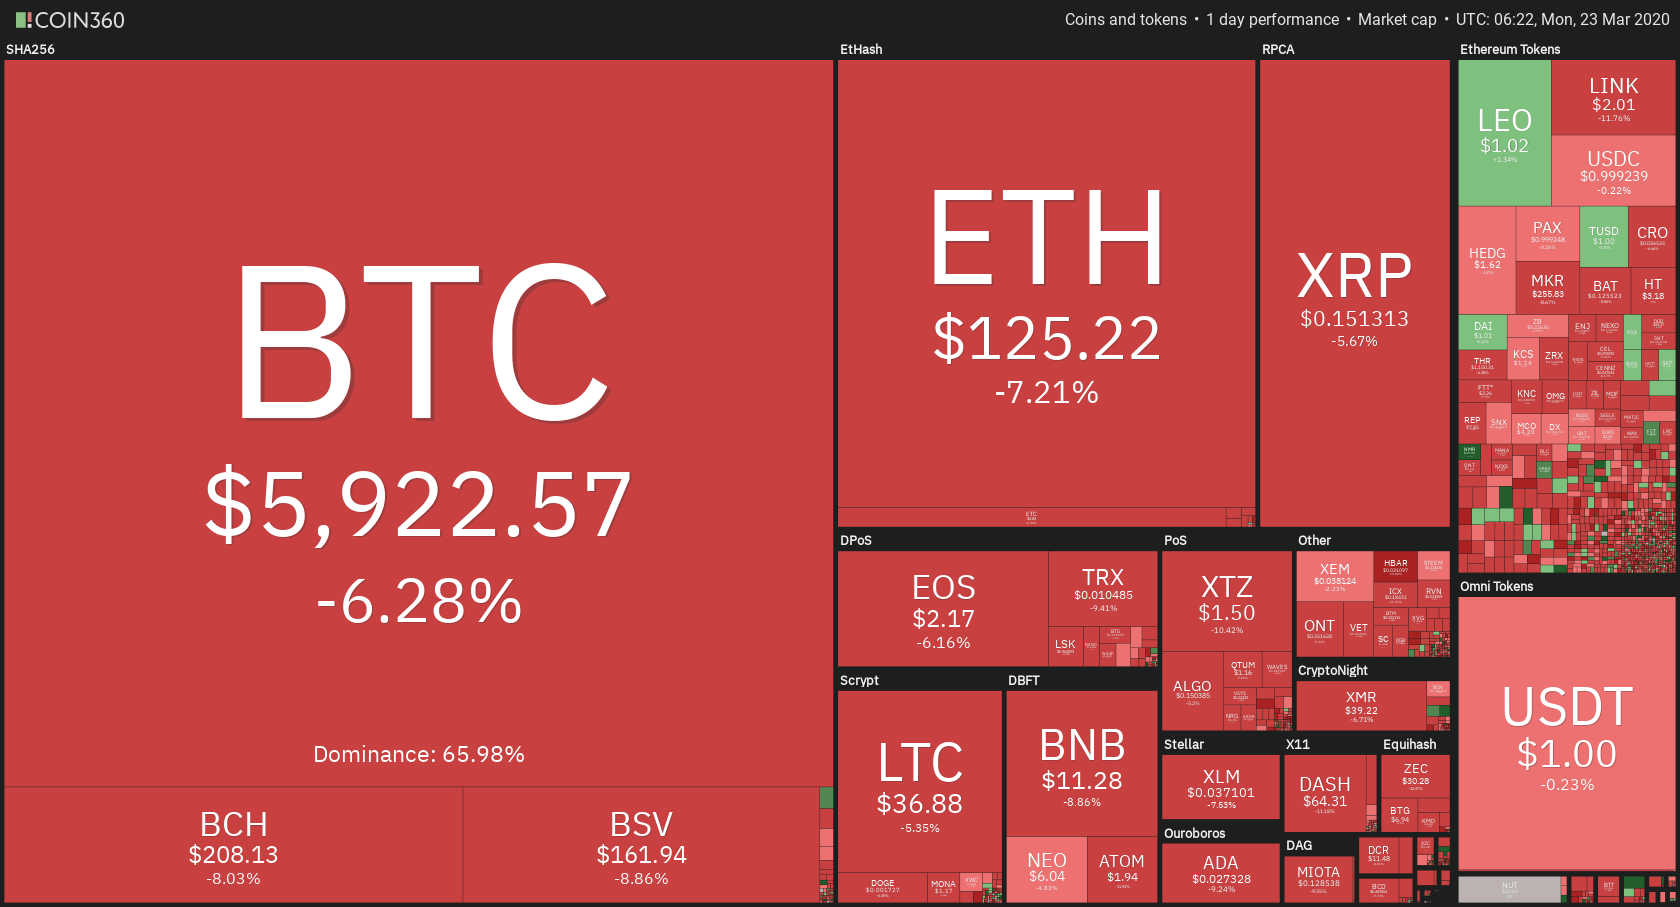
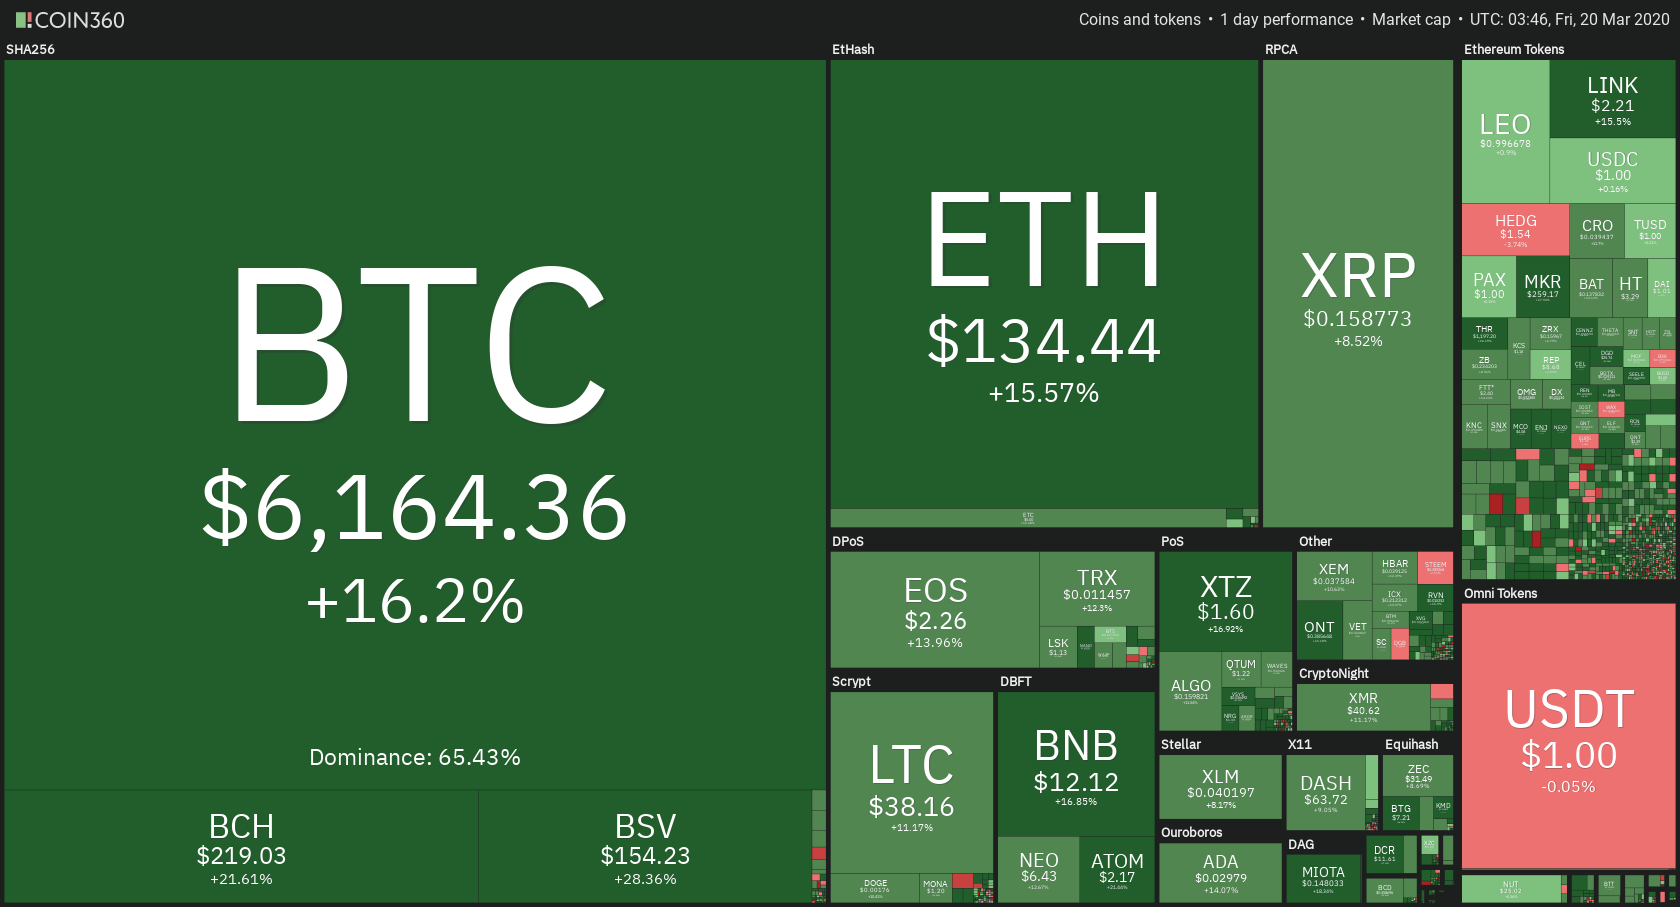
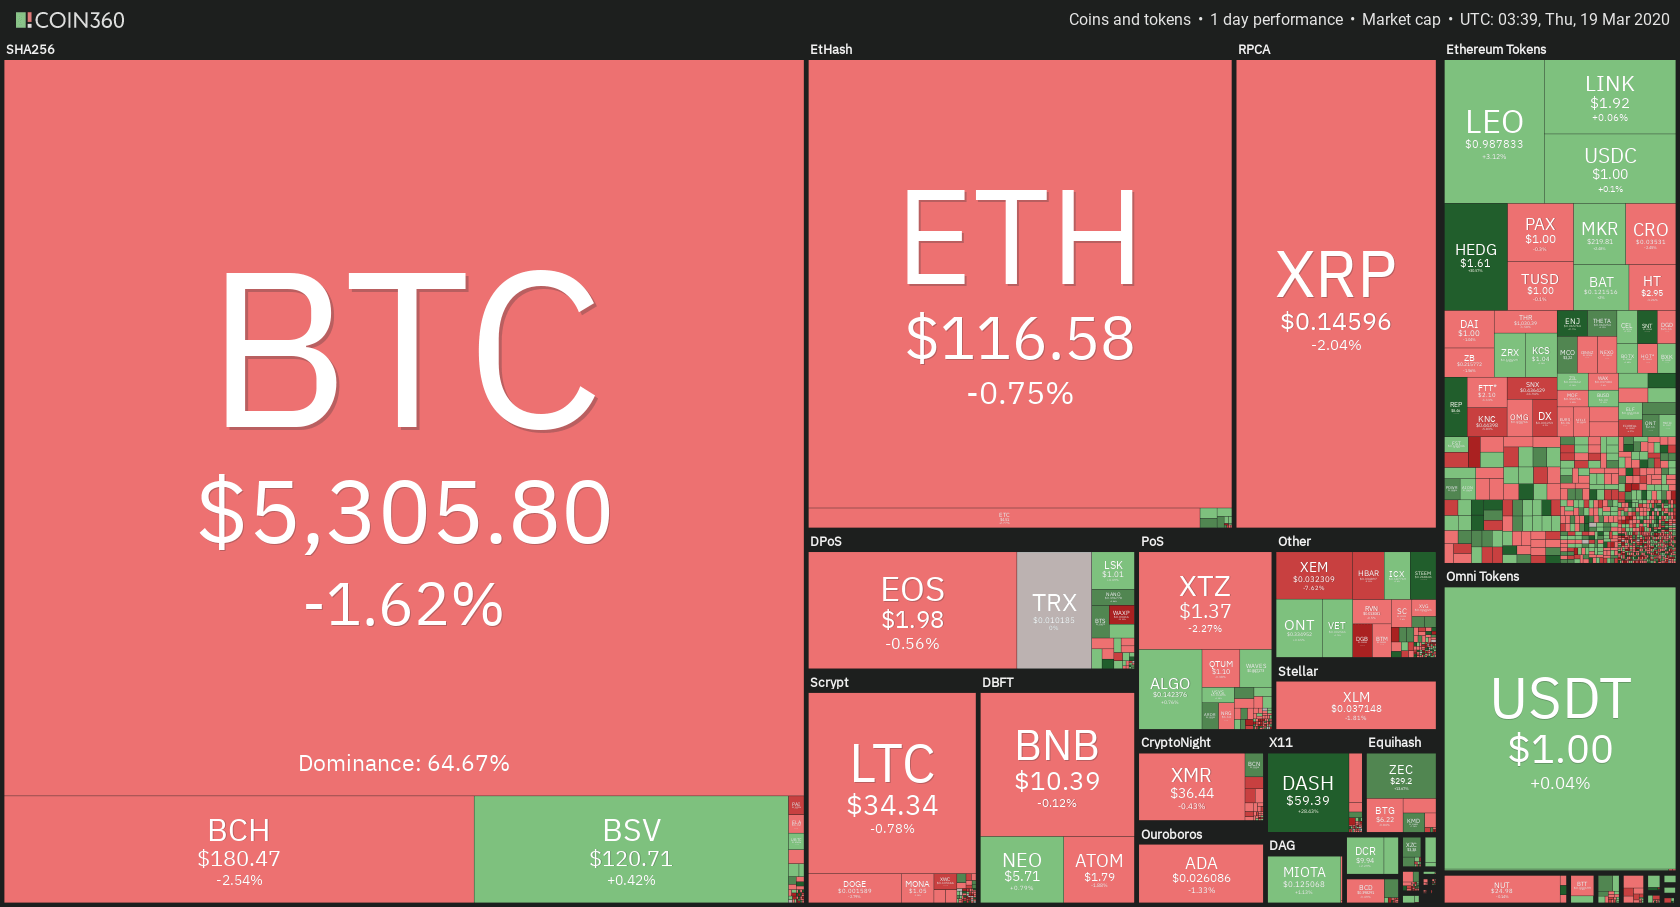
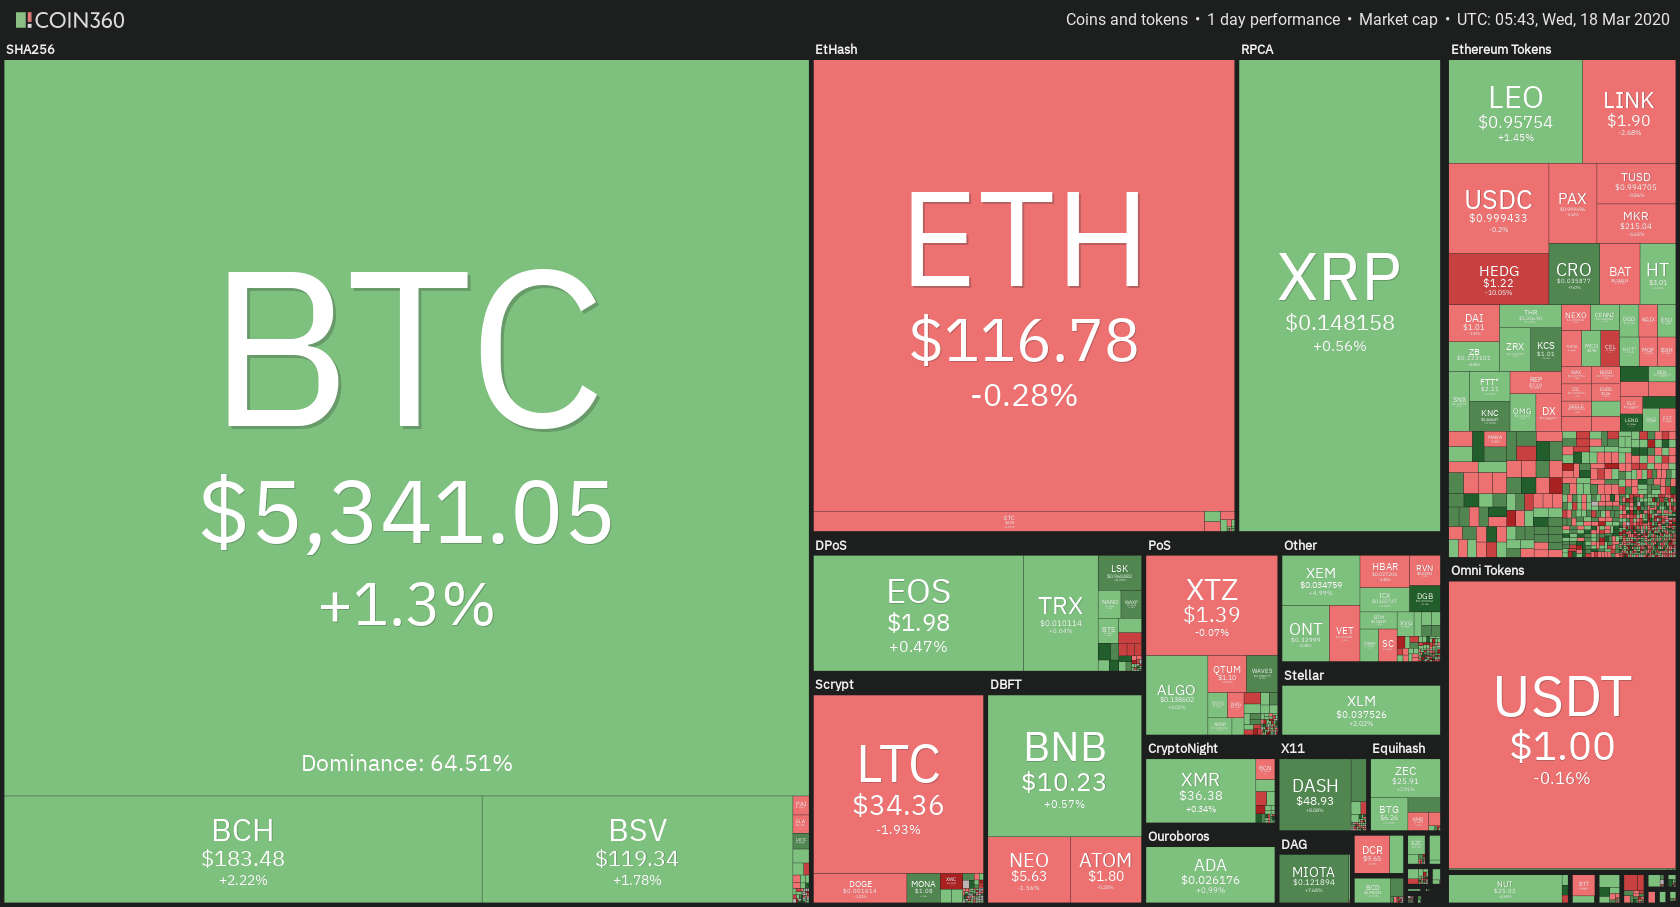
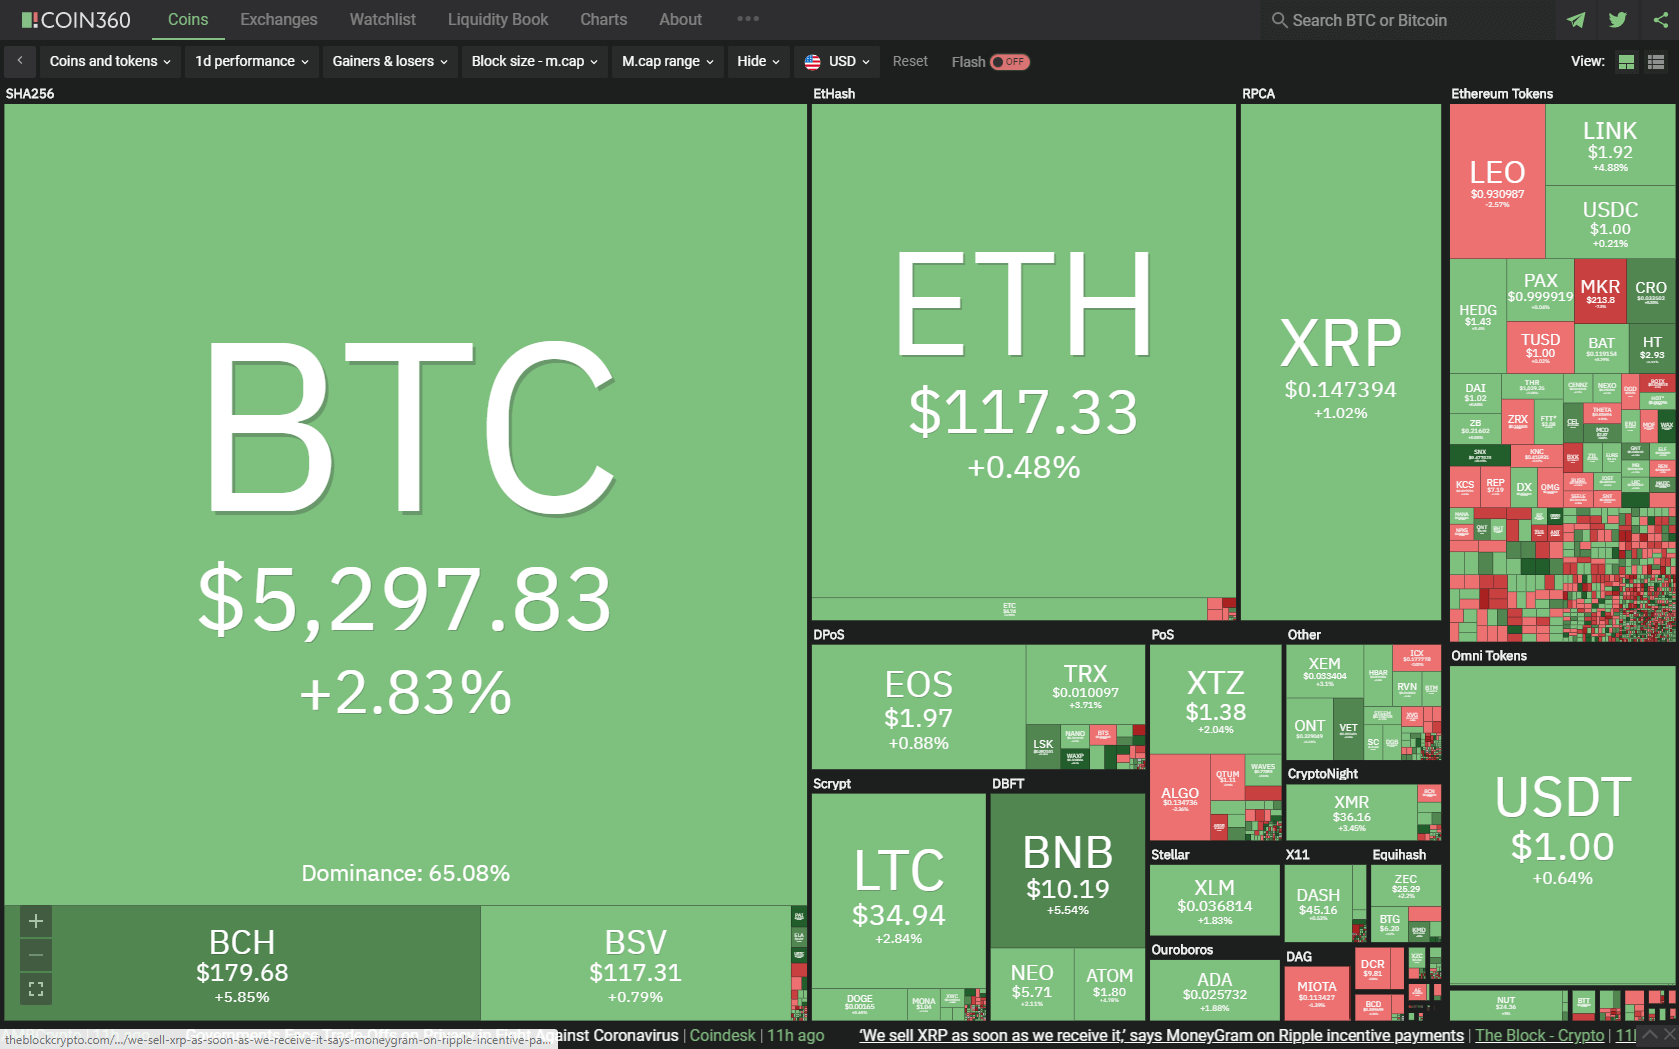
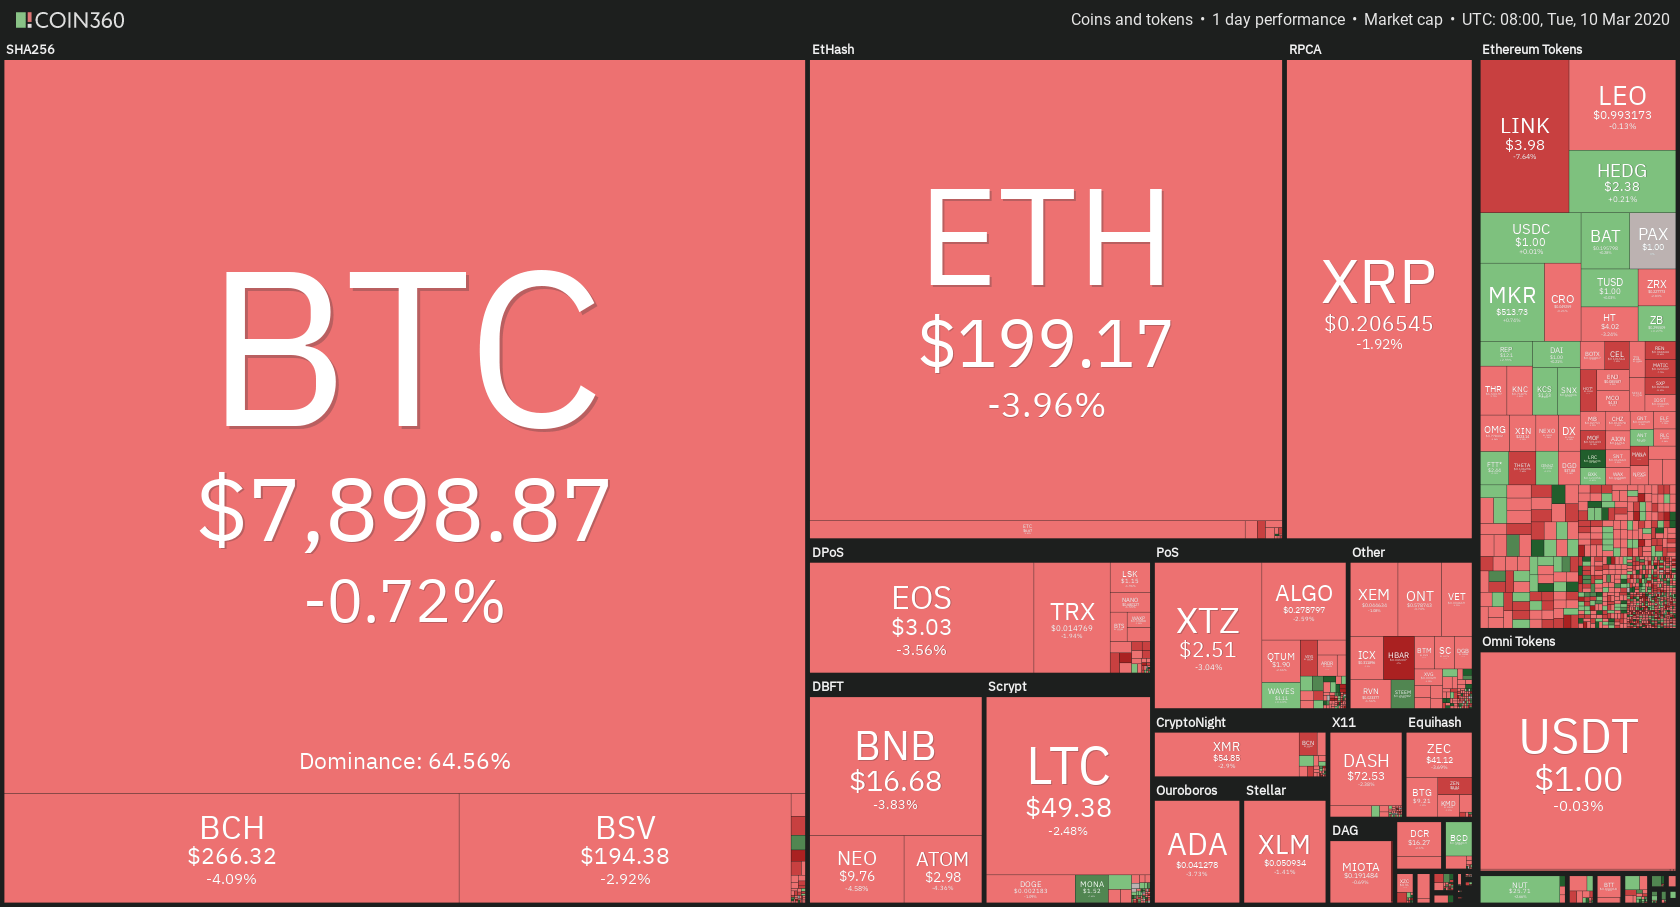
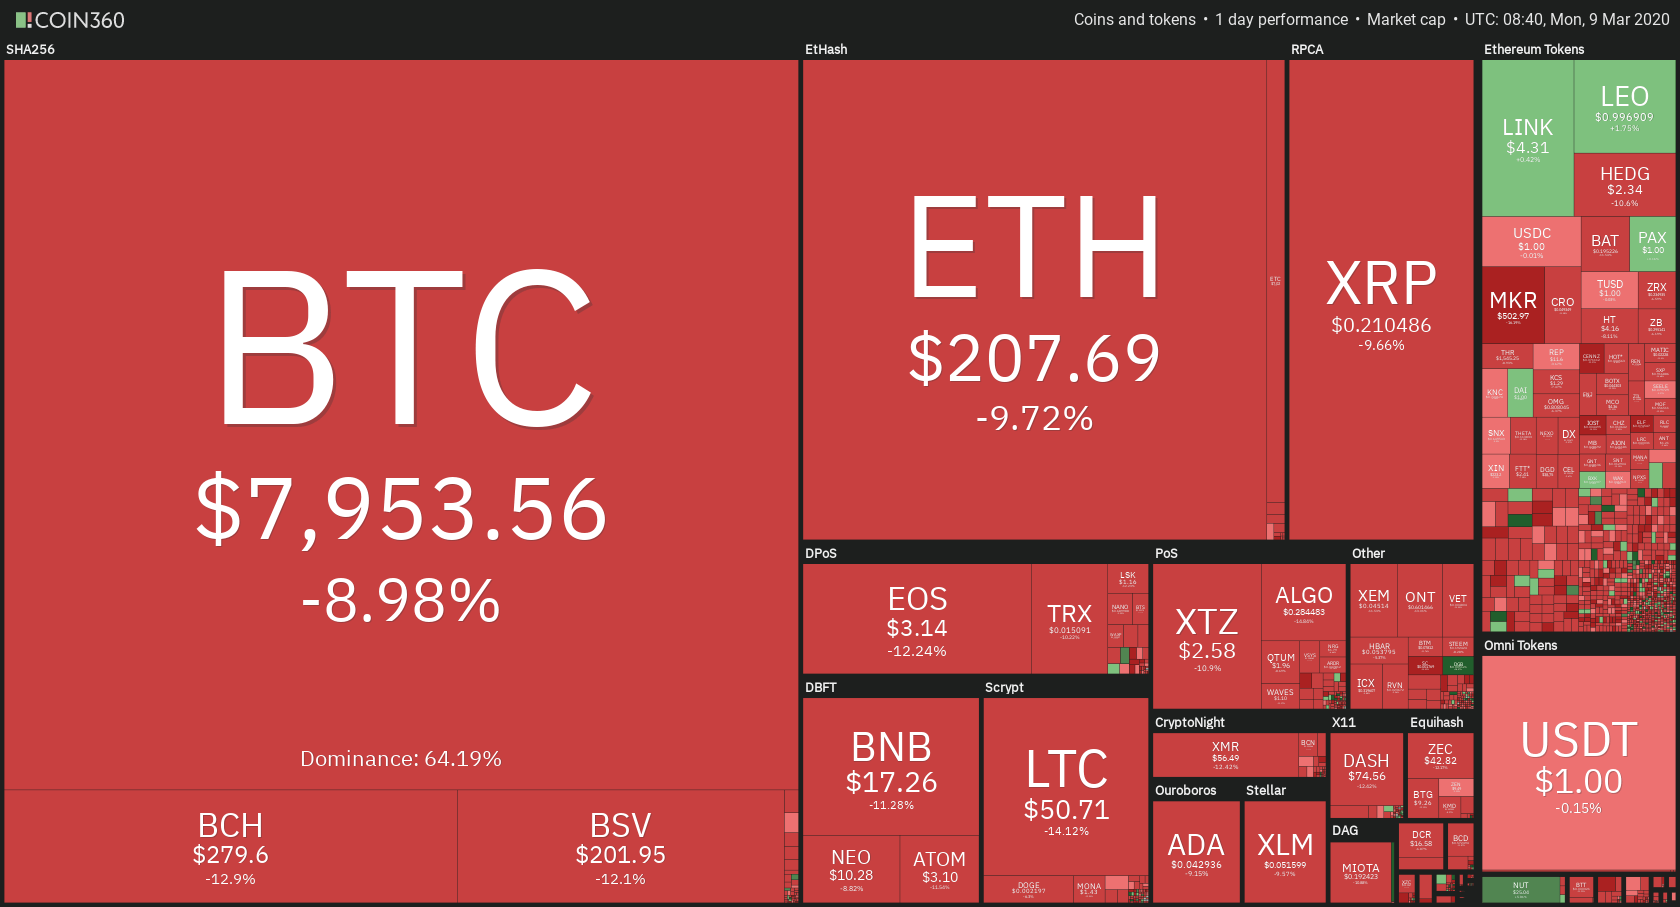
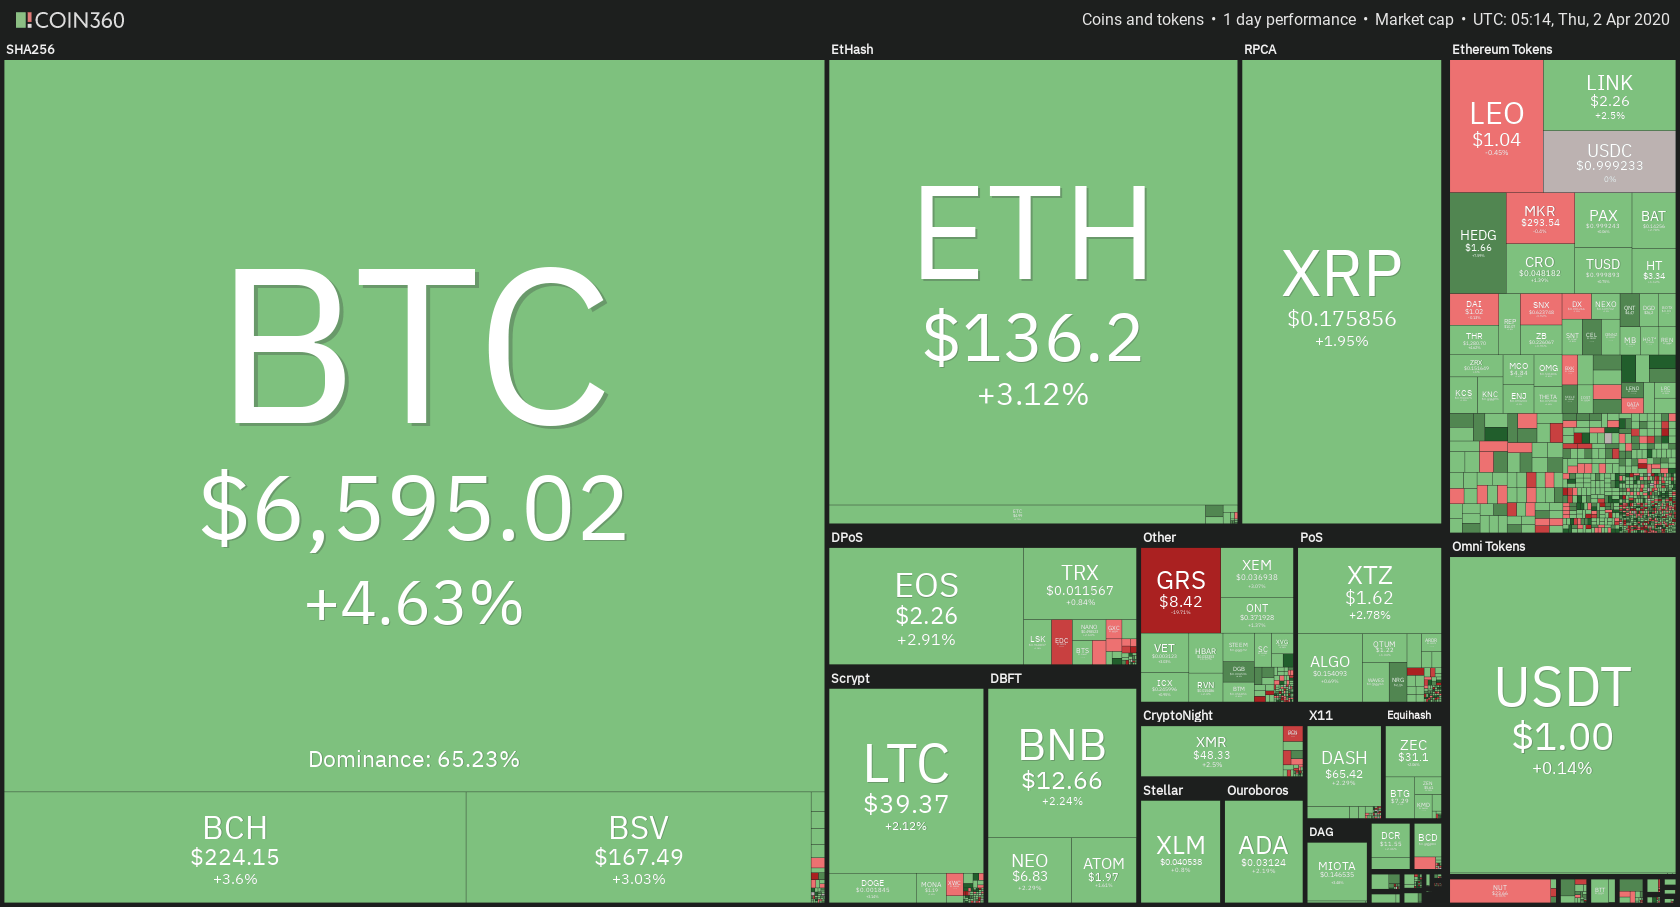
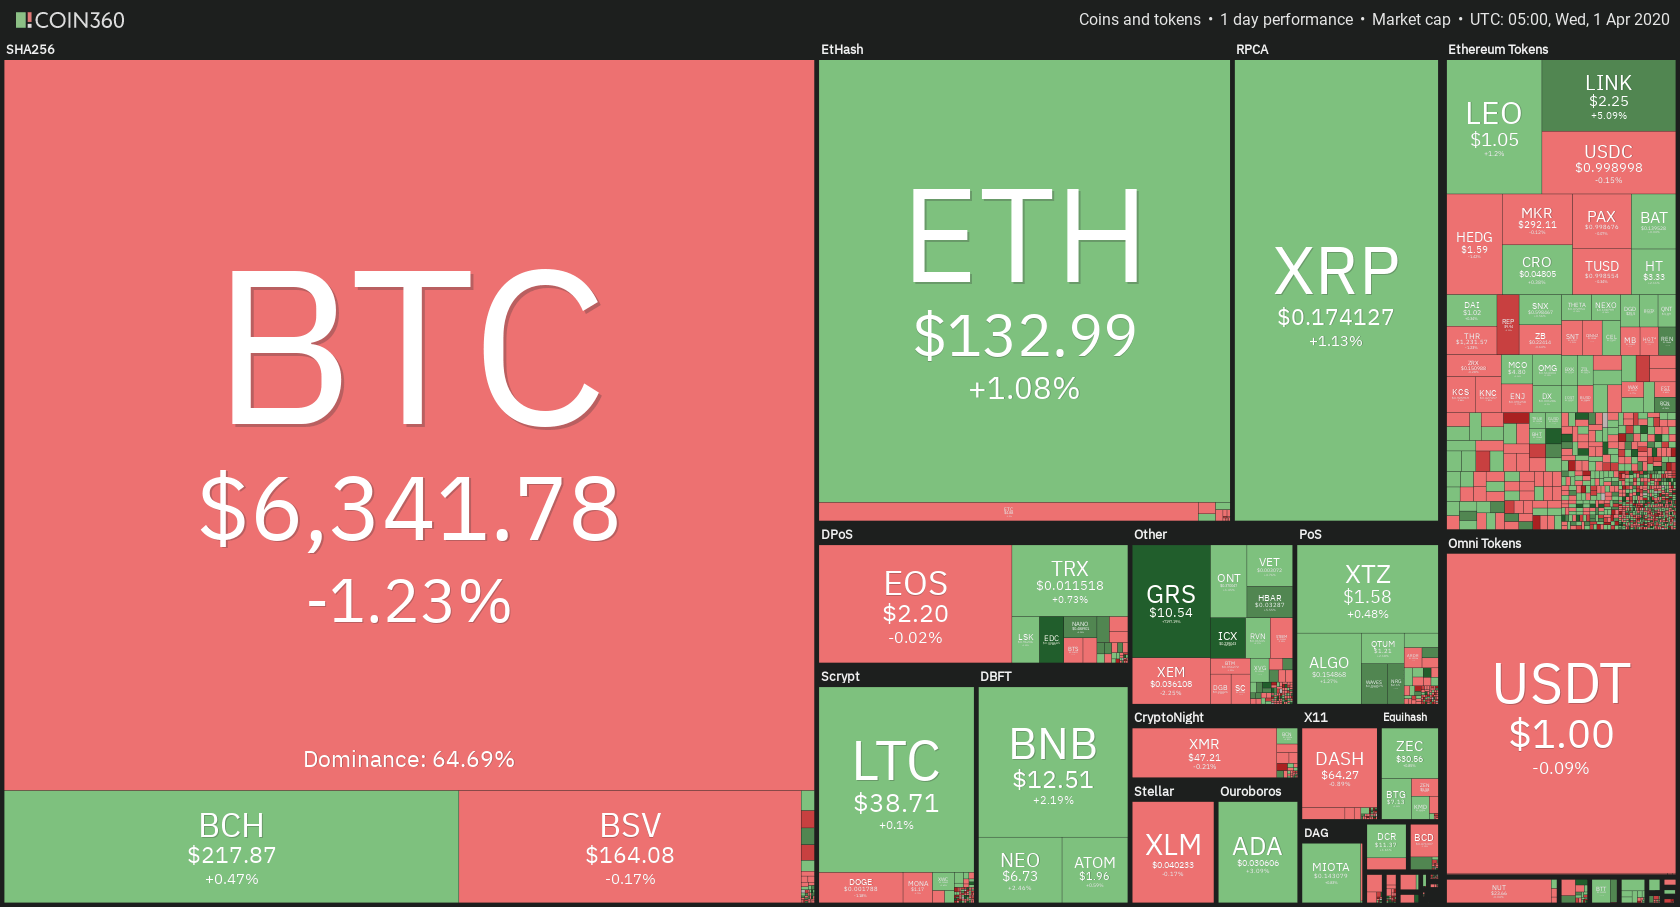
Bitcoin’s dominance stayed at almost the same place over the weekend. Its value is now 65.5%, which represents a 0.23% difference to the downside when compared to Friday.

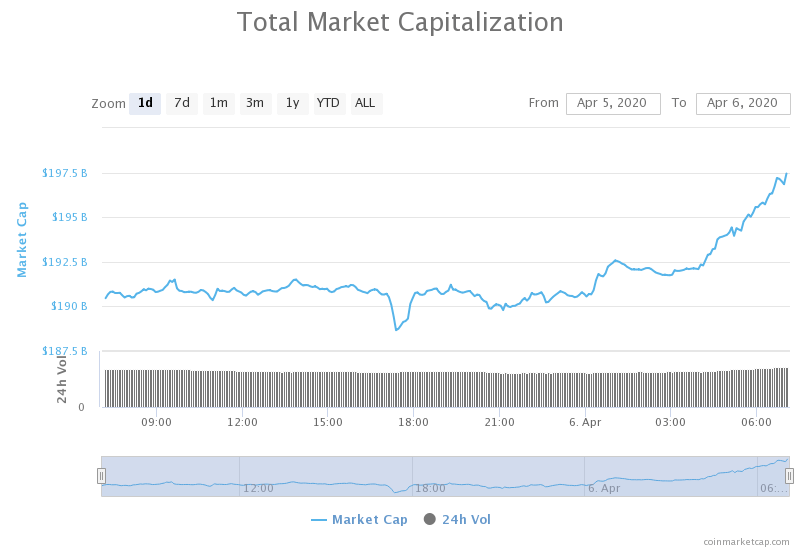
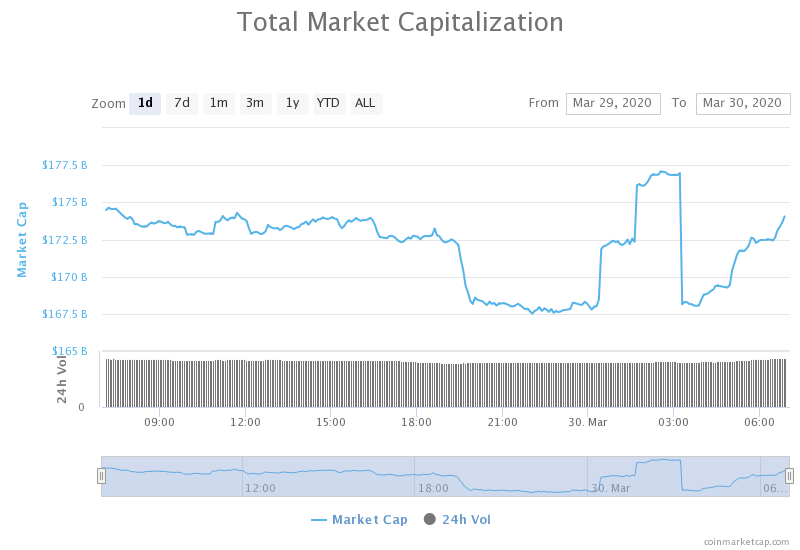
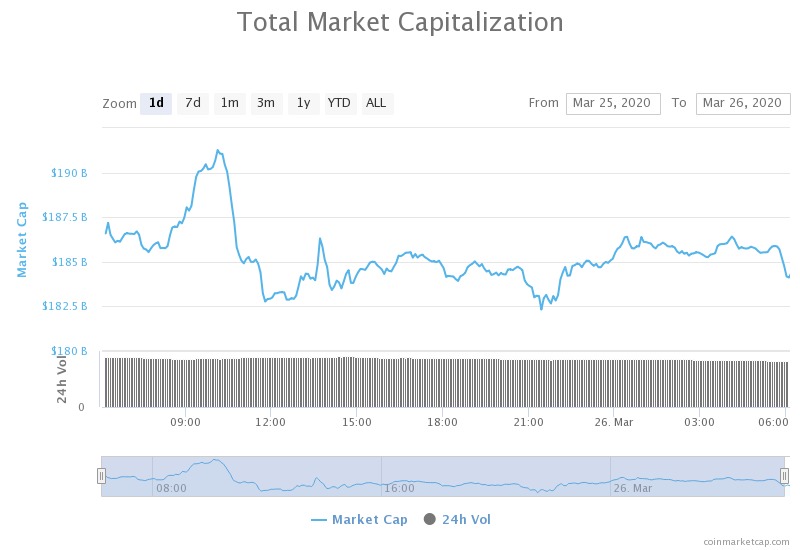
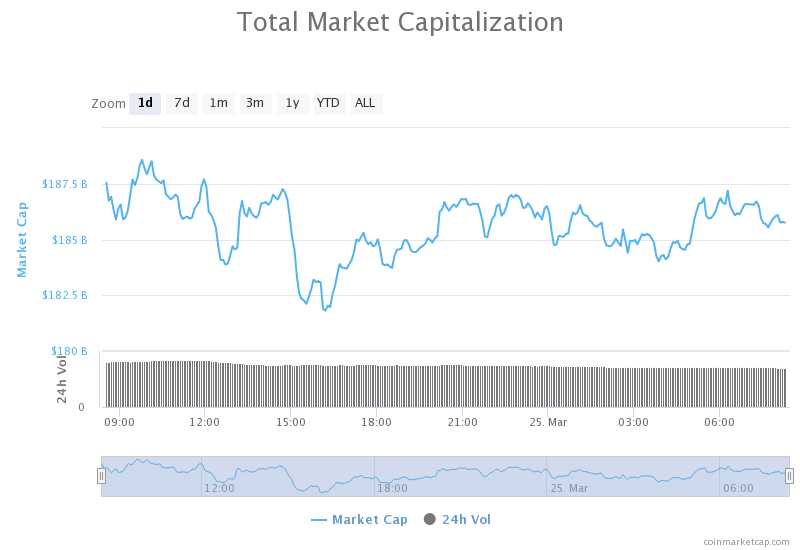
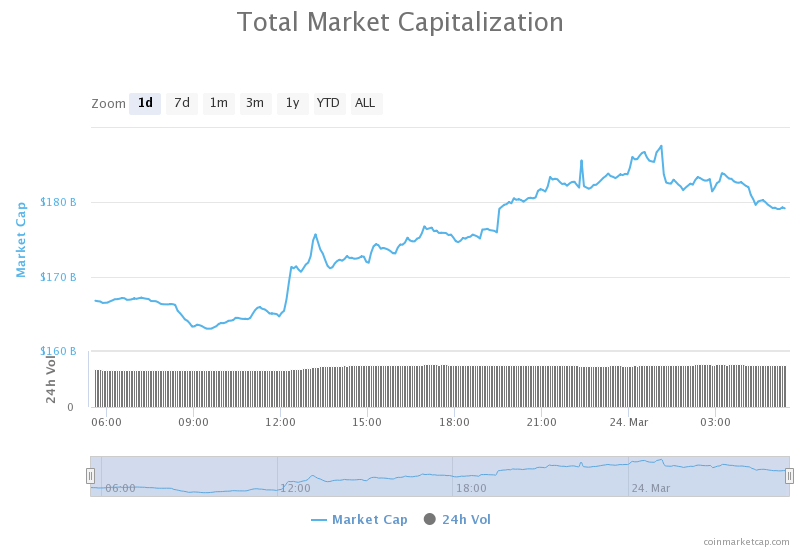
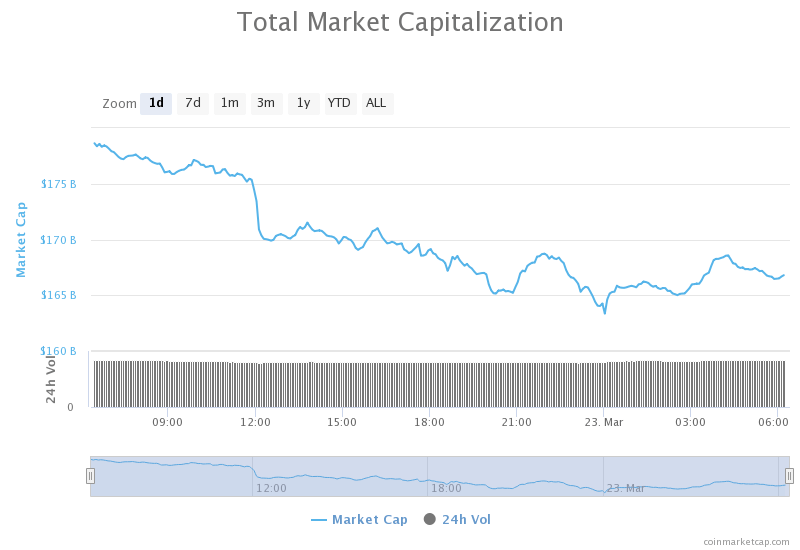
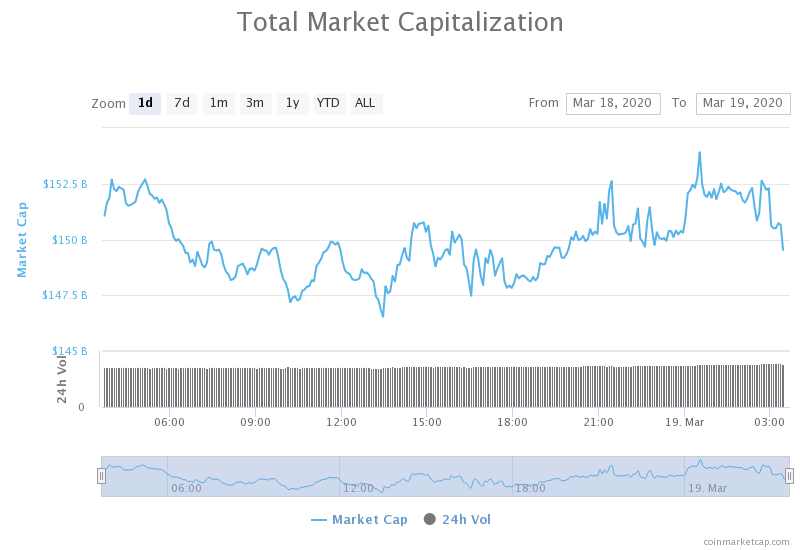
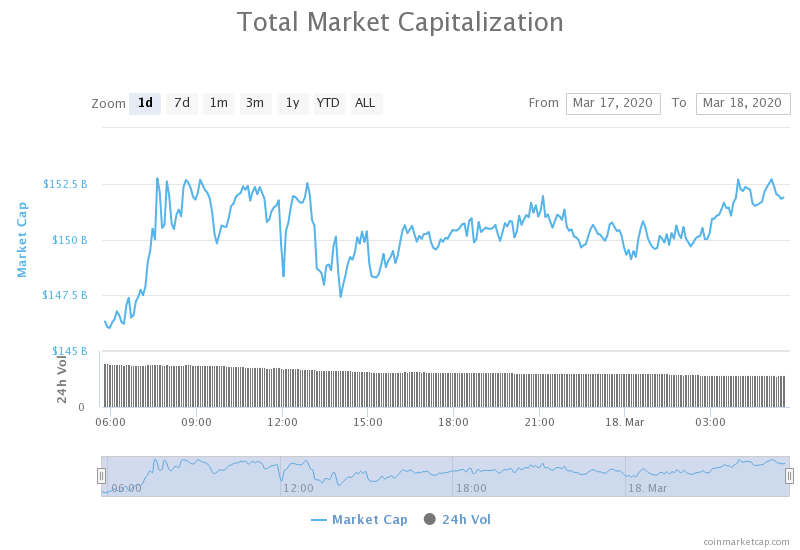
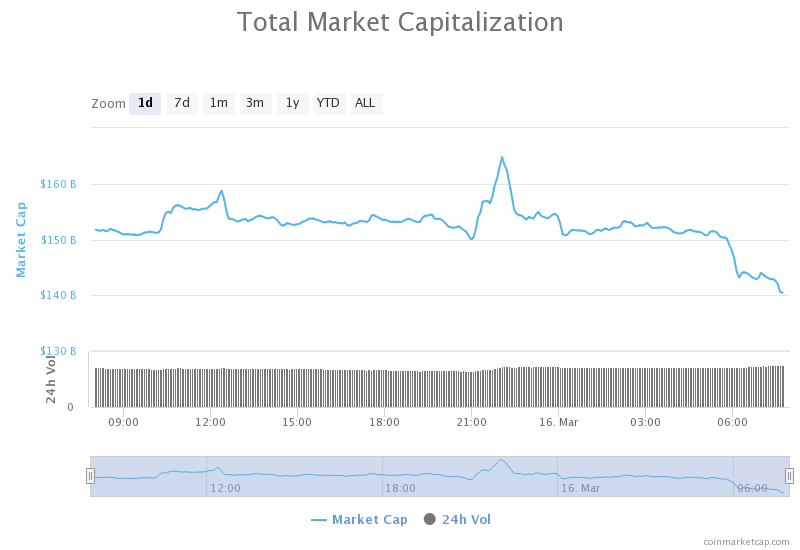
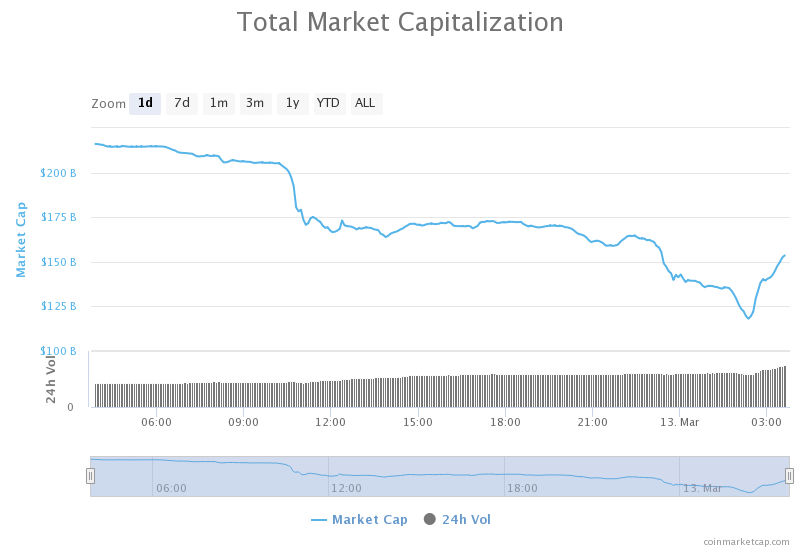
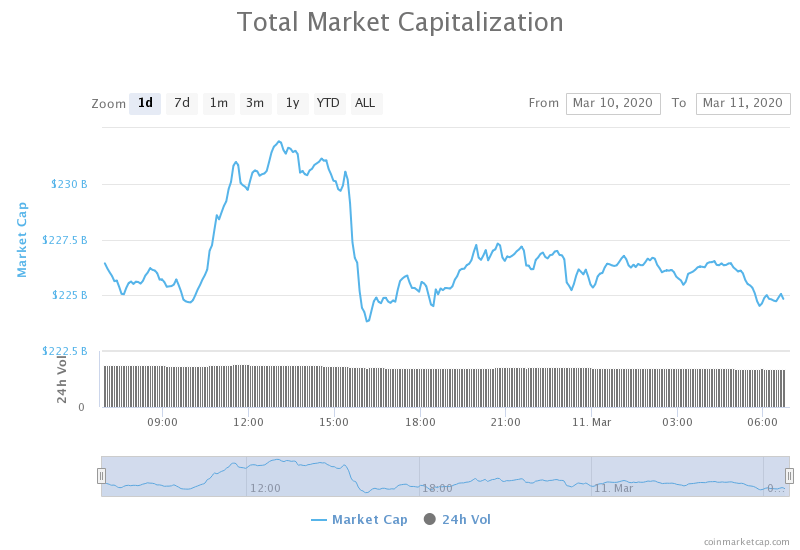
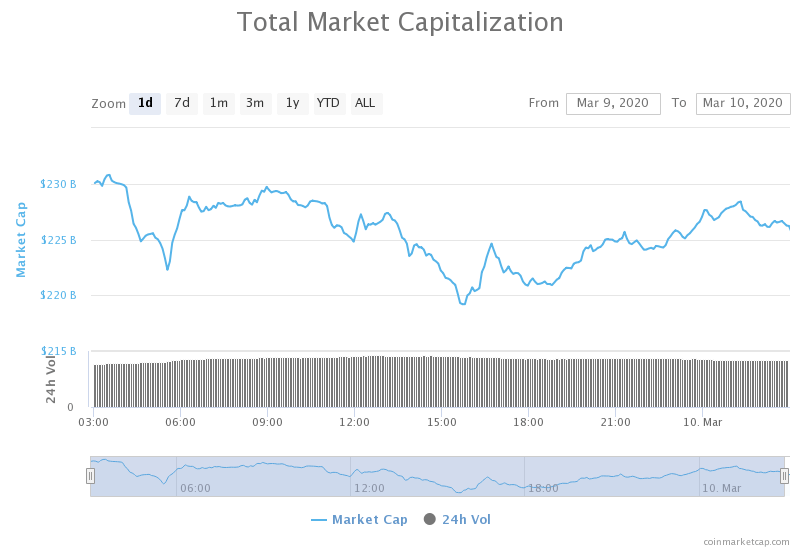
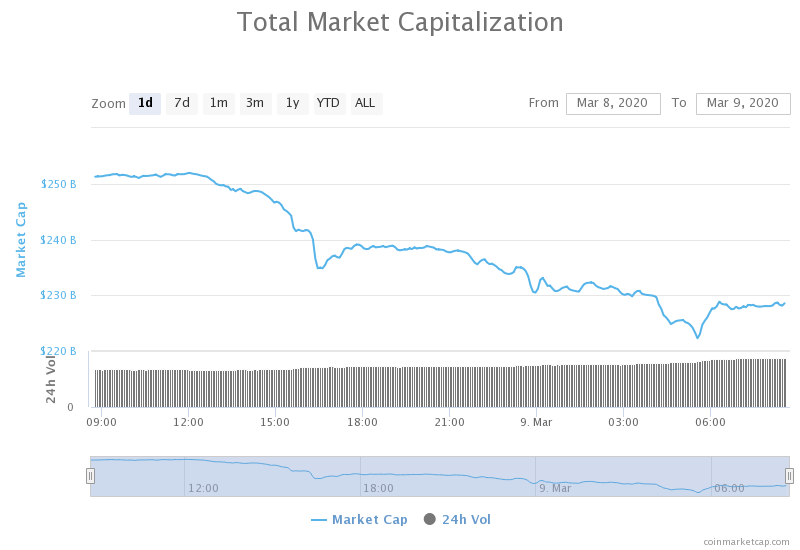
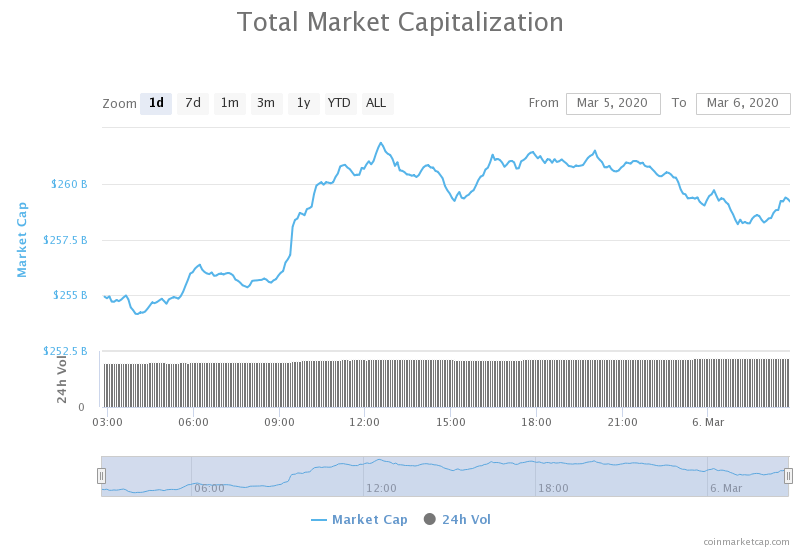
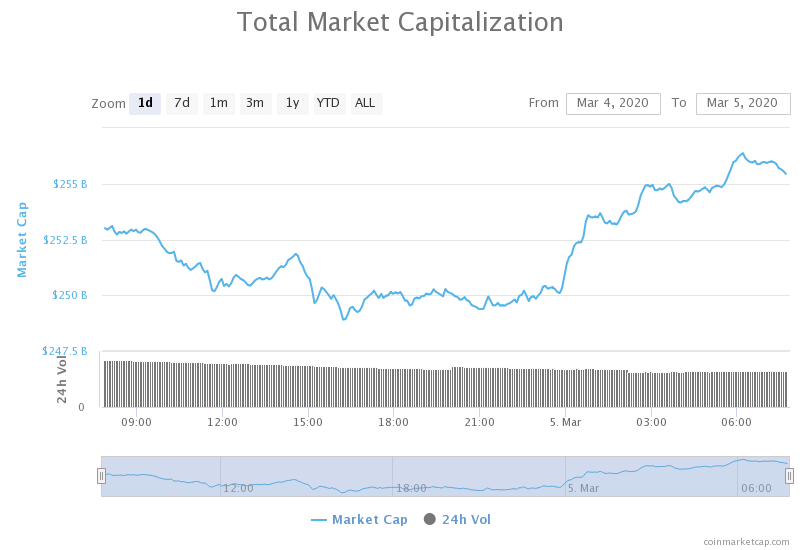
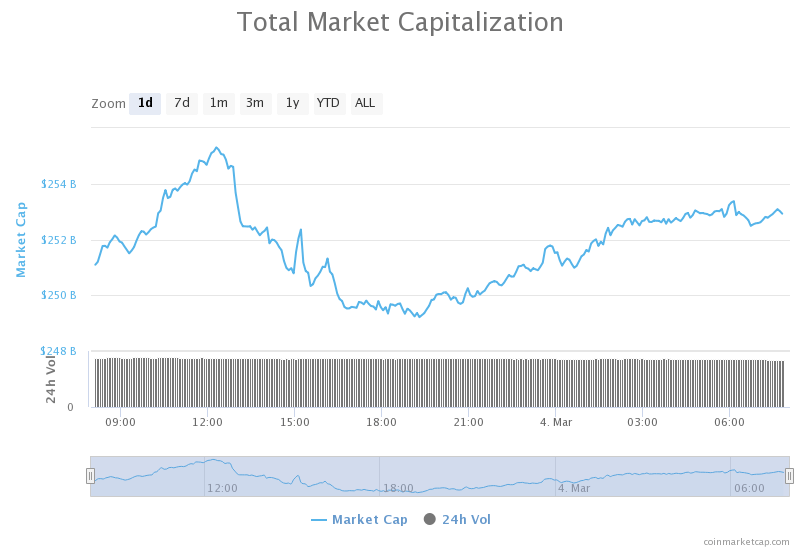
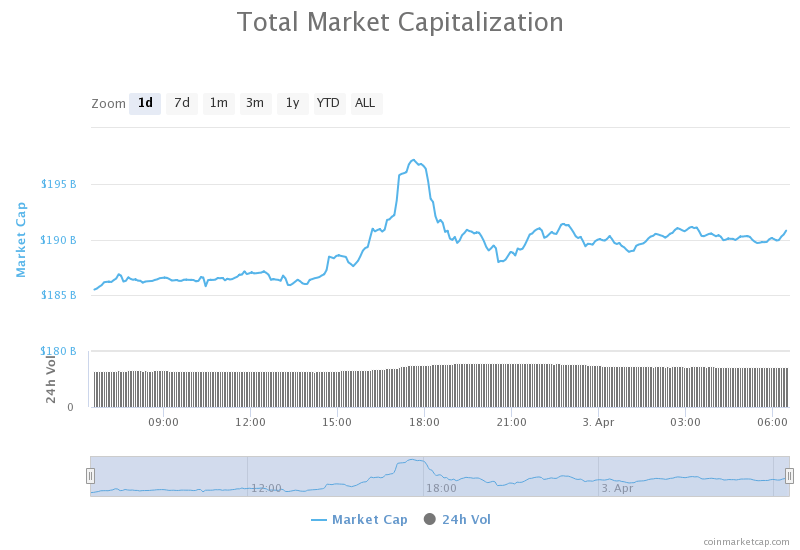
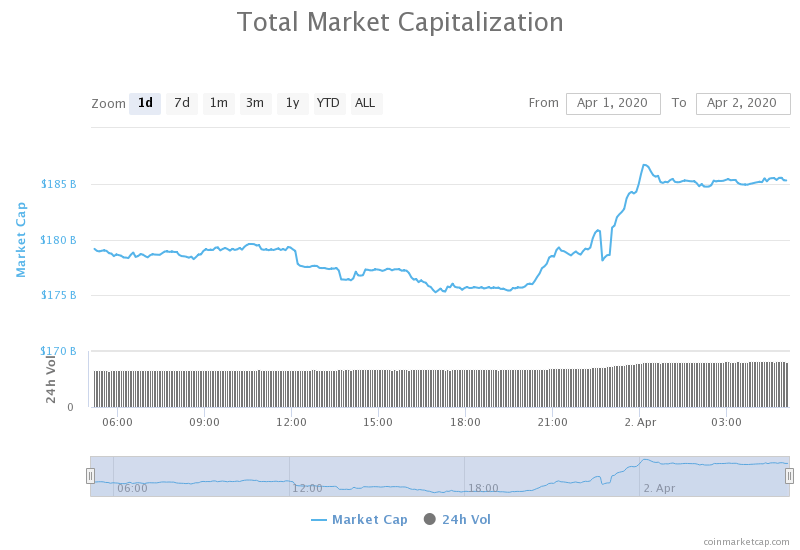
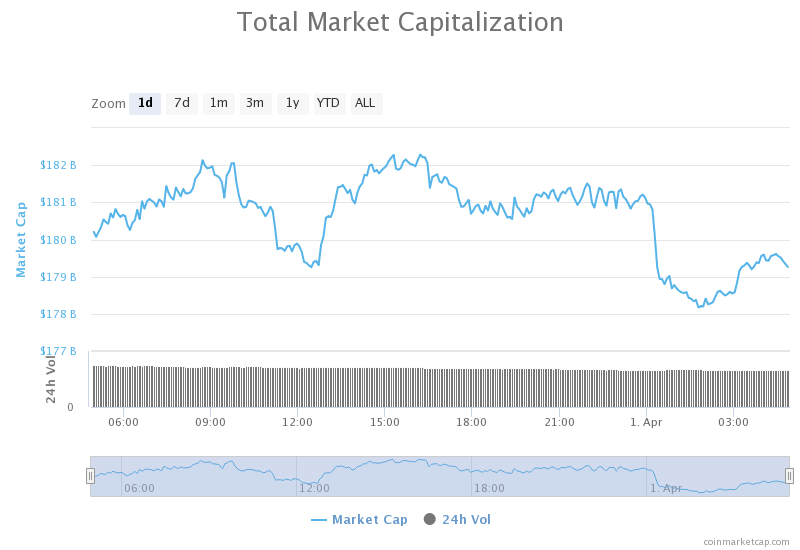
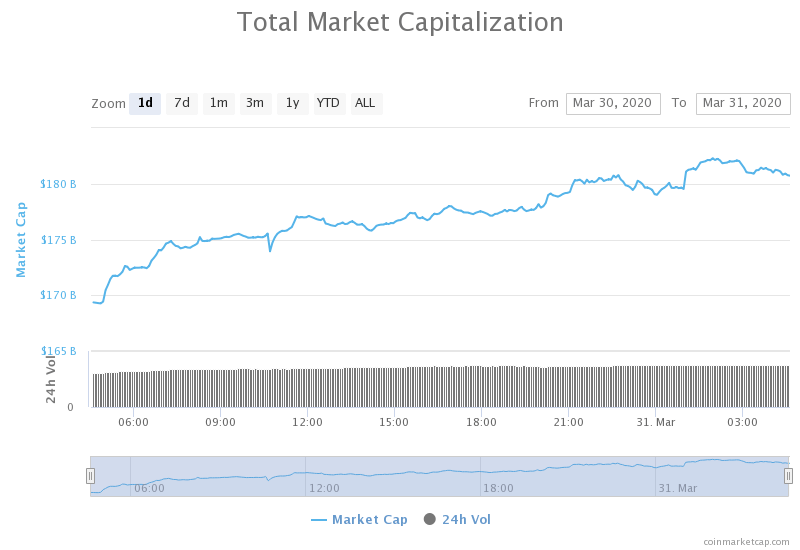
The cryptocurrency market capitalization increased greatly over the weekend. Its current value is $197.12 billion. This value represents an increase of $7.33 billion when compared to the value it had on Friday.

What happened in the past 24 hours

Michael Stay, a former Google’s software engineer as well as the current CTO of a DApp company Pyrofex, claims to have successfully hacked a certain zip file containing the private keys leading to over $300,000 in Bitcoin (BTC).

Honorable mention

Ripple

A new blockchain course that the Australian National University law school is offering this year now has full support from Ripple’s University Blockchain Research Initiative.

This partnership between ANU and UBRI will work on finding out more about how blockchain can disrupt the legal industry.

_______________________________________________________________________

Technical analysis

_______________________________________________________________________

Bitcoin

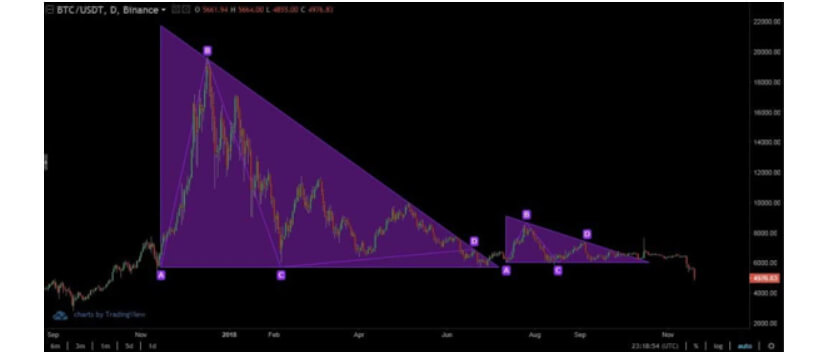
Bitcoin bulls pushed to reach new highs all throughout the weekend. The price went far above the resistance line of $6,850 three times, but came back quickly the past 2 times. This is the third time that its price has crossed the resistance. However, all three times, there wasn’t enough buying power to reach above $7,085. If Bitcoin doesn’t hold its gains, bears might get courageous and attack the downside.


Bitcoin’s volume increased compared to the previous week, while its RSI level on the 4-hour chart is 65.

Key levels to the upside                    Key levels to the downside

1: $7,085                                           1: $6,850

2: $7,420                                           2: $6,640

3: $7,750                                            3: $5,960


Ethereum

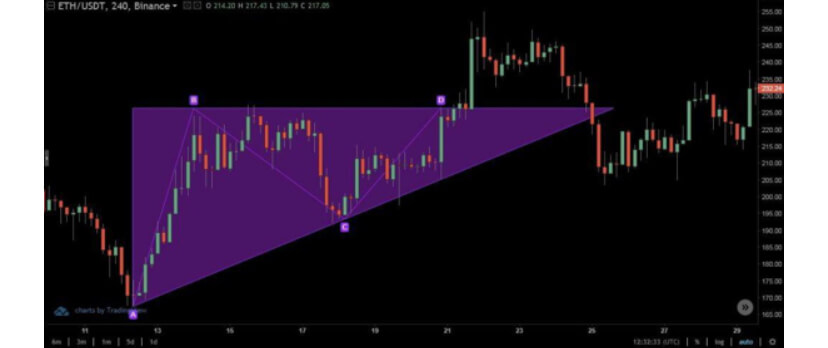
Ethereum followed Bitcoin in its jump up and even outperformed it. The second-largest cryptocurrency passed its $139 resistance level (for the first time, unlike Bitcoin passing through for the third time) and reached the level of $151. However, that level was quickly denied. Ethereum is still fighting to stay above this (now) support line as it enters the overbought territory.


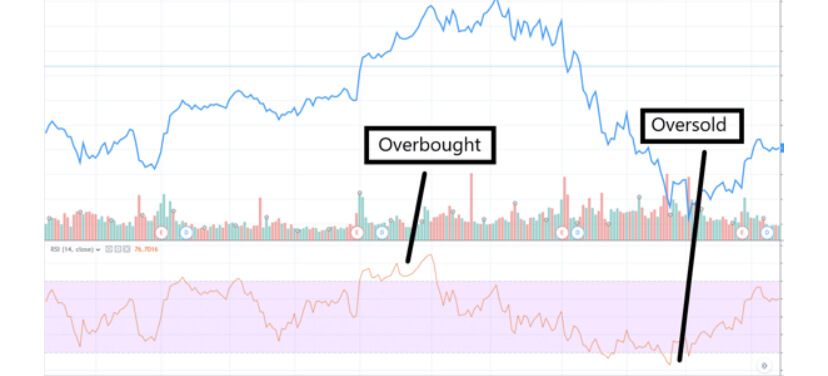
Ethereum’s volume increased during the spike, while its RSI is currently in the overbought territory (at the value of 72).

Key levels to the upside                    Key levels to the downside

1: $168                                                1: $128

2: $178.6                                            2: $122.5 

3: $185                                                3: $100


Ripple

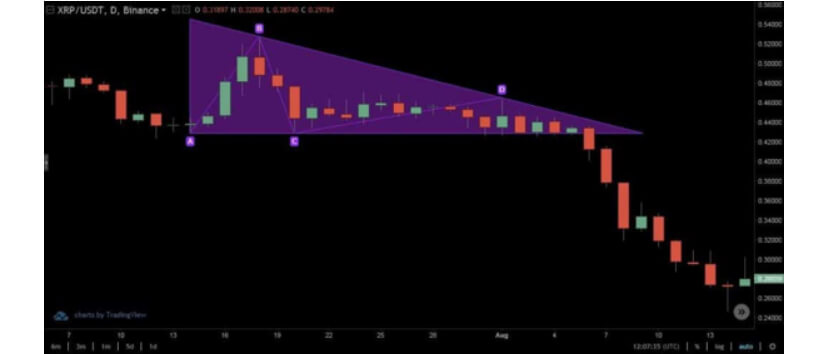
Even though XRP was the cryptocurrency that gained the least out of the top3, it still performed extremely well. XRP spent the weekend consolidating and preparing for a move, which is now happening. The third-largest cryptocurrency by market cap is reaching higher levels but is currently stuck around $0.185.


XRP’s volume increased when compared to the prior week, while its RSI level on the 4-hour chart reaches near the overbought territory, with the current value of 68.

Key levels to the upside                    Key levels to the downside

1: $0.19                                             1: $0.165

2: $0.2                                               2: $0.147

3: $0.205                                             3: $0.1

Categories
Crypto Videos

Master Crypto Trading With The 3 Black Crows Formation!

Profiting from the crypto market – Three Black Crows pattern

Three black crows are a pattern that indicates a bearish reversal of an uptrend. The black crow formation consists of three consecutive candlesticks that each opened within the read body of the previous candle and closed at a lower price than the previous candle. Traders often use this pattern in conjunction with other tools and indicators to confirm a reversal.

Three Black Crows – Explained

Three black crows is a visual pattern, which means that there are no calculations included to create the indicator. This pattern occurs when the bears overtake the bulls during a trending market. It is important to note that the candlesticks should have short to no shadows.
Being a visual pattern, three black crows are best used as a sign to seek further confirmation from other trading tools. The confidence a trader can put into the pattern greatly depends on how well-formed the pattern actually forms. If the shadows are long, it may simply imply that a minor shift in momentum will occur between the bulls and the bears.

Using volume indicators can make the three black crows pattern much more accurate. Volume during the uptrend that leads up to the pattern should be relatively low, while the three candle black crow pattern comes with high volume.

Three Black Crows vs. Three White Soldiers


Three black crows pattern has a complete opposite, which is the three white knights pattern. This pattern looks and acts exactly the same, but is completely reversed. It signals a bear to bull reversal and has three bullish candles instead of bearish ones.

Notable info

If the three black crows pattern formation involves a significant move to the downside, traders should be careful and look for oversold conditions caused by market instability. To mitigate this threat of pattern failure, we have to use an oscillator that can help with confirmation of the market reversal.

Categories
Crypto Market Analysis

Daily Crypto Review, Apr 3 – Bitcoin over $7,000? Is the downtrend finally over?

The cryptocurrency market had another, even more, successful push to the upside. The upswing was led by Bitcoin, which broke its immediate resistance. However, many altcoins outperformed it during the spike. Bitcoin is currently trading for $6,820, which represents an increase of 2.68% on the day. Meanwhile, Ethereum gained 3.99% on the day, while XRP gained 1.43%.

Swipe took the position of today’s most prominent daily gainer, with gains of 109.03%. Energi lost 5.453% on the day, making it the most prominent daily loser.

Bitcoin’s dominance increased half a percent in the past 24 hours as it was the one leading the push and gaining the most in value. Its value is now 65.73%, which represents a 0.5% difference to the upside when compared to yesterday.

The cryptocurrency market capitalization increased in the past 24 hours. Its current value is $190.79 billion. This value represents an increase of $5.49 billion when compared to the value it had yesterday.

What happened in the past 24 hours

The largest crypto exchange by market volume, Binance, has acquired the most popular crypto indexing website, CoinMarketCap. The purchase was made in secret, which means that the price is still undisclosed.

Binance CEO Changpeng Zhao announced that the deal officially closed March 31, even though a verbal agreement was there “a few months ago.”

Honorable mention

Stellar Lumens (XLM)

The Stellar Development Foundation has shown that it is thinking of the endangered during the times of crisis. It decided to dedicate 2.5 million Lumens to 6 non-profit organizations to help the coronavirus crisis. On top of that, they are very vocal in calling out the community to help.

The foundation will start the initiative off by donating 100,000 Lumens to each of the six charities, while the remaining funds will be used to match the community contributions on a 1-1 basis throughout the month of April.

_______________________________________________________________________

Technical analysis

_______________________________________________________________________

Bitcoin

Bitcoin bulls finally mustered enough strength to reach above the immediate resistance of $6,640, which was contested many times over the past couple of days. The push was gradual rather than sudden, and BTC managed to even contest the next resistance level ($6,850) which held up well. However, one candle brought extreme volume and pushed Bitcoin just below $7,300 just briefly.


Bitcoin’s volume increased when compared to the previous days, while its RSI level is hovering below the overbought territory.

Key levels to the upside                    Key levels to the downside

1: $6,850                                           1: $6,640

2: $7,085                                           2: $5,960

3: $7,420                                            3: $5,000


Ethereum

Ethereum had a clean, steady run to the upside, with its price going from $130 all the way up to $143, where it is trading at the time of writing. The second-largest cryptocurrency by market cap finally had an increase in volume after a long period of low-volume trading. The price, at one point, briefly spiked all the way up to the $150 but was quickly brought back down.


Ethereum’s RSI level is currently in the overbought territory on the 4-hour chart, sitting at around $74. A few resistance levels have been added, but they have not been confirmed as key levels yet.

Key levels to the upside                    Key levels to the downside

1: $168                                                1: $128

2: $178.6                                            2: $122.5 

3: $185                                                3: $100


Ripple

Ever since XRP has left the descending trend, it has been quite stable and upside-oriented. However, its gains did not match the rest of the crypto market. This is the case with today’s gains as well, as XRP gained the least out of the top3 cryptos. However, the move to the upside was steady, and the volume was increased.


XRP’s volume increased multiple times during one 4-hour candle, while it was slightly increased over the rest of the day. Its RSI level is currently at 61.

Key levels to the upside                    Key levels to the downside

1: $0.19                                             1: $0.165

2: $0.2                                               2: $0.147

3: $0.205                                             3: $0.1

Categories
Crypto Videos

Trading Crypto With The Three White Soldiers Pattern! Making Consistent Money

Profiting from the crypto market – Three White Soldiers pattern

Three white soldiers is a candlestick pattern used to predict current downtrend reversals in a pricing chart. The pattern is made of three long-bodied candlesticks that open within the previous candle’s body and close over the previous candle’s high. The candlesticks should not have long shadows.

The three white soldiers pattern suggests a strong market sentiment change. If a candle is closing with small to no shadows, it suggests that bulls have taken over the price and kept it at the top of the range.

Trading the three white soldiers pattern

As the three white soldiers is a bullish visual pattern, it is mostly used as an entry or exit point. Traders wanting to short a cryptocurrency look to exit, while traders who want to go long on a crypto see three white soldiers as an entry point.

When trading the three white soldiers pattern, make sure to take into consideration that the strong move higher might create temporary overbought conditions. That’s why this pattern should be paired up with oscillators, which may confirm the market reversal.

Three White Soldiers vs. Three Black Crows


The three white soldiers’ opposite pattern is the three black crows pattern. Three black crows have all the same attributes of the three white soldiers but in reverse. It consists of three consecutive candlesticks that open within the real body of the previous candle while closing lower than the previous candlestick. While three white soldiers mark a reversal from bear to the bull trend, three black crows show market reversal from bullish to bearish.

Things to consider

Three white soldiers might also appear during periods of consolidation, rather than during a trend. This is an easy way to fall into a trap, so one should take a good look at the longer time frames before trading Three white soldiers. One of the key things to take note of is the volume that supports the formation of this pattern. Any pattern is susceptible to failing in low volume conditions.

Categories
Crypto Market Analysis

Daily Crypto Review, Apr 2 – Bitcoin failing to break $6,640; What’s next?

The cryptocurrency market attempted another push towards new highs as Bitcoin bulls tried to get its price above $6,640. Even though most cryptos are in the green, the push was not successful, which may pose a problem in the short term. Bitcoin is currently trading for $6,595, which represents an increase of 4.63% on the day. Meanwhile, Ethereum gained 3.12% on the day, while XRP gained 1.95%.

Digitex Futures took the position of today’s most prominent daily gainer, with gains of 26.06%. IOTA lost 4.53% on the day, making it the most prominent daily loser.

Bitcoin’s dominance increased over half a percent over the past 24 hours as it was the one leading the push and gaining the most in value. Its value is now 65.23%, which represents a 0.54% difference to the upside when compared to yesterday.

The cryptocurrency market capitalization increased in the past 24 hours. Its current value is $185.3 billion. This value represents an increase of $5.8 billion when compared to the value it had yesterday.

What happened in the past 24 hours

Statistics on crypto adoption came out recently, showing that online purchases using Bitcoin went down during Q1 of 2020. However, the same goes for Visa and some other apps. However, crypto exchanges saw a major increase in new accounts in 2020, showing that people are responding to the price drop opportunistically.

What seems to be the case here is that people recognize crypto as a way to hedge their portfolios, so they are investing. However, due to the economic crisis knocking at our doors, people that do not have enough funds simply can’t spend it on online purchases, which is reducing the real-world use cases significantly.

Honorable mention

Ripple

The class-action lawsuit against Ripple had an amendment which includes additional claims of false advertising as well as unfair competition, now claiming that XRP might not be a security.”

The investors’ sixth and seventh claims would appear to be a direct hedge for the event that the judge rules “against” the original suit, basically saying that XRP was an unregistered security, and therefore sold as such.

_______________________________________________________________________

Technical analysis

_______________________________________________________________________

Bitcoin

After a steady day of consolidating, Bitcoin attempted another swift push towards the $6,640 resistance level. Even though the price reached over the level, it was quickly pushed down, announcing the fail of the push. Bitcoin is currently trading just under this key level. If the trend of Bitcoin failing to break the immediate resistances continues, we may expect a retest of the lows very soon.


Bitcoin’s volume almost tripled during the push, but quickly normalized. Its RSI level is now descending and is currently at the value of 59.

Key levels to the upside                    Key levels to the downside

1: $6,640                                           1: $5,960

2: $6,850                                           2: $5,000

3: $7,085                                            3: $4,300


Ethereum

We said yesterday that Ethereum would most likely not move without Bitcoin moving first, therefore deciding its direction. This is exactly what happened today. Ethereum followed Bitcoin to the upside, but only managing to reach its $139 resistance level before stopping the move. This key level held up strong, and ETH did not even manage to go above it.


Ethereum’s volume increased during the upswing but quickly dwindled to its usual low levels. Its RSI level is currently at 60.5.

Key levels to the upside                    Key levels to the downside

1: $168                                                1: $128

2: $178.6                                            2: $122.5 

3: $185                                                3: $100


Ripple

XRP didn’t have as good a day as BTC or ETH did, as its price didn’t increase as much. However, the fact that XRP didn’t go back under the descending trend seems to be good enough. XRP seems to be responding to a level between $0.1765 and $0.1785.


XRP’s volume increased each time the cryptocurrency retested the descending trend line. Its RSI is currently sitting at the value of 56.

Key levels to the upside                    Key levels to the downside

1: $0.19                                             1: $0.165

2: $0.2                                               2: $0.147

3: $0.205                                             3: $0.1

Categories
Crypto Videos

Master Crypto Trading With The Cup & Handle Formation Part 2!


Make money in Crypto by spotting the Cup and Handle pattern – part 2/2

Picking a Profit Target


Determining the profit target is quite simple with this pattern; all you need to do is add the height of the cup to the point of breakout.
There will be times when the left side of the cup is a slightly different height than the right side. In this case, you should use the smaller height to stay on the conservative side, or the larger height for an aggressive approach.


In addition to using the cup and handle formation, you can use the Fibonacci extension indicator to create a great crypto trading strategy (as seen on the chart). Draw the extension tool from the low of the cup to the high on the right side of the cup. Then, connect the tool down to the handle low. The 1, or 100%, level represents a conservative price target, while the 1.618, or 162%, and represents a very aggressive target. The possible targets can then be placed anywhere in between 1 and 1.618.

Things to consider

Traditionally, the cup has a pause at the bottom of the cup built in the formation, where it moves sideways or forms a rounded bottom. This movement shows that the price found a support level and will not drop below it. However, this pattern can also have a so-called V-bottom.
A V-bottom occurs when the price drops and then sharply rallies. Some traders like trading this form of a cup and handle, while others do not. The argument of V-bottom traders is that the sharp reversal of the downtrend shows that buyers stepped in aggressively, signaling strength. Opponents of the V-bottom say that the price didn’t stabilize before bottoming, therefore making the price unstable and susceptible to retesting the level.
When trading this pattern, always look for additional confirmation. It can be found by looking for the bottom of the cup and seeing if it aligns with a longer-term support level. Consider using indicators and tools to determine the support and resistance levels and check if they align or interfere with the cup and handle targets.

Categories
Crypto Videos

Trading Crypto Using The Double Top & Bottom Formation

Trading Crypto using Double Top and Bottom patterns

This year has brought many uncertainties in all aspects of the world, especially health and finance. Cryptocurrencies have not been an exception, either. For the past couple of months, the sentiment has changed from very bullish to very bearish. The trend changed as quickly and sharply as the sentiment did. This is why we will cover the patterns which signal a trend reversal, called “double top” and “double bottom.

Double Top pattern

This image represents a double top pattern. After a cryptocurrency’s has trended upward for a while, it will create a top in price. Investors will often close their positions during this pause of the market, thus creating a downward trend in price. Shortly after that, the value rises again, reaching a second top at almost the exact same price as the previous one. These two tops form a double top pattern, which is essentially a test of the market.

The market is tested in terms of whether the price is susceptible to be nudged higher or not. The downward trend after the second top shows that the market does not have enough of a drive to go further up and that it will trend downward again. In a nutshell, the distinct shape of a double top that is quite similar to the letter M represents a bearish move.

Double Bottom pattern

As expected, the double bottom represents everything that the double top represents, but in reverse. Rather than testing the upside of a cryptocurrency, the market testing comes after a downward move and tests if the market is ready to go further down. The double bottom pattern is recognized by the two inverted peaks that are formed at approximately the same price level.

When it happens that the downward trend has been tested twice, and the bottom has been found, then the market will reverse, and the uptrend will start. In a nutshell, the distinct shape of a double bottom that is quite similar to the letter W represents a bullish move.

Additional information

The double top pattern and the double bottom patterns are price reversal indicators. However, there is always the risk that you will encounter a false reversal, meaning that the price movement will play out just the way you want for a very short amount of time, and then do the complete opposite. That’s why it is important to mitigate the risk by doing a couple of things. First, set the stop-loss below the double bottoms or above the double tops. Second, make sure to wait for a candle close in your direction to get a confirmation of the trend reversal. Ultimately, you can pair trading this pattern with candlestick analysis, indicators, and other tools at your disposal.

As the last piece of advice, try to make trades where the double bottom or top will show a trend reversal to a direction of the longer time-frame trend. This way, you will trade alongside the long-term trend, which is much safer than trading against.

Categories
Crypto Market Analysis

Daily Crypto Review, Apr 1 – Crypto Outperforming Traditional Markets in Q1

The cryptocurrency market had a pretty stable day as most cryptos consolidated within previously achieved levels. Bitcoin is currently trading for $6,341, which represents a decrease of 1.23% on the day. Meanwhile, Ethereum gained 1.08% on the day, while XRP gained 1.13%.

ICON took the position of today’s most prominent daily gainer, with gains of 15.80%. Nervos Network lost 8.51% on the day, making it the most prominent daily loser.

Bitcoin’s dominance dropped almost a whole percent over the past 24 hours. Its value is now 64.69%, which represents a 0.78% difference to the downside when compared to yesterday.

The cryptocurrency market capitalization did not move much throughout the day. Its current value is $179.50 billion. This value represents a decrease of $0.41 billion when compared to the value it had yesterday.

What happened in the past 24 hours

Digital payments company PayPal posted a new job listing, where it seeks to hire an Anti-Money-Laundering and Blockchain Strategy director that will work in their Global Financial Crimes (GFC) division.

The new director, which will be based in New York, will be in charge of evaluating the use cases of blockchain for the prevention of financial crimes.

Honorable mention

Bitcoin vs. the Traditional markets

April 1 brings us to the Q2 2020, as well as reports and analyses on how assets performed in Q1. Nikkei 225 was down 20%, which represents the worst quarter since 2008. The FTSE fell 14% for the period, which its second-worst quarterly performance ever. The S&P 500 lost 18% to close out Q1 2020, which is its worst quarterly performance since 1938.

While cryptocurrencies operate 24/7 and don’t exactly have quarters, it is important to look at them as well and compare the crypto market’s performance with the performances of other assets. The crypto market was down just 10% for 2020’s first three months, which is significantly less than the aforementioned traditional markets.

However, despite its relative resilience, bitcoin (and the rest of the market) has been trending downward along with traditional markets, which shows some form of correlation. This correlation across all assets can be explained by the saying that “macro matters more than micro.”

_______________________________________________________________________

Technical analysis

_______________________________________________________________________

Bitcoin

Bitcoin had a pretty stable day as there was no real volume to push the price up or down. The largest cryptocurrency by market cap still trades within a range, bound by $6,640 to the upside and $5,960 to the downside. As the price could not break the resistance level, we can expect a slow decline towards the support level if nothing changes on a macro level.


Bitcoin’s volume was steady and low in the past 24 hours. Its RSI level is currently at the value of 50.

Key levels to the upside                    Key levels to the downside

1: $6,640                                           1: $5,960

2: $6,850                                           2: $5,000

3: $7,085                                            3: $4,300


Ethereum

Ethereum spent the day with virtually no fluctuations. Its chart is mostly consisting of doji candles, hammer and inverted hammer candles, meaning that there is low volume, as well as great price direction indecisiveness. Ethereum gained just slightly over 1% on the day, which was just catching up to Bitcoin’s gains, which happened the day before. Ethereum most likely won’t move without Bitcoin moving first and deciding its direction.


Ethereum’s volume is extremely low, while its RSI value is currently at 53.

Key levels to the upside                    Key levels to the downside

1: $168                                                1: $128

2: $178.6                                            2: $122.5 

3: $185                                                3: $100


Ripple

XRP had a great day, even though its price gains do not show it. The third-largest cryptocurrency managed to get out of the descending range, which it was in for around a week. The price broke the upper trend line and then successfully retested the line, which held well.


XRP’s volume increased greatly during the retest of the trend line, while the rest of the day passed without much volume. Its RSI is currently at 54.

Key levels to the upside                    Key levels to the downside

1: $0.19                                             1: $0.165

2: $0.2                                               2: $0.147

3: $0.205                                             3: $0.1

Categories
Crypto Videos

Master Crypto Trading With The Cup & Handle Formation Part1!

Make money in Crypto by spotting the Cup and Handle pattern – part 1/2

Chart patterns occur on charts when the movements of the price of an asset resemble a common shape. In this case, we will be talking about the cup and handle formation. These patterns are a visual tool that helps traders make their market decision. Cup and handle provide a logical entry point, a stop-loss target for managing risk, as well as a price target for exiting a profitable trade.

The Cup and Handle

The cup and handle pattern is a strong tool for both small time frames (such as one-minute charts) and in large time frames. It occurs when the price trends down, then have a stabilizing period, then followed by a rally of approximately equal size to the aforementioned decline. This creates a U-shape, which is the “cup” in the “cup and handle” formation. However, this is only a part of the pattern. The price then moves sideways or goes down within a channel, which forms the handle. The handle can also take the form of a triangle.
An important rule to keep in mind is that the handle should always be smaller than the cup. Ideally, the handle should stay in the upper third of the cup. If it is too deep, it will erase most of the gains of the cup, which makes it quite an unsafe bet when it comes to trading on this pattern.

A cup and handle chart may signal one of two things! A reversal pattern, or A continuation pattern. A cup and handle signals a reversal pattern when the price is in a long-term downtrend. If a cup and handle pattern is formed during that time, it will signal a trend reversal. However, if the cup and handle formation occurs during an uptrend, then the pattern would signal trend continuation.

How to trade the cup and handle pattern
Determining the Entry point

In order to trade this pattern well, wait for a handle to form and the full pattern to play out. The handle often goes sideways, descends, or creates a triangle. The entry point should be when the price breaks above the top of this channel or triangle. As soon as the price moves out of the handle, the pattern should be considered complete. However, you might want to wait for a full candle to form outside of the pattern, so you get a real confirmation of the move, rather than blindly entering a false breakout.

Setting up a Stop-Loss

A stop-loss order is a risk-control measure on the trade. It works by selling the position if the price goes the opposite way and declines enough to invalidate the pattern. The stop-loss should be put below the lowest point of the handle or below the most recent swing low (only if the price oscillated up and down often).

Since the handle occurs within the upper half of the cup, a stop-loss that is properly placed should not end up in the lower half of the cup. If the stop-loss happens to be below the half-way point of the cup, try to avoid the trade if possible. Ideally, the stop-loss should be placed in the upper third of the cup pattern.

Check out part 2 of our Cup and Handle crypto trading guide to learn more about setting profit targets as well as some other important info regarding this candlestick formation.

Categories
Crypto Market Analysis

Daily Crypto Review, Mar 31 – Opera browser openly supporting crypto; Markets in the green as BTC pushes towards $6,640

The cryptocurrency market has recovered from the downside push as Bitcoin regained strength and reconquered $6,000. In the past 24 hours, almost every single crypto was in the green. Bitcoin is currently trading for $6,419, which represents an increase of 6.53% on the day. Meanwhile, Ethereum gained 3.21% on the day, while XRP gained 2.4%.

Energi took the position of today’s most prominent daily gainer, with gains of 18.77%. There were no big losers on the other side as only two cryptos out of the top100 managed to be in the red. Status lost 1.444% on the day, making it the most prominent daily loser.

Bitcoin’s dominance dropped half a percent over the past 24 hours. Its value is now 65.47%, which represents a 0.56% difference to the downside when compared to yesterday.

The cryptocurrency market capitalization steadily increased over the course of the day. Its current value is $180.91 billion. This value represents an increase of $6.9 billion when compared to the value it had yesterday.

What happened in the past 24 hours

A web browser Opera now enables its users to access decentralized web pages with the .crypto domain extension. They made it possible through a partnership with Unstoppable Domains. This will allow users to access and surf decentralized websites, as well as to make cryptocurrency payments.

Honorable mention

Tron

Tron (TRX) founder Justin Sun posted a tweet announcing the release of Djed on Mar 28. Djed is a system for collateralized loans that he described as “something new.” However, the Djed platform was immediately criticized by the market as many think it is a copy of MakerDAO (MKR).

_______________________________________________________________________

Technical analysis

_______________________________________________________________________

Bitcoin

Bitcoin quickly and efficiently recovered from its most recent push down as its price regained previous levels. The largest cryptocurrency by market capitalization went over $6,000 yesterday, while it established its position today and even made a push towards new highs (namely the immediate resistance of $6,640). However, the push failed due to a lack of volume. Bitcoin’s future is still uncertain mostly due to external difficulties the world is facing rather than Bitcoin’s internal problems.


Bitcoin’s volume was somewhat higher than yesterday, but still at low levels. Its RSI level on the 4-hour chart is just above the middle of the range.

Key levels to the upside                    Key levels to the downside

1: $6,850                                           1: $5,960

2: $7,085                                           2: $5,000

3: $7,420                                            3: $4,300


Ethereum

Bitcoin’s downturn pushed Ethereum below the $128 support level, but as Bitcoin recovered, so did Ethereum. The second-largest cryptocurrency by market cap regained its previous support level and pushed higher up. The lack of volume prevented it from even reaching the $139 resistance level, forcing the price to consolidate within the range. Ethereum will most likely keep following Bitcoin’s price movements in the short term.


Ethereum’s volume is currently lower than the previous week’s volume, as well as overall. Its RSI level is just below the mid-range, with a value of 49.

Key levels to the upside                    Key levels to the downside

1: $168                                                1: $128

2: $178.6                                            2: $122.5 

3: $185                                                3: $100


Ripple

XRP passed over the $0.165 resistance level over the weekend, which was a great milestone towards establishing a stable price. However, the most recent downturn brought its price below this key level yet again. XRP quickly recovered and regained $0.165 as Bitcoin increased in price and pulled the whole market with it. However, the short-term future does not look good for XRP if it keeps trading within the descending range, making lower lows and lower highs.


XRP’s volume is on the same level as it was the previous week, while its RSI level is slowly descending. At the time of writing, its RSI has a value of 50.5.

Key levels to the upside                    Key levels to the downside

1: $0.19                                             1: $0.165

2: $0.2                                               2: $0.147

3: $0.205                                             3: $0.1

Categories
Crypto Videos

Using Pennants Correctly In Crypto Trading! How Is It Different To Forex?


Using pennants correctly in Crypto trading – spotting the difference between flags, pennants, and triangles


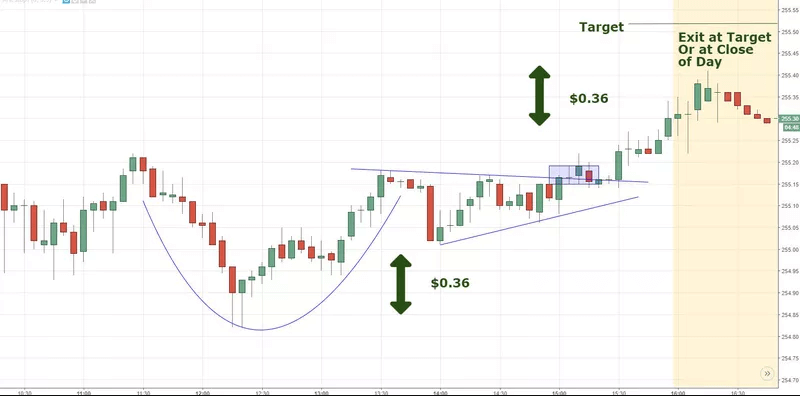
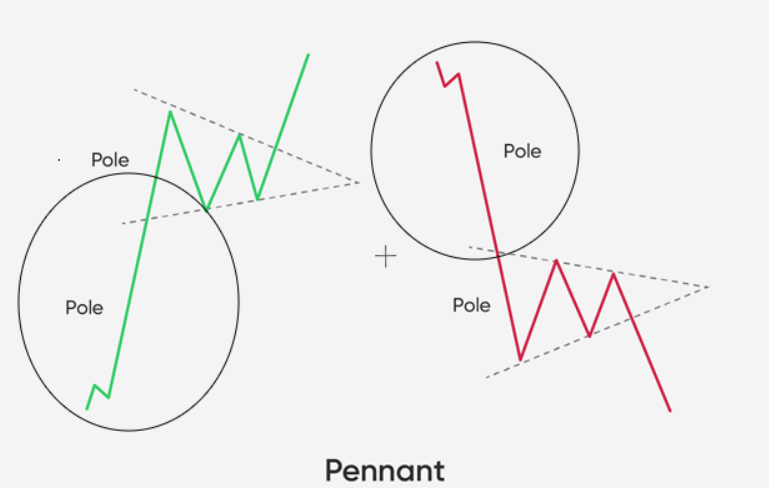
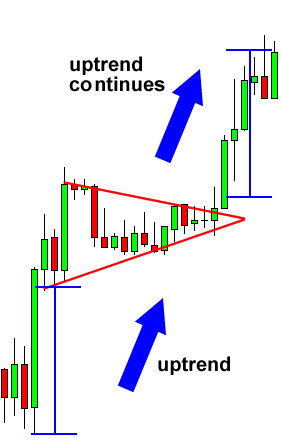
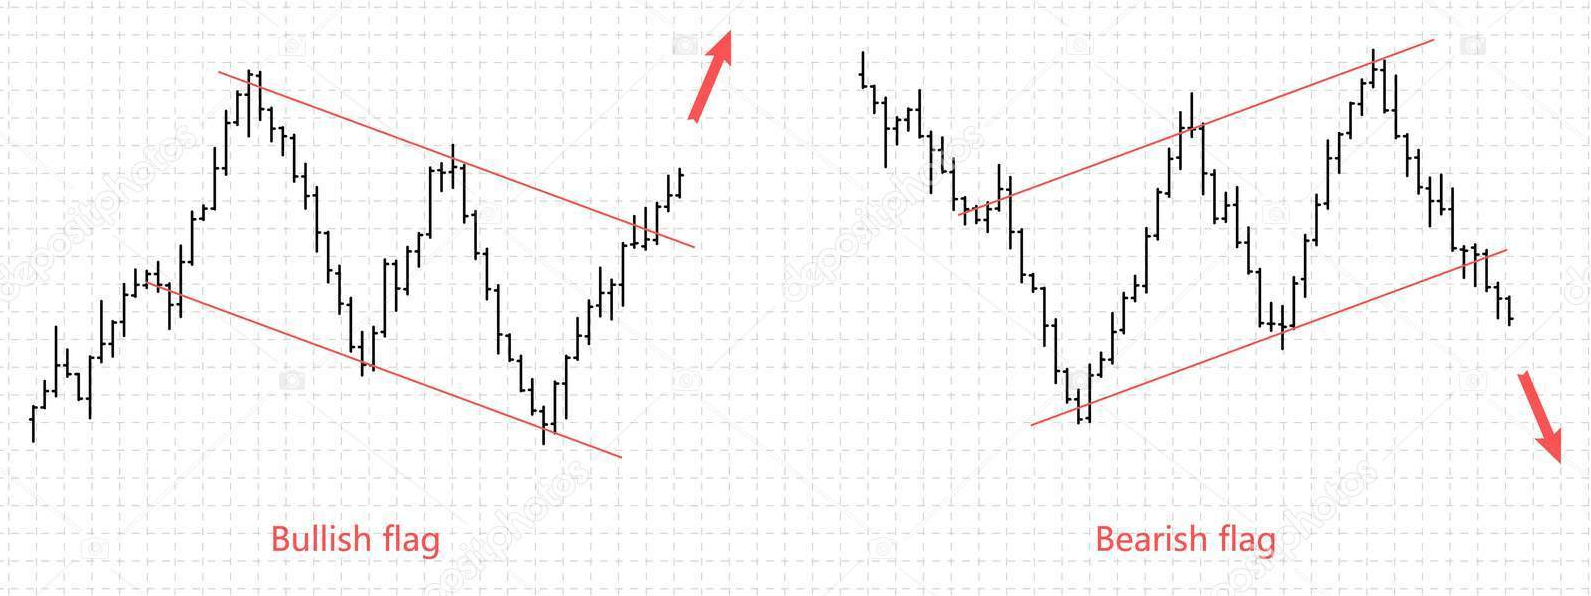
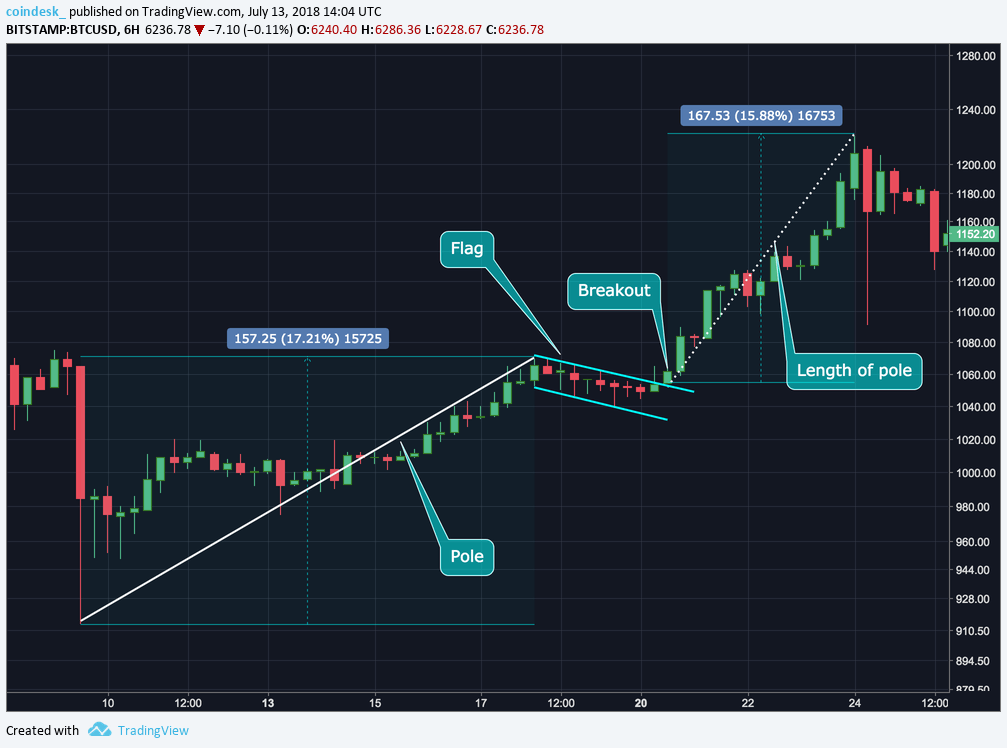
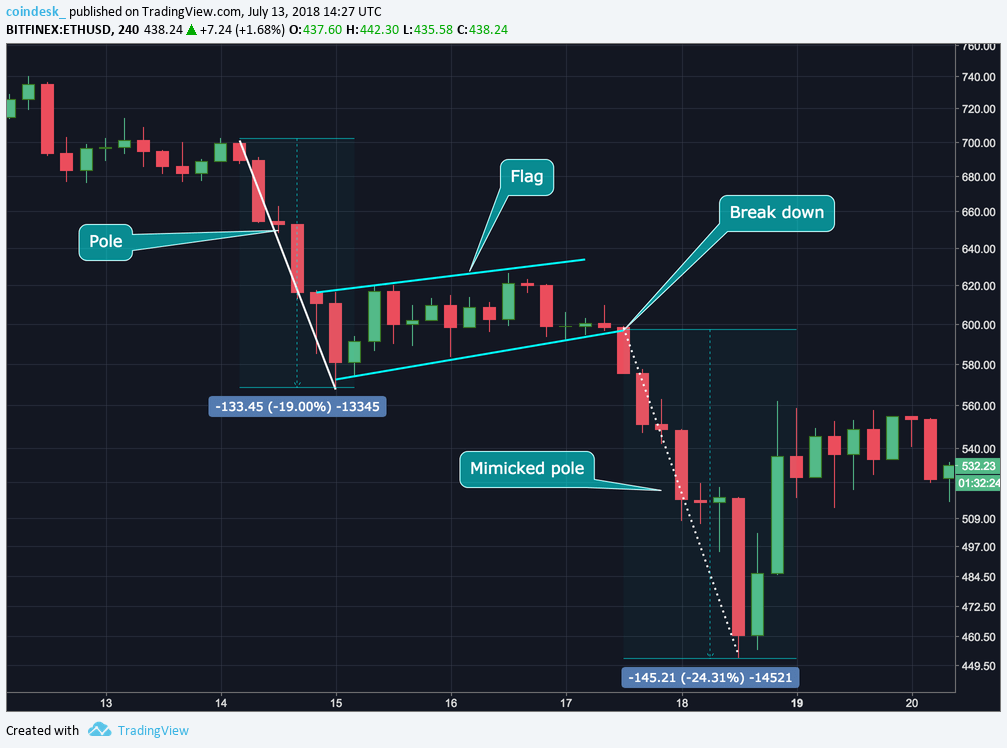
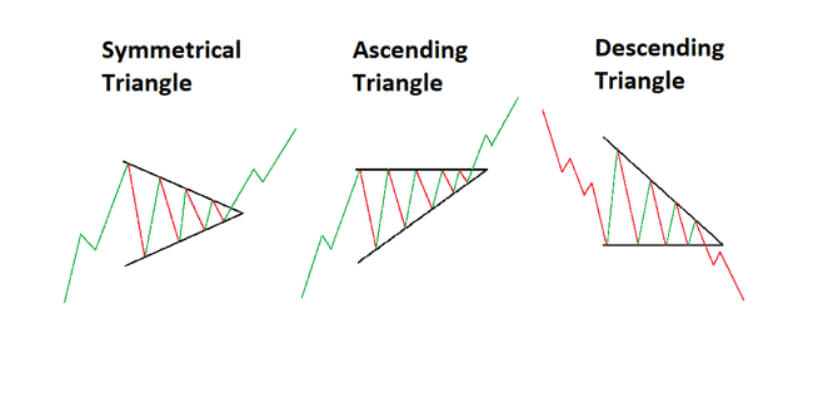
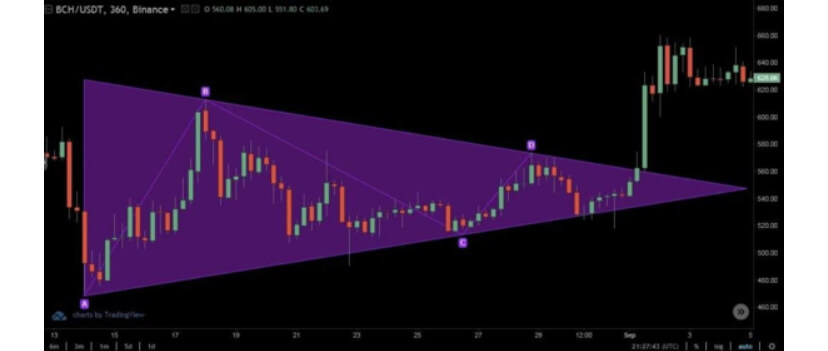
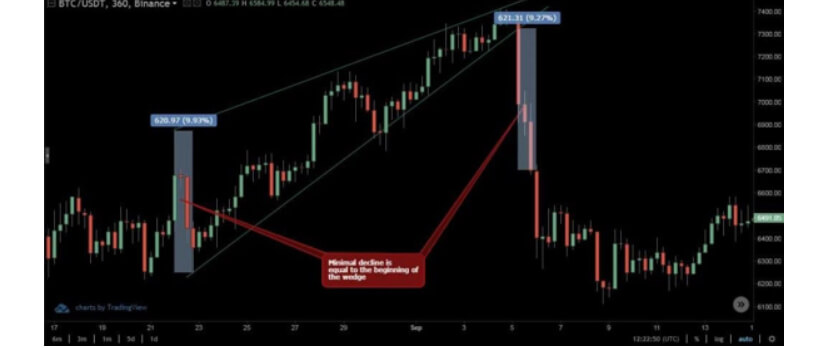
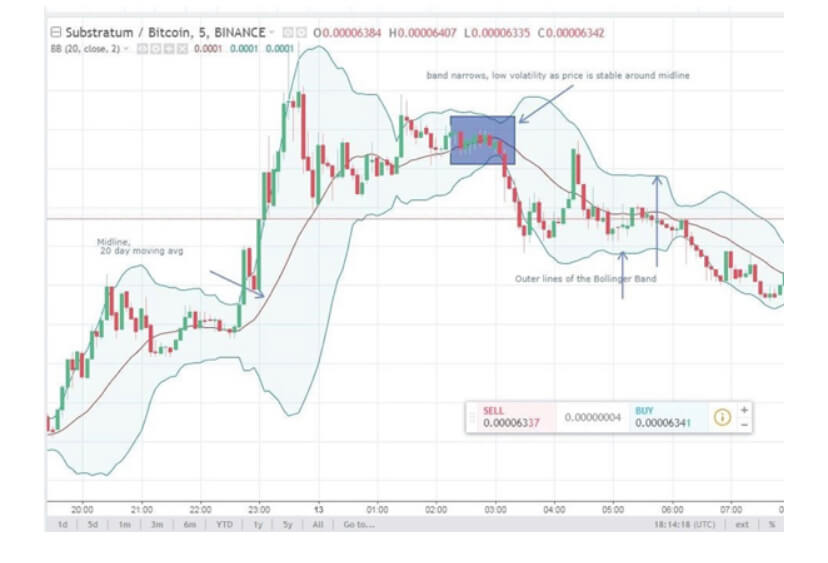
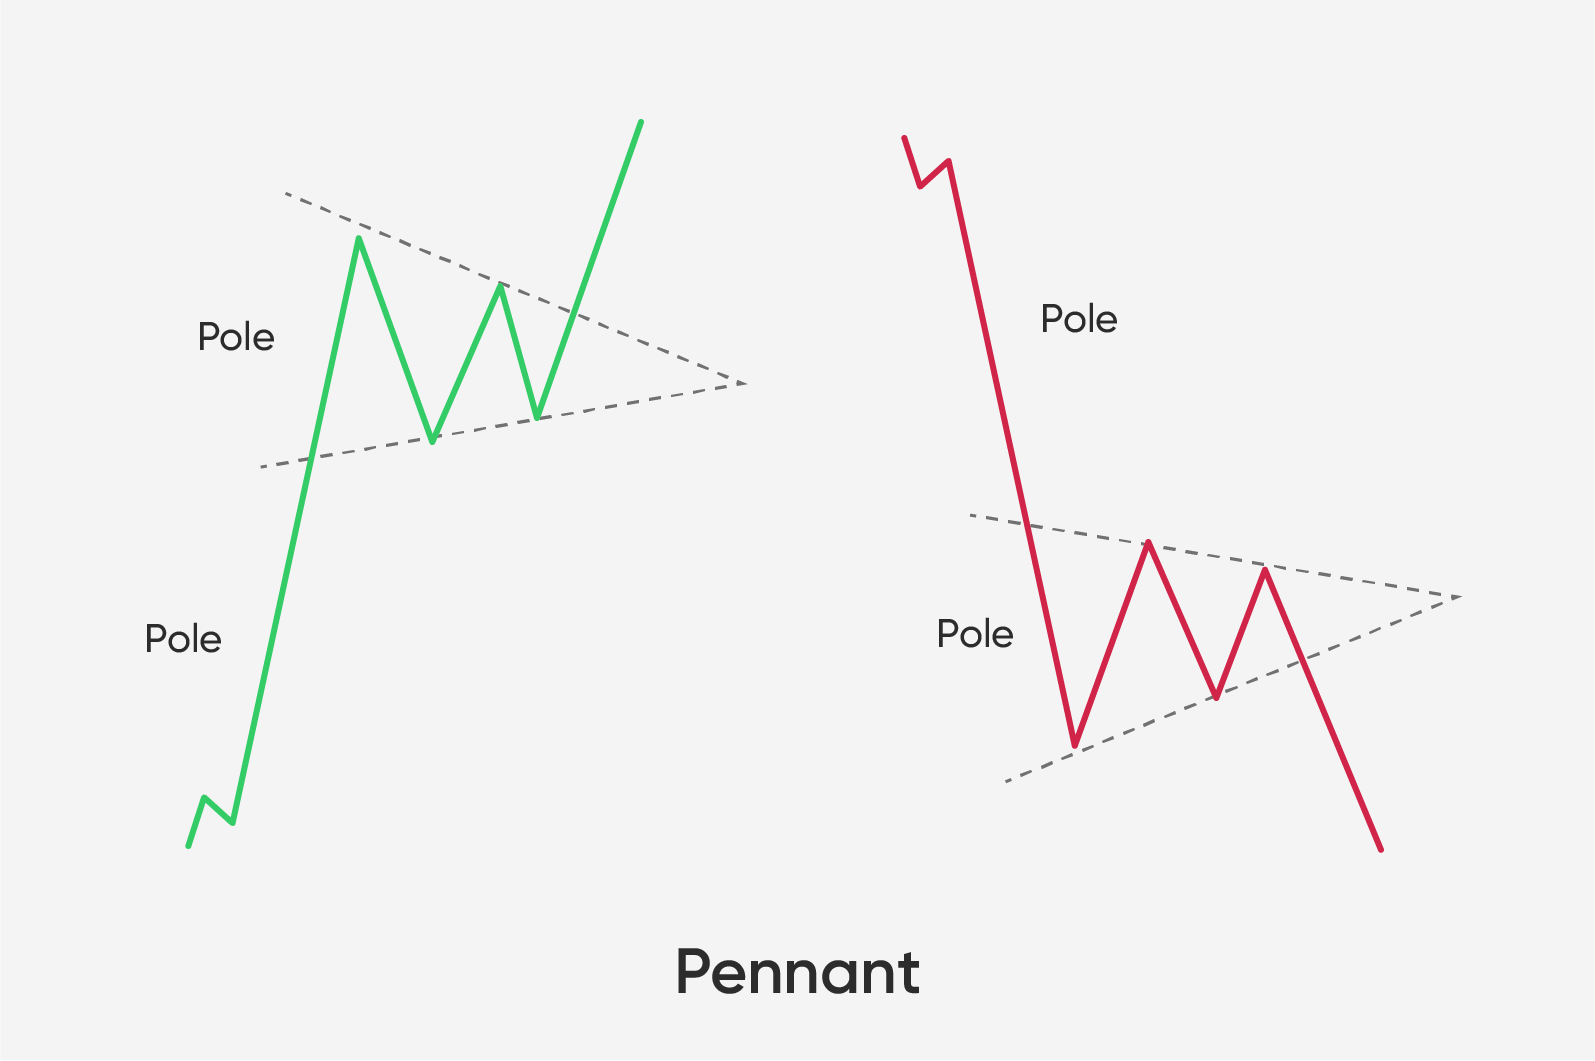
The pennant formation is a formation that looks much like a flag pattern but is triangular in shape. These formations tend to appear at the halfway mark of a trend. When a pennant forms, the trading volume tends to contract, while increasing only after the breakout. To simplify it even further, pennants look like a small triangle sitting on a long pole.

Pennants are a variation of a flag pattern, which means that it is made up of a body and a pole, much like the flag. Just like with the flag pattern, the pole height can be used to create a price target after a five-wave breakout from the body of the formation.
They are associated with very mild volatility alongside limited price fluctuations, which differentiates them from flags and triangles.
Difference between a triangle and a pennant
While pennants are most similar to flag formations, it is quite easy to distinguish one from another. On the other hand, triangles and pennants can be mistaken for one another due to the similarity of the pattern if we are not careful. However, they have some key differences which can be used to determine which one is which.

Difference 1 – the Flagpole

The symmetrical triangle and the pennant both have conical bodies which are formed during a period of consolidation. The price consistently fluctuates between higher lows and lower highs, therefore creating two converging trendlines. However, the part which many people know but tend to miss during a live trading session is that the pennant includes a flagpole at the start of its pattern, which is not the case with the symmetrical triangle. The flagpole is a sharp move accompanied by heavy volume, which marks the beginning of an aggressive move to the upside or downside. Price then pauses and forms the body of the pennant, before breaking out.

Difference 2 – the Duration

Another difference between the symmetrical triangle and the pennant would be the difference in their durations. The pennant is considered a short-term pattern that forms over a period of hours, days, or weeks. A triangle pattern, on the other hand, can take much longer, sometimes months or years. If a pennant pattern lasts for several weeks, it can be considered as a triangle as the flagpole is no longer important.

Difference 3 – the Breakout

The breakout after a pennant formation should occur at or near the point of trendline converging, which is called the apex. However, symmetrical triangles usually break above or below the trendlines a bit sooner, namely one half to three-quarters of the way through the pattern. Therefore, triangles almost never reach its apex.

Using patterns in Crypto trading

Pennants are a universal formation, which means that trading using this formation should be no different than using it to trade other assets. However, due to the volatility of the crypto market, one has to consider the duration of the formation itself. As the crypto market is much more volatile, the pattern formations tend to resolve quicker. Pennant formations, when trading regular assets, are not considered important on extremely short time frames, while that is not the case with the crypto market. They also grow into a triangle only after 12-13 weeks of not breaking out with traditional asset markets, rather than just a few weeks with the crypto market.

Conclusion

Recognizing pennants while trading cryptocurrencies can, just like with any other formations, be an effective way to improve your odds of profiting on a trade by determining the direction of the trend as well as the profit target.

Categories
Crypto Market Analysis

Daily Crypto Review, Mar 30 – Bitcoin back above $6,000 as Trump publicly supports printing $6.2 trillion

The cryptocurrency market, as it could not break the immediate resistances ahead, had a leg down over the weekend. The market stabilized with Bitcoin at above $6,000 for now. Bitcoin is currently trading for $6,223, which represents an increase of 1.34% on the day. Meanwhile, Ethereum gained 0.41% on the day, while XRP lost 1.28%.

Energi took the position of today’s most prominent daily gainer, with gains of 10.57%. On the other side, Steem lost 8.34% on the day, making it the most prominent daily loser.

Bitcoin’s dominance stayed at virtually the same place when compared to Friday’s value. Its value is now 66.03%, which represents a 0.13% difference to the downside when compared to before the weekend.

The cryptocurrency market capitalization took a big hit in the past 24 hours due to a sharp move down. Its current value is $174.01 billion. This value represents an increase of $13.06 billion when compared to the value it had on Friday.

What happened in the past 24 hours

Bitcoin (BTC) gains more and more support after the US President Donald Trump appeared to say he fully supported manipulating the dollar by printing $6.2 trillion.

Trump defended the Federal Reserve for printing more than $6 trillion with the words “It’s our money, we are the ones, it’s our currency,” which got quite a backlash.

Honorable mention

Ethereum

Data published the co-founder Covalent (an Ethereum analysis firm) Ganesh Swami announced that DeFi transactions are increasing its share of Ethereum block space, which goes at the expense of ETH transfers.

Swami said that the gas costs incurred by Ethereum transactions went up progressively.

_______________________________________________________________________

Technical analysis

_______________________________________________________________________

Bitcoin

After not being able to break the $6,850 resistance for quite some time, a leg down from Bitcoin was to be expected (check our previous reports). The largest cryptocurrency by market capitalization fell below $6,000 psychological support (and $5,960 support level), but quickly recovered and stayed above it. Bitcoin is currently trading at just above $6,200.


Bitcoin’s volume is average when compared to the previous week, while its RSI level on the 4-hour chart went from severely oversold to the middle of the range.

Key levels to the upside                    Key levels to the downside

1: $6,850                                           1: $5,960

2: $7,085                                           2: $5,000

3: $7,420                                            3: $4,300


Ethereum

Ethereum went through a similar price path as Bitcoin did. Its price fell down below the $128 support level as bulls could not break the $139 reliably, but quickly recovered and went above the support level. It is currently trading at above $130, where it looks pretty safe from any downturns in the short-term.


Ethereum’s volume is on the same low levels as it was the previous week. Its RSI level has risen to the middle of the value range after almost reaching oversold territory during the price drop.

Key levels to the upside                    Key levels to the downside

1: $168                                                1: $128

2: $178.6                                            2: $122.5 

3: $185                                                3: $100


Ripple

XRP received a great surge in volume as its price rose above the $0.165. The weekend brought bad news for XRP as bears took over and brought its price below the key level of $0.165. However, the third-largest cryptocurrency quickly overcome the downtrend and went back up above this key level.


XRP’s volume increased greatly during the spike, while the rest of the volume is average when compared to the past week. Its RSI level is on the upswing, currently passing the value of 55.

Key levels to the upside                    Key levels to the downside

1: $0.19                                             1: $0.165

2: $0.2                                               2: $0.147

3: $0.205                                             3: $0.1

Categories
Crypto Videos

Maximise Profits By Trading Bull & Bear Flags In Crypto Trading

When it comes to consistently being profitable in crypto trading, the trend is definitely your friend. However, spotting the trend when it still in the early stages is very difficult, while running along with it all the way to the top is even more challenging.

More often than not, trends (both bullish and bearish) will pause their move briefly, which allows traders or investors to join the bandwagon. We saw this pause in many cases during the crypto market uptrends and downtrends. If a lot of new participants join, the asset price continues the trend. If not, we can expect a trend reversal.

Continuation patterns

A trader can use continuation patterns to spot trend extensions. These patterns occur in a variety of shapes, with some of the most popular being known as bull and bear flags.
A bull flag is a pattern that occurs during an uptrend when the price is trying to continue upward. On the other hand, the bear flag occurs in a downtrend when the price wants to go further down.

Each flag pattern has two main components:
The pole and The flag. The “pole” is a part of the pattern that signifies a strong impulsive move, which is backed by a surge in trading volume, as well as by the subsequent pause in the trend, which represents the “flag,” which resembles a falling or rising channel.

The flag pattern has shown to be an invaluable addition to a traders’ toolset. It is mainly used to calculate the target as well as the direction of the move. As an example, if the resistance breaks in a bull flag, we can be confident that the price will continue upwards and set the target to approximately the length of the pole. On the other hand, if the support of the bull flag is breached, we know that the pattern is invalid and that the trend continuation is unlikely.

Calculating the profit target

A cryptocurrency move after a bull flag breakout or bear flag breakdown usually corresponds to the size of the pole of the flag.
Therefore, the profit target is derived like this:
Bull flag breakout equals to the breakout price plus pole hight
Bear flag breakdown equals to from the breakout price minus the pole hight
Pole height equals to the pole high minus the pole low.

Example of the Bull Flag

Let’s take a look at Bitcoin (BTC) on a 6-hour chart, where it presented a bull flag breakout. Bitcoin cleared this particular flag resistance on Feb 20, 2017, which signaled a continuation of the rally. The rally ranged from the $917 (which was the low of the pole) to the possibility to go towards $1,228 (target measured by the pole height method brought us to $157, which was added to breakout price).
In this case, Bitcoin came just $10 shy of the predicted price target on Feb 24, 2017.

Example of the Bear Flag

An example of the bear flag would be Ethereum’s (ETH) 4-hour chart, starting Mar 17, 2018. Ethereum broke the flag support, which suggested the continuation of the depreciation from the $699 pole high. The target would be $463 if we used the pole height method, which got us to the $133, which were then deduced from breakdown price.
As the move confirmed, Ethereum was just $12 shy of reaching the exact target level on Mar 18, 2018.

Summary

Bull and bear flags can be utilized in strongly trending markets to predict the price target of the move. However, they do not always perform as intended. In some cases, they can present a so-called “false breakout,” which occurs when price breaches the boundary of the flag but quickly retraces.
The risk of false breakouts can be mitigated by waiting for a candlestick to close outside of the flag territory.


For more superb educational content please visit our website https://www.forex.academy/
Categories
Crypto Market Analysis

Daily Crypto Review, Mar 27 – XRP recording double-digit gains as Ripple Labs donates $200,000 to fight COVID-19

The cryptocurrency market is still in consolidation mode, with most cryptocurrency prices at almost the exact same level that they were yesterday. Bitcoin is currently trading for $6,574, which represents an increase of 0.6% on the day. Meanwhile, Ethereum gained 1.01% on the day, while XRP gained a solid 7.28%.

Quant took the position of today’s most prominent daily gainer, with gains of 31.45%. On the other side, EDC Blockchain lost 29.88% on the day, making it the most prominent daily loser.

Bitcoin’s dominance decreased by slightly less than 1% over the past 24 hours. Its value is now 66.16%, which represents a 0.88% difference to the downside when compared to yesterday’s value.

The cryptocurrency market capitalization was a bit more turbulent in movements in the past 24 hours than it was the day before. Its current value is $187.07 billion. This value represents an increase of $2.8 billion when compared to the value it had yesterday.

What happened in the past 24 hours

A report announced by the derivatives analysis firm Acuiti has shown a growing interest in supporting and listing crypto assets among trading firms. The study surveyed 86 companies from the buy-side, sell-side, as well as prop trading groups.

The survey showed that 26% of these firms had adopted cryptocurrencies in one way or another.

Honorable mention

Ripple

Ripple Labs announced that they had made a donation of $200,000 on Mar 25, going to two different non-profit organizations. These donations are made with the intention to aid the fight to contain the coronavirus throughout the US.

Ripple Labs stated that half the funds will go to the Tipping Point Emergency’s Response Fund, while the other half will go to the Silicon Valley Community Foundation’s COVID Regional Response Fund.

_______________________________________________________________________

Technical analysis

_______________________________________________________________________

Bitcoin

Bitcoin did not show any major volatility throughout the day, but has made a couple attempts to break its immediate resistance of $6,850. All of the attempts were, however, quickly stopped as the resistance was too much to handle with such low volume. If the pattern of failing to get above resistances continues, we might see a move down and retest of the support level.


Bitcoin’s volume is at the same level as it was the day before, while its RSI level fell down to 56.

Key levels to the upside                    Key levels to the downside

1: $6,850                                           1: $6,640

2: $7,085                                           2: $5,960

3: $7,420                                            3: $5,000


Ethereum

Ethereum has not moved much, but all the moves it made were with deliberation. The second-largest cryptocurrency by market capitalization tried to break the $139 resistance level, which is only recently showed any significance. It did manage to go above it, but quickly returned below, where it is at at the time of writing.


Ethereum’s volume is just barely higher than yesterday, while its RSI level is currently at the value of 54. We are not listing the $139 resistance as a key level, as it is still considered a pivot point (as well as too insignificant historically).

Key levels to the upside                    Key levels to the downside

1: $168                                                1: $128

2: $178.6                                            2: $122.5 

3: $185                                                3: $100


Ripple

XRP, unlike the other two aforementioned cryptocurrencies, had quite a splendid day. Its price reached double-digit gains as it jumped from $0.16 all the way up to $0.18. However, the bulls could not take the price any higher, and the move ended there. XRP has fallen slightly since then and is currently trading at around $0.171.


XRP’s volume increased greatly during the price spike. While it has descended since, it is still higher than the average volume for the past week. XRP’s RSI level has left the overbought territory on the 4-hour chart and is currently sitting at the value of 62.5.

Key levels to the upside                    Key levels to the downside

1: $0.19                                             1: $0.165

2: $0.2                                               2: $0.147

3: $0.205                                             3: $0.1

Categories
Crypto Videos

Make Huge Profits Market Pattern Trading In Crypto (Head and Shoulders, Triangles, Wedges) Part 2/2


pattern trading in cryptocurrencies (Head and Shoulders, Triangles, Wedges) – part 2/2

This part of the guide will cover various triangle formations as well as wedges.

Triangles

Triangles come in three formations:
Ascending triangle
Descending triangle
Symmetrical triangle

Ascending triangle

Traders can spot an ascending triangle by the price going up and down between the constant line of resistance and the rising support.
The ascending triangle is widely considered to be a bullish formation, which leads to massive profits if approached the right way.
However, those not careful enough might consider taking a position near the support line in hopes of enhancing their gains, only to end up with a loss as formation didn’t complete, and the price movement turns to be a double or triple top bearish formation.
Targeted prices are measured by the widest distance between the highs and the lows, and applied up from the point of the breakout.
Experienced traders will wait for a confirmation of the upward breakout accompanied by a much bigger volume before taking a position, as breakouts without an increase in volume can catch traders in a bull-trap (as we showed on the chart).

Descending Triangle

A descending triangle is considered a typical bearish formation. For it to form, the price action needs to flow between a steady support line and descending resistance.
The pattern is confirmed only once a downward breakout with increased volume happens. Only then can a trader expect the continuation of the price movement to the downside.
Just like with ascending triangles, the price target is equal to the widest swing inside the triangle transferred from the breakout point to the downside.

One of the most famous descending triangles in cryptocurrencies is the one that formed on the 2018 Bitcoin chart.

Symmetrical triangle

These triangles are probably the most common formations in cryptocurrency trading. However, at the same time, they are the most unpredictable.

As the symmetrical triangle approaches its closure, the trading volume drops as traders are often indecisive about whether the price will unfold to the upside or downside. When the war between the bulls and the bears resolves, we get two outcomes: positive and negative.
Any of these breakout movements will be followed by an increase in volume, which will be even more visible due to the reduced trading volume before the breakout.
Once the breakout happens, traders can expect the target price to be the same distance as the distance between the breakout side and the base of the triangle.

Wedges

Wedges are very common formations in crypto trading as well. They are considered a multiple price wave reversal patterns.
The price action in a wedge swings from highs to lows multiple times before breaking out of the pattern.
Wedge formations come in two forms:

Rising wedges
Falling wedges

Rising wedge

As opposed to the ascending triangle formation, the rising wedge has price swings that travel through highs and lows, but both the highs and lows are getting higher. This formation announces a bullish trend reversal into a strong bearish sentiment.

Falling wedge

The falling wedge formation, on the other hand, looks like a mirror image of the rising wedge and announces a trend reversal from bearish to bullish.

As with other patterns, it is advisable for traders to get the confirmation of the breakout before taking a position.
The minimum targeted price for the falling wedge is the exact opposite of the ascending wedge.

One thing to notice is that, in the cryptocurrency market, peaks do not necessarily follow highs and lows in an exact straight line. They are rather just close enough in the price range to mark the formation.

Categories
Crypto Market Analysis

Daily Crypto Review, Mar 26 – The calm before the storm? Cryptocurrency price analysis

The cryptocurrency market had a pretty steady day when it comes to price movements. Most cryptos remained at their levels of 1 day ago. Bitcoin is currently trading for $6,652, which represents a decrease of 0.78% on the day. Meanwhile, Ethereum lost 2.75% on the day, while XRP lost 1.17%.

EDC Blockchain took the position of today’s most prominent daily gainer, with gains of 871.81%. On the other side, Swipe lost 12.67% on the day, making it the most prominent daily loser.

Bitcoin’s dominance has increased over the past 24 hours. Its value is now 67.04%, which represents a 0.39% difference to the upside when compared to yesterday’s value.

The cryptocurrency market capitalization did not move much in the past 24 hours. Its current value is $184.21 billion. This value represents a decrease of $0.14 billion when compared to the value it had yesterday.

What happened in the past 24 hours

Bitcoin mining difficulty dropped by 15.95% in the past 24 hours. This is the second-largest decline in its history. Bitcoin price plummeted more than 50% percent last time a decline like this happened.

Though this is not a surefire way to determine the price direction, it is very much possible that Bitcoin will go down some more in the short-term.

Honorable mention

GRAM

Cardano launched Ouroboros Hydra, its off-chain scalability protocol on Mar 25. This protocol has gone live after five years of development.

The protocol increased scalability greatly for the Cardano blockchain. On top of that, it is using very little storage on the network’s nodes. Hydra could theoretically scale to 1,000,000 transactions per second.

_______________________________________________________________________

Technical analysis

_______________________________________________________________________

Bitcoin

Bitcoin had a pretty stale day price-wise, as it did not move almost at all from yesterday. The largest digital currency by market cap is still trading just below the $6,850 resistance level without much fluctuation. While its price is above the weekly 200-period moving average, if the price doesn’t move to the upsidein the next couple of days, we can expect a leg down towards lower $6,000’s, or even lower.


Bitcoin’s volume drastically reduced from yesterday, while its RSI level dropped slightly towards the middle of the value range, currently being at the value of 56.

Key levels to the upside                    Key levels to the downside

1: $6,850                                           1: $6,640

2: $7,085                                           2: $5,960

3: $7,420                                            3: $5,000


Ethereum

Ethereum has almost mirrored the movements of Bitcoin for the past 24 hours. The second-largest cryptocurrency had close to no movement on the day, with its price being right below the $139 resistance line. However, the only change from yesterday is exactly the $139 level. While it was undecided whether the price will end up below or above it yesterday, it is quite clear that Ethereum will trade below this level for the time being.


Ethereum’s volume also dropped severely from yesterday, while its RSI level is currently at the value of 51.

Key levels to the upside                    Key levels to the downside

1: $168                                                1: $128

2: $178.6                                            2: $122.5 

3: $185                                                3: $100


Ripple

XRP had a bit more movement than Bitcoin and Ethereum in the past 24 hours. Namely, its price moved down to $0.157 but quickly recovered to its previous level of around $0.16. XRP is trading between the resistance of $0.165 and support of $0.147 for five days now, without any signs of going up or down.


XRP’s volume decreased slightly over the past 24 hours, while its RSI level dropped to 53.

Key levels to the upside                    Key levels to the downside

1: $0.165                                            1: $0.147

2: $0.19                                              2: $0.1

3: $0.2                                              

Categories
Crypto Daily Topic

Cryptocurrencies and Ponzi schemes

According to a report by Chainalysis, crypto Ponzi schemes are now the biggest crypto crime. In 2019, Ponzi schemes accounted for 92% of proceedings from crypto crimes.

Ponzi schemes are financial fraud schemes that trick unwitting people into investing money in a non-existent enterprise. Ponzi schemers sustain the fraud but paying out profits to initial investors using the money that new investors have pumped into the project. Ponzi schemes are able to sustain this lie for a while – but the facade starts cracking when they can no longer attract new investors, and old investors start getting concerned.

Ponzi schemers are now moving into the cryptocurrency space to try their luck. This is because many people are still unfamiliar with cryptocurrency or how the technology really works, rendering them vulnerable to any investment lie mixed with some truths. There is also the sentiment about cryptocurrency being a “get-rich-quick” investment. The crypto space also has few checks and balances – thanks to its decentralized and deregulated nature – making it easy to defraud unsuspecting investors and evade the law – even if just for a while.  

OneCoin: the Greatest Crypto Ponzi scheme of All Time

OneCoin is perhaps the cryptocurrency Ponzi scheme that takes the crown. US prosecutors have concluded that the scheme raked in approximately $4 billion from investors around the globe. From Palestine to the UK to Uganda to India to the US, people from all over the world were duped into sinking money into “the next Bitcoin.” 

In China alone, authorities recovered $267.5 million and prosecuted over 90 people in connection with the scheme. 

Dr. Ruja Ignatova, the mastermind behind the scheme, has been missing since 2017. The last that was heard of her is that she boarded a plane from Sofia to Athens never to be seen or heard from again. 

OneCoin was launched by Ignatova, a Bulgarian, who according to her LinkedIn profile, is an Oxford graduate and a former McKinsey employee. 

On the surface, you couldn’t have suspected anything was amiss. After all, OneCoin supposedly worked like any other cryptocurrency that generated new coins via mining and could be used to facilitate global payments. Also, it came with a safe and secure wallet, and it had a “total supply of 120 billion” coins. 

Network participants were required to buy educational materials that included cryptocurrencies, trading, and trading analysis, investments, and so on. 

Participants could also receive discounted packages and referral rewards if they got more users to join the network. 

Ostensibly, OneCoin was a “centralized network” where the team “took care of all technical aspects.” In truth, however, OneCoins were engineered by the scammers who programmed it from $0.56 to around $ 33.68. 

Also, it was later debunked that OneCoin never really had a blockchain, with police saying that it lacked “a true blockchain that is public and verifiable.”

The Launch of Onecoin

In June of 2016, Dr. Ruja appeared on stage at a flashy event on the Wembley Stadium in London, dressed resplendently in a ball gown complete with long earrings. With superlative after superlative, she described OneCoin as the next big thing, including that OneCoin would be “the biggest out there,” and it would “write history.” She told hundreds (or perhaps thousands) of screaming fans that OneCoin was the “most transparent, most powerful, and most legal” cryptocurrency. She concluded with this classic: “In two years, nobody will speak about bitcoin anymore!”

Despite OneCoin allegedly growing rapidly and stories of success, investors were starting to get concerned. A long-touted crypto exchange that would let users exchange one coin into Fiat was being constantly postponed. At an event in Lisbon where organizers would allay investor concerns, Dr. Ruja was a no-show. 

FBI records indicate that she flew on a Ryanair flight from Sofia to Athens on October 25, 2016, and that is the last that investigators know for now. A BBC article surmises that she might be living in Frankfurt under a fake identity. 

She has been charged in absentia with securities and wire fraud and money laundering. Her brother, Konstantin Ignatov, has been convicted for money laundering and fraud. A US lawyer Mark Scott has also been convicted for money laundering in connection with the OneCoin scam.

How to Smell a Cryptocurrency Ponzi scheme From Miles Away

The OneCoin story is a juicy one, but in there lies very important lessons for every aspiring cryptocurrency investor. Investors who put money into the project will likely never be able to recover it. Even though authorities might successfully recoup some of the money, the probability that individual investors around the world will be fully compensated is very low. Their money’s gone, just like that. 

So how can you protect yourself from these kinds of scams? After all, such fraudsters are not going anywhere; in fact, they are constantly reinventing the game. 

Always look out for these red lights: 

i) Massive and Consistent Returns

This is perhaps the most obvious tell-tale sign of a Ponzi scheme. No investment can consistently return massive profits almost without risk. So when you see a project bragging about an impossibly high rate of returns, think twice. The general rule is: if it is too good to be true, it probably is.

ii) Returns Dependent on Referrals

If an investment project relies too much on referrals, then that is a red alert. Referral and commissions are the main routes through which participants will earn in most Ponzi schemes. If you see this kind of a model in any enterprise, it means the business itself is unprofitable, and sooner or later, it will cave in. 

iii) Unclear Ownership

Who owns the company? Are the founders in the shadows, or is information about the company inconsistent? If you know what to look for, a simple Google search should be able to reveal any shadiness. 

iv) Need To Join For More Information

To escape the law, many websites of crypto schemes will put up the facade of a legitimate business such as a wallet service, a cloud mining platform, etc. Then they will tell you that to access the investment portion, you need to sign up first. This should set off your alarm bells.

v) Closed-source or Non-Public Blockchain

The tradition of cryptocurrencies is to exist in the open. But scam coins will usually hide their source code such that others in the development space cannot review it. Also, their blockchain is not up for public participation.

Final Thoughts 

As you can see, crypto Ponzi schemes are well and alive. Fraudsters are rushing in to cash in on the allure that cryptocurrencies hold, and if you’re not careful, it’s easy to get roiled in a Ponzi scheme and lose your savings in a flash. These nuggets should help protect you from falling victim to a crypto Ponzi scheme.

Categories
Crypto Videos

Make Huge Profits Market Pattern Trading In Crypto (Head and Shoulders, Triangles, Wedges) Part 1/2

Market pattern trading in cryptocurrencies (Head and Shoulders, Triangles, Wedges) – part 1/2

Finding ways to predict the future price movement of an asset has always been incredibly hard, no matter what asset you are trading. Cryptocurrency trading differs slightly from trading other assets, as it is more volatile, much younger, and susceptible to fear of missing out as well as fear, uncertainty, and doubt.
Although the number of factors that influence the price of a cryptocurrency is almost immeasurable (reaching milestones, partnerships, security breaches, new regulations, etc.), combining this knowledge with the usage of other methods, such as trend detection can be quite profitable.

No matter how volatile the prices of cryptocurrencies may be, at times, experienced traders can spot distinct movement patterns that allow them to predict the direction of the price movement. This guide will explain the fundamentals of three patterns that traders look for when trading crypto on various exchanges.

Head and shoulders pattern

The head and shoulders pattern is a price formation that, to an inexperienced trader, look like a baseline with three peaks and nothing more.
However, if we spot that the middle peak is higher than the other two, which are similar in size, we can deduce that it is, in fact, the head and shoulders pattern.

In technical analysis, a head and shoulders pattern is a sign of bullish-to-bearish trend reversal. It is regarded as one of the most reliable, if not the most reliable trend reversal patterns.
As the cryptocurrency market is extremely volatile and bulls and bears constantly switch in terms of market dominance, the head and shoulders pattern would appear after the market has been dominated by bulls.

After the first price stagnation (which is the Shoulder 1), and the price reaches a new high (which is the head), it still may be possible that the pattern will not form and that the bulls will push the price even higher. However, after the price goes down for the second time, bulls often try to push it up again (which is the Shoulder 2). If they don’t succeed and the price stops at the price level similar to the one of Shoulder 1, it becomes evident that bears are taking over the market.

The target price in this reversal is equal to the distance from the neckline to the peak of the head but in the opposite direction.
When deciding whether to trade the head and shoulders pattern, traders should not just assume that the pattern is going to play out. Instead, they should be patient and wait for the decline after the right peak to reach the neckline. Only then can they think of taking a position.
Reversed head and shoulders
Traders should also look for the reversed head and shoulders pattern, which plays out the same way a regular one does, but in the opposite direction. This pattern marks the end of the bear season.

Check out part 2 of our pattern trading guide, where we will cover various triangle formations as well as wedges.

Categories
Crypto Market Analysis

Daily Crypto Review, Mar 25 – BTC failing to break above $7,000; What to expect next?

The cryptocurrency market attempted to go up and reach new highs but failed to do so as Bitcoin couldn’t break above the $6850 resistance successfully. Bitcoin is currently trading for $6,682, which represents a decrease of 0.63% on the day. Meanwhile, Ethereum lost 1.48% on the day, while XRP lost 0.02%.

ZEON took the position of today’s most prominent daily gainer, with gains of 272.17%. On the other side, Molecular Future lost 11.20% on the day, making it the most prominent daily loser.

Bitcoin’s dominance has increased over the past 24 hours. Its value is now 66.65%, which represents a 0.26% difference to the upside when compared to yesterday’s value.

The cryptocurrency market capitalization increased over the past 24 hours, with a current value of $184.35 billion. This value represents an increase of $4.7 billion when compared to the value it had yesterday.

What happened in the past 24 hours

Blockchain analysis firm Coin Metrics found out that even though Bitcoin was experiencing tough times (especially the one when its price had the biggest daily loss in the last seven years), stablecoins bloomed.

This company released its State of the Network report on Mar 23. Stablecoins gained a lot of the market share, which everyone could see. However, spreads on spot and futures markets widened, while transfer fees went up as people rushed to deposit coins.

Honorable mention

GRAM

A United States District Court has ruled against Telegram for the issue of using GRAM tokens without declaring that they are securities prior to the ICO.

Prior to that, the Securities and Exchange Commission’s requested a preliminary injunction, to which the Court answered that it finds that the SEC has shown great likelihood of success in proving the contracts and understandings at issue. This would be including the sale of 2.9 billion Grams to 175 purchasers which netted Telegram $1.7 billion.

_______________________________________________________________________

Technical analysis

_______________________________________________________________________

Bitcoin

Bitcoin had somewhat a turbulent day, with its price going from all the way to $7,000 and then back down to $6500, only to stabilize at just sligtly higher levels than yesterday. The largest cryptocurrency did not manage to break the $6,850 resistance successfuly, so the bears stepped in and brought the price back down. BTC is now holding below $6,850 and above $6,640. This move might be percieved as a fakeout above $6,850 and the market might look for a leg down towards the low $6,000’s or lower.


Bitcoin’s volume did not increase during the spike, which is quite interesting. Its RSI level is currently at the level of 62.

Key levels to the upside                    Key levels to the downside

1: $6,850                                           1: $6,640

2: $7,085                                           2: $5,960

3: $7,420                                            3: $5,000


Ethereum

Ethereum is currently fighting for where it will go next. Its price is stuck right at the $139 level, not knowing whether it will go up or down. However, a break to any side will not be as significant as the moves that Bitcoin makes, and could only bring the price up or down so far.


Ethereum’s volume is still at extremely low levels, while its RSI level is currently just above the mid-point of the value range, sitting at the value of 57.

Key levels to the upside                    Key levels to the downside

1: $168                                                1: $128

2: $178.6                                            2: $122.5 

3: $185                                                3: $100


Ripple

XRP had a day of virtually no movement. However, this is not quite due to its price, not wanting to move. The third-largest cryptocurrency was trading right below the $0.165 level, constantly failing to break it. This exact thing happened in the past 24 hours as well, as the price kept trying to go above the resistance, failing, and then going back to its previous levels.


XRP’s volume saw no increase or decrease on the day, while its RSI level is currently at 57.

Key levels to the upside                    Key levels to the downside

1: $0.165                                            1: $0.147

2: $0.19                                              2: $0.1

3: $0.2                                              

Categories
Crypto Videos

Master Trading Cryptocurrencies Using The RSI Indicator

Trading cryptocurrencies using RSI indicator

RSI, which is an acronym for the Relative Strength Index, is one of the most popular technical indicators used in the analysis of any financial markets. It is often used for cryptocurrency trading as well.

It was created in 1978 in John Welles Wilder’s book that carries the name “New concepts in technical trading systems.” Wilder was a former mechanical engineer who abandoned his job in order to focus on the financial markets.
He wanted to create indicators based on mathematical analysis by finding a simple yet effective tool to visually represent market movements. The RSI indicator is what came from his research, and this indicator is one of the most widely used indicators to date.

RSI indicator – explained

This indicator is based on quite a simple concept. The stronger the relative price, the greater the market’s upward closures compared to the market’s downward closures. The opposite is also true.

RSI is considered an oscillator that is used for measuring the speed as well as the direction of price movements. That’s why it is also a “momentum” indicator. Contrary to some other indicators, RSI manages to overcome the momentum-related problems that can occur when abrupt movements of the market cause a sudden reversal of the trend.
RSI uses a band of oscillation that ranges from 0 to 100. It also allows for visual comparison with predetermined constant levels. It is based on a simple mathematical formula that requires only one input parameter, which is the number of periods that we are taking into consideration.
In his book, Wilder recommended that 14 should be used to get the best results.
As with all the other oscillators, if a short time-period is used, the sensitivity of the oscillator might be too great, and traders may get false signals.

Using RSI in crypto trading

Trading cryptocurrencies using RSI is not much different than trading any other asset. When the price moves up quickly, the RSI indicator will enter the “overbought” area. The opposite is also true.
It is important to say that the longer the time frame used, the more accurate the data is. Bitcoin has almost never had a false signal on the higher time frames.
Wilder designed this indicator with the aim to spot reversals. RSI will show alert zones set at 70 for overbought and by the value 30 for oversold. However, it is not uncommon to see zones moved to values 80 and 20.
A cryptocurrency trader, this indicator should NOT be used by itself, but rather alongside using the knowledge of candlestick and pattern analysis as well as some other indicators.

Categories
Crypto Market Analysis

Daily Crypto Review, Mar 24 – Bitcoin recording double-digit gains as it reaches $6,500

The cryptocurrency market managed to pull its weight to the upside as Bitcoin surged and recorded double-digit gains in the past 24 hours. Bitcoin is currently trading for $6,488, which represents an increase of 10.73% on the day. Meanwhile, Ethereum gained 8.91% on the day, while XRP gained 6.27%.

Bytecoin took the position of today’s most prominent daily gainer, with gains of 17.64%. On the other side, Steem lost 1.82% on the day, making it the most prominent daily loser. At the moment, it seems that the market moves as a whole (or at least in the same direction) and that not many cryptos differ from this rule.

Bitcoin’s dominance has increased over the past 24 hours. Its value is now 66.39%, which represents a 0.41% difference to the upside when compared to yesterday’s value.

The cryptocurrency market capitalization increased over the past 24 hours, with a current value of $180.28 billion. This value represents an increase of $3.5 billion when compared to the value it had yesterday.

What happened in the past 24 hours

Democrats in the US House of Representatives are looking to implement the US-made digital dollar in order to streamline payments to its citizens outside of the traditional financial system. This idea has come up as many people were in need of some form of a stimulus package as a response to the economic crisis caused by the COVID-19 outbreak.

Honorable mention

MakerDAO

The MakerDAO (MKR) has recently announced an auction to recover the DAI collateral debt. This auction is almost complete, even with the procedure suffering some technical setbacks. The MakerDAO community largely remains optimistic as they think that Maker is handling the situation quite well.

_______________________________________________________________________

Technical analysis

_______________________________________________________________________

Bitcoin

Bitcoin managed to pull itself out of the falling price by creating lower lows pattern. The largest cryptocurrency soared above $6,000 once it broke the $5,960 resistance. The price was, however, stopped by the $6,640 resistance. Bitcoin is now consolidating right below this key level, trading at around $6,500 at the time of writing.


Bitcoin’s volume increased slightly during the price surge, while its RSI reached above 60 values on the 4-hour timeframe.

Key levels to the upside                    Key levels to the downside

1: $6,640                                           1: $5,960

2: $6,850                                           2: $5,000

3: $7,085                                            3: $4,300


Ethereum

Ethereum followed Bitcoin price-wise and increased in value as well, though not quite as much. The second-largest cryptocurrency has broken its $128 resistance quite quickly and moved towards future resistances. However, a new key resistance level has formed at the $139 level, which stopped the price from increasing twice in the past 24 hours.


Ethereum’s volume increased only during the duration of the candle, which brought its price over $128, while the rest of the day went by with regular volume. Its RSI level increased and is now at a value of 55.5.

Key levels to the upside                    Key levels to the downside

1: $168                                                1: $128

2: $178.6                                            2: $122.5 

3: $185                                                3: $100


Ripple

XRP increased in price as well over the past 24 hours. However, a pattern that is present for a couple of runs (to the upside as well as the downside) is that XRP did not break any support or resistance levels. XRP couldn’t get past the $165 level and is now trading at the $158.5 level, performing consolidation.


XRP’s volume increased only slightly when compared to the past couple of days. Its RSI level increased to the value of 55.

Key levels to the upside                    Key levels to the downside

1: $0.165                                            1: $0.147

2: $0.19                                              2: $0.1

3: $0.2                                              

Categories
Crypto Videos

Using Bollinger Bands To Capture Consistent Profits Part 2

Trading cryptocurrencies using Bollinger Bands (part 2/2)


The rules of Bollinger Bands

John Bollinger is still quite active in the financial space, while his bands have 30 years of market testing. The first thing that Bollinger makes clear is that both highs and lows are relative. While the upper band signifies highs as they relate to the standard deviation, the lower band does the opposite. The terms “high” and “low” have to be used in a relative sense. This relativity can be derived from a variety of different indicators.
Bollinger stressed that each indicator has to be viewed in isolation before trying to use it in conjunction with something. Momentum, volume, sentiment, as well as many more things can be derived from Bollinger bands; however, they might not necessarily relate to one another.
He once said: “For example, a momentum indicator might complement a volume indicator successfully, but two momentum indicators aren’t better than one.”

Bollinger bands have proven to be a successful indicator if employed in a wide range of financial settings since they are simple by nature. They are made for trading equities, indices, exchanges, commodities, as well as futures. Cryptocurrencies were not there when this indicator was made, but they fit the space between the gray areas of these financial tools.
Bollinger Bands and are also flexible with regard to the time period, as long as the period that is examined contains enough details to present a meaningful view of the market.

How to use Bollinger Bands

Cryptocurrency traders, as well as investors, can use Bollinger Bands in several different ways.
The first we have to look at is the volatility of a given coin we are trading. Bollinger bands compress when standard deviations are low, which is signaling us a period of low volatility. They tend to do the opposite when volatility increases.

While this can have several meanings depending on the coin we are trading. We can look at the volatility and try to pinpoint the possibility of a breakout.
Bollinger Bands capture somewhere around 90% of the price action in a given cryptocurrency. When the price movement dives above or below a set Bollinger Band, we have to pay attention. When the price moves above the band, the coin is likely overbought, and it is possible that it will correct shortly. If, on the other hand, a price moves below the lower Bollinger Band, the coin is possibly oversold.

Movements at the Bollinger Band boundaries (upper or lower) can also be used to determine short-term price direction. If the upper band is cracked, but the price corrects to a level just at or below the upper band afterward, it’s a sign that the prices are generally moving up. The opposite is also true.

Conclusion

Bollinger bands present an easy way to visualize the cryptocurrency market price movement. In simplest terms, it shows when it is a good idea to buy or sell an asset.
However, Bollinger Bands are simply one of the many tools in a trader’s toolkit, which means that the rules are not written in stone. To confirm their decisions based on Bollinger Bands, many traders are relying on volume indicators or oscillators such as RSI or MACD before entering a position. Independently confirming trends by using other tools rather than only using the Bollinger Band system is more reliable than using just Bollinger Bands to come to a certain conclusion

Categories
Crypto Daily Topic

Atomic Swaps: The Definitive guide

Cryptocurrencies were invented so that we could have deregulated, decentralized and peer-to-peer finance. What perhaps was not factored in was how we could trade one currency for another in the same kind of environment. Centralized exchanges – which are platforms through which individuals can trade one crypto to another, fill this gap. But these exchanges are not the most ideal crypto exchange platforms – because of issues that are inherent to them, and also because they do not live up to the tenets of cryptocurrency. 

Enter atomic swaps – a technology that could be the solution to this problem. Atomic swaps is a technique that lets you trade crypto coins directly with other crypto holders. Also known as atomic cross-chain trading, this technology relies on smart contracts to automatically execute trades between two parties when both parties meet their end of the bargain.

Atomic swaps have the potential to revolutionize how we transfer crypto value.

History of Atomic Swaps

The concept of a trustless, decentralized, and peer-to-peer method of exchanging crypto was being floated since 2012 when cryptos were beginning to pick up and become a force in the trading arena. In July of that year, Sergio Demian Lerner created what was the first draft of such a protocol. The idea was a good one, but it was never really worked on. 

There wasn’t a breakthrough until May 2013 when Tler Nolan created the first full account of how such a protocol can work – through atomic swaps. Though many other developers have come up with their own iterations of trustless and decentralized exchange protocols, Nolan is credited as the inventor of the technology.

The Problem with Centralized Crypto Exchanges

  • Susceptibility to Hacks

 Centralized exchanges always have the possibility of getting hacked hanging over them. This is because cryptocurrency is a very appealing asset to fraudsters. (Isn’t it to all of us?) And these fraudsters are always devising new ways to get around security settings.

  • Subject to Bad Management

Centralized exchanges are managed by people, and people are fallible. Simple mistakes or seemingly harmless loopholes could undo a centralized exchange – and with it investor funds – very fast.

  • Inability to handle high demand

Centralized exchanges can simply not handle high volumes of demand, especially a sudden increase.

  • Subject to Censorship and Regulation

Centralized exchanges are much like other businesses. Since they operate in jurisdictions, they are subject to the arbitrary whims of such jurisdictions. Cryptocurrency exists to avoid this very issue.

How Atomic Swaps Work

Atomic swaps work by letting the two transacting parties make a shared “secret.” The parties will swap the agreed cryptos if and only if their secrets are an exact match. This way, if a third party happens to barge in on the transaction, they have no way of meddling with the transaction since they don’t know the secret.

This whole process is executed by something known as Hashed Timelock Contracts (HTLCs).

HTLCs are a type of payment channels that ensure both parties to the transaction hold up their end of the bargain for the swap to be successful. A hashlock uses a cryptographic algorithm that allows either party to access the funds when and only when they have signed up their side of the transaction.

The timelock is a sort of insurance policy that will see to it that both parties get back their funds in the event the transaction has not gone through during a specified time frame. 

The HTLC is made to create an environment where both parties rely on each other for the exchange to be successful. If, for whatever reason, the transaction is unsuccessful (e.g., network failure or one party not meeting their end of the deal), the timelock returns the funds to the rightful owners.

On-chain and Off-Chain Atomic Swaps

Atomic swaps can take place either on-chain or off-chain.

An on-chain atomic swap takes place on either currency’s blockchain. For an on-chain swap to be successful, both currencies must share the same hashing algorithm, and they both must also support HTLC. The first-ever on-chain swap was executed by Litecoin and Decred in September of 2017.

An off-chain swap takes place outside of the blockchain – in what is called a “layer 2.” Bitcoin and Litecoin were the first to conduct an off-chain swap in November of 2017. 

 Advantages of Atomic Swaps

  • Atomic swaps will help users of different cryptocurrency networks interact with each other. This contributes to the interoperability of these networks.
  • Atomic swaps facilitate “currency agnosticism” of the crypto ecosystem. This means the crypto market will be open to everyone rather than having a segmented market where people are holding to just one of a few coins. In other words, no matter which coin you use, you can transfer it to anyone, and anyone can do the same for you.
  • Atomic swaps facilitate trustless, fee-less and peer-to-peer, uncensorable currency exchanges
  • They remove the need for third-party intermediaries hence making the swap as direct as possible.
  • Atomic swaps give users complete control over their money, instead of entrusting it to centralized exchanges that are prone to governance issues and corruption. Moreover, the issue of banned withdrawals, account deactivation, or wallet maintenance problems is gone. 
  • Direct wallet-wallet crypto trading is the epitome of decentralization finance. Centralized exchanges are prone to state regulation – which renders them centralized platforms.
  • Atomic swaps are faster, period. The whole Know Your Customer procedures and other confirmation steps required by centralized exchanges slow down the trading process.
  • In an atomic swap, the need for an intermediary token is removed. E.g., if you want to buy Decred and you have LTC, you may need to trade that LTC for BTC – which you’ll then trade for Decred. Atomic swaps remove this long process by allowing you to trade at a go.
  • Trading at an exchange means you’ll be charged a lot of fees. And these exchanges set these fees and can increase them at will.

Limitations of Atomic Swaps

Atomic swaps look like the ideal way to swap cryptocurrencies among users, but unfortunately, we’re yet to reach the point where its adoption is a straightforward process. This is why:

i) Adoption

The current iteration of the technology needs the involved cryptocurrencies to meet three conditions:

Both must share a hash algorithm

Both cryptos must be able to initiate timelock contracts

Both cryptos must have certain programming functionalities 

These prerequisite characteristics lock out so many cryptocurrencies, as well as companies and users, that can give the technology a try as of now.

ii) Speed

Atomic swaps have the ability to get swaps done in an instant – but right now, it still needs a ton of work before it can get to the point of handling large volumes of data.

iii) Lack of Compatibility

Right now, a lot of existing wallets do not support atomic swaps. This impedes the wide-scale adoption of the technology.

Final Thoughts

Atomic swaps will help solve the problems of interoperability and lack of scalability in the current crypto space. The technology also has the potential to expand the growth of the crypto industry, as well as open up new avenues for truly decentralized and peer-to-peer transactions – which is the way it’s supposed to be. We can only hope that the technology will be enhanced and refined to be better positioned for this worthy task.

Categories
Crypto Market Analysis

Daily Crypto Review, Mar 23 – Bitcoin uncertainty amid worldwide COVID-19 economy shutdown

The cryptocurrency market spent the weekend falling down, possibly indicating a further drop towards the lows of the end of 2018/start of 2019. Bitcoin is currently trading for $5,922, which represents a decrease of 6.28% on the day. Meanwhile, Ethereum lost 7.21% on the day, while XRP lost 5.67%.

UNUS SED LEO took the position of today’s most prominent daily gainer, with gains of 1.62%. On the other side, Hedera Hashgraph lost 16.12% on the day, making it the most prominent daily loser.

Bitcoin’s dominance has increased over the weekend. Its value is now 65.98%, which represents a 0.55% difference to the upside when compared to Friday’s value.

The cryptocurrency market capitalization decreased over the weekend, with a current value of $166.74 billion. This value represents a decrease of $3.03 billion when compared to the value it had on Friday.

What happened in the past 24 hours

Catherine Coley, the CEO of the US branch of Binance, revealed that the coronavirus quarantine in Asia led to increased trade volumes. She announced this statistic during a Bloomberg interview, where she also talked about the increasing correlation between Bitcoin and the S&P 500.

On the subject of the increased correlation between Bitcoin and the S&P 500, Coley said that both the traditional markets as well as the cryptocurrency market are playing out a well-known long-term cycle.

Honorable mention

Tezos

The Tezos Foundation announced that they would settle a $25 million consolidated class-action lawsuit. This will settle more than two years of fighting in court. The foundation chose to settle due to the time and financial expenses that would keep piling up.

The settlement proceedings are currently pending court approval.

_______________________________________________________________________

Technical analysis

_______________________________________________________________________

Bitcoin

While most analysts claim that Bitcoin has not gone under the $5,900 level and therefore stabilized above it, they fail to notice that it might be more plausible that Bitcoin is facing resistance at the $5,960 level. If this is the case, then Bitcoin fell under one of its key support levels over the weekend. However, this does not signal that it will keep going further down. That being said, the situation in the world economy alongisde the coronavirus outbreak does not bring good news to any market, cryptocurrency included.


Bitcoin’s volume decreased over the weekend, while its RSI level is currently near the middle of the value range, sitting at the value of 47.

Key levels to the upside                    Key levels to the downside

1: $5,960                                           1: $5,000

2: $6,640                                           2: $4,300

3: $6,850                                            


Ethereum

Ethereum, as a cryptocurrency that is highly correlated to Bitcoin and its movement, did not differ much from the largest cryptocurrency by market cap. Ether’s price fell under the $128 support level but found its stability near the $122.5 support. Ethereum is now trading in the middle of the range, bound by these two key levels.


Ethereum’s volume decreased over the weekend, while its RSI level is currently at the value of 44.

Key levels to the upside                    Key levels to the downside

1: $128                                                1: $122.5

2: $168                                              2: $100 

3: $178.6                                                


Ripple

XRP fell below its $0.165 support level over the weekend after just briefly going over it. The third-largest cryptocurrency is, again, trading between the levels of $165 to the upside and $0.1 to the downside. The only change in terms of key levels seems to be that XRP now responded to a pre-2017 support level of $0.147.


XRP’s volume is on extremely low levels, while its RSI level is currently at the value of just above 44.

Key levels to the upside                    Key levels to the downside

1: $0.165                                            1: $0.147

2: $0.19                                              2: $0.1

3: $0.2                                              

Categories
Crypto Videos

Using Bollinger Bands To Capture Consistent Profits Part 1


Intro to using Bollinger Bands in cryptocurrencies (part 1/2)

The wild movements of a typical cryptocurrency price chart can definitely look bewildering at first glance. While it is easy to see the general direction of a trend for any given crypto, the confusion really sets in if you zoom in to a smaller time frame and take a look at all the peaks and troughs that actually make up that trend line.

Intro to Bollinger Bands


Simple moving averages are used to describe the average price of an asset over a period of time while using exponential moving averages will give more credence as well as arithmetic weight to newer prices. Both of them are intended to filter out the hourly and daily bumps that make up a price chart. They are also making trends as well as patterns more immediately obvious.

The system of using moving averages was further refined by a financial analyst as well as author John Bollinger in the 1980s. He introduced Bollinger Bands to the world. Bollinger bands are nothing more than a system of computing bands (high and low) above an asset’s moving average by using standard deviation.

Bollinger bands are also being used to examine exponential moving averages, unlike the Keltner channel’s examination of simple moving averages. The way Bollinger Bands are used provides the measurement tool with much more sensitivity to certain changes in the market.
Bollinger Bands and Crypto

When speaking about the notoriously volatile cryptocurrency market, Bollinger Bands are used quite a lot. They are mostly used in predicting possible breakouts as well as identifying key times to enter or exit the market. This use-case is particularly useful for day traders (rather than long-term investors), who often have to make quick and tough calls with incomplete information so they could retain their profits. If they make only one significant step in the wrong direction on just one cryptocurrency, they can eliminate days or even weeks of carefully harvested small gains.

More on how to use Bollinger Bands to improve your cryptocurrency technical analysis in part 2 of our guide.

Categories
Crypto Market Analysis

Daily Crypto Review, Mar 20 – Cure for Coronavirus found? Crypto surging, Bitcoin above $6,000

The cryptocurrency market had another surprise in its sleeve today. Bitcoin rose above $6,000, while other cryptos followed. Bitcoin is currently trading for $6,164, which represents a staggering increase of 16.2% on the day. Meanwhile, Ethereum gained 15.57% on the day, while XRP gained 8.52%.

v.systems took the position of today’s most prominent daily gainer, with gains of 38.24%. On the other side, Bytecoin lost 6.22% on the day, making it the most prominent daily loser.

Bitcoin’s dominance has increased over the past 24 hours. Its value is now 65.43%, which represents a 0.76% difference to the upside when compared to yesterday’s value.

The cryptocurrency market capitalization increased exponentially, with a current value of $169.77 billion. This value represents an increase of $17.41 billion when compared to the value it had yesterday.

What happened in the past 24 hours

This time, the “what happened in the past 24 hours” section will not be about cryptocurrencies. However, it is connected to the market as it influences it highly. Apparently, a cure for the notorious COVID-19 virus which struck the world has been found.

A drug that treats malaria developed over half a century ago is showing great signs of being the cure for COVID-19, especially in combination with an antibiotic. The study showed great results in treating the virus.

Honorable mention

Tether

The world’s largest stablecoin by market cap has launched its operation on the Bitcoin Cash network. USDT will, at the time of writing, be available on the Bitcoin Cash network. On top of this, it is also available on many other networks, such as Ethereum, Algorand, Liquid Network, EOS, Omni, and Tron.

Tether (USDT) has seen a great surge of interest in recent weeks as the market has been going down. With people not wanting to get out of crypto, but wanting to protect their investments, Tether has been one of the main destinations for their funds.

_______________________________________________________________________

Technical analysis

_______________________________________________________________________

Bitcoin

Bitcoin experienced a surge in price in the past 24 hours. The largest cryptocurrency by market cap managed to increase in value by over 15%, reaching a price of over $6,000. The resistance level of $5,960 has been broken and became a support level.The price push has ended and Bitcoin is now consolidating at the $6,100 level.


Bitcoin’s volume increased only slightly during the upswing, while its RSI grazed the overbought area on the 4-hour chart, but did not pass it.

Key levels to the upside                    Key levels to the downside

1: $6,640                                           1: $5,960

2: $6,850                                           2: $5,000

3: $7,085                                            3: $4,300


Ethereum

Ethereum followed Bitcoin and had a day with a double-digit increase in price. The second-largest cryptocurrency rose over 15% and managed to tackle the $122.5 as well as the $128 resistance levels, turning them into support.


Ethereum’s volume increased greatly during the upswing but died down as the move ended. Its RSI level also increased, with the value currently being at 61.

Key levels to the upside                    Key levels to the downside

1: $168                                                1: $128

2: $178.6                                            2: $122.5 

3: $185                                                3: $100


Ripple

XRP had a great day, as it increased in price by over 5%. However, its fortune is not as great as the other two aforementioned cryptos. The third-largest cryptocurrency by market cap did manage to gain some value but failed to break the $0.165 resistance level, which plays a crucial role in the future price development of XRP.


XRP’s volume increased slightly during the upswing but is back to normal levels now. Its RSI level is currently at the value of 56.

Key levels to the upside                    Key levels to the downside

1: $0.165                                            1: $0.1

2: $0.19

3: $0.2                                              

Categories
Crypto Videos

CNBC Is Always Wrong About Crypto – The Laughing Stock That Became A Indicator For Winning Trades!

Is CNBC always wrong about crypto? The CNBC reverse indicator!

Media has been covering cryptocurrencies in-depth for a couple of years now, with many crypto analysts, enthusiasts, and non-believers appearing on air. However, one channel stands out if we talk about cryptocurrency analysis and reports, and that is CNBC.

Bears, bulls, and CNBC

Jacob Canfield, a cryptocurrency analyst, and trader, noted how various tweets that CNBC posted and that is about Bitcoin going up or down coincided with exactly the opposite price movement. He posted his research in a submission on a popular website TradingView.

Canfield said that “Almost every single CNBC bullish tweet we’ve seen has been at the top of almost every single rally, giving traders a very strong sell signal. On the other hand, with every bearish tweet CBNC posts, it has been a clear tell of a short reversal as well as the end of a rally”.
As previously mentioned, CNBC is one of the most vocal mainstream outlets regarding Bitcoin and cryptocurrency in general, featuring daily price movement coverage as well as events regarding crypto. It has dedicated hosts that include the investment manager Brian Kelly.

CNBC reverse indicator

Based on the history of the posts, Canfield says, CNBC can be used as a reverse indicator. When used in such a manner, it had around 95 percent accuracy at the time the research was posted.
Canfield continued his analysis by saying: “With every bearish tweet CNBC posts, we typically see a 30% return on average.” If we pair this indicator with a few more indicators, we can create a pretty good strategy that covers price action, volume as well as market sentiment.
Based on this 30% average return expectation, the CNBC reverse indicator is an amazing indicator to use when gauging market sentiment and when to think about long or short positions. This indicator held up well over time as the CNBC news is showing almost the same levels of inaccuracy as they showed at the time of posting this analysis.

Following the post, the CNBC television reportedly contacted Jacob Canfield and invited him to be a guest at one of its crypto-related news segments.

Categories
Crypto Market Analysis

Daily Crypto Review, Mar 19 – BitMEX discussing Central Bank Digital Currencies; Cryptos consolidating

The cryptocurrency market has spent yet another day without much movement. Bitcoin is currently trading for $5,305, which represents an increase of 1.62% on the day. Meanwhile, Ethereum lost 0.75% on the day, while XRP lost 2.04%.

Steem took the position of today’s most prominent daily gainer, with gains of 95.53%. On the other side, WAX lost 21.91% on the day, making it the most prominent daily loser.

Bitcoin’s dominance increased by a slight margin over the past 24 hours. Its value is now 64.67%, which represents a 0.16% difference to the upside when compared to yesterday’s value.

The cryptocurrency market capitalization remained at basically the same place, with a current value of $152.36 billion. This value represents an increase of $0.61 billion when compared to the value it had yesterday.

What happened in the past 24 hours

BitMEX Research posted a thought that discusses the two approaches that governments can take regarding the issuance of a Central Bank Digital Currency as well as the ramifications for the economy. BitMEX posted its opinion on Mar 18.

The post said that “From a liquidity perspective, the largest deposit-taking institutions in an economy have an almost unconstrained capability to create new loans since the funds loaned out will automatically get placed back into their own bank as a deposit.”

Honorable mention

MakerDAO

The MakerDAO community has locked in an auction in hopes to cover a multi-million dollar hole in the DAI collateral. The funds were “gone” after the sudden Ethereum price crash on Mar 12.

The proceeds from the auction sale will be used to recapitalize and revitalize the system as well as to compensate the losses suffered by the borrowers. They lost their money as their Ethereum collateral got auctioned off for zero DAI.

_______________________________________________________________________

Technical analysis

_______________________________________________________________________

Bitcoin

Bitcoin had a pretty quiet day with virtually no price movement. There was, at one point, an attempt made by the BTC bears to push the price below $5,000. However, that push ended up quickly and Bitcoin was back to its previous level in no time.


Bitcoin’s volume is stable at the moment, though on quite low levels. Its RSI level is currently sitting at the value of 47.

Key levels to the upside                    Key levels to the downside

1: $5,960                                           1: $5,000

2: $6,640                                           2: $4,300

3: $6,850                                            3: 3,100


Ethereum

Ethereum had a similar day as Bitcoin, though with some differences. Namely, while Bitcoin had an attempted push to the downside, Ethereum tried to break its upside resistance level. However, that ended up without much effect, and Ethereum is now back to its previous level.


Ethereum’s volume is still extremely low and is keeping these levels. Its RSI level is currently slightly below the middle of the value range, sitting at 43.

Key levels to the upside                    Key levels to the downside

1: $122.5                                             1: $100

2: $128                                              2: $80 

3: $168                                           


Ripple

XRP also experienced a slow day with almost no price movement. However, its price moved a bit more than Ethereum’s and Bitcoin’s price. XRP managed to slide down in price by 2%. It is still kept within the same range, currently trading at just above $0.146.


XRP’s volume is extremely low, while its RSI level is sitting at 45 at the time of writing.

Key levels to the upside                    Key levels to the downside

1: $0.165                                            1: $0.1

2: $0.19

3: $0.2                                              

Categories
Crypto Market Analysis

Daily Crypto Review, Mar 18 – Bitcoin will save the world from crisis, Tim Draper announces

The cryptocurrency market managed stayed at almost the same place as yesterday. Bitcoin climbed above the $5,000 mark and is currently stagnating and consolidating there. Bitcoin is currently trading for $5,341, which represents an increase of 1.3% on the day. Meanwhile, Ethereum lost 0.28% on the day, while XRP gained 0.56%.

Dragon Coins took the position of today’s most prominent daily gainer, with gains of 62.43%. On the other side, Terra lost 4.53% on the day, making it the most prominent daily loser.

Bitcoin’s dominance increased by a slight margin over the past 24 hours. Its value is now 64.51%, which represents a 0.57% difference to the downside when compared to yesterday’s value.

The cryptocurrency market capitalization went up slightly, with a current value of $151.75 billion. This value represents an increase of $5.61 billion when compared to the value it had yesterday.

What happened in the past 24 hours

Right as bitcoin recovered slightly after a number of back-to-back market crashes last week, investor Tim Draper announced another optimistic forecast about Bitcoin.

Draper announced that decentralization powered by Bitcoin as well as other new technologies is one of the tools that has the “ability to transform the biggest industries in the world.”

Honorable mention

NEO

NEO-based DEX Switcheo partnered with the Zilliqa platform to allow trading of Ethereum-based and EOS-based assets on their platform.

According to a Mar 16 announcement, after the launch, Zilliqa holders will have access to Ethereum-based assets for the first time. Switcheo also plans to add Bitcoin (BTC) support soon.

_______________________________________________________________________

Technical analysis

_______________________________________________________________________

Bitcoin

Bitcoin experienced almost no price movement in the past 24 hours. The price was completely flat while the volume lowered slightly. This area of no movement happened ever since Bitcoin stepped into the $5,300 area.


Bitcoin’s volume is quite low, while its RSI level is in the middle of the value spectrum (currently at 45).

Key levels to the upside                    Key levels to the downside

1: $5,960                                           1: $5,000

2: $6,640                                           2: $4,300

3: $6,850                                            3: 3,100


Ethereum

Ethereum did pretty much the same as Bitcoin by mirroring its movement (or lack thereof). The second-largest cryptocurrency did nothing but move sideways for the whole day, with the price hovering right below the $122.5 resistance.


Ethereum’s volume decreased further, while its RSI level is currently at 40. There were no changes in key levels due to no movement to the upside or downside.

Key levels to the upside                    Key levels to the downside

1: $122.5                                             1: $100

2: $128                                              2: $80 

3: $168                                           


Ripple

XRP, for the first time in a while, didn’t just follow the general direction of the market but actually mirrored Bitcoin’s and Ethereum’s movement. The lack of volume resulted in sideways trading with no price movement whatsoever. The third-largest cryptocurrency is moving in a range between $0.1 and $0.165.


XRP’s volume decreased even more in the past 24 hours, while its RSI level is currently at the 44 mark.

Key levels to the upside                    Key levels to the downside

1: $0.165                                            1: $0.1

2: $0.19

3: $0.2                                              

Categories
Crypto Videos

The Fear & Greed Index Indicator! The Best Way To Identify Crypto Market Reversals part 2!

Trade cryptocurrencies using Fear and Greed Index – part 2/2

How to use the Fear and Greed Index to predict market reversals!

The Fear and Greed Index tends to reverse when it approaches “Extreme Fear” territory, while it is a bit less reliable when it approaches “Extreme Greed”. The “Extreme Fear” is the moment when fear transitions into very early and slight signs of greed. At that point, it reverses to the upside directly into greed territory, as opportunists start putting their money into the market.
If people feel greedier towards Bitcoin reversals when the market sentiment is at extremely fearful levels, will Bitcoin’s price follow to the upside?

The reversal points have plotted analogously to the BTC/USD’s price chart on the Fear & Greed Index.

Extreme Fear” levels on the Fear and Greed Index have always resulted in upswings and bullish reversals in Bitcoin’s price. Every time the Fear and Greed Index reached near-extreme levels of fear, a price reversal in Bitcoin’s price came. Extreme fear towards Bitcoin (and most top cryptos) has historically translated into a financial opportunity for the ones that decide to invest.

One big reversal was the mid-December of 2018 when the fear was extreme. At that point, Bitcoin bottomed at $3,200 before starting its new upswing.

Conclusion

The Fear and Greed Index is a great indicator to use when predicting when a bottom has formed on the Bitcoin chart. It surely is a great additional indicator that can show where and when a rally could approximately occur.
Although it won’t tell us exactly at which specific price point a reversal will happen, the Fear and Greed Index is certainly a valuable tool when it comes to timing a shift in market sentiment.
If history is a good teacher (and history does repeat itself), it is likely that people’s feelings towards Bitcoin are shifting dramatically sooner rather than later.

Categories
Crypto Market Analysis

Daily Crypto Review, Mar 17 – Bitcoin back up above $5,000 as bulls gather up

The cryptocurrency market managed to recover slightly from the fall it had yesterday. Bitcoin went above the $5,000 mark and regained some confidence. Bitcoin is currently trading for $5,297, which represents an increase of 2.83% on the day. Meanwhile, Ethereum gained 0.48% on the day, while XRP gained 1.02%.

WAX took the position of today’s most prominent daily gainer, with gains of 29.55%. On the other side, Komodo lost 13.25% on the day, making it the most prominent daily loser.

Bitcoin’s dominance increased by a slight margin over the past 24 hours. Its value is now 65.08%, which represents a 0.7% difference to the upside when compared to yesterday’s value.

The cryptocurrency market capitalization went up slightly, with a current value of $146.14 billion. This value represents an increase of $5.38 billion when compared to the value it had yesterday.

What happened in the past 24 hours

The fight against the Coronavirus pandemic is even present in the sphere of GPU mining, as the US chip manufacturer NVIDIA proposed for all users to use their computers to help the cause.

This initiative will accept donations of unused GPU computing power and then distribute it to an international processing power network. This will, in turn, be used to research COVID-19.

Honorable mention

Cardano

Earlier today, March 16, The Cardano Foundation made announced on its website that Z/Yen Group Limited (based in the UK) has initiated legal proceedings against the foundation.

Z/Yen Group Limited is a fintech company (think tank) as well as a former research partner of the Cardano Foundation.

_______________________________________________________________________

Technical analysis

_______________________________________________________________________

Bitcoin

After breaking $5,000 to the downside, Bitcoin bulls managed to gather and push its price back up. After struggling for a whole day, Bitcoin finally managed to break the $5,000 barrier and to reach consolidation above it. The largest cryptocurrency is now trading near the $5,250 area.


Bitcoin’s volume increased slightly during the breakout but quickly returned to normal. Its RSI level on the 4-hour chart is approaching the middle of the value range, currently being at around 44.

Key levels to the upside                    Key levels to the downside

1: $5,960                                           1: $5,000

2: $6,640                                           2: $4,300

3: $6,850                                            3: 3,100


Ethereum

Ethereum, unlike Bitcoin, did not move much in the past 24 hours. While it tried to replicate Bitcoin’s movements to the upside, the bull presence wasn’t strong enough to push the price above the $122.5 mark.


Ethereum’s volume is quite low, which is one of the main factors contributing to ETH not breaking the $122.5 resistance level. Its RSI level on the 4-hour chart is currently slightly above the oversold area.

Key levels to the upside                    Key levels to the downside

1: $122.5                                             1: $100

2: $128                                              2: $80 

3: $168                                           


Ripple

Our yesterday’s report said that XRP was in a better spot at that moment as it did not break any support levels during the price drop. This is true (but to the upside now) in today’s case as well. XRP gained some value as the bulls gathered up for a push, but the third-largest cryptocurrency did not break any significant levels (now to the upside).


XRP’s volume is quite low at the moment, while its RSI level on the 4-hour chart is currently 44.

Key levels to the upside                    Key levels to the downside

1: $0.165                                            1: $0.1

2: $0.19

3: $0.2                                              

Categories
Crypto Market Analysis

Daily Crypto Review, Mar 16 – Bitcoin under $5,000, how far down can we go?

The cryptocurrency market had yet another meltdown of epic proportions today. Bitcoin fell under $5,000 while most altcoins witnessed a price decrease that even goes into double digits on the daily. Bitcoin is currently trading for $4,847, which represents a staggering 7.93% decrease on the day. Meanwhile, Ethereum lost 11.82% on the day, while XRP lost 7.65%.

Dragon Coins took the position of today’s most prominent daily gainer, with gains of 117.84%. On the other side, Ren lost 27.37% on the day, making it the most prominent daily loser.

Bitcoin’s dominance decreased greatly over the weekend after falling over 5% in just one day. Its value is now 64.38%, which represents a 4.98% difference to the upside when compared to Friday’s value.

The cryptocurrency market capitalization went down significantly yet again, with a current value of $140.72 billion. This value represents a decrease of $12.8 billion when compared to the value it had on Friday.

What happened in the past 24 hours

Coinbase, which is one of the biggest US exchanges, recently revealed a new feature on its platform called Bitcoin batching. This feature is designed to save users money on transaction fees.

This move was taken by Coinbase in order to improve the customer experience, as it will allow single on-chain crypto transactions to be bundled into one.

Honorable mention

Tezos (XTZ)

A digital asset marketplace Binance.US will list Tezos’s XTZ token on March 16th. According to the announcement on Binance’s website, XTZ/USD, as well as XTZ/BUSD trading pairs, will be available to traders on Monday, March 16th.

_______________________________________________________________________

Technical analysis

_______________________________________________________________________

Bitcoin

After a pretty stable weekend of trading just above $5,000, Bitcoin’s price experienced some turbulence. At first, it seemed that the bulls have taken the lead and Bitcoin started moving up. However, the move slowed down as Bitcoin aproached $6,000. This newfound resistance got confirmed as Bitcoin’s price bounced back to $5,300, and then began falling even further. The largest cryptocurrency managed to go under the major support level of $5,000, which is a major psychological point. If the price continues going down this way, we can expect a major pinpoint to be the low of $3,100.


Bitcoin’s volume is average, except during the times of the price increases or decreases when it goes up. Its RSI level is currently in the oversold territory on the 4-hour chart.

Key levels to the upside                    Key levels to the downside

1: $5,000                                           1: $4,300

2: $5,960                                           2: $3,100

3: $6,640                                            


Ethereum

Ethereum shared a similar faith to Bitcoin. The second-largest cryptocurrency went above the $128 resistance level, but the bullish move quickly got shut down as bears took over. Ethereum then fell under the $128 and $122.5 support levels and is now trading just under $110.


Ethereum’s volume is quite low, while its RSI is in the oversold area on the 4-hour chart.

Key levels to the upside                    Key levels to the downside

1: $122.5                                             1: $100

2: $128                                              2: $80 

3: $168                                           


Ripple

Even though XRP almost mirrored the move that Ethereum made as far as price movement goes, it is in a much better spot at the moment. The third-largest cryptocurrency tried moving up but got stopped at the $0.165 resistance level. Right after that, the price started falling, and XRP reached the price of around $0.135. However, the price is slowly recovering, and the move to the downside didn’t break and support levels.


XRP’s volume is low, while its RSI level just went out of the oversold area on the 4-hour chart.

Key levels to the upside                    Key levels to the downside

1: $0.165                                            1: $0.1

2: $0.19

3: $0.2                                              

Categories
Crypto Videos

Crypto Lending The Superior Way Of HODLing Part 4 OF 5


Crypto Lending – Stay away from these platforms (part 4/5)


Not all crypto lending platforms are created equal. While it may be nice to earn interest on your cryptocurrency holdings, it’s not that nice to lose them or get them stolen somehow. While most people invest in cryptocurrencies to earn a profit, not many pay enough attention to the security of their holdings.

This part of the Crypto Lending guide will show two lending platforms that people should consider avoiding. This, of course, does not mean they are unusable. However, these lending platforms have critical flaws that might impact your holdings in a bad way.

XCOINS is a company founded in August 2018 by Sergey Nikitin. Nikitin decided to leverage PayPal and make this operation work. XCOINS lenders allow people to borrow their BTC funds; in return, they get monthly PayPal payments at various predetermined interest levels.
The main problem here is that XCOINS uses PayPal. This makes a lot of room for scams due to how PayPal operates in this domain. Someone can use XCOINS to borrow your BTC, go to PayPal and claim they never got it, and then file a payment reversal with PayPal, which will almost guarantee their funds back.
XCOINS explicitly announced that, in this case, there is no help or support whatsoever from XCOINS. Solely for this reason, XCOINS is a walking red flag when it comes to lending. On top of that, the platform is not exactly the best when it comes to good interest rates on crypto lending.

Salt lending platform made the news for being the first and only crypto lending site of that time. The company was founded in March 2016 by Shawn Owen. It quickly gained much popularity through its ICO. However, while their ICO promised many things (such as loans in many US states where there is no legal ability for SALT to provide such services), they never came through.
Ever since the public saw that many promises did not come to fruition, the project started experiencing more and more speed bumps. They have been under investigation by the US SEC for not declaring their ICO as security. This is not only a problem for the owners, as it can lead to the freezing all of their users’ assets. While they are working on this, the SEC pointed out to many red flags. On top of that, the founder and CEO Shawn Owens has stepped down from his position.
If we compound all this information, we can clearly see that SALT is currently far off from being a safe lending platform.

Check out the fifth (and last) part of our Cryptocurrency Lending series, where we will talk about various scams as well as about what cryptocurrency lending platforms could bring us in the future.

Categories
Crypto Market Analysis

Daily Crypto Review, Mar 13 – Cryptos staring into the abyss as Bitcoin drops to $3,800

The cryptocurrency market had a meltdown of epic proportions today. Almost every single cryptocurrency dropped over 20% in value. However, almost all the other markets are bleeding heavily as well due to the halt of the economy, which is caused by the Coronavirus outbreak. Bitcoin is currently trading for $5.025, which represents a staggering 34.29% decrease on the day. Meanwhile, Ethereum lost 29.15 % on the day, while XRP lost 24.74%.

Multi-collateral DAI took the position of today’s most prominent daily gainer, with gains of 7%. On the other side, Synthetix Network lost 49.74% on the day, making it the most prominent daily loser.

Bitcoin’s dominance decreased greatly over the past 24 hours. Its value is now 59.4%, which represents a 5.95% difference to the downside when compared to yesterday’s value.

The cryptocurrency market capitalization melted down, with a current value of $153.59 billion. This value represents a decrease of a whopping $63.64 billion when compared to the value it had yesterday.

What happened in the past 24 hours

The European Central Bank (ECB) announced that it would provide a $135 billion stimulus to the market. This number certainly dwarfs Bitcoin’s entire market cap. This move is not unique, as similar efforts have been shown from the US Federal Reserve on Mar 10.

In an effort to combat currently struggling markets, The European Central Bank made a decision to not cut interest rates any further, but to rather allocate 120 billion Euros to its asset purchase program.

Honorable mention

Enjin (ENJ)

Blockchain-based gaming ecosystem Enjin has just launched its Multiverse Program. The platform is now seeking applications coming from interested developers.

The Multiverse program is designed to attract developers to enter and explore Enjin’s Multiverse platform, which is a gaming platform supporting the creation of in-game digital assets. These assets can be transferred as well as used across multiple games that are hosted in the multiverse.

_______________________________________________________________________

Technical analysis

_______________________________________________________________________

Bitcoin

Bitcoin’s price had quite a meltdown in the past 24 hours. All technical analysis seems to be out of the game as BTC’s price went down from $7,400 to $3,830 in a matter of hours. The price broke every possible line and anchor it could hang onto and dropped to the lows of $3,830. However, the price quickly moved back up to just over $5,000 which is where it is at the moment.


Bitcoin’s volume increased greatly due to the selloff, while its RSI is deep in the oversold territory on every chart except for the weekly chart.

Key levels to the upside                    Key levels to the downside

1: $6,640                                           1: $5,000

2: $6,850                                           2: $4,300

3: $7,060                                            3: $3,100


Ethereum

Ethereum took a big hit as well, alongside other altcoins. In a price drop led by Bitcoin, Ethereum lost over 20% of its value in the past 24 hours. Its price fell to a staggering $90 all the way up from above $185 levels. The price has stabilized since and is trading at around $125. Unlike Bitcoin, though, Ethereum found resistance closeby, which is at the $122.5 level.


Ethereum’s volume increased due to the selloff, while its RSI level is oversold on every single chart except for the weekly chart.

Key levels to the upside                    Key levels to the downside

1: $128                                                1: $122.5

2: $168                                              2: $100 

3: $178.6                                            3: $80


Ripple

XRP was no different than other altcoins in terms of price development over the past 24 hours. Its price dumped as well, dropping to lows of $0.1. The price has recovered since and is now trading and consolidating near $0.14. However, XRP might be in the worst position out of the top3 cryptocurrencies as it does not have an anchor point to the downside.


XRP’s volume increased greatly, while its RSI level dropped to deeply oversold levels except for the weekly chart, where it is nearing the oversold area as well.

Key levels to the upside                    Key levels to the downside

1: $0.165                                            1: $0.1

2: $0.19

3: $0.2                                              

Categories
Crypto Videos

Crypto Lending The Superior Way Of HODLing Part 3 OF 5

Crypto Lending – Where to lend your crypto? (part 3/5)

This part of the Crypto Lending guide will cover Celsius Network, the third and last platform that we will show as good example of how a lending platform should operate.


Celsius Network – explained
Celsius Network is a company founded in 2018 by Alex Mashinsky. Mashinsky was one of the inventors and patent holders of the VOIP technology. He also holds numerous entrepreneurship awards. Forbes put Celsius Network in their Top10 companies to “watch for” in 2018, noting that the platform “is primed to disrupt traditional banking.”

Advantages of Celsius Network

When it comes to pros of Celsius Network, there are many. First off, users of the platform are allowed to deposit as well as hold their BTC, ETH, as well as several other top 10 cryptocurrencies. There are no fees whatsoever. This means no withdrawal fees, no transaction fees, no deposit fees, no early termination fees, even no origination fees. On top of that, there is no minimum deposit. Celsius accepts funds of any size, and they will never lock up the funds. You can withdraw anytime, whether it is because of an emergency, a better financial opportunity popping up or any other reason.

Celsius Network’s wallet is provided by BitGo (just like for Nexo). BitGo is the leader in using multi-sig encryption technology. Celsius lenders and borrowers are safely insured for up to $100,000,000.00 by Lloyd’s bank in case of a hack or bankruptcy. As with Nexo, this amount is for the company, not for each person.
When it comes to payouts, Celsius Network has weekly payouts for the interest earned. The platform also has great earning interest rates. Its interest rate is somewhere around 8% of interest earned on deposits of USDC, TUSD and GUSD. When it comes to the interest rates for deposits of ETH, BTC and some other cryptocurrencies, they are quite competitive as well, but not as good as the ones previously mentioned. Celsius Network also has rates of up to 10% if you accept to be paid interest with CEL tokens – their native cryptocurrency.

Disadvantages of Celsius Network

When it comes to cons, there are two noticeable ones. Celsius Network’s native token, CEL, has been suspended for the US customers. This means that the US customers can’t benefit from the 10% interest rate.

The other con is regarding their user experience. Celsius Network is only available via a mobile app. Its user experience is far worse than the user experience that its competitors provide.

Check out part 4 of our Cryptocurrency Lending series, where we will cover lending platforms that we do not recommend and explain why.

Categories
Crypto Market Analysis

Daily Crypto Review, Mar 12 – The US creating AmeriCoin? Altcoins plunging while Bitcoin increases its dominance

The cryptocurrency market moved down yet again in the past 24 hours. However, Bitcoin held up much better than most cryptos. Bitcoin is currently trading for $7,728, which represents a 2.1% decrease on the day. Meanwhile, Ethereum lost 7.18 % on the day, while XRP lost 4.57%.

Aave took the position of today’s most prominent daily gainer, with whopping gains of 35.9%. On the other side, WAX lost 20.15% on the day, making it the most prominent daily loser.

Bitcoin’s dominance increased greatly over the past 24 hours. Its value is now 65.45%, which represents a 1.52% difference to the upside when compared to yesterday’s value.

The cryptocurrency market capitalization lost a lot of value over the past 24 hours due to altcoins plunging. It is currently valued at $217.23 billion, which represents a decrease of $7.83 billion when its value is compared to the value it had yesterday.

What happened in the past 24 hours

Adam Kokesh, the first libertarian US 2020 presidential election candidate, just appointed Alastair Caithness as his personal chief blockchain policy advisor. The main purpose of Caithness’s role is to work on the development of a US-made sovereign cryptocurrency, better-known as AmeriCoin.

Caithness will focus on developing a cryptocurrency that is pegged to all the assets of the Federal government. The assets included will be the US government’s substantial land, gold, energy, timber, and mineral reserves.

Honorable mention

Basic Attention Token (BAT)

Brave purchased a whopping amount of 534,441 Basic Attention Tokens (BAT) on Mar 9. The event of purchasing BAT tokens happens just one day before Brave made an announcement of a partnership with TAP Network. This partnership will enable convertibility of BAT tokens into “gift cards from hundreds of national brands”.

_______________________________________________________________________

Technical analysis

_______________________________________________________________________

Bitcoin

Bitcoin is slowly continuing its price drop as bears took over the market. The biggest cryptocurrency by market cap fell under the $7,760 support level, but did not go too far down from it. BTC is currently trading between $7,600 and $7,700, with the next significant support level standing at $7,420.


Bitcoin’s volume has maintained levels it had yesterday, while its RSI value is declining towards oversold again.

Key levels to the upside                    Key levels to the downside

1: $7,760                                           1: $7,420

2: $8,000                                           2: $7,085

3: $8,650                                            3: $6,850


Ethereum

Ethereum took a big hit in the past 24 hours. The second-largest cryptocurrency by market cap fell under the support level of $198 as well as the $193.5 level. The next support, which is sitting at $185, held up quite well and held back the bears for now. However, the short-term outlook is certainly not positive.


Ethereum’s volume is low when compared to the previous days, while it is keeping the levels of the beginning of March. Its RSI level is on the verge of reaching oversold territory.

Key levels to the upside                    Key levels to the downside

1: $193.6                                             1: $185

2: $198                                              2: $178.5 

3: $217.7                                             3: $167.8


Ripple

XRP followed the daily trend of altcoins underperforming Bitcoin. The third-largest cryptocurrency by market cap lost almost 5% on the daily, but still outperformed Ethereum. XRP’s price fell below the support level of $0.2 but did not reach the $0.1985 level yet.


XRP’s volume is quite low when compared to the past couple of days, while its RSI level is approaching the oversold area, hovering around the value of 34.

Key levels to the upside                    Key levels to the downside

1: $0.221                                            1: $0.2

2: $0.227                                            2: $0.1985

3: $0.235                                             3: $0.19

Categories
Crypto Market Analysis

Daily Crypto Review, Mar 11 – Youtube crypto ban; XRP’s price rises

The cryptocurrency market had a pretty slow day when compared to the past couple of days. Bitcoin is currently trading for $7,838, which represents a 1% decrease on the day. Meanwhile, Ethereum lost 0.88 % on the day, while XRP managed to gain 1.78%.

Contentos took the position of today’s most prominent daily gainer, with whopping gains of 330.4%. On the other side, Swipe lost 6.49% on the day, making it the most prominent daily loser.

Bitcoin’s dominance managed to decrease slightly over the past 24 hours. Its value is now 63.93%, which represents a 0.63% difference to the downside when compared to yesterday’s value.

The cryptocurrency market capitalization maintained its levels over the past 24 hours. It is currently valued at $225.06 billion, which represents a decrease of $0.47 billion when its value is compared to the value it had yesterday.

What happened in the past 24 hours

In another attempt of censorship, social media giant YouTube has deleted two posted videos form two crypto channels.

Ivan on Tech, a crypto reporter and programmer, posted a tweet about YouTube deleting one of his videos on Mar 9. The Moon, a (mostly) cryptocurrency technical analyst and news reporter, also told that the content platform deleted one of his videos on Mar 10.

Honorable mention

Ethereum (Synthetix)

Ethereum-based asset issuance platform is currently adding new features, which even include derivatives trading.

In a Mar 10 blog post, the Synthetix platform announced plans for trading binary options in Q3 of this year. Binary options are a form of derivatives where the buyer is down to two outcomes: they either receive a payout or they lose their investment.

_______________________________________________________________________

Technical analysis

_______________________________________________________________________

Bitcoin

Bitcoin’s spent the day mainly trading between the support of $7,760 and $8,000. The price managed to break $8,000 at one point, even reaching $8,150, but quickly dwindling back below $8,000. The $7,760 level has proven to be quite stable and the bears are not able to break it at the moment.


Bitcoin’s volume is slowly declining while its RSI level has risen above oversold levels.

Key levels to the upside                    Key levels to the downside

1: $8,000                                           1: $7,760

2: $8,650                                           2: $7,420

3: $8,825                                            3: $7,085


Ethereum

Ethereum, just like Bitcoin, had a pretty slow day. The second-largest cryptocurrency found a strong support near the$198 level, which held up quite well. Its current price moves are narrowing down and might form a triangle pattern in the near future.


Ethereum’s volume is quite low at the moment, while its RSI level is just below the oversold line.

Key levels to the upside                    Key levels to the downside

1: $217.7                                             1: $198

2: $225.5                                            2: $193.6  

3: $240                                                3: $185


Ripple

Unlike Bitcoin and Ethereum, who mostly consolidated, XRP ended up gaining some value in the past 24 hours. The third-largest cryptocurrency bounced off of the $0.2 support and tried to move its price up, which it succeeded. The price slowly moved up over the past day and reached $0.216, where it stopped and started consolidating. XRP is currently trading near the $0.21 level.


XRP’s volume is extremely low, while its RSI level is in the 40’s range.

Key levels to the upside                    Key levels to the downside

1: $0.221                                            1: $0.2

2: $0.227                                            2: $0.1985

3: $0.235                                             3: $0.19

Categories
Cryptocurrencies

Weaknesses of Blockchain

Blockchain, the technology that underlies cryptocurrencies, constitutes distributed ledgers shared across nodes (computers) participating in the network. These ledgers record data in a sequential fashion after cryptographically securing it. Once data is recorded on the blockchain, it can’t be deleted. This, among many other features of blockchain, like transparency and being deregulated, has given blockchain tech a revolutionary reputation.

But some of these features have also proven to be the Achilles heel for blockchain. This article dives into some of the weaknesses of blockchain as it stands today.

i) 51% Attack

Consensus algorithms that help protect blockchains, like the bitcoin blockchain, have proven resilient over the years.

However, there’s the 51% attack threat that’s always hanging over these blockchains like the sword of Damocles. A 51% attack would occur if an entity managed to gain control over 50%+ of the network. This would disrupt the network by allowing such things as double-spending, excluding valid transactions, or altering the correct order of transactions.

ii) Data Modification, Or Lack of It

Once data is recorded on the blockchain, it’s immutable. Immutable means it’s unalterable. While this promotes accountability and reduces chances of fraud, it’s not always favorable for blockchain. Humans are prone to making mistakes, and once inaccurate information is stored on the blockchain, it can never be changed.

iii) No Customer Protection

Blockchain technology operates on the basis of the individual holding power over the asset they are verifying on the blockchain – whether it’s a title deed, a cryptocurrency, etc. Naturally, transactions go sour sometimes. In a scenario where this happens, the only way to overturn the transaction is if both parties agree, which might prove a tall order. This is unlike a centralized system where an arbiter mediates between two conflicting sides.

iv) Slow Settlements

Before any transaction is verified on the blockchain, all nodes must come to a consensus about the validity of the transaction. This is way slower than say, a bank verifying your transaction at the counter. And in the time between when a transaction is lodged and when it’s verified, a malicious actor can enter and execute malicious transactions.

v) Miners Can Be Selfish

On blockchains such as Bitcoin’s, mining is a process that incentivizes network participants to commit computer processing power and then gets rewards in the form of coins or a fraction of transaction keys. However, this has a downside. Miners may not be very concerned about settling the optimal number of transactions. All they care about might be finding the next block as quickly as possible in order to verify it and get rewarded.

There’s also the case of Selfish Mining, a.k.a block withholding attack, in which a miner finds and validates a block but does not broadcast it to the rest of the network. This results in the miner having more ‘proof-of-work’ than other miners in the pool and increasing their odds of unfairly getting more block rewards.

vi) Private Keys

Blockchain uses what are known as private keys to give crypto owners full control over their funds and data. Users need their private keys to access their funds and conduct transactions. This means if you own cryptocurrency, the security of funds is solely on you. In other words, you’re your own bank.  Once a user loses their private key (either by forgetting the seed phrase or misplacing their hardware wallet), their crypto holdings are effectively lost, and there is no recourse.

vii) Inefficiency

Blockchains that, for instance, use proof-of-work consensus mechanisms, are incredibly inefficient. This is because they store the entire history of transactions that ever occurred on the blockchain. This takes up massive storage capacities across devices. To make a transaction, the entire downloading and verification process needs to be completed. This could take several days – spelling crippling inefficiency about the network.

Viii) Storage Issues

As blockchains get more popular, it means more and more users are interacting with the network. This increases the size of the blockchain. We’re talking about hundreds of gigabytes of storage. This puts the network at the risk of losing nodes when people find the ledger too huge to download and store in their devices. And this puts the health of the blockchain in jeopardy since the health of a blockchain partly depends on how many nodes are supporting the network.

ix) Scalability Issues

To demonstrate the scalability issue of blockchain, let’s look at the most widely applied blockchain – the Bitcoin blockchain. It takes around 10 minutes for a transaction to be verified, translating into an average of 7 transactions per second. Compare this with Visa, which processes an average of 2,000 transactions per second. What this means is blockchains are still a long way off from achieving the level of scalability that they would need to be able to serve millions of customers around the world.

Final Thoughts

The idea here is not to discredit blockchain but point out how the technology could improve. Blockchain is not referred to as revolutionary for no reason. Developers are coming up with new solutions for blockchain’s weak spots every other day. Some of these are the Lightning Network, a technology that promises to improve Bitcoin’s scalability by offloading some transaction data off the blockchain so as to facilitate faster transactions. Industries of all types are also exploring technology so as to achieve more efficiency in processes. Despite its weaknesses, blockchain remains a technology to reckon with.

Categories
Crypto Market Analysis

Daily Crypto Review, Mar 10 – Crypto markets consolidating, Bitcoin still under $8,000

The cryptocurrency market spent the past 24 hours consolidating after a severe price drop. Bitcoin is currently trading for $7,898, which represents an 0.72% decrease on the day. Meanwhile, Ethereum lost 3.96 % on the day, while XRP lost 1.92%.

Loopring took the position of today’s most prominent daily gainer, with gains of 16.05%. On the other side, Swipe lost 12.25% on the day, making it the most prominent daily loser.

Bitcoin’s dominance managed to increase slightly over the past 24 hours. Its value is now 64.56%, which represents a 0.37% difference to the upside when compared to yesterday’s value.

The cryptocurrency market capitalization maintained its levels over the past 24 hours. It is currently valued at $225.53 billion, which represents a decrease of $7.18 billion when its value is compared to the value it had yesterday.

What happened in the past 24 hours

The VIX volatility index, one of the stock market’s main risk indicators, showed a value of 55 on March 9. This is the highest level it was on since 2009. In the meantime, the international oil price went all the way down to $36.20, down 20% from the previous session.

The Dow Jones tanked 6.9% as it was heading for its biggest daily loss ever to be recorded. On the other side, the UK’s FTSE went down 7.7%. Japan’s Nikkei ended up 5.1% below Friday’s close.

Honorable mention

Libra

Marc Bhargava, the co-founder of Tagomi, a company that has recently joined the Libra Association, spoke about the current market cryptocurrency downturn. Since Tagomi is well connected with some of the biggest exchanges as well as some of the biggest crypto traders, he may see the market movement from another perspective.

Bhargava believes that cryptocurrency is not a safe haven asset. This goes against the beliefs of other analysts. “BTC as well as crypto are currently a risk-on asset, more alike tech and VC rather than gold.”

_______________________________________________________________________

Technical analysis

_______________________________________________________________________

Bitcoin

Bitcoin’s price got destroyed over the weekend. After falling to the $8,000 levels, many analysts thought that this price level would hold up. However, Bitcoin continued its drop and ended up stopping at the $7,760 support level. The price bounced there and Bitcoin is now trading in a range between the support of $7,760 and the $8,000 resistance level.


Bitcoin’s volume decreased as the price began to rise, while its RSI level is still in the oversold area.

Key levels to the upside                    Key levels to the downside

1: $8,000                                           1: $7,760

2: $8,650                                           2: $7,420

3: $8,825                                            3: $7,085


Ethereum

Ethereum, just like Bitcoin, went into consolidation mode. Its price started to recover a bit earlier than Bitcoin’s but suffered another bear move, which ended at the $193.6 support level. Ethereum has recovered since and is currently trading above the $198 support level.


Ethereum’s volume decreased greatly since it stopped the downturn, while its RSI level left the oversold area.

Key levels to the upside                    Key levels to the downside

1: $217.7                                             1: $198

2: $225.5                                            2: $193.6  

3: $240                                                3: $185


Ripple

XRP ended up consolidating and finding anchor points as well in the past 24 hours. The third-largest cryptocurrency found a bottom to the downturn at the $0.1985 level and quickly recovered to above $0.2 levels. It is currently stable and trading just above this support line.


XRP’s volume decreased greatly once the move to the downside stopped, while its RSI level just left the oversold area and is hovering around 34.

Key levels to the upside                    Key levels to the downside

1: $0.221                                            1: $0.2

2: $0.227                                            2: $0.1985

3: $0.235                                             3: $0.19

Categories
Crypto Daily Topic

Ether Futures: The Definitive Guide

Speaking at an interview late last year, the new chairman of the U.S Commodity Futures Trading Commission (CFTC), Heath Tarbert, said that Ethereum Futures are likely to be launched sometime this year. 

Such a bold declaration, coming from the regulator of one of the largest derivatives markets in the world, will undoubtedly attract institutional investors who are looking to hedge losses in their fiat settled portfolios. 

But before we can examine the impact of ether futures on the crypto market, there is a good chance that the futures contract will not be launched as soon as expected. If at all it will even be possible to launch them in the first place. 

The Road to Launching Ether futures Contract

While CFCT is planning on launching Ethereum futures, the contracts have already been launched, and investors started to trade them on exchanges based outside the U.S. By extrapolating the market behavior on these exchanges, it’s safe to say that ether futures won’t trade in high volumes as anticipated.

On BitMEX, Huobi, and Deribit exchanges, where investors are actively trading ether futures, the contracts’ trading volume is less than 10% compared to that of bitcoin futures. It could be because Bitcoin futures were the first crypto derivatives to be launched, and have actually been in existence for quite some time now. As such, many investors view bitcoin futures as the crypto-asset of choice. Also, the difference in trading volume may be due to the fact that Ethereum is still maturing, and maybe it will eventually catch-up at its own time. 

Even without considering the trading volume, the launch of ether futures may not come to fruition due to the coin’s upcoming change in algorithm. The proposed change in algorithm will see Ethereum move from proof-of-work to proof-of-stake algorithm, making the coin more of a security than a commodity. 

Unlike proof-of-work where holders receive coin rewards randomly, once Ether moves to proof-of-stake, the coin holders will receive annualized rewards. As such, since the returns will be more regular and predictable, the entire Ethereum network will fall under the jurisdiction of the U.S. Security Exchange Commission (SEC). As it is widely known, SEC hasn’t warmed up to the whole idea of crypto-assets. This will likely delay the launch of Ether futures for quite a long time.

More so, the change in algorithm, which will be executed via hard forking, makes investing in Ethereum network riskier now than it would be if hard forking was executed when the network was in its infancy stage.  

Effects on The Crypto-market

Assuming that all goes well and ether futures are launched, the most immediate impact will be on Ethereum prices. 

Going back in time, the launch of Bitcoin futures coincided with the coin’s all-time high prices in the year 2017. Bitcoin pessimists were, therefore, able to enter the market via the futures, leading to a fall of  Bitcoin demand in the spot market. The lower the demand, the lower the prices.

The change in Bitcoin’s price dynamics, prompted the pessimists, as well as the initial coin holders, to short-sell in an effort to make returns off the falling prices, making the prices to decline further. 

History may repeat itself in Ethereum’s case, especially considering that the crypto-market is driven mainly by speculative investors. Yet, the Ethereum blockchain platform has the potential to shift the ETH market prices from speculation demand to benefit-driven valuation. This is possible due to the smart contract feature of the coin’s underlying protocol that allows users to complete transactions such as making a purchase without employing a third-party to oversee the whole process.  

Simply put, ETH isn’t just focused on cashing in the chips; instead, it’s focused on having a real-world use. This way, it’ll stick around for a long time and derive value from its transactional benefits. 

As Wall Street continues to work hard towards embracing cryptocurrencies, the launch of ether futures is critical, as it will incentivize deep pocket investors to enter ETH trade without necessarily owning the underlying asset. This might spark off an aggressive short-selling spree, but it might be a healthy thing for the market since it’ll help shift the focus to the real value of Ether. 

Companies who had raised money through ETH tokens – ERC20 – will, however, be affected if eth futures end up triggering short-selling panic. To hedge against further losses, these companies may resort to selling their token’s value for BTC or fiat currencies. In any case, whatever the resultants effect will likely increase Ether’s trading volume. 

With the increasing trading volume, more tools will be developed for seamless trading. Transactions will be faster, and even the current problems in the crypto-market, such as scalability, may eventually be solved. 

Besides the trading volumes and increased investment, Ether futures will help stabilize prices of the coin itself and, to a certain degree, those of Bitcoin. See, futures are, essentially, contracts to buy or sell a certain amount of an asset at a specific day and time. This is particularly useful when the underlying asset is highly volatile, which is the case with Ether. The rationale is that futures enhance liquidity, which is inversely proportional to volatility. 

Conclusion 

There are lots of mixed reactions about the expected launch of Ether futures. With Bitcoin options also hitting the market in the first quarter of 2020, perhaps, it’s best that ether futures are put on hold. 

For ETH, it’s futures may not attract a significant number of investors, since they are not the first of their kind to be launched. Nonetheless, their market debut will signify the maturation of the crypto-market, earning it mainstream acceptance. If the futures turn out to be as successful as Bitcoin’s, it might open the way for ETH options and other sophisticated trading instruments. 

However, before that, Ether will have to first mitigate the regulatory handle brought about by its algorithm change. Currently, analysts fear that the ETH may start out as a commodity but end up having a tangible value as it gets more decentralized. 


Categories
Crypto Market Analysis

Daily Crypto Review, Mar 9 – Blood on the streets, BTC under $8,000

It is quite a good statement when we say that the crypto market is bleeding over the weekend. Cryptocurrencies dropped in price a great amount as bears took over the market. Bitcoin is currently trading for $7,953, which represents an 8.98% decrease on the day. Meanwhile, Ethereum lost 9.72 % on the day, while XRP lost 9.66%.

UNUS SED LEO took the position of today’s most prominent daily gainer, with gains of 3.08%. On the other side, Swipe lost 26% on the day, making it the most prominent daily loser.

Bitcoin’s dominance managed to increase slightly over the weekend. Its value is now 64.19%, which represents a 0.4% difference to the upside when compared to yesterday’s value.

The cryptocurrency market capitalization dropped severely over the weekend. It is currently valued at $232.71 billion, which represents a decrease of $26.49 billion when its value is compared to the value it had on Friday.

What happened in the past 24 hours

Boeing has partnered with a multinational aerospace conglomerate Honeywell in order to use its GoDirect blockchain-based platform to track and sell $1 billion worth of airplane parts that they don’t need.

The partnership got revealed at the Hyperledger Global Forum 2020, which took place in Arizona. All the airplane parts were uploaded to the GoDirect Trade marketplace over the last weekend.

Honorable mention

Bitcoin (start of the bear trend)

Bitcoin began its sudden crash (which, in turn, brought all other cryptos down as well) due to another giant selloff coming from the PlusToken pyramid scheme.

According to various online Blockchain data sources, participants in the $2.9 billion pyramid scheme are attempting to sell their BTC holdings again. Ergo, the Twitter account that tracks PlusToken’s activities, showed that 13,000 BTC or roughly $210 million were involved in this sale.

_______________________________________________________________________

Technical analysis

_______________________________________________________________________

Bitcoin

Bitcoin’s price got destroyed over the weekend. Many analysts said that the sharp move to the downside will end at above $8,000. However, BTC dropped under it and can not get above again. This price drop was, as we mentioned above, caused by a pyramid scheme PlusToken giant attempting to get rid of its Bitcoin holdings.


Bitcoin’s volume increased as the price-drop occurred. Its RSI level is currently deep into the oversold territory.

Key levels to the upside                    Key levels to the downside

1: $8,000                                           1: $7,760

2: $8,650                                           2: $7,420

3: $8,825                                            3: $7,085


Ethereum

Ethereum also lost a great deal of its value but managed to spring back a bit (sooner and a bit more than Bitcoin). Its price went from $253 all the way down to $196.5. However, bulls took over and brought the price above the $198 support and slightly above (to around $208 at the moment of writing).


Ethereum’s volume increased greatly during this bear trend, while it is dropping at bulls took over. Its RSI level is just above the oversold territory on the 4-hour trading chart.

Key levels to the upside                    Key levels to the downside

1: $217.7                                             1: $198

2: $225.5                                            2: $193.6  

3: $240                                                3: $185


Ripple

XRP was no exception to the bleeding market. Its price dropped severely as well. The third-largest cryptocurrency dropped from $0.2454 all the way down to $0.2, where bulls took over. The price is currently rising at a slow pace, with XRP being traded for around $0.211 at the time of writing.


XRP’s volume increased immensely during the selloff but dropped down closer to normal when the bulls took over. Its RSI level is currently just slightly in the oversold territory.

Key levels to the upside                    Key levels to the downside

1: $0.221                                            1: $0.2

2: $0.227                                            2: $0.1985

3: $0.235                                             3: $0.19

Categories
Crypto Market Analysis

Daily Crypto Review, Mar 6 – Bitcoin above $9,000; Steem performing a network takeover

The crypto market managed to push up once again, with Bitcoin leading the way as it crossed the $9,000 mark. Bitcoin is currently trading for $9,061, which represents a 2.15% increase on the day. Meanwhile, Ethereum gained 1.31% on the day, while XRP gained 1.92%.

ABBC coin took the position of today’s most prominent daily gainer, with gains of 24.58%. On the other side, v.systems lost 7.02% on the day, making it the most prominent daily loser.

Bitcoin’s dominance managed to increase slightly over the past 24 hours. Its value is now 63.79%, which represents a 0.19% difference to the upside when compared to yesterday’s value.

The cryptocurrency market capitalization increased slightly in the past 24 hours. It is currently valued at $259.2 billion, which represents an increase of $3.75 billion when its value is compared to the value it had yesterday.

What happened in the past 24 hours

While multiple countries are testing and theorizing about the validity of a central bank digital currency, the US dollar remains physical and still sits in a place of dominance. However, how long will the dollar be so dominant if it doesn’t get digital? ING economist Carlo Cocuzzo said that “The dollar is the dominant currency today,” on a panel at London Blockchain Week, but added that “90% of forex turnover is in dollars, so the US stands to lose in this game.”

Honorable mention

Steem

The Steem blockchain experienced some problems recently, where the blockchain’s entire governance system had a couple of disturbances. Tron founder Justin Sun, who now owns the Steemit social network which is based on the Steem token, seems to have successfully executed a takeover of Steem tokens by leveraging not only the tokens that were directly controlled but also the tokens held on several major exchanges. If this is true, then the customers of these exchanges most likely had their funds used without their consent.

_______________________________________________________________________

Technical analysis

_______________________________________________________________________

Bitcoin

Bitcoin bulls managed to gather up for another push, which brought BTC above the $9,000 psychological mark. Bitcoin broke the $8,980 resistance without much effort, and continued to push up on the way to $9,115. However, the move ended with bulls getting exhausted at the $9,170 mark.


Bitcoin’s volume increased slightly when compared to yesterday, while it’s still considered average when compared to the rest of the week. Its RSI level is currently near the higher end of the value range on the 4-hour chart.

Key levels to the upside                    Key levels to the downside

1: $9,115                                           1: $8,980

2: $9,250                                           2: $8,825

3: $9,580                                            3: $8,650


Ethereum

Ethereum gained some value as well in the past 24 hours but did not break any major resistance levels. Ethereum moved within the range bound by $225.5 to the downside and $240 to the upside. Its price did drop below $225.5 earlier during the day, but quickly got back above and increased to $235.


Ethereum’s volume is extremely low, while its RSI is near the middle of the value range, sitting at around 53 on the 4-hour chart. There were no changes in the upside or downside levels.

Key levels to the upside                    Key levels to the downside

1: $240                                                1: $225.5

2: $251.3                                            2: $217.7  

3: $259.5                                             3: $198


Ripple

XRP also made some gains today. Its price went from right below $0.235 to almost breaking $0.2454 at one point in time. However, the bull pressure was not as strong, and the price could not pass this resistance level. XRP is now trading at around $0.24.


XRP’s volume is currently far below average, while its RSI level is slightly above the value range, sitting at around 57 on the 4-hour chart. There were no changes in the upside or downside levels.

Key levels to the upside                    Key levels to the downside

1: $0.2454                                          1: $0.235

2: $0.266                                            2: $0.227

3: $0.285                                             3: $0.221

Categories
Crypto Videos

The God Formula! How To Make Money In Crypto Using Fibonacci Part 2

How to make money in crypto using Fibonacci retracements – part 2/2

What do Fibonacci levels represent?

The Fibonacci levels used within crypto trading are 23.6%, 38.2%, 50%, 61.8%, and 100%. They represent psychological barriers that repeatedly show up within the crypto markets.
Another interesting aspect of Fibonacci levels is (as with many indicators), the fact that they become more accurate with more people using and respecting them. This falls under the “self-fulfilling prophecy” paradigm.

How to use Fib retracements

The Fibonacci retracement levels consist of horizontal lines that highlight areas of expected support and resistance. To create these Fib levels, you’ll need to draw a line between the lowest and the highest price of a particular trading cycle.
It’s up to the trader to choose whether they will use wicks or candles.


Fib retracements are a very popular tool amongst technical traders, as it allows them to identify levels where they can place their entry or exit points. More times than not, the market tends to struggle near these Fib levels.
Whether it is nature or a self-fulfilling prophecy, these levels do seem to work, and there are many traders that utilize Fib levels to profit in the volatile crypto market.
One thing to note is that you will never know how far the price will retrace exactly. This means that you can’t predict which Fib level the price will respect. That’s why it’s better to carefully watch the markets and wait for a level reaction before entering a position.
Can Fibonacci retracements be used with other indicators and tools?
Yes, they can. In fact, it’s highly recommended to use Fib retracements with some other indicators. If other tools and indicators overlap with the results of the Fibonacci retracement levels, the expected result is that much more realistic.

An example of using Fib retracements

Fibonacci retracement levels are very efficient when it comes to predicting a bounce off of a big red candle, upon the completion of a quick rally. These (fairly) quick trades can generate some good profit if timed properly.

Conclusion

Many traders use the Fibonacci retracements to decide where to set their buy orders. However, most of these traders use indicators such as volume and some momentum indicators alongside Fib retracements to increase the overall security of their decision.

Categories
Crypto Daily Topic

Is Coinfirm Redefining Crypto Privacy with New Tool?

On top of the list of the features or advantages that made cryptocurrency really take off are the privacy and anonymity benefits that its users enjoy. Most people have come to view the anonymity that blockchain offers as synonymous with digital privacy.

Would you believe that there is a new piece of technology that could spell the end of anonymity in cryptocurrency without compromising the privacy it offers?

Coinfirm, a global leader in analytics and AML for blockchain and cryptocurrencies, is leading the new tech development after having just raised over $4 million to build it. The software is designed to help crypto exchanges meet the new legal regulations that are meant to curb money-laundering using cryptocurrencies and digital assets.

The FATF Regulations of 2019

According to Pawel Kuskowski, the CEO of Coinfirm, his company developed the software with the primary objective to help crypto exchanges comply with the ‘wire transfer rule,’ also known as ‘The Travel Rule’ issued by the Financial Action Task Force back in June 2019. The Financial Action Task Force (FATF) is a large international agency tasked with setting the standards for anti-money laundering regulations around the globe.

In the new regulations targeting virtual assets and related providers such as cryptocurrency exchanges, countries are expected to implement a comprehensive framework of measures meant to combat terrorist financing and money laundering. These include providing essential information about the originator and beneficiary in every digital asset or cryptocurrency transfer.

Other pieces of information that must be provided are the sender’s physical address and identification as well as the date and place of birth. In the new rules, exchanges are also expected to capture the name and account numbers of the recipient.

Anonymity vs. Privacy

While privacy and anonymity are two very different concepts, the FATF regulation has put many cryptocurrency exchanges in a difficult position. This is because they are now required to collect and disclose customer information, something that definitely does not bode well with cryptocurrency users and tends to undermine blockchain’s greatest feature: anonymity.

This requirement has also brought to the fore the need to differentiate between anonymity and privacy as far as digital payments go. Anonymity refers to a situation where a person does not wish to hide what they are doing or what they own, all they try to conceal is their identity. Privacy, on the other hand, is the power to keep various personal things to oneself, regardless of how it impacts society.

According to Kuskowski, if you use cryptocurrency, you need to get used to the idea that the age of anonymity is gone. With the new ‘Travel Rule’ regulation issued by FATF, your favorite exchange will be required to tie your crypto address to your real-world identity. The software that Coinfirm is developing is focused on helping exchanges keep private their users’ information despite the problems anti-anonymity rules seem to cause.

How Coinfirm’s crypto privacy tool works

The new technology that Coinfirm is working on to help crypto exchanges comply with FATF’s new regulations is focused on the customer’s privacy rather than the exchange’s ability to provide it. The software lets virtual asset service providers (VASPs) such as crypto exchanges share only the necessary customer information securely with other VASPs. It also generates detailed security reports that can be used to determine how risky it would be for one VASP to trade with another VASP with customer privacy in focus.

The service is all-rounded. It not only makes it possible for VASPs to trade securely, but it also makes it possible and safer for exchanges to transfer funds to non-VASP establishments and recipients such as anonymous digital wallets.

The FATF Travel Rule requirements may seem to prevent VASPs from transacting with non-VASPs that are not subject to the new rules, but Coinfirm’s secure platform has a solution to this problem. Once the new regulations are in effect, it may be riskier for exchanges to trade with non-VASPs, but the new system is built to make it easy for exchanges to send and receive digital assets to non-compliant users while remaining compliant.

Is this the future of privacy in the crypto world?

It is no secret that blockchain’s top feature – anonymity – was the technology’s most marketed feature that turned out to be a double-edged sword that could cause almost as much harm as its benefits. Criminals – mostly traders in illegal products and services and money launderers – have had a field day thanks to the anonymity and peer-to-peer transaction capability offered by blockchain digital assets. FATF’s regulations have come at the right time just as global governments are grappling with how to deal with the surge in financial crimes brought about by the new digital currency.

Coinfirm’s CEO Kuskowski, is himself experienced in this field, having headed the anti-money laundering department of the Royal Bank of Scotland. He says that the future of financial privacy should be defined solely by how an individual or a business can keep snooping eyes out of their details, and not try to hide it from the system altogether. His company’s technology, if adopted by crypto exchanges, is more of a regulatory compliance system that aims to keep the exchanges in business while helping them protect their customers’ data.

Coinfirm is an established blockchain services company that already works with top exchanges, including Binance and even corporate investigations firm Kroll. They are best placed to provide a solution to the privacy and anonymity issue that exchanges have to explain to their customers because of the expertise it has in the industry and the influence it has on the global financial market.

Regulation is inevitable

Many people mistakenly believed that it is completely impossible to regulate the digital assets market, especially considering how governments and banks have tried and failed to kill blockchain products. Ultimately, they have had to embrace it. This new regulation is not just necessary; it is good for both the privacy of the users and the crypto economy into which the world is headed, according to Kuskowski.

“Coinfirm is focused on providing a solution to a glaring problem with no current solution. Our Solution will be available for the wider market, and not just specially developed for exchanges. Coinfirm is going to kill the market,” he said.

The future of privacy in the digital world will depend on how well the market will receive solutions such as the one developed by Coinfirm. While there is a risk that the new regulations will challenge crypto companies in every industry, it is likely to drag traffic off low-quality exchanges. 

Closing remarks

Kukowski and Coinfirm are very optimistic about the prospects and capability of their new tool. If they get it right, there is a high chance that the company will pioneer the next phase of cryptocurrency adoption with the new regulations. Exchanges that are compliant with the new regulations will be operating on the level of banks, and Coinfirm will be at the center of helping them manage their user data.

“Exchanges will soon be going head to head against banks, the financial field will be leveled,” Kuskowski said, “we will have the best seats in the house to see which financial industry is more effective as far as technology, costs, and user privacy goes. I believe that crypto and crypto exchanges will win hands down!”

Categories
Crypto Market Analysis

Daily Crypto Review, Mar 5 – Bitcoin uncertainty leading to a lack of buying or selling pressure

The crypto market had a green day, with only a few cryptocurrencies ending up in the red. Bitcoin is currently trading for $8,882, which represents a 0.95% increase on the day. Meanwhile, Ethereum gained 0.53% on the day, while XRP lost 0.05%.

Energi took the position of today’s most prominent daily gainer, with gains of 27.96%. On the other side, Bitcoin SV lost 4.56% on the day, making it the most prominent daily loser.

Bitcoin’s dominance managed to increase quite a lot over the past 24 hours. Its value is now 63.6%, which represents a 0.98% difference to the upside when compared to the value from when we last reported.

The cryptocurrency market capitalization increased slightly in the past 24 hours. It is currently valued at $255.45 billion, which represents an increase of $2.45 billion when its value is compared to the value it had yesterday.

What happened in the past 24 hours

Andrew Bailey, the next governor of Bank of England, expressed his sentiment towards crypto yesterday in London. He argued that anyone putting money into Bitcoin should prepare to lose everything.

Bailey shared his thoughts on Bitcoin to members of the U.K. Parliament at a Treasury Select Committee hearing, which happened on Mar 4. Bailey expressed his dislike towards Bitcoin and other cryptocurrencies as a whole before saying that:

“If you want to buy Bitcoin, be prepared to lose all your money… [Bitcoin] has no intrinsic value.”

Honorable mention

Cardano

The legal leader at Big Four’s PwC, Gunther Dobrauz, recently expressed his opinion about Cardano and showed open support to the people responsible for Cardano’s development.

Dobrauz claimed that decentralization is the future, and that the Cardano Foundation and the team surrounding the IOHK CEO and founder Charles Hoskinson are certainly a “huge part of this” future in a tweet on Mar 3. IOHK is the blockchain company behind Cardano as well as Ethereum Classic.

_______________________________________________________________________

Technical analysis

_______________________________________________________________________

Bitcoin

Bitcoin had a slow day with quite predictable price movements. Buyers and sellers bound its price between $8,400 and $9,000. Bitcoin has been staying in this range for some time now with no real pressure to go up or down. When compared to the yesterday’s price, Bitcoin did manage to gain some value, breaking the $8,825 line, but quickly stopping at the $8,980 one.


Bitcoin’s volume is slightly below average when compared to this week, while its RSI level is starting to increase slightly. It is currently sitting at a value of 58.

Key levels to the upside                    Key levels to the downside

1: $8,980                                           1: $8,825

2: $9,115                                           2: $$8,650

3: $9,250                                            3: $8,535


Ethereum

Ethereum is in the same position as Bitcoin, as its price has been ranging for some time now, as well. There has been no sign of pressure towards any side. Ethereum is currently trading above the $225.5 line, bound by it to the downside and the $240 resistance to the upside. However, all pressure to the upside seems to fade far before Ethereum’s price reaches $240.


Ethereum’s volume is quite low, while its RSI is near the middle of the value range, sitting at around 52.

Key levels to the upside                    Key levels to the downside

1: $240                                                1: $225.5

2: $251.3                                            2: $217.7  

3: $259.5                                             3: $198


Ripple

XRP is the only crypto out of the top3 that ended up in the red. Its price is also bound in a range, sitting between $227 and $2454. XRP’s price is not pressured to any side and is trading freely within this range. However, with fading volume, the volatility is fading as well, and the up and down movements seem smaller and smaller. XRP is now trading slightly above the $0.235 support line.


XRP’s volume is currently below average, while its RSI level is near the middle of the value range, sitting at around 53.

Key levels to the upside                    Key levels to the downside

1: $0.2454                                          1: $0.235

2: $0.266                                            2: $0.227

3: $0.285                                             3: $0.221

Categories
Crypto Market Analysis

Daily Crypto Review, Mar 4 – Bitcoin and Altcoins Recover, Look for Further Strength

The crypto market had a pretty quiet but effective day. Most cryptos that were going down yesterday ended that move and gained some value. Bitcoin is currently trading for $8,808, which represents a 0.24% increase on the day. Meanwhile, Ethereum lost 0.47% on the day, while XRP gained 0.84%.

Matic Network took the position of today’s most prominent daily gainer, with gains of 21.46%. On the other side, Kyber Network lost 9% on the day, making it the most prominent daily loser.

Bitcoin’s dominance managed to decrease slightly over the past 24 hours. Its value is now 62.62%, which represents a 1.12% difference to the downside when compared to the value from when we last reported.

The cryptocurrency market capitalization stayed at the pretty much same spot from when we last reported. It is currently valued at $253 billion, which represents a decrease of $1.43 billion when its value is compared to the value it had yesterday.

What happened in the past 24 hours

The tax bureau of Beijing made an official announcement that it will start implementing invoicing via blockchain within the city on March 2. Beijing wants to bring transparency, traceability as well as immutability by using blockchain invoicing.

The Beijing tax bureau will slowly and gradually carry out the promotion of the blockchain invoicing service throughout the city.

Honorable mention

MakerDAO

Major decentralized finance (or DeFi for short) player MakerDAO established a partnership with the payment processor Simplex. This partnership came to life to create a fiat on-ramp for MakerDAO’s Dai decentralized stablecoin.

The partnership allows people to buy Dai with the credit and debit cards that Simplex’s partner firms issued.

_______________________________________________________________________

Technical analysis

_______________________________________________________________________

Bitcoin

Bitcoin had a pretty slow day. However, the downtrend price movement that happened yesterday ended and Bitcoin moved up slightly. After the whole day of price going down, BTC bounced off of its $8,650 support and changed direction. Bitcoin is now right below the $8,825 which is did not manage to pass yet.


Bitcoin’s volume is slightly below average when compared to this week, while its RSI level is in the middle of the value range, sitting at around 51.

Key levels to the upside                    Key levels to the downside

1: $8,825                                           1: $8,650

2: $9,115                                           2: $$8,535

3: $9,250                                            3: $8,250


Ethereum

Ethereum had a slow day as well. However, its price movement did not make it to the green side when compared to the price of 24 hours ago. The slight downwards-facing move seems to have ended, and Ethereum stabilized right above the $225.5 support level.


Ethereum’s volume is quite low, while its RSI is in the middle of the value range, sitting at around 49.

Key levels to the upside                    Key levels to the downside

1: $240                                                1: $225.5

2: $251.3                                            2: $217.7  

3: $259.5                                             3: $198


Ripple

XRP also made a similar move as Bitcoin and Ethereum did. Once the bear pressure was weakened, bulls took over and brought the price above $0.235. XRP is now consolidating in the middle of the range, bound by $0.235 level to the downside and $0.2454 level to the upside.


XRP’s volume is slightly below average, while its RSI level is in the middle of the value range, sitting at around 50.

Key levels to the upside                    Key levels to the downside

1: $0.2454                                          1: $0.235

2: $0.266                                            2: $0.227

3: $0.285                                             3: $0.221

Categories
Crypto Market Analysis

Daily Crypto Review, Mar 3 – Cryptocurrencies back to bear cycle? Argentina suspending its blockchain registering system

The crypto market ended its one-day uptrend and backtracked a bit from the gains it made over the past 24 hours. Bitcoin is currently trading for $8,761, which represents a 1.7% increase on the day. Meanwhile, Ethereum gained 3.02% on the day, while XRP gained 1.7%.

Aragon took the position of today’s most prominent daily gainer, with gains of 17.41%. On the other side, Aragon lost 7.56% on the day, making it the most prominent daily loser.

Bitcoin’s dominance managed to increase slightly over the past 24 hours. Its value is now 63.8%, which represents a 0.15% difference to the upside when compared to the value from when we last reported.

The cryptocurrency market capitalization stayed at the same spot from when we last reported. It is currently valued at $251.57 billion, which represents a decrease of $0.36 billion when its value is compared to the value it had yesterday.

What happened in the past 24 hours

The government of Argentina made an announcement that its national blockchain-based mechanism for registering new companies will be suspended for a period of 180 days.

This measure, according to the statements made by the head of General Inspectorate of Justice Ricardo Nissen to La Nación, is made so Argentina could reorder the registration of new companies so that the inspectorate could also participate in the entire process.

Honorable mention

EOS 

Block.one released EOSIO 2.0 in January 2020 as an upgrade to the protocol. Some cryptocurrency exchanges like Coinbase announced that there was trouble with the performance of the network once the new set of protocol improvements was installed. This implementation slowed down or even stopped deposits and withdrawals.

In the meantime, the EOS community voted to slash the network inflation from 5% down to 1%, which marked this event as the blockchain’s second massive token burn event ever since Q2 of 2019.

_______________________________________________________________________

Technical analysis

_______________________________________________________________________

Bitcoin

Bitcoin ended its one day long upswing which managed to reach all the way to $8980 before crashing slightly. The biggest cryptocurrency by market cap broke the $8,825 resistance and rushed towards price levels of above $9,000 but failed as bears kicked in. Bitcoin’s price is now dropping, currently trading just around the levels that BTC has when we last reported.


Bitcoin’s volume is quite average when compared to the past and this week, while its RSI level is just below the middle of the value range, sitting at around 48.

Key levels to the upside                    Key levels to the downside

1: $8,825                                           1: $8,650

2: $9,115                                           2: $$8,535

3: $9,250                                            3: $8,250


Ethereum

Ethereum more or less mirrored the actions of Bitcoin in the past couple of days. Its upswing also ended after price not being able to push above $235. ETH is now slowly dropping in price, possibly testing the support level of $225.5. However, so far, the price is safe above this support level.


Ethereum’s volume is quite low, while its RSI is just below the middle of the value range, sitting at around 48.

Key levels to the upside                    Key levels to the downside

1: $240                                                1: $225.5

2: $251.3                                            2: $217.7  

3: $259.5                                             3: $198


Ripple

XRP also moved in the same direction and played out the same patterns as Bitcoin and Ethereum. After its upswing ended, XRP started to move to the downside. However, the bear presence was strong, and XRP is now testing the $0.235 support. It is still unknown whether the price will end up above or below it as the fight for the level is continuing. However, there is a good probability that XRP will continue its path to the downside in the short term.


XRP’s volume is slightly below average, while its RSI level is just below the middle of the value range, sitting at around 46.

Key levels to the upside                    Key levels to the downside

1: $0.2454                                          1: $0.235

2: $0.266                                            2: $0.227

3: $0.285                                             3: $0.221

Categories
Crypto Market Analysis

Daily Crypto Review, Mar 2 – Cryptos regaining pre-weekend prices; Watch out for crypto-stealing Trojans

The crypto market had a pretty slow weekend, with prices at almost the same place as they were on Friday. Bitcoin is currently trading for $8,773, which represents a 2.58% increase on the day. Meanwhile, Ethereum gained 3.07% on the day, while XRP gained 1.99%.

Bytecoin took the position of today’s most prominent daily gainer, with gains of 22.74%. On the other side, Kyber Network lost 9.66% on the day, making it the most prominent daily loser.

Bitcoin’s dominance decreased slightly over the weekend. Its value is now 63.65%, which represents a 0.88% difference to the downside when compared to the value from when we last reported.

The cryptocurrency market capitalization gained some value on the daily chart, while it stayed at almost the same spot from when we last reported. It is currently valued at $251.93 billion, which represents an increase of $2.84 billion when its value is compared to the value it had on Friday.

What happened in the past 24 hours

ThreatFabric, an Amsterdam-based firm specializing in cybersecurity and threats to the financial industry, managed to identify “Cerberus” Trojan that is able to steal 2-Factor Authentication (2FA) codes that are generated by the Google Authenticator app.

Coinbase, which is one of the biggest crypto exchanges in the world, is one of the cryptocurrency platforms listed in Cerberus’ list of targets.

Honorable mention

IOTA 

Iota began its seed migration on Feb 29, while they will open the network around Mar 10. Although many have criticized the decision to close the Coordinator verifier, it may have saved quite a lot of funds from being stolen from users.

The Iota network got shut down on Feb 12, shortly after their team received multiple reports of breached and drained user wallets. This was all possible thanks to the presence of the Coordinator, which is a centralized transaction verifier that is used to operate the network.

_______________________________________________________________________

Technical analysis

_______________________________________________________________________

Bitcoin

Bitcoin spent the past 24 hours gaining some value after the yesterday’s drop to $8,400. The biggest cryptocurrency by market cap managed to bounce off this price level and reach the price it had on Friday. Bitcoin bulls also attempted an upswing above $8,825, which failed.


Bitcoin’s volume is average when compared to the past week, while its RSI level is rising above the middle of the value range.

Key levels to the upside                    Key levels to the downside

1: $8,825                                           1: $8,650

2: $9,115                                           2: $$8,535

3: $9,250                                            3: $8,250


Ethereum

Ethereum’s also gained some value in the past 24 hours. This price gain made up for the price drop, which happened yesterday, and brought the price to $212. Ethereum reached over $225.5 and regained its pre-weekend levels. It also broke the descending trend line that it formed right before the weekend.


Ethereum’s volume is average when compared to the previous week, with its RSI level right in the middle of the value range.

Key levels to the upside                    Key levels to the downside

1: $240                                                1: $225.5

2: $251.3                                            2: $217.7  

3: $259.5                                             3: $198


Ripple

XRP performed almost exactly the same as Ethereum. Its price dropped to lows of $0.224 but recovered to levels above $0.235 in the past 24 hours. The third-largest cryptocurrency by market cap broke the descending trend line as well, confirming that it will stay above it (at least in the short term).


XRP’s volume is slightly below average while its RSI level is in the middle of the value range.

Key levels to the upside                    Key levels to the downside

1: $0.2454                                          1: $0.235

2: $0.266                                            2: $0.227

3: $0.285                                             3: $0.221

Categories
Crypto Market Analysis

Daily Crypto Review, Feb 28 – CFTC approaching stablecoin projects; Crypto market preparing for a move

The crypto market pretty much stayed at the same place price-wise in the past 24 hours. Bitcoin is currently trading for $8,758, which represents a 0.41% decrease on the day. Meanwhile, Ethereum lost 0.77% on the day, while XRP lost 0.11%.

Swipe took the position of today’s most prominent daily gainer, with gains of 19.28%. On the other side, DxChain Token lost 9.85% on the day, making it the most prominent daily loser.

Bitcoin’s dominance increased in the past 24 hours as some altcoins dropped in price more than it did. Its value is now 64.53%, which represents a 0.45 difference to the upside when compared to the value from when we last reported.

The cryptocurrency market capitalization stayed in pretty much the same place in the past 24 hours. It is currently valued at $249.09 billion, which represents a decrease of $0.92 billion when its value is compared to the value it had yesterday.

What happened in the past 24 hours

One of Switzerland’s biggest stock exchanges, SIX Swiss Exchange, announced a partnership with Omniex, a US-based firm that specializes in developing trading platforms for institutional investors, mainly targeting the cryptocurrency market.

The partnership will provide SIX and its clients with a way to include crypto to their business.

Honorable mention

Stablecoins 

American financial regulators had a sitdown with three major stablecoin projects in an effort for them to better understand the industry.

The CFTC Advisory Committee organized and held a public meeting in hopes of learning more about stablecoins, crypto insurance, custody practices as well as cybersecurity. JPM Coin, MarkerDao and Paxo had their representatives attend the event, discussing different aspects of stablecoins.

_______________________________________________________________________

Technical analysis

_______________________________________________________________________

Bitcoin

Bitcoin spent the past 24 hours trading at pretty much the same level. However, while there was seemingly not much price movement, Bitcoin made one attempt of breaking $8,825, which it did for a while. However, the price quickly pulled back and Bitcoin is almost exactly where it’s at 24 hours ago.


Bitcoin’s volume dropped to average levels after yesterday’s spike. It’s RSI level is currently on the line the oversold territory and regular value range.

Key levels to the upside                    Key levels to the downside

1: $8,825                                           1: $8,650

2: $9,115                                           2: $$8,535

3: $9,250                                            3: $8,250


Ethereum

Ethereum’s was also pretty stagnant over the past 24 hours. Its price attempted to reach the $240 mark but did not manage to get to it before bears took over again and put an end to the move. Ethereum fell to its previous prices and even attempted to break $225.5 to the downside. While its price is currently above this support level, it is unknown how long that will hold.


Ethereum’s volume is extremely low at the moment, while its RSI level is in the lower part of the value range.

Key levels to the upside                    Key levels to the downside

1: $240                                                1: $225.5

2: $251.3                                            2: $217.7  

3: $259.5                                             3: $198


Ripple

XRP performed the best out of the three biggest cryptos once again. However, this time, it was not by much. Its price tried to move above the $2454 level but failed to do so. As a result, XRP started dropping in price and pulled back to the $0.235 support. It is currently trading just above this support level.


XRP’s volume is slightly elevated, but nothing compared to yesterday’s volume. Its RSI level is in the lower part of the value spectrum.

Key levels to the upside                    Key levels to the downside

1: $0.2454                                          1: $0.235

2: $0.266                                            2: $0.227

3: $0.285                                             3: $0.221

Categories
Crypto Videos

Hedging Your Cryptocurrency Portfolio Part 3 – The Best Methods Explained

Hedging your cryptocurrency portfolio – part 3/4


Options
Options are a fairly new and limited concept in the cryptocurrency space. The only exchanges that actually offer it are Deribit and Bitmex.
Hedging using options can be pretty complicated. There are multiple ways you can build exactly what you want. We will show one of the most straightforward ways you can hedge out downside risk.


Why You Would Use This Method

One of the main benefits of hedging by using options is the difference in the payout. Hedging by buying put options can turn your existing options into a call option payout (which have limited downside with unlimited upside). The caveat to the method is that options, especially in the cryptocurrency market, are quite expensive.

Another great thing is that the margin does not need to be monitored as we are purchasing options to construct the hedge. These pros make it a fairly good method for investors that:
Are looking to hedge their positions but cannot, or don’t want to monitor their margin requirements Want the downside protection while still maintaining the potential upside gains.

How to Construct it

You will need:
An account with Deribit (they are the only exchange that offers crypto options)
The steps to constructing this method are similar to using futures:
Based on the current price of Bitcoin and your expected hedging time frame, check for the closest in the money (ITM) put option.
As an example, if BTC is at 6432 and you would like to hold it until the end of the quarter, look for the 6500 put option pricing for the end of the current quarter.
Check the current price of your chosen ITM put option and calculate how much funds you would need to deposit so you could make a 1:1 coverage of your BTC holdings.
Deposit the predetermined funds into the exchange.
Purchase the put option and simply hold it until expiration.

Summary

Hedging with options can be quite a complex task. However, this also means that it can be better tailored to your needs. If you want to use options to hedge and you want to hedge frequently, learning all there is about options is certainly a no-brainer.
Options hedging, as any type of hedging, has its Pros and Cons:


Check out our final part of the Hedging your crypto portfolio, where we will talk about hedging by using Perpetual Swaps.