Categories
Crypto Market Analysis

WAVES into a Corrective Phase

Waves (WAVES)

Market Cap: $647.89M

Circulating Supply: 100M WAVES

Max Supply: 0 WAVES

Volume (24h) $29.10M


The WAVES drops like a rock on the short term after another false breakout above a very strong dynamic resistance. Price approaches a strong support right now. It remains to see how it will react when it touches and retests the near-term support levels.

It is premature to talk about a larger drop in the short term as long as the rate is located above some crucial support levels. I said in last weeks report that the crypto marker rebound could be only temporary and it could come back down trying to capture more bullish energy.

We have important corrective movements on all major cryptocurrencies. This retreat is natural and it was expected after the impressive rally. I’ve told you in one of my editorials (Is the crypto market sell-off natural?) that the cryptocurrencies have reached important upside targets and could turn to the downside on the short term.

WAVES/USD dropped sharply in the last days

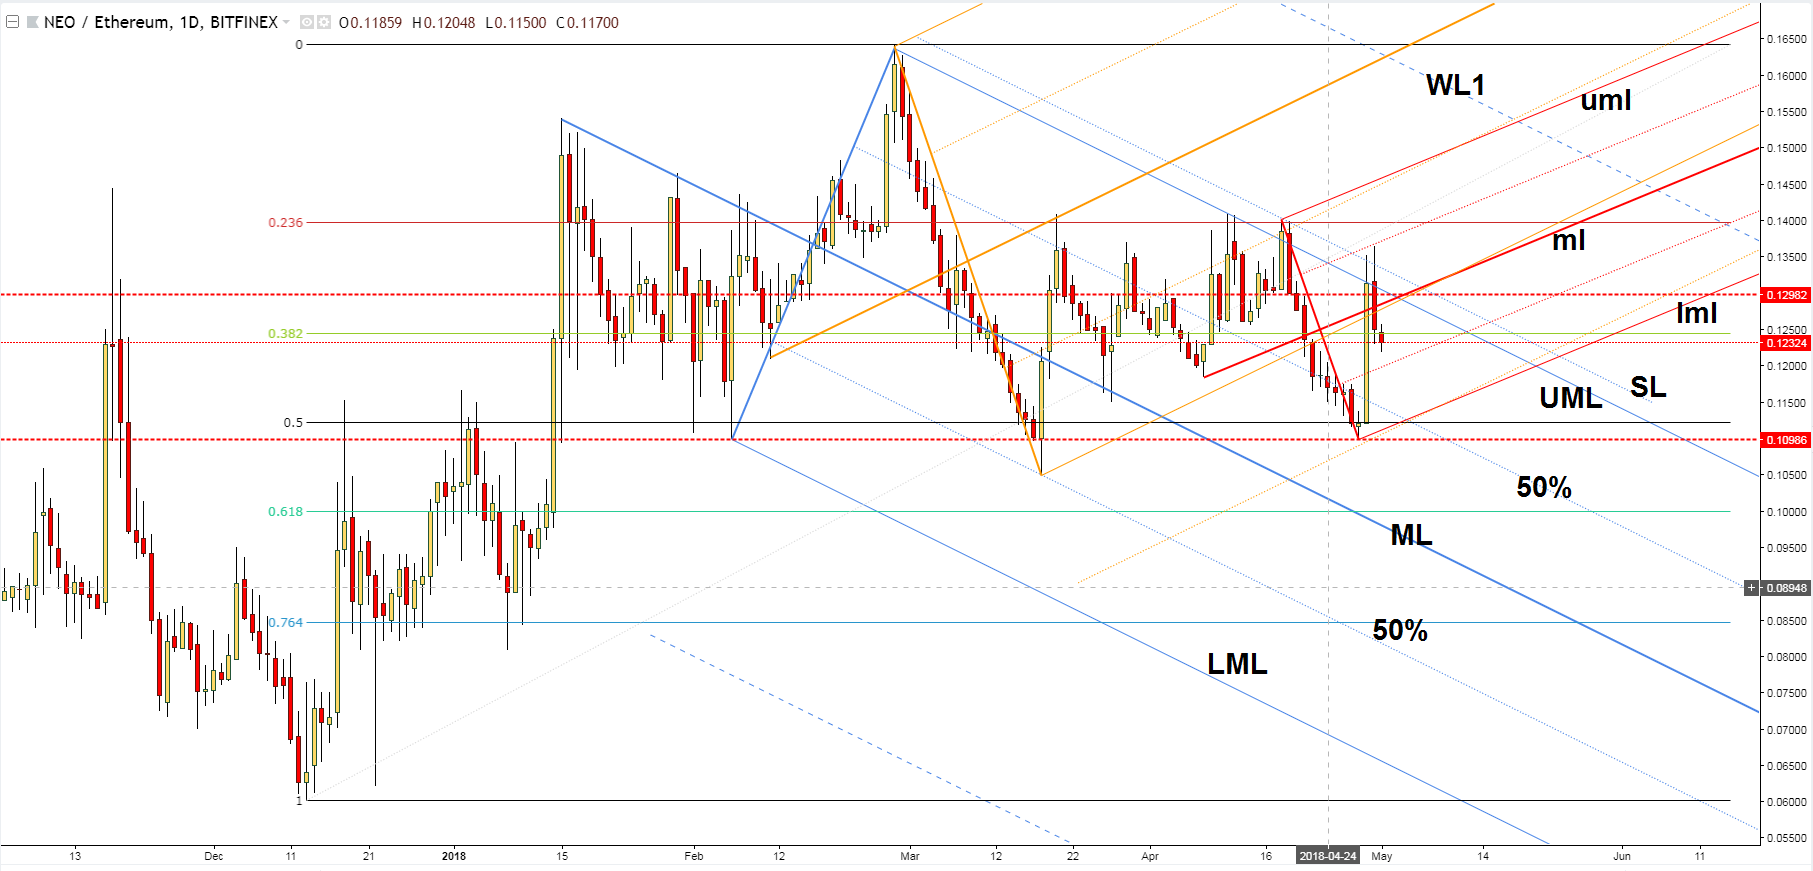
The WAVES/USD dropped sharply in the last days and now is pressuring the 6.28330036 static support. It should reach and retest the lower median line (LML) as well. A further increase on the Daily chart will be invalidated by a valid breakdown below the outside sliding line (SL) of the ascending pitchfork.


Conclusion

We could go long on this after a false breakdown below the mentioned support levels and after a retest. The first upside target will be at the 50% Fibonacci line. Only a valid breakout above the 50% line will signal a further increase towards the median line (ML).

©Forex.Academy

Categories
Crypto Market Analysis

XLM/BTC Bounce or Break?

Stellar (XLM)

Market Cap. $7.11B

Circulating Supply: 18.57B XLM

Max Supply: 0 XLM

Volume (24h) $55.19M


The XLM/BTC drops significantly after another false breakout above a dynamic resistance. It almost hits a dynamic support. A valid breakdown will confirm a further correction in the short term. Right now it will be better to stay away from this pair because we don’t have a great trading opportunity, but I really hope that we’ll have one very soon.

stellar charts

The XLM/BTC almost reaches the sliding parallel line (SL2) of the ascending pitchfork. A false breakdown below this dynamic downside obstacle followed by an important increase will signal a further increase in the upcoming days

However, a valid breakdown will send the rate to at least the lower median line (LML) of the ascending pitchfork. Support can be found at the 0.00003676 former low. A further increase will be invalidated after a breakdown below the lower median line (LML).

We still have a bullish perspective as long as the rate stays within the ascending pitchfork’s body. It will approach and reach the median line (ML) only if it will make a valid breakout above the sliding line (SL1) of the ascending pitchfork.

Personally, I believe that the rate will take out the support from the lower median line (LML) if will reach it and if will close on it.

Conclusion

I still believe that the crypto pair could increase in the upcoming period if will stay above the SL2. A drop below it will signal a high selling pressure and a larger drop. You could try to buy the retreat if the price will stay above the SL2.

©Forex.Academy

Categories
Crypto Market Analysis

SYS/BTC is this a temporary drop?

Syscoin (SYS)

Market Cap: $265.04M

Circulating Supply: 533.32M SYS

Max Supply: 888M SYS

Volume (24h) $3.45M


The SYS/BTC dropped aggressively in the last days and has reached an important support level. The bearish momentum was paused for the moment and is premature to talk about a significant rebound at this moment. Right now will be better to stay away because we don’t have a clear direction, but I really hope that we’ll have a great trading opportunity very soon.

Syscoin Price Prediction

The SYS/BTC has made two false breakouts above the upper median line (UML) of the descending pitchfork. The current drop is natural but remains to see how long this could be. We may have a perfect buying opportunity from above the upper median line (UML) of the descending pitchfork.

So, a rebound from here and a valid breakout from the descending pitchfork’s body will signal a further increase in the upcoming period. You can see that the 150% Fibonacci line represents a very strong dynamic support and could stop the retreat.

A drop below the 150% Fibonacci line will signal a further drop, and it could slip much below the 50% Fibonacci line as well, and it could be attracted by the median line (ML) again.

Price moves in range on the daily chart, that’s why only a valid breakout from the descending pitchfork’s body will signal a further increase and a breakout from the extended sideways movement.

Conclusion

The Syscoin dropped significantly after the false breakouts above the UML. Technically, it was somehow expected to climb much higher after the several failures to reach and retest the median line (ML) of the descending pitchfork. We’ll have an important upside target at the lower median line (lml) of the ascending pitchfork.

©Forex.Academy

Categories
Crypto Market Analysis

PIVX/USD – is this an Inverse Head and Shoulders?

PIVX (PIVX)

Market Cap. $317.45M

Circulating Supply 56.12M PIVX

Max Supply: 0 PIVX

Volume (24h) $4.65M


PIVX/USD dropped sharply today and failed to make a resumption of the bullish movement. The current drop could invalidate a further increase even if the perspective remains bullish on the short term.

Today’s drop has invalidated the latest day’s gains, but it could be stopped by the near-term support levels. We may have a great buying opportunity only if the rate makes a valid breakout above the near-term resistance levels.

pivx chart - forex.academy

You can see that the rate made another false breakout above the median line (ml) of the minor ascending Pitchfork. Technically, it was expected to climb much higher after the breakout above the first warning line (WL1) of the descending Pitchfork.

It could come back down to test and retest the 50% Fibonacci line (ascending dotted line) of the ascending pitchfork. Only a drop below this dynamic support will send the rate much lower in the short term.

The perspective will remain bullish as long as the rate is trading within the ascending pitchfork’s body. Only a breakdown will signal a further drop in the upcoming weeks and months.

Conclusion

You should buy it only after a valid breakout above the minor red line, above the median line (ml) and above the 6.75144524 static resistance level. The next upside target will be at the upper median line (UML). However, it will increase much more if the Inverse Head and Shoulders will be validated.

©Forex.Academy

Categories
Crypto Market Analysis

Ardor – Has The Rebound Completed?

Ardor (ARDR)

Market Cap. $430.46M

Circulating Supply: 999M ARDR

Max Supply: 999M ARDR

Volume (24h) $5.40M


The ARDR/USD dropped today and could invalidate a further increase. It remains to be seen what will really happen in the upcoming days because the perspective is still bullish in the short term as long as the rate is trading above some very important support levels.

We may have a great buying opportunity if the rate will decrease a little to retest the near-term support levels.

Ardor ARDR/USD chart

You can see on the Daily chart that the rate has made another false breakout above the 50% Fibonacci line (ascending dotted line) of the ascending pitchfork signalling that we may have a minor drop. It could come back down to test and retest the lower median line (lml) and the 0.33818380 static support.

We could take a long position from the mentioned levels if the rate stays above them after a retest. However, we could also buy this crypto after a valid breakout above the 50% Fibonacci line. A valid breakout will signal a potential increase above the median line (ml).

The perspective remains bullish as long as the rate stays above the 0.3381 level and the lower median line.

Personally, I was expecting to see an important upside movement after the retest of the lower median line (lml) of the ascending Pitchfork, but the 50% Fibonacci line represents a very strong dynamic resistance.

Conclusion

You can buy the ARDR/USD from above the 50% Fibonacci line after a valid breakout or after a retest of the lower median line (lml) of the ascending pitchfork. We have an important upside target at the 23.6% retracement level and higher at the upper median line (uml).

©Forex.Academy


Categories
Crypto Market Analysis

SNT/USD – could we have a larger upside movement?

Status (SNT)

Market Cap: $588.30M

Circulating Supply: 3.47B SNT

Max Supply: 0 SNT

Volume (24h) $66.63M


The SNT/USD is trading in the green right now but it remains to see how long for, after the last false breakout above a crucial resistance level. Price maintains a bullish perspective in the short term as long as it is trading above the crucial support line.

The crypto price went up and is signalling that the bulls are still present in the game after the last drop. We still have to wait for a confirmation that the rate will increase further.

SNT/USD is trading

The SNT/USD has once again failed to make a valid breakout above the downside 50% Fibonacci line of the ascending Pitchfork and now has come back down to retest the 150% Fibonacci line.

The price has made a false breakdown below the 150% Fibonacci line and has closed above it, signalling that we could have further price increases. The rate approaches the 0.18600 previous highs. It will reach it only after a valid breakout above the lower median line (LML).

A larger upside movement will be confirmed by a valid breakout above the downside 50% Fibonacci line (ascending dotted line between the ML and the LML). If this scenario takes shape, then the rate would jump much above the median line (ML) as well, with a target at the upper median line (UML).

Conclusion

If you are long on this crypto, you should keep your position as long as the rate stays above the 150% Fibonacci line. We have an important upside target at the 23.6% retracement level. A valid breakout above this level will really signal a broader upside movement.

©Forex.Academy

Categories
Crypto Market Analysis

Stratis Bulls in Control

Stratis (STRAT)

Market Cap. $775.46M

Circulating Supply: 98.84M STRAT

Max Supply: 0 STRAT

Volume (24h) $16.00M


Stratis Coin Price Prediction: STRAT/USD rose up to 8.09944618 today and passed above 7.90072126, yesterday’s highs. The crypto has increased by 30.24% in the last 7-days, signalling that the buyers are very strong. STRAT/USD has managed to climb above a strong dynamic resistance line but it remains to see if this will be a valid breakout.

It is close to reaching a very strong static resistance, that’s why we have to stay away from this crypto for now because only a valid breakout will confirm a further increase towards the 10.00000000 psychological level.

STRAT/USD chart

STRAT/USD has closed above the 50% Fibonacci line in yesterday’s trading session signalling that we may have a valid breakout. A valid breakout above the 23.6% retracement level will validate a further increase towards the median line (ml) of the ascending pitchfork and the upper median line (UML) of the descending pitchfork.

Only an aggressive bullish momentum will drive the rate towards the confluence area formed between the median line (ml) with the UML. The confluence area acts as a magnet and attracts the price. The several retests of the lower median line (lml) have signalled an increase at least till the median line (ml). So, we need a valid breakout above the WL1 and above the median line (ml) to be convinced that the rate will move towards the 38.2% retracement level and towards the next upside targets.

Conclusion

The pair will maintain a bullish perspective as long as it is trading within the ascending pitchfork’s body. If you want to go long, you can place a Stop Loss below the 5.49432004 low.

Categories
Crypto Market Analysis

Could AION shine again?

AION (AION)

Market Cap. $540.93M

Circulating Supply: 133.07M AION

Max Supply: 0 AION

Volume (24h) $13.15M


AION/USD rose and seems determined to climb much higher in the short term after the last minor drop. The failure to retest its dynamic support (resistance has turned into support) it has shown that the bulls are strong in the short term.

However, we still need a confirmation that the rate could increase significantly in the upcoming period. Price is ready to escape from an extended sideways movement so a valid breakout will confirm a further increase.

AION/USD

The AION/USD has finally managed to breakout above the downtrend line. It has come back to test and retest the broken dynamic resistance and now is struggling to climb towards fresh new highs. It seems like we have a valid breakout and the rate should make new highs soon.

AION/USD has jumped above the 3.8274271 static resistance, but we need a valid breakout to be sure that the rate will climb much higher in the upcoming period.

You can see that we had a false breakout above the 3.8274 level and above the 23.6% retracement level on April 24, that’s why the breakout needs confirmation. The failure to approach and test the first warning line (WL1) of the ascending pitchfork has signalled another bullish momentum.

The rate will become strongly bullish only after a valid breakout above the lower median line (LML) of the ascending pitchfork.

Conclusion

You can go long on this crypto if the rate will close above the 23.6% retracement level and you could place your Stop Loss somewhere below the 3.3446578 former low. A breakdown below the WL1 could invalidate a potential upside movement. We have an important upside target at the 38.2% retracement level and higher at the median line (ML).

©Forex.Academy

Categories
Crypto Market Analysis

Crypto Picks Review: EOS and VEN

EOS/USD

Crypto Picks Review: EOS/USD increased significantly after the breakout above the sliding line (SL1) of the minor ascending Pitchfork as expected (EOS Bullish Perspective), (EOS reached a major target, now what?). It has increased as much as 23.0290 level where it has found a very strong resistance.

EOS/USD chart - forex academy

The price dropped significantly and failed to stay above the second warning line WL2 and above the 250% Fibonacci line. The rate decreased today, signalling a selling pressure after the failure to retest the 250% Fibonacci line. EOS/USD failed to stay above the 18.6850 former high and now could drop further in the short term.

It could increase and approach the previous high only if it makes a valid breakout above the 250% Fibonacci line. The minor drop is natural and was somehow expected after the impressive rally. A valid breakdown below the first warning line (wl1) will confirm a further drop.

VEN/USD

The VEN/USD has increased as expected (VeChain broader increase validated) and has reached an important upside target. The rate is bullish and is targeting other major upside levels.

VEN/USD crart - forex.academy

The next upside targets will be at the first warning line (WL1) of the descending Pitchfork and higher at the first warning line (wl1) of the minor ascending pitchfork. This scenario will happen as long as the rate will stabilize above the broken upper median line (uml) of the minor ascending pitchfork. Only a breakout above the next targets will signal a larger upside movement.

©Forex.Academy

Categories
Crypto Market Analysis

Binance Coin – could we sell this?

Binance Coin (BNB)

Market Cap. $1.61B

Circulating Supply: 114.04M BNB

Max Supply: 0 BNB

Volume (24h) $78.38M


Binance Coin went down a bit and seems undecided right now because is hovering right above a very strong dynamic support. It remains to be seen what will really happen in the upcoming days because the price seems exhausted and could start a corrective phase. Right now it is premature to talk about a corrective phase because the rate could still recover after a false breakdown.

Binance Coin (BNB) chart

BNB/USD price increased in the previous weeks but has made another false breakout above the 15.1822017 static resistance signaling a potential drop. We have a bearish divergence on the Daily chart that’s why we could think of a significant drop.

We should wait for a selling opportunity. This could be confirmed by a valid breakdown below the first warning line (WL1) of the ascending Pitchfork. Price has moved away from the lower median line (LML) of the ascending Pitchfork and now has managed to close almost on the WL1.

You can notice that the rate has developed a Rising Wedge pattern, so only a breakdown will confirm a significant corrective phase. You should stay away from this crypto because a false breakdown below the WL1 will send the rate much above the 15.1822017 static resistance. A buying opportunity may arise after a valid breakout above the upside line of the chart pattern.

Conclusion

You can see this crypto after a valid breakdown below the WL1 or after a breakdown from the Rising Wedge pattern.

©Forex.Academy

Categories
Crypto Market Analysis

VEN/BTC Further Increase Could Be Confirmed

VEN/BTC pair is strongly bullish right now, but only a valid breakout will validate a further increase.

VeChain (VEN)

Market Cap. $2.57B

Circulating Supply:525.78M VEN

Max Supply: 0 VEN

Volume (24h) $120.84M

VEN/USD = $4.8790


VEN/BTC could resume its bullish movement if it really manages to make a valid breakout. Price is trading in the green and resumed the yesterday’s bullish candle. The rate goes up after the breakout from the Falling Wedge pattern. VEN/BTC is trading at 0.00054630 level and seems determined to approach and reach some very important resistance levels soon.

VEN/BTC Further Increase Could Be Confirmed

Price increased sharply after the retest of the 50% Fibonacci level and now is trading well above the 38.2% retracement level. The upside movement is natural after it has escaped from the Falling Wedge and retested the 61.8% retracement level.

I’ve drawn a minor black ascending pitchfork to catch the upside movement. The rate has finally managed to make a valid breakout above the 50% Fibonacci line (ascending dotted line) of the minor pitchfork. It should take out the resistance from the median line (ml) as well.

VEN/BTC retested the lower median line (lml) and failed to close below it or on it signaling a significant upside movement.

You should know that a valid breakout above the median line (ml) will confirm a further increase towards the upper median line (uml). Resistance can be found at the 50% Fibonacci line of the minor ascending pitchfork, at the sliding line (SL) of the major ascending Pitchfork and higher, at the 23.6% retracement level.

Conclusion

The VEN/USD should increase further if it makes a valid breakout above the median line (ml). A further increase will be invalidated only by a valid breakdown below the outside sliding line (sl2) of the major ascending pitchfork. Price could approach the 0.00081678 swing high if it makes a valid breakout above the sliding line  (SL).

©Forex.Acedemy

Categories
Crypto Market Analysis

LTC/BTC – could we have another leg higher?

Litecoin (LTC)

Market Cap $8.23B

Circulating Supply: 56.34M LTC

Max Supply: 84M LTC

Volume (24h) $345.98M

LTC/USD = $144.06


The LTC/BTC moves sideways on the short term signaling an oversold.  It seems like that the corrective phase could be completed after the failure to approach and retest a dynamic support. It is trading at 0.016167 level, right above the 0.015669 crucial support level.

It remains to see if this will be an accumulation or a distribution movement. Price is narrowing, but I really hope that we’ll have a fresh trading opportunity soon.

The LTC/BTC could drop a little to test and retest the 0.015669 static support after another failure to close above the median line (ml) of the ascending pitchfork. Price has failed to drop towards the 50% Fibonacci line signaling that the bears could be exhausted. I’ve drawn a sliding parallel line (sl), the rate has failed to approach and retest this level so we could think of another bullish movement.

However, the rate could continue to move sideways in the upcoming days before will decide what will do next. We have a crucial support at the 0.015669, at the sliding line (sl) and at the 50% Fibonacci line of the ascending pitchfork. The rate could bounce back as long as it stays above these downside obstacles.

Personally, I believe that a valid breakout above the median line (ml) of the descending pitchfork it will signal another significant leg higher.

Conclusion

You can go long after a valid breakout above the median line (ml). You can place targets at the median line (ML) and higher at the upper median line (uml). Only a breakout above the second target will confirm an increase above the 0.025004 swing high.

A potential increase will be invalidated by a valid breakdown below the 50% line of the ascending pitchfork and below the sliding line (sl) of the descending pitchfork.

Categories
Crypto Market Analysis

NEO/ETH Long After The Breakout

NEO (NEO)

Market Cap. $5.22B

Circulating Supply: 65M NEO

Max Supply 100M NEO

Volume (24h) $205.42M

NEO/USD = $80.114

The NEO/ETH is trading at 0.12324 level after the impressive drop. Price increased as much as 0.13649 in the yesterday’s trading session, but failed to stay there and now seems very heavy. The rate is trading in the red after the second false breakout above a very strong dynamic resistance.

Price moves in range in the short term, so we’ll have a clear direction only after a valid breakout from this chart pattern.

NEO Technical Analysis:

NEO/ETH increased aggressively on Sunday after the false breakdown below the 50% Fibonacci retracement level. Price has found strong resistance at the upper median line (UML) of the descending pitchfork. It has made a false breakout above the outside sliding line (SL) of the descending pitchfork and now could come towards the former low (0.10991).

Personally, I believe that we may have a larger increase only after a valid breakout above the sliding line (SL). You could buy this crypto pair after the rate will close above the SL and after a retest. You can see that I’ve drawn an ascending pitchfork to catch a potential upside movement.

Price has made a false breakout above the median line (ml) of the minor ascending pitchfork, and now it could come back down towards the lower median line (lml). NEO/ETH is somehow expected to increase after the failure to approach and retest the median line (ML) of the descending pitchfork.

You should know that only a valid breakdown from the minor ascending pitchfork’s body and below the 0.10986 will invalidate a potential broader increase.

Conclusion

You could buy it after a valid breakout above the SL, and you could place a  first take profit at the first warning line (WL1) of the descending pitchfork. The second take profit could be placed at 0.16409 swing high.

©Forex.Academy

Categories
Crypto Market Analysis

Bitcoin Increase Was Invalidated For Now

Bitcoin (BTC)

Market Cap. $152.98B

Circulating Supply: 17.01M BTC

Max Supply: 21M BTC

Volume (24h) $8.43B


BTC/USD dropped aggressively today and resumed the yesterday’s bearish candle. The crypto failed to take out a crucial resistance level and Bitcoin value now could drop significantly in the short term. Right now is premature to talk about a larger drop in the short term because this could be only a temporary drop. Price could try to accumulate more energy before will really start a larger increase.

Bitcoin Value Now

I talked about the Bitcoin two weeks ago (Bitcoin long, the most expected setup) and I’ve signaled a minor drop in the short term before the rate will really start a larger upside movement. I’ve said that the rate could come down after the breakout above the WL2 of the ascending pitchfork and could retest the lower median line (lml) or the outside sliding line (sl).

BTC/USD increased, but has failed to make a valid breakout above the 50% Fibonacci line (ascending dotted line) and above the 23.6% retracement level.

A valid breakdown below the inside sliding line (sl) will lead the rate towards the 350% line and towards the lower median line (lml). I’ve told you that we may have a great buying opportunity from the lower median line (lml) or after the retest of the outside sliding line (sl).

Personally, I was expecting a drop from 50% Fibonacci line or from the median line (ml) of the ascending pitchfork because was hard to believe that we’ll have a larger upside movement towards the 15000 level without a corrective phase.

Conclusion

The conditions haven’t changed too much. We’ll have an excellent buying opportunity if the rate comes down to test the lower median line (lml) of the sliding line (sl). You could go long also if the rate makes a valid breakout above the 50% Fibonacci line and above the WL3.

The first upside target will be at the median line (ml), the next one at the upside 50% Fibonacci line and a crucial one at the upper median line.

©Forex.Academy

Categories
Crypto Market Analysis

Verge – is this a buy or a sell?

Verge (XVG)

Market Cap. $1.02B

Circulating Supply: 14.94B XVG

Max Supply: 16.56B XVG

Volume (24h) $51.78M


Verge (XVG) Price Prediction:

XVG/USD moves sideways in the short term and seems undecided. Verge price is trading in the red right now and resumed the yesterday’s bearish candle. It is pressuring a dynamic support so that a valid breakdown will bring us a selling opportunity.

However, we may have a buying opportunity if the rate will have enough bullish energy to jump and stabilize above a dynamic resistance. I will show you two potential scenarios, a selling one, and a buying opportunity.

Verge (XVG) Price Prediction:

The rate could drop significantly if will close below the lower median line (LML) of the ascending pitchfork and if will come higher to retest it and the sliding line (sl) or the 505 Fibonacci line (descending dotted line).

So, it could drop at least till the median line (ml), a valid breakdown will send the rate towards the 0.02331280 former low and towards the lower median line (lml).


I’ve added another Daily chart to show you what could happen if the rate will remain within the ascending pitchfork’s body. XVG/USD it should climb much higher in the upcoming period if it will jump and will close above the sliding line (sl) and the 50% Fibonacci line (descending dotted line).

The last corrective phase could be completed, and the rate could approach and reach fresh new highs if the LML will hold and will keep the rate within the ascending pitchfork’s body.

Conclusion

The corrective phase was natural after the false breakout above the ML of the ascending Pitchfork and after the failure to close near this line. You can go short on this crypto if it makes a valid breakdown below the LML of the ascending pitchfork.

We may have a buying opportunity if the rate will climb above the sliding line (sl). The upside targets will be at the upper median line (uml), at the median line (ML) and much higher at the UML.

©Forex.Academy

Categories
Crypto Market Analysis

EDO/BTC Breakout In Play

Eidoo (EDO)

Market Cap. $81.26M

Circulating Supply: 29.26M EDO

Max Supply: 0 EDO

Volume (24h): $11.77M

The EDO/BTC rallied today and resumed the yesterday’s impressive increase. Price increased as much as 0.00027700 level where it has found a temporary resistance. The rate has reached two very important and crucial resistance levels.

The pair seems determined to increase further and to jump in the buyer’s territory. EDO/BTC is pressuring a resistance zone, so we have to wait for a valid breakout before we take action again. We had a great buying opportunity in the previous days, so, now we have to wait for another one.

 Eidoo Price Chart (EDO/BTC)

Eidoo price increased aggressively after the failure to retest the 0.00022195 static support and the inside sliding line (sl1) of the ascending pitchfork. You can see that the rate has finally managed to close above the second sliding parallel line (sl2) and now has reached the median line (ml) of the ascending pitchfork and the upper median line (UML) of the major descending pitchfork.

It remains to see how the rate will react in the upcoming hours, but you should know that a breakout is favored after the failure to close near the 50% Fibonacci line of the descending pitchfork in the last retest attempt.

A valid breakout above the UML will signal a further increase, while a valid breakout above the median line (ml) will confirm that the EDO/BTC is strongly bullish and it should approach the upper median line (uml) and the first warning line (WL1) of the descending pitchfork. We have an important upside target at the 0.00040010 swing high as well.

Conclusion

You could still go long on this crypto pair if the rate will close and will stabilize above the median line (ml) of the ascending pitchfork. You should wait for the rate to make another low in the upcoming period where you’ll place the stop loss.

Categories
Crypto Market Analysis

Dogecoin Could Start a Bullish Movement

Dogecoin (DOGE)

Market Cap. $604.75M

Circulating Supply: 114.24B DOGE

Max Supply: 0 DOGE

Volume (24h) $39.50M


The cryptocurrency is narrowing in the short term and maintains a bullish perspective. Dogecoin DOGE/USD changed was limited in the last days, but I really hope that we’ll have an impressive move soon. Is trading at 0.00529422 level after the failure to resume the yesterday’s minor increase.

Price has developed a minor chart pattern, but it remains to see if this is an accumulation or a distribution movement. The rate is pressuring a strong support area right now, so I really hope that we’ll have a great buying opportunity in the upcoming days.

Dogecoin (DOGE) - Forex Academy

You can see that the DOGE/USD has managed to jump above the downtrend line and now is retesting it. DOGE/USD has found temporary resistance at the 50% Fibonacci line (ascending dotted line) and now is trying to find strong demand again.

A valid breakout above the downward trend line will signal another upside momentum. The rate could continue the minor sideways movement before will have enough energy to make a larger move.

DOGE/USD could increase and could reach fresh new highs if it stays above the broken downtrend line and above the 0.00491848 static support. The rate could try to retest the lower median line (lml) in the upcoming days. Only a breakdown below the lower median line (lml) and a drop below the mentioned support levels would invalidate a further increase.

Conclusion

DOGE/USD will become strongly bullish only if will have enough directional energy to make a valid breakout above the 50% Fibonacci line (ascending dotted line). A valid breakout will confirm an increase at least till the median line (ML).


©Forex.Academy
Categories
Crypto Market Analysis

Is The NEO/BTC Poised To Climb Higher?

NEO (NEO)

Market Cap. $4.95B

Circulating Supply: 65M NEO

Max Supply: 100M NEO

Volume (24h) $144.05M


NEO/BTC decreased a little today and failed to resume the yesterday’s minor increase. Right now is premature to talk about the next move because is located between two crucial obstacles. It remains to see the breakout direction.

The crypto pair is trading at 0.008192 level after the failure to stabilize above the 0.009000 psychological level. Price has shown an overbought signal, but we still need a confirmation that the rate will turn to the upside and will reach new highs.

 NEO/BTC Forex Academy

The NEO/BTC has found strong support at the 61.8% retracement level. It has retested it showing that the buyers could take the lead again in the short term. Price has managed to breakout from the descending pitchfork’s body and above the first warning line (WL1).

Unfortunately, the crypto pair failed to stabilize above the downside 50% Fibonacci line (ascending dotted line) and above the 50% Fibonacci level signaling a minor exhaustion.

The rate has tested and retested the broken warning line (WL1), and now he’s moving away. NEO/BTC could come down to retest the sliding line (SL) before will try another breakout above the 50% level and above the 50% Fibonacci line. A breakdown from the red ascending pitchfork’s body will confirm a further drop.

Conclusion

You could go long on this crypto pair after a valid breakout above the 50% Fibonacci line (ascending dotted line). The near-term target will be at the median line (ML), while the major upside target will be at the upper median line (UML) and the 0.015200 highest high.

©Forex.Academy

Categories
Crypto Market Analysis

Santiment In The Buyer’s Territory

Santiment (SAN)

Market Cap. $117.29M

Circulating Supply: 62.66M SAN

Max Supply: 0 SAN

Volume (24h) $2.61M


SAN/USD increased today and resume the yesterday’s bullish candle. Price has managed to get back above a very strong dynamic resistance. The breakout needs confirmation because we had another false breakout the last days. Santiment Network Token increased by 10.35% today but is premature to talk about a larger increase at this moment.

santiment network token

You can notice that the rate has made a false breakout above the median line (ML) of the descending pitchfork. SAN/USD is trying to make a valid breakout right now but remains to see if the bulls will be strong enough. Price dropped sharply on Wednesday as the crypto market has crashed, but it has failed to close right on the lower median line (lml) signaling that the bulls are still in the game.

The crypto has tested and retested the lower median line (lml) of the ascending pitchfork and now is somehow expected to start an important upside momentum. Price needs to take out the resistance from the sliding line (SL) of the descending pitchfork because only a valid breakout will confirm a further increase.

It will become strongly bullish after a valid breakout above the inside sliding parallel line (sl) of the ascending Pitchfork. We may get a buying opportunity after a breakout above the SL and only if it will stay above the lower median line (lml).

Conclusion

The SAN/USD will climb towards the upper median line (UML) of the descending pitchfork and towards the median line (ML) only if will stay within the ascending pitchfork’s body.

©Forex.Academy

Categories
Crypto Market Analysis

Zcash Breakout Still In Cards

Zcash (ZEC)

Market Cap. $1.12B

Circulating Supply:3.79M ZEC

Max Supply: 0 ZEC

Volume (24h) $ 64.10M


The ZEC/USD dropped today and erased some of the yesterday’s gains. Price remains under pressure after the last false breakout and because is still trapped below some crucial resistance levels. The has found a temporary resistance, but we could see another breakout attempt soon.

Zcash rose by 4.17% today and by 10.80% in the last 7 days. We need a confirmation that the crypto will start a larger upside movement.

Zcash (ZEC) chart

The rate is trapped within a Falling Wedge pattern after the false breakout above the upside line of this pattern. ZEC/USD has also made a false breakout above the 23.6% retracement level and above the 50% Fibonacci line (ascending dotted line), so the minor decrease is natural.

It will drop towards the lower median line (lml) of the ascending pitchfork if the downtrend line will hold. A valid breakout above the upside line of the chart pattern will signal a further increase, but only a valid breakout above the 50% Fibonacci line will confirm a sharp increase in the upcoming weeks and months.

The ZEC/USD further increase could be invalidated only if the rate will drop and will stabilize outside the ascending pitchfork’s body.

Conclusion

We may have a buying opportunity after the breakout above the downtrend line and above the 23.6% retracement level, but only if the rate will stay above the lower median line (LML) of the ascending pitchfork. The next major upside target will be at the median line (ML) of the ascending pitchfork.

©Forex.Academy

Categories
Crypto Market Analysis

Metaverse – Buy a Valid Breakout

Metaverse (ETP)

Market Cap. $36.84M

Circulating Supply: 35.46M ETP

Max Supply: 100M ETP

Volume (24h): $5.94M


ETP/USD dropped aggressively in the yesterday’s trading session and erased some of the latest gains. Price is struggling to increase again and to stay above the 1.0000 psychological level. The crypto increased by 2.09% today, but unfortunately, the rate is under massive selling pressure after a false breakout.

It could drop further in the upcoming days to test and retest a potential support before will try to increase again.  Metaverse dropped sharply in yesterday’s trading session as the Crypto Market crashed. The retreat was somehow expected after the last period bullish movement.

Metaverse Coin Price

The rate was rejected once again by the lower median line (lml) of the ascending pitchfork and now is expected to test and retest the outside sliding parallel line (sl) before will make a significant move.

You could go long only if the rate will make a valid breakout above the lower median line (lml) of the ascending pitchfork and you can place the first target at the median line (ml). It will drop much farther in the short term if it slips and stabilizes below the sliding line (sl).

You can see that the rate has made a false breakout above the 1.1105 static resistance signaling a minor exhaustion. A valid breakout above the mentioned static obstacle will signal a  potential valid breakout above the lower median line (lml).

Conclusion

ETP/USD increase like the other cryptocurrencies after the massive drop, so the minor drop was natural as well.  We still need a confirmation that the Metaverse will resume the rebound and will reach at least the median line (ML)  in the upcoming weeks.

©Forex.Academy

Categories
Crypto Market Analysis

STEEM_Further_Increase_Awaits_Confirmation

Steem (STEEM)

Market Cap. $909.33M

Circulating Supply: 254.27M STEEM

Max Supply: 0 STEEM

Volume (24h) $96.44M


We had very high volatility on the STEEM/USD today. The crypto dropped aggressively in the morning, but the bulls have stepped in and have forced the rate to increase again. Price is trading in the green right now and has managed to increase by 2.47%  and by 21.82% in the last 7-days.

As you already know, the crypto market crashed today after the last period rebound. Steem maintains a bullish perspective on the Daily chart despite the today’s drop.


You can see that the rate was close to reach and retest the 50% Fibonacci line (ascending dotted line). Price has rallied and erased the morning losses, but it has failed to close and stabilize above the median line (ML) of the major ascending pitchfork and the 3.63158182 static resistance.

STEEM/USD it was expected to increase after the failure to test and retest the lower median line (LML) of the ascending pitchfork. It will move towards the 6.00000000 psychological level if will make a valid breakout above the median line (ml) of the ascending pitchfork.

The cryptocurrency will resume the upside movement and could be attracted by the upper median line (UML) if will close and will stabilize above the median line (ML).

Conclusion

Price squeezed in the second part of the day and now is trading in the green again. You can go long on this crypto after a valid breakout above the median line (ML). The next major upside target will be at the upper median line (UML), while the Stop Loss could be placed below the 2.52287131 level.

©Forex.Academy