Categories
Forex Videos

Forex Position sizing Part 10 – Scaling in and scaling out techniques!


Position sizing X: Scaling-in and scaling-out techniques

Scaling in and scaling out are usual techniques to increase the position while maintaining the risk stable. In this video presentation, we are going to explain how to do scaling in and out 3properly.
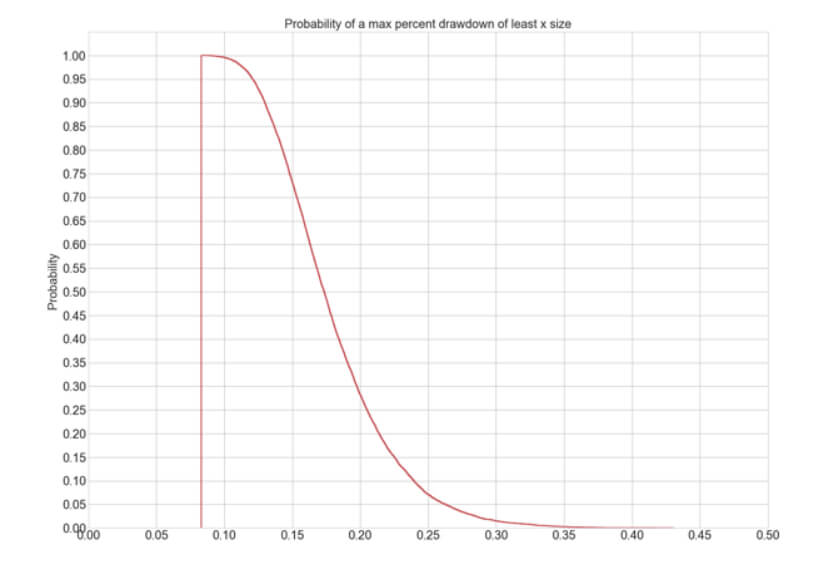
Scaling-in can be thought of as a means to reduce the risk while increasing the size of the position. Let’s say that you have a trading system optimal with a 10% total position sizing, and you expect to have no more than four open positions at a given time. Under these premises, the risk per position is 2.5%, but this may bring the overall drawdown to over 25%, which is too high for your tastes.

Pyramiding (scaling in) allows you to approximate your position to 2.5 % while using the market’s money to lower your risk to 1.25%, so your drawdown is reduced accordingly.

Scaling-In

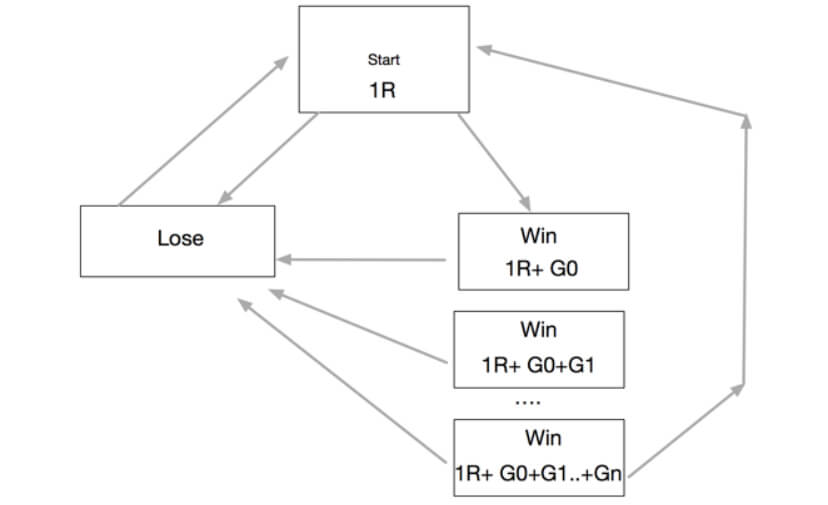
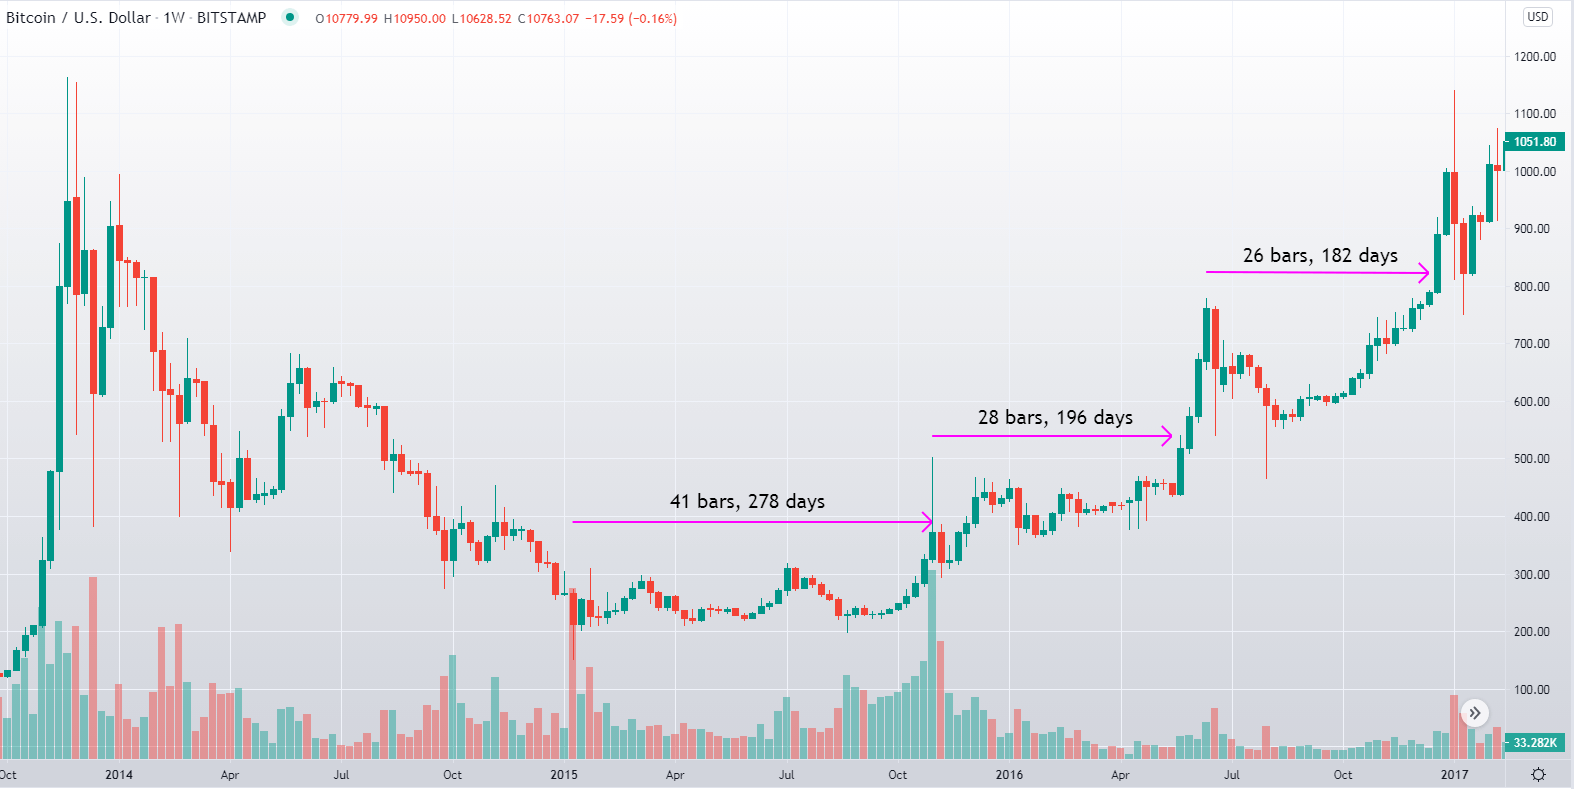
There are several ways to scale in. The basic idea is to add another position to an open trade after a determined profit milestone has been reached. This milestone is usually linked to volatility ( or range). Consequently, the stop-loss settings should also be related to volatility. Traders also associate it with new breakouts after consolidation or any other trend continuation signal. Finally, traders could consider adding a new position after the price moves a determined amount in his favor. One way is to wait for a 1R move, move the stop to BE, and add a position.
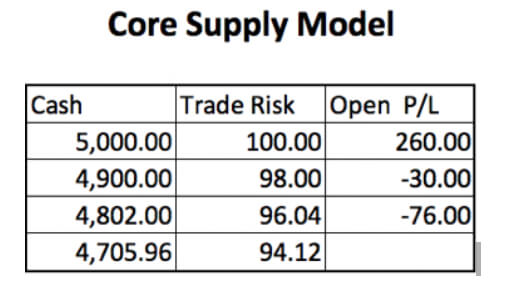
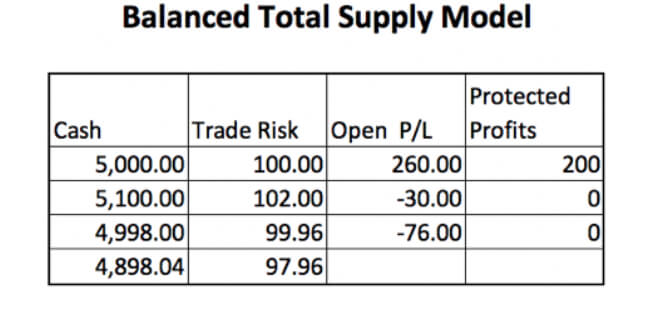
For example, let’s suppose a trader has a $10,000 account and wants to trade the EURUSD pair, actually trading at 1.1265. On the chart, the trader sees that the 4H range is 27 pips; thus, he sets the stop-loss setting to 81 pips (3X the 4H range). Let’s suppose that his analysis led him to conclude that the following action will completely fade the last upward movement. So, he opens a short trade (sell) with a profit target to 1.885 and an initial stop-loss of 1.1345 for about 3.3R trade. He begins to risk $125, which is 1.562 lots. The price starts moving in his favor, so he sets a new sell order for another 1.562 lots 27 pips below the open, another sell order 27 pips below this second sell order, and a final sell order at 27 pips below the previous order.
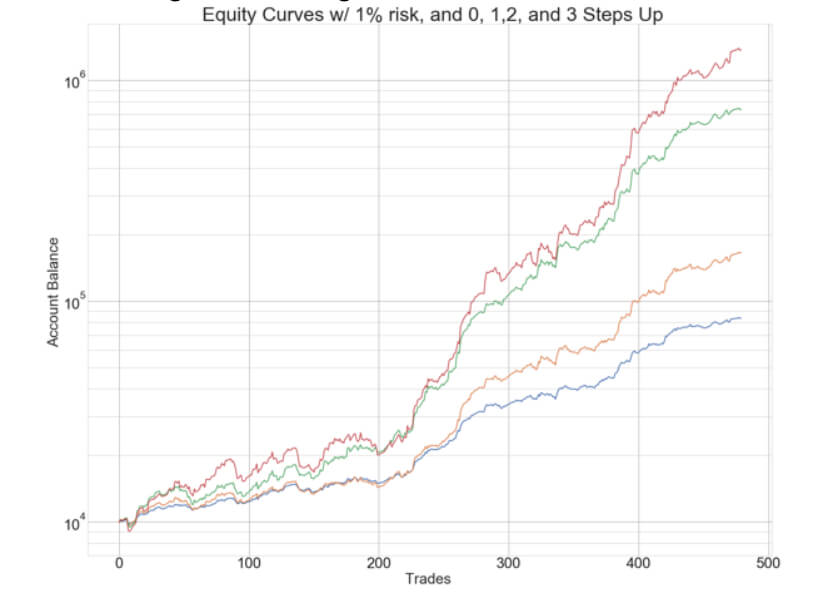
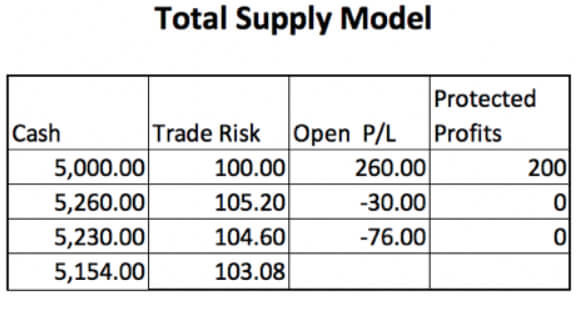
At the same time, the stops are moved 27 pips down every time a sell order is triggered. After the third trade, the trader has 4,6 lots., The last one has a $125 risk, the previous one has currently $83.3, and the initial order shows a $41.66 risk. That is so because the stop-loss was moved progressively from its initial value in 27 pip steps. So, even when the total risk should have been $375, the position has tripled after the pyramiding, but the risk has just doubled ($250), which is 2.5% risk the trader was seeking. Of course, there are plenty of variations on this theme. We might choose to split it into more steps 3, 4, 5. Or add positions at larger advances in our favor.

Scaling out

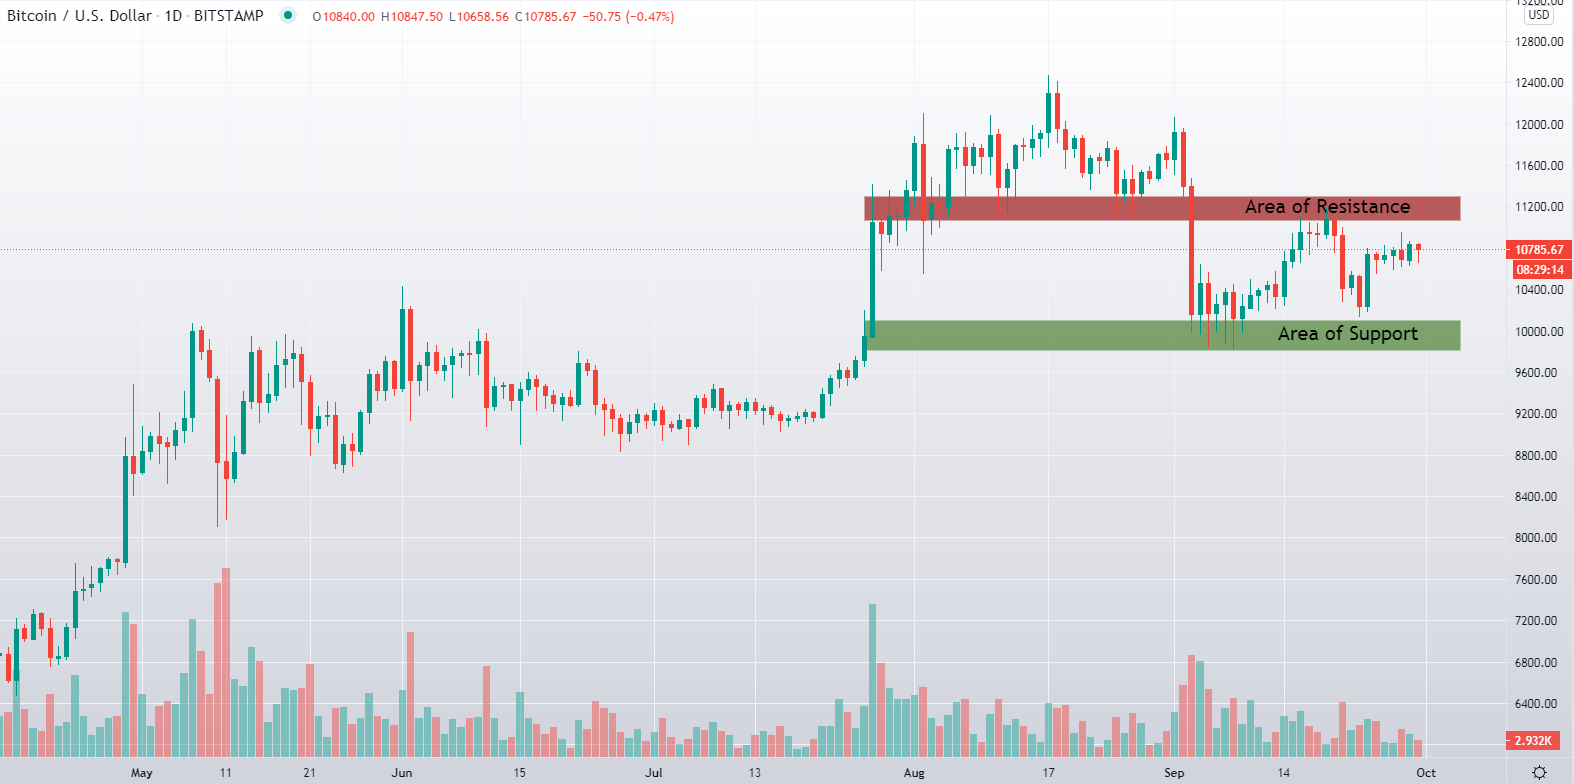
At some point, if the trader continues to add lots to his position, he may risk a swift movement against his position, wiping all then gains. Scaling out is the trader’s right method to plan ahead of time the potential support/resistance zones and set these levels as partial profit targets. Scaling out may be applied using the same volatility concepts. After the last entry, the trader may start scaling out when another measure of volatility or range has been reached, but technical levels should also be analyzed, so a blend of both can be made to make them optimal.

Scaling-In techniques

Scaling-In can be initiated using the following methods:

  1. Volatility/range based
  2. A percentage of the initial risk
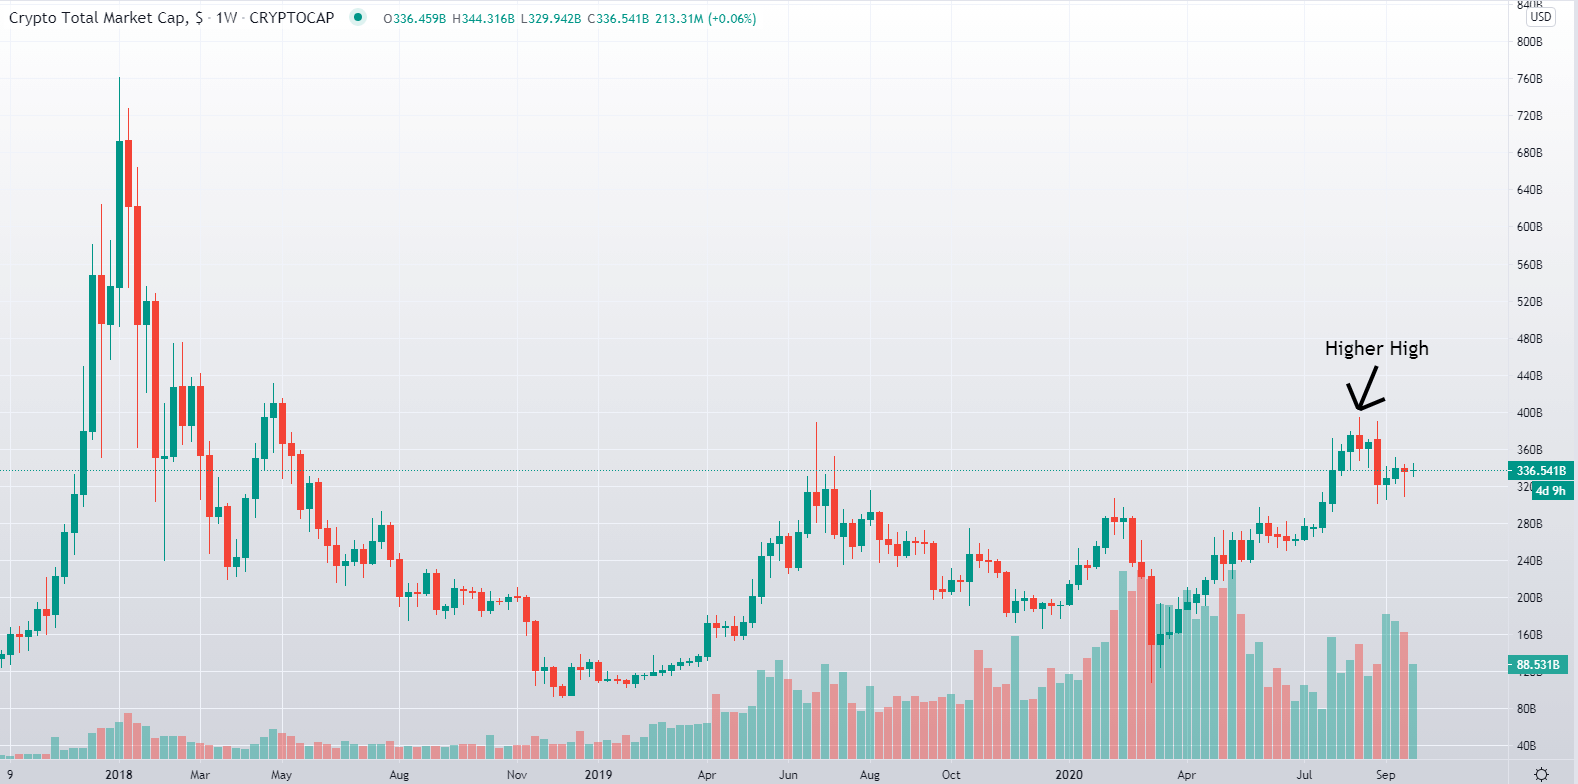
  3. Successive continuation signals of the prevailing trend, after consolidation or rejection.
  4. A new entry every time the stop is moved to break-even for risk-free rides.
  5. It can be combined with profit targets to create a series of pyramiding entries: For instance, on the buy-side: 1.-Buy, 2.- Sell at resistance, 3.- buy 2,3,4… units at the pullback. Conversely, so on the sell-side, Sell, buy on support and sell appropriate 2,3,4… units at pullups.

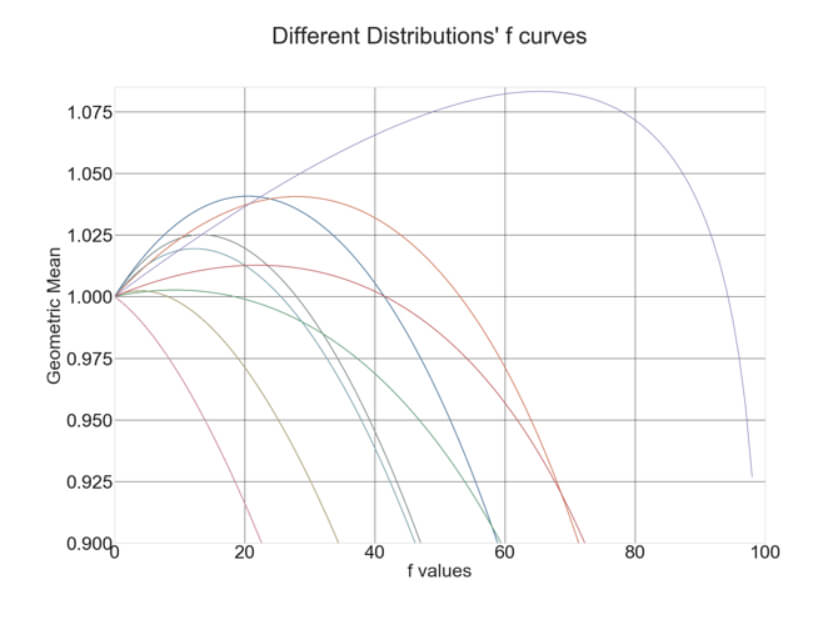
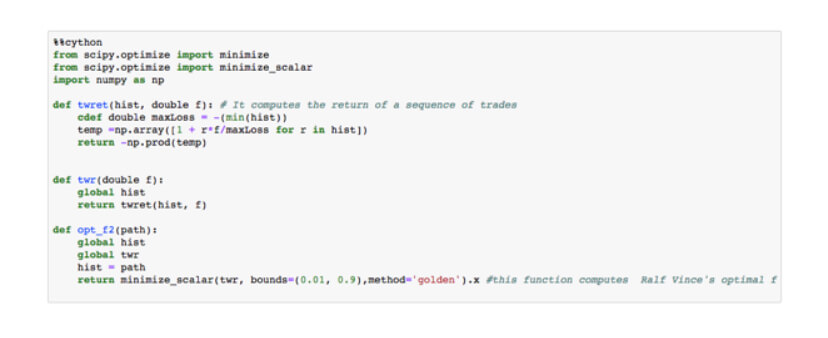
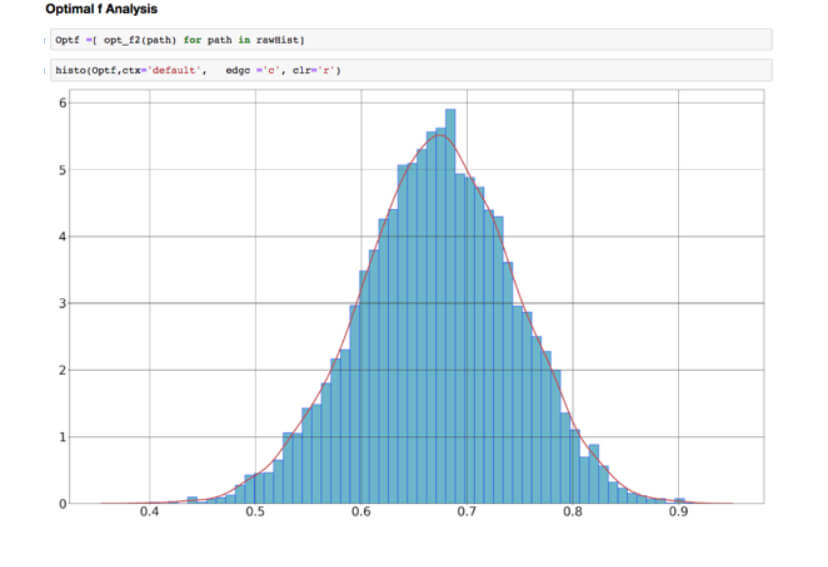
Also worth mentioning is, traders should limit the total number of scale-ins within the desired risk limits, and never above the optimal f of the strategy.

Pyramiding works best on trending markets. But, it can be applied to any large movement to lower initial risk, and only add more positions if the trade continues moving in the desired direction.

Categories
Forex Videos

Position Sizing IX: Improving the Percent Risk Model-Playing with market’s money


Position Sizing IX: Improving the Percent Risk Model-Playing with market’s money


One way to improve the returns of a position sizing strategy without increasing our capital risk is to play with the market’s money. In this video, we are going to develop this idea as a way to improve the percent-risk model.

The market’s money

We define as “market’s money” the gains resulting from the profits of previous trade or winning streak. This is a mentality shift. Instead of viewing recent profits as your own money, you momentarily consider them as a gift of the market to increase the trading size riskless. This has a slight resemblance to moving your stops to break even and let the trade go on. After that action, the rest of the trade evolution is riskless. The concept of the market’s money is especially attractive when the trading strategy has a high percentage of winners because high probability strategies show a higher likelihood of winning streak versus losing streaks.
There are several ways to use this concept, but in this video, we will focus our attention on its use with the Percent-risk model. Precisely, we will use the money gained in the previous successful trades to increase the size of the next trade without increasing the risk of our base money.

The N-Step up position Sizing Strategy

The N-Step-up method uses the N previous successful trades’ gains to increase the size of the next trade. After N trades, the profit is added to the general wallet, to start a new cycle. If there is a loss, the cycle resets and begins again.

The flowchart of this methodology is shown below.
The key idea is that, even when it ends at a loss in the N step, the risk incurred is the only the risk made in the starting position, But if the N-cycle ends as a win, on a 1R reward/risk situation, it will end up with R+2R+3R+… NR gains. On a 2R reward/risk strategy, it will be 2R+6R+ 14R +…
We will try this methodology using the Live Signals Service performance and 1% basic risk to see how the N-Step Up improves it.

Original 1% Strategy

The graph below shows the equity curve growth using a 1% risk over one year of trading, assuming 2 daily trades on average.

When we use Monte Carlo resampling to get 10,000 different 1-year histories, we get the following information.

Average ending Capital: 75,359.86
Max ending Capital : 219,145.26
Min ending Capital: 26,811.62

Probability of Capital ending above 78,604: 43.98 %
Probability of Capital ending above 26,812: 99.99 %
Probability of Capital ending above 10,000: 100.00 %

In the figure below, we can see the likelihood of max drawdown for the 1% Risk model:

Average Max Drawdown: 8.02 %
Maximum Max Drawdown: 27.46 %
Min Max Drawdown: 3.67 %

Probability of a 10% drawdown: 15.44%
Probability of a 20& drawdown: 0.03%
Probability of a 30% drawdown: 0.00%

We can see that the expected max drawdown is 8.38%, with a one in five years ending at 10% and almost no chance to reach 20 percent. Let’s see how this can be improved with one, two, and three N-Step cycles.

The below chart shows the original, plus 1-, 2- and 3-step up position sizing strategies, using semi-log scales to make them fit together in a single chart.

We can see that the advantage of using the methodology is evident, as the 3-Step-up sizing strategy reaches an ending capital of up to one order of magnitude higher (10X), as compared to the basic 1% Risk method.

Let’s see how they perform regarding returns and drawdowns:

1-Step Up Return Stats:

Average ending Capital: 236,427.55
Max ending Capital : 1,306,952.10
Min ending Capital: 34,015.66


1-Step Up Drawdown figures:

Average Max Drawdown: 13.29 %
Maximum Max Drawdown: 33.94 %
Min Max Drawdown: 5.64 %

Probability of a 10% drawdown: 86.21%
Probability of a 20& drawdown: 4.15%
Probability of a 30% drawdown: 0.00%


2-Step Up Return Stats:

Average ending Capital: 625,846.08
Max ending Capital : 8,601,130.02
Min ending Capital: 53,941.54


2-Step Up Drawdown figures:

Average Max Drawdown: 18.02 %
Maximum Max Drawdown: 43.04 %
Min Max Drawdown: 8.31 %

Probability of a 10% drawdown: 99.59%
Probability of a 20& drawdown: 28.29%
Probability of a 30% drawdown: 0.03%


3-Step Up Return Stats:

Average ending Capital : 1,597,715.25
Max ending Capital : 34,224,341.81
Min ending Capital: 53,439.67


3-Step Up Drawdown figures:

Average Max Drawdown: 22.52 %
Maximum Max Drawdown: 58.01 %
Min Max Drawdown: 9.79 %

Probability of a 10% drawdown: 99.99%
Probability of a 20& drawdown: 64.23%
Probability of a 30% drawdown: 0.63%

A variation of this strategy could be made by re-investing only 50% of the profits. This method will significantly lower the returns, although it will also smooth the equity curve. As an example, let’s see the reward and risk figures of a 3-Step Up with 50% reinvestment:

Average ending Capital: 199,952.02
Max ending Capital : 1,181,977.34
Min ending Capital: 34,950.58

Drawdown:

Average Max Drawdown: 12.10 %
Maximum Max Drawdown: 31.89 %
Min Max Drawdown: 5.37 %

Probability of a 10% drawdown: 74.30%
Probability of a 20& drawdown: 1.94%
Probability of a 30% drawdown: 0.00%

We can see that this method is quite similar in performance and drawdown to the 1-Step Up with 100% re-investment, but is not worthwhile, since it reduces the returns to half, while drawdown is only lowered from 13.29% to 12.1%.

Conclusions

We can see that even 1-Step up improves substantially the performance of a strategy (about 4X) with only an increase in the drawdown from 8.% to 13.3%.
We can see also that the best choice for this strategy is 2-Step Up, with a balanced mix returns (average ending equity of $625,846 over an average Max Drawdown of 18%); this is a 10X improvement from the basic 1% sizing strategy with only about 2.2X of drawdown. But, aggressive traders may choose the 3-Step Up strategy, which doubles the 2-Step Up model’s returns with an increase in drawdown from 18% to just 22.5% ( a 25% increment).

Categories
Crypto Videos

CRYPTO! A Closer Look At Tether’s $1 Billion Bitfinex To Binance Swap!

A closer look at Tether’s $1 billion Bitfinex-to-Binance swap

A Tether swap worth $1 billion and involved Bitfinex, Binance, and Tron blockchain happened on Aug 20.
Tether stablecoin burned some of its supply on one blockchain only to mint it anew on another one. While this may sound easy enough, in reality, this operation involves quite a bit of planning as well as, more importantly, trust.

How was this performed?

During the six-transaction swap that occurred between two blockchains and took 1 hour and 1 minute to bring to completion, the Tether and Bitfinex side was never at risk. This was due to Binance being the initiating party. On the two occasions – right after the first transaction and then after the fourth one, Binance, as the initiator, was down $400 and $600 million, respectively. This type of risky operation either shows great trust among the involved parties, or perhaps the possibility of some additional mechanisms that were involved and that the public was are not aware of.

Another necessary condition for this swap was the fact that Binance had to have a surplus of $1 billion TRON-based USDT, which it was willing to trade for the equivalent amount of Ethereum-based USDT. Even though Binance has met this criterion, it is unclear whether the funds used belonged to the exchange or consisted of user deposits.

Tether, Binance, and controversy

Tether has been at the forefront of controversies in the cryptocurrency space, as the crypto community knows well by now. On top of that, Binance has been accused of making shady deals with many projects. While this particular example is most likely nothing to worry about, the crypto space has to be aware of centralized institutions traversing the crypto sector.

Categories
Crypto Videos

What Is Uniswap? In Depth Analysis part 1!


What Is Uniswap: In-Depth Analysis (part 1/4)

Centralized exchanges have been the foundation of the crypto market for years. They offer extremely fast settlement times, high trading volume, as well as continually improving liquidity. However, it is clear that they defeat cryptocurrencies’ purpose, as they are centralized and hold your keys. Over time, developers have come up with a solution in terms of decentralized exchanges. These exchanges require no custodians or middlemen to facilitate trading.

Due to blockchain technology’s current limitations, building DEXes that can actually compete with their centralized counterparts is extremely difficult. One of the pioneers in the decentralized exchange sector is Uniswap. As a result of the innovation they brought to the sector, Uniswap has become one of the most successful DEX projects.

Uniswap – Explained

Uniswap is a decentralized exchange built on the Ethereum blockchain. To be even more precise, Uniswap is an automated liquidity protocol. What’s important to know is that no order book or centralized party is required to make trades. Uniswap allows its users to trade without intermediaries and provides a high degree of decentralization as well as censorship-resistance. It is also open-source, which is one of the pillars of the decentralized finance space.
Uniswap users can seamlessly swap between many ERC-20 tokens without any need for an order book.
Unlike centralized exchanges, Uniswap protocol doesn’t list certain tokens on the exchange, while denying it for others. Any ERC-20 token can be listed on it as long as there is a liquidity pool available. As a result, Uniswap doesn’t charge listing fees.

So how does it all work?

Uniswap completely leaves behind the traditional architecture of digital exchanges in that it has no order book. Instead, it implemented a Constant Product Market Maker design, an iteration of an Automated Market Maker model.

An automated market maker is a smart contract that holds liquidity reserves that traders can trade against. They are being funded by liquidity providers. Liquidity providers are users who deposit an equivalent value of two tokens in the pool. When trading, traders pay a fee to the pool distributed to liquidity providers, all according to their share of the pool.
If you want to learn more about Uniswap and its token, how it all works, and how the platform makes money, check out the next part of our guide.

Categories
Forex Videos

Donald Trump v Covid 19 – Forex Trading Tips!


Donald Trump v Covid-19, the fight is on, but how will the markets fare?

All the world’s a stage, wrote William Shakespeare in his comedy; As you like it. And one thing is true. The Donald Trump presidency has been theatre, the like of which we have never seen in politics in the western world. Let’s go back to December 2019; the US economy was buoyant with record employment, record stock market highs, and the US was a few weeks short of signing a massive phase one trade deal with China. Donald Trump was on the cusp of going down as the greatest American President ever, in terms of steering the US to economic glory.
Step forward a few months, and the global Covid-19 pandemic has all but reversed the economic fortunes for the US with massive unemployment, an economy in freefall, instability, and with the presidential elections just a month away, at the time of writing. Donald Trump and his management of the Covid crisis in the US now looks likely to leave a legacy of being one of the worst US presidents ever.


Love him or loathe him, President Trump has been a major critic of the Chinese government, who he blames for what he calls the China virus. He has spewed out vitriol against them in many statements, and this has led to threats of tariffs, sanctions, bans on Chinese companies operating in the US such as tik-tok, WeChat, Huawei for so-called security reasons, and now that he has had a taste of the virus himself, one can only imagine how things might be escalated from here, when and if he recovers.
Many would argue that Donald Trump testing positive for Covid is poetic justice for a man who consistently played down the seriousness of the disease, while criticising people such as his presidential opponent, Joe Biden, for wearing a mask, when he himself often refused to do so. In fact, it was likely that a recent event in the White House Rose Garden, regarding the nominee for the vacant supreme court judge, was very likely a super spreading Covid event, where many members of the Republican team are dropping like flies, as one by one, as they test positive for Covid.
People will say that Donald Trump had it coming, and it was only a matter of time and wonder how on earth the most secure building on earth, the White House, with all of its technology, and private hospital wing, could allow the President and so many of his aides and colleagues to become infected. This was probably down to sheer bloody mindedness by Donald Trump, who just didn’t take the disease seriously enough.


And getting back to the important presidential election on the 3rd of November, everything is now up in the air, with a quarantine of 10 days and a period of convalescence required, should President Trump shake off the disease, bearing in mind he is 74 and overweight and has a gruelling schedule that many much younger men would not be able to cope, with is it likely that he will be fit enough, should he recover, continue with the election campaign?


The financial markets will see great uncertainty regarding the prospect of President Trump returning for a second term to the White House. There are constitutional issues with regard to voting, which is already going on, with many ballot papers already having been returned, and if Donald Trump is not able to stand, questions remain about how that might affect votes for the second in command, Mike Pence. And with Joe Biden leading in the polls, institutional investors will be worried about extra regulations and higher taxes, should he win the presidential election. And with all this uncertainty, we can expect a great amount of volatility in the markets where institutions will be recalibrating their portfolios and where a risk-off event will take place, with stock markets edging lower, if not falling, and a great deal of volatility in the currency space, which might see a dollar resurgence. Because this event is unprecedented, it is really hard to call. But one thing is for sure; we will see extra volatility.

Categories
Crypto Videos

John McAfee Arrested For Tax Evasion! Promoting S**t Coins!


John McAfee Arrested For Tax Evasion

The US Securities and Exchange Commission has filed suit against the creator of McAfee antivirus and a long-term player in the crypto field, John McAfee. McAfee was charged with allegedly promoting initial coin offerings without ever disclosing that the ICO issuers were paying him. As this is a direct violation of the US securities law, the SEC has filed suit against this eccentric investor on Monday.

When taking a look at what the suit claims, McAfee allegedly leveraged his fame to make over $23.1 million in undisclosed compensation from November 2017 to February 2018. He earned the aforementioned amount by recommending at least seven “initial coin offerings” to his Twitter followers, claiming he was the Chief Technical Officer or Technical Advisor of the projects, or that he at least performed a thorough inspection of how well-built these projects actually were.
The SEC mentions seven unidentified ICOs and their issuers who privately communicated with McAfee’s crypto team to get him to publicly endorse their ICO projects in exchange for payment. The payments were denominated both in the native ICO coins as well as Bitcoin.

This is highly illegal and has previously provoked the authorities to go after celebrities that acted as ICO promoters, such as DJ Khaled and Floyd Mayweather, who both promoted ICOs without ever disclosing their financial interests.
In this case, the SEC’s complaint refers to a time period where McAfee was predicting not only the price of Bitcoin but also which ICO will “pump,” which turned out to be a self-fulfilling prophecy simply due to the following he had.

While the market soon discovered what’s behind McAfee’s ICO promotion scheme, the outlandish Bitcoin prediction stayed. He ultimately walked back on the prediction that Bitcoin will reach $1 million by the end of 2020, claiming he had only been trying to draw the public’s attention to BTC.


Authorities have been quick on their feet for this one, as the Justice Department reported that John McAfee has been arrested in Spain for the tax evasion charges and is awaiting extradition to the US. His arrest came only a day after the suit was filed.

Categories
Crypto Videos

When Will Bitcoin Push Towards $20,000


When Will Bitcoin Push Towards $20,000?

Bitcoin remaining relatively stable above $10,000 despite a major cryptocurrency exchange getting hacked is certainly a positive sign for the market’s maturity. While major volatility was expected several times throughout the past couple of weeks, this didn’t really happen, even with all the macro-economic uncertainty surrounding the sector.
The question remains, is boring price action becoming a new reality for Bitcoin?

Bitcoin is range-bound on the daily chart

Sometimes, charting can be quite simple and straightforward, and this is one of those cases. Bitcoin’s price fell below $11,090 resistance at the start of the month, establishing new support at $10,000-$10,360. The $11,090-11,300 zone that has been lost is now confirmed resistance.
When taking a look at the downside, a potential drop towards the $9,300-$9,600 zone wouldn’t be completely unexpected as the level around the $9,600 mark is still untested with the lingering CME futures gap.

Crypto sector market capitalization looking for support

The 1-week chart of the crypto sector market capitalization is showing a clear pattern by posting a higher high in the previous months, marking the potential start of a brand new uptrend.

After a higher high, the market needs to set a new higher low in which a range-bound structure can be defined. While the new possible higher low might be the $300 billion mark, it is also possible for the sector to pull back to the previous resistance zone, which is between $250-275 billion.
However, the price has possibly found resistance at the $320 billion mark, which is where it hit the 100-day moving average. While this bounce is extremely bullish and unexpectedly high, the move is not over yet, and the crypto sector market cap might end up going lower.

If the given area holds, it also shows how the beginning of a new cycle can be relatively dull. With each new start of a fresh market cycle, levels are flipped as support and resistance, after which we can see months of range-bound trading periods. We can use the price movement of Bitcoin in 2016 as an example, as that year was also a halving year.

During these periods, Bitcoin’s price stabilized in an accumulation range all throughout 2015. After the accumulation range has ended, Bitcoin’s price broke out and pushed towards the next zone of resistance.
This rally ended up with a sideways range that lasted for six months. A new breakout occurred, followed by another sideways range that lasted for six months. The current market sentiment, as well as price movement, is comparable with that period. The real excitement will come only when the total market capitalization of the sector, as well as Bitcoin itself, break into price discovery, as new potential parabolic runs can come back into play at that point.

A Bull case for Bitcoin

It should be noted that the scenarios shown here are based on lower time-frames (specifically the 4-hour time-frame) and, therefore, should be considered a short-term outlook.
As Bitcoin’s price is currently stuck in a range and is currently facing strong resistance, it’s more likely to anticipate a pullback to the $10,360 area, which is the vital area to hold for any form of bullish continuation.
If Bitcoin’s price holds at least that level and creates a higher low, we can expect a strong push towards the upside. If the price decides to just shoot up, the crucial breaker would be the $10,850 area. If Bitcoin breaks that area with confidence, we may see a rally towards the $11,090 or even 11,300 area.
While it would be unexpected to see a massive breakout that would surpass the aforementioned area, that would warrant an even stronger case for the Bitcoin bulls, and even possible highs of above-$20,000.

A Bear case for Bitcoin

The same levels surround the bearish scenario as well. A failure to break the $10,800 zone with confidence would present a potential test of the $10,360 area.
As we discussed in the bullish case for Bitcoin, a potential higher low can fuel the bulls and rally, even more buying power. However, if Bitcoin falls below the $10,360, further downward momentum should be expected, even including the still-open CME gap. However, very few people are expecting Bitcoin to fall below $9,000 any time soon, if ever.

WASHINGTON, DC – SEP. 27: U.S. President Donald Trump reacts to a journalist question during a news conference in the Briefing Room of the White House. Trump is planning for the first presidential debate with Democratic Nominee and former Vice President Joe Biden on Sep. 29 in Cleveland, Ohio. Joshua Roberts/Getty Images/AFP

Bears are mostly making their case based on the economic and political events, such as the U.S. presidential elections, U.S. President Donald Trump announcing that he is ill from COVID-19, as well as events in the crypto space such as the BitMEX platform fallout due to the U.S. government charges against it.

Who is in the right?

While we have no way of finding out who is currently in the right and where Bitcoin will head in the short-term, we can look at its day-to-day price movement as well as fundamentals and sentiment to get a clearer view.
Bitcoin is on track for its best Q3 ever, as Skew’s data shows. According to this on-chain analytics resource, Bitcoin’s Q3 closing price will be stronger than any Q3 before.

BTC/USD traded at somewhere in the $10,700 range on Sep. 30. That number very comfortably beats any other Q3 close on record, with the next highest one being 2019’s close of $8,310. On top of that, Bitcoin has sealed the second-best quarterly close in general, as it beat Q2 of 2019, which had a closing price of $10,590.
On top of that, network fundamentals also speak to Bitcoin’s overall strength, with the network difficulty itself at all-time highs and set for another push towards the upside. Hash rate, a measure of the estimated computing power that is being directed to mining, is also trending back towards its all-time-high levels.

Conclusion

While there are many discussions on whether Bitcoin will retrace to sub-$9,600 levels or push past $11,000, one thing is certain: Bitcoin’s dull price movement will not remain like this for good. Whether its short-term movement will be tilted towards the upside or downside is irrelevant, Bitcoin is here to stay, and good times remain ahead.

Categories
Forex Videos

Nancy Pelosi for President?

Nancy Pelosi for President?

Thank you for joining this Forex academy educational video.

In a shock announcement, President Trump has been tested positive for the Coronavirus, and in a shock, has been moved to a military hospital for further treatment, including….

Receiving the drug Remdesivir in order to try and reduce the viral load and in the hope that it will reduce the length of his illness. The drug has received mixed results in patients, with some having seen no effect at all and others statistically seeming to spend less time in hospital.

Donald Trump was taken to hospital as a precaution, looking pale and tired, while tweeting ‘’it is going well, I think’’, but he 74, and is overweight, and it is well known within his circles that he enjoys a poor diet of hot dogs and burgers and takes little exercise, in which case the odds are stacked against him.
The dynamics of the election has completely changed in just 24 hours, Joe Biden wished the president well and has pulled negative adverts, and the timing of President trump’s illness could not be worse, bearing in mind we are just a few weeks away from the date of the election and that a dozen states have already sent out postal votes to the electorate and many of these will have been returned with votes cast.

But interestingly, the timetable, which is already incredibly stressed, cannot be moved because the day of the election is set in stone by the US Constitution and falls on the 3Rd of November this year. For it to change, both houses, the republicans, and democrats would need to agree to postpone the date of the election, and with the Democrats holding the majority of power in the house, this is very unlikely to happen.

But in a twist, if the votes are not counted, buy a hard deadline in December, and the winning President not be announced, the House of Representatives would need to vote on this and make a decision who would be the next President of the United States. If they were unable to make a decision, in accordance with the Constitution of the United States, the speaker of the House, Nancy Pelosi, will automatically become President.

The financial markets, as will the rest of the world, be glued to their television screens over the next few days watching this situation unfold. Never before in the history of politics has there been quite such a dramatic theatre, the likes of which would make the most incredible novel or enthralling movie. But in reality, people’s lives and livelihoods are all heavily dependent on how President Trump progresses through this terrible illness. Certainly, all of us here at Forex Academy wish him a speedy recovery.

With regards to financial trading at this most uncertain times, one thing is for certain, we will see extreme volatility, and should the President’s health deteriorate, we might see sell-offs in the stock markets within the United States, which could lead to further sell-offs abroad, this might lead to a strengthening in the United States dollar.

And in another twist, should President Trump become critically ill and then recover the unquestionable dislike that he has for the Chinese, and what he calls the China virus, maybe heightened even further, causing an even greater fallout out between the two Nations.

Categories
Crypto Videos

What Are The Key Components of DeFi?


Key Components of DeFi

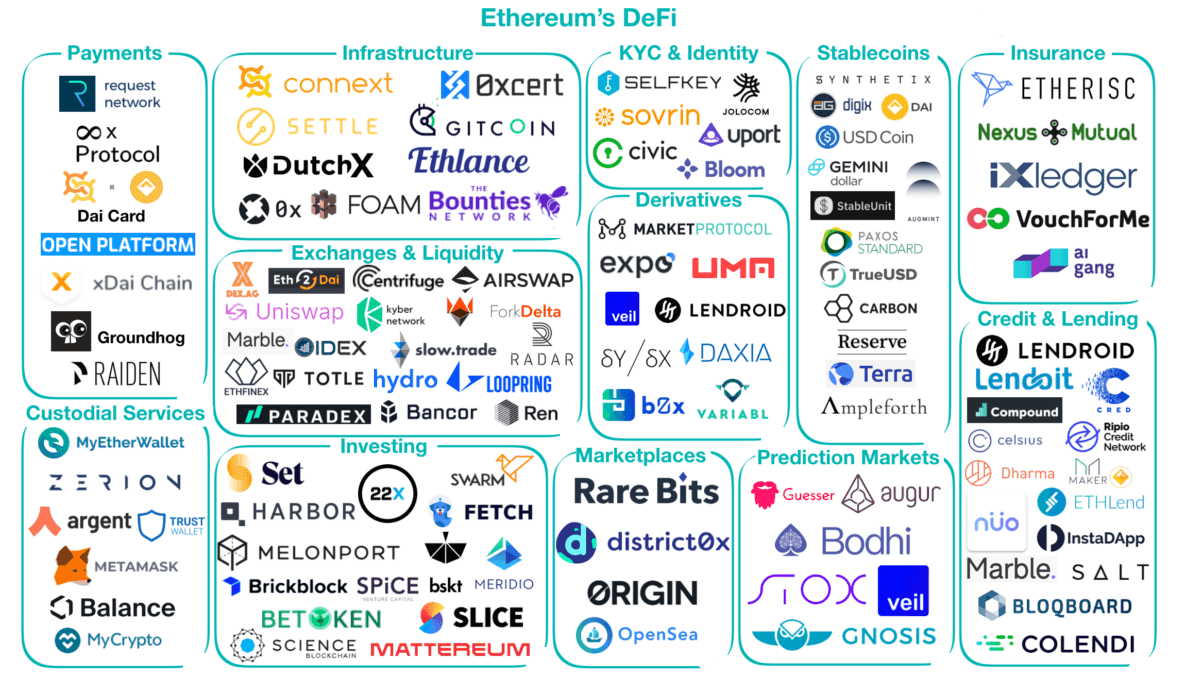
The crypto and DeFi sectors are growing exponentially, and there are currently more DeFi apps than ever. These projects are already saving businesses and customers both time and money. In fact, DeFi platforms started to emerge across nearly every branch of the financial sector. As the DeFi sector expands, it is important to understand what characteristics all DeFi applications have in common, and what they offer.

Open-Source

DeFi applications have to be open-source, or they are not truly decentralized. Open source coding means that the project’s code is made public. By being open-source, these apps can be audited it and its functionalities, security, and capabilities validated. Open-source codes are more stable and secure than fully-private codes simply because of community interaction. Additionally, being open-source provides more confidence in the platform as users can rest assured that no malicious coding is hidden in the background.

Transparent

DeFi projects provide the world with new levels of transparency. As most DeFi apps operate on public blockchains such as Ethereum, all transactions are fully available on the public ledger. As a matter of fact, all activity on the blockchain is completely public. The main difference in this approach vs. a traditional bank account is that the accounts are not bound to anyone directly. Instead, user accounts are pseudo-anonymous and list only a numerical address rather than show identity.

Global

While this characteristic is not only bound to Dapps, it is an extremely important one. Anyone can participate in DeFi platforms from anywhere across the globe. All you need is a smartphone with internet access.
Consequently, DeFi Dapps have the ability to solve the problem of certain areas being unbanked or underbanked, as they can bring them the financial services they are looking for. This openness is a major upgrade from the current banking system, which leaves around 40% of the population without any form of banking.

Permissionless

The DeFi sector operates without gatekeepers. As such, anyone can create a DeFi application and offer it to the world. On top of that, anyone can participate in DeFi apps without any concern for approval. This strategy is a massive change from the current financial system that requires every single potential user to be a part of many regulatory verification systems before even participating in the global economy.

Interoperable

Another trait of the DeFi space is interoperability. Interoperability is critical as it ensures that, as more developers enter the space, all the previous work is not suddenly lost. Instead, users can stack their own DeFi products to expand exposure. As an example, it’s common for a single user to utilize stablecoins, decentralized exchanges, as well as wallets. This strategy is only possible due to the seamless integration that DeFi applications possess.

Flexibility

Due to the open nature that DeFi provides, developers are able to exercise way more flexibility in their platforms than they ever could. Users gain considerable options by integrating third-party application integrations as well. If the current options are insufficient, users can even choose to build their own interfaces.
Check out the next video in our DeFi series, where we will show examples on how DeFi is used.

Categories
Forex Videos

FOREX – Fundamental Analysis for Novices – US JOLTS Job Openings!


Fundamental Analysis for Novices: US JOLTS Job Openings


Thank you for joining the fundamental analysis for novices’ educational video. In this session will be looking at United States JOLTS job openings. Jolts defines job openings as all the positions that are opened on the last business day of the month. The criterium is that a specific position exists and that there is work available for that position.


If it’s the first time that you have seen one of our fundamental analysis videos for novices, we strongly recommend that you use an economic calendar every day if you are not already doing so. An economic calendar should act as your Bible in order to trade around it while avoiding high impact news data releases which may have a negative impact on your trades.


The key components of any economic calendar are the time of the release, the day and date, the type of event, and the impact that any such data release will likely have on the market, which is typically low, medium, and high. And where we can see an impact bar here displaying various levels of impact from low, which is in light orange, to medium shown in a darker orange and taking up a third of the box, to the full red impact box, which means that any data release is likely to cause extra volatility on its release.
Most economic calendars will also show you the previous period’s data release, which might be weekly monthly, quarterly, or annually, and also a general consensus of where market analysts believe the data statistics will be upon its release. And then we have the actual release data, which will be populated upon the release of the data. Most brokers will provide this information almost instantaneously to help your trading decision making.


Here we can see an example of the US JOLTS job openings for June 2020, which was released on Monday the 10th of August and came out at 3 p.m. BST and we can see the various data details including May’s release, the forecast or consensus, and the actual number of 5.89 million, which was higher than the consensus and higher than the previous for May.
Although the impact bar for this particular news release was set at low, because of the implications of the virus fallout, especially within the United States, which has suffered a huge economic collapse and massive unemployment, the market will be looking for any signs that jobs are rebounding, and this is a positive sign that job openings are appearing on the market.
This means that United States companies are confidence that they are recovering from the pandemic and that they are growing to a certain extent and need extra labour manpower to fill those vacancies which have been created within those organisations.

Typically, any increase in job openings is good for the United States economy, and therefore you might expect that United States stock indices to increase and where this is also good for the US dollar. However, when we see that job openings are lower, this would be bad for the United States economy and also bad for the US stock markets and the United States dollar.

Therefore, in these unprecedented times, we should not take for granted even US data releases, or from any economy, such low-impact status data, which at any normal time in history be met by a neutered response from the marketplace. Sometimes even low impact releases can cause extra volatility, and you should bear that in mind, especially until such time as the pandemic as gone away and things returned to some kind of normality.

Categories
Crypto Videos

What Is DeFi Used For?


What is DeFi used for?

The Decentralised finance sector has been flourishing in the past few months, with more and more interest coming both from the side of retail and institutional investors. However, the current system isn’t exactly clear on what DeFi actually brings to the table. This video will hopefully bring a bit more clarity on how DeFi works.

DeFi in Lending

One of the sectors affected the most by the introduction of DeFi is certainly the lending sector. If you have ever applied for any type of loan, you surely know the process is both intense time-consuming. Worst of all, you are forced to use lending companies specifically designed to maximize their returns. On the other hand, the DeFi community produced some interesting ways to improve this sector.

Compound

A good example of a DeFi lending platform is Compound. The Compound platform showcases the true power of DeFi and its ability to transform how the world envisions the financial market in the future. Compound allows users to lend their cryptocurrencies out to other users. In exchange for providing the loan, these users receive interest in the form of cryptocurrency. The platform utilizes smart contracts that match lenders and borrowers. Additionally, these smart contracts make interest adjustments based on the market’s current state automatically.

Decentralized Exchanges

Many consider decentralized exchanges (DEX’s for short) as the logical next step in the evolution of the crypto exchange sector. DEX’s are peer-to-peer trading platforms that provide users with a more streamlined UX, tighter security, as well as more flexibility. Traditional exchanges operate via a centralized organization that monitors, facilitates, and approves all trades within the platform, which defeats the purpose of cryptocurrencies. On top of that, users of centralized exchanges are vulnerable to attacks and hacks, as history has shown us. There were numerous occurrences of exchange hacks in which the central organization, as well as its users, suffered huge losses.
DEX’s eliminate many of these concerns. The platform doesn’t include the assets directly, but rather via a smart contract. This way, there is no “weak spot” that a hacker could exploit.

Uniswap

We will use the Uniswap platform as our example of a decentralized exchange. It introduced an innovative mechanism now known as Automated Market Making. This new protocol enables near-instant settlement between different parties. The protocol will try to close trades as close as possible to the current market value.

DeFi Prediction Platforms

Another interesting development in the DeFi sector is the creation of prediction platforms. These platforms are used to analyze the current public opinion regarding a certain event.
Guesser
One good example of this type of decentralized application is Guesser, as it allows you to make various predictions and examine other people’s results in the pool. You even earn crypto for participation by being right with your prediction.

DeFi is Here to Stay

As the main systems of our society are currently undergoing a transformation towards decentralization, the demand for DeFi applications will rise. These new applications continue to disrupt the financial space in remarkable ways.
Decentralized applications are certainly something that is able to set the new standard for the worldwide economy moving forward.

Categories
Forex Videos

FOREX – Swiss go to the polls to vote on limiting EU immigration! CHF Prediction!

Swiss go to the polls to vote on limiting EU immigration: – where next for the Franc?

Thank you for joining the forex academy educational video. In this session, we will be looking at the Swiss who go to the polls to decide on limiting EU immigration and what this might do for the Swiss Franc.

Switzerland is a beautiful country with magnificent scenery and a high standard of living. It has become extremely attractive for people from the EU to visit via the open borders policy, and subsequently move and set up home in the country.

The Swiss national bank or SNB sets monetary policy within the country of Switzerland. The Swiss Franc, which is commonly referred to as swissie, or CHF, it is the fifth most traded currency in terms of global FX liquidity behind the United States dollar. It is considered to be a major currency. It is considered to be a safe haven currency because of the country’s economic stability, low-interest rates – making it attractive to borrow in, and making the currency attractive as a hedging mechanism. The SNB prefers a weaker currency to make exporting more attractive. 65% of its export market is with the EU.


This chart shows the US dollar CHF pair going back to July, the area marked position A shows a high of 0.9465, followed by a bear trend which takes us down to a low of 0.9000, which is a major psychological area of support for the pair, and then a subsequence bull run to its current level of 0.9286.

On Sunday, the 27th of September, Swiss voters go to the polls to vote on limiting immigration from the EU, which has seen a sharp increase in the last ten years of 30%. The vote, known as Ecopop, could see immigration from the EU capped at just 0.2% of the overall population, thus restricting migrants to around 16,000 per year and effectively closing its borders to the EU. It also calls for 10% of its overseas aid to be spent on family planning projects in developing countries.


This is where things get complicated because the Swiss has certain rights and trading privileges, including a free trade deal, and is based on the Swiss open borders’ agreement it signed up to as a part of its preferential trading pact with the EU. 25% of its workforce comes from within the EU. The counter-argument is that if you lose them, you lose the high-quality life that everyone in Switzerland enjoys.
A breach of this mechanism would throw the agreement into the long grass and potentially cause economic uncertainties with the trading partners with which could cause the levies being introduced by the European Union, which in turn would have a negative impact on the Swiss economy. While this may be somewhat negated by a weakening of the Franc, it will likely cause volatility in the markets, especially for the USDCHF and other CHF pairs. More worryingly, it could also cause volatility in the Euro, because this will look similar to the Brexit situation, to a degree, whereby major countries within the block and those exterior trading partners are losing faith in the closely tied and constrictive trading arrangements.

Categories
Crypto Videos

The Craze Behind DeFi – Explained!


The Craze Behind DeFi – Explained

There are many reasons that the DeFi sector has been experiencing a surge of interest lately.
First off, we need to mention that the regulators have been behind the curve in terms of DeFi, which has been able to flourish in this vacuum. As an example, in traditional unsecured lending, a legal requirement that lenders and borrowers know one another’s identities exists. On top of that, the lender always assesses the borrower’s ability to repay their debt. In DeFi, on the other hand, there are no such requirements. Instead, every part of the process is about mutual trust and preserving privacy.

Regulators always have to weigh the delicate balance between deterring innovation and failing to protect society from risks. In July, the US SEC made a major shift towards embracing decentralized finance by approving an Ethereum-based fund called Arca.
This is welcome and extremely important since one of the major challenges with financial innovation is the hostile environment that is created by archaic regulations. This had caused many cryptos and DeFi projects to fail, including major ones such as Basis, which returned $133 million to investors back in 2018 when it concluded that it couldn’t work within the SEC rules.


The second reason for the DeFi craze is that mainstream players are not-so-slowly and surely getting involved. Many financial institutions are beginning to accept DeFi, as well as seeking ways to participate. Seventy-five of the world’s biggest banks are now trialing blockchain technology to speed up their payment system as part of the Interbank Information Network, led by JP Morgan, Royal Bank of Canada, and ANZ. Even though most of these banks are testing centralized versions of blockchain, this is one step closer to DeFi than the current system.
Major asset management funds are starting to get interested in DeFi seriously as well, with the most prominent one being Grayscale, the world’s largest crypto investment fund.

The third reason for the craze is the effect of COVID-19. The pandemic has evidently driven global interest rates even lower, with some jurisdictions, such as the eurozone, now offering negative interest rates.
DeFi potentially offers much higher returns on investment to savers than high-street institutions. As an example, Compound has been offering an annualized interest rate of 6.75% for people that save with stablecoin Tether. Not only do you get the interest, but you also receive Comp tokens, which adds to the attraction of this offer. With as much as two-thirds of people without bank accounts having a smartphone, DeFi also has the potential to offer its services to the so-called unbanked.

One final reason for the surge in people putting money into DeFi projects is FOMO – fear of missing out. Many tokens are worth nothing or very close to nothing in terms of their utility, so we see a lot of irrational investment and pure speculation. But, people see certain tokens rise in value exponentially and want to turn their life around as well.
Like it or not, we are certainly heading towards a new financial system that will be more liberalized and decentralized than before, and DeFi will be at the forefront of these changes.

Categories
Crypto Videos

What Is DeFi – Beginners Edition!


What Is DeFi –Beginners Edition

One area in cryptocurrencies that have recently attracted huge attention is certainly DeFi or decentralized finance. DeFi refers to financial services using smart contracts, automated enforceable agreements that work without intermediaries like banks or lawyers. Instead, they use online blockchain technology.
Between September 2017 and now, the total value locked up in DeFi contracts managed to go from $2.1 million to over $7 billion. The hype it has gotten in the past couple of months has risen over $3 billion.

This has, in turn, driven a massive rise in the valuation of all the tradable tokens that are using DeFi smart contracts. The total market cap of DeFi projects now exceeds $15 billion, almost doubling the value it had in July. Numerous tokens have exploded in value this year. For example, Synthetix Network Token has increased its valuation by more than 20-fold, while Aave did an almost 200-fold increase. So if you had bought $1,000 worth of Aave tokens in August 2019, your position would now be worth nearly $200,000.

So why is DeFi so disruptive, and what does it bring to the table?

DeFi projects are mostly built on the Ethereum blockchain network. They are the next step in the financial technology revolution that began 11 years ago with Bitcoin. One area in which these decentralized applications have taken off is cryptocurrency trading on DEX’s (short for decentralized exchanges) such as Uniswap. These exchanges are entirely peer-to-peer, without any person, company, or other institution behind the platform.
Other DeFi services allow you to:
Borrow and lend cryptocurrencies in order to earn interest using platforms such as Aave or Compound Bet on the outcome of certain events using Augur Create and exchange real-world asset derivatives such as currencies or precious metals on platforms such as Synthetix.
Buy stablecoins, a type of cryptocurrencies that are pegged to the value of a particular currency or commodity.

DeFi is often called “Lego money” because you can stack decentralized applications together to maximize your returns. As an example, you could buy a stablecoin such as DAI and then lend it on the Compound platform to earn interest.
Though many of today’s decentralized applications are niche, future applications could have a massive impact on everyone’s day-to-day life. As an example, you will probably be able to purchase a house or a piece of land through a DeFi platform under a mortgage smart-contract whereby you repay the price over a certain number of years.

The deeds would be tokenized on a blockchain ledger as collateral, and they would shift to the lender automatically in the event of you defaulting on your repayments. Because no lawyers or banks would be required in the process, it could make the whole process of buying and selling houses cheaper, smoother, and easier.

To learn more on how DeFi works, check out our next video where we will talk about the current DeFi craze and how it came to be.


Categories
Crypto Videos

Blockchain Can Shield Banks From Trade Scandals! The Banks Mass Adoption Of Blockchain Is Coming!


Blockchain Can Shield Banks From Trade Finance Scandals

Blockchain word as symbol cryptocurrency in chrome chain.

The pressure created by the ongoing economic crisis, mounting geopolitical tensions, and obsolete trade finance systems is pushing the trade finance industry all across the globe down a rabbit hole. To add fuel to the fire, recent trade finance scandals that involved major players such as Hin Leong, Agritrade, ZenRock, and Hontop Energy netted a combined loss of almost $6 billion. To limit exposure to such threats, major banks such as ABN Amro, Société Générale, and BNP Paribas have all withdrawn completely from the sector, while others stayed in the sector but raised the bar on their funding processes.

Samir Neji, founder, and CEO of Dltledgers, said: “For traders and other businesses that involve moving goods around the world, capital is now much harder to come by. This is bringing the sector that is already in difficulty further down.” By implementing blockchain, Neji pointed out. Traders can negate the paperwork, email exchanges, and phone calls that are now required to secure trade finance.
Distributed ledger technology (DLT for short) has the potential to bring transparency to the process of trade execution by sharing information in real-time, he added.

When all sides immutably record everything from trade participants, goods, documents, contracts, and payments on a single safe platform that provides tracking and authentication, the chances of a trade being fraudulent would plummet, or perhaps disappear altogether. Neji also said: “If banks see their trades carrying less risk, which they do when using DLT, the trader will be in a much better spot to get financing, and in many cases, will even end up paying lower rates.”
Apart from regaining the banks’ trust to fund global trade, blockchain would also allow traders to easily, smoothly, and safely execute their trades during the ongoing pandemic.

Conclusion

Regarding the adoption of blockchain technology by trade finance and supply chain players, Neji stressed that it was important to stop just talking about blockchain to customers and that they should just see the benefits the technology would offer themselves.
According to the exec, just as with using a smartphone, it is not important for people to know all the technicalities of the underlying technology if they want to actually benefit from it. He said that his company, as well as other companies in the sector, are working to incorporate blockchain in trade finance, but that they need to work together more so they could fight the common foes, such as paper documents, outdated processes, as well as fraud.

Categories
Crypto Videos

Binance Is Entering the DeFi Space!


Binance Entering the DeFi Space

Crypto exchange giant Binance has announced that it will be delving deeper into the world of DeFi products with its latest offering, which is an automated market maker named Binance Liquid Swap.

Aimed directly at its competitor Uniswap, as well as at its clones, Binance will launch an AMM liquidity pool that will allow its users to provide liquidity by depositing tokens. Just like Uniswap, which is the world’s most popular decentralized exchange, newly-created Binance Liquid Swap will also enable users to earn interest as well as a cut of the trading fees for the pool.

Binance’s product is the first AMM pool on a centralized exchange, and will, as such, be integrated into the Binance.com exchange. This will allow users of the Binance platform to pool tokens in their wallets to earn rewards.

The AMM pool will use a pricing module instead of an order book so they could provide more stable prices as well as lower transaction fees according to the announcement Binance made. The company is currently prioritizing liquidity for its own tokens, which means that the first pools offered on launch will be BUSD/DAI, USDT/BUSD, and USDT/DAI.

Earnings from the AMM pool will be accrued with a corresponding seven-day annual percentage yield (APY for short) with returns converted into the assets in their respective pools. Transaction fees, as well as prices, will be determined by the number of assets gathered in the liquidity pools.


Binance CEO stated that the new product is aimed to attract more volume and participants. He said:

“We hope we can further the growth of the DeFi space and empower our users with more earning power and easy liquidity through a centralized AMM pool. The pool’s main characteristics are credibility, safety, and security, which are all provided by Binance,”

Uniswap is, at the moment, the world’s most popular token swapping protocol as well as a decentralized exchange, with more than $1.8 billion in liquidity.

Binance Liquid Swap is actually the second venture into DeFi that the company has made within a week. On Sept 1, the crypto exchange took aim at Ethereum by launching ‘Binance Smart Chain,’ a new Ethereum smart contract that is compatible with the existing Binance Chain.

The company stated that the blockchain was optimized for DeFi, with the goal of low-cost transaction fees that can go as low as 1 cent.

Categories
Forex Videos

The New Cold War Between America & China & What It Means For Traders!

The New Cold War

Thank you for joining this forex academy educational video. In this session, we will be looking at the escalating tensions between the United States and China.


If we believe everything that western media companies tell us about China and, in particular, regarding the Uyghur Muslims of Xinjiang province, we would have a right to be extremely concerned. Human rights advocates are calling it cultural genocide.
Max Blumenthal is an American investigative journalist for The Grayzone, and he believes that US corporate media and the US Government are deliberately sending out false news about China in order to disrupt China’s global rise to being a superpower and advancing the USA as the number one economic and military power. He calls the Executive Commission on China anti-china institutions, while Donald Trump refers to China as liars, thieves, and where he refers to the pandemic as the China virus.


Grayzone uses reliable sources to provide information regarding various US departments, which are actively initiating anti-China propaganda to destabilize China’s continued economic growth.


Max reports that while at a meeting recently in Congress, Capitol Hill, he met Omer Kanat, who is the leader of the World Uyghur Congress, a multi-million US dollar dissident group, which is entirely funded by the US Government. They are primarily focused on regime change and are heavily responsible for providing the western media with reports about the Uyghur’s. Max immediately confronted Kanat about the story from 2018 about the concentration camps in Xinjiang, where millions of these Muslims were supposedly imprisoned. Kanat admitted that he was supplying western media sources with the information about these camps and human rights abuses. And Kanat told him that some stories were provided by other western media sources and some direct witness statements.
This feedback loop, as Max calls, it is the reason why the story is being fuelled by misinformation to portray China as a new Nazi Germany to the West.

Grayzone dug deeper and was only able to find two other sources to back up the concentration camp story: one was Adrian Zenz, an Evangelical fanatic, who, in his 2010 book, Worthy to escape. Zenz has declared he is on a mission from God to wipe out the Chinese Communist Party, which he views as a satanic entity. Zenz believes homosexuals are evil, and yet he has been called as a witness by some US media groups to provide evidence on the human rights abuses of millions of Uyghur Muslims in so-called concentration camps in Xinjiang province.
The other source Max found was the group Chinse Human Rights Defenders, which is a dissident group based in Washington and funded by the US Government. The group says it has testimony from only 8 Uyghur Muslims.
Max says there is simply not enough evidence to collaborate the stories of forced labour, human rights abuses, the extermination of Muslims and their culture, or even that these camps exist.


The Chinese Media Group CGTN, interviewed Gerry Grey, a duel English, Australian passport holder, and Ex UK police officer, with ten years of service, who has travelled extensively five times around China, much of it on his bicycle, since retiring in 2005. He travelled to Xinjiang by plane 2019 and said there were no restrictions there. He could hear the call to prayer 4/5 times per day and witnessed many mosques, something he saw all over China, with some towns having 3 / 4 mosques and where Wiki reports a total of 25,000 mosques in the region alone. He said he could hear the Uyghur’s language being used everywhere and that it was just not true that the Uyghur’s and indeed the Muslim way of life was being eradicated by the Chinese. What’s more, he could find no evidence of concentration camps while travelling freely in the province.
So, are we being fed the truth? The narrative is predominantly being driven by US media groups, and they are being led by the US government. And the flames are then being fuelled by other Western governments, including Great Brittan and many countries in Europe and Australia.

In fact, US officials have been flying around the world looking for support in the so-called fight for injustice and human rights abuses in Mainland China and Hong Kong since the New Security Bill was passed in June 2020.
So who is right and who is wrong? If you believe the above, then it is clearly evident that we are not being fed the correct information about Chinese Muslims and human rights abuses, and it would appear that misinformation and fake news is being used to try and destabilize the Chinese economy, possibly with the effect of slowing it down in order to maintain united states economic supremacy.

But what does this mean for us as traders; well, we are seeing extreme volatility in the markets every single day right now, and while much of this is due to the economic fallout from the pandemic, a great deal of this is because of the continuing spat between the United States and China, and where this looks to have no end in sight.

Therefore traders should be looking out for updates on the status between the relationship of these two powerhouses and expect more market volatility to come.

Categories
Forex Videos

Forex Position Sizing Part 8 – Optimal F Revisited – Why You Must Know it?

Position Sizing VIII – Optimal F Revisited: Why You Must Know it?

Now that we know the properties of optimal f, many of you may ask why we bother with this theme, that Optimal f is just a theoretical limit nobody would even approach.

Well, that may be true ( or not). Nonetheless, information is power, and knowing the optimal f of our strategy or system is quite informative. To begin with, maybe unknowingly, you are trading beyond the optimal point.

The next graph shows several distributions’ f-curves with different percent winners and payoff (reward/risk ratios) that may match different trading systems.


In the graph, we can see that one of them, shown in red, is unprofitable, so the best position size is zero. The first profitable distribution shows its optimal f in the vicinity of 5%. That may indicate the system is poor, and a trader will be beyond its optimal f when several simultaneous trades are taken.
By knowing the optimal f of the strategy we are using, we can assess its quality and figure if we breach the optimal trading limit, risking too much. Thus, optimal f will allow us to compare the real power of a trading system, measured by its geometric mean. The best attainable geometric mean will indicate which trading system to choose among a list of candidates.

A safer way to compute optimal f?

Ralf Vince defines Optimal f as the divisor of the biggest loss, the result of which is divided by the total cash to know how many pips or contracts to have in the next trade. But he assumes that the worst loss has already happened. It is much better for a trader to assume it has not happened.

Due to the properties of the random processes, the statistical properties vary from sample to sample. There is no way to assess the real value, and that is true for all statistical distributions of trading systems.

Montecarlo resampling

With the use of computers and high-level programming languages such as Python, we have on our hands the possibility to create variations of the sequence of trades we took in real life. The use of Monte Carlo resampling will show a more realistic picture of a trading system, signaling its limits and allowing us to be on the safe side.
As an example, let’s examine the performance of forex.academy’s Live Signal service.
The system shows the following basic stat parameters:
STRATEGY STATISTICAL PARAMETERS :

Nr. of Trades: 145.00
Percent winners: 67.59%
Profit Factor: 2.41
Reward Ratio: 1.16

The code to create several thousand different histories is simple. We use Cython to speed up the process. Cython translates Python into C:

The gethistories() function returns a container with the desired number of trade histories, and with the number of desired trades on each history. This function returns just wins and losses, not capital accumulation.

Using a fixed trade size of 0.1 lots, applied to 10,000 paths, resulting from the Monte Carlo resampling of the original path, on a hypothetical account starting with $5,000, we obtain the following graph, representing about one year of trade activity.


The “smoke cloud” seen is typical of resampling. In the figure, we can see that some paths are luckier than others. The less lucky path shows a final equity of about $19,200, while the most profitable goes over $29,700. This will result in differing optimal f values. That happens because the laws of chance change the sequence’s values; so, every sequence will have its optimal fraction. We look for the lowest optimal f, which will minimize the risk of overtrading.

Finding a safer opt f

This procedure will also help us better assess the optimal f. That means we will compute all the optimal f of the resampled paths. As shown in the histogram below, we obtain a distribution of values that follows a normal distribution.


We can, then, compute the mean, max, and min of the optimal f collection. In this case, are:

  • max opt f: 0.915
  • mean opt f: 0.672
  • min Opt f: 0.39

What we look for with this procedure is to find out the minimum opt f value, since we want to minimize the risk of overtrading. In this case, our min opt f is 0.39, which is large enough to be on the safe side when using multiple positions.
For computer geeks, this is the Python code to do optimal f

Using these three functions, we can easily compute the opt f values of a collection of trade sequences in just one line of code. The second line is just to plot its histogram.


Here rawHist is a container of these sequences or histories. Optf is used to store the values obtained.
Stay tuned! The next episodes will explore more position sizing strategies.

Categories
Forex Videos

Forex Position Sizing Part 7 – Optimal Fixed Fraction Trading!


Position Sizing VII – Optimal Fixed Fraction Trading (I)

In the previous video, we have discussed the virtues and drawbacks of the Kelly Criterion. But, the Kelly Criterion formula is valid for fixed outcomes, such as bets, in which the gambler wins or loses predefined amounts, and the probability of success is known. In this video, we are going to explain Ralf Vince’s Optimal f. Optimal f is Ralf’s way of applying the concept of Optimal Fixed Fraction to the markets.

Investing in the markets generates a sequence of wins and losses. If this sequence has a positive mathematical expectation when using a normalized risk unit, ” […] there exists an optimal fraction between zero and one as a divisor of your biggest loss to bet on each and every event.” (Ralf Vince, The handbook of Portfolio Mathematics).

Many people think that the more you bet, the more you’re going to make. That is true in risk-free investing, but it is evident that if you risk 100% of your capital in a trade and lose, you’re losing all your funds. As we have seen in the previous video, there exists an optimal bet size that creates the highest multiplier for your initial capital. This value is different for strategies with distinct parameters.

The figure below shows the return curves of two games after 100 bets. The first blue one corresponds to the fair coin toss game with a 2:1 payoff. The amber curve corresponds to a game with 30% winning percent and 4:1 payoff. We can see that the top of the curves representing the optimal fraction to trade is different, as expected.


How to find the optimal f under market conditions

As said, the Kelly Criterion is valid when the size of the payoff and probability of success is known. When it is not, such as in trading, the procedure to find the optimal fraction is making iterations using different bet sizes to determine the historical best value. Ralf Vince proposes to find it using the Geometrical Mean (GM). He calls HPR to the return of a single trade:

HPR = 1 + f *(-trade/biggest loss)

The product of HPRs is what the calls The Total Wealth Return (TWR)

TWR = ∏(1 + f *(-trade/biggest loss)), where ∏ stands for product.

GM = TWR ^(1/n)

Thus, the Geometrical Mean is the n-th root of TWR, Where n is the number of trades. This Geometric Mean is the growth factor of the strategy.
By looping through f values between zero and one we can find the f for which GM is the highest.

The graph represents the same two games shown above, but depicting the Geometric Mean curves for the different fractions from zero to one. Values below one represent a negative growth factor, meaning the trade size leads to the loss of the capital.
Doing this on Python is straightforward:


To summarize:

  1. We take a list of trades of our trading system, with a standard 1 unit position size
  2. We create a loop from 0 to 100 compute the individual HPR of the trades using the different fractions.
  3. We compute the HPR for each trade fraction
  4. We compute its geometric mean (GM)
  5. We find the optimal f, which is the fraction that delivers the highest GM

Once found, we compute the optimal trade units using the formula

Units = Largest Loss / f.

for example, if our largest loss is $100 and f= 0.2, then Units = $100/0.2 , or $500. This means to trade one unit for every $500 in the cash balance of your trading account.
We see that the optimal fraction is a divisor of your biggest loss that gives you the dollars needed in your account for every unit of trade (lot or contract)
In the next video, we will continue discovering the properties of the optimal f, stay tuned…

Categories
Forex Videos

Position Sizing Part 6 – The Kelly Criterion! How To Find Your Optimum Risk In Forex!

Position Sizing VI: The Kelly Criterion

The Kelly Criterion is a formula that finds the optimal amount to bet based on the percent of winners and the reward/risk ratio. It was published by the Texan-born scientist John L. Kelly, in a paper entitled “A New Interpretation of Information Rate.” The formula is as follows:

f% = P – [(1-P)/R]

were, P is the probability of winning, and R is the reward/risk ratio.

For instance, in a coin toss game in which you win $2 when heads and lose $1 when tails,

f% = 0.5 -[(1-0.5)/2] = 0.5 -0.25 = 0.25%

The formula indicates that you need to bet 25% of the available cash for optimal growth.


Fig 1 – Final equity as a function of the percent bet. Coin-toss game with a 2/1 profit factor after 100 bets, starting with $1.

The fig 1 shows that in a winning game, there is an optimal bet which allows for the maximal growth of the capital. We can see also that after the optimal bet value is surpassed, the risk increases while returns decrease. Therefore, betting beyond optimal is harmful.
Another interesting fact is that the growth curve is steeper as the number of bets (trades) grows, and decreasing the position size by small amounts will significantly harm the overall growth.

The virtues of trading using the Kelly Criterion

Trading using the Kelly Criterion produces the fastest growth. As an example, the next image shows the progression of the equity curve with the same sequence of gains and losses, using 15% and 25% trade sizes in the mentioned coin-toss game. Please, remember, the game started with 1 dollar, so the figure shown in vertical axis of the image is a multiplier. If you’ve started with $1,000 at the end of the 100 tosses, you’ll end with $30 million using the Kelly Criterion (amber curve).


In the image, we can see that the 25% trade had a 30,000X profit in 100 bets, whereas the 15% trade size has a mere 2,200X. That difference grows with the number of bets. We can see also that the difference is not that much in the first sixty trades, but it explodes after trade nr. 70 and especially after trade nr. 90. Thus, the Kelly Criterion does not show its effects in the short-term; thus, trader should let it go long-term.

The downside of the Kelly Criterion

One downside of using the Kelly Criterion is that even on a fair coin-toss game with 2:1 reward/risk ratio in which we know the exact optimal position size (25%), the random nature of the coin toss would make it seem as if the optimal size should be different. The following figure shows 20 different coin toss curves of 100 bets using real random sequences.


The figure is set to log scale because the difference in the outcomes are so high that a linear scale does not reveal what we are looking for. In the image, we can see that the lower curves show its peak below the theoretical 25, while the more successful outcomes show optimal fractions of up to 42. This explains how difficult it is to find the optimal fraction on a trading system in which we only know the historic parameters, not the true parameters.
Linked to this, comes what we already have said: using the optimal fraction sizes may result in huge drawdowns.

Drawdowns

Similar to the growth curves shown, drawdowns cannot be fully predicted but using Monte Carlo simulations, we can create a good approximation of the typical and maximum values. On the next figure, plotting the histogram of max drawdowns, we can see that the typical value for the Kelly Criterion sizing is about 85% drawdown.


In the next figure, we can see the max drawdown probability plot. We observe that the likelihood of a max drawdown of at least 95% is about five percent in sequences of 100 bets, or once every 20 occasions. Therefore, we should assume the possibility of it happening over time is a sure thing.


So, if the Method is not tradeable, why waste our time?
Although it is rather hard to trade using optimal fractions, we can make use of the concept of maximal equity growth. So, stay tuned for practical applications of the Kelly Criterion in the future.

Categories
Crypto Videos

Ethereum Developers Discuss Transaction Fees! The Death Of Ethereum?

Ethereum Developers Discuss Transaction Fees – Is It Too Late?

An Ethereum All-Core-Developer call was held on Sept 4 to discuss a variety of proposals that could improve the Ethereum network. However, this call was mostly prompted by gas fees on the network remaining historically high.
The call agenda included several discussion points, most notably about high gas prices as well as ways to mitigate the problem. Alexey Akhunov, an independent Ethereum researcher, opened the conversation with a comment on the existence of gas tokens and how they are pushing the prices higher than predicted.

He highlighted how the mempool is often full of transactions bidding a certain amount of gas to mint these tokens. He also compared this approach to order book exchanges where the traders fish for dips with low price orders. However, according to Akhunov, the fact that gas bidding orders cannot be simply and easily canceled could mean that the prices remain artificially high as any possible dip is bought by default.
While there was mention of elimination of the refund mechanism that underpins the gas tokens, Akhunov acknowledged that the magnitude of gas minting only accounts for around 2% of current gas usage. This would, in turn, suggest that any negative contribution that this problem may cause is limited in size. However, he noted that he would need to find more data before discussion options to eliminate this mechanism formally.
The remaining topics were less important in terms of gas price discussion. One of the topics brought to the conversation was a recently introduced EIP supported by Ethereum co-founder Vitalik Buterin as well as core developer Martin Swende.

Main Proposals

Filed under the name EIP-2929, the proposal substantially increases gas costs for a couple of storage operations. On the other hand, this is being done as a protection against Denial of Service attacks. This change will also mean that some operations could actually be cheaper than before.
While raising gas costs appears counterintuitive at the moment, doing so could help Ethereum devs feel more confident about the gas limit increases in the future.

A further EIP that could have the biggest impact on the general user experience is the one named EIP-2711. This proposal could let one account pay for someone else’s transaction fee, as well as create batched transactions that have a guarantee to be executed in the exact order they were submitted.
The latter change could also result in savings in gas costs, as we have seen on platforms like Uniswap, where this system was already implemented.

Conclusion

Overall, the changes brought up during a developer call are being discussed primarily for inclusion in the Berlin hard fork, that was originally expected to come this summer. However, as many proposals still need to be tested and approved, the hard fork is most likely still some time away.
For the time being, the Ethereum fee market will remain without changes and entirely at the mercy of surging demand, which drives the gas prices up.

Categories
Forex Videos

Better Bid Or Better Offered – Determining Forex Trends!


Better bid or better offered?

In the old days of currency trading, long before the internet, around the late 1970s to mid-1990s, banks who traded in the foreign exchange market would largely rely on brokers to feed them exchange rate prices. This was much quicker than phoning around 150 banks in London, or the other major financial centres, in order to try and find a bid or offer which matched where they wanted to trade, although many of them would do this as well with preferred trading partners.

It was much easier to call up a broker who had a team who was directly speaking with all the banks simultaneously, and again, this applies to all the major trading centres such as London, New York, and Frankfurt.

Most brokers would call prices, which were offered to them by their banking clients, down a direct squawk box to the banker’s desk, in order to relay movements in foreign exchange currency rates. If the bank liked a rate, they would trade on the bid or the offer. Bank names would be checked for credit and risk purposes, and the deal would be closed within a few seconds, usually.

And because the current technology was not available, the volatility which we take for granted in the markets was pretty much unheard of and where brokers wood simply quote the exchange spreads as prices moved up and down. Nowadays, that would be absolutely impossible because an exchange rate can move 50 pips in a few seconds.

One of the features that brokers wood call out along with the prices was whether the market was better offered or better bid. In other words, whether there was more money on the offer than the bid or vice versa. This would suggest to the bank receiving the quotes that more people were selling than buying, or the other way around, and this type of information would influence how they traded currency pairs and, indeed, other sections of the currency markets like cash deposits, certificates of deposits, and forex forward rates.

In a market such as forex, where the volumes are not known, it is difficult to know where the offers and bids are greater because there are so many brokers and market makers in spot FX it’s difficult to see what volume is going through at any given time, although candlestick sizes and shapes can give a level of accuracy here. But another way is to look at trends to determine where the market is better bid or better offered, and that tool is the stochastic overbought/oversold oscillator.

This is a 1-hour chart of the GBPUSD pair, and at position A, if you follow the vertical line down, you can see that the stochastic indicator reaches the oversold position at the 20 line, with a standard setup of 5,3,3, and the pair acts accordingly and reverses the sell-off and moves higher. Now let’s focus on the vertical line at position B, where we can see that again, the stochastic shows oversold. However, this time, if we follow the vertical line, price action does not move higher. There is a very slight pullback, before a continuation to the downside. This tells a professional trader that the market is not going with the stochastic indicator, and at this time, the market is better offered than bid: in other words, there are more sellers.

If we follow so the chart across to position C, again, we see the stochastic showing oversold at the 20 line, and after a very brief pullback, the pair moves to the downside because there are more sellers than buyers, as you might expect, having seen a recent bear trend.
Always look for when the stochastic is working as per position A and failing as per position B and C. This will tell you where there are more sellers than buyers, or the opposite, as well as the market being overbought or oversold.

When trading, always try and look the where the volume is greater, and if therefore if there are more buyers than sellers, or vice versa, and if you keep this in the back of your mind to help you find weaknesses in directional bias, and this will ultimately will help you in your trading.

Categories
Forex Videos

Forex! China and USA the fire just got stoked – How To Trade The Ongoing Feud!

China and USA, the fire just got stoked


Thank you for viewing this forex academy educational video. In this session, we will be looking at the continuing tensions which have been escalating between China and the United States of America.
Tensions began to rise just after the Chinese phase 1 trade deal purchasing agreement with the United States came into effect after causing a record-breaking move higher on US equities,

especially the Dow Jones 30, as the market expected the US economy to grow as a result. The ink was barely dry on the agreement when the coronavirus broke out in China and eventually spread across Europe before catching hold in the United States of America.
President Trump often refers to the disease as the China virus, and an escalation between the two nations has been growing ever since. Recently, President Trump banned:

WeChat and TikTok from being used by the American public and organizations in the United States and where President Trump has been putting pressure on European countries to stop using Huawei for 5G g-technology. The reasoning behind this is that the Chinese companies which own the technologies might send the collated personal data of US citizens and firms to the Communist Party of China. This has led to tit-for-tat escalations building between the nations, which could not have come at a worse time bearing in mind the global slowdown with economies suffering due to the ongoing Covid pandemic.

On Saturday, the 15th of August, the United States, and China were due to have had a videoconference meeting to discuss the 6-month anniversary of the signing of the phase one trade deal between the two Nations. However, this was surprisingly canceled, with American officials citing a delay due to apparent scheduling conflicts and where the United States requested more time to allowed China to purchase more United States exports.
This should have been a 6-month compliance review you wear the US trade representative Robert Lighthizer, US treasury secretary Steven Mnuchin and Chinese vice-premier Liu He had agreed should have taken place. Bearing in mind that this would have been arranged six months ago, it seems rather than usual that all of a sudden, there should be a scheduling issue. Surely this must be down to the fact that there is a growing breakdown in the relationship between the two Nations. One has to wonder what is going on in the background? Are the Chinese sticking to their part of the deal with the enormous purchasing requirements of American goods and services, especially products from United States farmers, which runs into millions of tons of products. And as a result of which saw US equities pushed to record highs.


With the United States in the grip of the worst economic turndown in its history, the last thing it needs at the moment is for the Chinese to renege on the deal.

Donald Trump has said that the trade is, and I quote: ’’ is doing very well’’, but has not so far commented on the delay of the meeting. The Chinese side is saying that, and I quote: ’the new date has not been finalized yet’’.

But it is known that China is behind with the purchasing agreement. However, markets are predicting that this is purely a knock-on effect from the Coronavirus lockdown they had earlier on this year ear and that this is the reason for them not being able to honor the agreement which would contain a clause such coving a force majeure.
Nonetheless, the financial markets have been twitchy as the escalation grows, but US stock indices have not suffered, but where the American dollar is currently on the back foot due to the ongoing pandemic within in the United States and, no doubt, tensions between America and China will be playing a part also.
The failure of the phase one deal would be a political scoring point for the democratic presidential candidate Joe Biden who recently said that the historic agreement was ‘’failing’’.
So, what can we expect? Certainly, escalations in relationships between these two Nations is likely to continue, and we will see market turbulence as a result. Stock indices in the United States seem to be running on helium and are largely unaffected by the coronavirus. However, should the Chinese pull out of phase one deal, this would cause a potential sharp fall in the United States equities.


The American dollar remains under pressure, and this would also see great volatility should any such announcements occur. During these times, which are unprecedented, and where no end seems to be in sight, traders are advised to tread with caution and used tight stop losses at all times.

Categories
Forex Videos

Where Next for the Dow Jones US Elections In sight!

Where Next for the Dow Jones? US Elections in sight.


Thank you for joining this forex academy educational video. In this session, we will be looking at the Dow Jones 30 industrial average index.

In this chart, we can see price action going back to the 15th of July why where the index was at 24,659 and where it had since rallied to 27,889, which is quite staggering when you realize that’s the record high before the coronavirus was just above 29,000, and where the United States is still in the grip of the covid pandemic and where businesses are suffering badly and where unemployment is still at historic highs not seen since the second world war.

And yet the Dow Jones stock markets, one of the benchmark indices in the United States, is flying in the face of fundamental analysis, and indeed common sense, and is rallying to the upside almost at a record-breaking pace. Market analysts, traders, and leading names in the stock markets investing arena have been suggesting that the Dow Jones would collapse down to the levels we witnessed in march where the index was at 18,200: A total collapse from the high of a few weeks previously.

And while the index causes for a breather before the next push in either direction, traders will now be in to focus on the United States elections in a few week’s time, And where Republican Donald Trump is not doing well in the ratings due to his handling of the Covid virus within the USA, and where it was commonly believed that Donald trump’s policies on low taxation and less regulation, and a push for lower interest rates were of great benefit to American corporations, thus pushing the Dow Jones to the highs we saw before the virus pandemic. The US stock market loved Donald Trump. It is now believed that the Democrat opposition, Joe Biden, may sweep to a November election victory and that if this happens, many of Donald trump’s policies, including taxation, would be reversed.


Therefore, we should presume that if Joe Biden won the election and the democrats reversed Donald trump’s policies that the American stock market, including the Dow Jones 30 industrial average index, would suffer and where analysts predict a 20% fall on the basis that Biden reverse Trumps’ policies and would likely increase capital gains tax to as high as 39% for upper-income individuals, bearing in mind that it is the higher earners that tend to buy more stocks.

In times gone past when the biggest factor to determine the value of stocks was companies earnings, it would appear that this no longer matters, fundamentals have gone out of the window, and where if an incredibly disruptive and economically devastating pandemic cannot crush the Dow Jones industrial average, we should in fact not be at all surprised that not even an election defeat for Donald Trump will necessarily mean a collapse in the Dow Jones index. In fact, if the market is purely driven by trend, which it appears to be, we could see the previous highs breached. Sellers beware.


Categories
Crypto Videos

Apple Stock Market Cap Dwarfs Crypto!

Apple Stock Market Cap Shows Us How Small Crypto Still Is

While it is undeniable that the crypto space has seen tremendous growth both in value and adoption terms over the past decade, the asset class is still very tiny when it comes to value in relative terms. When compared to mainstream markets, and especially when pitted against giants such as Apple, the value of cryptocurrencies is easily dwarfed.

Apple vs. Cryptocurrencies

Apple stock (AAPL) currently holds a staggering $2 trillion market cap, essentially dwarfing all the speculative capital that is held within the entire crypto space, which, at the moment, totals a mere $327.6 billion according to CoinMarketCap.

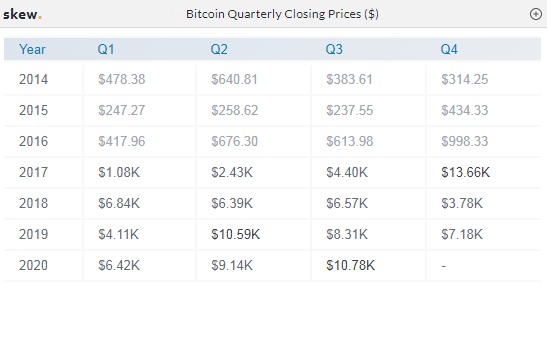
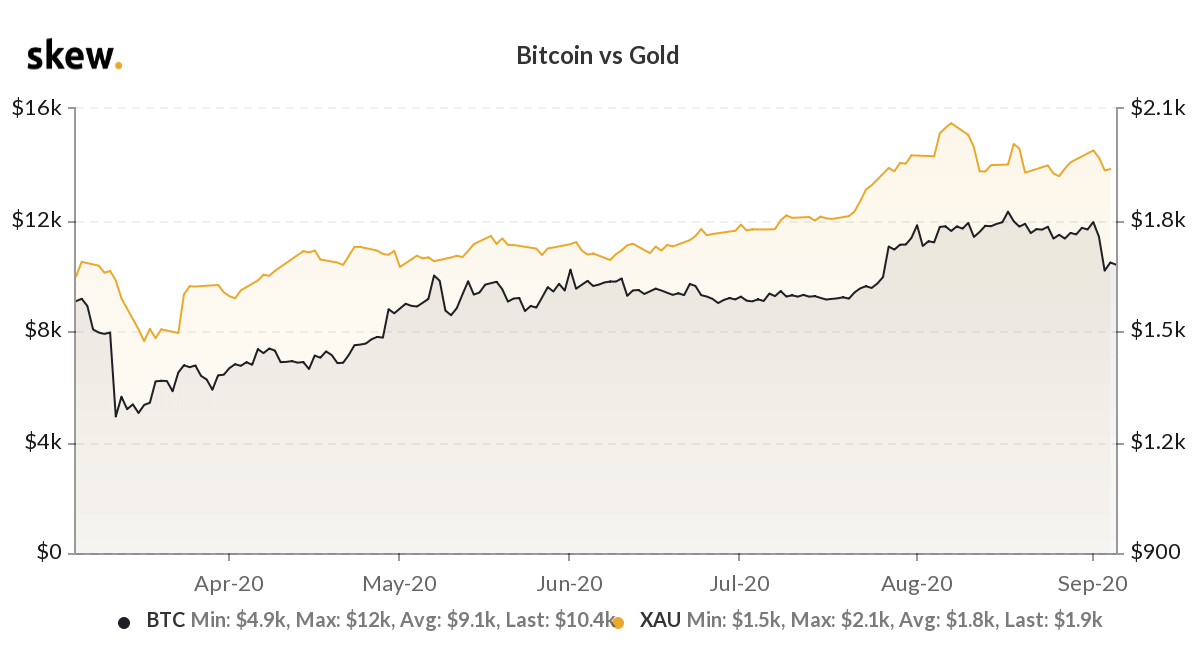
The cryptocurrency industry has grown from merely a concept in 2008, with the inception of Bitcoin’s white paper, all the way to hosting billions of invested dollars and millions of people that believe that crypto will revolutionize the future. Bitcoin went from less than $1 per coin, all the way up to $20,000 at its all-time high in December 2017. It is currently carrying a market capitalization of roughly $189 billion.
The entire crypto industry, however, is still only a fraction of the size of Apple’s total stock shares. Even if the market cap of the whole Blockchain industry would triple, it would still not reach Apple’s market valuation.

Apple is a tech company, well-known for pushing the smartphone revolution with its iPhone series phones. It currently holds the biggest market capitalization on the US stock market, based on data shown by TradingView. Apple also has the record of being the first publicly traded US company to ever reach a $2 trillion market cap.

An image of Bitcoin and US currencies is displayed on a screen as delegates listen to a panel of speakers during the Interpol World Congress in Singapore on July 4, 2017.
The three-day conference on fostering innovation for future security challenges is taking place from July 4 to 6. / AFP PHOTO / ROSLAN RAHMAN (Photo credit should read ROSLAN RAHMAN/AFP/Getty Images)

Conclusion

While some people may say that crypto is, in its current state, too small to be taken seriously, many believe that crypto is a great investment at the moment precisely because it is small but with immense potential. The room to grow as well as the possibilities in terms of finance solutions are what fuels the year-over-year growth of cryptocurrencies.
The key takeaway from the comparison with Apple would be that, while Bitcoin and other cryptocurrencies are extremely small in relative terms, they provide solutions to real-world problems and have the potential to change the world as we know it.

Categories
Forex Videos

Buffett dumping Wells Fargo benefits Bitcoin


Warren Buffett and its company Berkshire Hathaway have substantially cut their position on Wells Fargo, selling a whopping number of 100 million shares. The, as they call him, Oracle of Omaha, is continuing to trim his position in bank stocks, which subsequently means that he is bumping up the bull case for gold and Bitcoin.
Berkshire Hathaway reportedly held $32 billion in Wells Fargo stocks at one point, while the investment conglomerate now owns only 3.3% in equity of the lender, coming up to just $3.36 billion.

Why Did Buffett Dump Wells Fargo


Throughout his career, Buffett always spoke about the importance of value investing and cash flow. He typically prefers businesses that have quite predictable and stable operations and results in consistent profitability.
In July, Wells Fargo posted a loss of $2.4 billion, recording its first loss since the 2008 financial crisis. Following the disappointing quarterly report, the bank said that its dividends would be cut to 10 cents per share.
This month, Moody’s financial analysis report showed its rating going down from stable to negative. The reason for this was mainly how slow the process to overhaul its governance was. Allen Tischler, a Moody’s analyst, said:
“Our change in outlook reflects Wells Fargo’s slower-than-anticipated pace when it comes to resolving its legacy governance, oversight, compliance, as well as operational risk management deficiencies. The aforementioned slow pace weighs on its expense base, further undermining the company’s earnings potential.”


The confluence of the quarterly loss, the dividends being cut, and the downgraded outlook presented by analysts likely led Buffett to trim his position in Wells Fargo.
Berkshire’s portfolio has had a reshuffle in recent months as its investments shifted more towards Barrick Gold. While decreasing its exposure to the US banking sector, Buffett invested in gold as well as in Japanese trading companies.
How Does This Benefit Bitcoin?
The decisions Buffett made recently show that he is seeking safety in terms of cash flow as well as a hedge against inflation. The large Barrick Gold investment fuels the bull case for Bitcoin simply because the perception of BTC as a store of value is greatly improving, especially given the tight correlation between gold and BTC since the March 2020 crash.

BTC would “cannibalize” gold in the future


While Buffet doesn’t want to get involved in cryptocurrencies, other notable investors, including the Winklevoss twins, have very strong beliefs that Bitcoin as “digital gold” could compete against gold over the long term. Of course, Bitcoin is also interesting to investors because of its immense upside potential. When comparing the size of the two markets, Bitcoin’s market capitalization is still only around 1.5% of gold.
Cameron Winkelvoss, the co-founder of Gemini, announced that Bitcoin already has significant advantages versus gold. He said:

“Bitcoin has made significant ground on gold —going from white paper to over $200 billion in market cap in under a decade. Bitcoin will continue to cannibalize gold dramatically over the next decade.”
Wall Street veteran and the host of the Keiser Report, Max Keiser, also believes that Buffett exiting the dollar is quite a bullish signal for the price of gold and Bitcoin.

Categories
Crypto Videos

Avoid Having Your Crypto Stolen!

WATCH OUT FOR THIS CRYPTO SCAM: Copy & Paste Exploit Exposed

A Reddit user operating under the nickname “seraf1990” warned crypto holders of a copy & paste scam that stole his crypto holdings. This copy & paste scam works by replacing a wallet address he copied from Coinbase with the one belonging to scammers. In his post, seraf1990 added that he lost about $350 worth of Bitcoin. This money, as he noted, was meant to go towards his next month’s rent.
The post explains how exactly seraf1990 got scammed. He was attempting to cash out some Bitcoin by sending it from Binance to his Coinbase account. After copying the exchange’s Bitcoin wallet address, the Reddit user pasted it into the appropriate field on the Binance exchange and completed the transaction “without a second thought.” It was only later that he actually realized the address had somehow been switched out.

This type of attack is not new. In fact, it is fairly common, except for one major difference. When a bad actor swaps out the address for one of their own, the two addresses are usually completely different from one another, therefore making the exploit reasonably easy to spot. However, in this case, however, the first four digits of the two addresses were the same.
The fact that Coinbase only displays the first couple of digits of the wallet on the user’s device only compounded the issue.


In the post, seraf1990 said that the device used in this particular transaction was a computer using Windows OS. Some replies on the thread speculated that some form of malware could be behind the crypto scam, though the exact method was never directly confirmed.
Since the method of spreading this particular malware is not known, we can only speculate on how to defend against it. However, it is safe to say that clicking on unknown links and downloading unsafe files is a sure way to get your crypto stolen.

Categories
Forex Videos

Position Sizing Part 5! Optimise your returns using the Percent Risk Model

Position Sizing V: Optimize your returns using the Percent Risk Model

Besides the constant position size, the Percent Risk Model is the most used method. The Percent Risk Model allows us to define the number of lots (or mini/micro Lots) as a fixed percentage of the available cash in the trading account.

The risk is defined as the loss incurred if the trade hits the stop-loss order. Thus, every trade must have at least a pre-defined entry and stop-loss. The monetary value in pips from the entry point to the stop-loss is the risk of the trade. The size is determined by MCP simple formula, as already stated in a previous video presentation.
M=C/P
M is the number of mini-lots, C is the cash at risk, the percent risk decided by the trader, and P is the pip distance from entry to stop-loss.

C, the cash at risk, can vary widely, and it will determine the profitability of the strategy and, also, the max drawdown incurred.

From the MCP formula, we can deduct that M increases as P decreases. So tight stops wold allow traders to increase M without increasing the dollar risk C, but, before analyzing this methodology, we have to emphasize that the stop-loss setting must be set at its optimal place. Setting them too close to the entry to increase the position size will force the trader to close a position that would be profitable with a proper stop setting.
In our site, Forex.academy, we have already published several methods to optimize the stops. We recommend you to give them a look.

Masteting Stop-Loss setting: How about using Kase Dev-Stops?

Maximum Adverse Excursion

The Case for Average True Range-based Stop-loss Settings

The Constant Size Risk Model

The Percent Risk Model is a compounding method. The constant-size trading method uses a single size, independent of the amount of cash available, so it has drawbacks. The first one is that the size of the position does not decrease on drawdowns. Imagine a trader risking One-tenth of the initial cash, experiencing a 10-losing streak. He will be wiped out! Also, If he is successful, this position sizing method does not allow him to use the money gained in the markets to make more profits. It is like having a constant account and withdrawing all the gains. Thus it is much more difficult to create wealth.

To see the importance of compounding, let’s look at the difference between a constant mini-lot size and a compounding 1% risk in one year of trading using the trade signals of our Live Signal Service, starting in both cases with $10,000:


In the image, we can see that while the profits of the constant-sizing methodology are linear, the equity curve of the percent-risk model is exponential. We can also observe by the ripples of the curve that the Percent Risk Model has higher drawdowns, which grow (moneywise) with the trading account’s growth. These are the main features of these sizing models.

Optimizing Our Percent Risk Model

The figure below, shows the hypothetical position sizing curves of 1%, 2%, 5%, 10%, and 20% risk models in log-scale, for the same segment of a trading system with 68% winners and 1.1 reward/risk factor, which shows similar figures as our Live Signal Service. We can see that the theoretical account growth can be made astronomical by increasing the position sizing. Unhappily, the future is not written in stone, and future returns can vary substantially from past performances. Thus, the trader must set his trading goals taking into consideration no only the growth but also the drawdown.

For instance, in the figure above, the steepest curve, corresponding to the 20% risk model, shows several 90% drawdown segments. Are you willing to accept to lose 90% of your hard-earned profits to push your returns to the sky? Indeed, there is a limit to the amount a trader can withstand to lose. Thus, it seems reasonable to define our desired maximum drawdown and set the percent risk accordingly.
Let’s say our risk appetite allows us to lose up to 25% Drawdown, and that our system is well below 10 losing streaks. An approximation of our ideal Percent Risk Model Size is to divide 25% by 10 and set our trade size to 2%.

To verify this figure, traders with programming abilities could create a code to produce a Monte Carlo simulation of futures trades. That is what we have done here. The curve below corresponds to the drawdown histogram of 10,000 synthetic trade histories.

Mean Drawdown: 21.02 %
Our little exercise tells us that the average max drawdown is 21.02%, but there is a 3% chance that we could experience a 30% drawdown in a year. A small sacrifice to convert $10,000 into $2.5 million in 12 months.
In a future video, we will discuss improvements on this basic model.

Categories
Forex Videos

Position Size Part 4! Equity Calculation Models ( Mastering The Markets )

Position Size IV – Equity Calculation Models

In our previous video, we learned the basics of calculating mini-lot sizes for a single position. But how to proceed if we have concurrently open positions? This video is aimed at providing different solutions to the theme.

Core Supply Model

Using this guideline, you determine the dollar risk for the next trade by taking the remaining cash left on your account. For example, your initial account cash balance is $5,000, and you have risked 2% (or $100) in your first trade. To compute the next position size, you should consider the $4,900 remaining cash; thus, if your position sizing method told you to use a 2% risk, the size of your next trade should be $4900 *2% or $98.

Using the Core Supply Model, open profits are not considered until the trade or trades are closed. The formula subtracts all the initial risk of the previous trades until the trades are closed. New positions are always computed using the cash calculated with the formula:

Cash = Total equity – Open-trade risks

Balanced Total Supply Model

This method is similar to the Core Supply Model, but it adds the profits of the positions in your favor, but only if a stop-loss level protects them. For example, let’s assume you currently have a paper gain of $260 in your first trade, as in the following figure, and you’ve placed a trailing stop that is now protecting $200 of it. In this case, the available cash for the second trade will be $4,900+$200 = $5,100.

Total Supply Model

The total available cash is calculated by adding and subtracting all the open positions’ gains and losses. This model is a bit riskier than the previous model, as all the profits are added without the requirement of protecting them with a stop-loss. This makes it very simple, although it delivers slightly larger sizes. If we use the previous table, the $250 current profit on the first trade will be entirely added to the $4,900 base supply for a total supply of $5,150 available for the next trade.

This risk model is very much used by account managers, as it helps them keep their position size (their risk) constant, because the next trade size it will always be a percentage of the total available equity.

Boosted Supply Model

This model is made of two “pockets”: The Conservative Money Pocket and the Boosted Money Pocket. This central approach uses a low-risk sizing model on the Conservative Money Pocket and an expanded risk sizing model on the Boosted Money Pocket. The Boosted Money Pocket can be filled using two methods. The first one is to allocate a percentage of the equity ( from 5% to 20%) to the Boosted Money Pocket. The second method is to wait for “market money.” Market money is money resulting from your net gains.
The Boosted Supply Model’s main idea is to be conservative with most of your trading funds and be speculative with the market’s money or a small part of your equity.
Also, the key to this methodology is that the Boosted Money Pocket be rebalanced. We can set a rule to rebalance every week, 15 days or one month, or set a profit target for this pocket that, when reached, will trigger a rebalance action to set it to a pre-defined 5%-20% level.

Using this boosted model, a trader is willing to set a max drawdown much higher to profit from the accelerated equity growth. It is well known that equity growth grows in a geometric progression while drawdowns move in an arithmetic progression. That means that we could obtain over 10X equity growth with just a 2X drawdown increase. We will develop more on this with specific models in future videos. But, as an example, if a trading system delivers a 10% drawdown using 1% position sizing, a boosted pocket could be set to 6X this risk (6%) for a 60% projected drawdown on this 10% portion of the funds of the market’s money. That would triple the profitability of the system but remaining conservative on the core funds of the trader.

Categories
Crypto Videos

Is Bitcoin rising because the US Dollar is falling? #correlated

.

Is Bitcoin rising because the US Dollar is falling?


Thank you for joining this educational video by forex.academy. In this video, we will be looking at the rising bitcoin and the falling US dollar.


Let’s take a look at the US dollar currency index, also known as DXY, on this daily chart where we can see that at the beginning of March, there was a high of 103.00 when measured against other currencies which make up the major pairs, including the Euro, GB Pound, Swiss Franc, Japanese Yen, Australian dollar, and the New Zealand Dollar, and the Canadian Dollar, and where since then the DXY has fallen to its current level of around 93.00. this is entirely due to the American economy suffering at the hands of the covered virus.

And although the recent economic data from the United States, including upbeat retail sales and non-farm productivity for July, were better than expected, and where the initial jobless claims for August was also lower than expected, all depicting a slightly healthier economy then was forecast by market economists, the dollar remains very much on the back foot. This will likely continue until such time as the democrats and republicans agree to a relief stimulus package to aid those unemployed Americans and struggling companies.


Now let’s look at this bitcoin futures chart on the Chicago mercantile exchange, or CME, going back to June of this year and where we can see that prices failed to fall below the key 9,000 to the US Dollar support area and since the latter part of July, prices have increased almost exponentially up to its current level of 11,870.
And so we can clearly see that in this extra time of market turbulence and volatility, the dollar is clearly falling, and bitcoin futures are clearly rising. Historically the markets typically do not use a correlation mechanism – in this case, a negative correlation – in order to trade one against the other. However, is that about to change?

It is a widely held belief that the highest ever spike in bitcoin to around 20,000 was driven by the fear of missing out or the FOMO effect.
However, some institutions and market analysts are fearful that the biggest single currency in the world, the United States dollar, will continue to take a battering, and that holding just one currency at such times of market turbulence and uncertainty may have inflationary pressures within the United States, and therefore there is a trail of thought is that some long-term speculators are moving out of the US dollar, even in these risky times, preferring to diversify into bitcoin, where market upside potential is possible on the basis that bitcoin has seen a previous high of 20,000 and whereby a floor seems to be established of around 9,000. This will give investors some comfort in believing that the coins will not go down to a few dollars, for example, and this will likely fuel the FOMO effect and thus the continued trend for both assets.

Categories
Forex Videos

Forex Position Sizing Part 3 – The Advantage!

Position Size III – The Advantage

After deciding the current price movement was a good trading signal, position sizing answers the question of “how much shall I take,” which is a crucial question to ask, especially on leveraged trading. But position sizing defines not only the Risk and drawdown but also the overall profitability of a trader.


Van K. Tharp usually presents his learners a game, There are commonly near 300 traders attending to his courses, and the game consists of a bag of 30 marbles with defined gains and losses representing trades. A marble is pulled out randomly and then replaced each time. Everyone gets the same results in terms of reward/risk ratios or R. The participants only have to choose the size of R. At the end of the game, except for those who went broke, everyone ended up with different equity, although the trades are the same.
Van K. Tharp also mentions a study by G. Brinson appearing in “Financial Analysts Journal” in 1991 that studied the performance of 82 portfolio managers over a 10-year period. Their primary variable was how much was invested in bonds, stocks, and cash. The study concluded that over 90% of the variability in performance was due to “asset allocation,” which is a word used by professionals to refer to how much to invest. That means position sizing modeling results in considerable variations in the performance of a trading strategy.


The Three Components of Position Sizing Settings

1.- Psychology:

People with no knowledge of position sizing methods modify the size of their position based on their current emotions. Traders with no regard for Risk usually overtrade. Their account balance is likely insufficient; thus, they go broke at the minimum flip of the market against them.

2.- Objectives:

A person with only profitability objectives will have a different result from a trader with a combination of profit/risk objectives.

3.- Position sizing Method

Some people use a single position size, no matter how large is his current trading account. Others use a percentage of the account balance, while others vary the position size, pyramiding or downsizing, as their trading results evolve.

The combination of these three elements can create a wide variety of models.

Simplifying the model

Indeed, there are trading strategies in which trades are correlated, or dependent, which may be improved by the use of trading sizes adapted to the past results, such as the Turtles trend-following methods, which might benefit from pyramiding schemes. Still, the majority of trading systems show independency. Thus, we are in favor of separating the decision part from the sizing part.

Thus, the trading system should deliver the entry and exit signals, with a precise R-risk- figure, its results as a stream of multiples of R. This allows the trader to measure and determine the profitability and drawdown, adapting the size of future trades to fit his trading objectives.

The MCP Model

A simple shortcut to help you define the size of every trade is the LCR formula.
C: Cash, a trader, is willing to risk. That part comes from your position sizing strategy. For example, if you’re ready to risk 1% of your current $3,500 trading balance, C will be 3,500×1% = $35

R: Risk of the trade: The dollar distance between entry and stop-loss level.
L: Position size in lots

L = C/R

In Forex, the definition of Risk is in pips. So, the first thing you need to know is the dollar risk of one pip. For instance, in the EURUSD, the dollar risk of one pip is $10 for one lot. If you think in mini-lots, this goes to $1, which is a nice figure since it is mathematically “transparent.” Also, the majority of pairs have a pip value close to $1 on mini-lot sizes; the only one exceeding this value is the EUR/GBP, which is $1.28. Therefore, we can simplify the formula to calculate P in mini-lots with the formula for practical uses.

M = C/P

Where M = mini-lots, C= cash at risk, P= Pip distance from entry to stop-loss.

As an example, If our C is $35, and we have 20 pips distance between entry and stop-loss,
M = $35/20 = 1.75 mini-lots.

This methodology is valid on systems with only one open position at a time. For more than one open positions, there are three additional modes needed to compute C. That will be left for another video. Stay tuned…

Categories
Crypto Videos

Big Hit To The US – Digital Yuan vs the US Dollar!


Digital Yuan vs. the US Dollar – Will the Takeover Happen?

Eswar Prasad, a senior fellow at the Brookings Institution and a professor of Trade Policy at Cornell University, believes that, while China’s digital yuan will enhance the role of the renminbi as an international payment currency, it will most likely not impact the dollar’s status as the dominant currency.
Parsad stated his opinions in a piece published in Project Syndicate, where he said that the Chinese government should keep reforming its financial markets and remove restrictions on the capital flow, all in order to put both China’s national cross-border payments system and CBDC in the global sphere.

According to the professor, China’s national currency has made significant progress in recent years, both as a reserve currency and as a means of payment. He says that this can mostly be attributed at the expense of currencies such as the British Pound and the Euro:
Even when the IMF added renminbi to the four existing currencies in the SDR basket, and then gave it a 10.9% weighting, it was most likely the euro, the pound, as well as the Japanese yen that gave way, not the US dollar.
The People’s Bank of China still influences the renminbi exchange rate, said Prasad, who added that such policy most likely won’t change “significantly anytime soon.”

On the other hand, the professor clarified that as other developing countries are making solid trade and financial links with China, they “could start to invoice and settle their transactions directly” in their national currency, which could easily lead to the adoption of the digital yuan when it’s officially launched.
China’s Commerce Ministry made an announcement on Aug 14 that it will expand the trials of the nation’s CBDS to include Beijing, as well as Tianjin and Hebei provinces.

Categories
Forex Videos

How to read a volatile chart! EURUSD Price Analysis…

How to read a volatile chart: EURUSD Price Analysis for 13th August 2020

Thank you for joining this forex academy educational video. In this session, we will look at one of the most frustrating things that a trader will find and about a complete turn in price action, which does not necessarily go with technical analysis.


This is a one-hour chart of the euro US dollar pair, and I’m interested in the period between the 12th and 13th of August.
We can see that at position A, on the 11th August, the price action high, is at the same level as on the 10th of August, suggesting a price action double top reversal formation, and indeed the market reacts accordingly, and price action begins to fade back to position B, which breaches the previous lows going all the way back to the beginning of August, suggesting that the bears were in control of the pair, and price action might continue lower into the high 1.16’s
However, frustratingly for those sellers, the price could not be maintained in the downward direction and then completely reverses, retesting the high at position ‘A’ and finally breaching it to the upside, and where now we might expect a retest of the 1.19 level.


So, what is going on here where our chart suggests the bears are in control, and then all of a sudden, during the Asian session on the 12th of August, things just completely reverse, and the pair is driven higher?
One of the main factors to consider during the current economic crisis throughout the world caused by the global covid pandemic is the continuous change in sentiment for one country against the next, which at the moment is causing such a volatility and where the market can turn for no apparent reason with regards to technical analysis.


This pair was simply unable to bridge the 1.1700 key level, and this became a significant turning point. Key level trading such as round numbers can often reverse an exchange rate in its tracks, and that is what happened on this occasion. However, we must also take into account market sentiments, and a critical component of this reversal was the continuing spat between the democrats and republicans of the United States Congress who have so far not been able to come to a solution with regard to the continuation of the covid relief fund, which expired the previous Friday, leaving millions of Americans wondering how they are going to cope financially without the support that they had been relying on in the last few months.
Until such time as the Americans have got their act together and implement extra financial relief, we can expect more market volatility and a weakening United States dollar. Watch out for key number reversals and spikes in price action, where technical analysis must be used in combination of market sentiment while keeping fundamentals in the background and remembering that these are not the key market drivers during the continuing crisis. Keep informed with up-to-date news, especially pertaining to the United States covid relief status. And Keep stops tight.

Categories
Crypto Videos

Brazil’s Central Bank Joins the CBDC Race! Crypto!


Brazil’s Central Bank Joins the CBDC Race

The Central bank of Brazil has begun laying the groundwork for its own Central Bank Digital Currency with an official statement revealing that it has already formed a dedicated group who’s job is to study the crypto industry and potential benefits of Brazil having its own CBDC.
According to the central bank officials, the team consists of 12 members that form an intergovernmental group that will assess how the CBDC could fit the national payments ecosystem, as well as what its impact could be on Brazil’s economy and the society as a whole.

Previous reports showed that Brazil spends around 90 billion reals or $16 billion annually to ensure a functional supply of cash in circulation. This amount of money represents between 1% and 2% of Brazil’s GDP.
The central bank said that the new group would examine and state how much money will be saved by issuing Brazil’s own CBDC, as well as if it will be net beneficial for the national economy.

Information Technology Department of the Brazilian central bank’s official Rafael Sarres de Almeida made a public statement, saying:
“The subject of digital currencies that are addressed by central banks has been on the research agenda of many central banks across the globe for some time. However, in 2020, there was a greater focus on an approach that was more practical.”

He added that China has already led the way by entering the final testing phase of its CBDC, but that many other monetary authorities have announced new projects as well.

In May, Ripple had a closed-door meeting with the Brazilian central bank, where officials from both sides discussed “institutional matters.” According to the bank, this meeting included its president Roberto Campos Neto, Ripple’s CEO Brad Garlinghouse, as well as three other representatives of the crypto firm. However, but no other details have been provided on the specific topics of the meeting.

Categories
Forex Videos

The Next Financial Crisis Is Brewing! How Can We Profit From This Debt Bubble?

The next financial crisis is brewing already; this time, it will be caused by debt!

You will probably have heard the old adage that history repeats itself. We only need to look back to the 2008 financial crash, which decimated some banks and institutions, many of which had been pressured to lend more money to consumers, especially in America, specifically to buy homes. Many of these mortgages were taken out by people who simply could not afford them. Some had clauses offering very low initial interest rates, which ballooned after a few years, which centers around the time of the crash in 2008. These were subprime mortgages, and these bad loans were the spark that lit the fire, which became an inferno.
This lending culture was not restricted to mortgages. Banks were competing against each other to lend money to consumers for everything including renovating or extending homes, car loans, holiday loans, white goods, and other consumer household products. Banks were simply throwing money at consumers. The result was a mountain of debt, which caused a recession in the west. Some banks, including Lehman Brothers, which was founded in 1847, and the 4th largest U.S. investment bank at the time, went under. Many other banks such as the Royal Bank of Scotland and Bradford and Bingley and the Alliance and Leicester came very close to bankruptcy and had to be bailed out by the U.K. Government.

Move on to the 2020 coronavirus epidemic, and we find ourselves in a post-2008 catch-22 position. Companies that have seen growth hammered by the coronavirus, including airlines, car manufacturers, hoteliers, and the entertainment industry, including bars and theatres, have all seen their incomes throttled as a result of the continuing virus. Restrictive legislation and fears by consumers of returning to any kind of normality before a vaccine can be found means one thing: these companies and individuals are being artificially propped up in the form of Government debt. It is either that or there will be carnage in the form of bankruptcies, increased unemployment and people failing to meet their mortgage payments, which will have a potential knock-on effect to those banks providing the finance. Does this sound like a repeating cycle of 2008?


In trying to stop a total financial crash, the only solution which can be found by governments is to issue more debt, which is tantamount to stoking up the fire with more debt. The west is not yet in a situation to offset the need for this debt by economic growth, which is the only way to achieve it properly in economic terms.
Companies that are struggling to survive are borrowing more debt from banks to prop up their companies in the hope that earnings will pick up soon. This increases their debt burden and the longer the virus continues the more it increases their chance of going under.


With a mountain of corporate debt growing in the West, this curtails central banks from increasing interest rates, which is what the Fed did after the 2008 crash, as things return to normal because this could cause companies to fail to be able to meet their debt obligation payments. This is another catch-22.


But, with the virus still in in the grip of Europe and America and much of the world, we are unlikely to see strong economic growth for the foreseeable future. Certainly, the increasing spat between the United States and China is not helping the situation. With the West generally bashing at the door of China over the issue of the Hong Kong national security bill, and Donald Trump banning Chinese owned companies such as tik-tok, WeChat and Huawei, we can expect more tit-for-tat sanctions, tariffs and bans on Chinese and American companies working in respective countries.


One thing is for sure we have a long way to go, it could be many years before things are back to what we used to consider normal. As traders, we must expect the unexpected; this will mean shocks and sonic waves exploding through the financial markets, causing volatility in the stock market and huge swings in currencies, especially the United States dollar, the Great British pound, and the euro.

The Dodd-Frank Act
In the U.S., the Dodd-Frank Act, enacted in 2010, requires bank holding firms with more than $50 million in assets to abide by rigorous capital and liquidity standards, and it sets increased restrictions on incentive compensation.

Categories
Forex Videos

Banks Actually Launder More Money Than Crypto! Are You Surprised?


Banks Launder More Money Than Crypto, a New Report States

The Financial Intelligence Unit of Mexico recently published the results of its second-ever National Risk Assessment. The report stated that the risk of money laundering in the banking sector exceeds the issues encountered by fintech companies by a large margin.

According to El Economista, a well-respected Mexican newspaper, the so-called “G7 banking” group, which consists of BBVA, Santander, HSBC, Citibanamex, Banorte, Scotiabank, and Inbursa, registers a lot more money laundering in Mexico than all the Blockchain firms combined. Brokerage companies, exchange firms, as well as institutional banking providers are also included in the report, where they have been classified as “high risk” companies.

Although the fintech sector is still considered a possible propagator of both money laundering as well as the financing of terrorism, the 2020 UIF report chose not to classify the sector. While the reasons for this are unknown, many speculate that it is because crypto doesn’t pose as much of a risk as the mainstream thinks.

During a virtual conference in Aug, an official from the UNIF mentioned cryptocurrencies, saying that the sector does pose a risk for illicit activities. He also noted that the entity still considers the technology to be a possible “emerging risk” rather than it already being a risk, as many say.
It is worth noting that Mexico’s fintech, as well as blockchain industries, have nearly doubled in size in just over two years.

Categories
Forex Videos

Donald Trump Ramps up the heat with China! Forex Traders Beware!


Donald Trump Ramps up the heat with China


Thank you for joining this Forex Academy educational video. In this session, we will be looking at for little events surrounding the ratcheting up of tensions between the United States and China.


In the ratcheting up of the tensions between the United States and China, Donald Trump sites the risk of companies such as Huawei and now TiK ToK and we-chat, which are viewed as major security risks, because the American government believes that Chinese tech firms will have back door access to United States data, including access to the American population’s personal data where they use such technology.
Donald Trump has now signed an executive order banning the use of TikTok, a sort video platform owned by Bytedance Ltd., and WeChat, which is a messenger app owned by Tencent Holdings. The order will come into effect within 6-weeks of the time of writing this article. This is almost unprecedented where such apps could be banned from use to millions of us citizens. United States citizens and American companies will be banned from doing business with either of these two firms.

In a twist, TikTok, which has global downloads predicted at 2 billion + with a valuation of 100 billion US dollars, may find a reprieve in the United States if Microsoft can secure a license to run the application in the United States, Canada, Australia, and New Zealand and where such a license may cost Microsoft between 20 and 50 billion US dollars. The idea being that Microsoft would be the only company to collate user information, stating that this would be safe Microsoft and not passed onto the Chinese government.

Tiktok, which was seen until fairly recently as a harmless video for children, has been embraced by celebrities and influencers, which has helped it attain exponential growth within the United States. However, US national security concerns that its parent company will share valuable information with the Chinese government, and the same can be said for WeChat.
While the digital market remains open in most western countries, including the United States, where are companies such as Facebook and Amazon and Google operate with few restrictions, China has blocked several US internet companies, including Google, from operating in its country.

And while Tencent lost billions as the WeChat ban hit Chinese stocks and caused the Chinese Yuan to depreciate, the fallouts could hit United States tech stocks as markets try to calculate how American tech companies and other firms in the United States are affected because some of them rely on these apps for their businesses.
The Chinese foreign ministry reacted to Donald trump’s ban by saying that America is using national security as an excuse and using state power to oppress non-American businesses.


One thing is for sure, the escalation between these two Nations can only get worse before it gets better. Traders should be looking for dips in US tech stocks and tech indices, and perhaps broad-based volatility with the United States dollar and related major currency pairs as further sanctions, bans, and potential tariffs are introduced by both sides as matters worsen.

Categories
Forex Videos

Forex Options Part 15 Delta Neutral Strategies!

Forex Options XV – Delta Neutral Strategies
The Delta

To be proficient with Delta-neutral strategies, one obviously needs to understand Delta. The option Delta can be considered the ratio of change in the option premium relative to the underlying spot price movement.
Delta’s range is 0 to100 for Calls and -100 to 0 for Puts. Thus, on a combination of options, it may range from -100 to 100. Bullish strategies will show positive Deltas, whereas bearish positions will present negative Deltas. Bullish strategies include long the underlying, long calls, and short puts. Also, short the underlying, short calls and long puts are bearish strategies.
The deeper in-the-money a strategy is, the higher its Delta (regardless of the sign). Out-of- the-money options present Delta values below 50. The farther out, the less its Delta will be. As already explained, the Delta is a proxy to the probability of an option to end in the money at expiration. An option with Delta of 10 has a 10 percent probability of being in-the-money at expiration. An option very deep in-the-money acts very similarly to its underlying. Its time value shrinks while its intrinsic value increases.
On the other hand, out-of-the-money options are almost unaffected even by a significant movement in the underlying. For example, if you were holding that option with a delta of 10, it would catch only 10 percent of the underlying movement. Therefore, a 10-Delta option is cheap, but it captures a tiny portion of market action.

Delta Features

 Are estimates of the option’s price change against the underlying changes in price
 Defines the probability of it expiring with profits
 Delimits the number of options needed to equal the movement of the asset

Relationship between Volatility and Deltas

As we have already understood, Volatility is a measure of the uncertainty of the markets and the degree to which the prices of an asset are expected to move over time. Also, Delta can be considered as the sensitivity of an option to its underlying price movement. An increase in Volatility causes all option deltas to move toward 50. For in-the-money options, Deltas will decrease, and for out-of-the-money options, Deltas will increase. Since Deltas are related to the probability of expiring in-the-money, when Volatility grows, probabilities move towards 50-50.

Volatility is a crucial element for Delta-neutral strategies, and knowing how Deltas behave due to Volatility changes and price movements in the underlying is critical.

The Delta Neutral Strategy

A Delta Neutral Strategy is a combination of securities to create a position with a total Delta of zero. It can be a combination of asset plus options or only options whose total delta summation is close to zero. The key idea is to profit from the Volatility changes while covering the position from the movement of the underlying.

Professional traders think in terms of option spreads, and they hedge their trades to stay neutral on the market direction. To them, the direction of the asset is less critical than the Implied Volatility. Implied Volatility will define when to buy or when to sell options, as it will determine if the option’s price is cheap or expensive.

The second key element is to manage the trade when needed. If the position becomes too bullish or too bearish, the trader should act without hesitation and adjust it back to neutral. The beauty of this concept is that it naturally makes you do the right thing: buy cheap and sell expensive.

Think about it. You start your options trade delta neutral. If your position goes to the bullish side after some time, it means your options betting to the bullish side gained value, whereas your bearish side lost it. What should you do under these circumstances? To move back to neutral, you should sell. Thus, you’re selling high. Imagine then that the price turns and go bearish. Then you must buy some assets to balance the position back to neutral, and you’ll do that when the price is relatively low. We can see that buying and selling come naturally from the need to balance the position, not by market timing considerations, but this happens to be the right strategy.

As with other strategies, the upside and downside break-evens must be computed to identify the profit range. The maximum profit and loss potential should be understood by a trader to see if the trade is viable, modified, or discarded. You’re not timing the market, but on mean- reverting markets such as in Forex, this strategy is quite profitable.

Usual Delta Neutral Strategies

Strategies with zero Delta include buying or selling straddles and strangles, as well as Butterflies. It can also be created by a combination of underlying and options, such as buying one lot of a forex pair and sell two at-the-money calls of the same asset.
One of the most used delta-neutral position is a Ratio Spread. A Ratio Spread involves the uneven number of options are purchased and sold. Spreads can also be combined with the underlying asset. The particular spread to use should be based on the market conditions, as we already have understood in previous videos.
Ratio spreads are attractive strategies that present a broad profit region; nevertheless, they also show an unlimited risk; therefore, the position should be observed and managed.
Our videos are an introduction to Forex options; consequently, an in-depth explanation of a particular delta-neutral strategy is left for the reader.

Categories
Forex Options

Forex Options Part 14 The Butterfly Spread!

Forex Options XIV – The Butterfly Spread

The Call Butterfly spread requires buying a Call at one strike price, selling two Calls at a higher strike, and buying one additional Call at an even higher strike level. The Put Butterfly spread consists of buying a Put at a strike price, selling two more Puts at a lower strike, and buying an extra call at a strike below the written Puts. The Butterfly ratios are always 1:2:1 or a multiple of it. The purpose of a Butterfly spread is to profit from the high volatility of assets in a trading range by collecting option premiums. Butterfly Spreads are a specialized, statistically-based strategy. To improve the chanced of success, traders must consider the following.

Guidelines when selecting a Butterfly spread trade

 The underlying asset should be in a trading range, with no potential news that would disrupt the ranging state. The asset should have produced visible support and resistance zones on a daily or weekly chart. That means that assets that are trending are poor candidates.

 The implied volatility of the asset is high. The higher, the better, also considering the first guideline, of course. High volatility is required as the money comes from the two sold options, as the time premium increases with volatility. Thus, the more time premium the written options have, the better the profit.

 No more than 60 days till expiration, to help accelerate the time decay. Options with 30 days to expiration are ideal.

 The written options should be at-the-money or only slightly out-of-the-money. That will improve the chances of the asset to expire near at-the-money, where the premium maximizes.

 Make sure to trade it as a unity, avoiding market orders to sell and buy its components. A Butterfly created at optimal prices will increment the odds of making profits. The use of limit orders to guarantee you get the trade as you’ve planned is essential.

 Look to commissions also. A low-commission broker is desirable, as this trade involves trading four options.


Position management

The risk profile graph shows that the maximum profit available grows with the approach to the expiration, but also, the range of prices in which the spread is profitable gets narrower. The maximum profit is produced when the underlying’s price is at the strike price at the expiration date.

The best plan for exits is to close the spread before expiration; therefore, we have to make another four option trades. This is why Butterflies are complicated to trade. A complete trade requires eight trades in which spreads and commissions might eat all the available profit. Therefore, the trader must be alert to the best opportunity to close the position and create appropriate orders to minimize trade costs.
By good opportunity, we mean occasions where the combination of decreasing volatility and the price in the vicinity of the maximum level allows the closing of the spread at an acceptable profit.

Stop-loss

We should plan a stop-loss level in which our loss does not go beyond our projected profit to try to make sure our overall reward-to-risk ratio is at least 1:1.

Categories
Crypto Videos

Crypto News – DeFi Adoption Two Ways Ahead!


DeFi Adoption – Two Ways Ahead

As decentralized finance starts to gain ground, co-founder of Chainlink Sergey Nazarov believes that there are two ways for more DeFi mainstream adoption.
Nazarov spoke about DeFi at the Smart Contract Summit, where he said he sees two main ways the new technology “crosses the chasm” and makes more Web 2.0 companies actually adopt these technologies.
“The transition can occur in two different key dynamics. The slower path would be the interest yield. We are, at the moment, in a low-interest environment, and the appetite to combat yield will become massive. The second, faster path, is through counter-party risk. This is where the solvency of the brand-based guarantees erodes and where the math-based contractual guarantees come in. While the slow case is compelling, the fast path is scary, but we should be seeing both.”

He also added one of the exciting possibilities for DeFi, which is when people start thinking of blockchain when looking for financial products. This would effectively transition the idea that blockchain is for tokens only into something much larger. He said that the industry would eventually see investors openly talking about their crypto holdings, but that this will only happen after crypto proves that it has superior value over other financial products. Also, this is the time where people would stop holding crypto only as a means of diversification.
Nazarov noted that information, such as market data, is always essential, but stressed that privacy is as well. He pointed to its newest acquisition, called DECO. The DECO protocol uses zero-knowledge proofs and advanced cryptography to provide enhanced privacy to users.

Nazarov is a well-known crypto bull and one of the people behind Chainlink. Its LINK token saw a meteoric rise in 2020 as interest in it, as well as DeFi, is at an all-time high. Chainlink is currently holding the 5th place when it comes to crypto market cap, just recently surpassing Bitcoin Cash and Litecoin.

Categories
Forex Videos

Forex Options Part 13! Selling a Vertical Spread…


Forex Options XIII – Selling a Vertical Spread


A vertical spread is a combination of options in which the trader buys a Call or Put and sells another Call or Put of the same underlying at a different strike.
Buying a Vertical Spread
We are long ( buying the vertical spread) when we buy the at-the-money or in-the-money option and sell an out-of-the-money option. A vertical spread is a strategy similar to a naked option. The selling of the out of the money call simply lowers its cost, as the trader is aware that the price is unlikely to move above the sold option’s strike level.
Traders buy vertical spreads when they are sure about the market direction, have a target for the move, and seek to optimize the cost of the trade.

Selling a Vertical Spread

We sell a vertical spread when we sell the at-the-money or in-the-money option and buy an out-of-the-money option. This is not a market-timing strategy, but a statistically-based move. The purpose of this is to profit from the decay and volatility drop, avoiding the unlimited risk of a naked option.

It is well known that the sellers make the majority of the money on options trading. That is because options will lose all its premium at expiration. Over 60% of all options that are out of the money expire worthless. This fact gives option sellers an advantage. The downside is that naked options involve the assumption of unlimited risk. The selling of an out-of-the-money option and the simultaneous purchase of a further out-of-the-money option solves this issue. This strategy allows traders to profit from high volatility and market-timing situations such as market tops and bottoms.

Key factors to maximize the trade potential of a vertical spread

  • The implied volatility is in the upper range, historically, the higher, the better to maximize the amount of premium received.
  • Identify support and resistance levels on the underlying’s price action, and sell the option whose strike price is at or beyond that level ( so that the chance to cross it is minimized).
    Sell the call with a delta of 40 or a put with a delta of -40. That way, the chance of the option to expire in the money is below 50%, while the premium is still acceptable.
  • Choose options with less than one month to expiration to make the time decay more pronounced
  • Look for the situation where the volatility of the sold option is higher than the one you intend to buy.

Market timing

Option writing can be used in place of option buying to take advantage of a market-timing strategy when volatility is very high. Inexperienced traders usually make the mistake of buying naked options to profit from the market movements without caring for volatility, losing money, long-term, because the more expensive the cost is, the larger the movement of the underlying to compensate for the costs of the trade. Furthermore, a posterior drop in volatility will further reduce the options’ value, hurting the naked position.
The best alternative to option buying when you believe the underlying is going to move in a determined direction and volatility is high, is selling a vertical spread. When you have reasons to believe that the market is going to rally or remain flat, you may sell a vertical put spread, usually called “Bull Put Spread.” Conversely, if you consider the market is going to fall, flat, or with limited movement, you may decide to sell a vertical call spread, called “Bear Call Spread.”

Position management

To optimize the profits, you should look at your strategy’s risk-profile curve at expiration to determine your maximum potential profit.
Also, check the risk curves before expiration to determine how far against your position should move the market to create a loss equal to your maximum profit, and determine the level at which to cut losses. The main idea is we don’t want reward-to-risk trades below 1.

Stop-loss
  • Close the trade if the loss surpasses the max-profit value.
  • If you consider that some significant support or
  • resistance was broken and the scenario you considered for the trade is no longer valid.

Taking profits

Close the trade if your profit reaches 80% of the maximum profit potential.
The idea behind this is that holding the trade trying to get the last 20% of the profits is wrong from the risk-reward point of view, as the R/R is
RR =0.25.

Categories
Forex Videos

Forex Options Part 12… Buying a Straddle!


Forex Options XII – Buying a Straddle

Straddle buying involves buying a Call and a Put at the same time and strike. There is a variant called Strangle, where the strike prices differ. This strategy is exclusive of options, and, theoretically, allows the trader to profit from a large movement at a key level when the likely direction is unknown, for instance, on a Central Bank news release, where the moment of the statement is known, but there is no way to known the posterior movement of the forex pair.
Since the cost of the straddle is expensive ( two premiums), it shows the lowest probability of all options strategies of making profits (and even more so on strangles). Thus, the best moments to buy it is when volatility is at its lowest point, and a sudden jump can be forecasted in advance of the rest of the participants.

Thus, the key elements to be decided to use Straddles are:
There is some key market factor that makes you believe a large move is ready to occur.
The market is quiet, and the implied volatility is at the lowest extreme.
There is enough time to expiration for the market move.
The reward is equally good, no matter which direction will move the underlying. That means making the trade delta-neutral by being as close to the current spot price as possible.

The dangers

As Jay Kaeppel reminds in his book,
“The goal in option trading is to put the odds as far in your favor as possible each time you enter a trade. Paying a lot of time premium on both a call option and a put option is not consistent with this goal and should generally be avoided.”

Time to expiration

Traders usually make the mistake of buying short-term straddles because they are cheaper, but that is wrong. The asset must make a large enough movement to pay for the two premiums. Thus, it is essential to let it the time to do it. Traders must analyze equal moves historically and determine the proper time to expiration. Of course, if the expected move has to do with a determined news release, that date, plus the expected time for the posterior movement, will set the correct timeframe.
You also have to take into account that it is advisable to close the trade earlier than the last two weeks before expiration unless one of them is deep in the money. In this case, it is best to hold if there are reasons to think the move is not over.

Volatility high

When buying a straddle when implied volatility is relatively high, and, following the purchase, volatility collapses, you’ll be hurt twice because the time premium part of the price will collapse as well. Under this circumstance, the probability of making a profit is close to null.

The Opportunity

If you focus your straddle purchases on very low implied volatility, you’ll profit not only on the price movement of the underlying asset but also on the rise of volatility that will increase both the call and the put.

Exiting the trade

Stop-loss

The best way to cut losses is to plan the trade so that the premium is low due to the low implied volatility. But, besides this,
You can plan to close the trade if it has not made profits before the last two weeks before expiration, since after that, the time premium decay accelerates its decline.
Cut your losses to a determined amount or percentage, for example, 50% of the total price paid. Let it go until expiration if you’ve decided that the premium is your risk. The downside is your position size will be smaller than if you choose to cut your loss at 50% of the cost.

Taking profits

There are several methods for taking profits.

  • Locking-in profits after the position doubles its value, by selling 50% of the position ( it requires to being long several straddles, of course), and trailing-stop the rest of the open position.
  • Setting a profit target, based on the technical analysis of support/resistance of the underlying.
  • Just use trail stop all the way.
    There is no guarantee that these approaches to stop-loss and take-profit will improve results. Still, it is important to have planned all the trade details to avoid emotionally driven errors.
Categories
Forex Videos

Forex Options Part 11… Buying a Calendar Spread!


Forex Options XI – Buying a Calendar Spread

The Calendar Spread is a strategy only available on options. As we already know, Options on assets come with different expiration dates, and each one offers different implied volatility levels. What’s more, at times, they show strikingly different values. Traders can use this situation to take advantage of the disparity by selling the option that trades at a significantly high price and buying the cheaper one.

The main factors for using calendar spreads are:
The written option should trade at least at 15% higher implied volatility than the option bought.
If the overall volatility is high, it is wrong to use it. It works best when the bought option shows low implied volatility.
The sold option expiry is within the next 45 days.
There are reasons to think that the underlying market will remain in a range.

A calendar spread is a neutral position that is entered by buying one option of a determined strike price and expiration month, and selling at the same time another option of the same type and strike price, but with less time until expiration than the option bought. The right time to enter a calendar spread is when the short-term implied volatility is over 15% higher than the long-term one. The higher the implied volatility of the option sold relative to the option bought, the higher the likelihood of profit.

The dangers

A significant advance or decline in the underlying makes the trade very unprofitable.
A sharp decline in implied volatility degrades the odds of a profit.
Therefore, the less time to expiration for the option sold, the better, provided it allows enough premium to have profits.

Factors to profitability

According to Jay Kaeppel, to maximize profits, we must consider the following:
Only trade a calendar spread when the volatility gap between sold and bought option is higher than 15%
Rank the volatility from 0 to 10 land trade calendar spreads only when below 6, ideally in the 1-2 range. If volatility increases on a trade entered at these volatility levels, it would return extraordinary profits, because the bought long-term option will increase much more than the short-term option that was sold.
Don’t sell options with more than 45 days to expiration.
The options traded must show deltas within 30 to 65 on calls and -30 to -65 on puts. As a rule of thumb, avoid trading options with more than one strike price from the current asset price.
Ideal markets for a calendar spread are assets moving in a trading range, where supports and resistances are clearly identified.

A decline in volatility

A decrease in volatility is the worst that can happen on a calendar spread trade. To understand why we have to remember that we sell the short-term option and buy the longer-term option. The longer the time to expiration, the higher the sensitivity of the option to volatility changes. That means a rise in volatility would result in increased profits because the option bought will increase more than the option sold. Conversely, a volatility drop would drive the trade to the losing side as the price of option bought sinks relative to the option sold.

References: “The option’s trader guide to probability, volatility and timing” by Jay Kaeppel

Categories
Crypto Videos

The IRS Coming Down on Crypto Users!

IRS Coming Down on Crypto Users

Every American citizen filing taxes for the year 2020 will have to tell the Internal Revenue Service whether they used cryptocurrencies this year, according to new drafts coming from the tax agency.
The IRS released drafts of how its income tax forms will look like for the year 2020 on Aug 19. As the draft shows, the IRS requires every American filing income for the year to declare whether or not they used crypto over the course of the year.

Early into its very first page, the new and updated 1040 form asks: “At any time during 2020, did you receive, send, sell, exchange, or otherwise acquire any financial interest in any virtual currency?”

Thoughts on crypto regulation

The founder of crypto tax software firm Cointracker, Chandan Lodha, spoke about the draft of the 1040 form, saying that “The cryptocurrency question is now the front and center on the IRS Form 1040 for 2020. This pretty clearly shows that the IRS is taking crypto taxes even more seriously.”

With an increasing number of people starting to use crypto, it is only natural that governments all around the globe would be interested in possibly taxing crypto usage. As one of the countries with the most strict taxing rules in the world, the US is a frontrunner in designing taxing forms and trying to regulate the usage of crypto.
While people may argue whether cryptocurrencies should be regulated at all, or in what way they should be regulated, it is a fact that everyone must comply with their countries’ tax policies.

Categories
Crypto Videos

Restaurant Owner Converts All Spare Cash To 𝐁𝐢𝐭𝐜𝐨𝐢𝐧 During Covid19!


Middle Eastern Restaurant Goes All-in Into Bitcoin


A Canada-based Middle Eastern restaurant chain announced that it had converted its entire fiat reserves into Bitcoin.
According to an Aug 19 tweet that came from a Canada-based Middle Eastern restaurant Tahini’s, the decision to switch its fiat reserves to crypto was fueled by the March’s crash, as well as by the Canadian government starting to provide assistance programs for businesses that were unable to stay open due to the pandemic, causing further inflation of the national currency.


With the United States and Canada constantly printing money to prop up their injured economies, Tahini’s owner Omar Hamam decided to look at the financial system as, as he said, “a game of musical chairs being played where the music will stop at some point and some people will get left out.”

Hamam then said he was concerned that the handouts that were made possible only by money printing would severely devalue fiat currency. “It was apparent that cash didn’t have the same appeal, and that eventually, with all the excess cash circulating, the currency would be worth less.”
Hamam heard people in the Bitcoin community talking about bitcoin and then looked into it. He decided to convert his company’s entire savings into Bitcoin because it “offers a better alternative to saving cash.”

Bitcoin accepted here

Tahini’s is following roughly the same financial planning strategy as MicroStrategy, which announced that it had adopted Bitcoin as its primary reserve asset. MicroStrategy has purchased 21,454 BTC for roughly $250 million last week.
The restaurant’s decision to switch to crypto received enthusiastic support from the community. Podcaster Anthony Pompliano tweeted his support, while Peter McCormack, host of the What Bitcoin Did podcast tweeted he is also considering a conversion of all his non-working capital into Bitcoin.

Categories
Crypto Videos

China Dropping USD for Bitcoin!


China Dropping USD for Bitcoin – Iron Importers Favoring Crypto Over the US Dollar

The Chinese iron ore sector seems to be completely shifting towards blockchain-powered cross-border platforms when it comes to conducting trade deals in the national currency Yuan (RMB for short), rather than using the more usual USD transactions.
According to China Economic Net, many of the world’s biggest iron miners are on board for the adoption of blockchain platforms rather than using USD as they did before. The report suggests that importers also want to adopt the up-and-coming digital yuan as soon as it launches officially, all in order to make transactions less dependent on USD.

Powered by blockchain

Ansteel Group International Economic and Trade Co., Ltd., as well as Rio Tinto Group, completed a $14.44 million cross-border settlement transaction recently. This transaction was, unlike the previous ones, powered by blockchain.
During an interview with the International Finance News, a Rio Tinto Group representative commented on the transaction settled on the blockchain:

“As early as 2014, we started conducting RMB transactions with Baosteel. In 2019, we established a port business. Now, Chinese customers have the opportunity to buy our products in small quantities from Chinese ports and pay for them in RMB. As the main supplier of individual Chinese customers, we believe that these port sales can help us better serve our existing customer base.”
Xinhua News Agency reported that in the first half of the year, RMB cross-border transactions amounted to RMB 12.7 trillion (which equates to $1.83 billion), a year-on-year increase of 36.7%.
This proves a point of China trying to move away from the US dollar and into other alternatives, with the main one being blockchain.

Categories
Crypto Videos

Grayscale Extremely Bullish on Bitcoin! The Next Bull Run Is Now!

Grayscale Extremely Bullish on Bitcoin: Bitcoin Market ‘Looks Like 2016, Before Historic Bull Run’

A new report coming from crypto fund manager Grayscale Investments proposes an argument that Bitcoin’s market structure currently “parallels that of early 2016, right before Bitcoin began its historic bull run.”
Grayscale predicts that the demand for Bitcoin will grow significantly as inflation accelerates, therefore highlighting the need for a scarce monetary commodity.
The report identifies many on-chain indicators that show growing interest in cryptocurrencies, noting an increase in long-term holding rather than short-term speculation. Grayscale also notes that the number of daily active addresses is at the highest level since 2017’s all-time highs.


Grayscale notes that the increasing dependence of the US economy on quantitative easing to simply stay afloat and that history shows that this is a difficult addiction to quit.
Despite the US dollar remaining “structurally quite strong relative to other currencies,” the report also shows that investors are constantly searching for ways to protect against the, now than ever, ever-expanding money supply. Grayscale also notes that the investors found Bitcoin to be a good a store of value and a great protection against inflation, simply due to its deflationary nature.

Grayscale cites the scoring system that is used by hedge fund manager Paul Tudor Jones and which assesses Bitcoin’s attributes against other financial assets, such as cash, gold, and others.
Quoting Jones, the report noted:
“What was surprising to me was that Bitcoin scored as high as it did. BTC had an overall score of almost 60% of that of financial with a market cap that is 1/1200th of that. Bitcoin scored 66% of gold as a store of value with a market cap just 1/60th of gold’s total value.”
Paul Tudor Jones then added that “Something appears wrong here and my guess is it is the price of Bitcoin.”

Categories
Crypto Videos

How Much Bitcoin Do You Have? Rich Dad Poor Dad!


How Much Bitcoin Do You have?’ Rich Dad Poor Dad Author Robert Kiyosaki Bullish on Bitcoin

Robert Kiyosaki, the popular author and writer of the bestseller ‘Rich dad poor dad,’ says there is no longer any time to just “think about” buying safe havens such as Bitcoin, as dollar weakness continues worsening.
Bitcoin is an essential investment as the whole world is about to face a “major banking crisis,” Kiyosaki has warned.

“Major banking crisis coming fast”

The reasoning behind his statement was, he said that Warren Buffett dumped bank stocks altogether. “WHY is BUFFET OUT OF BANKS? Banks bankrupt. MAJOR BANKING CRISIS is COMING FAST,” Kiyosaki tweeted. “Fed & Treasury are supposed to take over the banking system? Well, Fed and Treasury’ helicopter fake money’ directly to people to avoid mass rioting? Not a time to just ‘Think about it.’ How much gold, silver, and Bitcoin do you have?” he added.
Kiyosaki is a well-known Bitcoin supporter, frequently advising the public to buy and actively think about the downward trajectory of fiat currencies. The COVID-19 crisis has only exacerbated his calls to quickly exit dependency on fiat, and to start moving into safe havens such as, as he stated, gold, silver, and Bitcoin. He is not the only one openly speaking about this, as the public saw many well-known Bitcoin proponents who fear that the COVID-19 crisis responses by governments have put a nail in the coffin of already inflated paper money.

In the intervening period that started in March, macro assets crashed in a major way, but both Bitcoin and precious metals saw huge gains, fueled by the US dollar currency index hitting its two-year low.

The weakness of the USD vs. a strong stock market

One thing that investors certainly could not predict is that the traditional markets would keep going strong despite everything that is happening to the world economy. While it is true that some sectors, such as tech and entertainment, should be seeing an increase in value due to more people turning to it during the time of the pandemic, it is certainly not reasonable to think that the major indexes should reach record highs every single week.
“Fed balance sheet is back above $7 trillion, giving investors the green light for further stock market gains as S&P 500 P/E (just spell them, read them as P, E) trades in tandem with the Fed balance sheet,” market commentator Holger Zschaepitz summarized.
Meanwhile, institutions are becoming increasingly focused on Bitcoin as a trade opportunity.

Categories
Crypto Videos

BitMEX Are Now Mandating Users to Perform ID Check!


BitMEX Mandating Users to Perform ID Check

Cryptocurrency derivatives exchange giant BitMEX will be launching a user verification program starting Aug 28, requiring all its customers to complete an ID verification within the next six months.
In order to sweeten the pot and make this verification worthwhile for its customers, BitMEX is offering a trading competition that would be available to verified customers only.
BitMEX was founded in 2014 and has become one of the largest derivatives exchanges in the whole world, with one of its main features being that the platform doesn’t require user verification.

Ben Radclyffe, the Commercial Director of BitMEX, announced that all of BitMEX’s customers have to complete the new verification process by Feb 12, 2021:
“User verification has been on our checklist of things to do. We’ve been getting ready for this, as ID verification was becoming necessary in order to run a scalable, responsible, as well as a compliant platform moving forward. This is a building blockchain for BitMEX to grow and do business in the future.”
With numerous jurisdictions across the globe coming out with explicit regulations for the cryptocurrency industry, Radclyffe noted that having a user verification process will help exchanges meet new operating requirements. User verification will, as he said, allow BitMEX to better understand its diverse user base, allowing the platform to develop tailor-made products for customers.
Details regarding the large-scale trading tournament that would be available only to verified customers will be announced in the coming weeks.

It won’t take more than 5 minutes

Young woman putting off a mask of herself

According to Radclyffe, BitMEX’s verification program should take customers no longer than five minutes to complete.
Users will go through a four-step process similar to ID checks that many other crypto exchanges conduct. Customers will be required to provide a photo of an ID and a proof of address. In addition to that, a number of multiple-choice questions relating to their funds and trading experience will be asked.

Categories
Crypto Videos

Litecoin Gets its Own Visa Debit Card!

Litecoin Gets its Visa Debit Card


The first Litecoin-native Visa debit card is being launched by BlockCard.
The creator of Litecoin, Charlie Lee, said that this is their second attempt at creating a Litecoin-native card as the previous one failed: “We worked with LitePay on a debit card but ultimately failed when they went out of business.”
Lee also made a few distinctions between this Litecoin-native debit card and other cryptocurrency cards that only support Litecoin, but are not Litecoin-native:

“There are other crypto debit cards that are available today, and most of them support Litecoin. However, they only support funding with LTC. This card is natively Litecoin, so funds are kept in Litecoin until you swipe the card.”
Although Litecoiners already have the option to sign up for the card, the service itself will be available only in a few weeks. On a lighter note, Lee clarified his opinion on crypto maximalism, saying that there is no such thing as a “Litecoin maximalist”:

“I don’t think that that even exists. Most Litecoiners support and hold Bitcoin also.”
Users will be able to deposit any of the twelve most popular cryptocurrencies, including all the major stablecoins. According to Lee, somewhere around 300 users have signed up so far. In the meantime, Litecoin has continuously stayed among the top ten cryptocurrencies by market capitalization. It also has one of the biggest followings on social media.