Categories
Crypto Videos

Is Bitcoin rising because the US Dollar is falling? #correlated

.

Is Bitcoin rising because the US Dollar is falling?


Thank you for joining this educational video by forex.academy. In this video, we will be looking at the rising bitcoin and the falling US dollar.


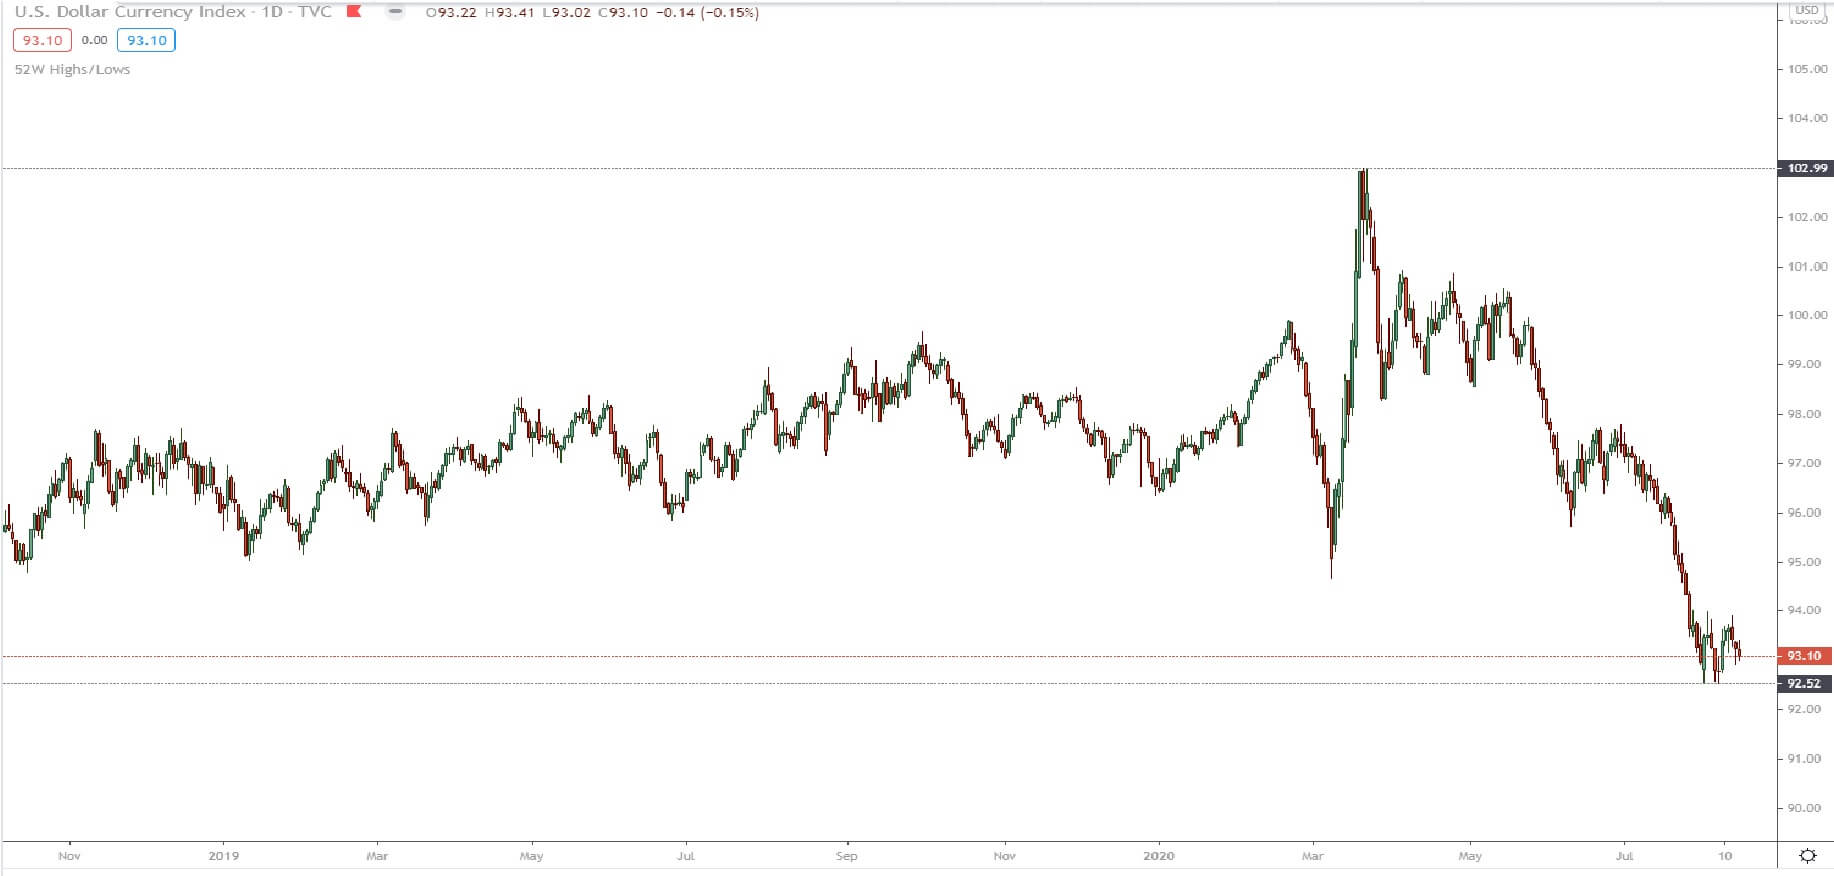
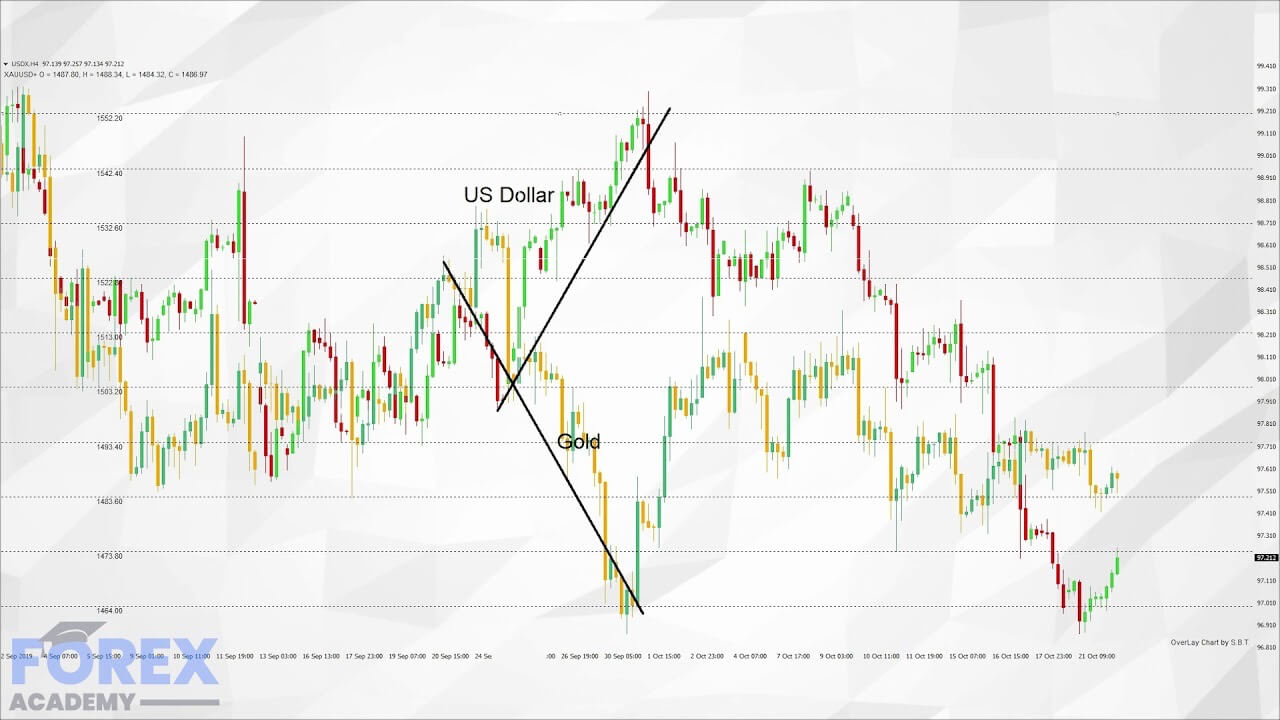
Let’s take a look at the US dollar currency index, also known as DXY, on this daily chart where we can see that at the beginning of March, there was a high of 103.00 when measured against other currencies which make up the major pairs, including the Euro, GB Pound, Swiss Franc, Japanese Yen, Australian dollar, and the New Zealand Dollar, and the Canadian Dollar, and where since then the DXY has fallen to its current level of around 93.00. this is entirely due to the American economy suffering at the hands of the covered virus.

And although the recent economic data from the United States, including upbeat retail sales and non-farm productivity for July, were better than expected, and where the initial jobless claims for August was also lower than expected, all depicting a slightly healthier economy then was forecast by market economists, the dollar remains very much on the back foot. This will likely continue until such time as the democrats and republicans agree to a relief stimulus package to aid those unemployed Americans and struggling companies.


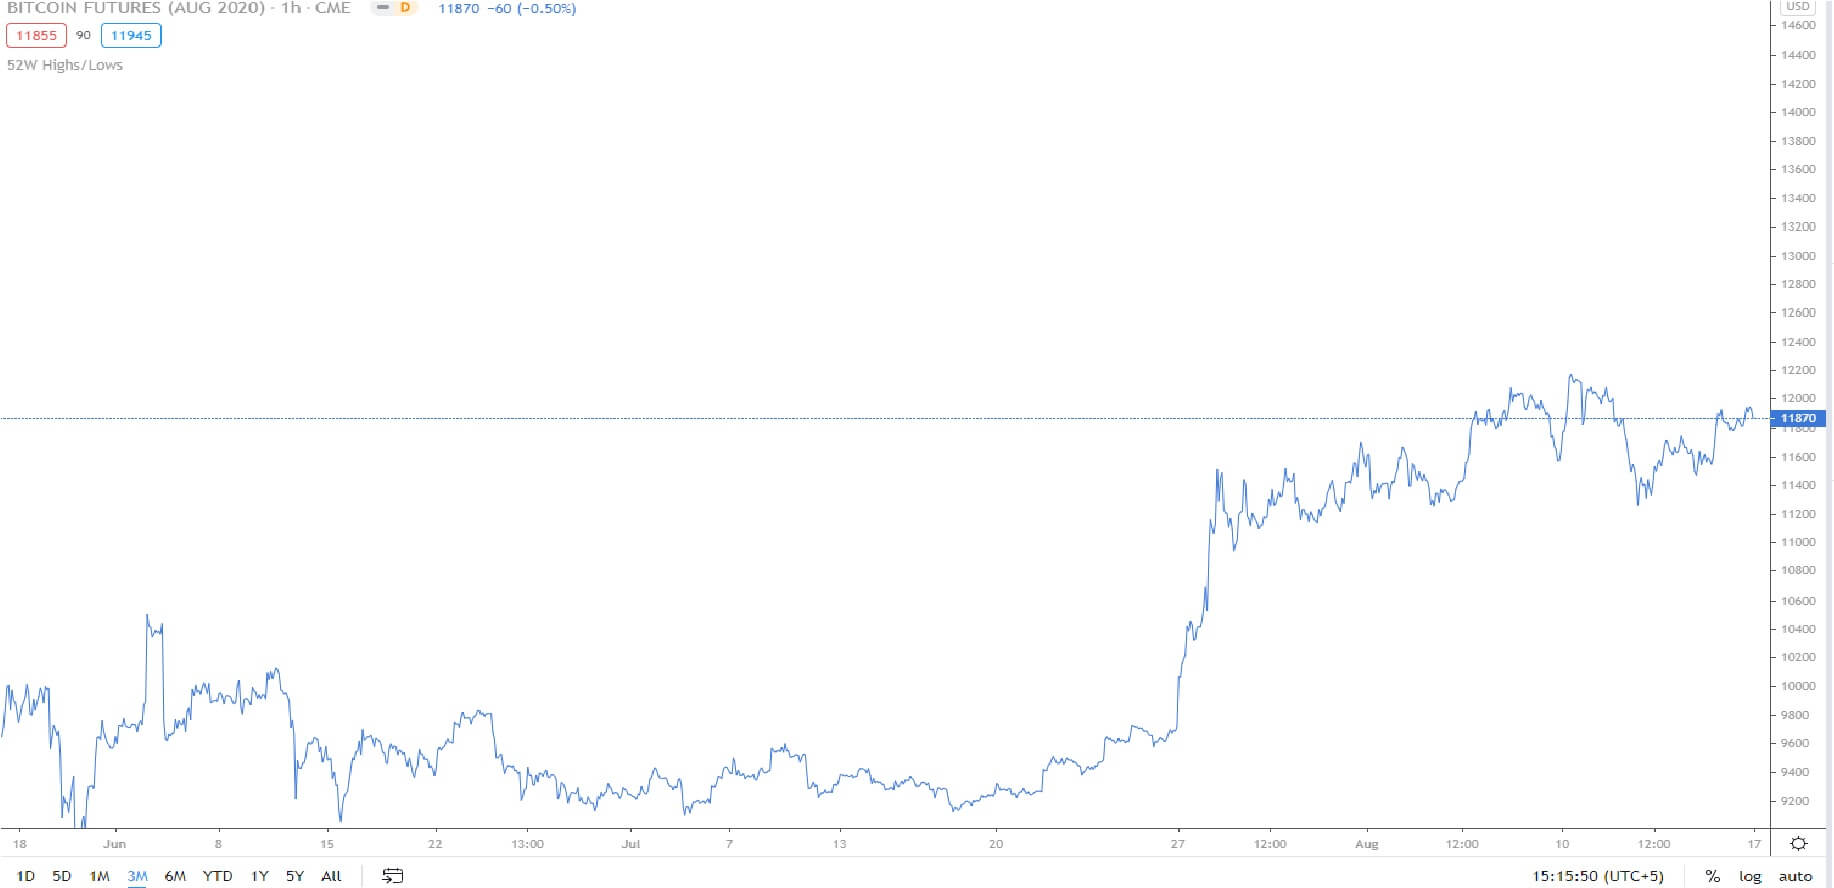
Now let’s look at this bitcoin futures chart on the Chicago mercantile exchange, or CME, going back to June of this year and where we can see that prices failed to fall below the key 9,000 to the US Dollar support area and since the latter part of July, prices have increased almost exponentially up to its current level of 11,870.
And so we can clearly see that in this extra time of market turbulence and volatility, the dollar is clearly falling, and bitcoin futures are clearly rising. Historically the markets typically do not use a correlation mechanism – in this case, a negative correlation – in order to trade one against the other. However, is that about to change?

It is a widely held belief that the highest ever spike in bitcoin to around 20,000 was driven by the fear of missing out or the FOMO effect.
However, some institutions and market analysts are fearful that the biggest single currency in the world, the United States dollar, will continue to take a battering, and that holding just one currency at such times of market turbulence and uncertainty may have inflationary pressures within the United States, and therefore there is a trail of thought is that some long-term speculators are moving out of the US dollar, even in these risky times, preferring to diversify into bitcoin, where market upside potential is possible on the basis that bitcoin has seen a previous high of 20,000 and whereby a floor seems to be established of around 9,000. This will give investors some comfort in believing that the coins will not go down to a few dollars, for example, and this will likely fuel the FOMO effect and thus the continued trend for both assets.

Categories
Forex Videos

Understanding Which Pairs Effect Each Other – Forex Hacks

Correlated Market’s – Understanding Which Pairs Affect Each Other

When we talk about correlation in the financial markets, we are looking for assets across all the financial classes, such as stocks, Forex, bonds futures, commodities precious metals and oil, etc., which trade positively or negatively against each other, either for brief or sustained periods. And so in Forex trading, we seek other currency pairs or other assets from these classes to assist us in our trading decision making, especially when we know that we can rely on correlation due to historical reliance.

As an example, in the stock market, we often find that if a major bank announcers a large loss due to underperformance you might find that there is a knock-on effect in the banking sector, causing bank stocks to fall due to the fact that the market perceives a correlated risk in this sector. This was particularly true in the 2008 market crash. Stock market traders might consider trying to counter this by buying stocks in utilities companies and firms that manufacture consumer staples, which are usually seen as more safe haven stock. In this example, traders look for positive correlation by buying utilities and consumer staples producers, and negative correlation in selling banking stocks in order to balance their portfolios.

There are many ways to measure correlation, and the larger the financial institution, the more complex measurements are used to define values in correlation, such as; Correlation Brownian motions, The Binomial correlation coefficient, Copula correlations, and others.
The basic measurement is called a Correlation Coefficient and is calculated within a range between -1 and +1. A perfect positive correlation has a correlation coefficient of +1, where currency pairs will move in the same direction 100% of the time. A perfect negative correlation is measured at -1 and means that the two currency pairs will move in the opposite direction 100% of the time. And if the correlation is 0, the two currency pairs are said to have no correlation and will act independently of each other.

We often find positive correlation within the precious metals sector, where silver will move either up or down in line with gold. An example of a negative correlation would be between gold and the US dollar. If we think about this logically, gold is valued in US dollars, and therefore for if the price of gold is rising, it stands to reason that the value of the dollar must be falling in value. Therefore some Traders will buy gold when the value of the dollar is falling and vice versa. See example ‘A.’

When looking for correlation on equities we find a positive correlation between the Dow Jones, the NASDAQ 100 and the S&P 500, and this is because these indices are priced in dollars and when the US economy is strong we would expect that these three indices are correlated positively to the upside, and vice versa when their economy is weak. Also, if the US has a strong economy and, therefore, we experience positive correlation between the indices, then we might expect this positive correlation to spill over into global equities. Again the opposite would

apply in a US downturn.
Another area we would expect to see positive correlation would be the bond market and especially when it comes to US and German 10 year treasury bonds, which typically move in sync with each other. Another positive correlation is seen in the oil markets where US, Canadian, and European oil stocks are heavily correlated, being supply-driven, and where the price is affected by the global economy outlook.

Great, so we know that correlation exists in the market and that traders use correlation to adjust their portfolios, but how can it help us in the retail Forex market? First and foremost, the fact that we know it exists already helps us because now we can use it as a tool or leading indicator in order to support our trading view of a particular currency, for example, USDCAD. This pair is heavily influenced by the fluctuations in the oil market. We can see this in action, in the example, ‘B.’

Here we have overlaid the USDCAD pair with US oil on a daily chart. The magenta trend line helps to define areas where USDCAD and especially when the price of oil is moving higher from the 10th to the 12th of June 2019, and the opposite is true between the 18th September to the 4th October 2019.
This is because a major contributor of the Canadian economy GDP is their production and subsequent sale of oil into the global oil market. Therefore when we find the price of oil tumbling, we might see the value of the Canadian dollar to fall in relation to the US dollar due to a negative correlation.

Also during the last few days, we have seen a rapid appreciation of the British pound to US dollar and whereby this rally was followed by the Euro against the US dollar which acted as positive correlation between the two pairs, and which largely came about because of positive sentiments regarding the eurozone and United Kingdom withdrawal agreement. See example ‘C.’

Where we see negative around the beginning of August 2019 and positive correlation during mid-October 2019. Correlation can be seen in the most unexpected places, such as, for example, ‘D,’ between the CHFJPY and EURUSD pairs, so it’s worth looking out for examples by studying your charts regularly.


The thing to bear in mind when it comes to correlation in the financial markets is that the markets have an ebb and flow to them, and things are constantly changing, and therefore correlation between assets should be seen as a fair-weather friend who comes and goes when they feel like it.