News Events
USD
Federal Reserve officials left interest rates unchanged, declaring inflation is close to target without indicating any intention to be near, from their gradual tightening of monetary policy.
“Inflation on a 12-month basis is expected to run near to the committee’s symmetric 2 percent objective over the medium term,” the Federal Committee said in a statement on Wednesday in Washington. “The committee expects that economic conditions will evolve in a manner that will warrant further gradual increases in the federal funds rate.”
Officials may have signalled their desire to allow inflation to surpass their 2 percent goal slightly by alluding to the “symmetric” nature of their target.
The FOMC also indicated the frailty in growth in the 1st quarter, removing the remark in the in March report that the economic outlook had “strengthened in recent months.” They weighed that out by noting the strong growth in business investments.
The 10-year U.S. Treasury notes yield slipped moderately to 2.96 percent after the release of the statement, while the S&P 500 Index of U.S. stocks climbed to its highest level of the day.
The Federal Reserve may have relieved concerns about a faster pace of rate increases at this week’s FOMC meeting, but US inflation data could hold the current expectations of a fourth rate hike during 2018. Producer price figures on Wednesday will possibly show factory prices softening slightly in April. However, the CPI is anticipated to level further on Thursday. The market expectations about the annual rate of CPI is for it to increase from 2.4% to 2.5% in April, the highest since February 2017.
The US jobs report was disappointing, however, the Federal Reserve won’t consider it important. A June hike is still by far the most likely scenario.
The main thing now will be whether Trump staves off on tariffs on the extra USD100bn-worth of Chinese imports or not. He might wish to put more pressure on China but might also hold fire as long as the talks proceed. He said on Thursday he’ll likely meet with Chinese President Xi Jinping soon.
Next week eyes will be on the speech of the Fed chairman Powell on Tuesday, PPI on Wednesday with the expectation of 0.2%, CPI & core CPI on Thursday, with the market expecting 0.3% and 0.2% respectively
AUD
It’s been a busy week at the Reserve Bank of Australia (RBA). On Tuesday, the bank announced its May interest rate decision, leaving the cash rate unchanged at 1.5% for a record-breaking 19th consecutive meeting. This announcement was followed up by a speech from RBA Governor Philip Lowe.
In his speech, Governor Lowe said the latest forecasts “should not contain any surprises, with only small changes from the previous set of forecasts issued three months ago”. However, that’s unlikely to stop markets from estimating what the changes mean, especially when it comes to the bank’s forecasting for consumer price inflation (CPI), the primary key in the outlook for interest rates.
The Australian dollar also draws down to multi-month lows this week before rebounding on higher than expected trade data. Also to watch out of Australia next week are business and consumer confidence gauges by the NAB and Westpac on Monday and Wednesday respectively, as well as the annual budget release on Tuesday, and housing finance numbers on Friday.
CAD
Canada’s economy bounced higher than economists forecasted in February, a reassuring sign the nation is fluttered to arise from a recent soft patch in growth. Gross domestic product grew 0.4 percent during the month following a 0.1 percent contraction in January. Economists forecasted a 0.3 percent gain. The gains were attributed to stalled oil and auto production coming back on line. “The Canadian economy hit a pot-hole to begin the year, but February’s GDP reading suggests that it was only a temporary bump in the road,” Royce Mendes, an economist at CIBC Capital Markets, said in a note to investors.
Most economists are anticipating the economy to grow by less than 2 percent for a third straight quarter to start 2018. The Bank of Canada speculates first-quarter growth of 1.3 percent, and the same in the second quarter, and 2.0 percent for all of 2018. Better-than-expected monthly GDP growth was one of the factors supporting the currency. If Friday’s employment report shows other solid numbers, the Canadian dollar could find a fresh motivation to strengthen. It would also inflame expectations that the Bank of Canada could raise rates at its May or July meetings, especially after Governor Stephen Poloz appeared to have a more hawkish tone in a recent meeting. Next week, all eyes will be on the employment change with the expectation of 19.5K, and unemployment rate with expectations of 5.8% on Friday
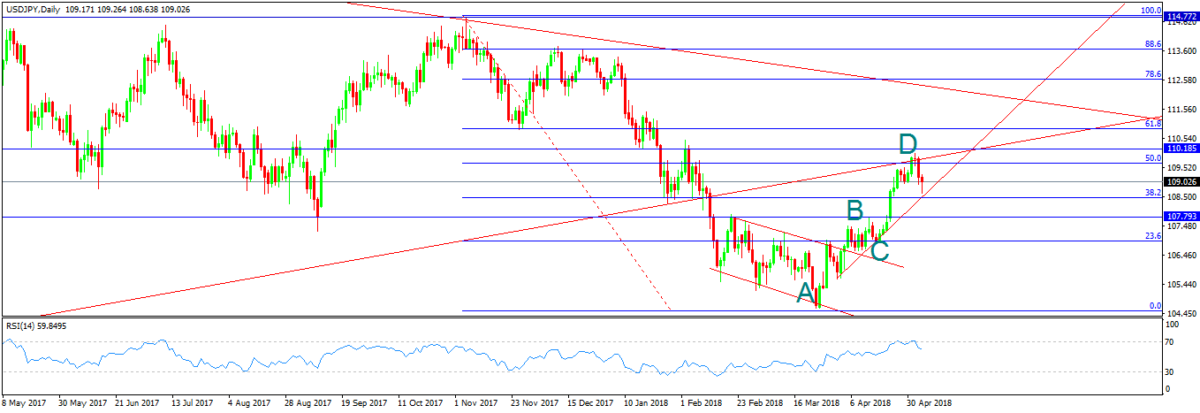
USD/JPY
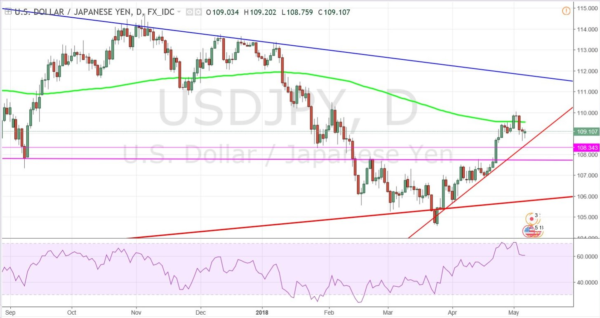
On the daily chart, the price bounced from the resistance 110 which is the same level of 50% Fibonacci level. The price had reversed from a broken upward trend line from the low of 2011 with the 200 moving average. The pair confirmed the bearish bias after forming a harmonic pattern (AB=CD), with pin bar and engulfing candle, besides overbought on RSI. If the price could break the uptrend line from the low of 2018, we can see 107.5 level
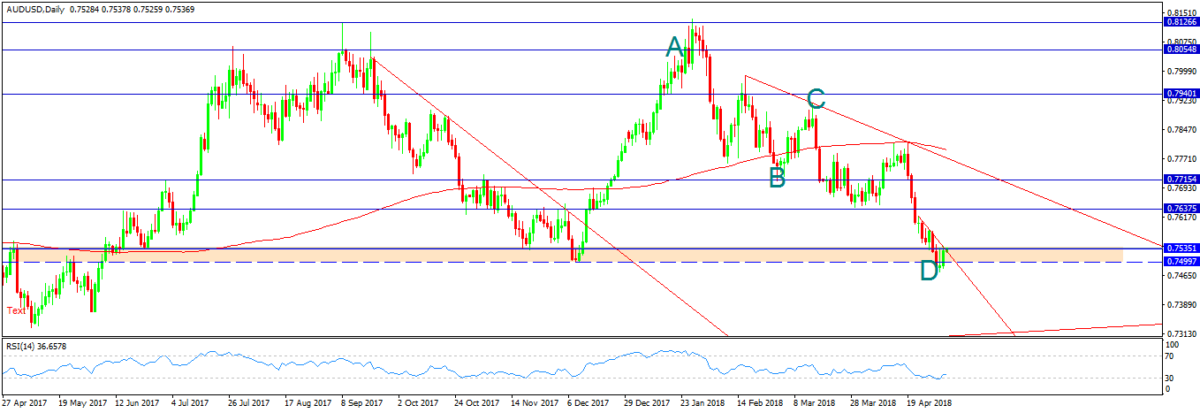
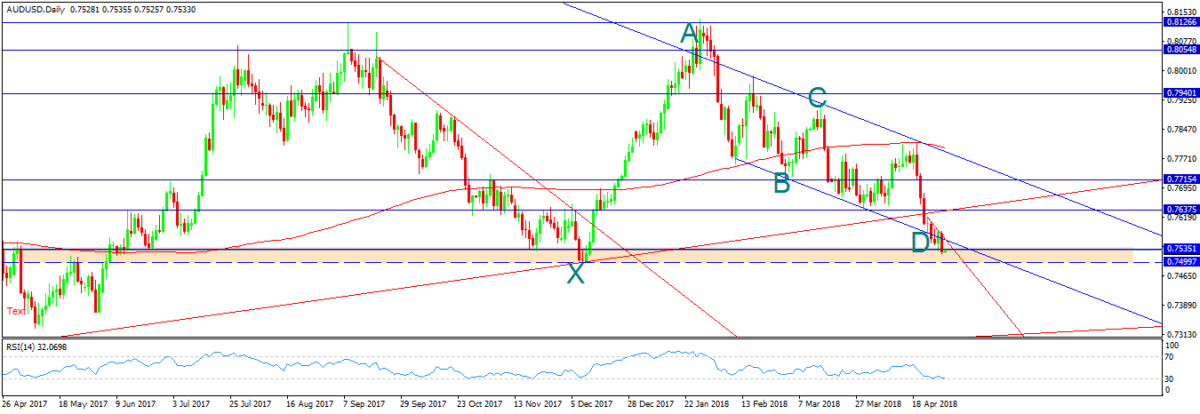
AUD/USD
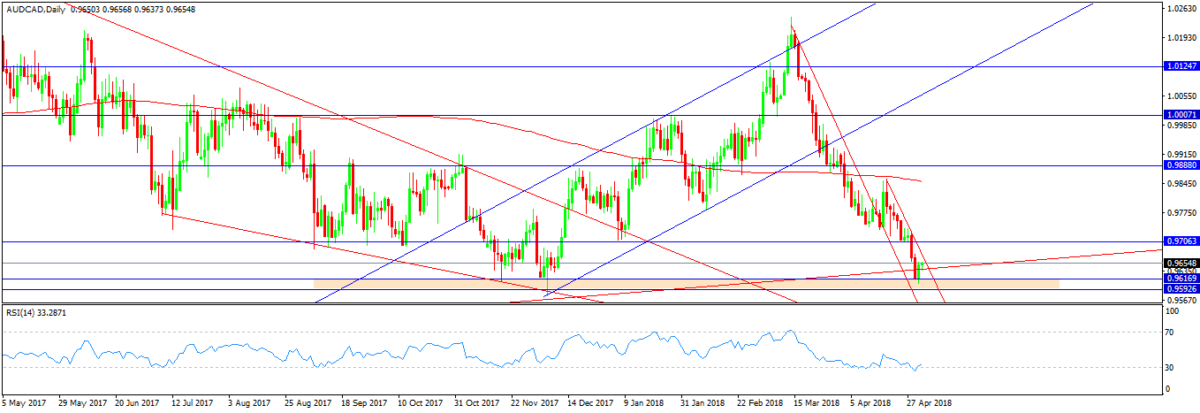
On the daily chart, it was a long bearish rally moving in a downward channel. The price has bounced from the support zone 0.7535-0.75. A harmonic pattern (AB=CD) is set to provide the correction way too. Followed by oversold on RSI & price action formula, the price is supposed to retest 0.7635.

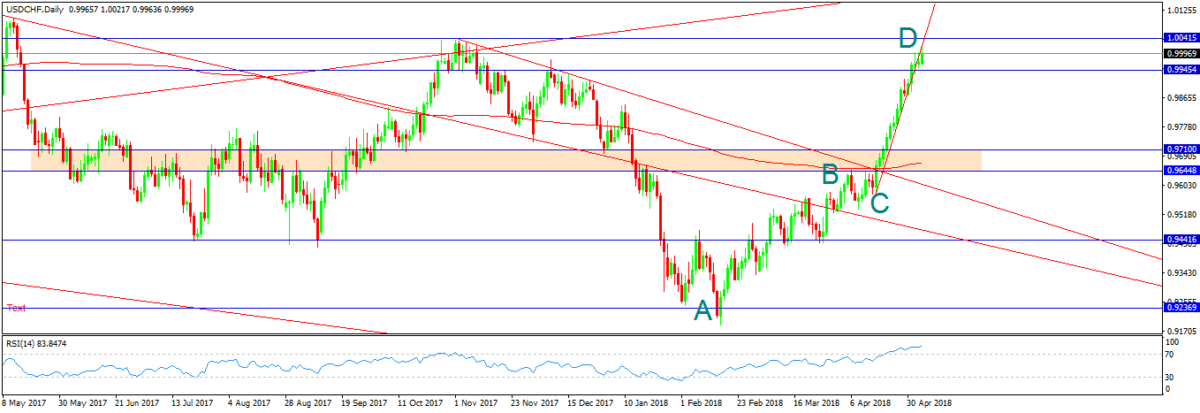
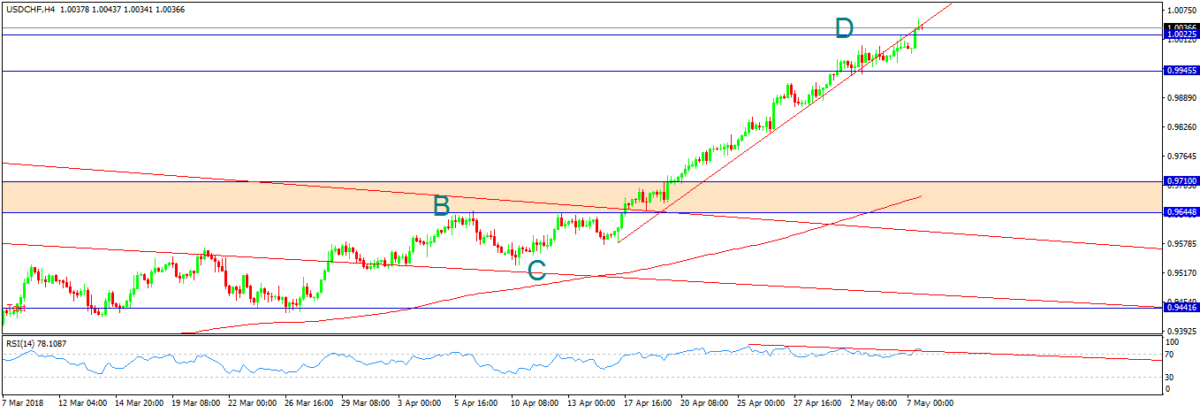
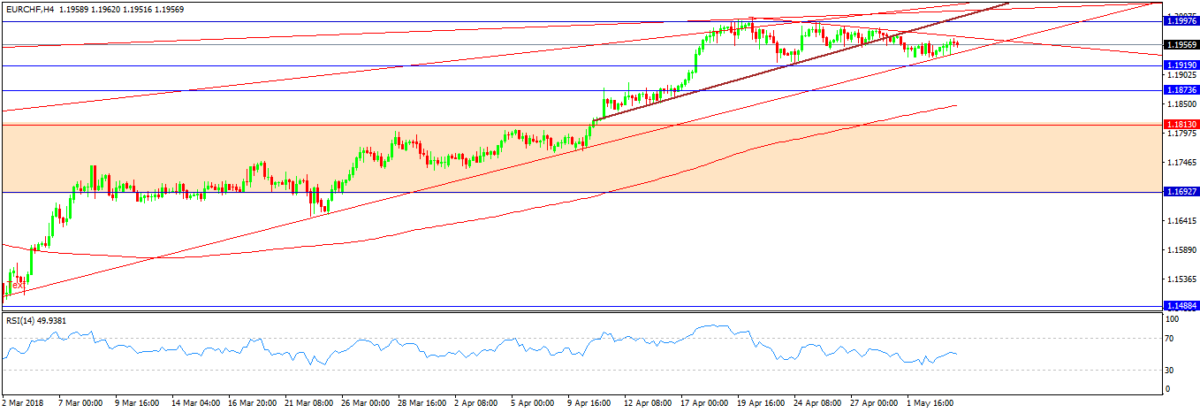
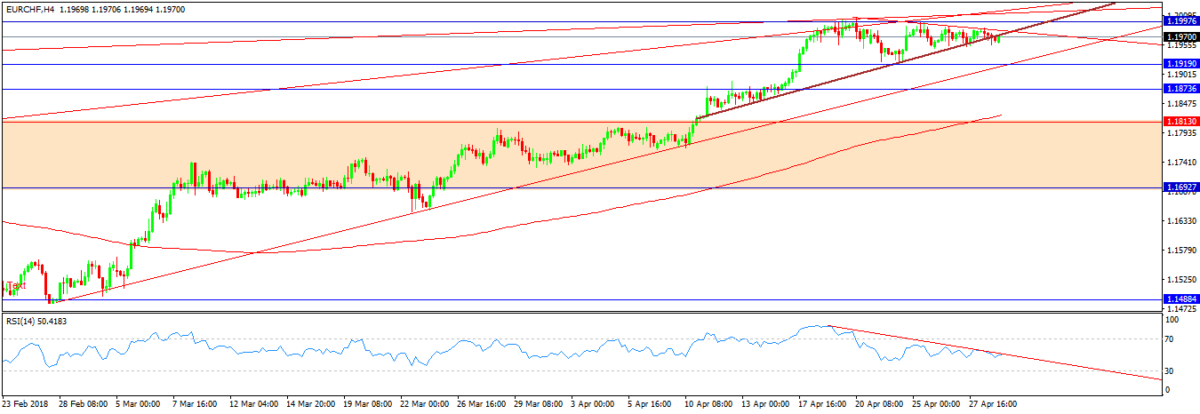
USD/CHF
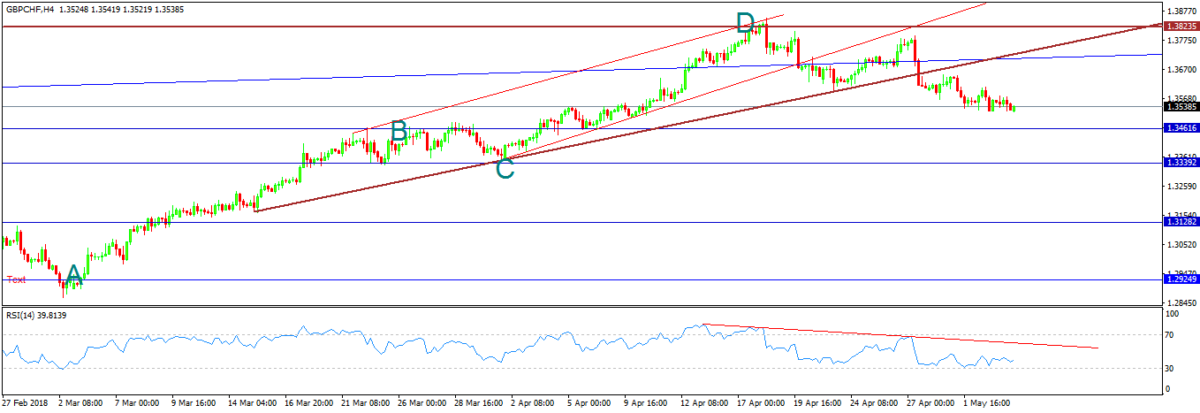
The pair had an aggressive bullish rally over the past six weeks, reaching the key resistance of 1.004. The price had made its way up to shape a (AB=CD) harmonic pattern, with overbought on RSI. If the price could bounce back from this level, it’ll possibly be seen at 0.98
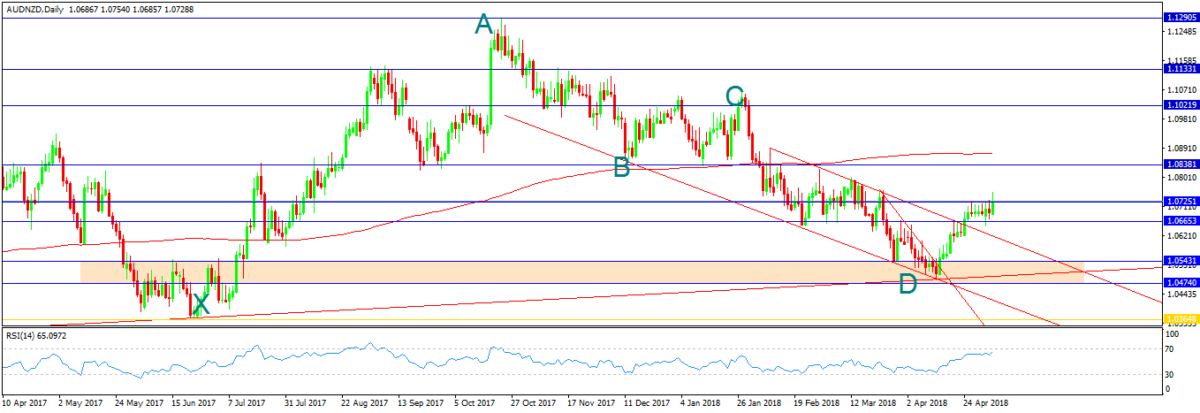
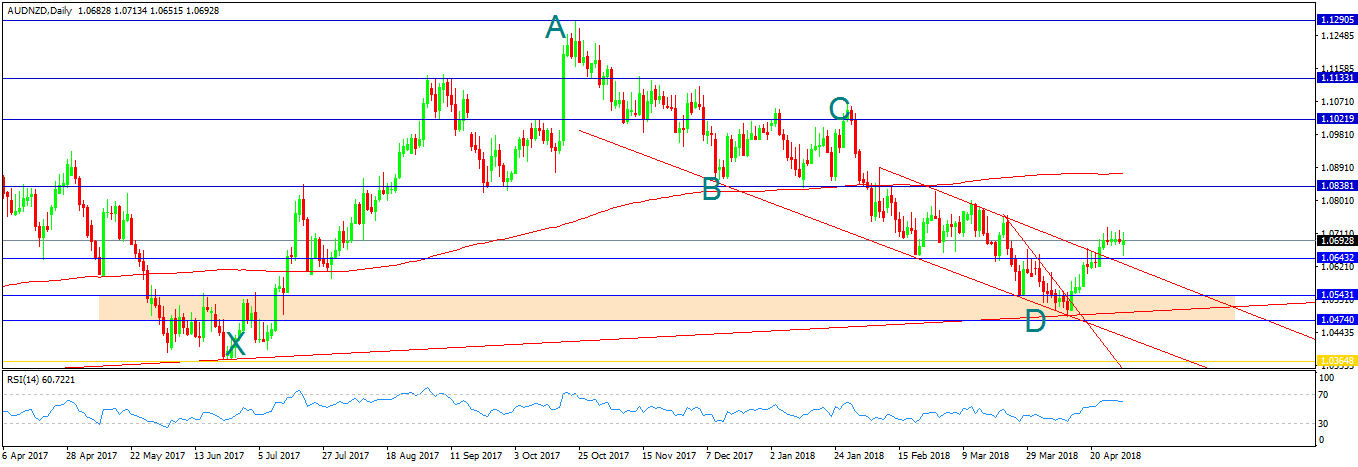
AUD/NZD
On the daily chart, the price moved according to our analysis before bouncing from the support zone 1.0475-1.0545, also breaking a lower trend line followed by a break of the descending channel. The price has formed four dojis above the key level 1.0645. The harmonic pattern improves the chance of a bullish continuation. Therefore, the price is assumed to visit 1.084.
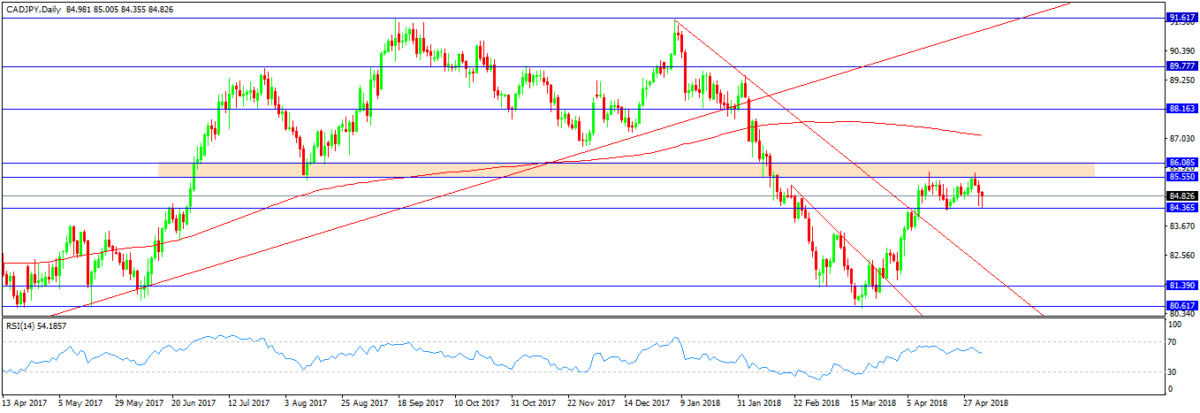
CAD/JPY
On the daily chart, the price ranges between the resistance zone 85.55-86.05 & the support 84.35. The price had shaped a double top at the previous zone but touched the support with a hammer, which indicates a return back to the sideways movement. So, any break of this zone would take the price higher to 88.15, and any close beneath the support level would show 81.4 level.
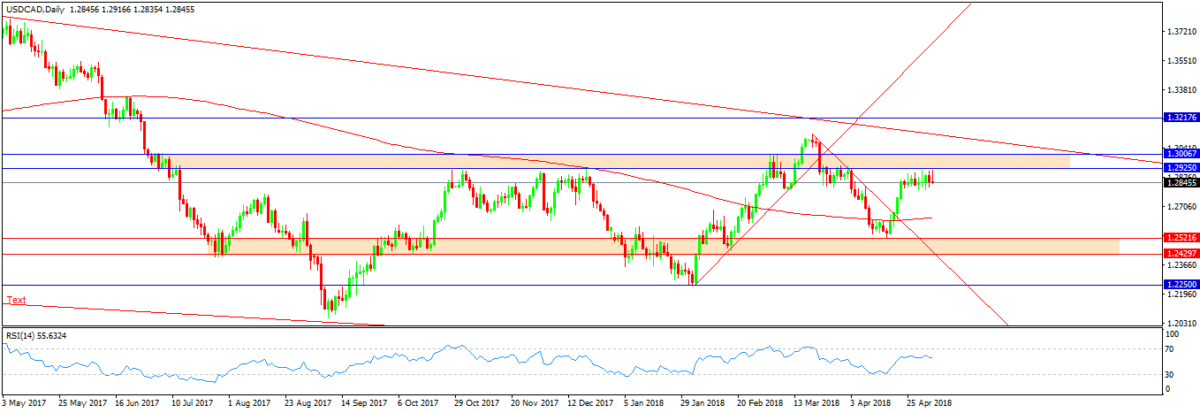
USD/CAD
On the daily chart, the pair had a tighter movement last week with not one favour of any direction. The price reached the resistance area 1.2925-1.3 and couldn’t continue its bullish rally. This level is a high obstacle as it’s located at 61.8 Fibonacci too. The price is closely approaching the lower trend line from the high of 2015. So, if the price makes a reversal action, we can see a retest for its support zone 1.252-1.243
©Forex.Academy


.")
.")


 (c) Forex.Academy


")


")


