News Commentary
A lot of events and dates are about to be released this week. Major readings that could shake the market, so, we will show the possibilities and the big moves that happened last week as well.
USD
In the FOMC meeting, the Fed showed that it would endure inflation rising above its goal for a time.
Policymakers also expect another interest rate increase would be warranted “soon” if the U.S. economic outlook remains fit.
The Fed appeared to let inflation run above the 2% target for a “temporary period”, with no rush to tighten monetary policy.
An important small edit, the Fed members, had discussed raising the interest rate by 20 basis points, rather than by a widely anticipated 25 basis points.
US Secretary of the Treasury, Steven Mnuchin, said the US trade war with China is “on hold”. Investors now hope that this particular pause will be more remarkable than previous attempts to rebalance trade tensions.
The statement also said “consensus on taking effective measures to substantially reduce” the US trade deficit in goods with China. And, China agreed to “significantly increase purchase” of US goods and services.
But Trump also called for “a different structure” in any trade deal with China, raising uncertainty over the negotiations.
This came with The U.S. Commerce Department decision that it would apply a national security investigation into car and truck imports, a move that could lead to tariffs like those on steel and aluminium in March. This made traders nervous which was obvious in the markets, to avoid risk they relied on safe havens.
China’s Commerce Ministry clarified that they didn’t promise to cut China’s trade surplus with the U.S. by a certain figure and that it hopes the U.S. implements measures promised during trade negotiations as soon as possible.
Trump also decided to cancel a planned summit with North Korean leader Kim Jong Un.
“I have decided to terminate the planned Summit in Singapore on June 12th. While many things can happen and a great opportunity lies ahead potentially, I believe that this is a tremendous setback for North Korea and indeed a setback for the world…”. Trump noted.
Two big events for the dollar next week, firstly on Tuesday CB consumer confidence, the previous reading was at 3.7% and the forecast goes higher for 3.9%.
All eyes will gaze on Friday’s monthly Non-Farm Employment Change, the previous reading was at 164K and the forecast goes higher for 190K, followed by Average Hourly Earnings & Unemployment Rate.
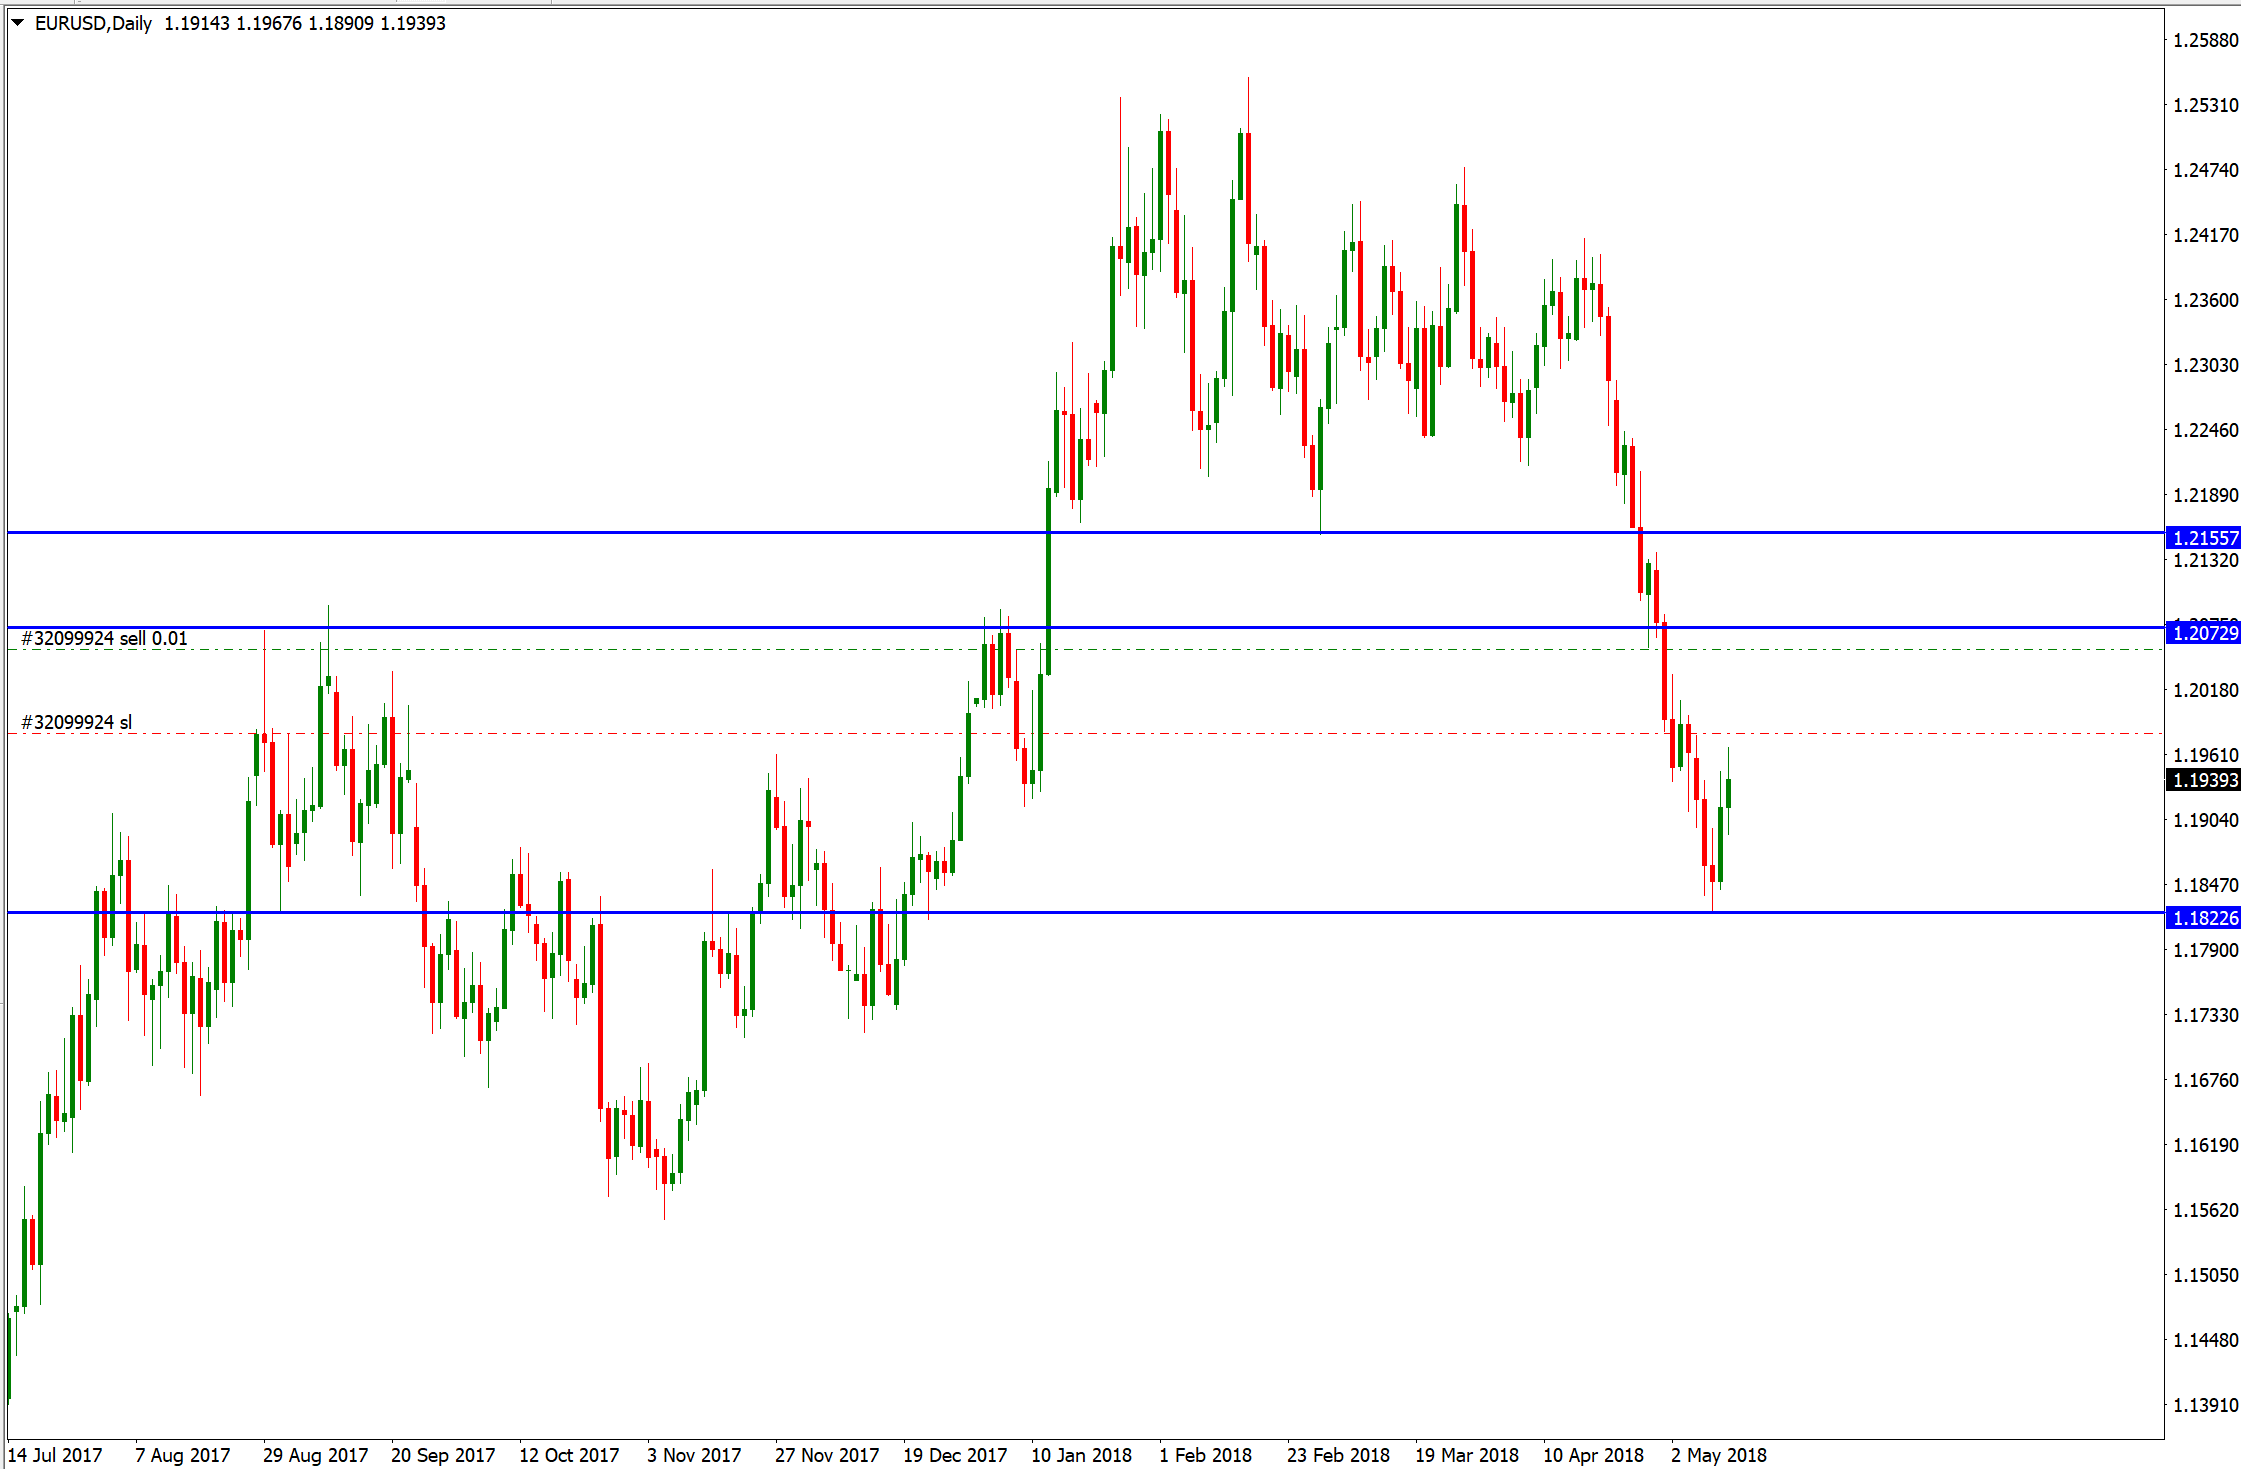
EUR
The inflation reading for May on Thursday is expected to show the 12-month CPI rate rising to 1.6% in May from 1.2% in April. The core rate is forecast to 1.0% year-on-year from 0.7% previously. The euro remains liable to additional losses if the inflation numbers indicate persistent weakness in price pressures. But if the data comes in as expected or stronger, it would add confidence to the ECB’s outlook that inflation will return to the target of just below 2% in the medium term.
GBP
The readings had witnessed a slowdown in CPI last week with 2.4%, which put more pressure on the Pound with GDP at 0.1% as expected.
PMI index fell to a 17-month low back in April. It is expected to decline further to 53.6 in May from 53.9. A weaker number would cut the possibility of a Bank of England rate hike by the year-end, which has now fallen to around 75%. The pound is also under pressure if Brexit headlines infer the UK and the EU are heading for a confrontation at the end of June with the EU summit.
AUD
The National Australia Bank pushed back their forecast of an RBA rate increase within 2018. Their next move’s expectation is now relocated from November to May 2019. That change puts them back in line with market pricing.
RBA chief economist Alan Oster announced that the “change reflects the fact there is no sign yet of stronger wages growth, and unemployment has been stuck around 5.5% for the best part of a year.” Also, he explained that once the tightening cycle begins “further rate increases will be very gradual”, and after the first May 2019 increase, the next one will be “not until November 2019”.
First quarter capital expenditure figures on Thursday will act as an intro to the quarterly GDP estimate due the following week.
CAD
With no update about NAFTA negotiations, investors began to fear as the 30-day exemption on steel and aluminium tariffs that Trump administration had given to Canada & Mexico is about to end in June.
On Wednesday, the bank of Canada will publish its overnight rate in which the BoC is unlikely to want to raise interest rates in May, even though there’s been a progress with inflation accelerating and the labour market improving since the last rate hike in January.
Followed on Thursday by the release of GDP with an expectation of 0.2%.
NZD
The Reserve bank of New Zealand has put rate hikes on hold and appears to be in no rush to raise interest rates until next year.
RBNZ McDermott has noted “Currently no prospect of unconventional monetary policies” and continued “ […] not projecting a significant decrease in the cash rate.”
This made analysts at Morgan Stanley start to be bullish on the NZD/USD, referring to oversold technical indicators.
Chart Analysis
US INDEX
On the daily chart, the price has broken the lower trend line from the high of 2017.
But the price is located at the key resistance of 94.25.
There’s a bat harmonic pattern that boosts the retracement bias for the index.
Divergent on RSI assured this possible downfall.
So, If the price bounces beneath from the resistance level, it may reach 92.6 to retest the broken trend.
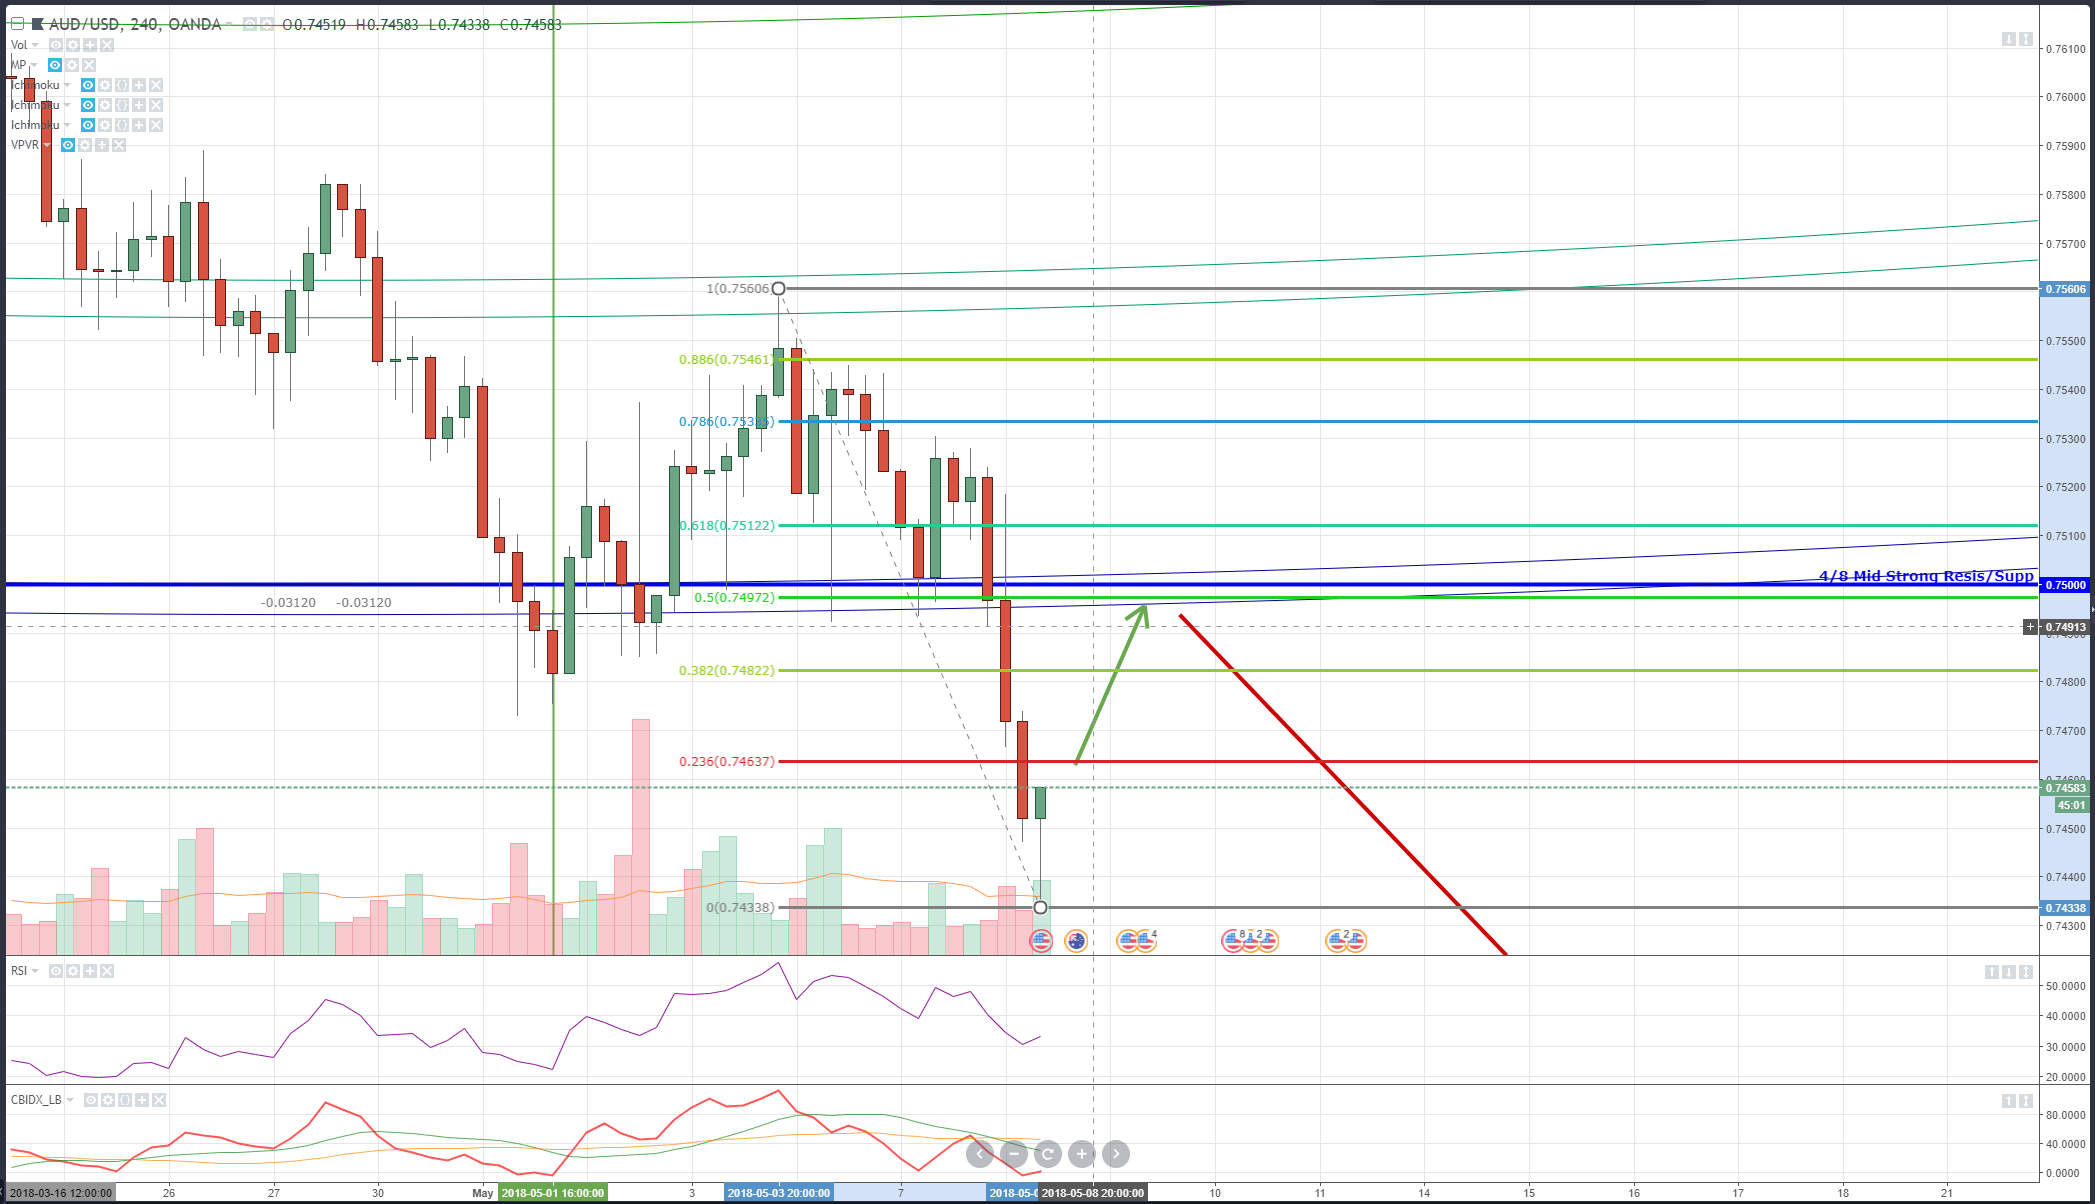
AUD/USD
On the daily chart, the price had a false break beneath the support zone 0.75-0.7535.
That enhances the harmonic pattern AB=CD, with breaking a descending channel.
The pair had risen with an engulfing candle and pulled back with a hammer, one touching the support zone again.
Along with divergence in RSI, the price is ready for the next move up to 0.774 which is a level with a combination of the lower trend line from the high of 2018 and the broken uptrend.
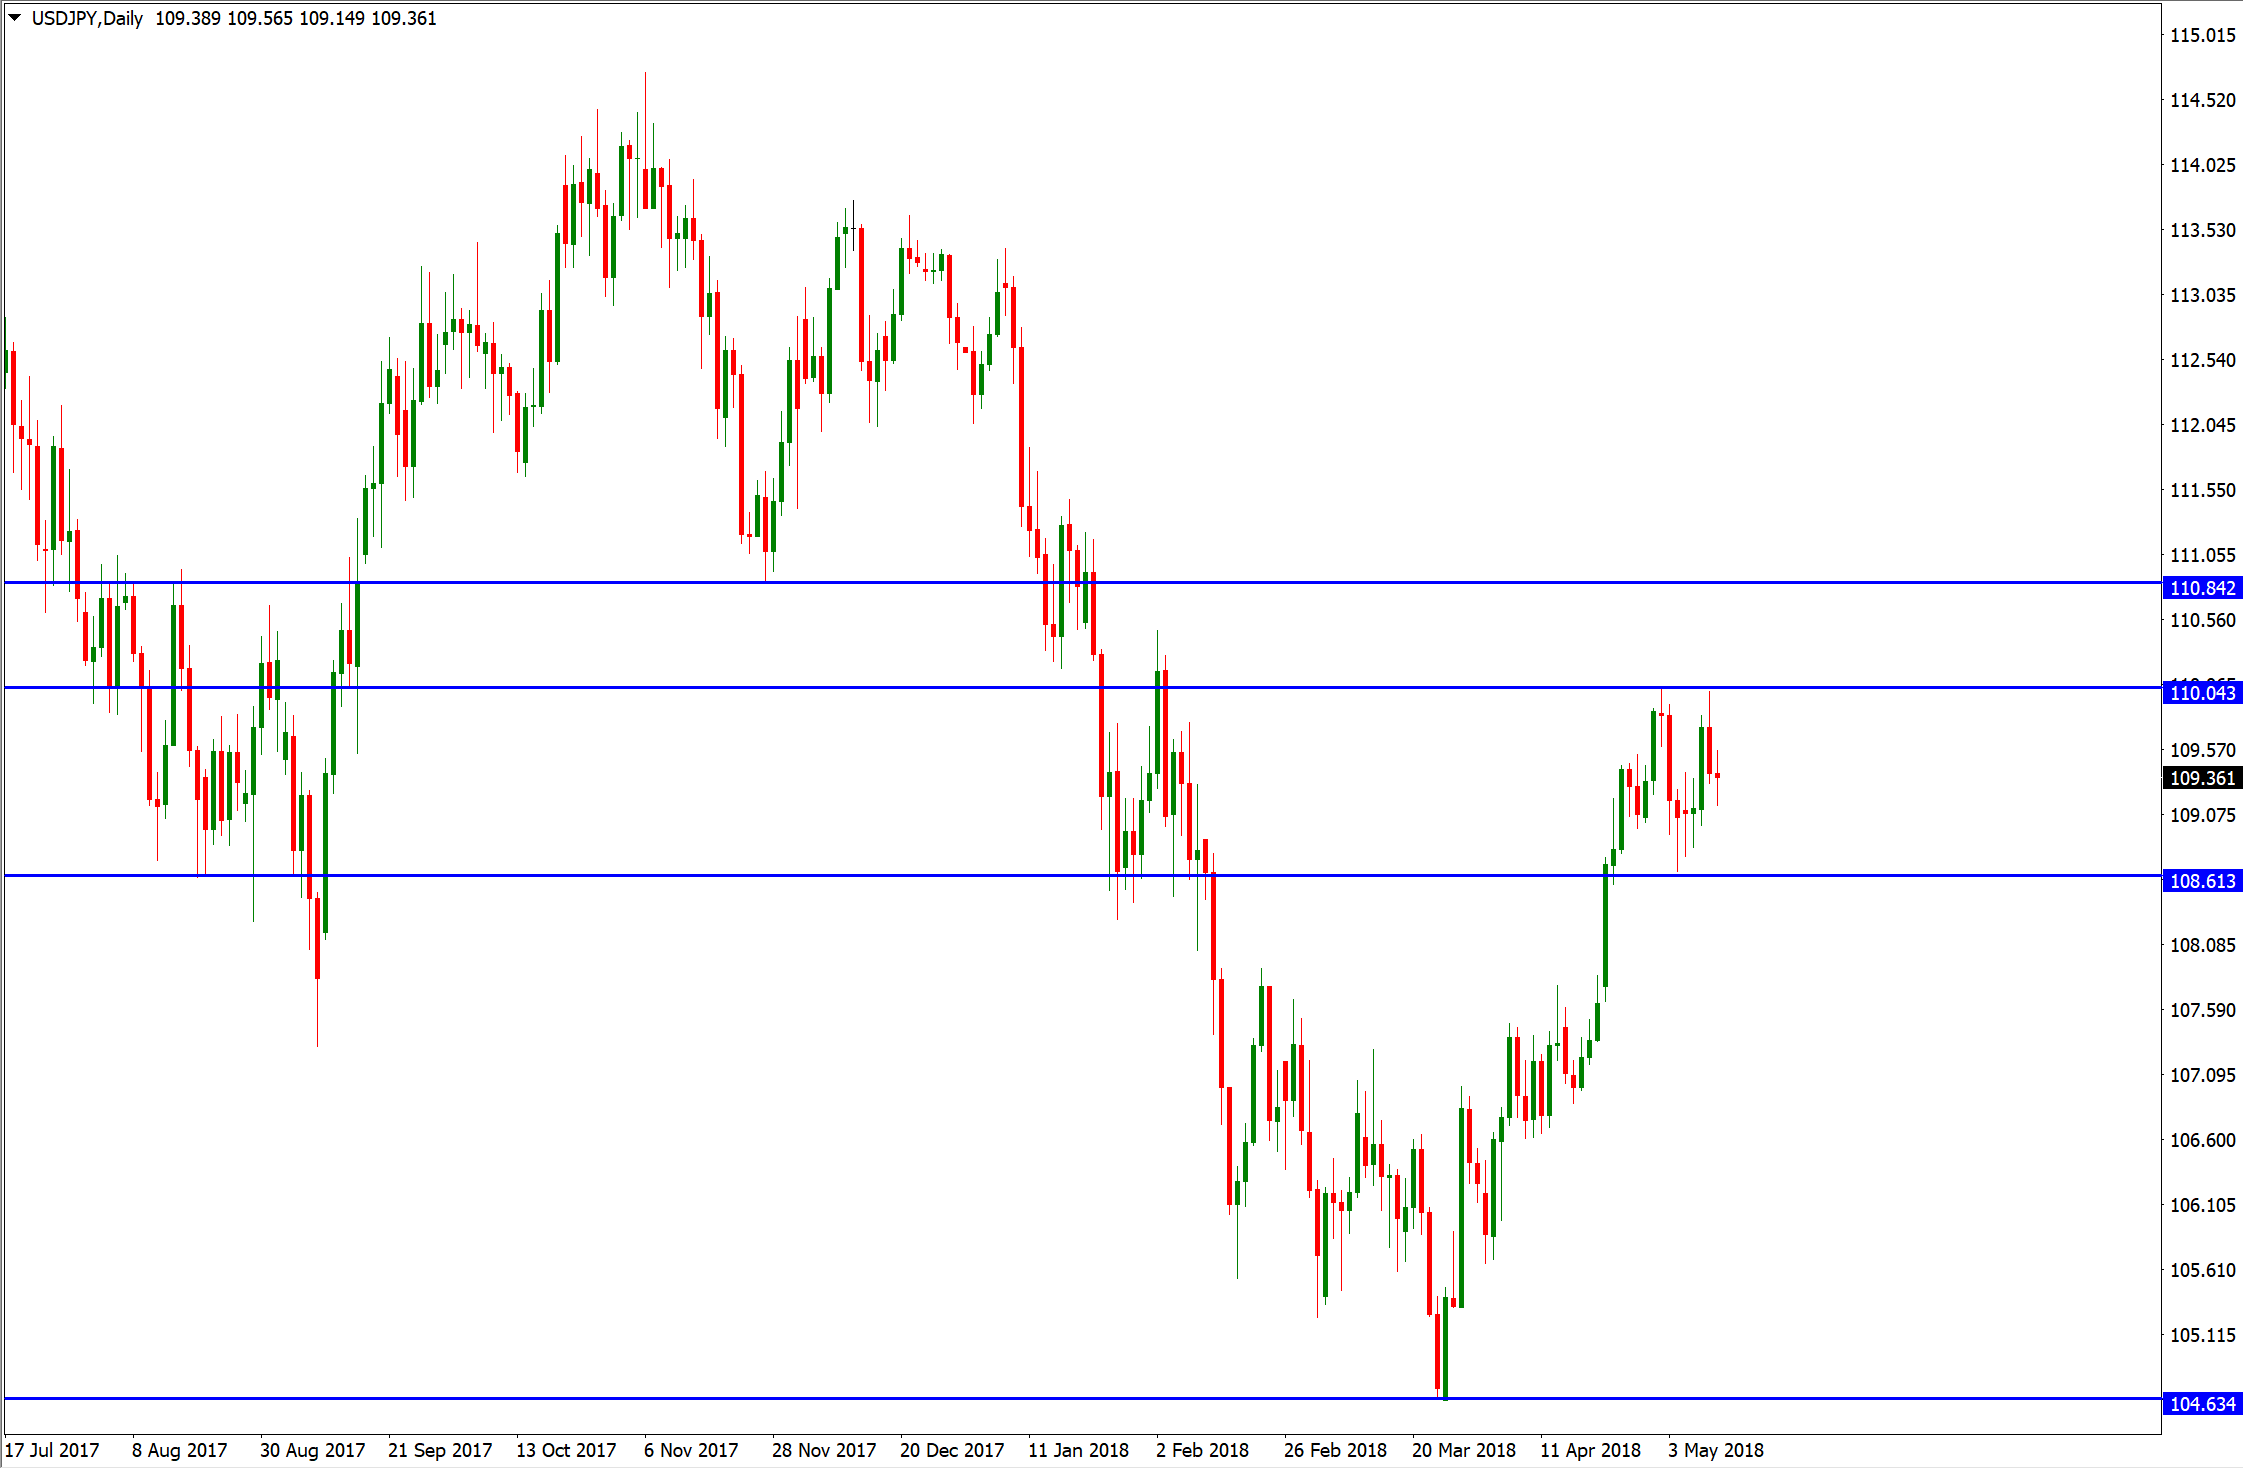
USD/JPY
The price has reversed from a very strong short-selling area, rebounding from the key resistance level at 111.1 and the lower trend line from the high of 2015, also reversing from the top edge of the upward channel along with forming an AB=CD harmonic pattern with overbought on RSI.
The price has broken the key support level 110.05 along with the ascending channel.
So, the price is supposed to revisit the support level at 1.08.15.
NZD/USD
On the daily chart, the pair had broken the upward trend line from the low of 2009, but then the price made its way up to retest the trend, with oversold on RSI.
We can also notice that there’s a descending channel that the price has already broken, along with a harmonic pattern (BAT) which is already shaped. So, we can conclude that the last break beneath the upward trend line was a false break and the pair is about to restart its bullish momentum towards the resistance zone of 0.697-0.702.
AUD/JPY
On the daily chart, as we expected, the price reached the resistance zone at 84-84.35, affected by shaping a head & shoulders reversal pattern.
The price couldn’t break through this area to bounce back.
It could reach the support levels at 81.25-80.5 to pull back up again. As the pair is currently moving sideways
USD/CAD
On the daily chart, the price had made its way into the resistance zone of 1.289-1.298, also reaching near the key resistance at 1.309.
With an approach from the descending trend line starting from the high of 2015 and the upper edge of the horn pattern.
If the daily candle closes beneath this zone again with suitable price action, it will prompt the price to be bearish to the support zone 1.2525-1.2415.