News Events
The last payrolls reading of 103k looked very disappointing, tomorrow’s forecast was set to 190K
This Job creation number is an important leading indicator of consumer spending, which accounts for a majority of overall economic activity. It is also considered to be a gauge to inflation for accelerating the rate.
Source: https://www.bls.gov/charts/employment-situation/civilian-unemployment-rate.htm
“Our great financial team is in China trying to negotiate a level playing field on trade! I look forward to being with President Xi in the not too distant future. We will always have a good (great) relationship!”. Trump tweeted to calm down the atmosphere in the trade war
On the other hand, Japan’s economic recovery has been impressive, as the economy has expanded for eight quarters in a row. However, the economy experienced a slowdown in the first quarter of 2018
The weak data has raised doubts on whether the Bank of England will increase its rates at next week’s rate meeting, with the possibility of a rate hike reaching 20%, compared to 90% at the beginning of April. Most economists expect the BoE to delay a rate hike until the second half of the year with August or November being the most likely months for a rate hike.
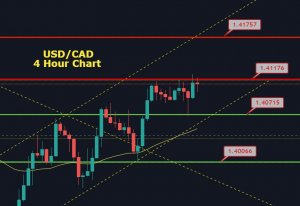
Trump announced this week that he had expanded exemptions on the tariffs for Canada and Mexico for another 30 days. The exemptions come at a perfect time, with the US, Canada and Mexico involve in negotiations a new NAFTA trade agreement. The talks have made significant progress, but the critical pact remains a stumbling block. It is likely that a tentative agreement will be repeated, perhaps later this month. The Bank of Canada has announced strong hints that it plans to raise interest rates later this year, but policymakers would like the NAFTA issue to be resolved before the next rate hike.
GBP/CHF
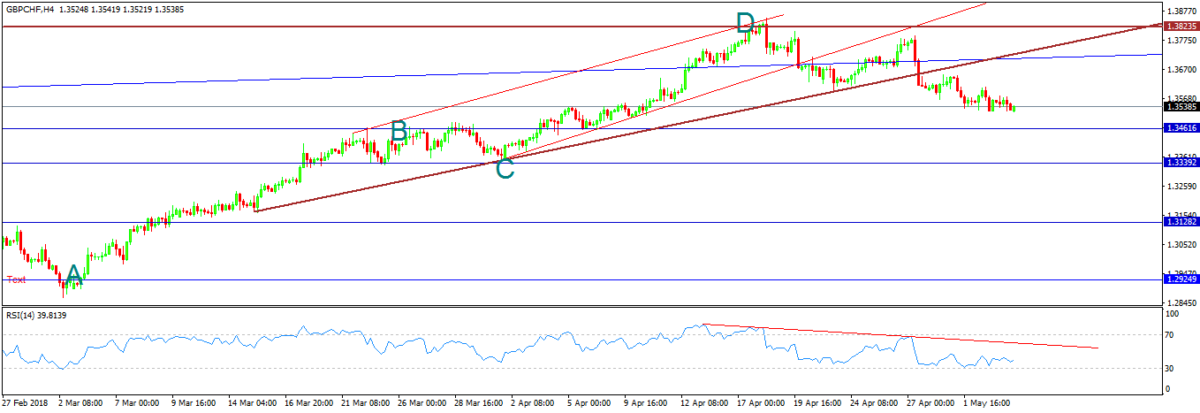
As mentioned before in our analysis at the beginning of the week, on the 4-hour chart, the price has shaped a double top reversal pattern bouncing from key resistance 1.3825. The price has then rebounded from the broken up channel, followed by breaking the upper trend line. A harmonic pattern (AB=CD) has boosted the downward possibility.
Also looking at a divergence in RSI, the price is supposed to continue its bearish movement to retest 1.346 then 1.334.
AUD/USD
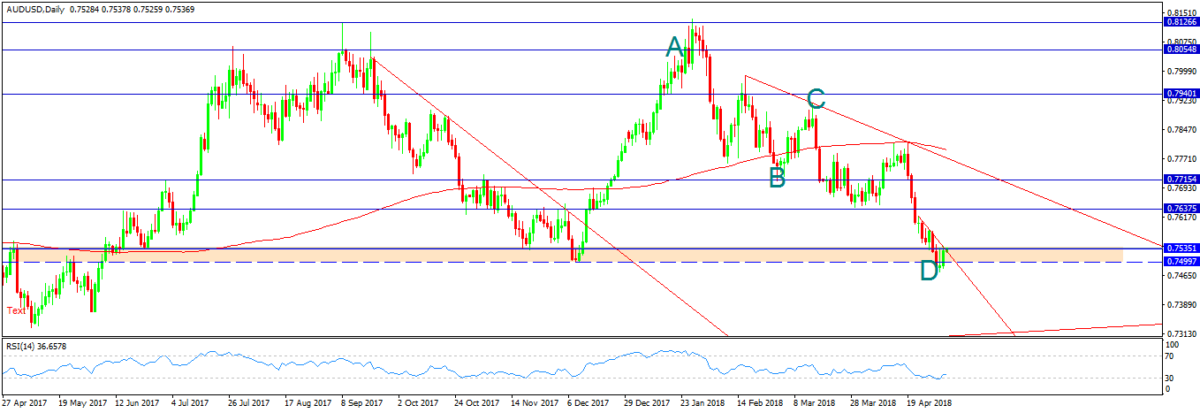
On the daily chart, it was a long bearish rally moving into a down channel. The price has bounced from the support zone 0.7535-0.75. A harmonic pattern (AB=CD) is set to provide the correction way too, followed by oversold on RSI, the price is supposed to retest 0.7635.
EUR/CHF
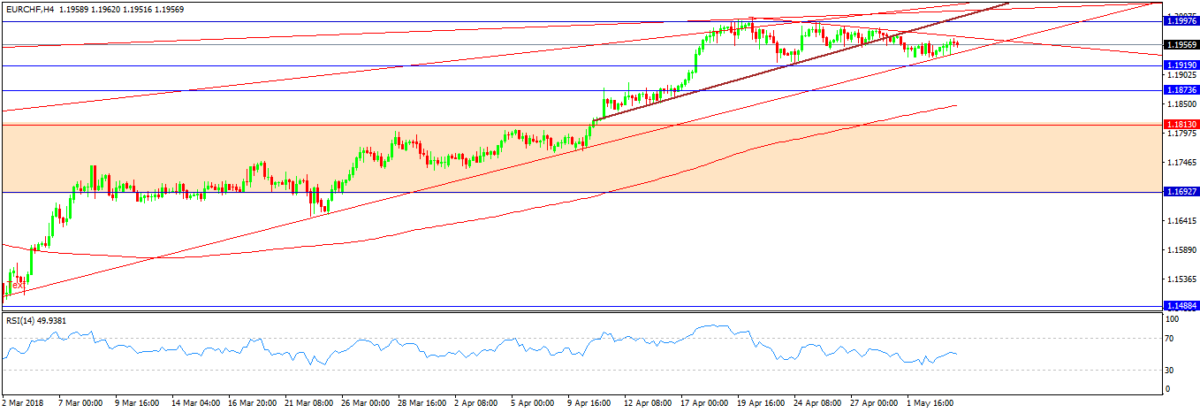
On the 4 hour chart, the price closes under the key resistance 1.2. The pair began to weaken below this level forming a triangle which has been broken down. The 1.2 level is a combination of tighter resistance (as it was a protective limit from the SNB), the broken uptrend, and the high edge of the upper channel on the daily timeframe, followed by divergence on RSI.
The price is now located at the upper trend line from the low of 2018. If the price could go further with breaking it down, we may see 1.192 level, and then to 1.187.
©Forex.Academy


