News and events
Today both the UK and the US release Manufacturing PMI reports. The poor performance of the economy in the first quarter restrained expectations that the BoE will raise rates at the upcoming May rate meeting, as a consequence of a disappointing 53.9 manufacturing PMI.
Most analysts expect the BoE to hold rate hikes until the second half of the year, with August or November being the most likely months for a rate hike.
There is a rising sentiment that the Federal Reserve will raise interest rates four times this year, although Fed policymakers continue to project a total of three increases in 2018.
The European Central Bank last month forecasted a 2.4 percent growth this year. However, some economists worry that more structural factors are at play, which could dampen future growth.
A further factor is that the impact of the European Central Bank’s quantitative easing policy may have begun to fade away. Also asset purchases have been declining from €80bn a month in 2016 to €30bn.
Eyes will be on gov. Lowe speech after declaring the rate statement of reserve bank of Australia
And also the GDP of Canada followed by the speech of gov.poloz
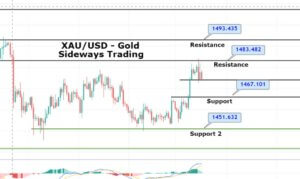
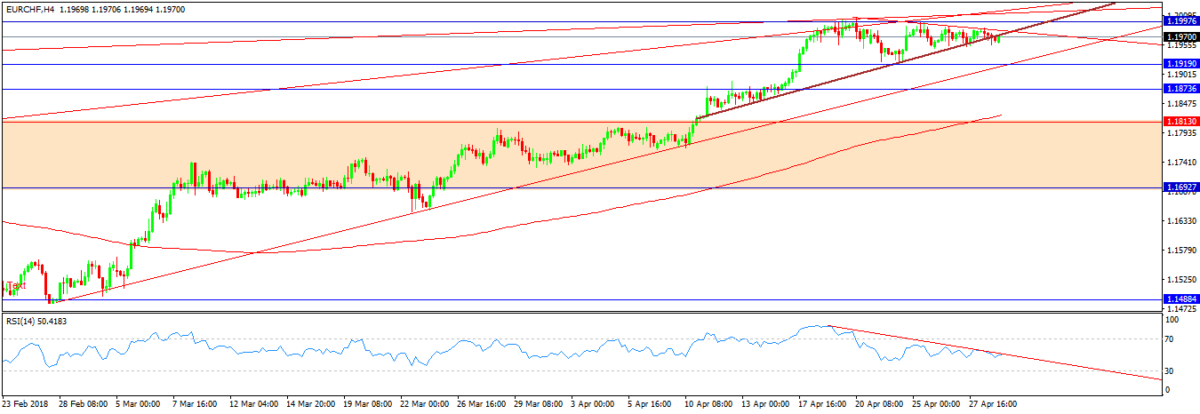
EUR/CHF
On the 4 hour chart, the price closes under the key resistance 1.2
The pair began to weaken below this level forming a triangle which has been broken down. The 1.2 level is a combination of tighter resistance (as it was a protective limit from the SNB), the broken uptrend, and the high edge of the upper channel on the daily timeframe. Followed by divergence on RSI, the price is expected to go down to 1.192, and then to 1.187
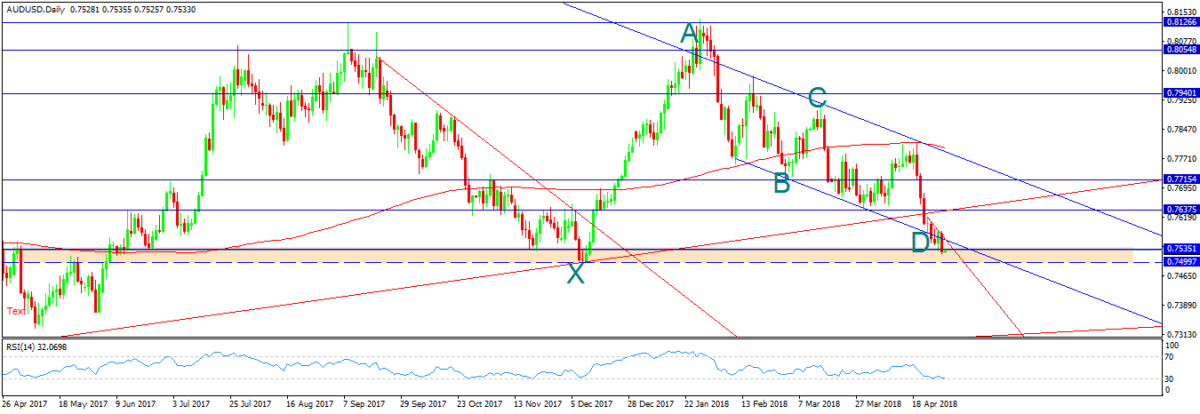
AUD/USD
On the daily chart, it was a long bearish rally moving into down channel. The price has reached a support zone 0.7535-0.75, followed by 88.6% Fibonacci level. The down channel is considered a continuous pattern for getting back up again. A harmonic pattern is set to provide the correction way too. Followed by oversold on RSI, the price is supposed to retest 0.7635
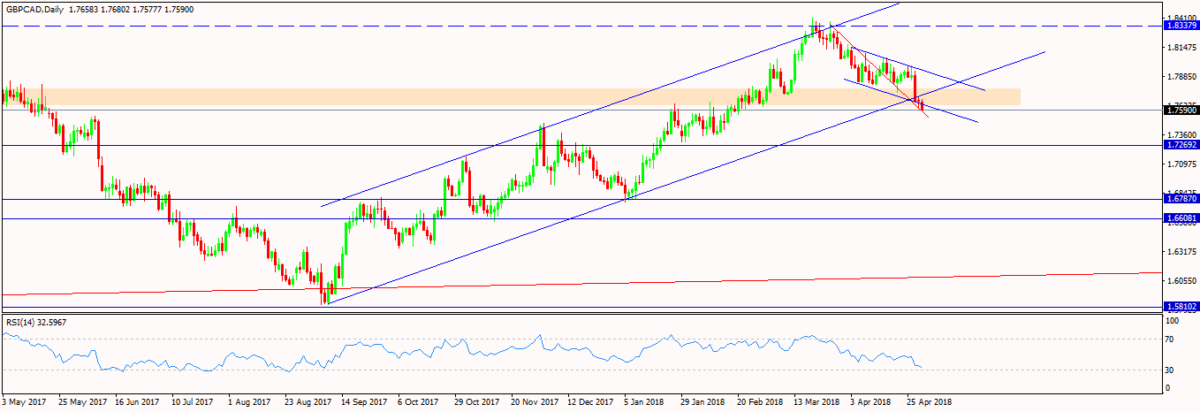
GBP/CAD
The pair is moving in an upward channel on the daily chart, reaching its lower edge. In the same level with the support zone 1.778-1.7645. The price is located too in the broken lower trend line from the high of 2018. Followed by a flag that enhances the bullish bias. So, the price is expected to get back up again to retest 1.8335
©Forex.Academy