General overview
Market Cap: $409,364,645,716
24h Vol: $30,469,124,781
BTC Dominance: 37.3%
In the last 24 hours, the evaluation of market capitalization has dropped from 438B to 404B and has found support at those levels.

News
News that came out in the last 24 hours are mostly regarding governmental relation to cryptocurrencies. Some of the headlines are the following:
US: ICO Market Is Example Of Unregulated Securities Market, Says SEC Commissioner
US Securities and Exchange Commission (SEC) Commissioner Robert Jackson highlighted consumer protection regarding Initial Coin Offerings (ICO) in an interview on CNBC today, April 30.
Source: cointelegraph
Iran: Model Of State-Issued Digital Currency Now Ready, Says Gov’t Minister
An Iranian government minister has confirmed that an experimental model of a domestic digital currency is now ready, Reuters reported Saturday, April 28.
Source: cointelegraph
US Federal Trade Commission To Offer Free Workshop On Crypto Scams
The US Federal Trade Commission (FTC) will be holding a free workshop this summer titled “Decrypting Cryptocurrency Scams” according to a press release published today, April 30.
Source: cointelegraph
Saudi Arabian Communications Ministry Hosts ‘Blockchain Bootcamp’ With ConsenSys
The government of Saudi Arabia completed a “blockchain bootcamp” last week, the Ministry of Communications and Information Technology (MCIT) announced in a press release April 29.
Source: cointelegraph
Analysis
BTC/USD
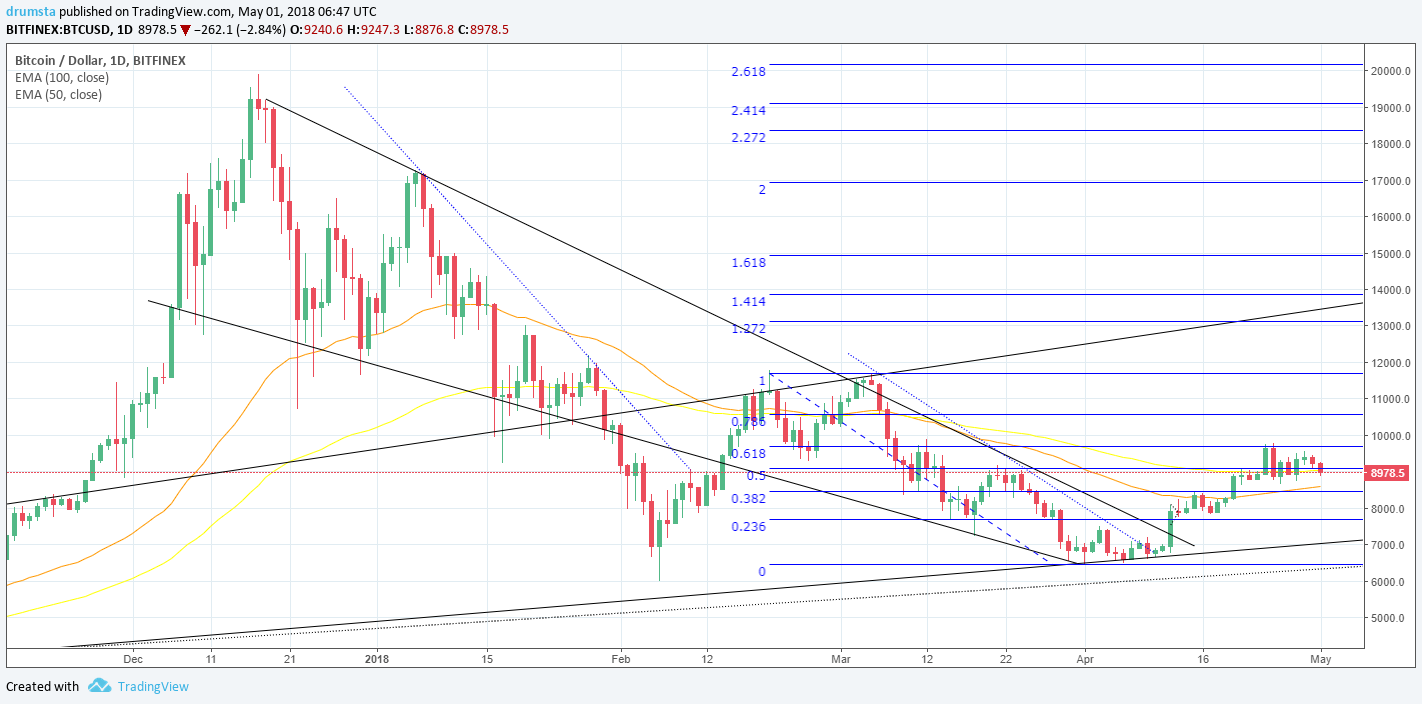
Bitcoins price dropped from 9396$ to 8975$ which is 4,58% decrease from the yesterdays opening. Cryptocurrency daily chart shows us that the price has fallen below 0.5 Fibo level again and the 100 day EMA.

Looking at the hourly chart we can see the momentum behind the drop. The price has fallen below 100 and 50 EMA and is now looking for support.
Hourly chart signals a buy, but it’s more like neutral overall.

Pivot points
S3 1793.1
S2 5135.4
S1 7188.0
P 8477.7
R1 10530.3
R2 11820.0
R3 15162.3
ETH/USD
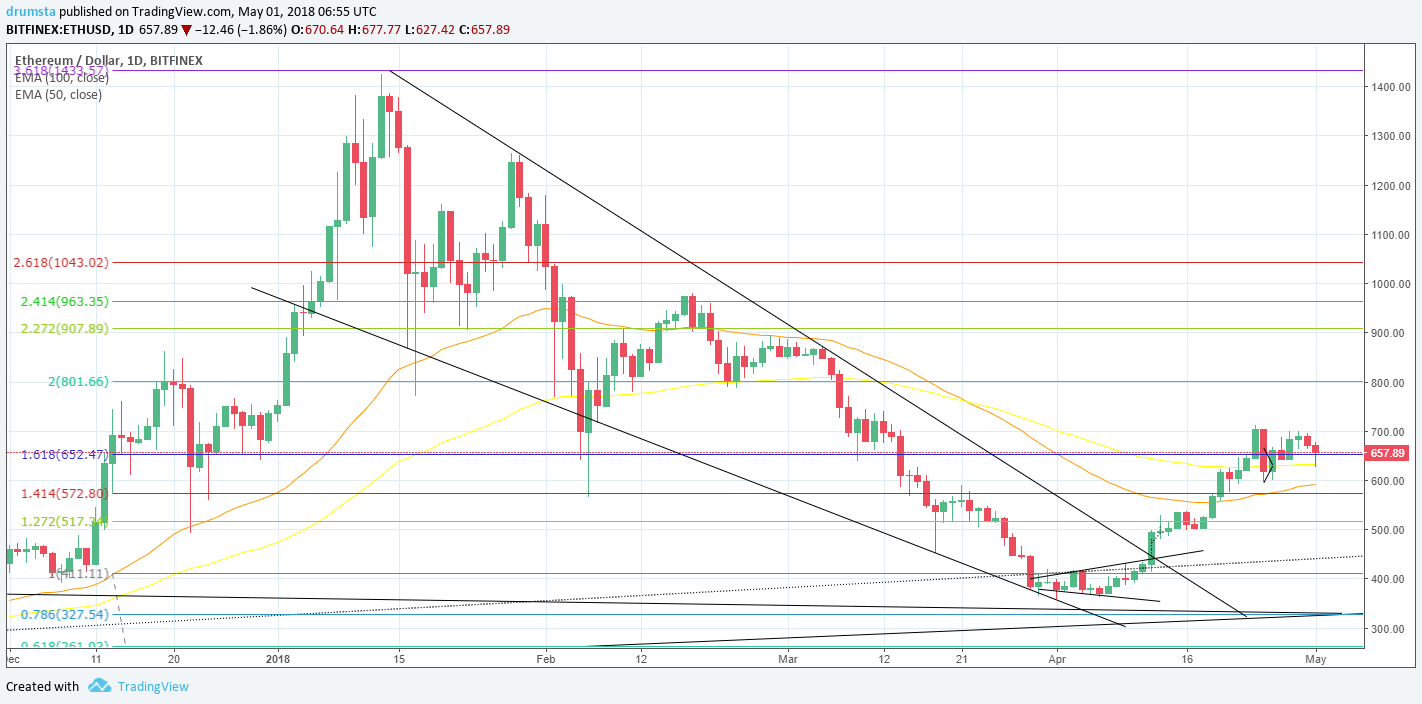
Ethereums’s price also dropped from the yesterdays opening, from 690$ to 658$ which is a 4,66% decrease. Cryptocurrency daily chart is showing the sign of struggle, as indicated by the wick. The price is above 1.616 Fibonacci level and 100 day EMA which is a good sign.
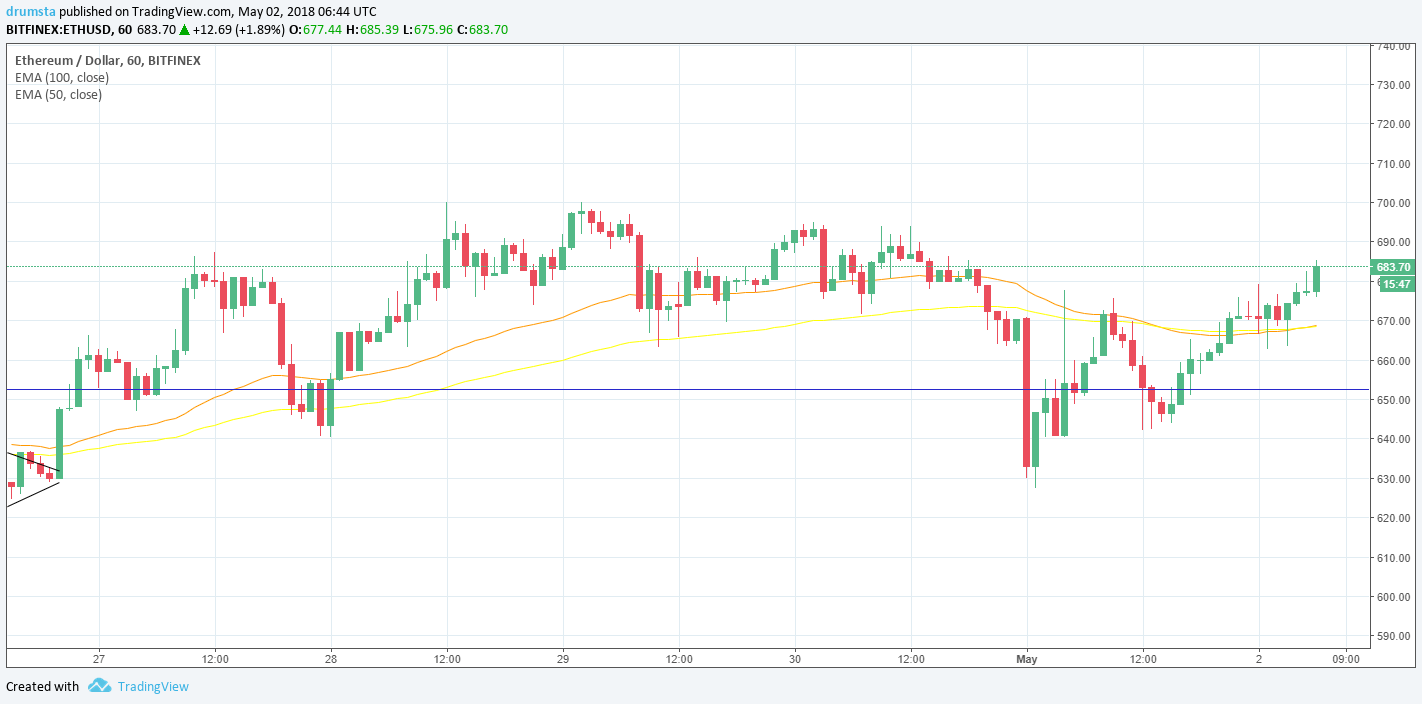
Zooming into the hourly chart we can see the wich being a drop to 632$ after the price quickly bounced back.
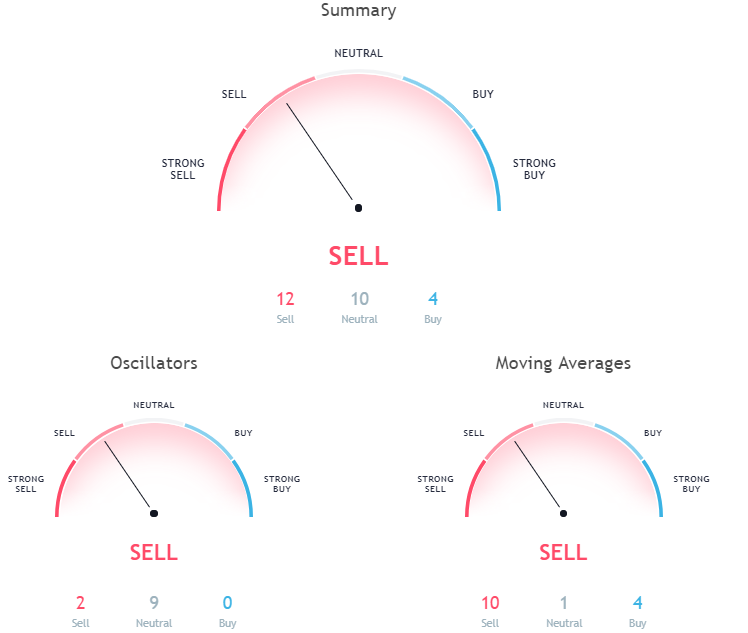
Hourly chart signal is leaning to the sell side.
Pivot points
S3 420.56
S2 541.36
S1 612.31
P 662.16
R1 733.11
R2 782.96
R3 903.76
XRP/USD
In the last 24 hours, the price of Ripple has fallen by 7% from 0.86$ to 0.8$ where it is now sitting.
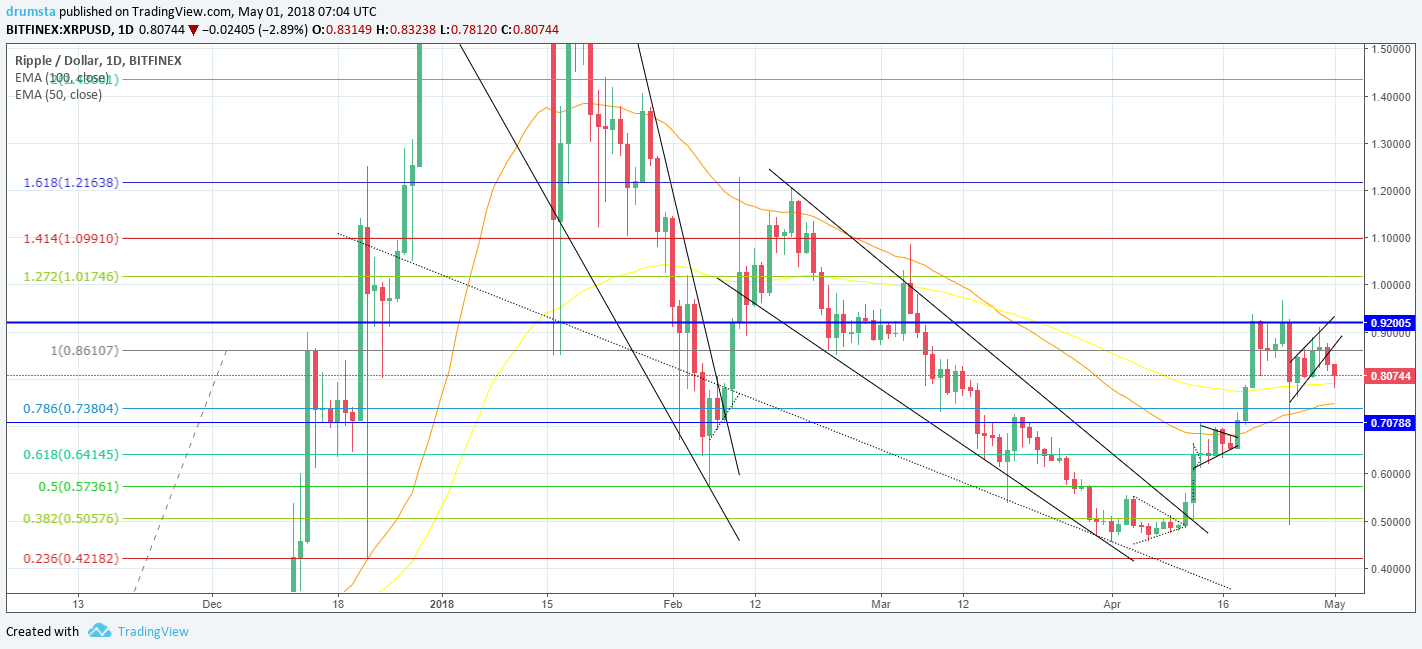
Cryptocurrency daily chart looks bearish, as the price was clearly repelled by 100% Fibonacci level. The price hasn’t fallen below 100 EMA, it touched it and quickly bounced of it as seen from the wick.
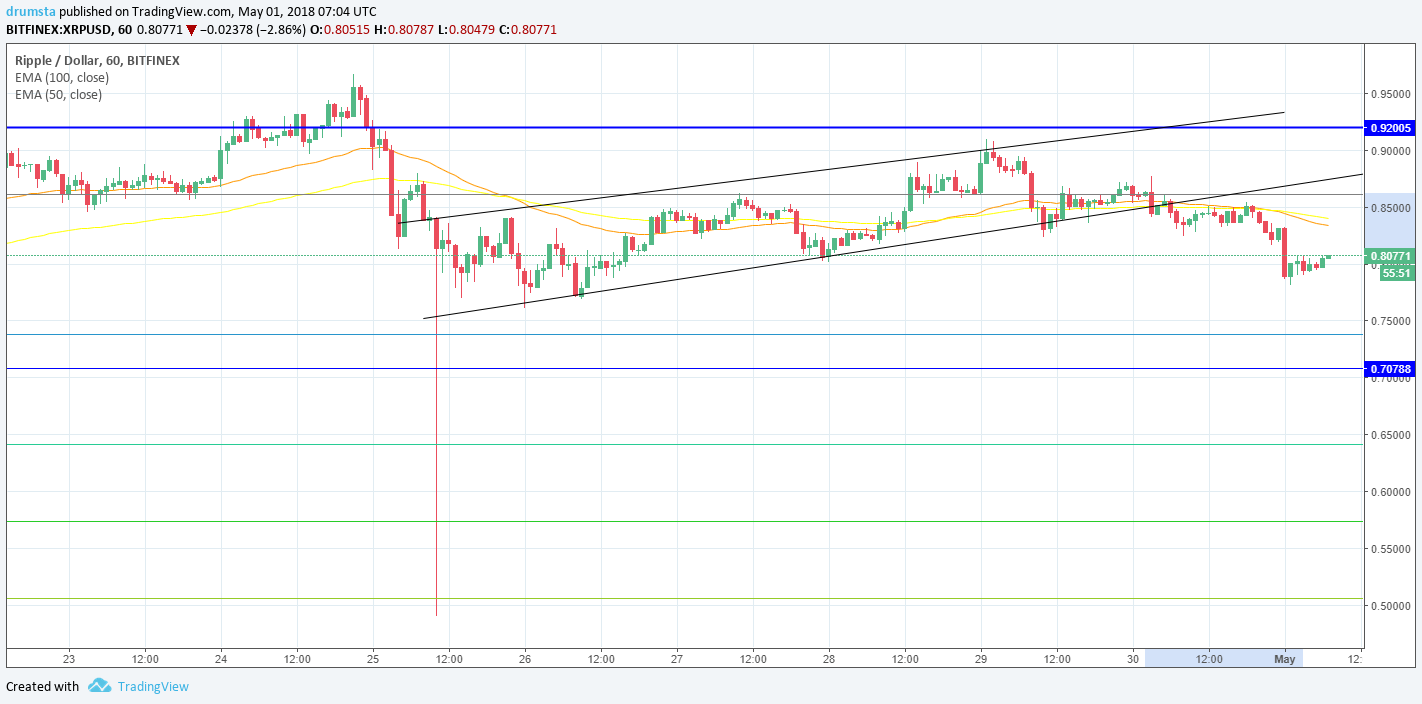
Zooming into an hourly chart we can see that the price broke out of the upward channel in which it was from 25. of April, and is currently below 100 and 50 EMA.

Hourly chart signals a sell
Pivot points
S2 0.29625
S1 0.57893
P 0.77278
R1 1.05546
R2 1.24931
R3 1.72584
Conclusion
I have stated yesterday that if we see a close on the red candle, we are going to see a start of a trend reversal. This is what is happening now, and we can conclude that the downside movement has started.
©Forex.academy
Related posts
 Daily Crypto Review, Oct 10 – Market pushes up again, majority of cryptocurrencies in the green
 Daily Crypto Review, Oct 17 – Bears Taking Over, Cryptocurrencies in the Red
 Daily Crypto Review, Oct 13 – G7 Will Continue to Oppose Libra; Bitcoin Consolidating After Another Bull Run
 Daily Crypto Review, Oct 15 – JP Morgan Says Bitcoin is Overvalued; XRP Crashes As it Breaks Major Support