How to earn a living during the Coronavirus while stuck in isolation
There is no shying away from the fact that we are currently living in unprecedented times. With governments across the world instructing businesses to close their doors, forcing people out of their jobs, as well as being ordered into self-isolation, which will leave many people facing huge debts, and many will go broke with some people losing their businesses and even their homes.
This is not fear-mongering; this is an absolute fact. The world is facing a global recession and a financial meltdown. And things will not improve until such time as the virus has been beaten and vaccines are made available. And because of the unknown nature of the virus and the fact that vaccines can take many months to bring to the market, the dilemma that faces the world is that this is too much of an unknown to be able to say when things will return to normal.
However people are adaptable and will search for opportunities to make a living, and the old adage “invention is the mother of necessity” springs to mind, and where people will reinvent themselves with new business opportunities and where because they will mostly be in isolation those opportunities can only arise online.
Therefore, isn’t it about time that you considered working in the forex industry? Because no matter what happens, the money markets continue to operate even during crises such as we are faced with at the moment.
The benefits of working in the forex industry are that you can set up a business quickly and with very little setup costs. Indeed, all you need is a decent computer and internet connection and then choose a broker who to trade currencies with, and whereby your initial outlay can be as little as $200 in order to start trading, although ideally, you would need to put up at least $1000 in order to be able to realistically begin to make a decent living.
The forex market is the largest financial market in the world and is open 24-hours a day five days a week and where anybody can participate. Even during this crisis many institutions and professional traders, all the way down to retail traders, make money by using chart patterns they see on their computer screens to tell them when currencies – which are always traded in pairs – are too high or too low against their counterparts and therefore may be ready to rise or fall. Traders simply bet on the rise or the fall in currency pairs in order to make a profit. Effective tools can be implemented to minimize losses.
The forex market is a global market and is not centralized, and therefore nobody owns it. Transaction costs are low, and here at Forex Academy, we have an abundance of educational material where you can learn all about trading in the forex market, and we can even show you how to open a risk free demo account to practice what you learn with us before you risk your money for real.
The many articles, posts, and videos have been written by professional financial traders who trade the markets even during these difficult times, and want to share their success with you so that you can have an opportunity during these dark times to learn how to successfully trade forex.
When it comes to consistently being profitable in crypto trading, the trend is definitely your friend. However, spotting the trend when it still in the early stages is very difficult, while running along with it all the way to the top is even more challenging.
More often than not, trends (both bullish and bearish) will pause their move briefly, which allows traders or investors to join the bandwagon. We saw this pause in many cases during the crypto market uptrends and downtrends. If a lot of new participants join, the asset price continues the trend. If not, we can expect a trend reversal.
Continuation patterns
A trader can use continuation patterns to spot trend extensions. These patterns occur in a variety of shapes, with some of the most popular being known as bull and bear flags.
A bull flag is a pattern that occurs during an uptrend when the price is trying to continue upward. On the other hand, the bear flag occurs in a downtrend when the price wants to go further down.
Each flag pattern has two main components:
The pole and The flag. The “pole” is a part of the pattern that signifies a strong impulsive move, which is backed by a surge in trading volume, as well as by the subsequent pause in the trend, which represents the “flag,” which resembles a falling or rising channel.
The flag pattern has shown to be an invaluable addition to a traders’ toolset. It is mainly used to calculate the target as well as the direction of the move. As an example, if the resistance breaks in a bull flag, we can be confident that the price will continue upwards and set the target to approximately the length of the pole. On the other hand, if the support of the bull flag is breached, we know that the pattern is invalid and that the trend continuation is unlikely.
Calculating the profit target
A cryptocurrency move after a bull flag breakout or bear flag breakdown usually corresponds to the size of the pole of the flag.
Therefore, the profit target is derived like this:
Bull flag breakout equals to the breakout price plus pole hight
Bear flag breakdown equals to from the breakout price minus the pole hight
Pole height equals to the pole high minus the pole low.
Example of the Bull Flag
Let’s take a look at Bitcoin (BTC) on a 6-hour chart, where it presented a bull flag breakout. Bitcoin cleared this particular flag resistance on Feb 20, 2017, which signaled a continuation of the rally. The rally ranged from the $917 (which was the low of the pole) to the possibility to go towards $1,228 (target measured by the pole height method brought us to $157, which was added to breakout price).
In this case, Bitcoin came just $10 shy of the predicted price target on Feb 24, 2017.
Example of the Bear Flag
An example of the bear flag would be Ethereum’s (ETH) 4-hour chart, starting Mar 17, 2018. Ethereum broke the flag support, which suggested the continuation of the depreciation from the $699 pole high. The target would be $463 if we used the pole height method, which got us to the $133, which were then deduced from breakdown price.
As the move confirmed, Ethereum was just $12 shy of reaching the exact target level on Mar 18, 2018.
Summary
Bull and bear flags can be utilized in strongly trending markets to predict the price target of the move. However, they do not always perform as intended. In some cases, they can present a so-called “false breakout,” which occurs when price breaches the boundary of the flag but quickly retraces.
The risk of false breakouts can be mitigated by waiting for a candlestick to close outside of the flag territory.
For more superb educational content please visit our website https://www.forex.academy/
pattern trading in cryptocurrencies (Head and Shoulders, Triangles, Wedges) – part 2/2
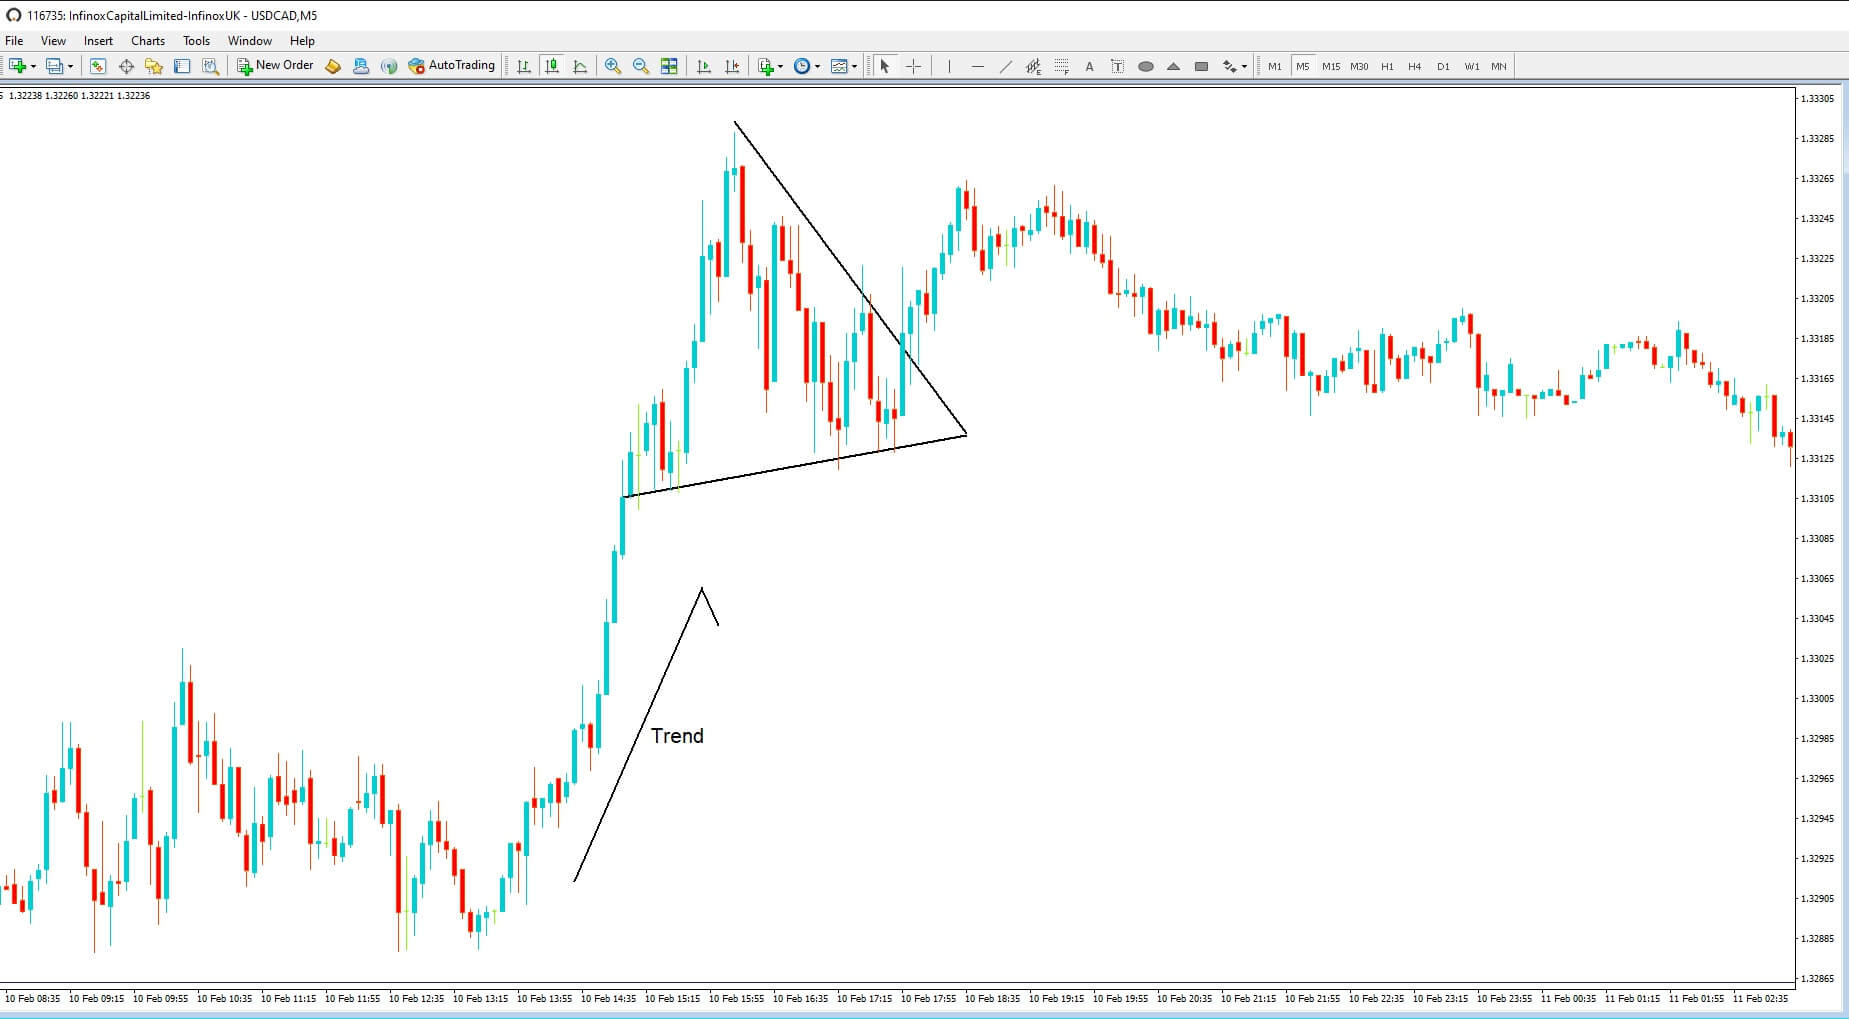
This part of the guide will cover various triangle formations as well as wedges.
Triangles
Triangles come in three formations:
Ascending triangle Descending triangle
Symmetrical triangle
Ascending triangle
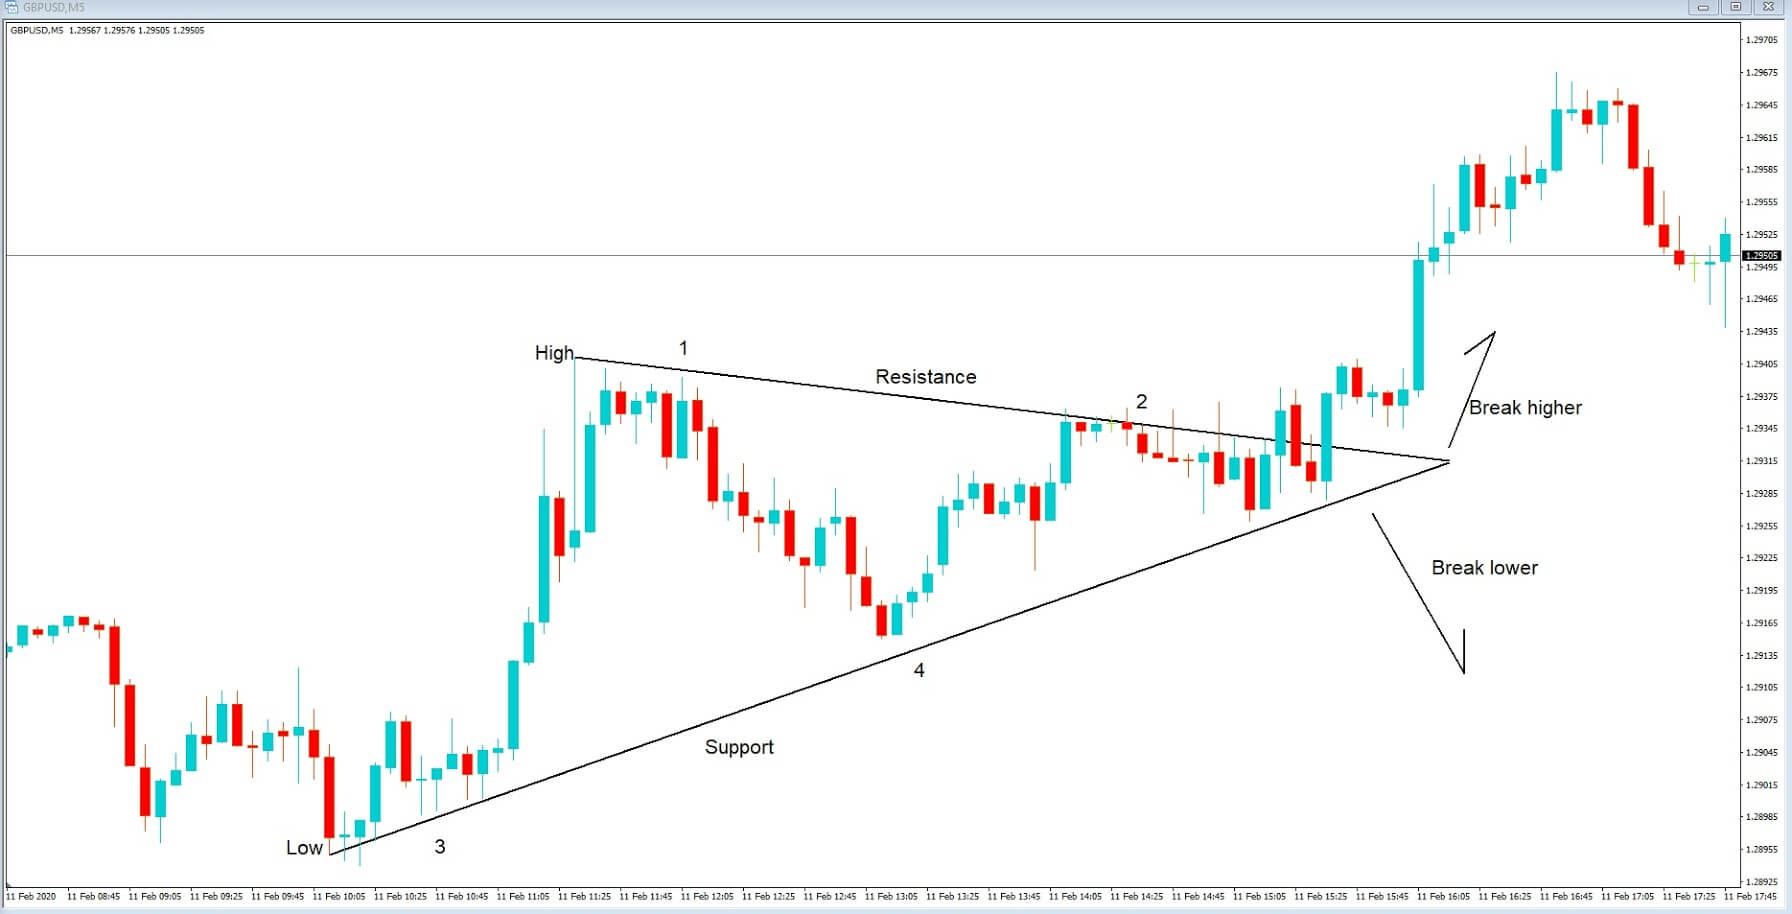
Traders can spot an ascending triangle by the price going up and down between the constant line of resistance and the rising support.
The ascending triangle is widely considered to be a bullish formation, which leads to massive profits if approached the right way.
However, those not careful enough might consider taking a position near the support line in hopes of enhancing their gains, only to end up with a loss as formation didn’t complete, and the price movement turns to be a double or triple top bearish formation.
Targeted prices are measured by the widest distance between the highs and the lows, and applied up from the point of the breakout.
Experienced traders will wait for a confirmation of the upward breakout accompanied by a much bigger volume before taking a position, as breakouts without an increase in volume can catch traders in a bull-trap (as we showed on the chart).
Descending Triangle
A descending triangle is considered a typical bearish formation. For it to form, the price action needs to flow between a steady support line and descending resistance.
The pattern is confirmed only once a downward breakout with increased volume happens. Only then can a trader expect the continuation of the price movement to the downside.
Just like with ascending triangles, the price target is equal to the widest swing inside the triangle transferred from the breakout point to the downside.
One of the most famous descending triangles in cryptocurrencies is the one that formed on the 2018 Bitcoin chart.
Symmetrical triangle
These triangles are probably the most common formations in cryptocurrency trading. However, at the same time, they are the most unpredictable.
As the symmetrical triangle approaches its closure, the trading volume drops as traders are often indecisive about whether the price will unfold to the upside or downside. When the war between the bulls and the bears resolves, we get two outcomes: positive and negative.
Any of these breakout movements will be followed by an increase in volume, which will be even more visible due to the reduced trading volume before the breakout.
Once the breakout happens, traders can expect the target price to be the same distance as the distance between the breakout side and the base of the triangle.
Wedges
Wedges are very common formations in crypto trading as well. They are considered a multiple price wave reversal patterns.
The price action in a wedge swings from highs to lows multiple times before breaking out of the pattern.
Wedge formations come in two forms:
Rising wedges
Falling wedges
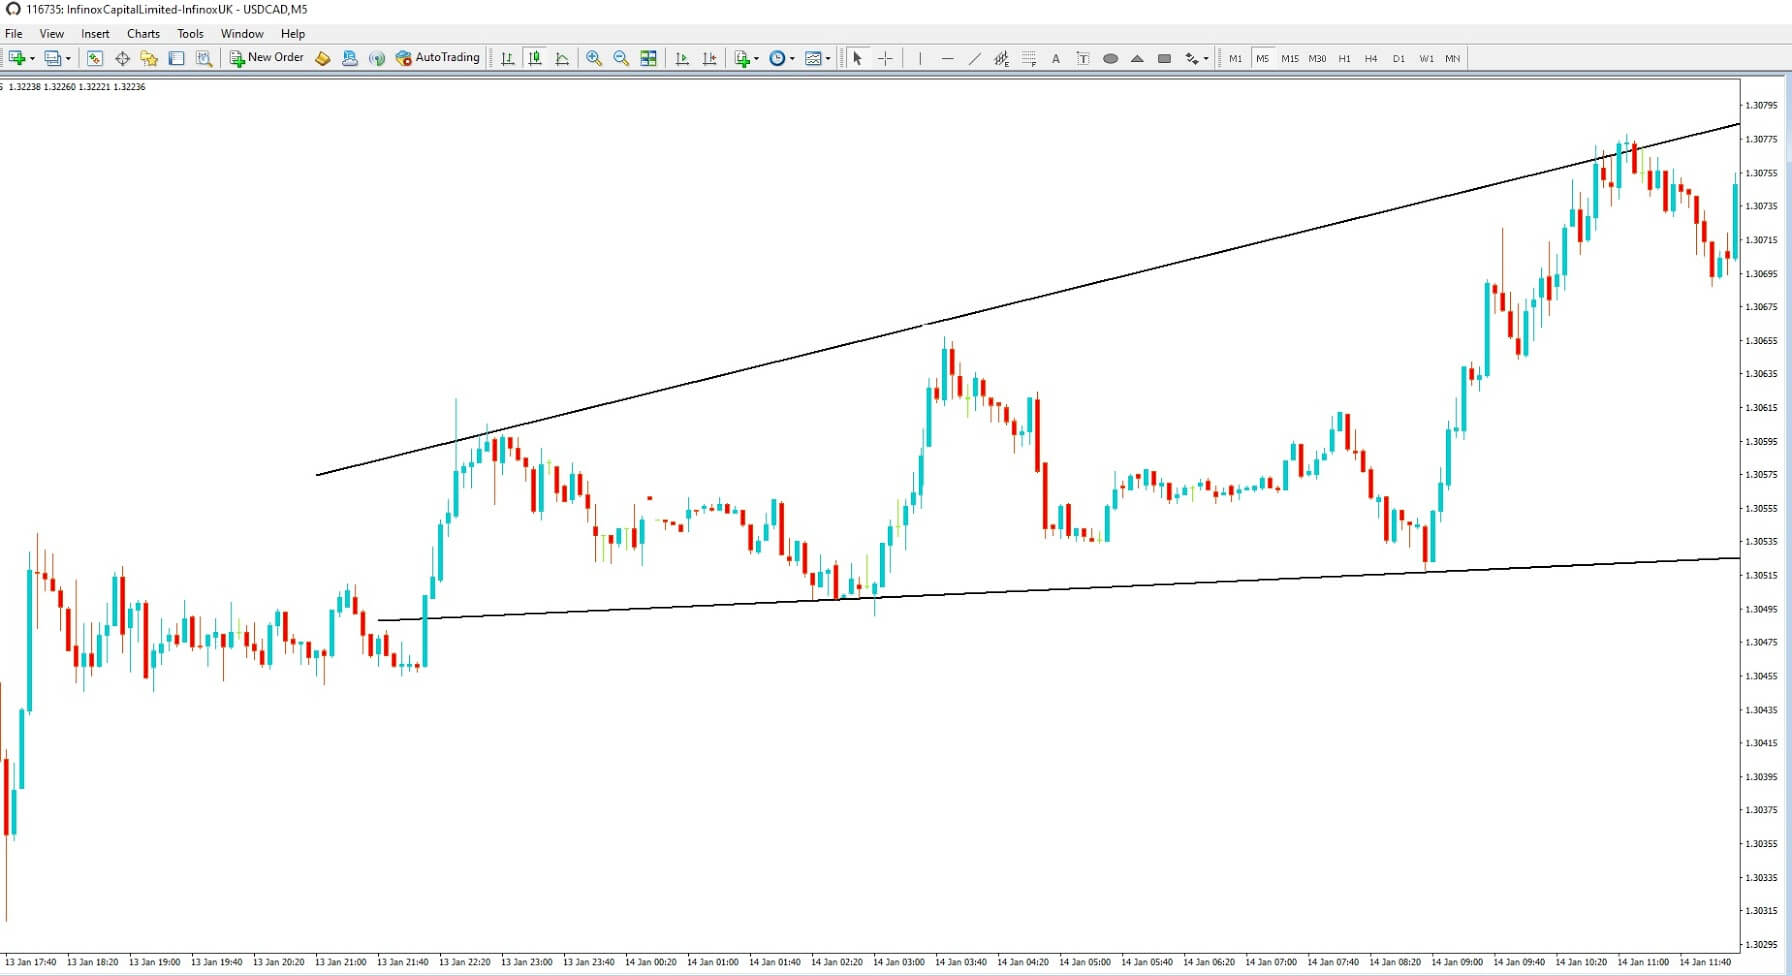
Rising wedge
As opposed to the ascending triangle formation, the rising wedge has price swings that travel through highs and lows, but both the highs and lows are getting higher. This formation announces a bullish trend reversal into a strong bearish sentiment.
Falling wedge
The falling wedge formation, on the other hand, looks like a mirror image of the rising wedge and announces a trend reversal from bearish to bullish.
As with other patterns, it is advisable for traders to get the confirmation of the breakout before taking a position.
The minimum targeted price for the falling wedge is the exact opposite of the ascending wedge.
One thing to notice is that, in the cryptocurrency market, peaks do not necessarily follow highs and lows in an exact straight line. They are rather just close enough in the price range to mark the formation.
We are undoubtedly in the worst economic crash the global economy has seen since WW2, and the financial impact may be even more far-reaching. With the financial markets in turmoil and no end in sight, maybe we should pause and take a look at what’s happened over the last few weeks and see if it can give any pointers to future direction, especially within the forex space.
In January, in our video on How to guard your financial assets against the Coronavirus outbreak, we warned that stock indices across the globe would come under continued selling pressure. Although the virus was mostly contained to China, it wasn’t possible, at that time, to predict the terrible crash that we have seen. It was only really when the virus took hold of Italy and broke out in Hong Kong and South Korea, that market jitters forced investors to see the potential of this deadly outbreak and begin selling stocks. Nonetheless, anybody who heeded our advice may well have reduced their exposure to stocks and been financially better off as a result.
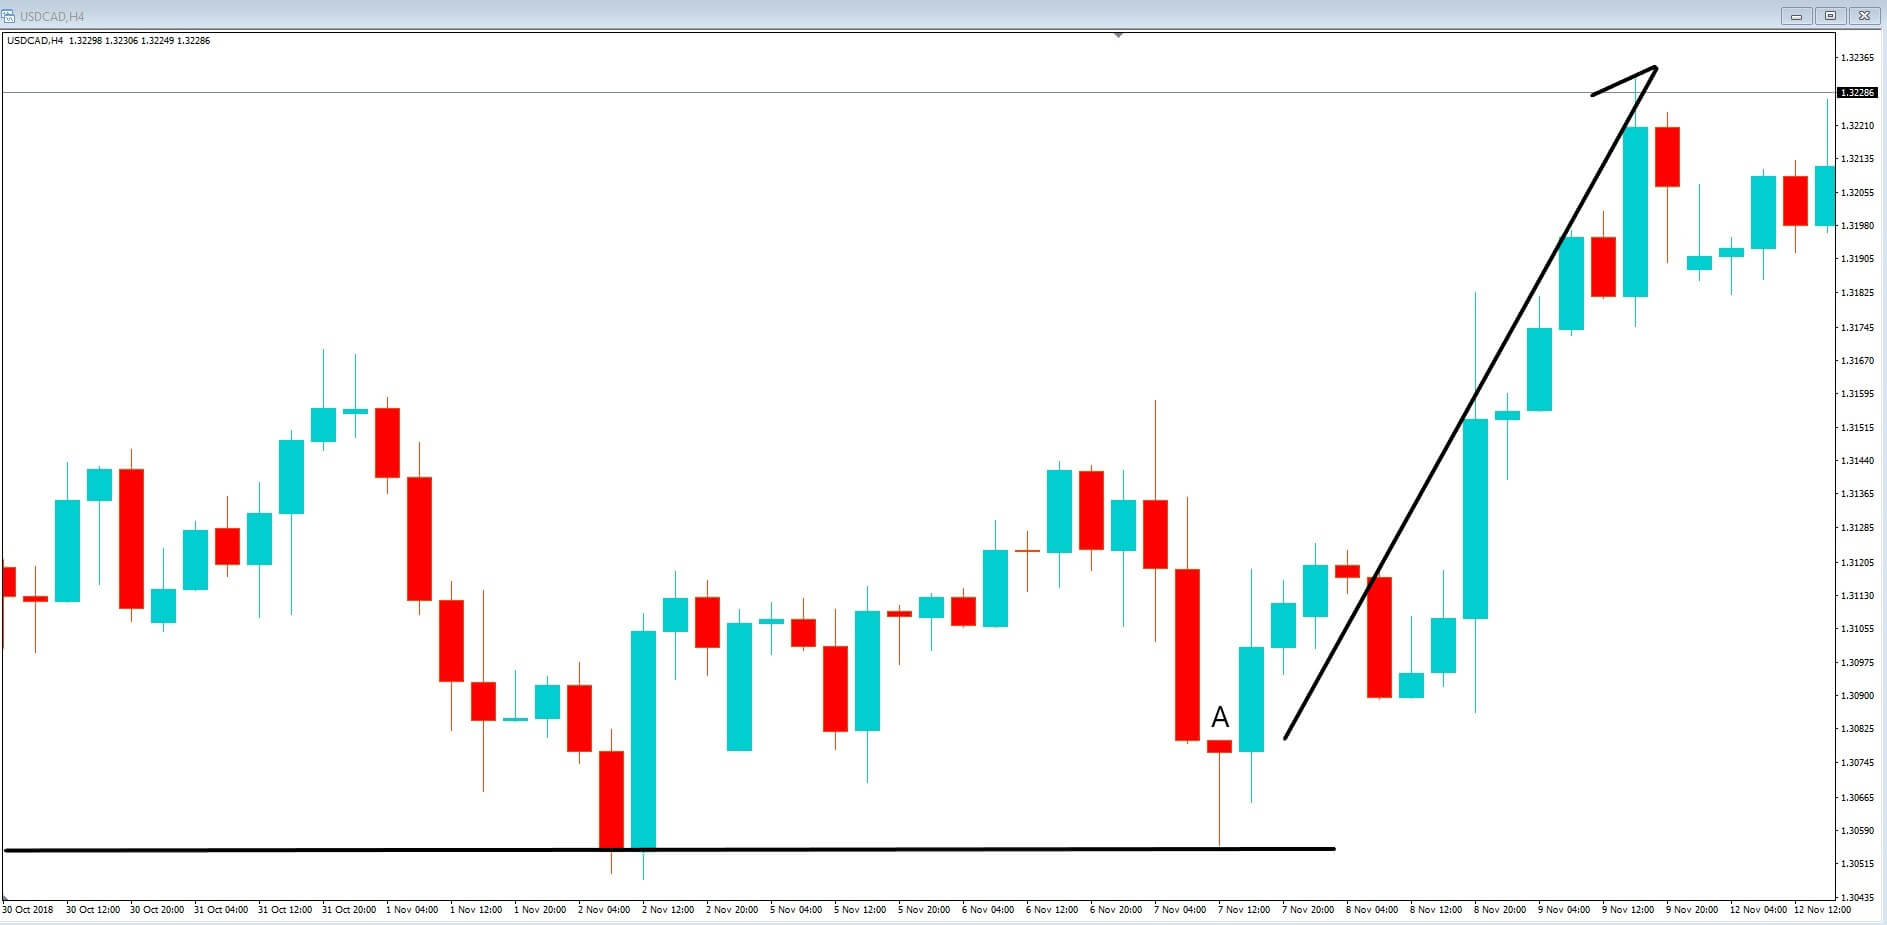
Example A
In our February video about How to trade the Australian Dollar and The Convid-19 Pandemic Black Swan Event, again, we called it correctly. With Australia heavily exposed in China, it was highly likely that the Aussie dollar came under extreme selling pressure against the Dollar and that is exactly what happened and where we have seen highs of 0.70 in AUDUSD to a sharp decline to 0.54
Example B
We also warned that New Zealand, whose GDP is heavily dependent on their exports into China, may find that their currencies come under selling pressure too. It has also seen a huge decline against the Dollar from 0.6750 to a low of 0.5490.
Example C
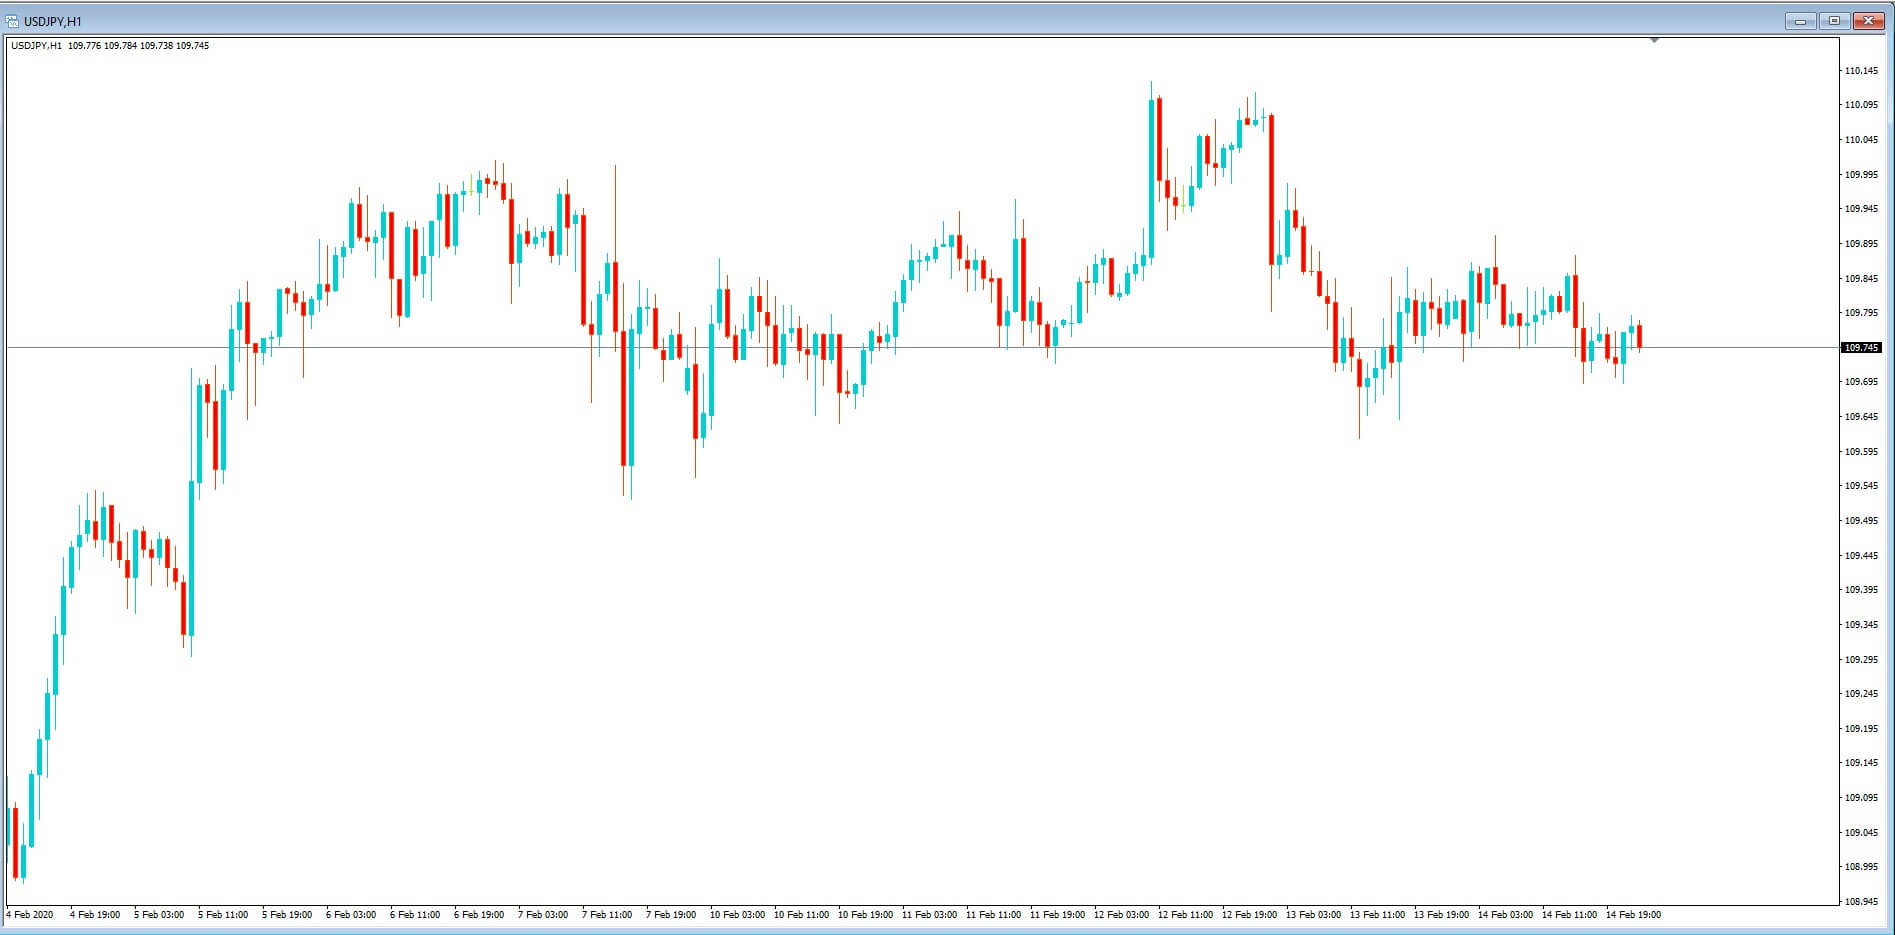
We warned that countries such as Japan and Switzerland would find that their currencies grew stronger due to their safe-haven status. And where USDJPY declined from 112.20 to a low of 101.00 initially, before reversing due to concerns about the virus on the GDP of Japan.
Example D
We saw USDCHF tumble from 0.9855 to a low of 0.9160 and warned that the Swiss National Bank would likely intervene in the markets to drive the value of their currency lower for export purposes. That is exactly what happened.
We also warned that all of this could only mean one thing for the US dollar: it’s directional bias will be to the upside. Again, that’s exactly what happened with the Dollar index at highs around the 102.00 level against the Forex Majors.
Example E
So where to from here? Well, let’s just take a look at the 1-hour chart of the GBPUSD chart from Friday, 20th March. The Arrows show that there was extreme price action, which amounted to over 1400 Pip swings in this pair for this one-day period. This is almost unprecedented in financial trading. It can only tell us that the markets are thinning in volume and leverage and that institutional traders will be largely standing on the sidelines because as the crisis deepens the UK government, just like other western governments, are closing down, albeit temporarily, businesses that produce gross domestic product income revenues. All of that income has suddenly evaporated and gone out of the window. We are now in a situation where governments are financially bailing out business sectors, and they are doing that through borrowing. The burden of the debt that will grow and grow, month after month, as the crisis continues, cannot be predicted, and in fact, the repercussions will be the basis of a secondary crisis which will emerge at the end of the epidemic, due to overburdening debt caused by a virus, while countries and their workforces get back to normal in order to reimburse governments’ coffers in the form of taxation.
And nobody can predict when this virus will be contained enough for the markets to steady themselves. It will only happen when good news emerges, and this does not look at all possible or likely in the short term.
Therefore as institutional and professional traders are waiting on the sidelines and reducing leverage, we would advise retail forex traders to also exert extreme caution in trading these markets while the current crisis persists.
How To Use A Hedging Strategy To Trade Double Tops and Bottoms
In this video, we are going to show you how to set up a hedging strategy to trade double tops and bottoms. The idea is to set up two trades simultaneously where one trade will act as an immediate execution trade, and where all the technicals are telling us that price action will go in a certain direction. And the second trade will act as an insurance policy should price action ignore our technical analysis setup, and in which case, we will then capture price action as it moves in the opposite direction.
In the following examples, we are looking for price action reversals, which will form the basis of our technical analysis; and therefore our belief is that we will be looking for price action to have peaked, or bottomed out, and then reverse. Our secondary trade, which will act as an insurance policy, will be set up on the basis that price action has simply pulled back and then continues in the direction of the original trend.
Before we move ahead with our setups, let’s quickly remind her selves of the kind of setup we are looking for a double top scenario.
Example A
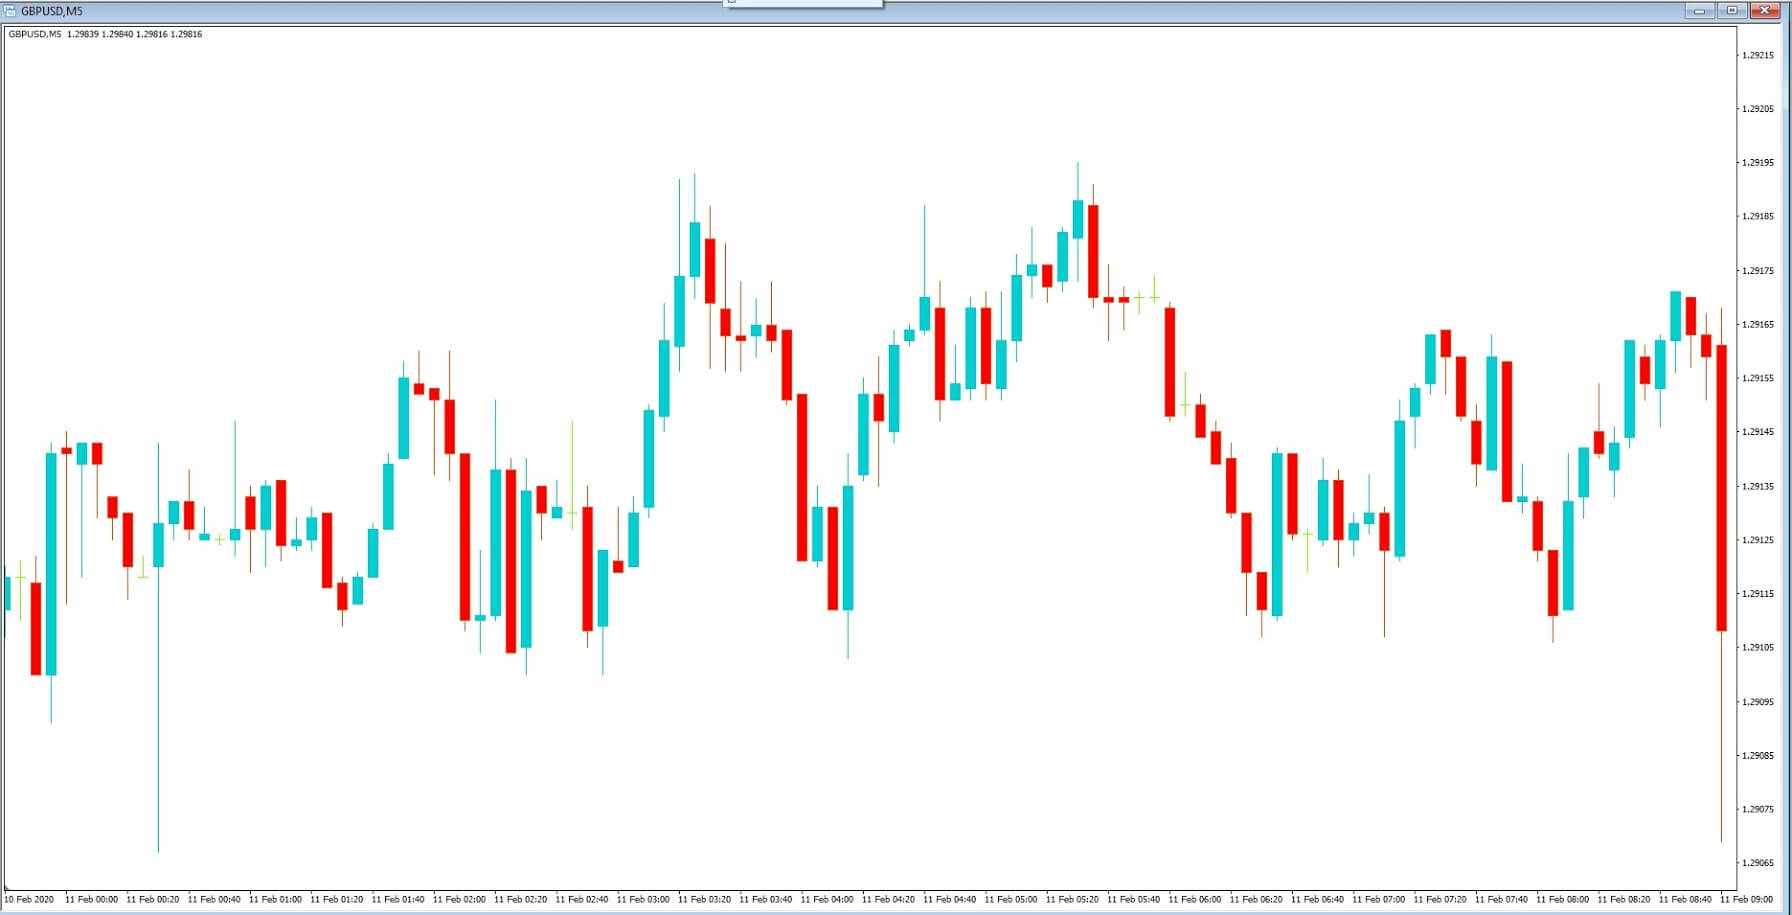
Example A, shows us that for a double top formation we need a peak, followed by a pullback to what is referred to as a neckline which acts as a line of support, followed by a second peak which must be at the same exchange rate as the previous peak, and then confirmation of the double top pattern occurs once price action breaches the neckline for a second time.
Example B
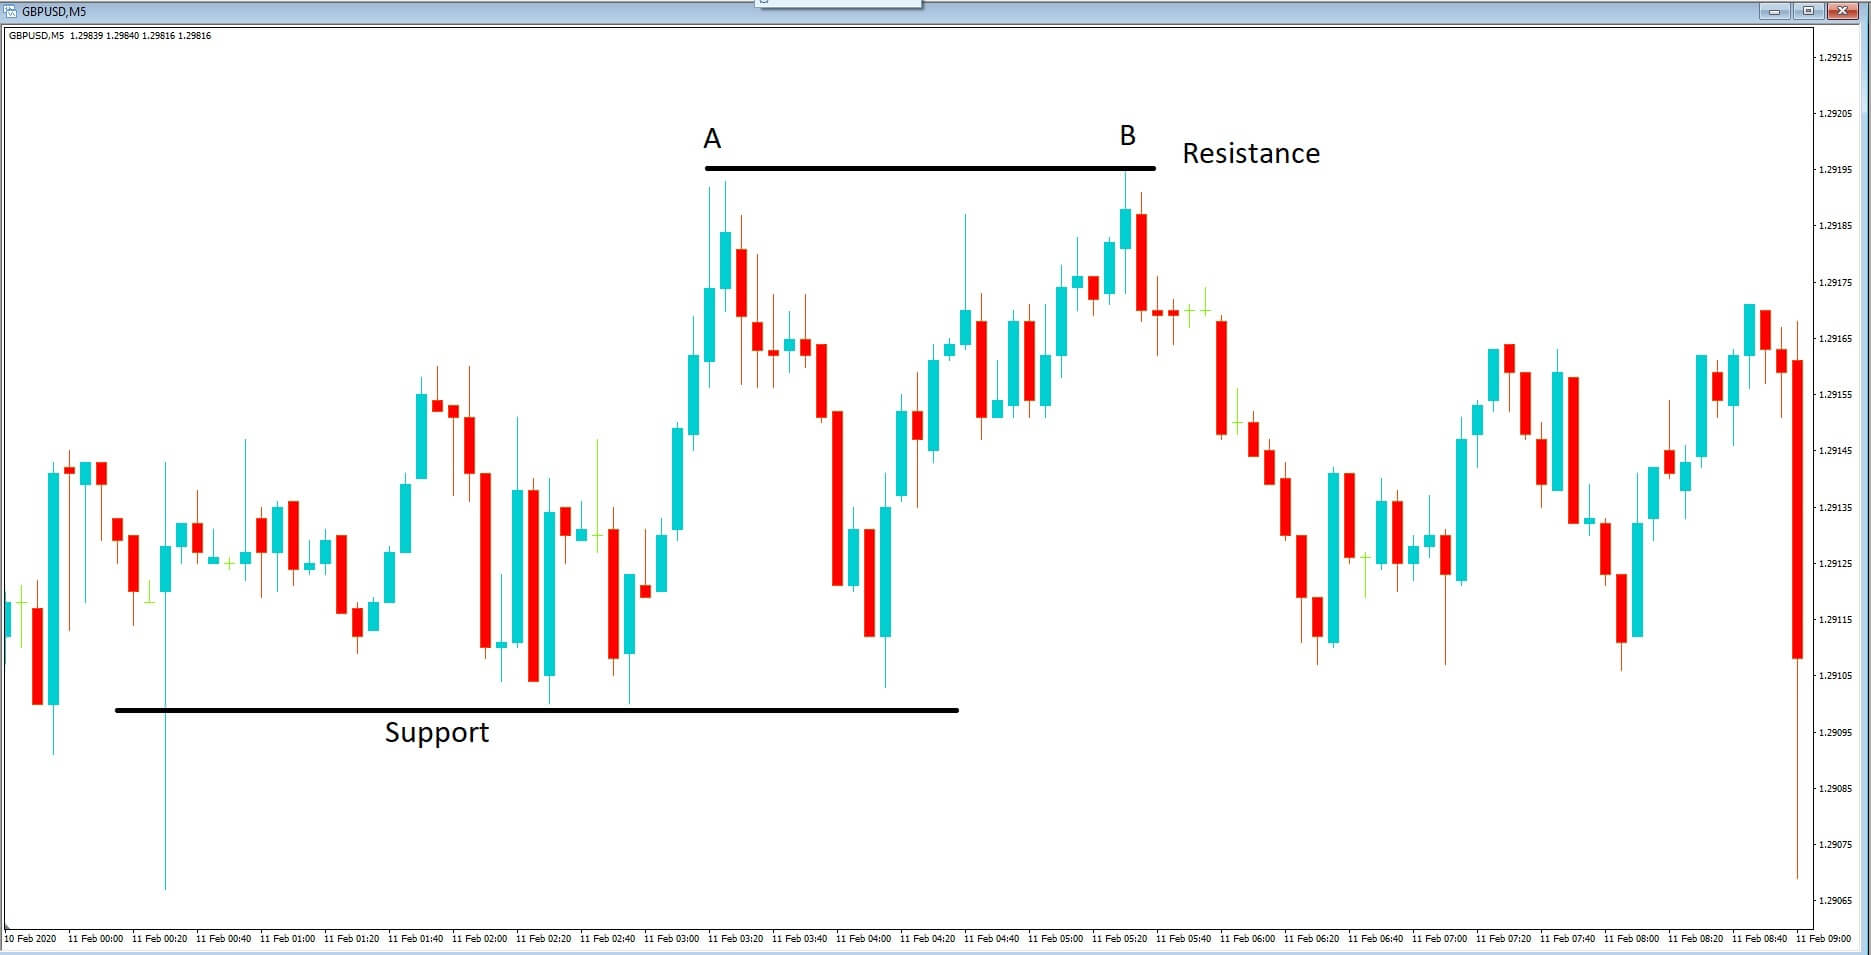
Example B, The reverse is true for the double bottom scenario. We have a bottoming out of a pear followed by a reversal to a neckline, which acts as an area of resistance and where price action forms a second bottom at or around the same exchange rate as the previous bottom and then a reversal back to the neckline, which previously acted as an area of resistance and where price action punches through and this line which then acts as an area of support before we see a continuation in the reversal of price action, which confirms the double bottom pattern.
Example C
Example C, the following is how we set up the double top hedge. First of foremost, we need to wait for price action to pull away slightly from our second peak and go short at this point with a stop loss a couple of pips above whichever peak was the highest of the move. Should price action continue lower than our neckline, the double top formation will be confirmed, and we can ride the downward move. If price action reverses from the support line, this will confirm an area of consolidation in which case we can bring into play a protective stop out in front of our entry, and at least we will not have lost any money on this trade.
Example D
Example D, The hedging strategy set up is where we place a buy limit order a couple of pics above the stop loss from the first trade, with a slightly larger stop loss which must be a couple of pics below show the previous support or neckline, and in this case, we expect that price action will continue with the original upwards trend. For this trade, we must have a minimum target equal to the amount of pips that were lost in trade one in order to keep our profit and loss in check. However, naturally, we want to let the trade run on as much as possible.
Example E
Example E, In the double bottom hedging strategy, we will simply need to reverse the trade setup for the double top. In which case, we would go long as soon as price action reverses from our second bottom line. With a tight stop loss a few pips below the lowest point of both bottoms. If price action then goes on to reverse back from the neckline to form a third bottom, we can close the trade out with a small profit. But the double bottom confirmation pattern will be confirmed once the neckline is preached, and price action continues in an upward trend.
The hedging strategy consists of a sell limit order just below the stop loss of the first trade and where the stop loss for hedging strategy must be a couple of pics below the neckline.
This hedging strategy should be reserved for timeframes or 15-minutes, and above this is where we will find the most amount of pips to be made. This is not to be considered as a scalping strategy.
Market pattern trading in cryptocurrencies (Head and Shoulders, Triangles, Wedges) – part 1/2
Finding ways to predict the future price movement of an asset has always been incredibly hard, no matter what asset you are trading. Cryptocurrency trading differs slightly from trading other assets, as it is more volatile, much younger, and susceptible to fear of missing out as well as fear, uncertainty, and doubt.
Although the number of factors that influence the price of a cryptocurrency is almost immeasurable (reaching milestones, partnerships, security breaches, new regulations, etc.), combining this knowledge with the usage of other methods, such as trend detection can be quite profitable.
No matter how volatile the prices of cryptocurrencies may be, at times, experienced traders can spot distinct movement patterns that allow them to predict the direction of the price movement. This guide will explain the fundamentals of three patterns that traders look for when trading crypto on various exchanges.
The head and shoulders pattern is a price formation that, to an inexperienced trader, look like a baseline with three peaks and nothing more.
However, if we spot that the middle peak is higher than the other two, which are similar in size, we can deduce that it is, in fact, the head and shoulders pattern.
In technical analysis, a head and shoulders pattern is a sign of bullish-to-bearish trend reversal. It is regarded as one of the most reliable, if not the most reliable trend reversal patterns.
As the cryptocurrency market is extremely volatile and bulls and bears constantly switch in terms of market dominance, the head and shoulders pattern would appear after the market has been dominated by bulls.
After the first price stagnation (which is the Shoulder 1), and the price reaches a new high (which is the head), it still may be possible that the pattern will not form and that the bulls will push the price even higher. However, after the price goes down for the second time, bulls often try to push it up again (which is the Shoulder 2). If they don’t succeed and the price stops at the price level similar to the one of Shoulder 1, it becomes evident that bears are taking over the market.
The target price in this reversal is equal to the distance from the neckline to the peak of the head but in the opposite direction.
When deciding whether to trade the head and shoulders pattern, traders should not just assume that the pattern is going to play out. Instead, they should be patient and wait for the decline after the right peak to reach the neckline. Only then can they think of taking a position.
Reversed head and shoulders
Traders should also look for the reversed head and shoulders pattern, which plays out the same way a regular one does, but in the opposite direction. This pattern marks the end of the bear season.
Check out part 2 of our pattern trading guide, where we will cover various triangle formations as well as wedges.
Example 1: In this session, we are going to be discussing trading strategy as this is something that new traders find difficult to develop and implement without deviation.
Any forex strategy should be a systematic step-by-step procedure for how and when to use specific tools when a sequence of analysis needs to be developed.
Typical components of any strategy should include the following:
Example 2: The types of analysis tools we will be using. Whether it’s technical, fundamental, or both, it is something that will always be personal and based on your preferences. Now, although preferences are important specific analysis tools will have a generally higher success rate, and you should take some time to learn out of your comfort zone to improve on your weaknesses. You should have a clear order setup before you as to when and how you apply these analysis tools.
Example 3: next, you will want to have a clear picture of the timeframes, and trading windows will need to use. It’s no good trading an unsocial trading window that encroaches on your sleep and day-to-day responsibilities, and in addition, we want to use the same timeframe to implement our analysis tools while considering the type of trader we want to become. For instance, scalpers will rarely use the daily time frame because they are looking for quick in and out trades based on the technical analysis of the lower time frames.
For the longer time frame Traders, it would be beneficial to scan through the pairs that you are interested in trading in order to ascertain the key levels of support and resistance enable to drill down using your technical tools to look for potential trade entries and exits.
No matter what type of trader you want to be, it is important to consider fundamental factors which might impact on your trading, or assist your decision-making such as economic data releases, interest rate decisions, and key political events. In which case, you want to keep an eye on the economic calendar for the day or even week ahead.
We want to establish what high probability trades are available based on our technical and fundamental analysis. When developing a trading strategy, we need to implement all of these features and stick to them rigidly in order to achieve consistent trading profitability. Should any part of the strategy fail for any reason, we will need to make adjustments accordingly in order to make the trading strategy more fail-proof.
Example 4: What types of orders will you be using. If you are unable to be available during the times where you would normally need to trigger a buy or sell, you must make use of pending orders. If you’re trading news and have plenty of time on your hands, you may want to enable one-click trading to quickly enter the market based on data releases. This will all factor into your larger plan, and you should write down every detail. The purpose of strategy development is to increase your probability of success through research, development, and application, just as any other commercial business would go through in their model.
Example 5: We can’t talk about developing a successful strategy without looking at risk management in great detail. Risk management is the key most important aspect of a financial traders toolbox. Trying to determine what your risk appetite is while training can initially be very difficult.
Example 6: You need to consider your available balance, the pair being traded, pip worth, lot size, and other factors. You should never be trading with money you actually need because this will play with your emotions and put enormous psychological pressure on your trading, especially when things are not going your way.
Those who consistently make money in forex trading might not necessarily have more winning trades than losing trades. A part of being a consistently winning trader is knowing when to let the losing trades go and exit quickly, with as little loss as possible, while optimizing those winning trades and letting them run on as long as possible, through careful trade management, in order to maximize the amount of pips to be one. This comes down to the risk to reward ratio and to accept losses in accordance with your strategy. And as well as accepting your profits in accordance with your training strategy. Remember, we are looking for a consistent strategy without deviation. A common mistake of new traders is to quickly take profits and let losing trades run. As a consequence of this, they need to accept a higher risk to reward ratio than professional traders. Professional Traders will typically use a set percentage of risk on every single trade. The larger the accounts size, the smaller the percentage of risk should be. For example, you could have a trade with a risk to reward ratio of 1 to 3, where one equates to 3% of your bank. You could think to take that 3% and split it into three entries. Those three entries may have varying profit levels.
Example 7: Let’s look at the strategy checklist and add any of these components to your own strategy if you have not done so already. Be patient, test your strategy on a demo account over a period of 2 to 3-months and tweak and adjust as necessary because if it doesn’t work on a demo account, it certainly will not work on a real money account.
Successful Traders will look at the amount of money they can lose as well as the money they can make. Do not fall into the same trap as many Traders and simply bury your head in the sand when you are needed in a losing trade. Stop losses are the best way to implement against trades that run away from you. Having a frugal mindset will protect you against losses and bad decision making.
In every trade that you enter, you must have two things on your mind: at what point do you get out if it becomes a losing trade and at what point do you get out of a winning trade.
One thing is for sure when trading, there will be trades that you get stopped out of, and they then turn around and become what would have been winning trades, there will be trades that you will be stopped out of, and they will continue to have moved against you, and you will be grateful for your stop loss, and there will be trades that you get out of having taken your profit, only for them to continue on for hundreds of more pips. This is all a part of trading. It is all about sticking to
your methodology and trading strategy, making money consistently, looking for the next set up, and fighting on. Do not dwell on losses, do not dwell on what might have been, simply carry on with your strategy and remember the old adage: if it ain’t broke don’t try and fix it.
RSI, which is an acronym for the Relative Strength Index, is one of the most popular technical indicators used in the analysis of any financial markets. It is often used for cryptocurrency trading as well.
It was created in 1978 in John Welles Wilder’s book that carries the name “New concepts in technical trading systems.” Wilder was a former mechanical engineer who abandoned his job in order to focus on the financial markets.
He wanted to create indicators based on mathematical analysis by finding a simple yet effective tool to visually represent market movements. The RSI indicator is what came from his research, and this indicator is one of the most widely used indicators to date.
RSI indicator – explained
This indicator is based on quite a simple concept. The stronger the relative price, the greater the market’s upward closures compared to the market’s downward closures. The opposite is also true.
RSI is considered an oscillator that is used for measuring the speed as well as the direction of price movements. That’s why it is also a “momentum” indicator. Contrary to some other indicators, RSI manages to overcome the momentum-related problems that can occur when abrupt movements of the market cause a sudden reversal of the trend.
RSI uses a band of oscillation that ranges from 0 to 100. It also allows for visual comparison with predetermined constant levels. It is based on a simple mathematical formula that requires only one input parameter, which is the number of periods that we are taking into consideration.
In his book, Wilder recommended that 14 should be used to get the best results.
As with all the other oscillators, if a short time-period is used, the sensitivity of the oscillator might be too great, and traders may get false signals.
Using RSI in crypto trading
Trading cryptocurrencies using RSI is not much different than trading any other asset. When the price moves up quickly, the RSI indicator will enter the “overbought” area. The opposite is also true.
It is important to say that the longer the time frame used, the more accurate the data is. Bitcoin has almost never had a false signal on the higher time frames.
Wilder designed this indicator with the aim to spot reversals. RSI will show alert zones set at 70 for overbought and by the value 30 for oversold. However, it is not uncommon to see zones moved to values 80 and 20.
A cryptocurrency trader, this indicator should NOT be used by itself, but rather alongside using the knowledge of candlestick and pattern analysis as well as some other indicators.
Trading cryptocurrencies using Bollinger Bands (part 2/2)
The rules of Bollinger Bands
John Bollinger is still quite active in the financial space, while his bands have 30 years of market testing. The first thing that Bollinger makes clear is that both highs and lows are relative. While the upper band signifies highs as they relate to the standard deviation, the lower band does the opposite. The terms “high” and “low” have to be used in a relative sense. This relativity can be derived from a variety of different indicators.
Bollinger stressed that each indicator has to be viewed in isolation before trying to use it in conjunction with something. Momentum, volume, sentiment, as well as many more things can be derived from Bollinger bands; however, they might not necessarily relate to one another.
He once said: “For example, a momentum indicator might complement a volume indicator successfully, but two momentum indicators aren’t better than one.”
Bollinger bands have proven to be a successful indicator if employed in a wide range of financial settings since they are simple by nature. They are made for trading equities, indices, exchanges, commodities, as well as futures. Cryptocurrencies were not there when this indicator was made, but they fit the space between the gray areas of these financial tools.
Bollinger Bands and are also flexible with regard to the time period, as long as the period that is examined contains enough details to present a meaningful view of the market.
How to use Bollinger Bands
Cryptocurrency traders, as well as investors, can use Bollinger Bands in several different ways.
The first we have to look at is the volatility of a given coin we are trading. Bollinger bands compress when standard deviations are low, which is signaling us a period of low volatility. They tend to do the opposite when volatility increases.
While this can have several meanings depending on the coin we are trading. We can look at the volatility and try to pinpoint the possibility of a breakout.
Bollinger Bands capture somewhere around 90% of the price action in a given cryptocurrency. When the price movement dives above or below a set Bollinger Band, we have to pay attention. When the price moves above the band, the coin is likely overbought, and it is possible that it will correct shortly. If, on the other hand, a price moves below the lower Bollinger Band, the coin is possibly oversold.
Movements at the Bollinger Band boundaries (upper or lower) can also be used to determine short-term price direction. If the upper band is cracked, but the price corrects to a level just at or below the upper band afterward, it’s a sign that the prices are generally moving up. The opposite is also true.
Conclusion
Bollinger bands present an easy way to visualize the cryptocurrency market price movement. In simplest terms, it shows when it is a good idea to buy or sell an asset.
However, Bollinger Bands are simply one of the many tools in a trader’s toolkit, which means that the rules are not written in stone. To confirm their decisions based on Bollinger Bands, many traders are relying on volume indicators or oscillators such as RSI or MACD before entering a position. Independently confirming trends by using other tools rather than only using the Bollinger Band system is more reliable than using just Bollinger Bands to come to a certain conclusion
In this presentation, we will be looking at the technical analysis chart pattern known as a double top. Being able to recognize this formation or pattern and the information it provides us with will help to trade more effectively.
Double top patterns one of the many pillars of technical trading structures and should be incorporated into your trading knowledge base. Double top identification and understanding can further enhance your technical analysis when trading the forex market,y helping us see more than just support and resistance levels.
Example A
So what exactly is a double top? It will include two high points within the market, which generally signify an impending bearish reversal. There will usually be a decline in price between two high points. After the first peak has formed, there will be a retracement to a certain degree, before another rally to the upside. The second peak usually forms at the same level or slightly below the first peak, although occasionally it might breach the level of the first peak before price action reverses.
Example B (OR EXAMPLE C)
Here we can see that after a rally to the upside to peak one, price action reverses to our line of support line, often called a neckline between the two peaks, before the second push higher to peak number 2, and where price action reverses from this area, suggesting unsustainable buying pressure and that we should expect a reversal. And where price action goes on to breach the previous level of support, with a strong bearish candlestick, this is confirmed as a double top formation. And where price action subsequently comes back after some brief consolidation, with mixed small shaped candlesticks suggesting a lack of direction and where the previous level of support becomes an area of resistance and hence the continuation downwards which adds to our belief and support for this technical setup.
Example D
On the flip side, we have the double
bottom formation. This setup is identical to the double top in its theory and execution of trading. However, it is simply in reverse, In which case the exact same rules apply, But it is simply the mirror image of the double top. In this case, we would expect a bullish signal once the neckline is broken.
Example E
So here, for example, we can see a push down in price action to our first bottom, before price reverses to the neckline, which acts as an area of resistance, and where price subsequently comes down again to our second bottom, and where price action again returns to the neckline and breaches it and where this prior area of resistance becomes an area of support, and where price action continues to the upside from.
So to sum up, we are looking for two peaks at a similar height and where price action reverses between them to a neckline or area of support, which subsequently becomes breached after reversing from the second peak.
Secondly, we should make sure that the peaks are not too small because we prefer them on larger time frames of 15 minutes or higher because that is where we would expect larger amounts of pips to be made from this successful trade setup. This type of setup should be used in conjunction with a stochastic or ma CD to support double top or double or bottom formation.
One of the biggest problems with technical trading is that sometimes these patterns appear obvious in hindsight and that quite often we will miss opportunities and of course this can be very frustrating when you are always missing the mark. These patterns appear on our chats and often can be difficult to decipher when the market is moving, and with the pressure of placing trades sometimes, we simply miss these setups. There are two ways of going about solving this problem, and both have their pros and cons. We can either anticipate the formation before it occurs or wait for confirmation to trade the potential reversal. This will always be down to your appetite for risk, your personality as a trader, and your competence at understanding the nature of the forex market. Reactive traders who are playing the safer game have the advantage of simply seeing the pattern occur and trading it accordingly with the downside to this, which is that part of the trade has already been missed. This can equate to larger potential stop losses and less pips being made as the move continues.
Traders who have gotten into the sell or buy during the second peak or bottom phase of the setup will enjoy the comfort of having tighter stop losses, which should be placed a few pips above or below the first peak or first bottom. And of course, they will be able to claim more pips.
As with anything in forex trading, these things are a matter of trial and error and consistency, and therefore practice and observation will pay dividends in the long run.
Hedging Strategy With the Head and Shoulders Formation
In this video, we are going to show you how to use money using a hedging strategy, which is a continuation in the series. On this occasion, we are going to be looking at the head and shoulders formation and try to take advantage of a price action reversal with this shape.
The trade is constructed in two parts with the idea of hedging, which is to maximize the potential for trading opportunities in either direction of price action. However, initially, we want to set the trade up with our tried and tested technical analysis methodology, and in the event that for some reason price decides to go against the chart, we will have a second opportunity to catch the move in the opposite direction. And so we will have trade one, which goes with technical analysis and trade two, which acts as an insurance policy in the event things do not go to plan.
Example A
Example A is a very typical chart pattern that traders see on their screens on a daily basis. This is the formation of a head and shoulders, where initially we have price action rising, followed by the head and shoulders formation and then price reversal.
Example B
Let’s drill down a little further in example B. Here we can see that price extended higher from the left- hand side of the chart where we subsequently have a peak formation, or the left shoulder, followed by a slight pullback in price and then a continuation higher, which forms the head, before we see another pullback and then another move higher where the price action completes the formation of the head and shoulders shape.
We can also see the neckline, which acts as an area of support that is qualified by price action bouncing off it on at least two occasions. Traders will keep a close eye else for the neckline to be breached, which will offer a high probability of price action reversal to the downside.
Example C
In example c, we are going to set up our first trade. We are going to go short when price action moves under the neckline, and place a stop loss a couple of pips above the highest point of the head. Technical analysis offers a high probability that the price action will continue lower from this point with this particular formation. We should be looking for price action to come down to at least the previous low of the initial move higher on the left-hand side of the chart.
Example D
Example D is our secondary trade setup. The insurance policy if you will. Should our first trade fail, and we get stopped out, we will have already set in place a limit order to buy the pair at or slightly above the stop loss of trade one, in order to capture what will be a continuation in price action to the upside. We must place a stop loss a couple of pips below the neckline, and we should be looking for price action to continue upwards and, at the very least, cover the loss of our first trade. This can be done by carefully managing the position. This type of setup is better suited to time frames of 15 minutes or above because we are looking for trends, and this is where the larger amount of pips will be found.
Intro to using Bollinger Bands in cryptocurrencies (part 1/2)
The wild movements of a typical cryptocurrency price chart can definitely look bewildering at first glance. While it is easy to see the general direction of a trend for any given crypto, the confusion really sets in if you zoom in to a smaller time frame and take a look at all the peaks and troughs that actually make up that trend line.
Intro to Bollinger Bands
Simple moving averages are used to describe the average price of an asset over a period of time while using exponential moving averages will give more credence as well as arithmetic weight to newer prices. Both of them are intended to filter out the hourly and daily bumps that make up a price chart. They are also making trends as well as patterns more immediately obvious.
The system of using moving averages was further refined by a financial analyst as well as author John Bollinger in the 1980s. He introduced Bollinger Bands to the world. Bollinger bands are nothing more than a system of computing bands (high and low) above an asset’s moving average by using standard deviation.
Bollinger bands are also being used to examine exponential moving averages, unlike the Keltner channel’s examination of simple moving averages. The way Bollinger Bands are used provides the measurement tool with much more sensitivity to certain changes in the market.
Bollinger Bands and Crypto
When speaking about the notoriously volatile cryptocurrency market, Bollinger Bands are used quite a lot. They are mostly used in predicting possible breakouts as well as identifying key times to enter or exit the market. This use-case is particularly useful for day traders (rather than long-term investors), who often have to make quick and tough calls with incomplete information so they could retain their profits. If they make only one significant step in the wrong direction on just one cryptocurrency, they can eliminate days or even weeks of carefully harvested small gains.
More on how to use Bollinger Bands to improve your cryptocurrency technical analysis in part 2 of our guide.
Today we are going to be looking at spreads in reference to the forex market and some of the points to remember when choosing a broker having carefully considered the trading spreads they offer and eventually helping you to decide which trades you make according to the tightest spreads available.
Example A
So, what is the spread? All foreign exchange currency trading is done in pairs are the prices for each pair and are quoted as currency exchange rates.
Example B
Prices are quoted in quote boxes similar to this one, where the relative value of one currency unit is termed in the units of the other currency in its pair. In this example, the British Pound is being quoted against the United States Dollar and is where each currency has a three-letter quote, so here it would be GBP USD.
To simplify this, the spread always reflects the price for buying the first currency of the pair, in this case, the Pound, with the second currency, in this case, the USD.
The exchange rate that is supplied to a trader willing to purchase a quote currency is called a BID, and it is the highest price that the currency pair could be bought at. The selling price of the quote currency is called the ASK, and it is the lowest price that a currency pair will be allowed for sale. The difference between the Ask and the Bid is termed as spread. Essentially, the reason for the existence of the spread is so that brokers can take a cut. It can be applied instead of charging fees on your close trade positions, although some brokers may charge a small commission separately after the trade is closed.
Spreads are typically measured in pips and measured using the fourth decimal place in a currency quotation. There different types of spreads available in forex trading with different brokers provide let’s take a look at these two examples to May better understand your options.
Example C
When choosing a broker, you will want to consider the types of spreads they offer typically. This will be a fixed spread, or it might be a variable spread. With the fixed spread, the difference between the Ask and the bid price remains constant during normal periods of activity in the trading day. This can, however, widen slightly at times of extreme volatility. Fixed spreads are phenomenal in terms of knowing where you are at all times. With this option, you can determine your costs before entering your trade. Therefore it allows you to have better foresight in terms of your finances. This type of spread is preferred by professional traders because it means that brokers cannot manipulate the spread in their own favor throughout the trading day.
Next, we have variable spreads. This type of spread does not remain constant. Spreads fluctuate in line with market conditions during the day and especially during high levels of volatility and are also affected by liquidity in the market. The benefit of having variable spreads is that sometimes the spreads can be much tighter than fixed spreads and are better suited to frequent traders, for example, scalpers and intraday traders.
Some brokers will offer kept variable spreads, and these can often be considered to be the best of both options depending on how high the cap is.
Is CNBC always wrong about crypto? The CNBC reverse indicator!
Media has been covering cryptocurrencies in-depth for a couple of years now, with many crypto analysts, enthusiasts, and non-believers appearing on air. However, one channel stands out if we talk about cryptocurrency analysis and reports, and that is CNBC.
Bears, bulls, and CNBC
Jacob Canfield, a cryptocurrency analyst, and trader, noted how various tweets that CNBC posted and that is about Bitcoin going up or down coincided with exactly the opposite price movement. He posted his research in a submission on a popular website TradingView.
Canfield said that “Almost every single CNBC bullish tweet we’ve seen has been at the top of almost every single rally, giving traders a very strong sell signal. On the other hand, with every bearish tweet CBNC posts, it has been a clear tell of a short reversal as well as the end of a rally”.
As previously mentioned, CNBC is one of the most vocal mainstream outlets regarding Bitcoin and cryptocurrency in general, featuring daily price movement coverage as well as events regarding crypto. It has dedicated hosts that include the investment manager Brian Kelly.
CNBC reverse indicator
Based on the history of the posts, Canfield says, CNBC can be used as a reverse indicator. When used in such a manner, it had around 95 percent accuracy at the time the research was posted.
Canfield continued his analysis by saying: “With every bearish tweet CNBC posts, we typically see a 30% return on average.” If we pair this indicator with a few more indicators, we can create a pretty good strategy that covers price action, volume as well as market sentiment.
Based on this 30% average return expectation, the CNBC reverse indicator is an amazing indicator to use when gauging market sentiment and when to think about long or short positions. This indicator held up well over time as the CNBC news is showing almost the same levels of inaccuracy as they showed at the time of posting this analysis.
Following the post, the CNBC television reportedly contacted Jacob Canfield and invited him to be a guest at one of its crypto-related news segments.
Ichimoku Cloud is mostly useful in trending markets. It won’t perform well or produce much relevant info in ranging markets. When the market is ranging, the cloud will constantly be swapping between red and green, yielding very little valuable information. The same will happen on short time frames, which is why Ichimoku Cloud shouldn’t be used on these.
Ichimoku cloud strategies that involve other indicators.
There quite a lot of trading strategies that involve Ichimoku Cloud. However, the important thing to understand is that, even in trending crypto markets, Ichimoku Cloud is almost never used alone. Typically, traders will combine it with other indicators.
Indicators that pair well with the Ichimoku Cloud should provide some way of identifying support-resistance levels based on the asset volume. Using a volume-based indicator alongside Ichimoku is beneficial because the cloud takes price action cycles into consideration while disregarding volume completely.
Popular indicators to use with Ichimoku in cryptocurrency trading
Volume
StochRSI, MACD or any other momentum oscillators
Fibonacci retracements
Bollinger Bands
Ichimoku Cloud cryptocurrency settings
Many people ask if they should use alternative settings for Ichimoku Cloud for trading cryptocurrency markets.
Ichimoku Cloud works with timely moving averages, so with crypto trading, it follows reason to set timespans considering the fact that cryptocurrencies are being traded 24/7/365.
While the traditional Ichimoku cloud settings are (9, 26, 52, 26):
9 would represent a week and a half of regular trading
26 is the number of trading days in a typical month (30 minus 4 Sundays)
52 represents two months of trading days
Traders should create a special Ichimoku Cloud setting for cryptocurrencies as the market is open 24/7 (20, 30, 120, 60):
7+3.5 = 10 (due to the low volume on Sunday), or double that for longer-term trend capture
30 days in a month rather than 26
2 trading months in crypto are 60 days instead of 52 days
However, some traders reject this special Ichimoku Cloud crypto setting. Their reasoning behind that is that the cloud period lengths are meant to capture a certain time period and that it doesn’t matter whether it represents a week. This opinion is less popular as it seems a bit ignorant to disregard the day of the week movements and how certain days influence the market.
Ichimoku Kinko Hyo is a well-known indicator that seems complex to many traders but actually isn’t. Once you know how it works, it makes your crypto-trading decisions easier and faster. Mastering Ichimoku Cloud trading will really bring you one step closer to the main goal of trading, which is making high-probability decisions in a relatively short time span.
Ichimoku Cloud indicator – definition Ichimoku Kinko Hyo is translated as the “one look equilibrium chart.” It was created with a specific purpose, which is to enable quicker decision making in trading. Ichimoku Cloud is one of the main indicators offered at websites such as TradingView.
Ichimoku Cloud lines – explained
The Senkou and Kumo
“Senkou span” represents the borders of the filled cloud, which is known as the “Kumo cloud.” This span is filled with green color when the market is bullish, while it is red in bearish markets.
Senkou lines represent major support/resistance areas, and they attract the price. Using these lines, traders set their entries, exits, and stops. However, they are mostly used as additional information alongside some other indicators.
The TK lines and Cross
The Ichimoku Cloud also consists of the Tenken and Kinjun lines, or “TK lines.” These are the balance lines, basically fast and slow MA’s.
As they are moving averages, traders will look for crosses when they search for trend reversals. Because of the names of these lines, the Cross is called “TK cross.” However, TK lines are also important, even when there is no cross in sight. They can signal that the price of a cryptocurrency is neither overpriced nor underpriced if the price sticks around them. On the other hand, if the price action happens very far from the TK lines, it shows that the price is way out of balance and that a pullback is likely. It is important to note that this indicator by itself is not a trigger to open positions expecting a pullback.
The Chinkou
The “Chinkou” span is an indicator that is a lagging one. It is used to confirm trend strength. When the Chinkou line is above the candles, it means that the market is strong. On the other hand, if the Chinkou crosses below candles, it’s a bearish market.
When there is strong action while the lagging line crosses the candles, the trend is slowly weakening and becoming undecided. This tells traders to look for a reversal.
Reading Ichimoku Cloud
Ichimoku cloud Bullish signals
In order to have a strong bullish signal, everything in this indicator must occur above the Kumo cloud, namely:
The price action has to remain above the Kumo cloud.
The Chinkou line has to stay above the Kumo
Tenken has to cross Kinjun above the Kumo – if this Cross occurs inside the Kumo, that’s only slightly bullish.
In order to have a strong bearish signal, simply reverse everything said about the bullish signals:
The price action occurs below Kumo
Tenken and Kinjun have to be crossing
The Chinoku line has to stay below the Kumo.
If none of these is happening yet, it most likely means that the market is undecided, sideways, or waiting for direction.
Check out part 2 of Trading Cryptocurrencies using the Ichimoku Cloud to learn about cryptocurrency setups using this indicator as well as to learn the popular indicators that get along with Ichimoku well.
Trade cryptocurrencies using Fear and Greed Index – part 2/2
How to use the Fear and Greed Index to predict market reversals!
The Fear and Greed Index tends to reverse when it approaches “Extreme Fear” territory, while it is a bit less reliable when it approaches “Extreme Greed”. The “Extreme Fear” is the moment when fear transitions into very early and slight signs of greed. At that point, it reverses to the upside directly into greed territory, as opportunists start putting their money into the market.
If people feel greedier towards Bitcoin reversals when the market sentiment is at extremely fearful levels, will Bitcoin’s price follow to the upside?
The reversal points have plotted analogously to the BTC/USD’s price chart on the Fear & Greed Index.
Extreme Fear” levels on the Fear and Greed Index have always resulted in upswings and bullish reversals in Bitcoin’s price. Every time the Fear and Greed Index reached near-extreme levels of fear, a price reversal in Bitcoin’s price came. Extreme fear towards Bitcoin (and most top cryptos) has historically translated into a financial opportunity for the ones that decide to invest.
One big reversal was the mid-December of 2018 when the fear was extreme. At that point, Bitcoin bottomed at $3,200 before starting its new upswing.
Conclusion
The Fear and Greed Index is a great indicator to use when predicting when a bottom has formed on the Bitcoin chart. It surely is a great additional indicator that can show where and when a rally could approximately occur.
Although it won’t tell us exactly at which specific price point a reversal will happen, the Fear and Greed Index is certainly a valuable tool when it comes to timing a shift in market sentiment.
If history is a good teacher (and history does repeat itself), it is likely that people’s feelings towards Bitcoin are shifting dramatically sooner rather than later.
The methodology in this presentation is to use the 5-minute time frame on the EURUSD and the GBPUSD pairs during lulls in the market. Such lulls or quiet periods tend to occur after the American session and just before the Asians come to market. During the Asian market session traders typically tend to focus on domestic currencies that affect their own countries’ GDP, such as the yen and Australian and New Zealand Dollar. Therefore if the timing is correct, opportunities will present themselves to scalp or look for trades with expectations of only making or losing a few pips at a time in this type of scenario. Should trace spill over into the Asian session, financial institutions will be taking positions with our peers, and volatility will increase, but our technical analysis set up and tight stops should protect us from heavy losses.
And although present market conditions are extremely volatile due to the coronavirus, eventually, the markets will calm down, and opportunities will present themselves to try and make money in calmer markets with this methodology.
The first part of our setup is to observe periods in trading that have not been volatile in the run-up to the closing of the American session. We are looking for periods of consolidation and sideways trading in our two pairs, which should spill over into the Twilight Zone between the American session closing and the Asian session opening.
We want to keep our chart set up to a minimum with as little indicators as possible because they tend to be quite laggy on the 5-minute chart. Price action and Bollinger bands are the key behind this setup.
Example A
Example A shows the GBPUSD pair on a five-minute chart, and the period between our two vertical lines shows the time zone we are targeting specifically, and please note some brokers use different times on their charts, such as ours, which is two hours ahead of UK time.
First of all, we can see that price action has been very muted in the run-up to the time we are focused on, and should this be the case, there is no reason why you should not enter this trading methodology sooner, should you wish.
Example B
In example B, we have added the Bollinger bands with a period of 13 and deviation set at the standards default of 2.0.
The most critical parts of this setup is that the Bands must be moving sideways.
Example C
In example C, we can see that price action spikes outside of the Bands at position A, where we have gone short and placed a tight stop loss a couple of pips above the previous high as denoted by our Horizontal line. And when price touches the bottom of the Bollinger band, we need to exit the trade. If price begins to move higher inside the band, which it does at position C, we would enter a buy trade with a target of the upper band and with a stop loss a couple of pips below any low in this consolidation period. In which case, our exit would be at position D.
There are conservatively 15 pips within our highlighted period and a total of over 50 pips within this consolidation period, as presented on the chart as price tops and bottoms from the tops to the bottoms and back of the bands. Tight stops keep losses to a minimum with this setup.
Trade cryptocurrencies using Fear and Greed Index – part 1/2
It’s a well-known fact that emotions move markets. Greed drives prices up, while fear drives them down. Human psychology always ends up being predictably irrational because a lot of people tend to react very similarly in certain situations.
If people behave almost the same way in certain situations, it is possible to make money trading by just being a contrarian. As an example, Baron Rothschild made his fortune by buying when others panic-sold. His philosophy was relying on “Buying when there’s blood in the streets.”
John Templeton once said to “Invest at the point of maximum pessimism.”
This rings true simply because – the greater the fear — the larger the opportunity for profit.
The Fear and Greed Index
If we conclude that a trader can be profitable by acting contrary to how others are acting, then it is important to pinpoint moments of fear as well as moments of greed.
This strategy is quite simple:
If others are greedy – be fearful.
If others are fearful – be greedy.
One well-known tool that measures cryptocurrency market sentiment is the Fear and Greed Index.
The Fear and Greed Index measures cryptocurrency market sentiment by aggregating data from various sources and generating them into one number, which is on a scale of 0 to 100. A value of 0 is known as “Extreme Fear,” while the opposite (a value of 100) represents “Extreme Greed.”
The data that the index uses is compiled daily. You can also glean the data of the Fear and Greed Index on a daily, weekly, monthly, as well as yearly basis.
Tendencies that show in the Fear & Greed Index
Extreme fear is a place where the first signs of greed are created. As we can see from the graph above, fear can quickly spiral out of control. However, every time the Fear and Greed Index is close to or below the 10 mark, the value of the index quickly reverses to the upside.
This brings us to the conclusion that every time high levels of fear dwells in the minds of traders and investors, opportunists use this market climate to their advantage. Following the ways of savvy investors such as Warren Buffet, Baron Rothschild, or John Templeton, these “bargain hunters” get greedy when others were fearful.
However, just like fear can quickly gain momentum, so can greed. And since emotions move markets, extreme fear drives prices down, while greed drives them up.
Check out part 2 of our Fear and Greed Index guide to learn more about how to use this tool to predict market movement.
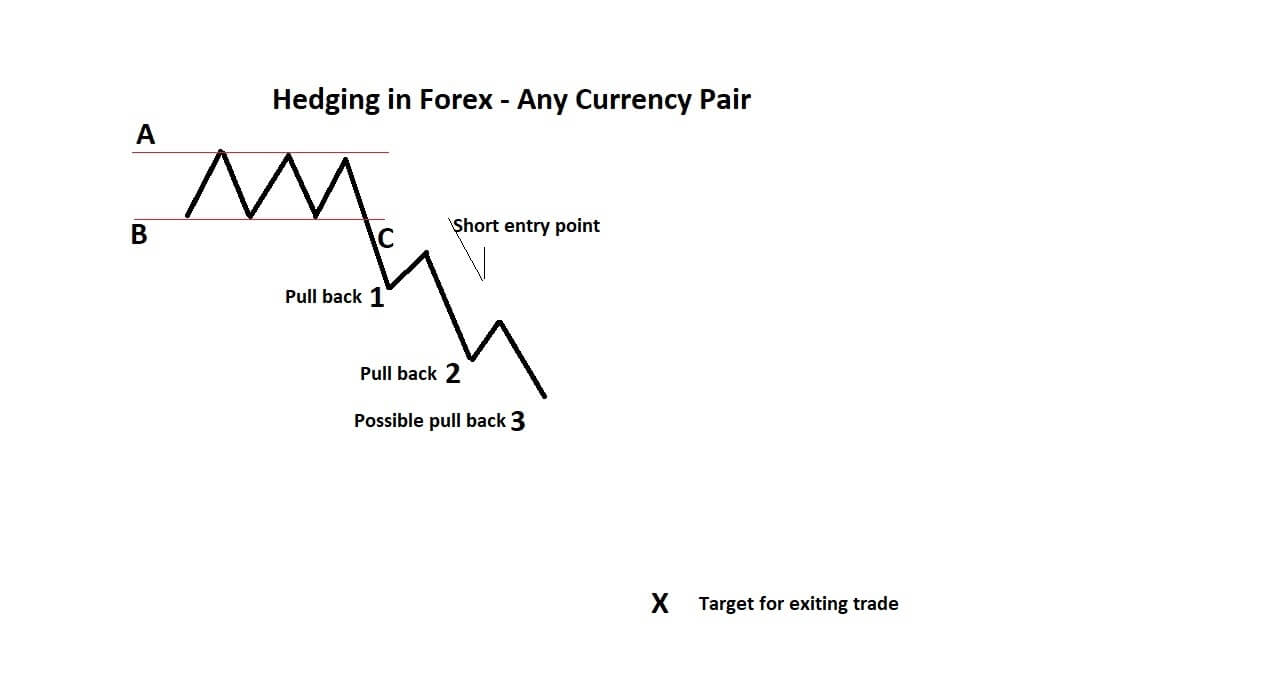
Continuing with our hedging strategy series. Today we are going to look at setting up two trades. One Which involves using the Elliott wave Theory of technical analysis, and should this prove ineffective, we will also be setting up a secondary hedging, or insurance based trade, in the event that our first trade does not go according to technical analysis.
While hedging comes in many forms and strategies, the methodology behind this type of hedging is that we want to carefully set up a trade based on tried-and-tested technical analysis, and where, in this particular case, price action may be set for a sharp reversal, but turns unexpectedly, in which case we will be able to catch the move in the opposite direction. In which case theoretically we win no matter which way price moves. Therefore this strategy works best when markets have consolidated or reached highs or lows, which seem right for reversal or continuation in price action but where the consolidation squeeze should cause a burst in volume in either direction.
Example A
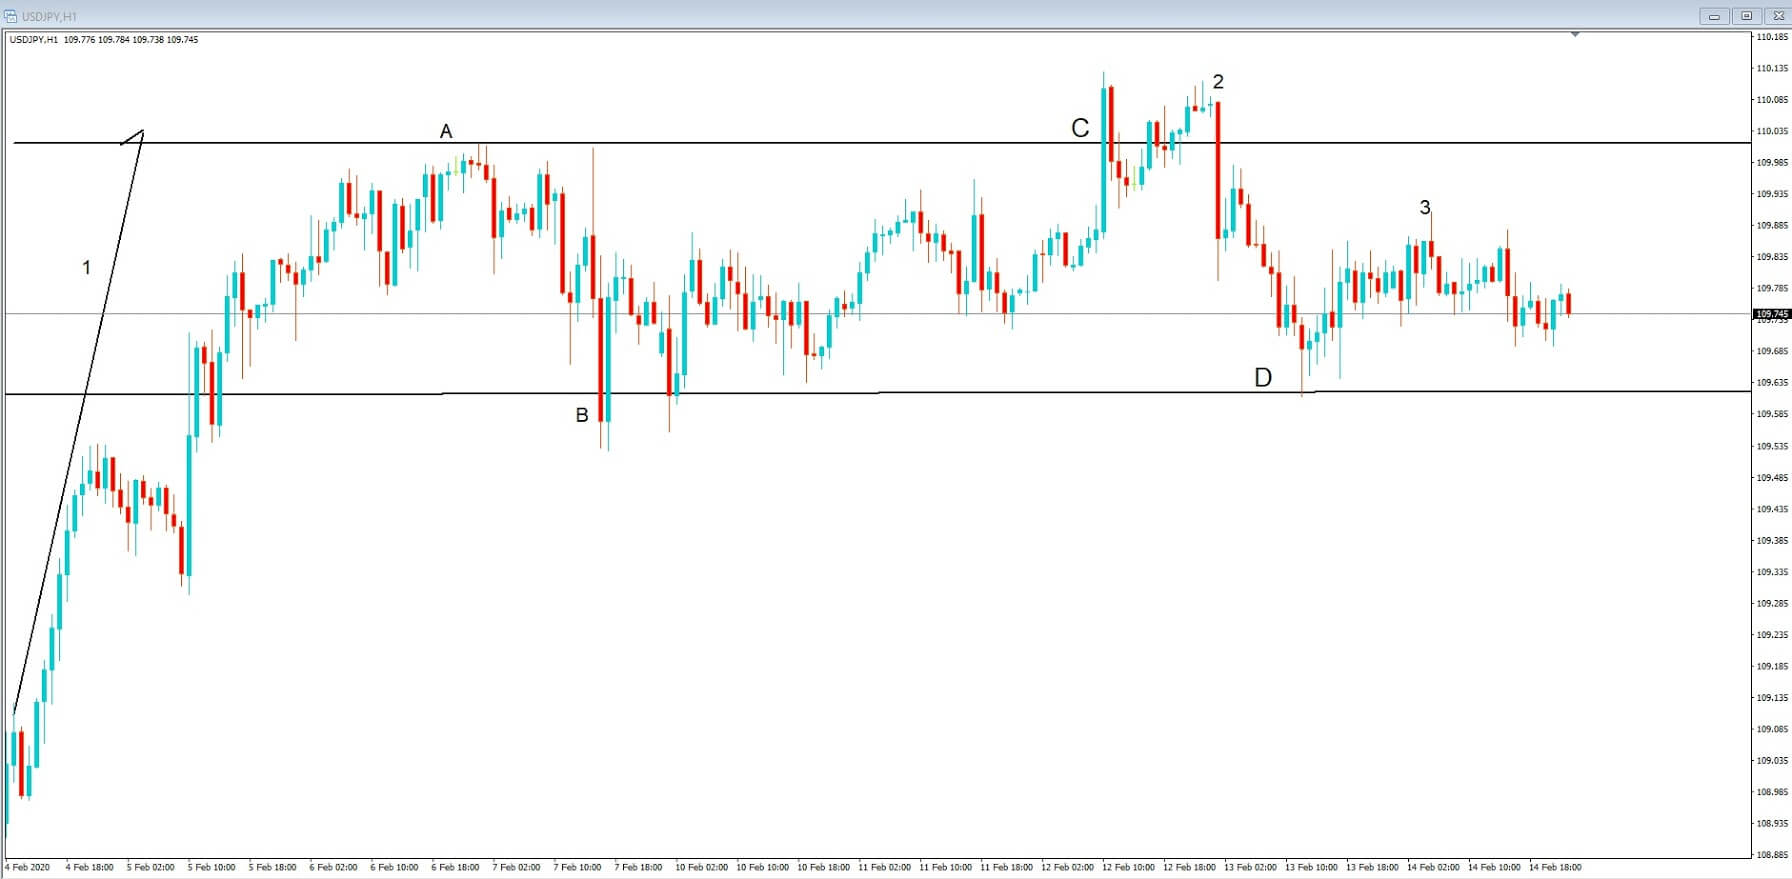
Example A, Let’s quickly remind ourselves of the theory of the Elliott Wave, which consists of an impulse wave that is usually composed of 5 sub-waves that move in the same direction followed by a corrective wave composed of three subways that move against the previous trend.
Example B
Example B, Here we can see the Elliot wave in action. After a consolidation period, we can see the Elliott wave as denoted by 1 2 3 4 5 6 pattern, with higher highs and higher lows and where we would expect price action to begin to fade with our three-part full pull back as denoted by the A B C technical pattern we have drawn as an estimation onto our chart.
Therefore, if the Elliot Wave theory holds true in this case at position A, we would see a decent in price action in line with our A B C expectation, and if not, we would expect a price action continuation up to position 7 in continuation of the original upward trend.
Example D
Example D, This is the first part of our hedging strategy in which case we are going to go shorts at position A, which represents her 50% pullback between position 6 and 5, and at which point should be the beginning of the three-wave counter move in the opposite direction of the trend upwards should the Elliott wave Theory hold at this point we will capture some decent down movement, especially if this setup is used on a 15 in 30 or 60 minutes chart.
We must set our stop loss at a couple of pips above position 5, which would mean that the Elliott wave theory has not held out on this occasion, and that price could be set in a continuation upwards of the original trend. However, should position 5 on your chart be a round number and what is also called a big figure number such as 1.3400 which you might see in the USDCAD pair, or 1.300 in the EURUSD pair at the time of writing, then price action might find this as a level of resistance and fall anyway. But as the theory would be negated, we would suggest you consider this and think about exiting the trade and waiting for another Elliot Wave set up. In either case, stop losses should not be more than 20-30 pips.
Example E
Example E is our hedging strategy. In the events that the Elliott wave fails and price action continuous, we must set a buy limit order a couple of pips above the previous trade’s stop loss in order to capture the move from position 6 to position 7 and beyond. If possible, we should monitor this move closely, because as an insurance policy, we need to at the very least make the same amount of pips.i.e. 20 to 30 that we lost in the first trade.
There are many great lending platforms that can offer great returns and make this way of investing far superior to just regular holding. However, the old saying still remains true: if you are not the owner of your private keys, you are not the owner of your cryptocurrencies.
This saying holds true for crypto lending platforms as well. The concept of lending cryptocurrencies is more than outstanding and will surely flourish. However, one must first worry about security rather than be hyped up about potential gains.
A platform might have the best crypto interest rates but fail in some other departments, such as the safety and security of the customers’ assets.
In January 2018, a cryptocurrency lending platform called Davor Coin made an announcement: “Lend us your funds, and you’ll have the chance to win a prize of $1,000,000.” People from all around the globe got overly excited and started lending their money to Davor Coin. Just a week later, the platform received a cease-and-desist letter from the state of Texas.
Davor Coin’s lending platform scheme worked only as long as values kept rising. However, when cryptocurrency values went down, Davor Coin crashed. The platforms such as this one that did not crash were fined by the SEC or given a cease-and-desist letter from the same SEC regulators, which meant they were under investigation for securities fraud.
Bitconnect is yet another great example of such platforms, as is Lendconnect. Both of these companies offered a RoI that was ‘too good to be true’; they indeed were too good to be true. These ‘great opportunities’ are also called Ponzi schemes.
Bitconnect offered a 1% return per day compounded. This certainly couldn’t go on forever. Lendconnect went even further and offered up to a 164% return on investment! What’s shocking is not the attempts of scams such as these, but the number of people that fell for it.
Crypto Lending – What does the future hold?
As they say, money makes the world go round. The same goes for cryptocurrencies as well. It’s evident that some cryptocurrencies are slowly but surely transitioning into crypto assets.
To learn the basics about how to earn interest in Bitcoin and other cryptocurrencies is getting simpler and easier by the day. As soon as these lending platforms find their audience as well as their place on the market, we will witness so far unseen financial tools working together to open the world of finance to everyone, including the unbanked.
Lending your cryptocurrencies is becoming safer, easier, and an overall great way to earn passive income. However, for more safety and better returns, you will have to stick to the best and safest crypto lending platforms that offer good crypto interest rates while still being insured for your safety.
This video continues in the series showing you how you can make money by using hedging strategies to take advantage of breakouts and reversals in the market, no matter what direction. And while there are many different styles of hedging strategies, in this series, we are focussing on a simple way to maximize opportunities while increasing the chance of profitability, no matter which way the market moves and if used correctly, you will be able to utilize this in your own methodology.
While the following is risky – just like all trading, we will show you how to keep setups tight, while implementing clear and precise technical analysis that professional traders use every day in the Forex market. This strategy consists of two parts, the initial trade, and a backup trade. We have eyed an opportunity with multi-month lows for the EURCHF pair.
Example A
Example A is a monthly chart of the EURCHF pair, and we can see that the Euro is falling heavily against the Swiss franc. This is due to the flight to safety, whereby the Swiss franc is seen as a safe-haven currency during the Coronavirus pandemic.
However, the Swiss National Bank will be very unhappy about their currency being so strong and are threatening to intervene in the money markets to correct this. We can also see from this chart that we are approaching lows that have not been visited for five years. Therefore with the threat looming of the Swiss National Bank intervention, and previous reversals from these levels, we can hypothesize that although the continuing risks of the virus are still prevalent, there could be an argument for imminent price action reversal, particularly because of the current strength of the Euro and where the EURUSD is currently riding high around the 1.13 level.
Example B
Let’s take another look at this chart as in example B. While we may see some further downside in the EURCHF pair, our particular area of focus will be on the key 1.03 level. Previously price action found support at this level for several months. We are going to look at putting in a buy limit at the 1.03 level, with a tight stop loss, which, if triggered, we will also implement an immediate sell limit order to target the 1.00 key psychological trading level, which is parity.
Example C
Example C is a one-hour chart of the EURCHF pair, and our setup for the first part of this trade. We have placed a buy limit at the key 1.03 level with a tight stop loss at the 1.0270 level and a profit target of the current trading range around the 1.0550 level.
Example D
Example D, Now let’s look at our backup or insurance trade in the event that price continues to fall in the pair. We want to to set up a sell limit order at the 1.0270 level which is our previous stop-loss, and this time we need a slightly wider stop loss on this new trade at 1.0310, in case the key 1.03 level is initially targeted from our entry, and where we believe it might possibly become an area of resistance before price action reverses again and where will be looking at a target of 1.000 or parity in the pair.
On the second trade, we should be looking to implement a protective profit stop at around 1.0240 level in order to, at the very least, cover the loss from our first trade.
Crypto Lending – Stay away from these platforms (part 4/5)
Not all crypto lending platforms are created equal. While it may be nice to earn interest on your cryptocurrency holdings, it’s not that nice to lose them or get them stolen somehow. While most people invest in cryptocurrencies to earn a profit, not many pay enough attention to the security of their holdings.
This part of the Crypto Lending guide will show two lending platforms that people should consider avoiding. This, of course, does not mean they are unusable. However, these lending platforms have critical flaws that might impact your holdings in a bad way.
XCOINS is a company founded in August 2018 by Sergey Nikitin. Nikitin decided to leverage PayPal and make this operation work. XCOINS lenders allow people to borrow their BTC funds; in return, they get monthly PayPal payments at various predetermined interest levels.
The main problem here is that XCOINS uses PayPal. This makes a lot of room for scams due to how PayPal operates in this domain. Someone can use XCOINS to borrow your BTC, go to PayPal and claim they never got it, and then file a payment reversal with PayPal, which will almost guarantee their funds back.
XCOINS explicitly announced that, in this case, there is no help or support whatsoever from XCOINS. Solely for this reason, XCOINS is a walking red flag when it comes to lending. On top of that, the platform is not exactly the best when it comes to good interest rates on crypto lending.
Salt lending platform made the news for being the first and only crypto lending site of that time. The company was founded in March 2016 by Shawn Owen. It quickly gained much popularity through its ICO. However, while their ICO promised many things (such as loans in many US states where there is no legal ability for SALT to provide such services), they never came through.
Ever since the public saw that many promises did not come to fruition, the project started experiencing more and more speed bumps. They have been under investigation by the US SEC for not declaring their ICO as security. This is not only a problem for the owners, as it can lead to the freezing all of their users’ assets. While they are working on this, the SEC pointed out to many red flags. On top of that, the founder and CEO Shawn Owens has stepped down from his position.
If we compound all this information, we can clearly see that SALT is currently far off from being a safe lending platform.
Check out the fifth (and last) part of our Cryptocurrency Lending series, where we will talk about various scams as well as about what cryptocurrency lending platforms could bring us in the future.
This video is a follow on from Hedging – Making money no matter which way the market moves and Hedging Strategy Via The Ascending Pennant Chart Pattern.
The idea in this series is to incorporate a secondary backup, or insurance policy type trade, in order to maximize the possibilities of breakouts from well-known, tried, and trusted chart patterns that professional traders use. And these setups are better suited to the 15-minute, 30-minute, and 1-hour time frames, where you might expect a larger amount of pips to be made in a trending, or reversing market.
Example A
Example A is a 1-hour chart of the GBPUSD pair, but this set up works with any forex pair.
Example B
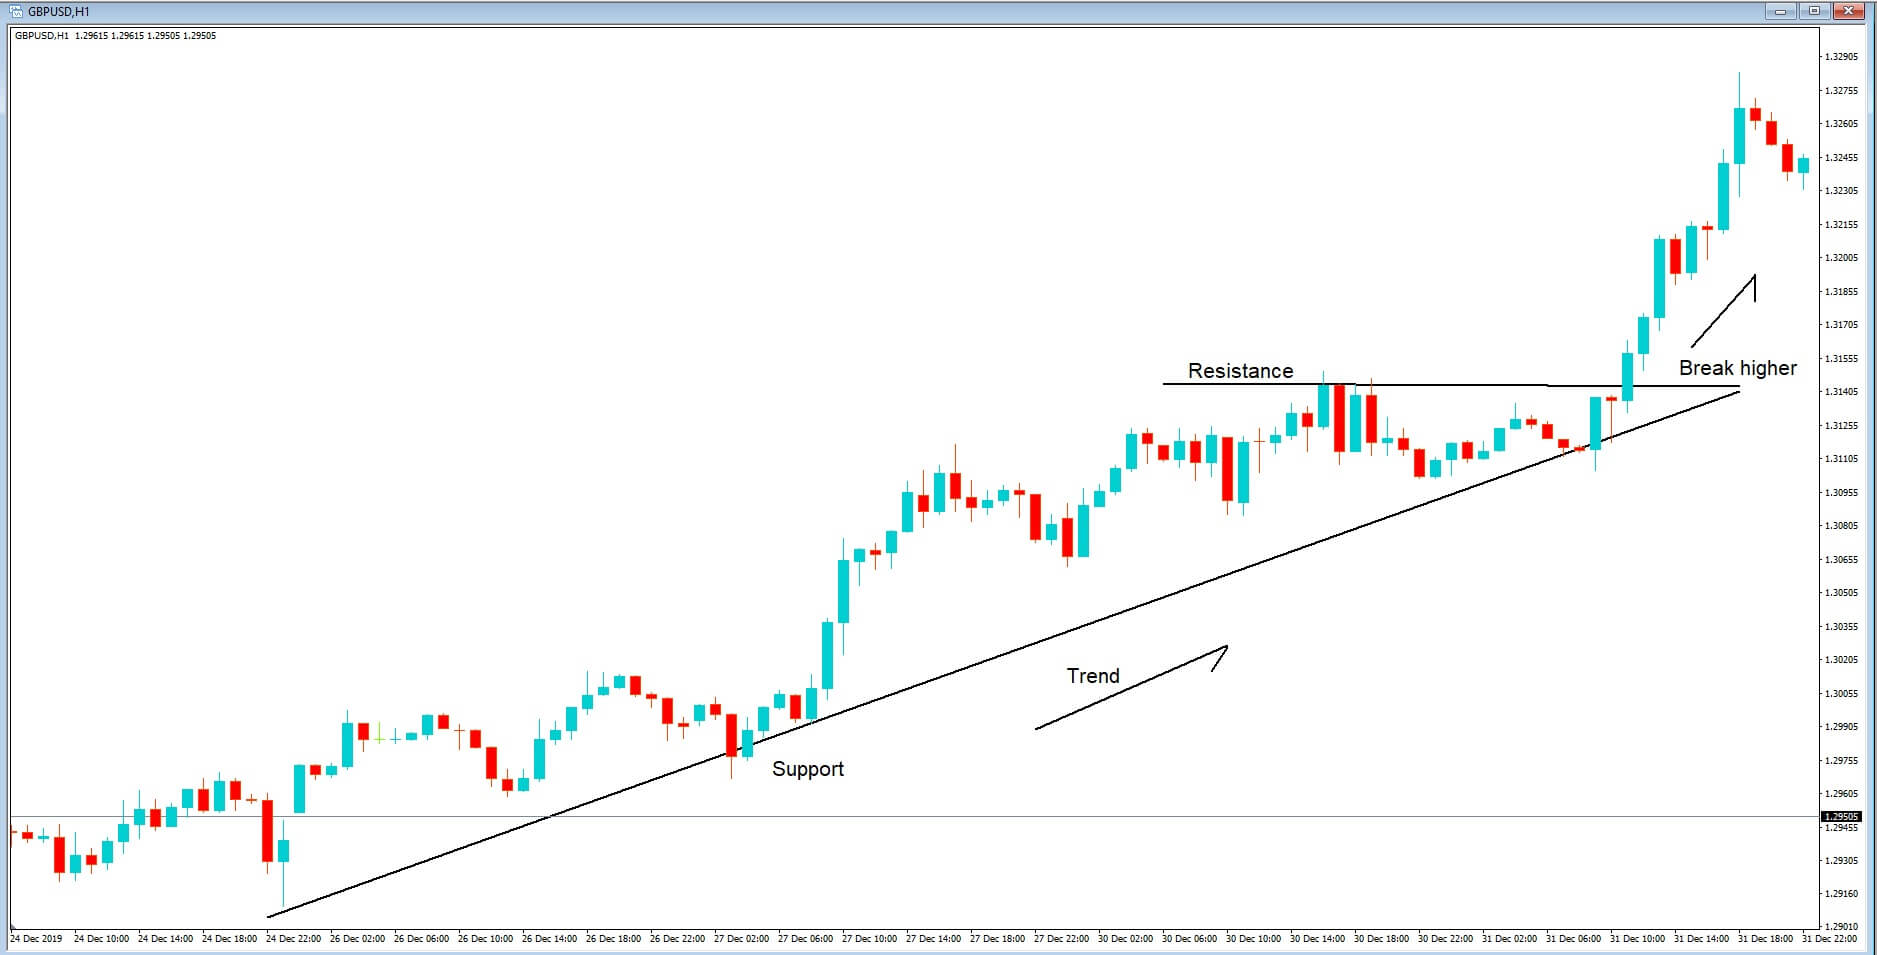
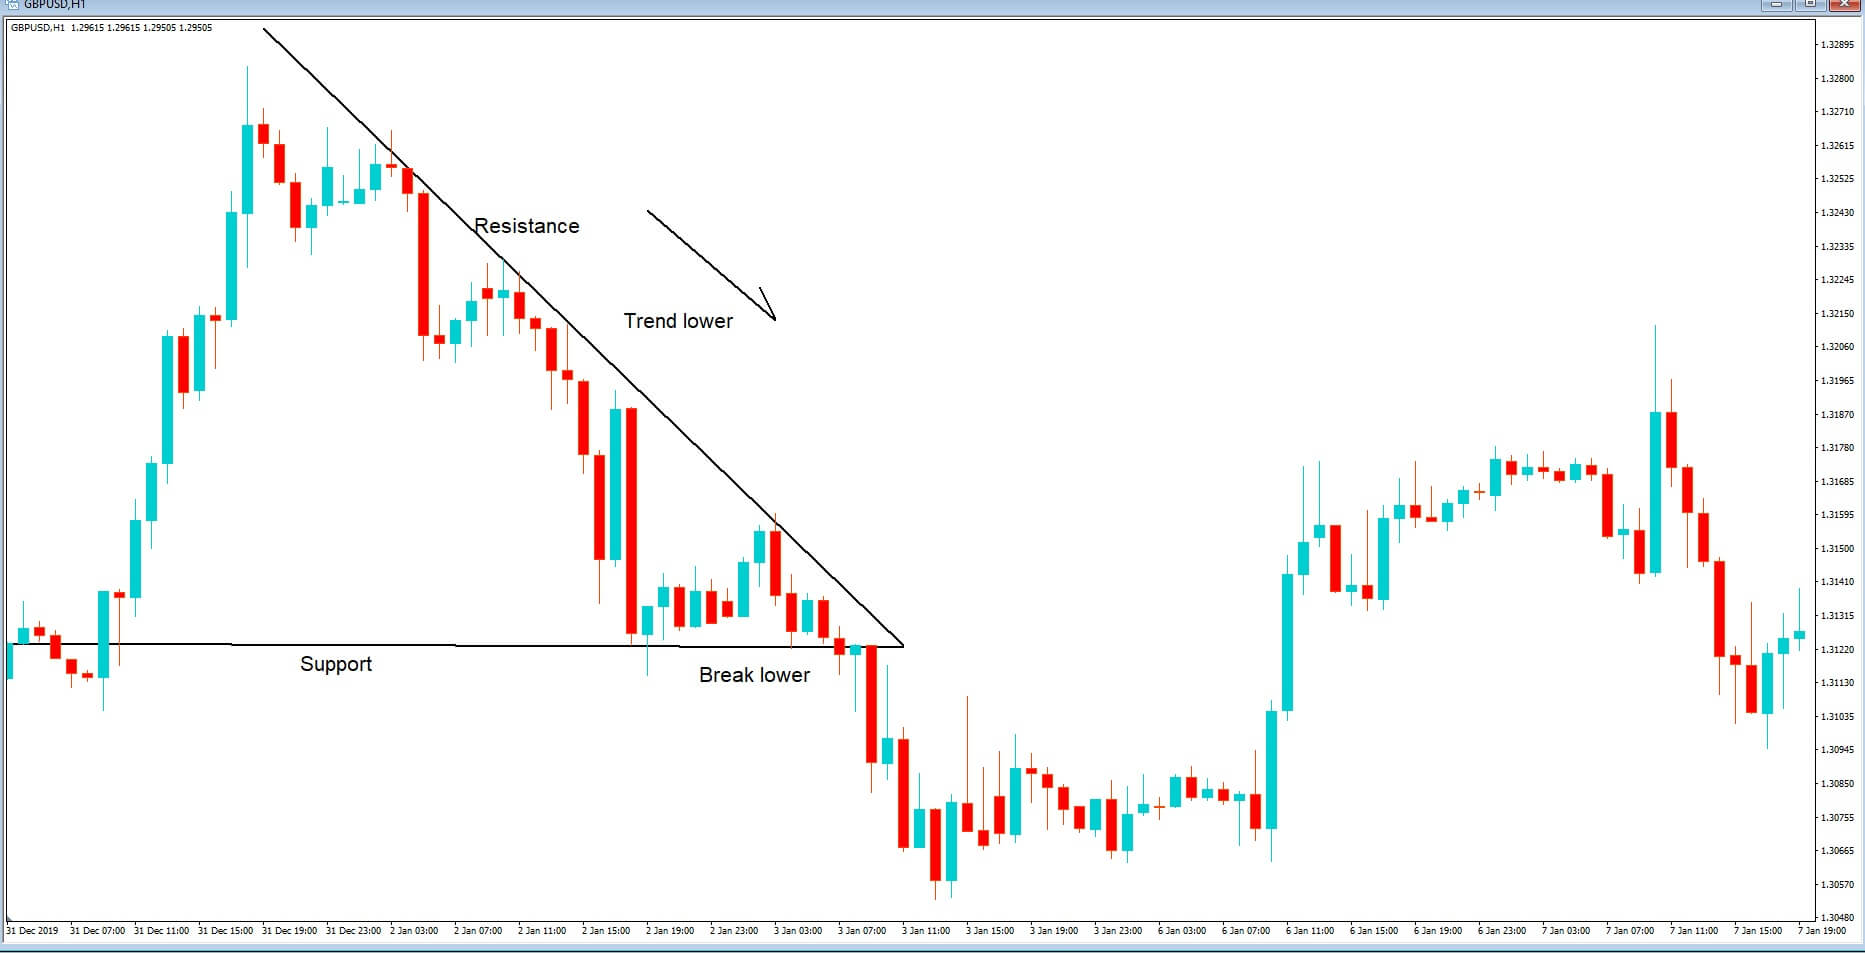
Example B shows that after an initial push higher, price action consolidates in a sideways move and this consolidation is confirmed by at least two attempts to push higher than a horizontal line of exchange rate where price action is rejected and which acts as a line of resistance and at least two pushes lower on a separate horizontal line of the exchange rate which was met with a line of support.
While this see-sawing between the resistance and support levels may continue for some time, one thing is for sure, that eventually, price action will either break to downside or break to the upside.
Example C
Now let’s look at Example C. This is where we will set up our first limit order. Firstly, price action appears to be fading to our support line, as defined by the green line. This fading of price action means that we are more likely, at this point, to see a breach of our support line and a continuation in price action in a downwards direction.
Therefore we have placed a sell limit order a couple of pips below the support line with a stop loss a couple of pips above the resistance line.
Example D
Now we must turn to example D, which is our secondary backup buy limit order, which we believe would be a good insurance policy should price action break the resistance line and move in an upward direction.
In this situation, we simply set our buy limit order a couple of pips above the line of resistance with a stop loss a couple of pips below the area of support.
The idea regarding our hedging strategy is to prime everything in readiness for where we believe the price action will go due to our technical analysis and also to set up a secondary trade in the reverse direction as a backup or insurance policy in case price action reverses in the opposite to the direction where we believe price action will go.
Obviously, it is possible that both trades could be executed and therefore we would advise that you keep an eye on the trade and should both trades be executed and where one triggers a stop loss, the profit target from the secondary trade should be at the very least the amount that was stopped out on the first trade, in order not to adversely affect your profit and loss.
Crypto Lending – Where to lend your crypto? (part 3/5)
This part of the Crypto Lending guide will cover Celsius Network, the third and last platform that we will show as good example of how a lending platform should operate.
Celsius Network – explained
Celsius Network is a company founded in 2018 by Alex Mashinsky. Mashinsky was one of the inventors and patent holders of the VOIP technology. He also holds numerous entrepreneurship awards. Forbes put Celsius Network in their Top10 companies to “watch for” in 2018, noting that the platform “is primed to disrupt traditional banking.”
Advantages of Celsius Network
When it comes to pros of Celsius Network, there are many. First off, users of the platform are allowed to deposit as well as hold their BTC, ETH, as well as several other top 10 cryptocurrencies. There are no fees whatsoever. This means no withdrawal fees, no transaction fees, no deposit fees, no early termination fees, even no origination fees. On top of that, there is no minimum deposit. Celsius accepts funds of any size, and they will never lock up the funds. You can withdraw anytime, whether it is because of an emergency, a better financial opportunity popping up or any other reason.
Celsius Network’s wallet is provided by BitGo (just like for Nexo). BitGo is the leader in using multi-sig encryption technology. Celsius lenders and borrowers are safely insured for up to $100,000,000.00 by Lloyd’s bank in case of a hack or bankruptcy. As with Nexo, this amount is for the company, not for each person.
When it comes to payouts, Celsius Network has weekly payouts for the interest earned. The platform also has great earning interest rates. Its interest rate is somewhere around 8% of interest earned on deposits of USDC, TUSD and GUSD. When it comes to the interest rates for deposits of ETH, BTC and some other cryptocurrencies, they are quite competitive as well, but not as good as the ones previously mentioned. Celsius Network also has rates of up to 10% if you accept to be paid interest with CEL tokens – their native cryptocurrency.
Disadvantages of Celsius Network
When it comes to cons, there are two noticeable ones. Celsius Network’s native token, CEL, has been suspended for the US customers. This means that the US customers can’t benefit from the 10% interest rate.
The other con is regarding their user experience. Celsius Network is only available via a mobile app. Its user experience is far worse than the user experience that its competitors provide.
Check out part 4 of our Cryptocurrency Lending series, where we will cover lending platforms that we do not recommend and explain why.
Hedging Strategy Via The Ascending Pennant Chart Pattern
Today’s video is a follow on from our: Hedging – Making money no matter which way the market moves. So be sure and check that out if you missed it. The theory in this series is that we are looking to maximize successful trading opportunities from areas in price action that are likely to accelerate in either direction. And by covering both eventualities, we create a situation where we can capture the breakout in either direction, even if our initial trade goes against us.
There are various types of hedging, such as selling equities in favor of buying gold or buying one currency pair while simultaneously hedging the position by selling another pair, which might be seen as acting in confluence, in order to spread the risk.
But this is a different style of hedging, where we essentially set up two trades in the opposite direction, while incorporating tight stop losses and where trade one is based on a high probability of a correct move based on our technical analysis and where trade 2 acts as a backup trade, or insurance policy if the market reverses against our technical setup, which, unfortunately, can happen.
Example A
Let’s look at example A. This is the basic pattern you would expect to see on an ascending pennant pattern.
Example B
Now let’s take a look at this setup in a little more detail in example B. Initially we can see that there has been a period of consolidation, where price action is conforming to an area of support and resistance at positions A and B, and where price action remains above a key moving average, which is gradually moving higher, in line with price action, which eventually breaches the area of resistance at position A and a short while after finds support at that level, before continuing higher.
At the top of our charts, at position D, we have a wedge shape formation, which confirms our bullish Pennant chart pattern. Price action has consolidated within the wedge and is beginning to break out from it in an upward direction. From this setup, we would have very good technical grounds to believe that the buyers have got hold of this pair at the current time and that break from price consolidation within the D shaped wedge is likely to be higher, in continuation of the overall trend.
Had you not already been buying into the trend, this is the point at which you might want to seriously consider buying the potential continuation.
Example C
In Example C, we are going to implement our hedging strategy with an immediate buy order at position 1, and a stop loss at position 2.
Example D
In example D, we are going to set up our backup trade in the event that our first trade reverses.
First of all, we are going to put a sell limit order just below the stop loss of our first trade at position 3, and we will place a stop loss for this second backup trade just above our entry of the first trade at position 4. We need to place a take profit at around the area or position 5, which would be equal to at least the amount that we lost in our first trade in order to rebalance our profit and loss. In this a hedging strategy, we have covered all the bases regarding strict observation of technical analysis, and we have carefully placed our orders in order to capture the breakout from this ascending
pennant set up. We have also carefully mitigated against the risk of a price reversal by incorporating a backup trade.
Crypto Lending – Where to lend your crypto? (part 2/5)
This part of the Crypto Lending guide will cover Nexo and BlockFi, two of the three platforms that we will show as good examples of how a lending platform should operate.
Nexo is a company founded in 2017 and is backed by Michael Arrington, the founder of TechCrunch. It has nearly 200,000 customers and even got covered by Forbes. The platform has back payments in 45 Fiat currencies.
Nexo Wallets are provided by BitGo. Therefore, users who borrow or lend Bitcoin or any other cryptocurrency are insured for up to $100,000,000.00. The insurance is backed by Lloyd’s bank. This amount is, however, for the total company in case it gets hacked or goes bankrupt. NEX allows its lenders to have their earnings deposited every single day, rather than having to wait for a week, month or more. They have an interest rate of 8%, with the option to withdraw anytime.
When it comes to user experience, they are top-notch. On top of that, this company constantly strives to get better and makes new beneficial partnerships quite often. When it comes to cons, there aren’t many. However, one comes to mind. Even though borrowers can withdraw in any of the supported 45+ fiat currencies, lenders are allowed to deposit only stablecoins and fiat currencies. Nexo is currently working on supporting BTC and ETH deposits, but they didn’t make any projection regarding the time of realization of this project.
BlockFi is a company founded by Zac Prince and Flori Marquez. It has raised over $20 million of capital from various firms. The company is young and growing at a fast pace. The company offers a 6.2% interest rate on BTC lending and 3.3% on ETH lending, compounded. Granted, this rate is only for deposits under 10 BTC and 100 ETH. The rates for larger amounts of crypto drop severely. When it comes to borrowers, they get a 4.5% interest rate by using the platform.
There is no minimum deposit, and all your crypto holdings are stored with Gemini. Gemini acts as a 3rd party depository trust that is a licensed custodian with insurance. It has a perfect track record when it comes to preventing hacks and fund losses.
When it comes to cons, there are a couple we can think of. The first one only applies to people that want to lend larger amounts of crypto. BlockFi offers digressive interest rates, meaning that the rates decrease to 2.2% and 0.2% for deposits larger than 10 BTC and 100 ETH. BlockFi also offers fewer choices of cryptocurrencies people can earn interest on as it supports only BTC, ETH, and GUSD. The last con would be that the platform is not FDIC insured (though Gemini – which protects BlockFi user’s assets – has a strong track record for security).
Check out part 3 of our Cryptocurrency Lending series, where we will cover Celsius Network as the third good option for crypto lending.
Hedging – Making money no matter which way the market moves
In this video, we are going to show you how to make money by using a hedging strategy that will take advantage of a breakout move in the market, no matter what direction. There are many different styles of hedging, and while some are implemented to protect profit and loss, The following strategy has been developed to maximize opportunities increase the chance of profitability know matter which way the market moves, and hence to create more money-making opportunities with your trading.
If used correctly you will be able to regularly make money using this strategy. Hedging sounds like a strategy that is too good to be true, however, we back up this strategy with a clear and precise methodology, while looking for breakout strategies that professional traders use every day in the Forex market.
Therefore the basis of this ageing strategy is that it should be implemented at such points that markets have consolidated, or has reached high or low peaks which are right for a reversal in price action. With the correct implication you will be able to make money even if you have a short position and the market goes against you, or if you have a long position and the market goes short.
This strategy consists of two parts, the initial trade and a backup trade.
First of all let’s look at a potential set up before we implement this strategy.
Example A
Example A is a pretty standard screenshot that you will see on any of the forex pairs. We have two key horizontal lines A&B and where they would typically be a big figure, or whole numbers, such as 1.2800, which you might see in cable currently, or 1.100, which you might see in EURUSD.
In our chart, we can see that price action has been moving between the two key levels in a series of channels. At position 1, price is rejected and moves lower to position 2 in a channel, and is rejected by the lower key level and moves higher in our second channel from position 2 to position 3.
Critically, price fails to reach the key level or line A. Secondly, we have a Fractal reversal signal suggesting price will move lower and we have what appears to be a third lower channel forming to the downside and where the line of support between move 2 to 3 has been breached by our last bearish candlestick on the chart.
We are going to implement our strategy at this point. The first and immediate thing that we need to do do is to enter a short position, as shown in example B.
Example B
We will need to put our stop loss a couple of pics above our key level, as defined by line A, which has proven to be an area of resistance.
So at this stage, we believe that we have done everything humanly possible to analyze the comings and goings of this trade, and we believe we have taken all necessary steps to pick the correct trade and gone short. However, as we know, anything is possible in the forex market. And that is why we intend two support our trade with a secondary back up or insurance policy trade if you will, and we can show you how that is set up now in example C.
Example C
Should price action reverse and trigger our stop loss we will enter a buy limit order, at, or slightly above the same point as our stop loss on the sell trade, in order to try and capture the reversal in price action and possible continuation upwards in the original trend line between position 2 and 3.
We will also enter a stop loss a couple of pips below our entry-level of the original short trade. Because if the price does move higher, our line of support between positions 2 and 3 will have been confirmed as a line of support. We must also place a take profit level with an aim to at the very least break even from our first losing trade.
No strategy is without risk. The forex market, like every other market, can turn direction in an instant, and never more so than in the current climate, where markets are tiptoeing nervously around the Coronavirus epidemic. As such, we suggest you try and adapt the methodology to your own trading style, or practice the above strategies on a demo account until you have honed your skills before trying it on a real money account.
Crypto Lending – the superior way of HODLing cryptocurrency (part 1/5)
Bitcoin (and cryptocurrency in general) loans are quickly becoming a hot topic. Crypto lending sites and crypto-backed loans are becoming a new way for the investors, hedge funds, miners, and even the unbanked to utilize and leverage their finances as well as to support their business ideas. The HODLers with their crypto bags can also earn interest on their holdings and gain more financial freedom through earning passive income.
The concept is actually quite simple:
For borrowers: If you need a loan to support your business idea or some other endeavor, you will have to put up a small amount of crypto as collateral. After that, you can get a fiat or a stablecoin to use. You will have to pay back the loan according to the agreement.
For lenders: If you want to lend cryptocurrency, you will put up a certain amount of crypto and earn a predetermined amount of interest from it.
From what we have established, we can see that lending crypto is a great way of utilizing funds when you want to hold rather than trade or sell. However, lending cryptocurrencies doesn’t come without risks. If a bank fails, a chunk of their customer’s funds is insured by the government. If it happens that they go down, their customers are at least partially safe. However, what happens with crypto lending platforms and their insurance? You need to consider things such as safety and insurance policy alongside the things you would usually look for in a lending platform (more talk on that later on in the series).
Crypto lending – introduction
Certain studies have shown that when you have passive income, your stress and anxiety levels are greatly reduced. You also spend more time with friends and family, and you are freer to pursue hobbies and interests.
This 5 part series will cover:
What is Bitcoin lending, and why you should take advantage of the best Bitcoin lending sites to earn passive income
What to look for in a lending platform (We will be covering Nexo, BlockFi and Celsius Network)
What NOT to look for in a lending platform (We will be covering XCOINS and SALT)
Security and insurance policy and the importance of these factors.
Check out part 2 of the Crypto Lending series, where we will talk about Nexo and BlockFI, their advantages and disadvantages, and why they are good lending platforms in general.
In a perfect trading world, we would have no risk trades and be able to double up on those trades if we were 100% confident that price would continue in the direction that our technical charts said they should. Of course, there is no perfect world in trading, and absolutely anything can happen at any time, and we have to guard against those eventualities. However, with some careful preparation, we can protect winning trades from loss, and even double up on those trades, with little or no risk, if we prepare carefully.
Example A
Example A is a 1-hour chart of the GBPUSD the pair. On the face of it, it looks like price action reached a plateau in the middle of the chart and then gradually begins to fall. We are in a bearish descending channel.
Example B
Example B, backs up this theory with two simple descending trend lines. The trend lines A and B are acting as an area of resistance and support for price action and where lower highs and lower lows are clearly evident. Therefore a breach higher than trend line A would be considered a bullish move, and a more likely breach of trend line B would be considered as a bearish move.
Example C
In example C price action has breached trend line B, and this move is associated with bearish candlesticks just before the breach. We have chosen to sell at position 1 with a stop loss at position 2 in case price action reverts higher. Should it do so, we would need to adjust our stop loss lower along the descending line of resistance.
Example D
In example D, and in line with our free trade promise, price action has moved lower, and so we have put a protective stop (PSL) just below the entry point of this trade by a couple of pips. No matter what happens now, we cannot lose money on this trade. It is effectively a free trade.
Example E
In example E, price action has continued to fall. Let’s say by 20 pips from our original sell entry. We can sell this position again using the same amount of leverage as trade 1, with a stop loss of 10 pips; and by bringing our protective stop from trade 1 lower and placing it in the same position as our second trade stop-loss, we have effectively doubled up on this trade with no risk of loss. So if trade two is stopped out at minus 10 pips, it will be netted out by trade one which gained 10 pips, minus your spreads.
As price action continues to fall lower, we simply bring our protective stops lower in order to maximize our profit.
Although, at times, the forex market seems to be unpredictable, candlesticks, as denoted by price action, and various technical indicators, create a series of patterns which repeat themselves time after time. And while to the untrained eye, these patterns may look completely confusing, by mastering technical analysis skills. Eventually these patterns tell you an awful lot about where the price is likely to go to in the future.
One such repeating indicator is called the fractal. The fractal indicator was invented by a trader called Bill Williams. It is calculated from a 5 bar reversal pattern and indicates a trend reversal.
Example A
Example A is a diagram of price action as shown by the Japanese candlesticks and whereby the arrows are fractal indicators denoting a potential reversal in price action. Confusingly the arrow points in one direction; it actually predicts a possible trend reversal in the opposite direction. So an up arrow denotes a bearish trend reversal, and a down arrow denotes a bullish trend reversal.
Example B
Example B: A fractal indicator consists of five or more price bars. And the set of rules which apply to them are as follows: A bearish pattern reversal point occurs when there is a bar with the highest high, set in the middle of two bars with lower highs on each side. A bullish fractal pattern reversal point occurs when there is a bar with the lowest low with two bars on either side with higher lows. The patterns shown here are typically what you would expect to see, with the fractal indicator printed above and below the middle bars.
Fractals tend to work better on higher time frames because on the lower time frames, they will throw up a lot of noise and be more confusing than they are worth.
Example C
Example C, However when used in combination with price action and also the key price action levels, such as whole round numbers such as the double 00’s, such as the 1.2800 or 1.2900 levels in our GBPUSD example, they help us to determine if price action is observing these key areas and therefore can be a second confirmation for entry and exit points, the first being price action itself.
Fractals are essentially a lagging indicator and provide us with a delayed signal to enter the market. However, Although it lags behind price action because it identifies trend reversals, it is particularly useful in longer time frames, especially above 15 minutes, where trends tend to continue for a period of time once the pattern has presented itself.
Find because the fractal indicator does tend to pop up on the chart quite often, it is best to use it in conjunction with other indicators as double confirmation.
Example D
In example D of a 4-hour chart of the GBPUSD pair, we can see the fractals are very often adhering to the resistance and support levels on our trend lines while price action is moving down, up and down again on the char, while also supporting the whole numbers.
Experiment with them on your particular trade setup, and we feel sure that you will find a useful way to incorporate them into your trading methodology.
Trading cryptocurrencies using the MACD indicator – part 2/2
MACD Overbought and Oversold conditions
The MACD indicator is great for identifying possible changes in a trend and spotting trend reversals. However, it can also identify overbought market conditions or oversold market conditions.
The overbought and oversold market conditions are presented on the indicator when the MACD line and the signal line are separated too far away from each other as well as from the zero-line.
As can be seen in the picture, the MACD line started to stray noticeably far away from the indicator’s signal line in December 2017. On top of that, both the MACD line and Signal were well above the zero-line at that time.
The combination of the two warned careful investors that the price surge was causing the market to become overextended and that a pullback was becoming extremely likely.
Zero-line explained
The so-called zero line marks the midpoint of the MACD oscillator, splitting the value range in half. When the 12-period exponential moving average crosses above the 26-period EMA, the MACD will cross above the zero-line, therefore presenting a buy signal. On the other hand, when the 12-period EMA crosses below the 26-period EMA, the MACD will go below the zero-line and will present a sell signal.
The histogram, which are the pink bars shown on the oscillator, quantifies the distance that is currently between the MACD line and the signal line. The histogram will print a bar above the zero-line when the MACD line is above the signal line. On the other hand, it will print a bar below when the MACD line is below the signal line. The bigger the size of the bar, the larger the gap between the two lines is.
When the histogram reaches its highest level, it will show the MACD line at its farthest point above the signal line. This situation implies that the rally is becoming overstretched, as shown in the chart.
Conclusion
The MACD oscillator is a great tool for traders that like following trends and spotting trend reversals. It comes in handy to both beginners and professionals alike.
Psychological whole numbers in technical analysis plays a major role with professional traders. They offer key areas of support and resistance. If you have been studying technical analysis for any length of time you will no doubt have realised that price action has a tendency to react to whole numbers.
Example A
Let’s take a look at a 1-hour chart in example A, of the USDCAD pair. We can see that price action gravitated towards the 1.2900 whole number level on the left of our chart, and when it failed to reach it, price action fell back to the 1.2800 whole number. Subsequently price action rebounds to the 1.2900 number and eventually moves higher to the 1.300 whole the number which holds as a level of resistance, before price action toos and fros between the 1.3000 and 1.2900 levels. Institutional traders and commentators call these types of numbers Double Zeros, so you might hear them say 1.30 double zero, or 1.29 double zero or ‘1.29 The Figure’ or ‘1.30 the Figure’, and this pretty much applies to all double zero levels in all Forex pairs.
Example B
Now let’s take a look at example B, and the EURUSD pair on a 4 hour chart where we can quite clearly see that whole number 1.1000 held as a line of support, and where price action moved higher in the middle of the chart to the whole number 1.1100, which initially held as an area of resistance, and where price action goes on to punch through it, before falling back again to the 1.1100 whole number, which is then acted as an area of support and where price action subsequently moved higher to touch the 1.1200 whole number, which acted as an area of resistance.
So what does this tell us about the psychology of the whole numbers? We humans like to keep things simple, we like to use limit orders with round numbers, we like to trade with round numbers, and if we know that everybody has this psychological trait, it is not unusual that we can see why traders use these whole numbers as psychological areas of support and resistance in order to take their profits, and also to place stop losses, and limit orders, at these whole numbers when they trade.
This type of psychology is embedded in our everyday life, we don’t seem to say to people that we will meet them at 10:07, or 10:17, for example. We are much more likely to say 10:00 or 10:15 10:30.
You wouldn’t go out to a bar and deliberately think to take £30.82P. You would just automatically take the £30.00 with you.
You wouldn’t go out with the intention of buying a car for £15,872.20P. You would most likely round it up to £16,000 or down to £15,7500 or £15,500. This is just the way that our minds are geared, and the same applies in the financial markets.
Example C
Let’s return to our EURUSD chart, this time it’s example C, and where we have now included another key number, the five zero, or 50 level, or as per the 1.1050 and 1.1150 as shown. These five zero, or 50 levels are also of significance in trading forex can quite often lead to areas of support and resistance as we have highlighted on our chart.
Therefore we need to have these key levels of whole numbers and 50 levels in our trading mindset because, because of their significance in acting as support and resistance levels. And of course we must appreciate the in forex trading nothing is certain, and that these numbers will not hold true in every single circumstance. However, if we look at our charts objectively knowing that price action does, in most cases, gravitate to and from these whole and 50 number levels it should offer us an extra edge in our trading.
Trading cryptocurrencies using the MACD indicator – part 1/2
While there are many technical indicators that can help with identifying changes in the strength, momentum, or the duration of a trend, none of them are simpler than the Moving Average Convergence Divergence, better known as MACD.
By definition, the MACD indicator turns two moving averages into a momentum oscillator. It does so by subtracting the longer period moving average from the shorter period moving average.
As the MACD indicator is a “lagging” or a “trend following” indicator, it actually trails pricing events that already took place in order to determine the strength of the current trend.
As with most indicators, though, you won’t make money just by understanding the indicator works, but rather by knowing how to use this indicator. However, it is still worth explaining what MACD is, so you have a better understanding of why it is such a widely used and loved indicator.
MACD is composed of three main components: the MACD line (which is the blue oscillator), the signal line (which is the orange oscillator), and the histogram.
MACD line is typically made up of the 12-period exponential moving average (EMA) minus the 26-period exponential moving average.
The signal line is typically the 9-period EMA of the MACD line.
The histogram represents the difference between the MACD line and the signal line.
How to interpret the MACD indicator
It might be hard to explain how MACD works, but it is actually one of the easiest indicators to interpret as everything is represented clearly and visually.
The MACD Cross
When the MACD line performs a cross above the signal line, it is interpreted by the traders as a bullish cross. On the other hand, when the MACD line crosses under, traders know that this is a bearish cross. These crosses indicate a shift in momentum, which can represent a buy or sell opportunity.
As seen in the picture, MACD crosses provide confirmation of a trend change. This is true, at least in the short term.
As an example, the MACD line crossed above the signal line on November 16, 2017, presenting a buy signal. The MACD line stayed above the signal line for over a month, which resulted in the price increasing more than 150% before the next bearish cross. The bear cross, which occurred on December 20, 2017, signaled a change of trend to bearish.
It’s recommended (and almost necessary) to use the MACD indicator in conjunction with some other indicators such as volume or RSI because MACD, just like any other indicator, is not 100% accurate and can give off false signals.
Check out part 2 of Trading cryptocurrencies using the MACD indicator to learn more about how this indicator shows overbought and oversold market conditions as well as about what zero-line represents.
Heikin Ashi – Forex Trading Like A Samurai Warrior!
The Heikin Ashi technical indicator means “average bar” in Japanese, by the people who invented the tool. Heikin Ashi is combined with the Japanese candlestick, with the basic principle being that when functioning together on a chart, they have the effect of smoothing out a lot of the noise you get in forex trading while making charts more readable and making trends easier to analyze.
The Heikin Ashi has the same four data points, open, low, high, and close and the ordinary candlestick, however, they have some unique maths behind them and differ from that of a normal candlestick.
The close is an average of the open, high, low, and close of the current period. The Open is the average price of the previous candlestick.
The low is the least one of these three numbers: the current period’s high, the current Heiken Ashi candlesticks open, or the current Heiken Ashi candlesticks close. Whichever one of these is the smallest number is the low for this candlestick.
As traders, we can use the tool to show us more clearly when to hold on to a trade while also identifying when a trend may have run its course and thus showing us when to exit a trade.
As most profits are gained when markets are trending, it is important to have any tool available to help us more clearly identify those trends and thus help us to maximize our profits.
Example A
Example A is a 5-minute chart of the USDCAD pair using only Japanese candlesticks and where price action appears to be quite choppy.
Example B
In example B, we have added the Heiken – Ashi indicator while setting up the colors of our bars to match those of our candlesticks. We can already see that there is a noticeable difference and where we previously might have expected some price action reversals, the Heiken Ashi averaged out some possible turns and would have kept us in the trade.
Let’s go back to Example A in case you missed them.
Example C
Now let’s revisit our Heiken Ashi chart one more time as per example C, where we can see three areas that filtered out the noise and would have kept us in those trades a little longer in order to bag extra pips.
So when we look for a smoother Identification in trends, the Heiken Ashi will definitely help us to filter out some of the noise associated with standard candlesticks. That’s because normal candlesticks tend to alternate color even if the price action is predominantly moving in one direction. However, Heiken Ashi trend to stay blue in up trends and red in downtrends, or depending on how you have your candle colors setup.
Example D
Anything that gives us an edge is welcomed, and a lot of traders prefer Heiken Ashi over Japanese candlesticks, especially when they are as effective in Example D at identifying overall trends, in this case, a sell-off of the USDCAD pair on a one hour chart showing a 700 pip sell-off.
Let’s take a look at some simple rules when trading Heiken Ashi:
Example E
1: Example E, Blue candles with no wicks to identify strong upward trends. These offer strong bullish signals, so let them run
Example F
2: Example F: Blue candles identify an uptrend; you might want to add to your bull position and close out short positions.
Example G
3: Example G, Candles with short bodies and long wicks show market indecision and possibilities for price action reversals. You might want to close your positions and wait for confirmation of a new trend direction.
Example H
4: Example H, Red candles identify a downward trend. You might want to look for opportunities to add to your short position. And exit long positions.
Example I
5: Example I, Red candlesticks with no wick signify strong downward price action. You might want to exit your long trades and add to your short positions as price action moves lower. And stay in the trade until there is an indication of price action reversals.
Therefore the Heiken Ashi can be a great technical tool in your armory.
How to make money in crypto using Fibonacci retracements – part 2/2
What do Fibonacci levels represent?
The Fibonacci levels used within crypto trading are 23.6%, 38.2%, 50%, 61.8%, and 100%. They represent psychological barriers that repeatedly show up within the crypto markets.
Another interesting aspect of Fibonacci levels is (as with many indicators), the fact that they become more accurate with more people using and respecting them. This falls under the “self-fulfilling prophecy” paradigm.
The Fibonacci retracement levels consist of horizontal lines that highlight areas of expected support and resistance. To create these Fib levels, you’ll need to draw a line between the lowest and the highest price of a particular trading cycle.
It’s up to the trader to choose whether they will use wicks or candles.
Fib retracements are a very popular tool amongst technical traders, as it allows them to identify levels where they can place their entry or exit points. More times than not, the market tends to struggle near these Fib levels.
Whether it is nature or a self-fulfilling prophecy, these levels do seem to work, and there are many traders that utilize Fib levels to profit in the volatile crypto market.
One thing to note is that you will never know how far the price will retrace exactly. This means that you can’t predict which Fib level the price will respect. That’s why it’s better to carefully watch the markets and wait for a level reaction before entering a position.
Can Fibonacci retracements be used with other indicators and tools?
Yes, they can. In fact, it’s highly recommended to use Fib retracements with some other indicators. If other tools and indicators overlap with the results of the Fibonacci retracement levels, the expected result is that much more realistic.
An example of using Fib retracements
Fibonacci retracement levels are very efficient when it comes to predicting a bounce off of a big red candle, upon the completion of a quick rally. These (fairly) quick trades can generate some good profit if timed properly.
Conclusion
Many traders use the Fibonacci retracements to decide where to set their buy orders. However, most of these traders use indicators such as volume and some momentum indicators alongside Fib retracements to increase the overall security of their decision.
How to make money in crypto using Fibonacci retracements – part 1/2
The Fibonacci retracement level tool is one of the most popular and most effective tools in crypto trading (and trading in general). This tool is associated with helping traders determine the key levels to place buy and sell orders.
Traders who properly know how to utilize this tool can determine crucial levels of support and resistance with ease. However, to fully understand how and why this tool works, we have to go over how the Fib retracement tool has been created.
About Fibonacci
Leonardo Bonacci, widely known as Fibonacci, was an Italian mathematician born in 1170. Besides being a brilliant mathematician, Leonardo was also an avid traveler.
While traveling, he discovered a Hindu-Arabic numerical system that he explored. He saw that this system had some advantages over the current European system (at that time).
Bonacci published a book called “Liber Abaci.” The book included examples on how to use these calculations in every day uses such as bookkeeping, weight and measurement conversions, and human interest calculations, among other things.
Fibonacci Levels
An interesting proposal within Bonacci’s book was based on an observation of how the population of rabbits grew in ideal conditions. The solution to the rabbit problem was found within a mathematical sequence, which we now know as Fibonacci numbers.
What’s even more strange is that this was not the first time that this sequence of numbers was recorded. In fact, there were many more.
The ratio of numbers, which we know today as the Golden Ratio, was discovered by a Greek architect called Phidias between the years of 500BC and 432BC.
So, why are these levels important in trading?
The history and the research of many people showed that the Fibonacci sequence is found all over the geometry of nature. This sequence can be found in things like animal skin, DNA structure even spirals within a seashell.
Most financial markets (and the cryptocurrency market is no exception) will reveal this Golden Ratio on its time and price periods, where a retracement of 61.8% is typically found after a 100% gain or loss.
Conclusion
So to sum it up, Fibonacci retracement levels are referring to simple areas of support and resistance, and that is derived from the way nature works. These retracement levels are often used by traders to determine how much a move to one side will retrace once it stops. This way, they can have a better grasp on support and resistance levels as well as possible entry and exit points.
Check out part 2 of making money using Fibonacci retracements to see examples of how these levels work in real trading.
We hate to say I told you so, but we pretty much called this crisis out back in January, in our article about How to guard your financial assets against the Coronavirus Outbreak.
Those who heeded our warnings had a great opportunity to convert equities to cash, while stocks were at an all-time high, which would have safeguarded them against the biggest equities crash in market history. Other aspects pertaining to the crisis have been largely fluid, with the possibility of a virus outbreak in Japan, initially, USDJPY pair went to bid, targeting the 112.00 handle, and when that did not happen the yen currency reverted back to being a safe haven. And where just a day ago the pair found support at 110.0, it is now tumbling and currently trading at 108 70.
Similarly, the rhetoric from the Swiss National Bank that they were happy with negative interest rates and ready to intervene in the markets in support of a weaker Swiss franc, which has been ignored by the markets, while the USDCHF pair has moved lower and is currently training at 0.9650, flying in the face of the SNB’s threats.
Yesterday also saw the biggest daily move in almost seven months in an otherwise subdued performance of the EURUSD pair, which pushed 125 pips higher and where it hit a high of 1.1050. Amazing, bearing in mind that only yesterday, the German health minister warned of a high probability of the Convid-19 virus causing an epidemic in Germany.
This has led to the dollar coming off its highs above 99.00 on the dollar index to below 98.00 currently, while the market price in a 0.5% interest rate cut at next month’s Federal Reserve meeting. And of course, the possibility of supply chains being affected by the virus outbreak, and signs that the problem may cause more damage to the US and indeed the global economy than was previously predicted.
None of this has been helped by the fact that US equities, until last week, were at record highs, and one wonders why that was the case, especially as the levels were not supported by traditionally more modest earnings to value calculations. And the fact that the world may well have been fed false information from the Chinese Government regarding the contagiousness of the virus in the early days, and that they would get it under control. The proverbial stuff really hit the fan when the virus took hold in South Korea, Hong Kong, and Italy, and when that started to affect airlines, who restricted flight destinations and whose stocks suffered immediately, then the second contagion set in market panic selling.
So where do we go from here? The markets are going to be incredibly data-sensitive, and will also be focusing heavily on policymakers’ decisions with regard to what financial tools they will implement in the event of further escalation of the crisis. Overall, we expect further toing and froing of the dollar index, further flight to safe assets, including precious metals such as gold, yen, and Swiss franc. And further weakness in the Canadian loonie, which recently found resistance at 1:33 against the dollar, but which has now punched well above 1.34 area as oil prices continue to fall.
Cable is capped at the 1:3000 level due to its spat with the European Union and the continuing risk that it may not be able to complete a trade deal by December 2020, leaving the possibility of WTO trading rules needed to be applied and the obvious disarray confusion and the likelihood of a damaging fall out between the two sides. We expect the pair to find support at 1.2750.
AUDUSD and NZDUSD both remain southbound; such is their dependence on exporting to China.
Looking forward, canny traders and investors will be waiting on the sidelines for the virus to abate, supply Lines reinstated, and positive market data before confidently coming back into the equities space on a buying spree.
Until then, expect more market volatility, and thankfully, fewer tweets from President Trump, who has been noticeably quiet this week.
How to make money in crypto by utilizing Golden and Death cross
Whether you want to use them or not, you will need to understand how moving averages work in order to understand some more advanced indicators. However, trading by using only moving averages is not uncommon and can be extremely profitable. Today, we will be talking about the Golden cross and the Death cross. These two occurrences are quite rare but powerful signals that traders are looking for.
They occur when the short-term and long-term moving averages cross. When the cross is to the upside, we are talking about the Golden cross. If the cross is to the downside, it’s called the Death cross.
Both Golden and Death crosses have predicted some of the worst economic downturns of the 20th century. As an example, the Death cross predicted bear markets in 1929, 1938, 1974, and 2008. When talking about cryptos, they are very popular as they underscore the strength and potency of the primary trend. This, in turn, enables traders to navigate the chaos that is the crypto market.
Golden cross
The Golden cross is an event that occurs when a short-term moving average crosses over a long-term moving average to the upside. This occurrence signals to traders that they can expect a strong bullish move.
There are two main requirements for a golden cross to be a good indicator of a move:
It has to spell an end to a sharp downtrend due to seller exhaustion.
The short-term moving average has to rise above the long-term moving average (traders typically use the 50-period for short and 100-period or 200-period for long moving averages).
As seen on the picture and highlighted in green, a Golden cross occurred on the daily BTC chart in March 2019, signaling a strong move to the upside and away from the low of $3,122.
Starting March 12, 2019, BTC price rose by as much as 260%, from $3,859 all the way up to near $14,000 on June 26.
The Golden cross is more accurate when analyzing long time frames.
Death cross
The death cross is the complete opposite of the Golden cross. This occurrence has two main requirements for it to be a true Death cross:
A death cross is created as an end to a bull trend due to long-term buyer exhaustion.
It shows up when the short-term moving average crosses beneath a long-term moving average (traders typically use the 50-period for short and 100-period or 200-period for long moving averages).
As seen in the picture, BTC showed greater bearish conditions on March 30, 2018, as the 50-day moving average crossed below the 200-day moving average. Following this Death cross came a 54% decline in value, namely from $6,850 all the way down to the bottom of $3,122 by December 15.
The Death cross is best identified when looking at longer time frames (just like the Golden cross).
Conclusion
Golden and Death crosses are great ways to determine trend changes on larger time frames. However, as with all indicators, they’re not always perfect. However, they are respected by the traders and, therefore, very valuable in the crypto trading community.
Triangle formations are another key tool used by technical traders to gauge potential price action moves based on triangle patterns that form on their charts.
Such patterns regularly occur and where traders will draw the patterns on their screens themselves rather than using a technical tool to do the job for them. The triangles can then be used areas of support and resistance around these triangle formations in order to trade from.
So what is a triangle, or wedge as it is sometimes referred to as? It literally is what appears to be a triangle based on price action, where traders will identify these areas by drawing lines onto their screen charts, such as in example A.
Example A
Here we can see a low point and a high point, as marked on the chart, and where are we have drawn two lines which act as resistance and support, the rules of which require that price action must touch both lines on at least on two occasions, which they do at positions 1 and 2.3 and 4, and where price action goes through a period of consolidation and becomes wedged to a point that it must eventually break from, either lower or break higher. In this situation It breaks higher from the triangle, and where the previous area of resistance at its furthermost point goes on to become an area of support, from where bulls come in and drive price higher.
Example B
Example B is an ascending triangle formation. It offers bullish setups and where the main characteristics are price action moving higher, with a flat top, which is confirmed by at least two attempts of price action to move higher than the area of resistance. Here we can see that the price action trend is higher and where price action is largely following our support line until price action flattens off and where we see resistance forming at the furthest most point of the wedge. Traders will be looking for a break higher or a break lower from the wedge. In this situation, we have a break higher and a continuation with the overall upward trend.
Example C
Example C is a descending triangle. This shape offers bearish setups. Again we have at least two confirmed attempts to breach the area of support and at least two attempts to move higher than our area of resistance and where the overall trend is moving lower until price action eventually breaks lower from the furthermost point of our triangle shape.
Other shapes in this category include falling or descending wedge formations, where price action is contained within two narrowing lines and is identified by lower highs and lower lows such as, in example D.
Example D
Also, a rising or ascending wedge, where price action again is contained in two narrowing lines, but this time identified by higher highs and higher lows, such as in example E.
Example E
In both wedge-shapes, traders will be looking for a break out as the lines narrow and where the breaks usually prove to be good entry points for trading the opposite direction as the previous trends run out of steam.
Example F
Slightly more complex are the symmetrical triangle shapes as in example F, and where we would identify lower tops and higher bottoms with an almost flag-like appearance, and where we can see our confirmed area of support and resistance is breached and where price action eventually moves lower and where our initial area of support becomes an area of resistance.
We would usually look for our initial breakout from the first area of price action to reach the peak of the initial high. However, the shape is considered neutral with no real particular bias.
The next shape is a bullish Pennant and is defined by an initial upward trend with a triangle shape based on a slightly ascending support line with a confirmed area of resistance with lower highs and where we would expect a breach higher from this triangle shape formation such as in example G.
Example G
Our final shape in this series is the expanding wedge, which, as the name would suggest, is an area of price action that expands as it moves forward, as in example H. This might typically occur as extra volume enters the market after a period of tight consolidation.
Hedging Your Cryptocurrency Portfolio Part 4 – The Best Methods Explained
Perpetual Swaps
Perpetual swaps (or just perpetuals) have recently grown in popularity. More and more cryptocurrency exchanges are starting to offer them. Their use is quite similar to that of inverse futures. However, it does have some differences, mainly:
The periodic funding rate (usually 8 hours)
No expiration date
Why Would You Use This Method
The key reasons for using this method are the same as with using futures. The main difference would be that the short funding rate means that perpetual swaps closely track the underlying prices (much closer than the futures). On the other hand, this also means that your hedging cost may vary (as funding rates are re-adjusted every 8 hours).
Not having to deal with rollovers reduces your trading costs as well.
How You Construct This
The portfolio construction is exactly the same as inverse futures. Check out part 2 of our series to see how to construct this hedging method. The only difference is that you will need to have an account on an exchange that offers perpetual swaps.
Summary
Just like hedging with futures, hedging with swaps is best suited for cryptocurrency investors that carry the standard coins rather than ones that are well diversified. It is also for the investors that want to hedge their exposures efficiently. A good understanding of perpetual swaps is highly recommended, as you will need to assess the risk of using financial derivatives fully.
Pros and Cons are mostly the same as for futures, so this table will list the differences between the two:
Bonus: Why Do People Hedge?
Most investors in the cryptocurrency industry probably want the exposure as they expect their favorite crypto to “go to the moon.” However, in some cases, they might want to stay safe for certain reasons. Those reasons are dependent on what position they have in the industry:
Miners
Miners need to pay their electricity bills as well as other costs in USD or their native currency. For this reason, they might want to have more predictability on their capital returns. They could sell their cryptocurrencies directly, but it may be more beneficial for them to stock up their cryptocurrencies and sell them in one larger batch periodically. This way of selling cryptos is better as they can negotiate better fees and reduce certain transfer costs. Therefore, miners will hedge to reduce their risk while they are piling up cryptocurrencies to sell them in a bigger batch.
ICO Projects
ICO projects often incur various costs in USD. They often have a need for a more predictable cash flow, which is why they might want to sell some cryptocurrencies they hold. However, they do not want to be seen selling their own tokens or funds, as that could be interpreted as a weakness and send off a bad vibe to the investors. Therefore, ICO projects hedge to keep their cash flow more predictable while maintaining the trust of their investors.
Funds
Certain funds employ strategies that are based on a return that is relative to Bitcoin. In this case, they would have to overlay their portfolio with a BTC equivalent hedge so the returns they get become relative to BTC’s performance.
Whales
Selling a significant amount of cryptocurrencies is not as easy as it can cause market fear. Whales need to make sure not to cause big market drops when wanting to cash out. Therefore, their alternative would be to put hedges in place. This reduces their overall exposure as they slowly sell their holdings over a longer period of time.
You have no doubt heard the phrase hedging your bets. So what does it mean in financial trading and how can it be applied? The basic principle of hedging your bets In financial trading is to reduce the risk of loss on a trade by counterbalancing the risk of loss by introducing a second or third trade in some way in order to offset risk. There are several ways that traders use hedging strategies to reduce risk.
In the vast majority of cases hedging is used by institutional size traders who have large portfolios and will quickly move in and out of an asset, dependent on risk, and on risk off factors, or they will offset some of the risk by hedging strategies. In current market conditions there has been until very recently Direct correlation between the the USDJPY pair, and the DOW 30, and where the USDJPY has been acting as somewhat of a barometer in the COVID-19 outbreak. So here we would find that when the pair is moving higher this will have been reflected in the DOW 30, and vice versa. In which case to offset risk some institutions might reduce the size of their investment in one of these assets and take a position in the other to reflect their risk appetite. This could be trading in the same direction, ie going long on both, or even going short on one, and long on the other. It is all about their perceived risk.
Another strategy would be where a swing trader had a medium term view of the u.s. dollar index or DXY, where they might be looking for a target of 100.00 and rather than just going short on GBPUSD they would prefer to hedge their bets by going short on two or three pairs, such as GBPUSD, EURUSD and then perhaps a long position such as buying USDCAD. All of these trades would favour a long position on the USD, and where a trader would not necessarily require all three to be in profit in order to make this an overall winning trade.
But a direct hedging strategy on a single pair yeah where is an entirely different strategy and is usually taken on by Traders with larger size portfolios, who prefer their drawdown or how much they are losing on their profit and loss, or who like to be liquid in a trade which means being long and short simultaneously on a trade which usually favours volatile markets.
Example A
Let’s look at example A, where such a strategy might be implemented. This setup applies to any currency pair. At position A and B on our charts, we have have a defined area of consolidation which is confirmed by at least two points of price rejection along the line at position A, which can be confirmed as a level of resistance, and at least two point of rejection at position B, which can then be qualified as a support line.
In this example, the pair has broken out of the range at position C, and where traders will have started going short. Now, as we know, price action does not move in a straight line, we see periods of pullbacks and further consolidations in the majority of trades. But in this example, traders will have gone short at position C and where he/she has an exit target at position X.
Knowing that will be pullbacks, some traders who like to adopt a hedging strategy might go long at position 1, 2 and 3 to to make some money on the pull backs, and if they are right they can get out before the price continues lower, and we’re at the very least if price action returns to the previous high they will have a net profit position which they can close out.
If price action does continue in the vein that we have described they will get subsequent profit from other pull backs. As a contingency they can set very tight stop losses on their long trades, even bringing their stop losses in front of their entry, which is allowed on some platforms – such as the Metatrader MT4, thus
making their long trade completely risk-free.
Traders will also go long and short at the same time on a pair during times of news and data releases. And even overnight. Although then swap rates begin to kick in and tend to work in the favour of the broker’s who set the fees for overnight lending.
Therefore, unless your trading is pinpoint accurate and you are extremely confident with your entry and exit points, hedging can complicate your trading, but if you have developed a system of accurate entry and exit points, with tight stop loss implementation, hedging strategies can be a great way of reducing risk of loss and maximizing profits.
Options
Options are a fairly new and limited concept in the cryptocurrency space. The only exchanges that actually offer it are Deribit and Bitmex.
Hedging using options can be pretty complicated. There are multiple ways you can build exactly what you want. We will show one of the most straightforward ways you can hedge out downside risk.
Why You Would Use This Method
One of the main benefits of hedging by using options is the difference in the payout. Hedging by buying put options can turn your existing options into a call option payout (which have limited downside with unlimited upside). The caveat to the method is that options, especially in the cryptocurrency market, are quite expensive.
Another great thing is that the margin does not need to be monitored as we are purchasing options to construct the hedge. These pros make it a fairly good method for investors that:
Are looking to hedge their positions but cannot, or don’t want to monitor their margin requirements Want the downside protection while still maintaining the potential upside gains.
How to Construct it
You will need:
An account with Deribit (they are the only exchange that offers crypto options)
The steps to constructing this method are similar to using futures:
Based on the current price of Bitcoin and your expected hedging time frame, check for the closest in the money (ITM) put option.
As an example, if BTC is at 6432 and you would like to hold it until the end of the quarter, look for the 6500 put option pricing for the end of the current quarter.
Check the current price of your chosen ITM put option and calculate how much funds you would need to deposit so you could make a 1:1 coverage of your BTC holdings.
Deposit the predetermined funds into the exchange.
Purchase the put option and simply hold it until expiration.
Summary
Hedging with options can be quite a complex task. However, this also means that it can be better tailored to your needs. If you want to use options to hedge and you want to hedge frequently, learning all there is about options is certainly a no-brainer.
Options hedging, as any type of hedging, has its Pros and Cons:
Check out our final part of the Hedging your crypto portfolio, where we will talk about hedging by using Perpetual Swaps.
Futures represent financial contracts that obligate the buyer to purchase a certain asset (or the seller to sell a certain asset) at a predetermined future date and a predetermined price.
Just like in traditional finance, cryptocurrencies have futures contracts that you can use to hedge out your position. Crypto market comes with two types of futures:
Futures that trade in USD and settle in USD, such as CME Bitcoin Futures and CBOE Bitcoin
Futures
Inverse Futures that trade in USD pricing, but settle in BTC, such as Bitmex Quarterly Contract Futures
The profit and loss calculations work slightly differently for these two methods. However, they can both come to the same result.
An example of the investment is (if you wish to hedge your position fully):
Calculation explained:
As Bitmex offers only BTCUSD and ETHBTC futures, we need to convert ETH to BTC first. As the contracts are denominated in ETH, we will:
Short 10 ETHBTC futures
Factor this into our BTCUSD hedge. The total short of the BTCUSD position = $6,500 x 10 + $200 x 10 = $6,700
By using this method, your portfolio will be fully hedged (as long as you make sure to maintain your hedge).
Why Would You Use This?
Futures contracts are a fairly cost-efficient way of hedging out your risk. This is because:
You have a lower capital requirement due to the leverage you can use.
You can profit from the hedge over time if the market goes in your favor.
You know the full cost of your hedge the moment you place the hedge on, unlike some other methods of hedging.
How You Construct The Hedge
In order to start hedging by utilizing futures, you will need:
An account with a crypto futures exchange.
To construct this hedged portfolio:
Choose which future contract you will use. Your decision should depend on which currency you wish to settle in and fund the exchange.
If you are settling in USD, you can sell some crypto to fund the account. However, keep in mind that withdrawals and deposits could take some time to process.
Based upon your holdings and what is available on the exchange, you need to calculate which combination of futures contracts you need as well as how many contracts.
Monitor your short positions profit and loss so that if you are getting close to your margin call, you will need to deposit more USD or cryptocurrency into the exchange to maintain your short position.
Depositing into the exchanges can take some time, and since crypto markets are very volatile, make sure to do everything in time.
Close out the short position when you think there is no reason to hedge anymore.
Summary
Hedging by using futures is best suited for cryptocurrency investors that carry the standard coins and are not overly diversified into altcoins. Hedging by using futures is very efficient but requires knowledge of the market as well as futures themselves.
If you are looking for ways to hedge out your crypto investment exposure, this guide will cover four different methods that you can use:
Short Selling
Futures
Perpetual Swaps
Options
Selling vs. Hedging
The first question that should be asked is, why is there a need to hedge when you can just sell. This point will be covered in each hedge method section individually to avoid any misunderstandings.
Short Selling
This is the most straightforward method of hedging out your investments. All you need to do is to short sell the cryptocurrencies so that your portfolio will look like shown on the picture (assuming you want to hedge your exposure fully).
Why Would You Use This?
Long-term investors say that you are better off just selling your cryptos as the cost of short selling is higher for the amount of margin funding cost. However, hedging is good for reducing risk in the short-term.
There are several reasons why hedging crypto in the short term is better than selling:
Once you sell your cryptocurrencies on the exchange, the proceeds of the sale remain on the exchange until withdrawal (which isn’t always that easy). This makes your funds subject to default risk. Short selling requires you to have fewer funds on the exchange (which is not the best to store your cryptos on). If your hedge period is short, the process of selling, withdrawing, and then depositing and buying back could be too slow.
How To Construct This
For this method, you are required to have:
An account with any exchange that provides the option to short sell (Optional) USD for maintaining margin in your account
We will be using BTC as an example of constructing a short-sell hedge:
1. Deposit your USD into the exchange that provides the option to short sell. If you do not have any USD available, you can deposit some cryptocurrency and sell a fraction of it
2. The amount of USD that should be on the account will depend on the margin requirements of the exchange
3. Put on a short position on the cryptocurrency that you want to hedge against at a 1:1 ratio. As an example, hedging 10 BTC at a 1:1 ratio will require a short position of 10 BTC
4. Monitor your short positions to avoid reaching the margin call.
6. Close out your short position when you decide to close out your hedge.
Summary
Short selling as a hedge method is best suited for investors that are already diversified, and that want to hedge as selling parts of their portfolio would take too long.
There are quite a few pros as well as cons to using short selling for hedging. This table shows some of them:
Check out the next part of the Hedging your cryptocurrency portfolio, where we will talk about using futures as a hedge.
If you missed our earlier article, a financial black swan event is usually a catastrophic event such as the Japanese earthquake and tsunami of March 2011, or virus breakout events such as the Sars epidemic in 2002/2003, Avian flu, or the Ebola breakout in West Africa in February 2014.
These events cannot be predicted and have the risk of severe consequences for the global economy. Black swan events are thankfully rare and have a severe market impact. They are also almost impossible to predict.
The latest COVID-19 breakout in China could turn out to be a major black swan event, with severe implications for the global economy.
While previous black swan events such as the 2003-2004 Sars epidemic wiped 14% off of the S&P 500 in as little as two months, it subsequently went on to recover its losses and gained from there. The avian flu crisis in 2006, the Ebola crisis in March 2014, both had similar effects, where the S&P slumped at the time only to recover and thrive after the events. It would, therefore, seem that stock indices, especially in the USA, such as the S&P 500 and DOW 30, have taken that onboard and, as yet, have suffered no real sustained selling pressure. And although both have recently hit record-breaking all-time highs, we might expect normal ebbing and flowing based on US fundamentals until the real global impact of the COVID- 19 can be seen in terms of hard data. And that won’t be available for several weeks. History tells us that the markets are prone to short jolts during such events, but they go on to recover, and in many cases, make further gains than were lost.
Another fairly typical scenario would be for investors and traders to bail out of riskier assets, such as equities, but that isn’t happening in the USA at the moment. And where safe-haven assets such as the Yen or Swiss Franc currencies get bought.
However, when the Japanese health expert who visited the Diamond Princess at the port in Yokohama said the situation on board was “completely chaotic” it left the market wondering if there could be an outbreak of the disease in mainland Japan, who earlier in the week said the virus could impact their GDP by 0.2%. This, coupled with weak data and the possibility of a spread of the infection in Japan, saw the USDJPY pair punch through the psychological 110.00 barrier this week. Should there be a breakout, it will prove catastrophic for the Japanese economy and where we might see the pair accelerate to 115.00 and beyond.
With the Yen failing to act as a safe haven we might see a continuation higher in USDCHF, where the Swiss National Bank has made it clear they are not happy with a strong Franc, and they will defend this stance by intervention, in which case we might see a return to the 0.1000.00 level.
The pound and Euro have their own problems with uncertainty regarding if the UK can reach a trade deal by the deadline of December 2020 and where the economic data coming from the Euro area looks bleak and where Germany is struggling to achieve growth. The COVID-19 virus will not help.
The Australian dollar is also on the back foot due to its dependence on trade with China as with New Zealand, and we might see AUDUSD hit 0.63 and NZDUSD test 0.60 in the short term if there is no immediate resolution in China, which looks highly unlikely.
Oil prices are at risk, and we would expect gold and precious metals to remain bid.
The Chinese government has committed to honoring the trade pact with the rest of their partners across the globe, but the longer this goes on, the more likely the markets will doubt if this is possible.
And so while the US economy remains strong and while economically and geographically it remains on peripheries of the virus event, and with its higher interest rates than the other safe-haven currencies, we should now see a further surge in the USD DXY which is approaching the psychological 100.00 level and which is now being seen by the markets as a safe haven currency and preferred investment choice.
Therefore, all scenarios are strictly data dependant and likely to be fluid and volatile as things unfold.
In mastering technical analysis, one of the key pattern formations is the double top and double bottom, and it is essential that you understand what this is, and that you develop your skills for identifying it, and implementing it in your trading because these patterns will recur time after time. It will provide you with invaluable information when it comes to trading around it. Double tops and double bottoms will enhance your trading by showing you where potential reversals in price action may occur, whether or not they form the basis of technical support and resistance levels.
Example A
So what exactly is a double top? Let’s take a look at example A, which is a 5-minute chart of the GBPUSD and where only price action is shown on the chart.
Example B
Now, let’s drill down a little further on this chart as per example B, pair and where we have a high at position A and where we have had a pullback, followed by another push higher at position B, and where the price action stopped at the same level as position A, before selling off again.
So what is the rationale behind this double top? Traders read their charts from left to right, because they tell a story of how price action is unfolding as time goes on. Firstly we have the area of support which has seen price action fails to go lower on at least two occasions, which will have been observed by traders, and where price action moved higher from this line, and then ran out of steam at position A, before retreating, and whereby traders would again keenly observes the area of support and therefore started to close out their short positions when price failed to breach the support line while expecting a reversal. This does indeed happen and where we see price action move up to position B, and where traders would have noted the reversal at position A, and used that as a possible area of resistance, and therefore exited their long trades when price failed to move higher than position A, and thus leaving a double top formation.
Example C
In example C, we have the reverse, which is a double bottom formation, where we can see that price has failed to breach the resistance line at positions 1 2 and 3, before moving lower to position A, and where price action failed to move any lower and where it reversed before failing to reach the resistance line, and then has a second attempt to move lower to the support line at position B. Thus forming a double bottom formation.
Incidentally, we can see that eventually, price action does move higher and breaches the line of resistance at position 4, which then becomes a line of support for future price action.
Traders can potentially use price action alone to trade without the need to rely on other indicators. When doing this, they rely on Japanese candlestick patterns and formations, and one such pattern is the pin bar formation, which we will look at in great detail in this presentation. Traders try to identify reversal patterns, and pin bars are high on their list because they offer a high probability of success, and especially in volatile market conditions.
Example A
Example A is what you would expect to see when looking for bullish or bearish pin bar formations. The formation is dependent on one single candlestick, and will typically be larger than its immediate preceding candlesticks and represents a rejection of a move, followed by a sharp reversal. The pin bar reversal, as it is sometimes referred to, consists of a short body and a wick, or tail, which is at least three times the length of the body, thus making them easy to identify. The area of the pin bar’s wick defines the area of price action that was rejected. Traders would read the formation as identifying a reversal in price action and a continuation in the direction of the wick.
Example B
Example B looks at these shapes more closely and identifies the expected move of any subsequent price action.
Example C
Example C shows a bullish pin bar trading strategy in action on a real chart of the USDCAD pair on a 4-hour chart. Here we can see a bullish reversal pin bar at position A. The reason that we can be fairly confident that this is a potential set up to move higher is because we can see that the previous candlesticks have found a support area as defined by our line and where candlestick A has gone down and touched that support area, only for the majority of the price action to be reversed. Had we decided to take this trade on, we would have placed a stop loss just below the support line, and we can see that on this occasion, we would have been nicely rewarded with a push higher in price action.
Example D
In example D, we can see a bearish pin bar set up on the same pair at a later date. The pair has witnessed a move higher and where at candlestick A we can easily identify a bearish pin bar setup. The subsequent candlestick moves lower, and this enforces our belief that we are going to get a reversal in price action and that indeed happens. Had we taken on this trade and placed a fairly tight stop loss, we would have been nicely rewarded again.
A word of caution, trading pin bars is essentially gambling that price action will reverse in the opposite direction of which might have been a trend, and which is therefore almost counterintuitive. Trading pin bars might be a result of many factors including economic data releases, price action hitting key levels of support and resistance, or simply running out of steam, newsflow, policymaker speeches, or other unexpected events, and therefore we do not recommend that new traders use these setups to trade unless they are experienced.
However, pin bars can also offer a warning of when to exit a trade, rather than necessarily looking at it as an opportunity to trade in the opposite direction.
Convid-19 USDJPY acting as a barometer to sentiment
The coronavirus, or to give it its technical name, Convid-19, is dominating the financial markets, which are broadly holding their nerves and apart from a few jitters, overall remaining steady at the moment. And this is because of a lack of information regarding the true economic impact of this breakout. This can only be analysed with data, and because we are in the early stages, there is no clearly defined economic basis to say how this has or will affect the global economy. In the past, events such as the Avian flu, Ebola, and Sars have all caused losses on global equities and where safe-haven currencies such as the Yen, and Swiss franc have been bought along with gold and precious metals and where oil has been sold off due to perceived risk to a global economic slowdown and flight to invest in less riskier assets.
But the markets have learned that on each of these occasions, the markets have subsequently turned around and rallied at some point close to, or after the event has passed. Although China now is a much greater power than at any time of these previous events and has a significantly higher percentage in terms of global gross domestic product which is estimated at nearly 20%, the Chinese government has said that it believes that the economic impact of the virus will be short-lived and that it will meet its trading obligations with its global partners.
While this has pacified the markets to a certain extent, one wonders about the reality of this virus which seems not to be coming under control as quickly as the Chinese government led us to believe, and where some analysts wonder if indeed the West has been given a true picture of what is going on in mainland China regarding the outbreak and the true extent of those infected and dying. And of course, if it does turn into a pandemic, the above sentiments will change in a heartbeat.
Until such time as the true economic statistics have been released by the Chinese government, the markets will be driven by snippets of information being released on daily statistics from China of those infected and dying and the number of incidences outside of China, and more importantly should any such incidents begin to spread in other countries will be of the utmost interest.
In order to trade cautiously at these times, and especially for those traders who may not have access to real-time news release information from entities such as Reuters or Bloomberg, One way to try and gauge their sentiments of the markets is to to keep a close watch on USDJPY pair, which has been acting a somewhat of a perimeter two news releases surrounding this event. Any sell-off in the spare air or short spikes either indirection will most likely be on the basis of a news of events regarding the virus and where traders and then go fishing to find out what that information is.
Example A
Let’s take a look at a couple of examples. First of all example A, is a 1-hour chart of the pair.
Example B
If we drill down in more detail at this chart as in example B, we can see that the Yen was losing ground against the dollar on the 4th of February at position 1 our charts, and this was because the Chinese government said it had the virus under control and that it would meet its trade obligations and that the impact to its growth would be minimal and short-lived, and market sentiment became more positive and drove price action up to a key area of 110.00.
However, jitters ensued as the virus continued to give bad news with cases breaking out in other countries, and the Yen became a safe haven currency again as the market moved from position A to position B, as the sentiment is again reversed. And by the 10th of February price action moves up again to test the 110.00 key area before spiking above it at position C,
However, the sentiment which drove the pair up initially during our uptrend at position 1 is reversed buy a hammer blow at position 2, when the market learnt of a massive increase in the number of deaths overnight on the 12th February, which amounted to 250 people, and which sent the pair back to position D. This A B C D formation confirms consolidation and with A and C acting as an area of resistance at the key 110.00 level, and where the B and D confirms a support line.
The move to position one coincides with improved sentiment around the crisis, whereas the move lower, from position 2, coincides with negative sentiment, and where at position 3, the price action has become muted and has not returned to the top line of resistance, which would strongly indicate the high probability of negative sentiment and the likelihood of a move lower to retest the support line and beyond as mood sentiment becomes soured.
Five proper trading strategies for trading crypto during turbulent periods – part 2/2
This video will touch upon three more ways of dealing with turbulent periods of the crypto market.
Following the Trend
If you did your research and concluded that trend would continue for a while, or if it is too hard to predict when the price will change its direction, following the trend is a more risk-averse strategy. With this strategy, you should trade with the trend rather than trading with the swings. If the market is trending up, open only long trades. If the market is dropping, open only short trades. Trend followers start trading only after a trend has been established, while they exit when the trend changes. This trading method is also called “Position Trading.”
There is quite a number of tools that you can use to maximize profits as well as to minimize risks. These include margin trading, leverage, and stop-loss orders.
Advantages: Strategy such as following the trend is more of a risk-averse strategy. It works if the market, whether the market is going up or down.
Downsides: Crypto markets are unpredictable, so you will need good mechanisms put in place to protect against sudden changes in price direction.
Investing in Staking Coins
Employing this strategy will require doing some serious research.
Staking coins and tokens are the assets that perfectly align with the diversification goal an investor might have, as they generate staking profits over time. All you have to do is to buy them, lock them and stake, therefore becoming a validator node in their network. Validator nodes receive rewards for generating new blocks and securing blockchain networks. There are many staking coins and tokens out there, such as DASH, NEO, Lisk, Qtum, etc.
Advantages: This investment strategy doesn’t require any additional maintenance from you.
Downsides: You are still exposed, to some degree, to the ups and downs of the market.
Investing in a Tokenized Crypto Fund
If you want to collect some form of profit from all of the strategies mentioned above, you should opt for tokenized crypto funds.
These funds are pools of investor capital that are managed by a team of professional investors. Fund managers use a range of strategies to earn returns on all of the capital within the fund. Investors that join the pool benefit from having access to the skills professional traders have, while the professional traders benefit from having much more capital to work with.
Tokenized crypto funds examples
There are some examples of tokenized crypto funds available to the public. Crypto20 is an autonomously organized crypto fund that functions as an index fund for, but for cryptocurrencies. This is not the only crypto fund available, as there are quite a few nowadays.
Conclusion
In times of panic and market downfall, experienced investors usually come out on top. By using the right strategies and having a cool head, it’s possible to be profitable during all market conditions.


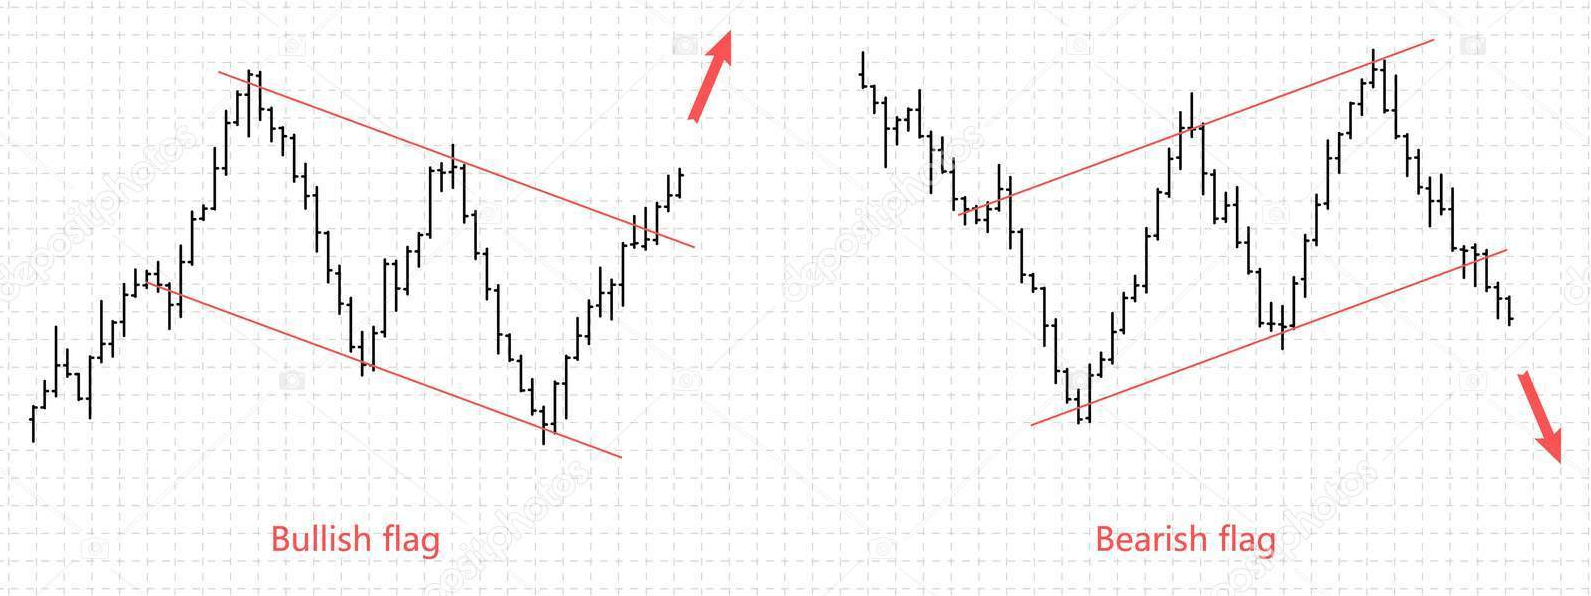
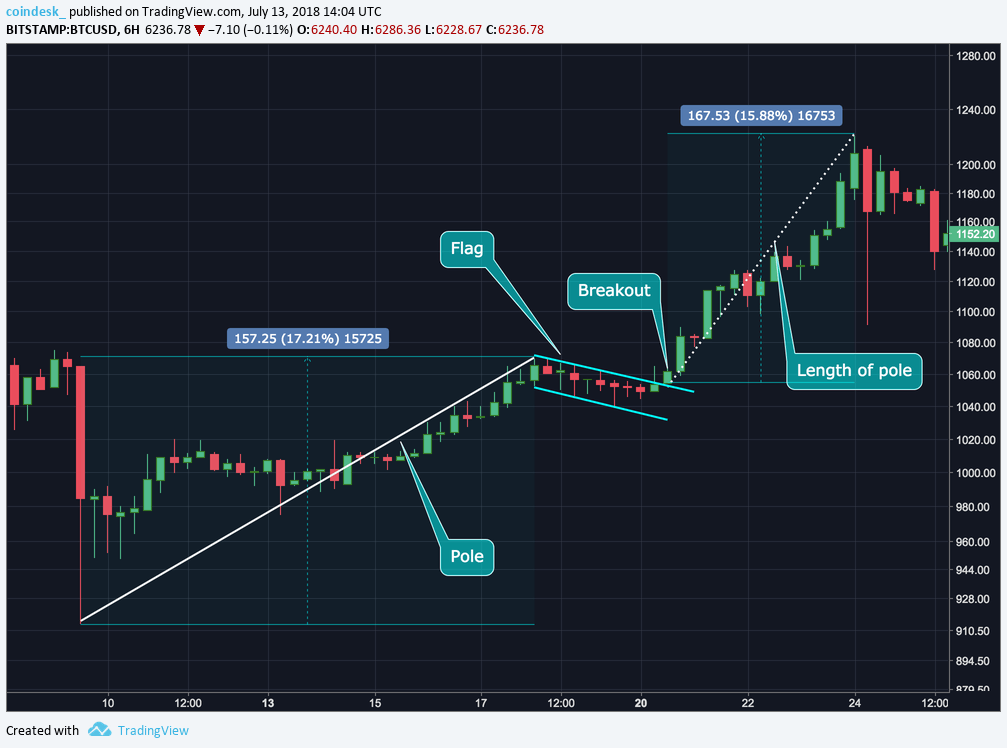
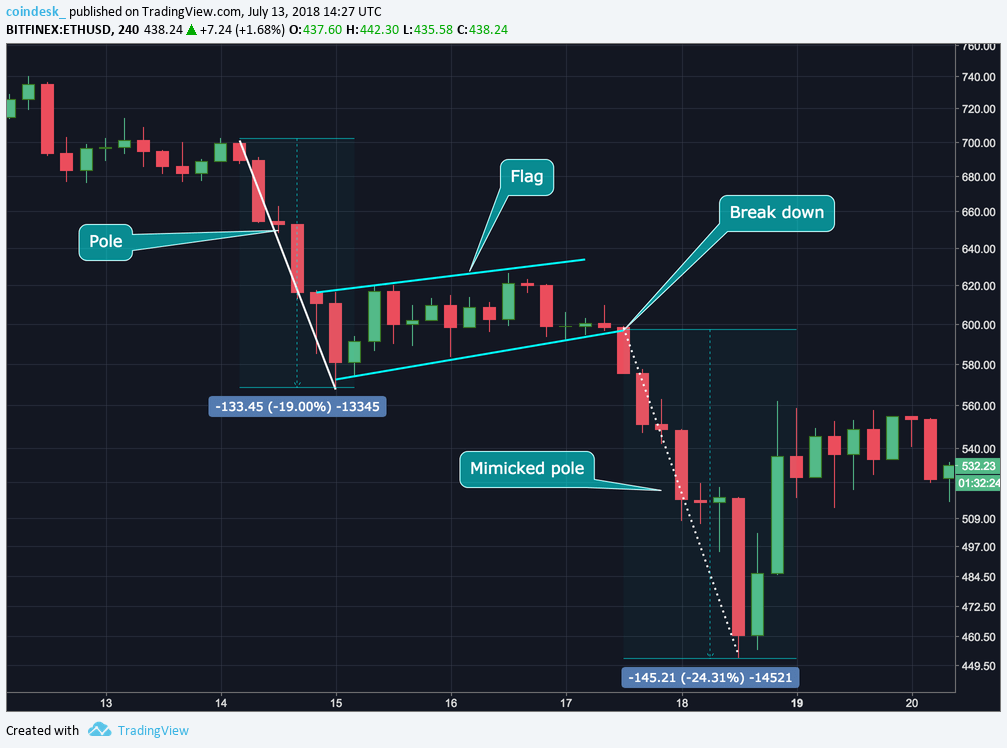
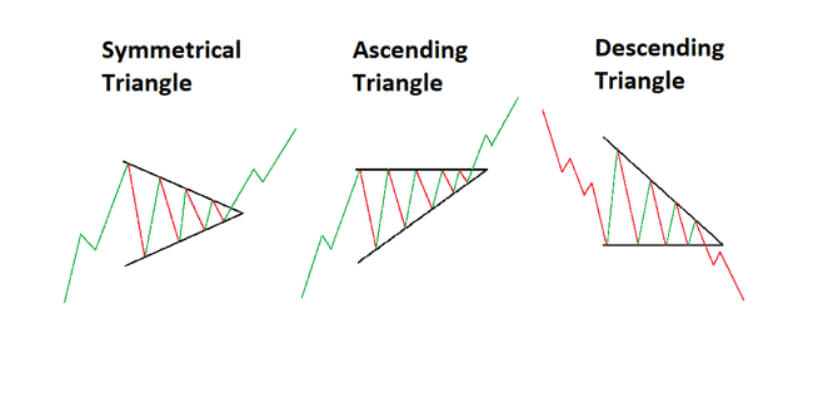
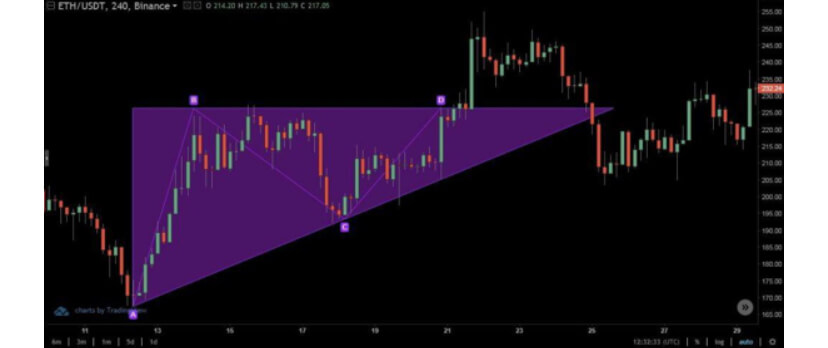
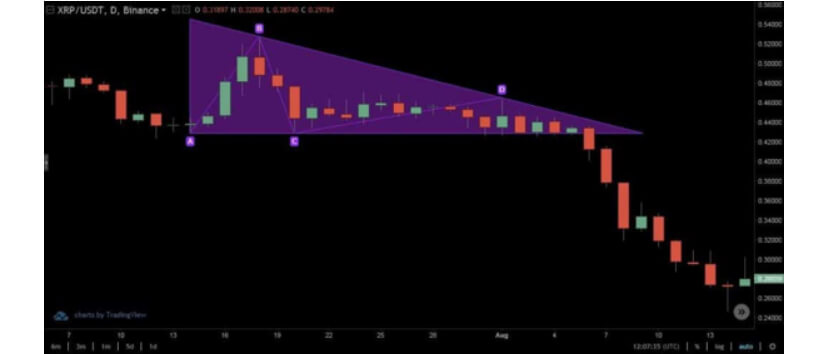
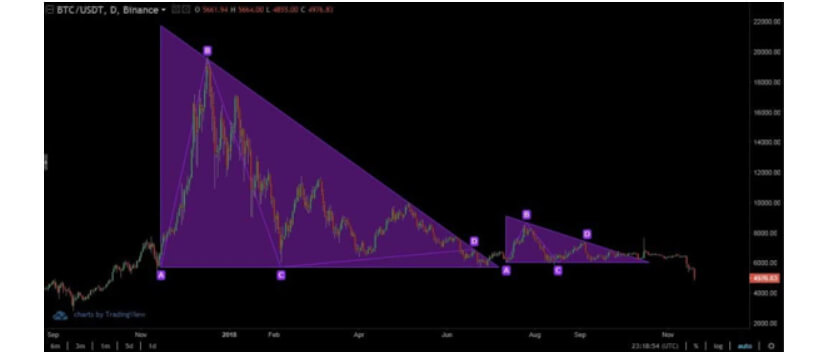
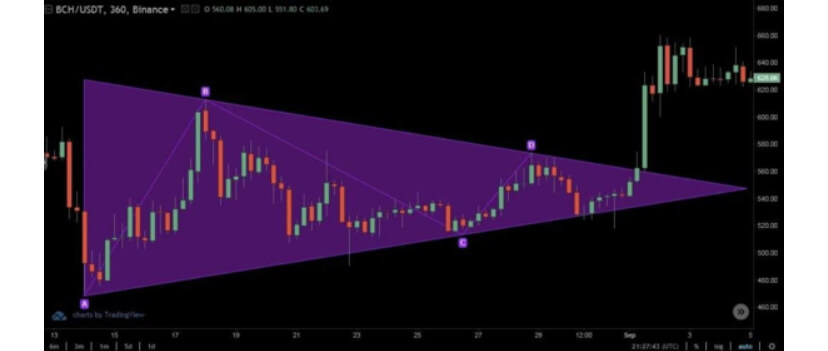
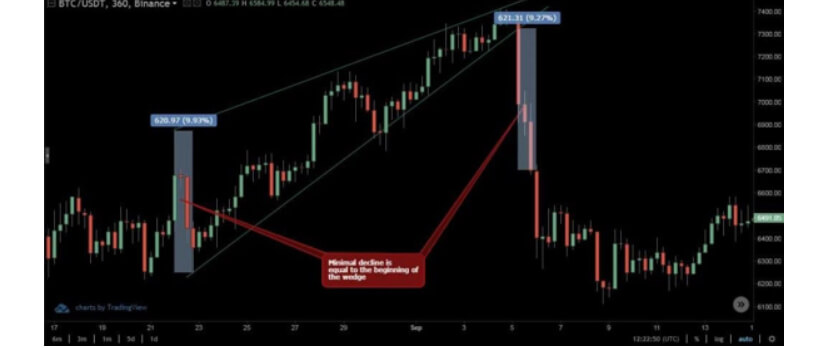
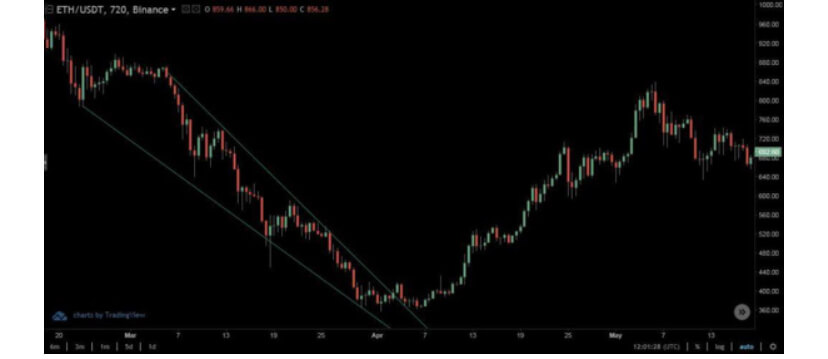

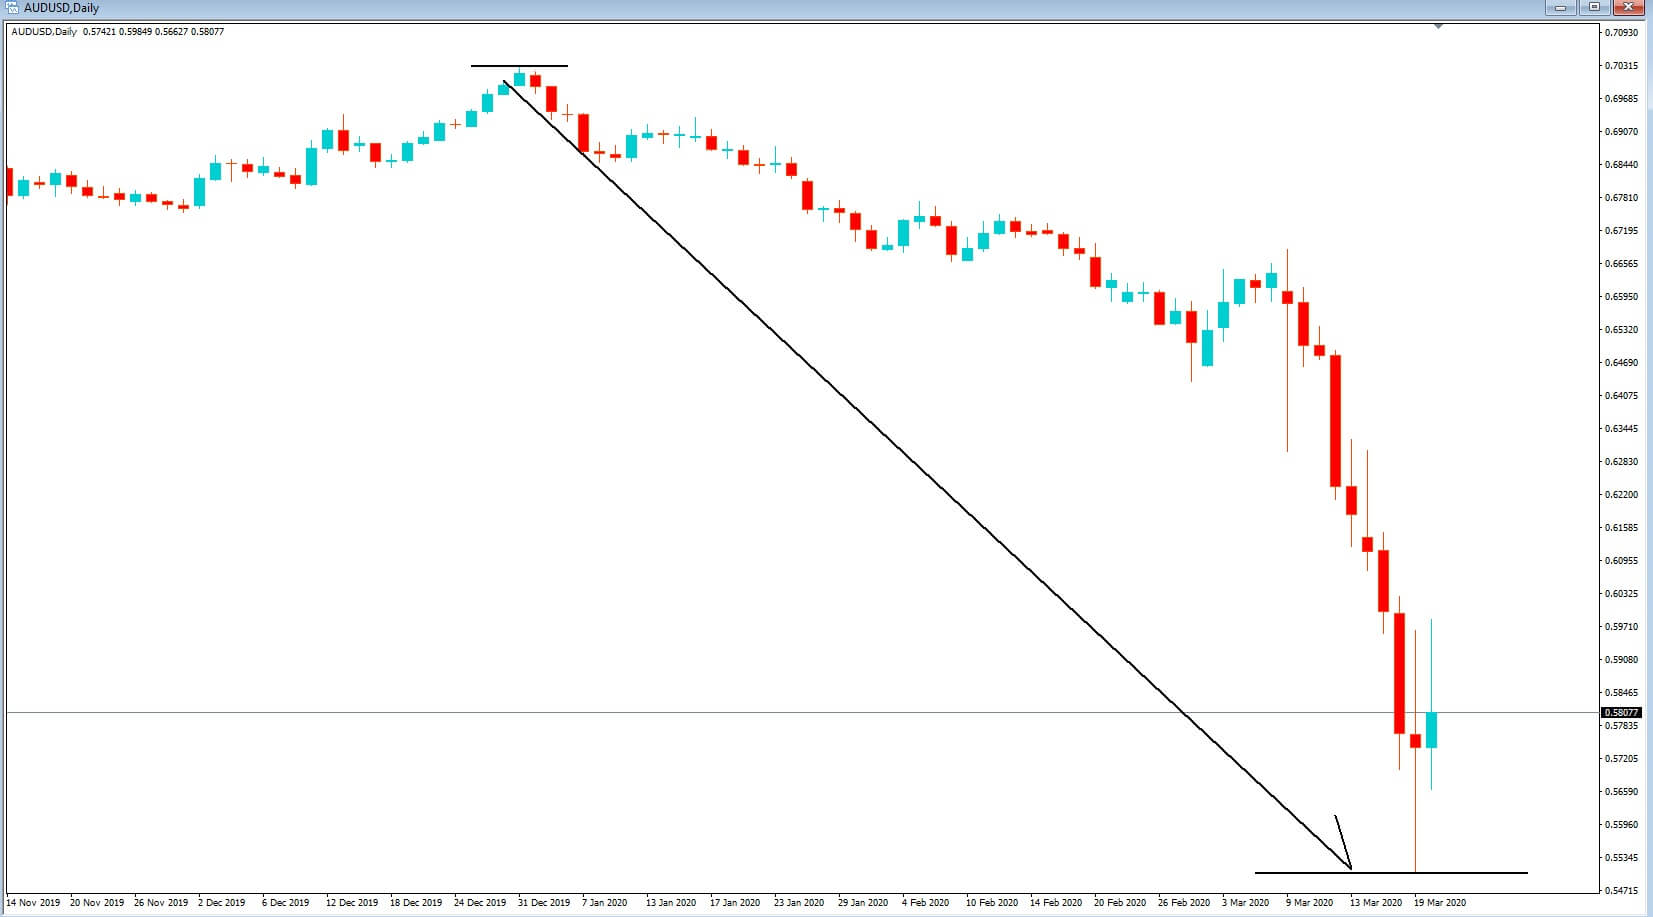
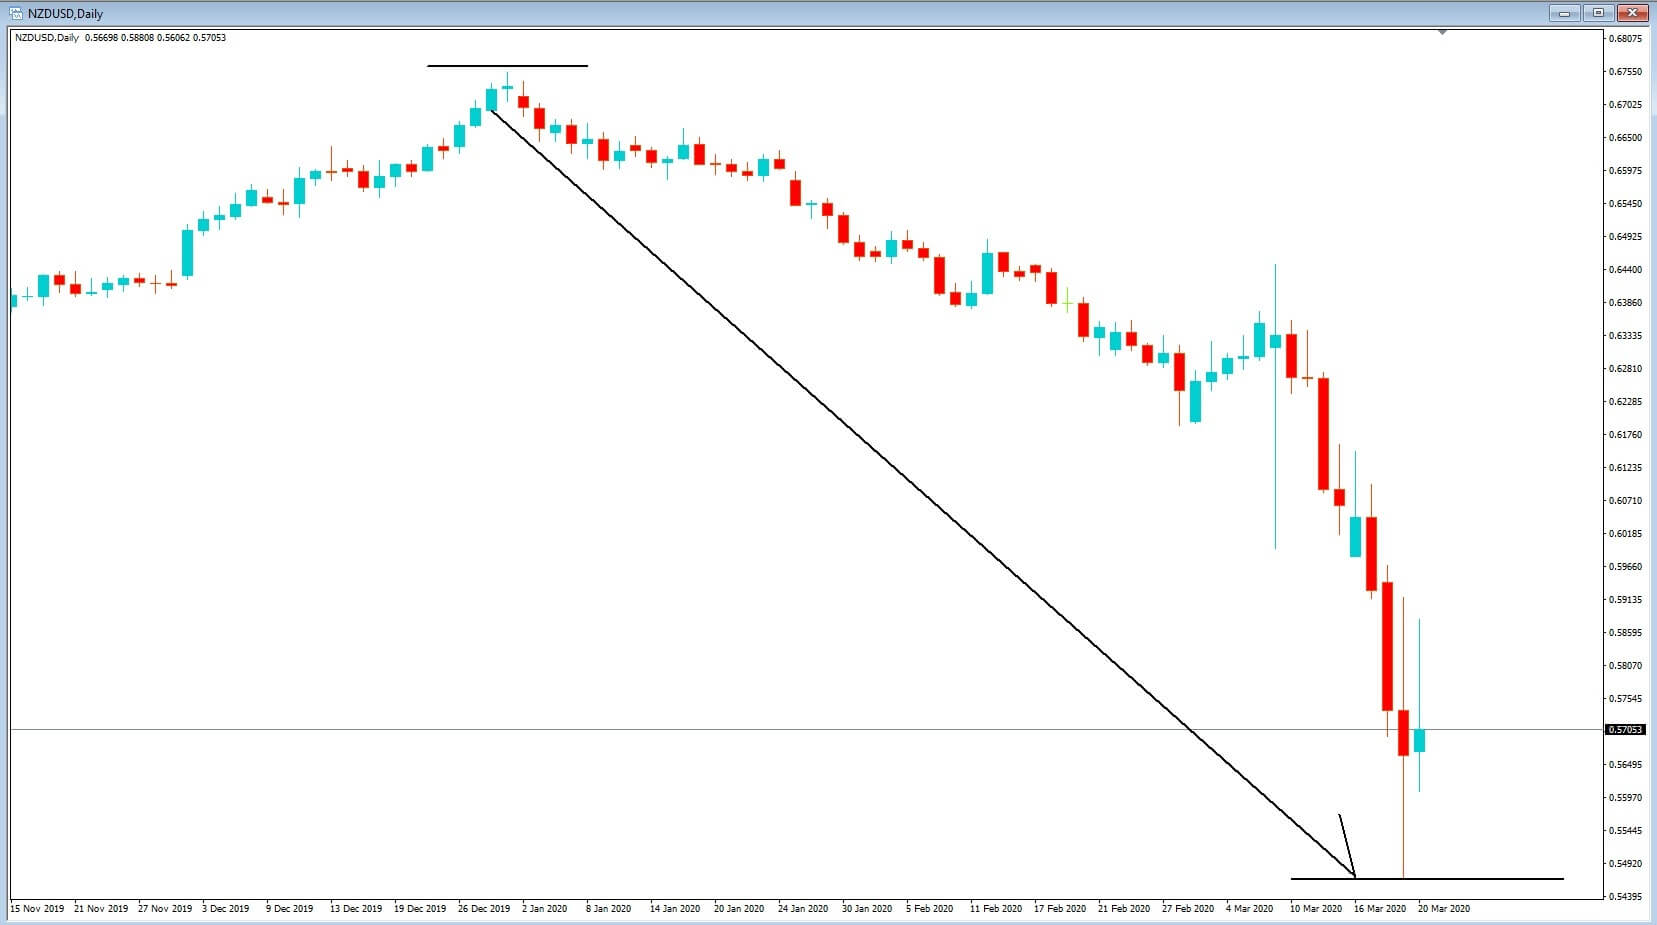
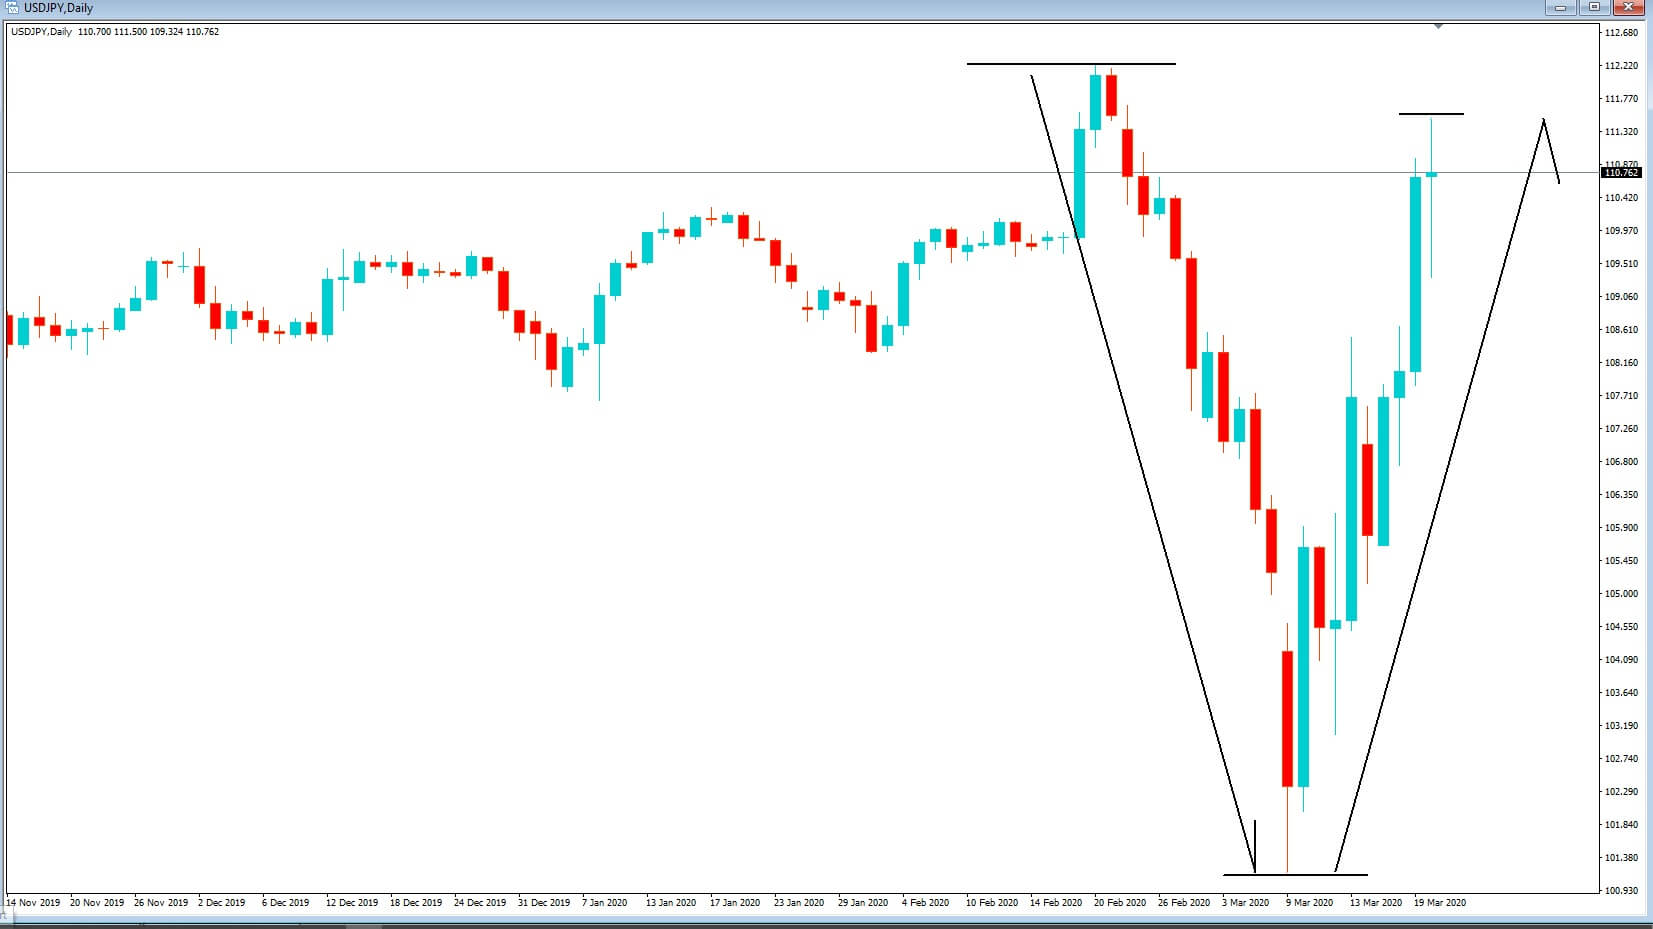
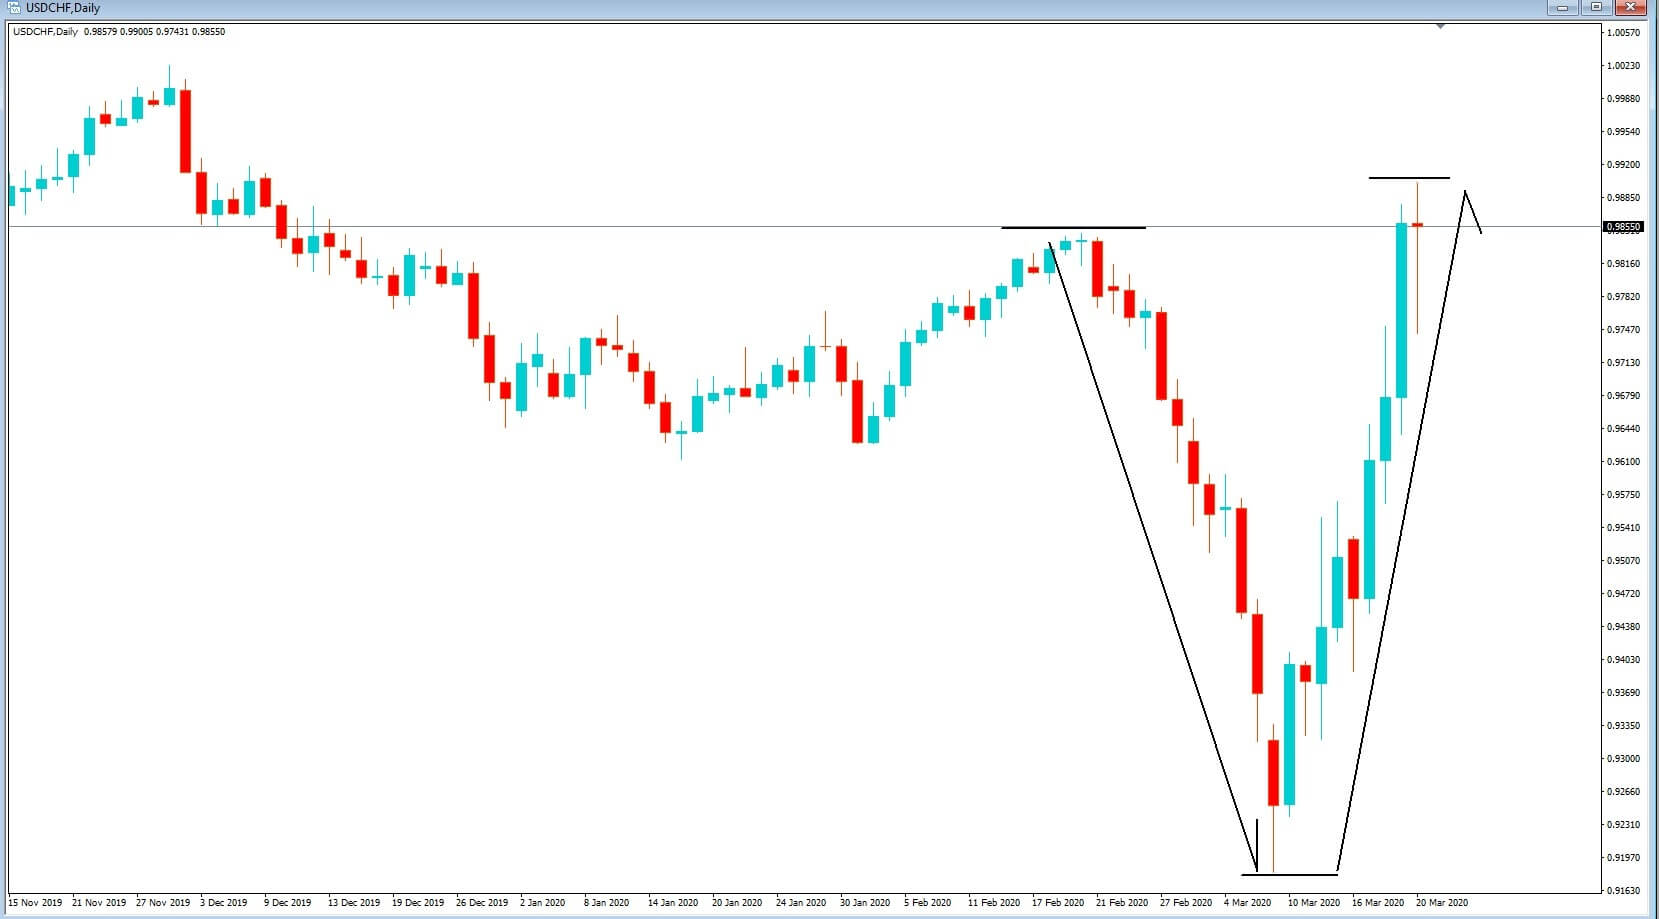
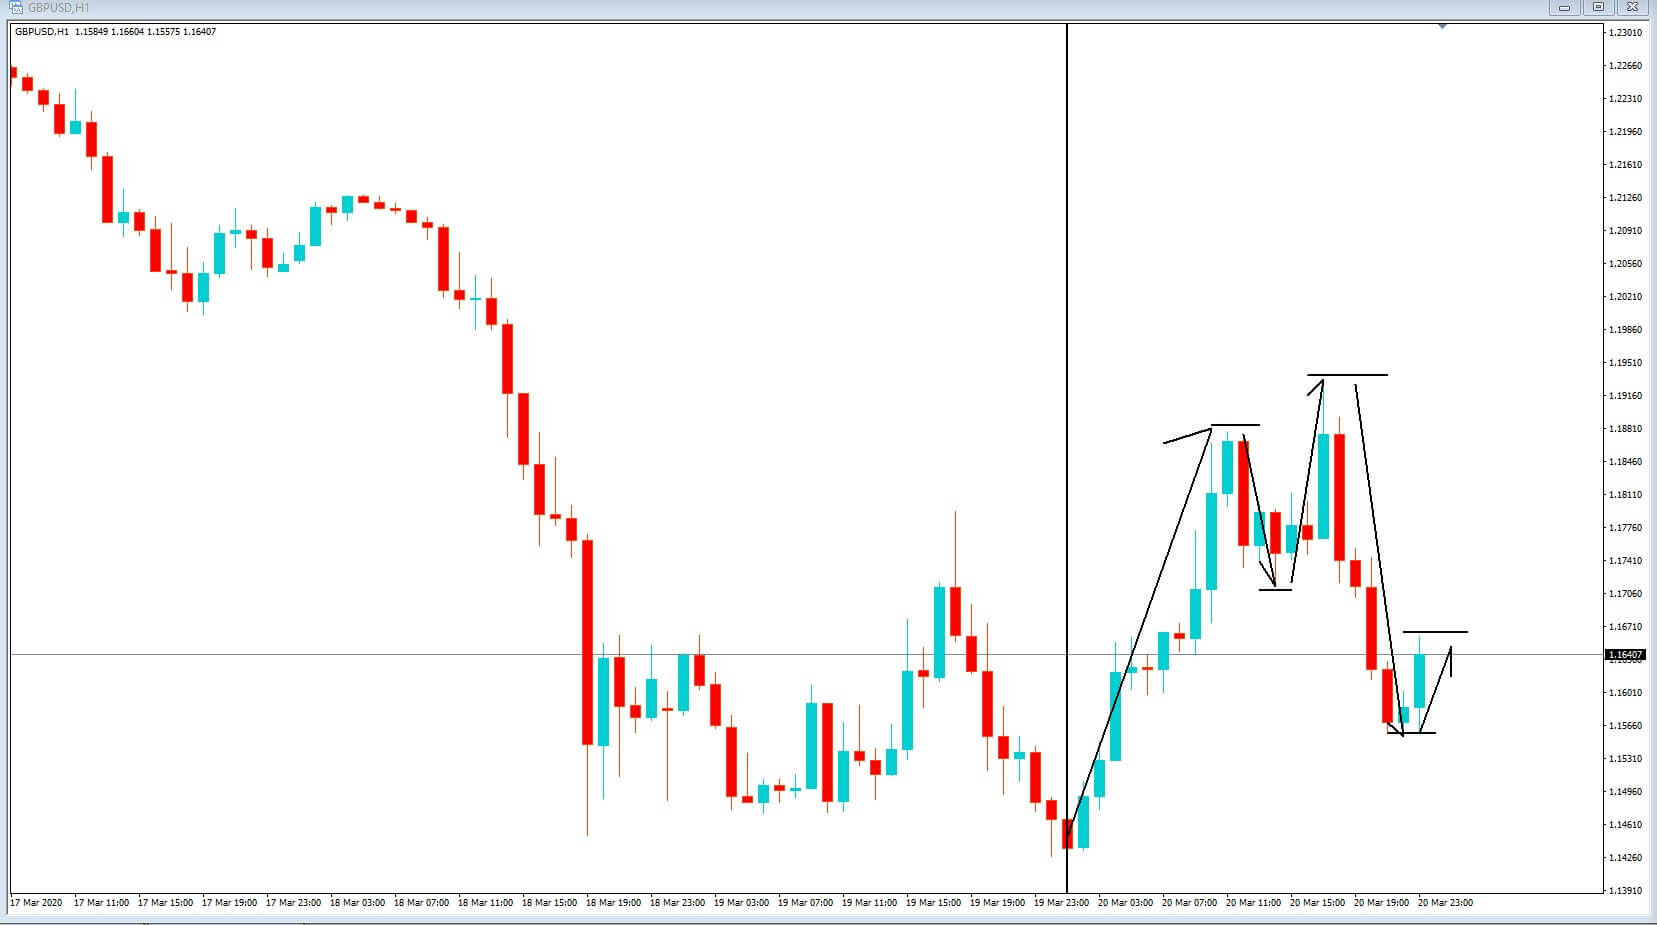

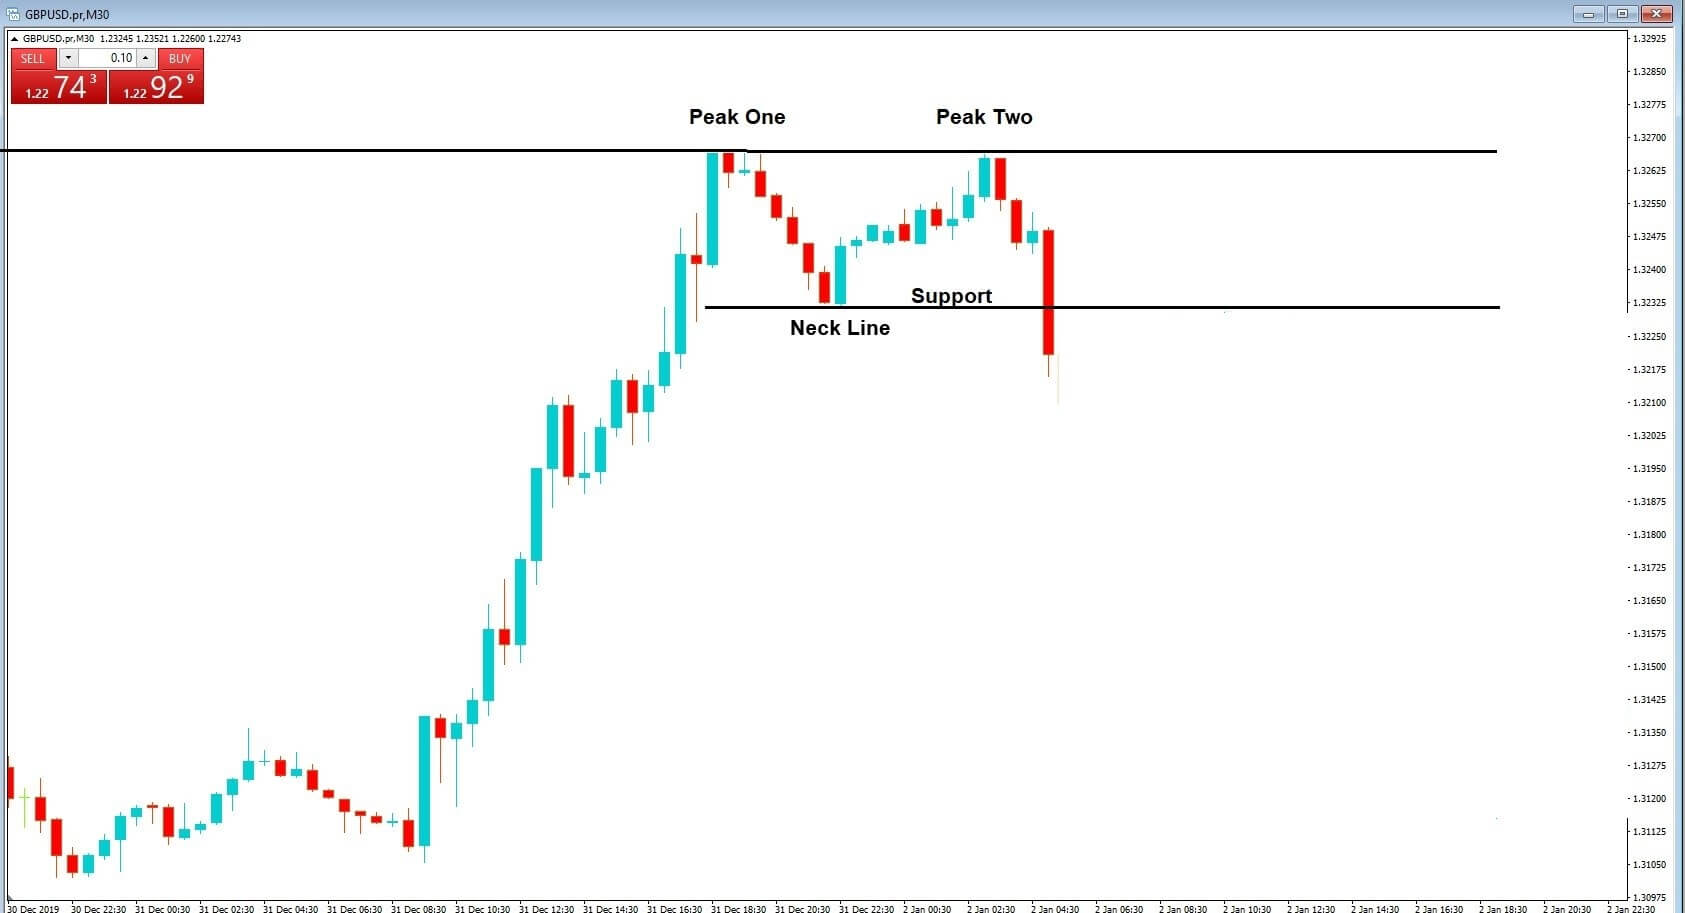
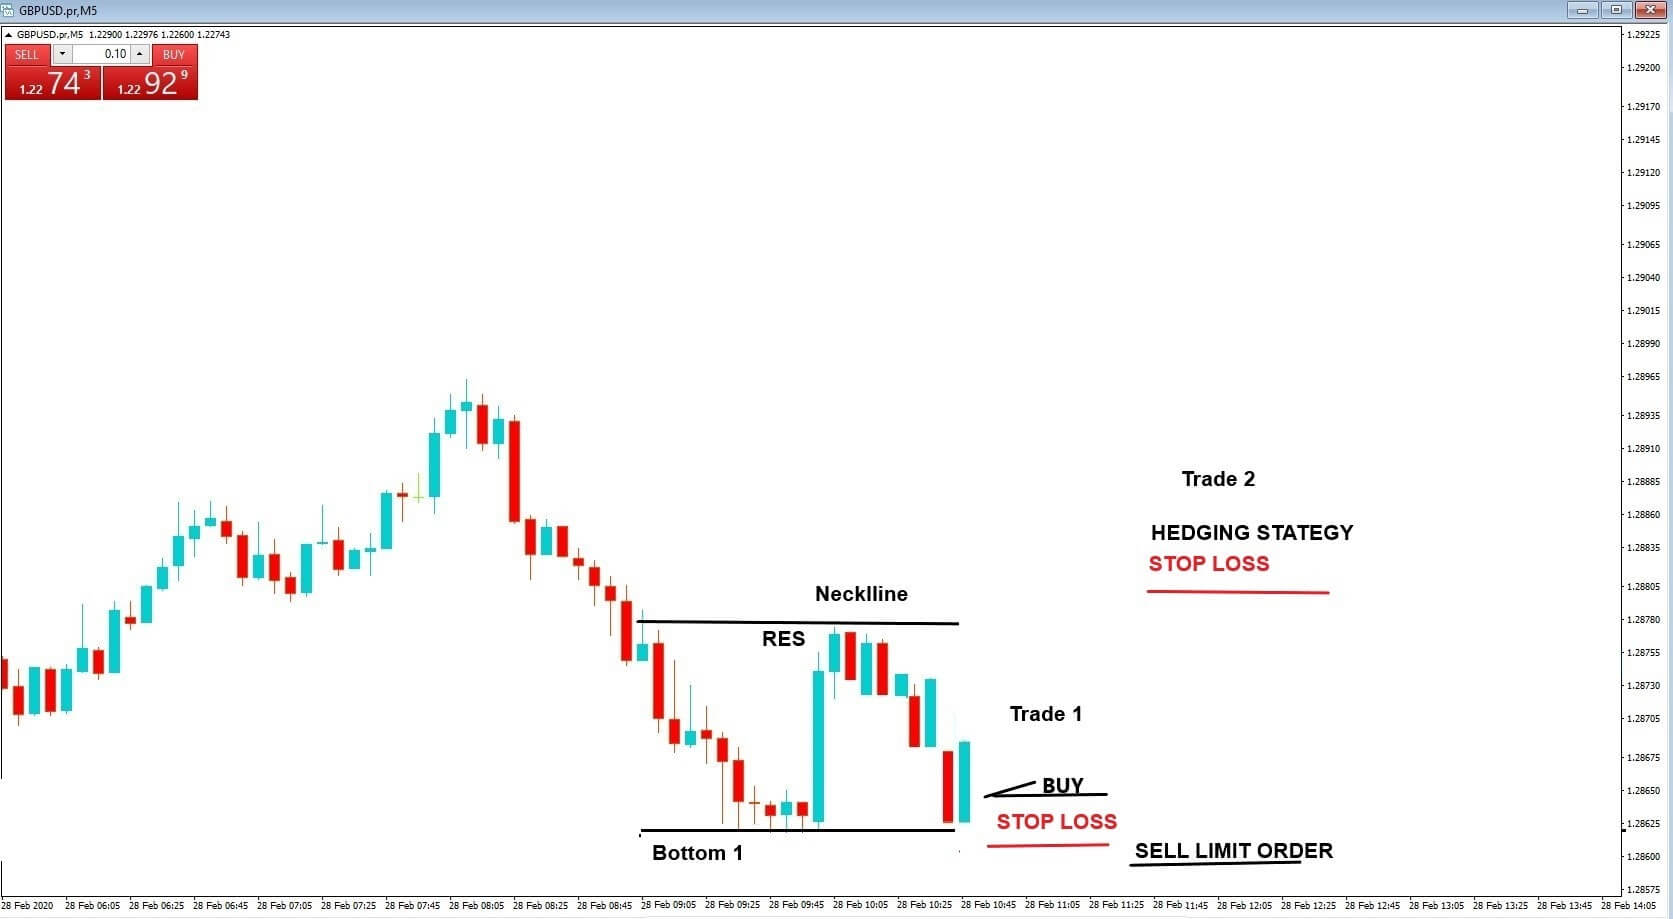
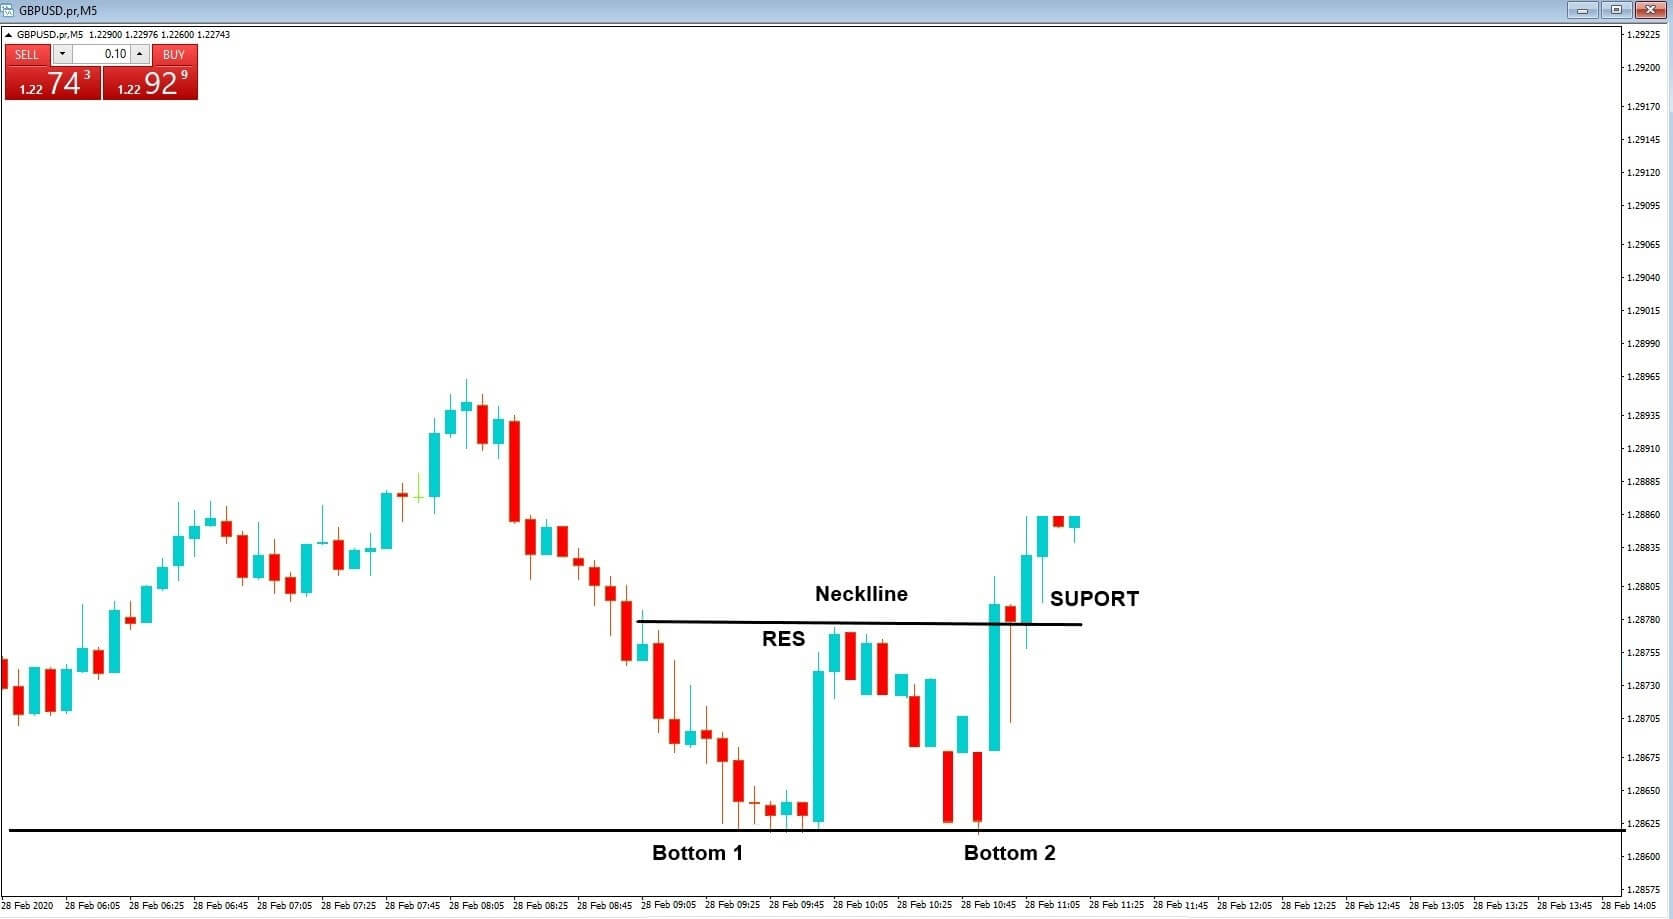
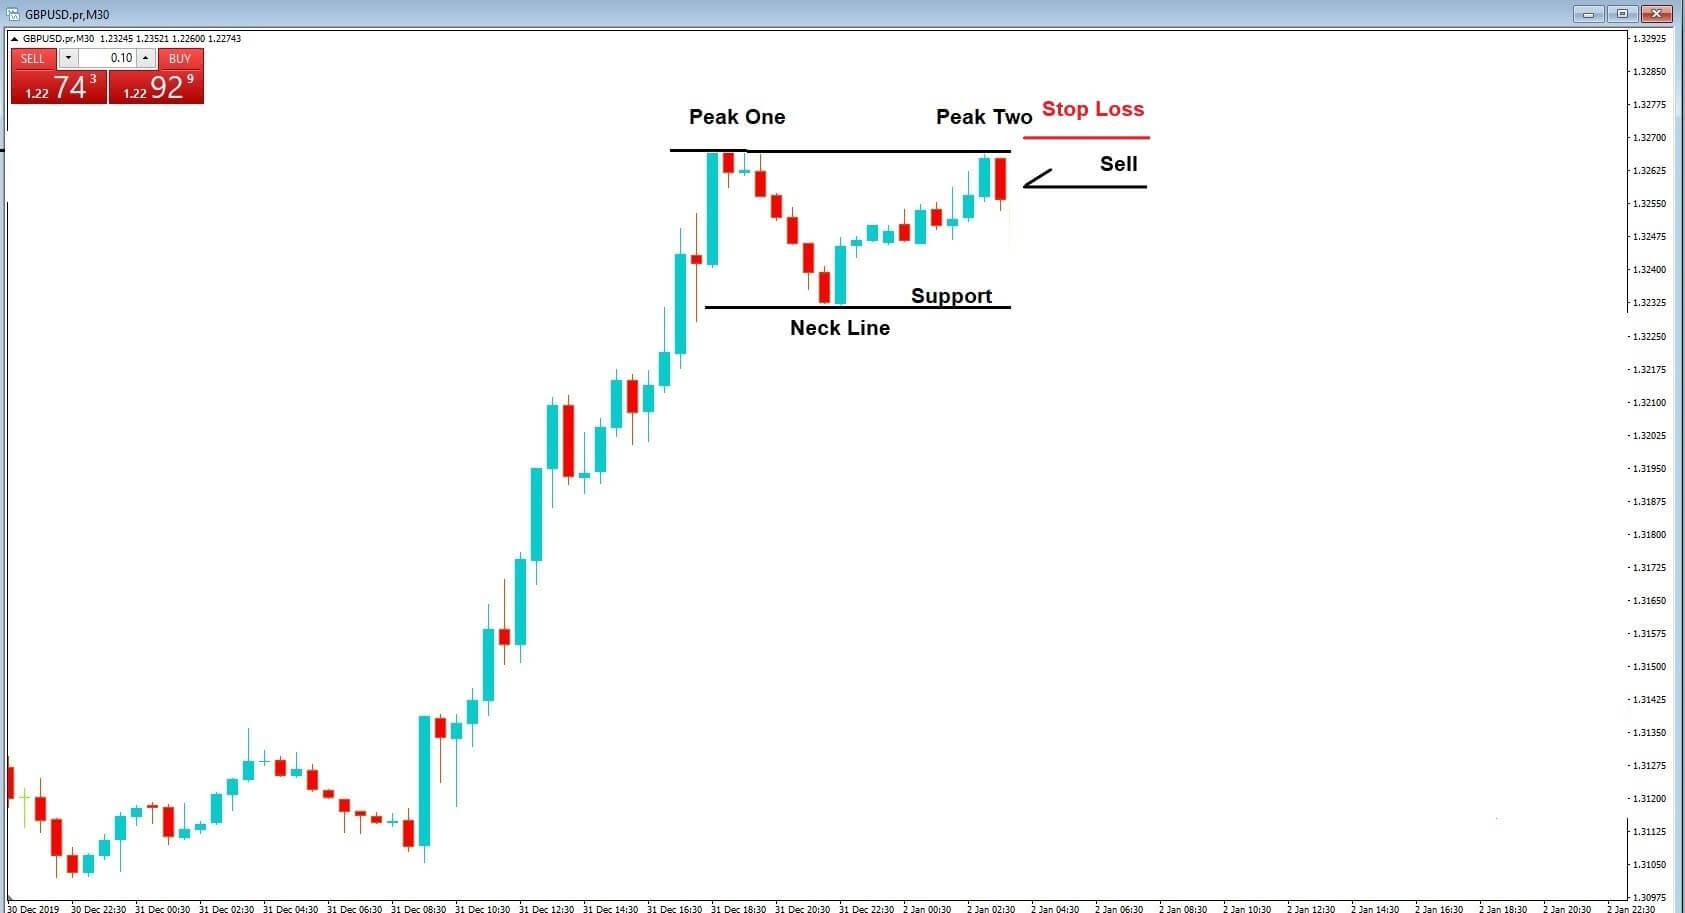
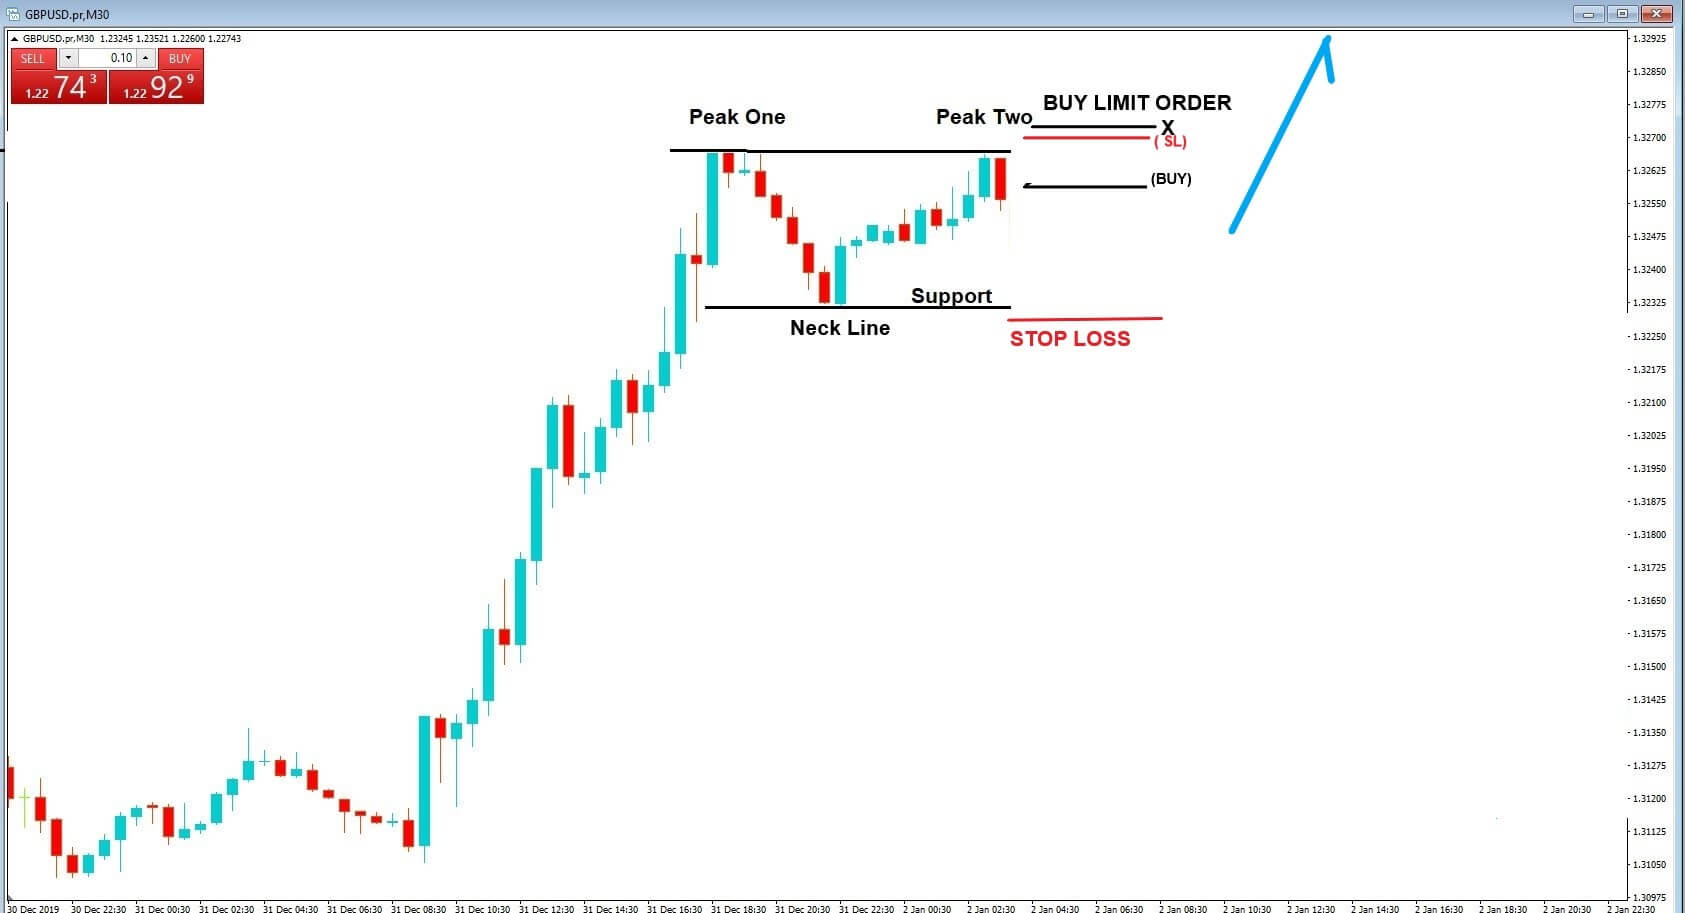
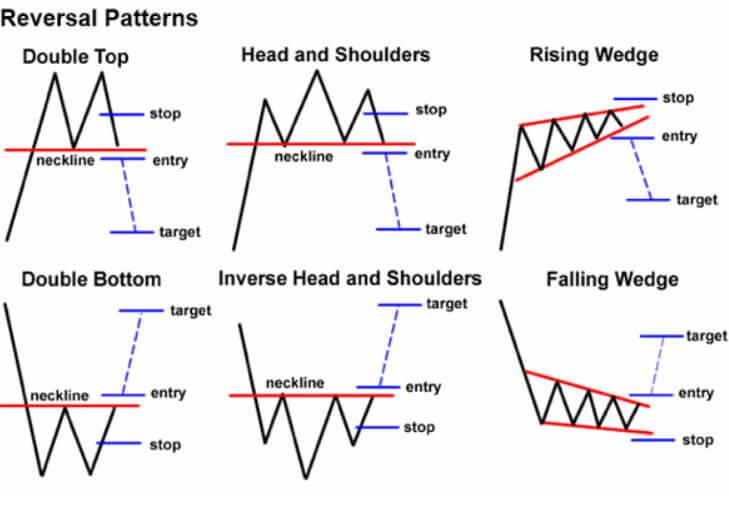
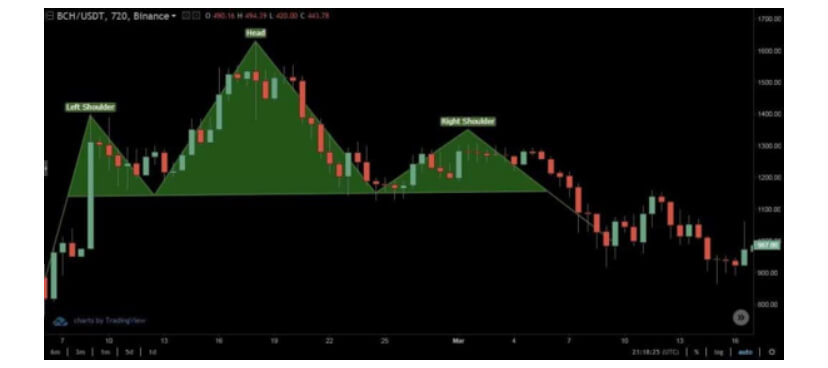


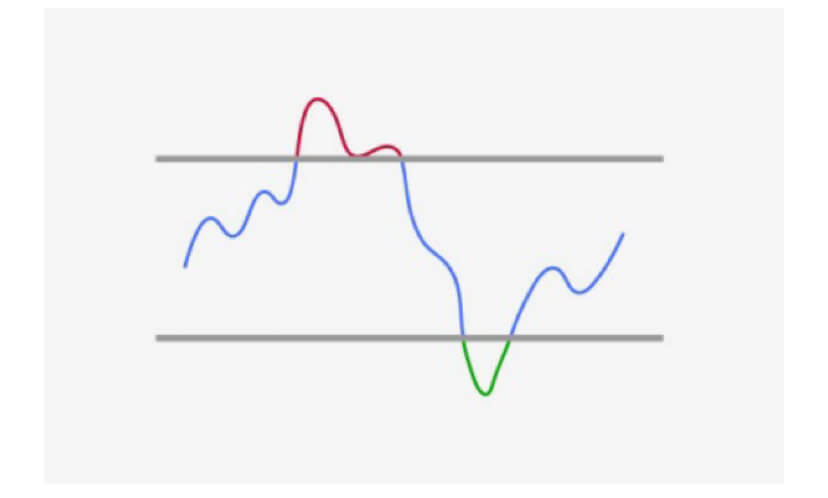
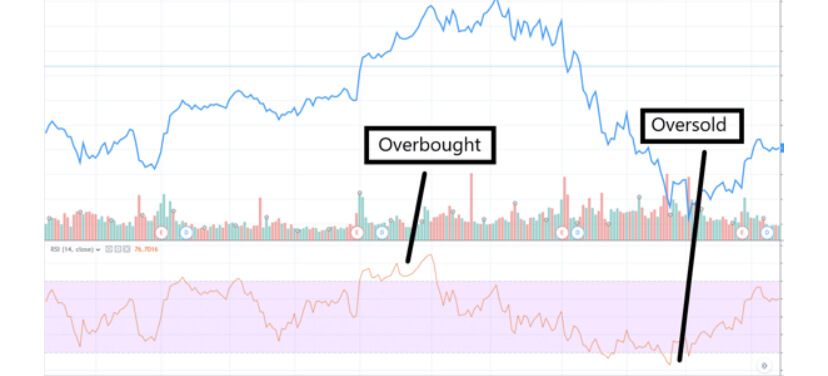


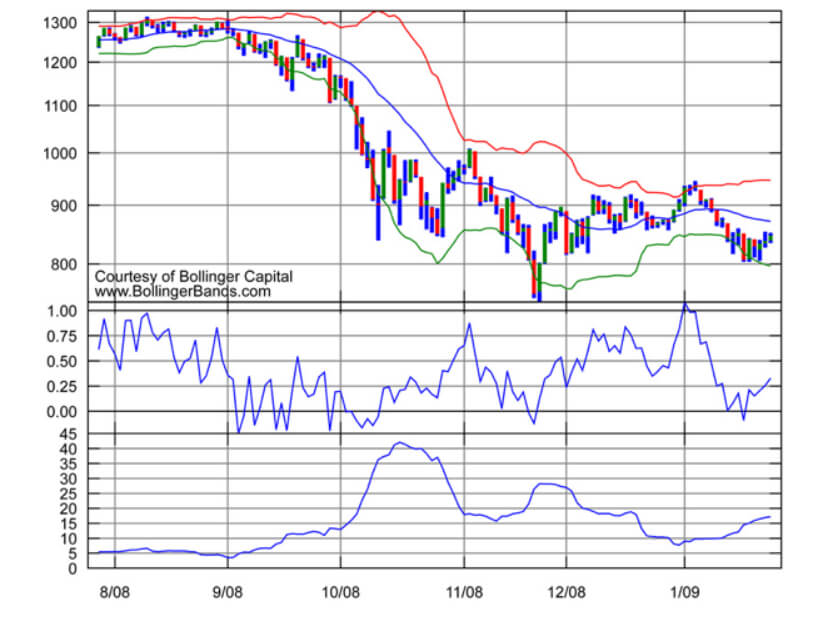
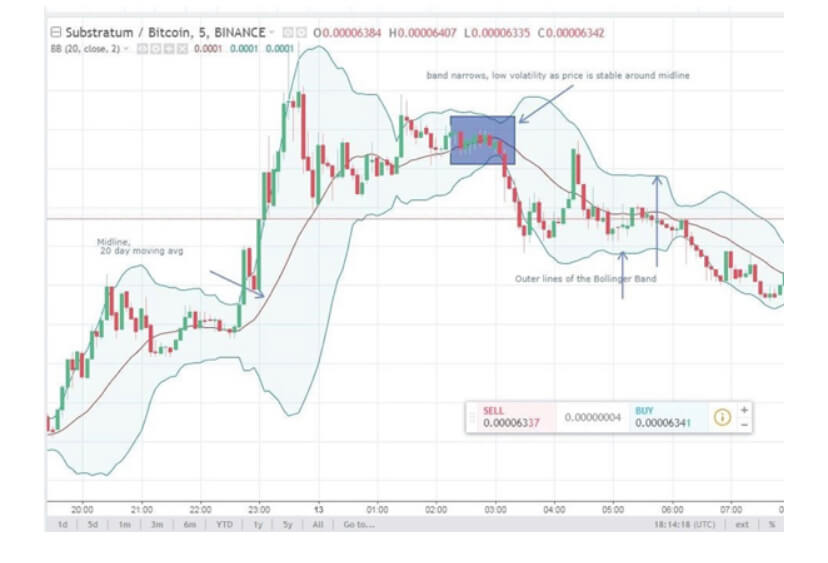

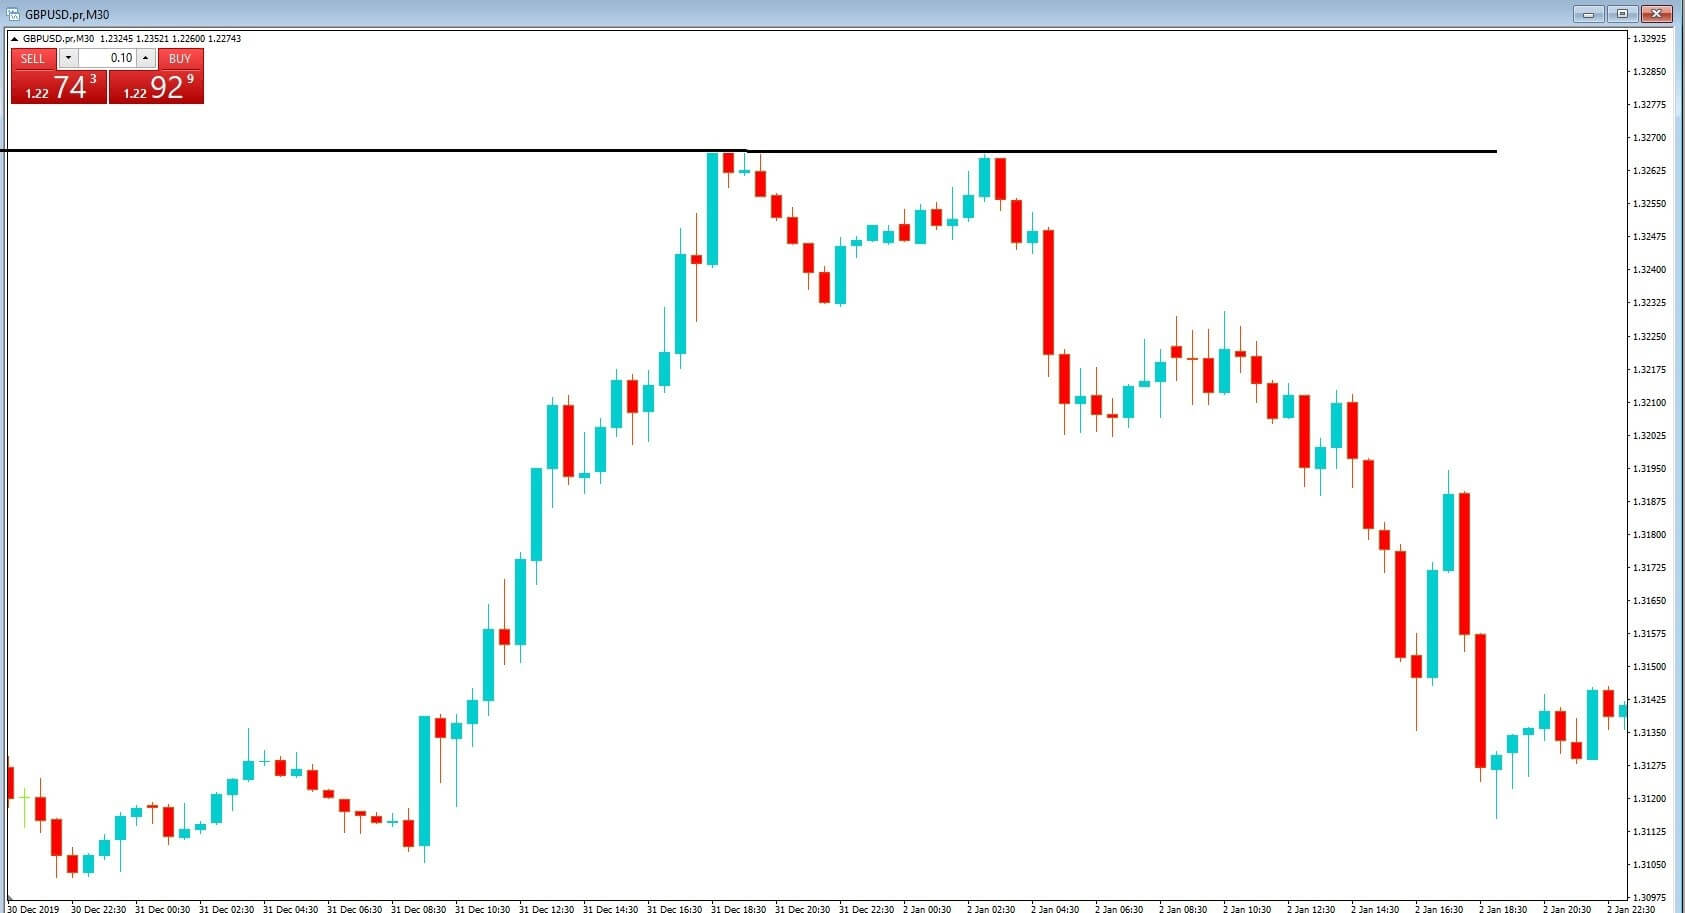
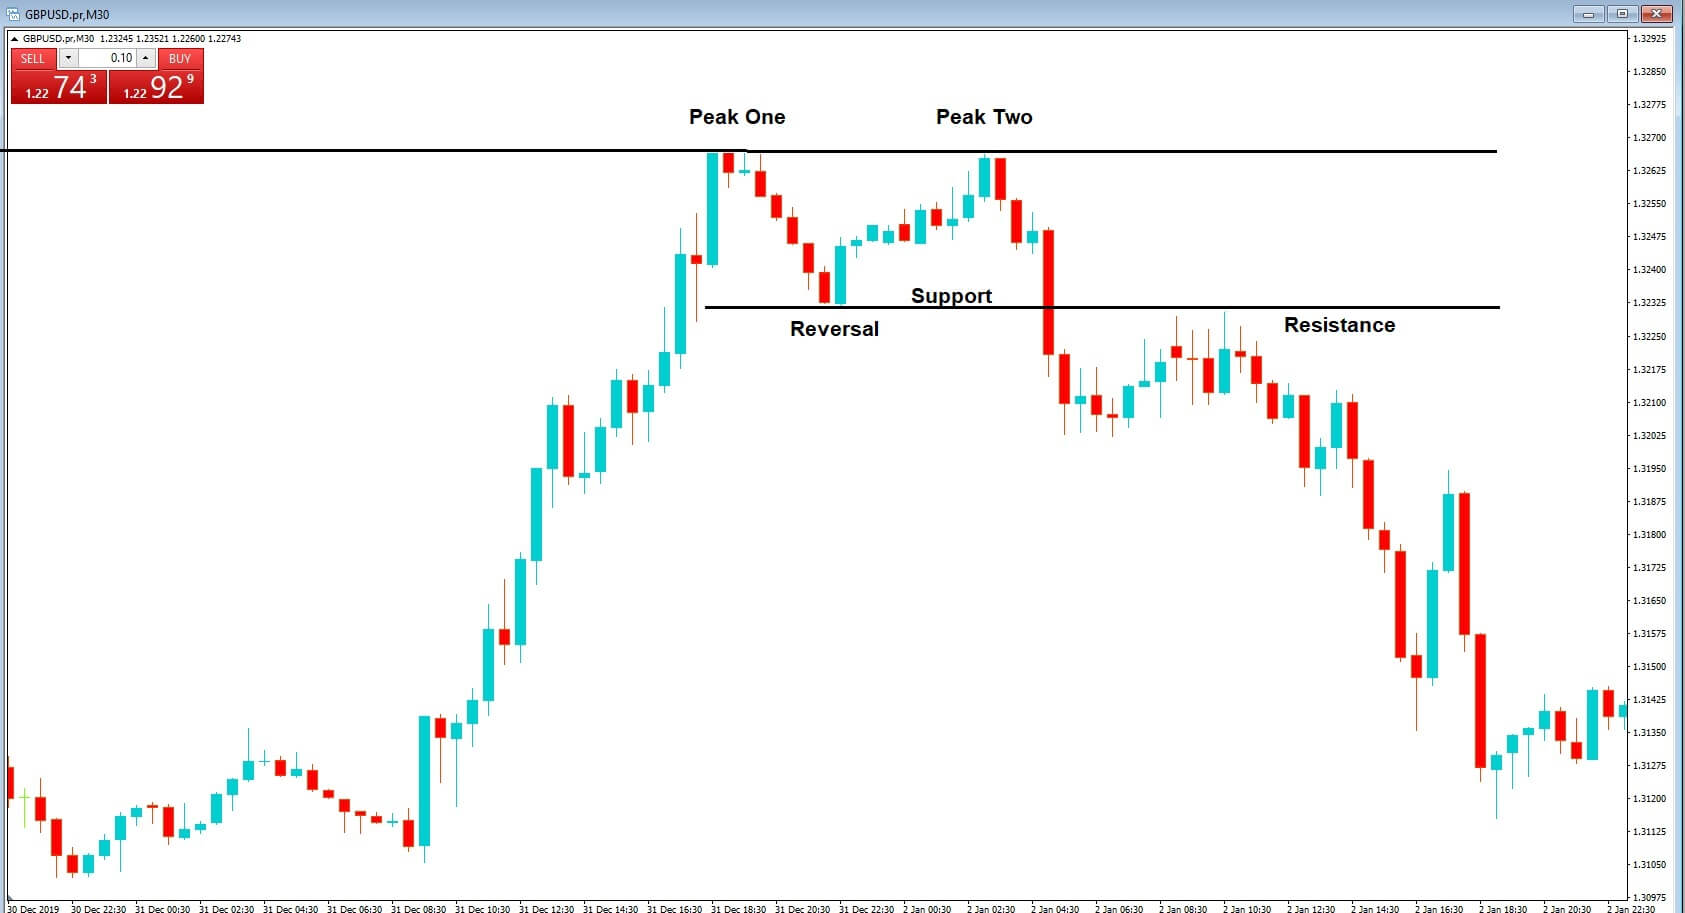

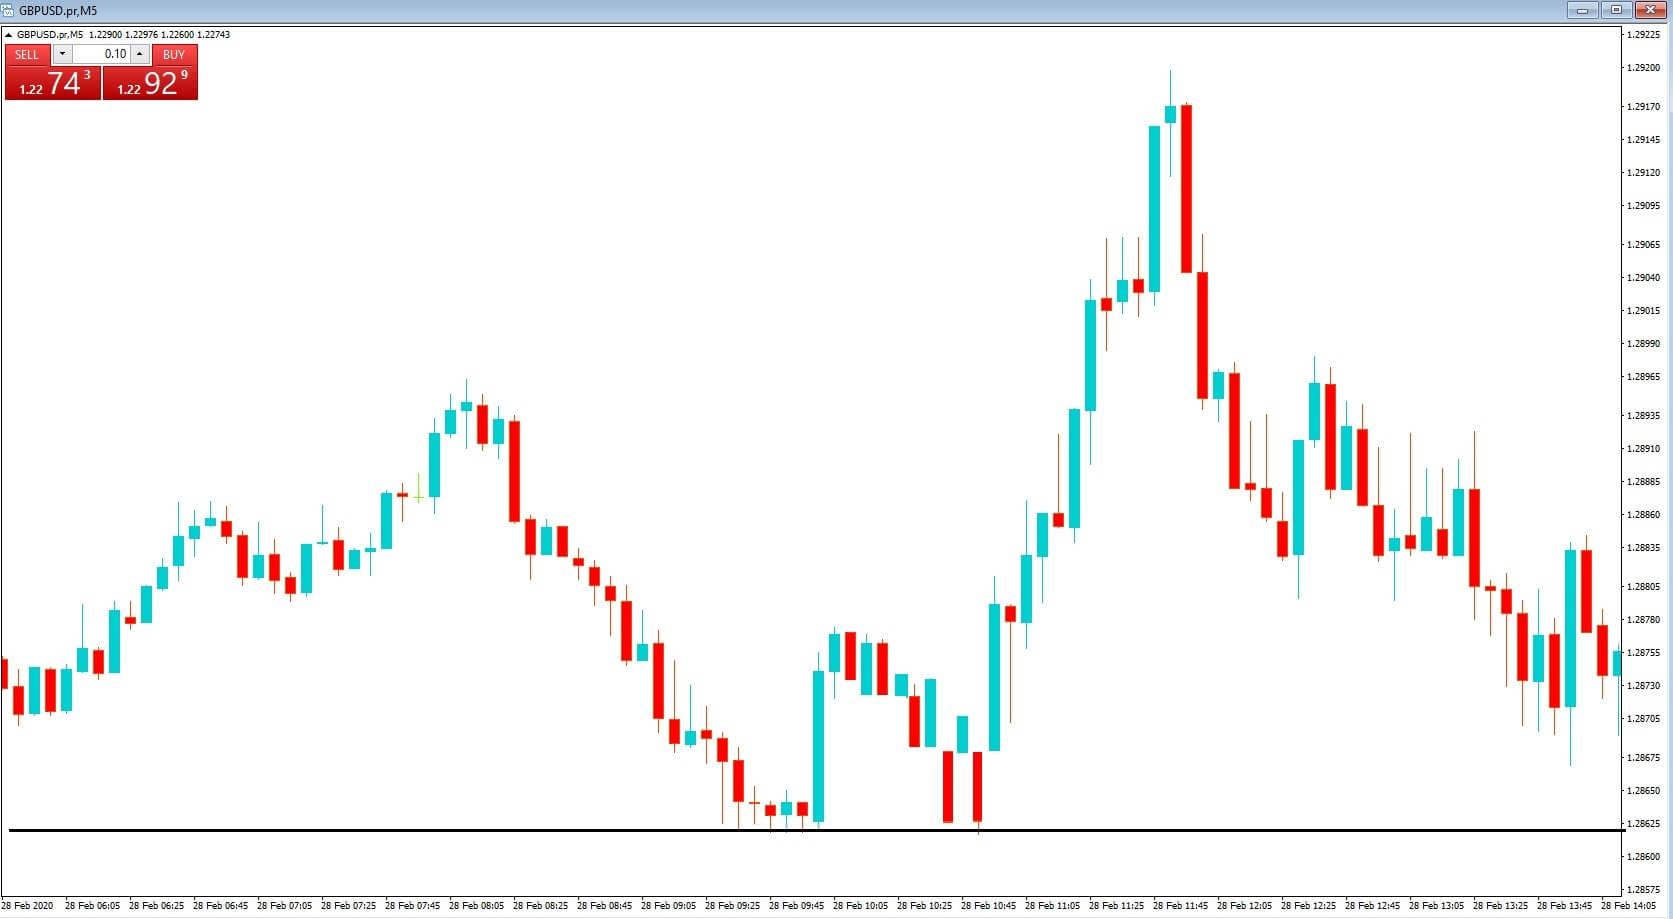
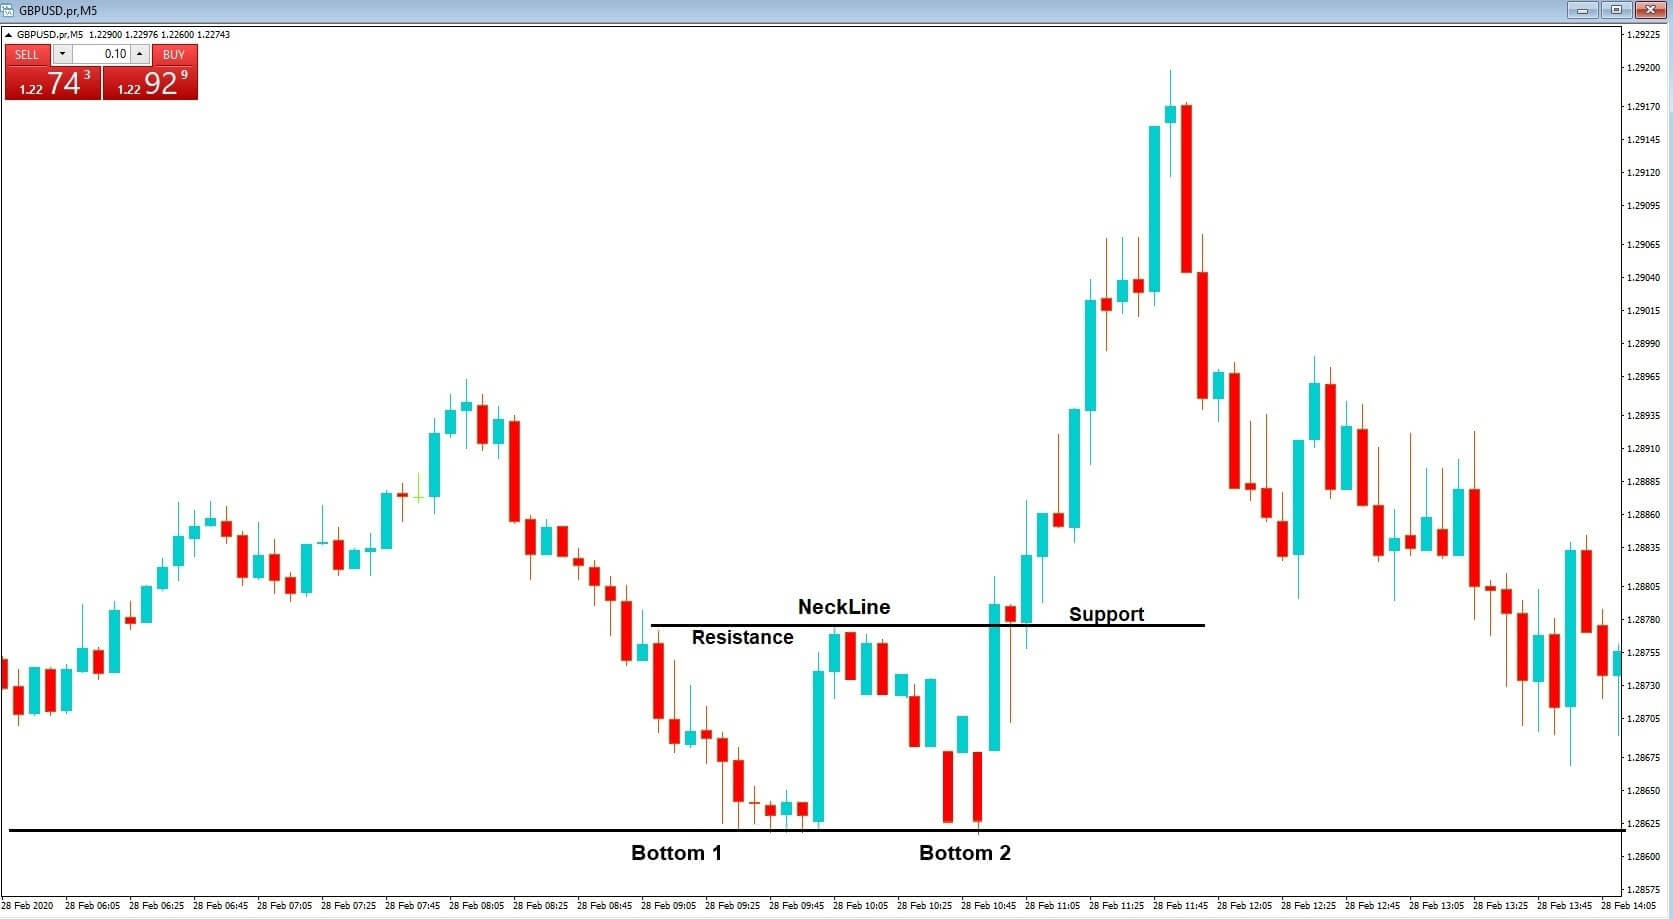

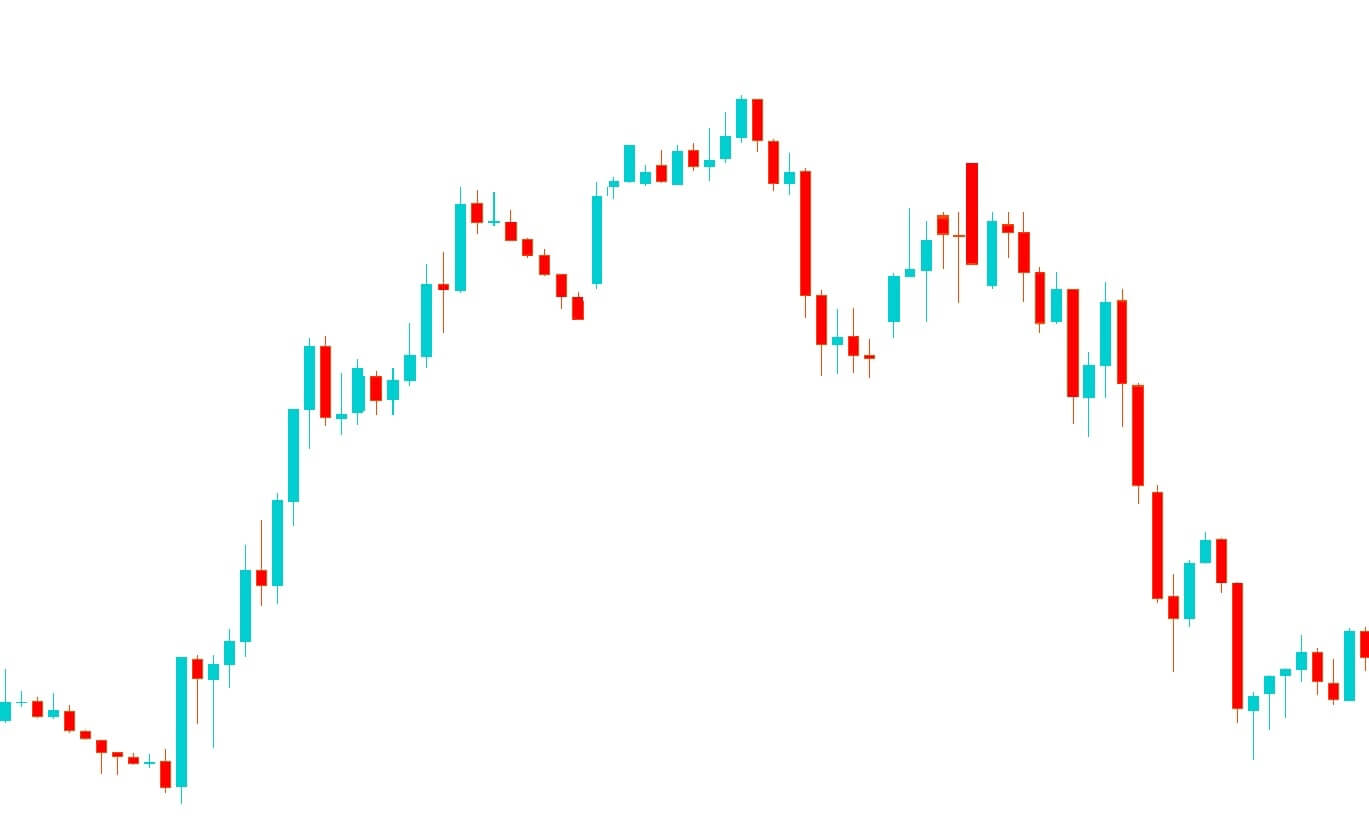
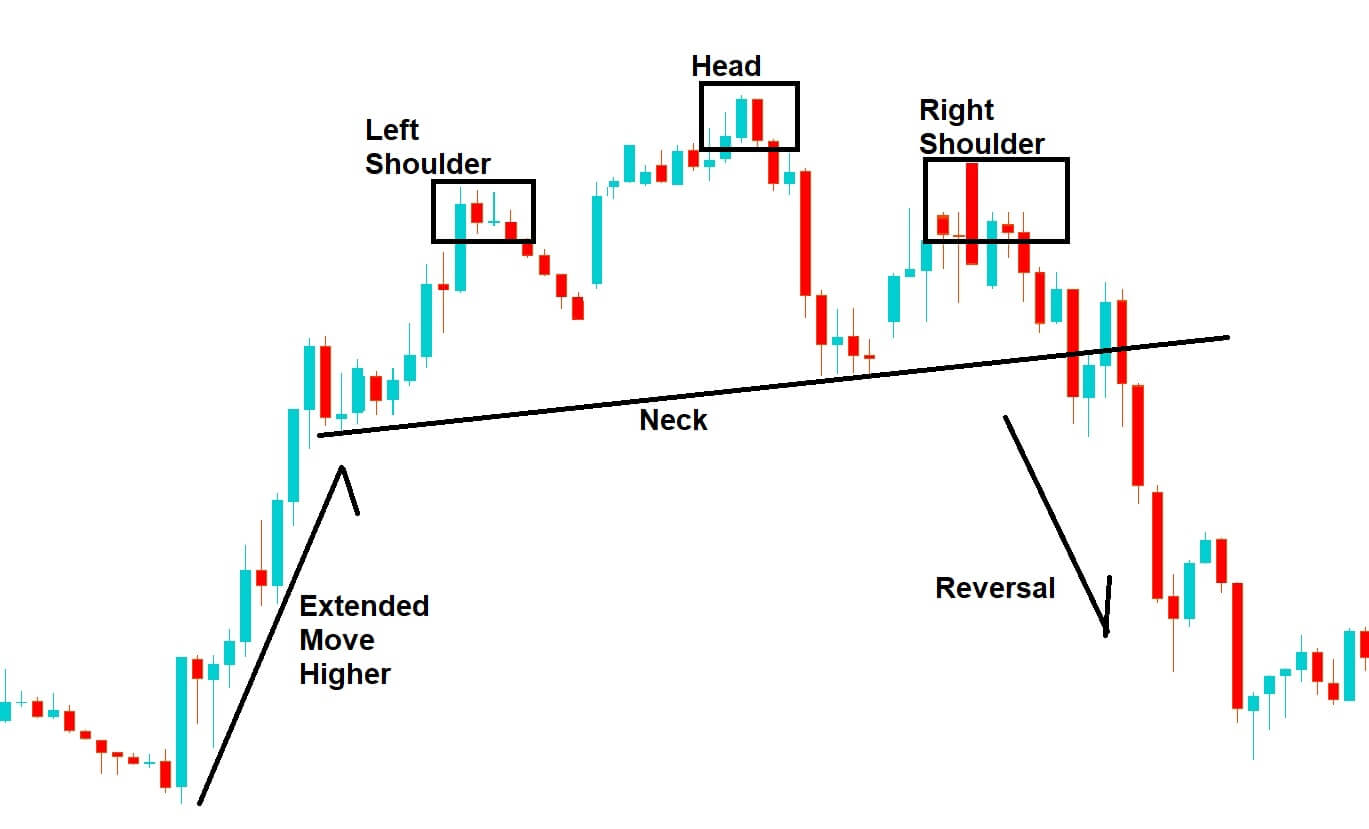
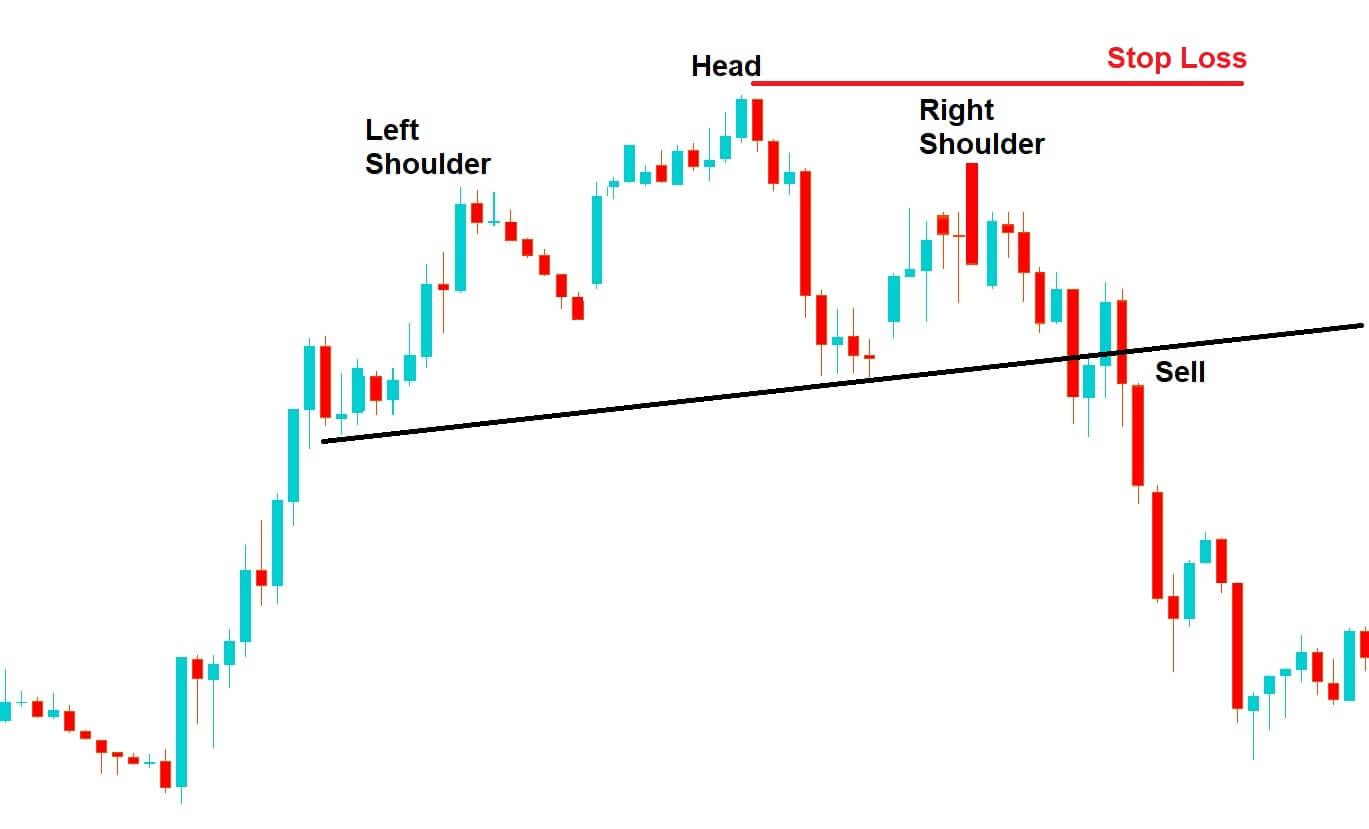
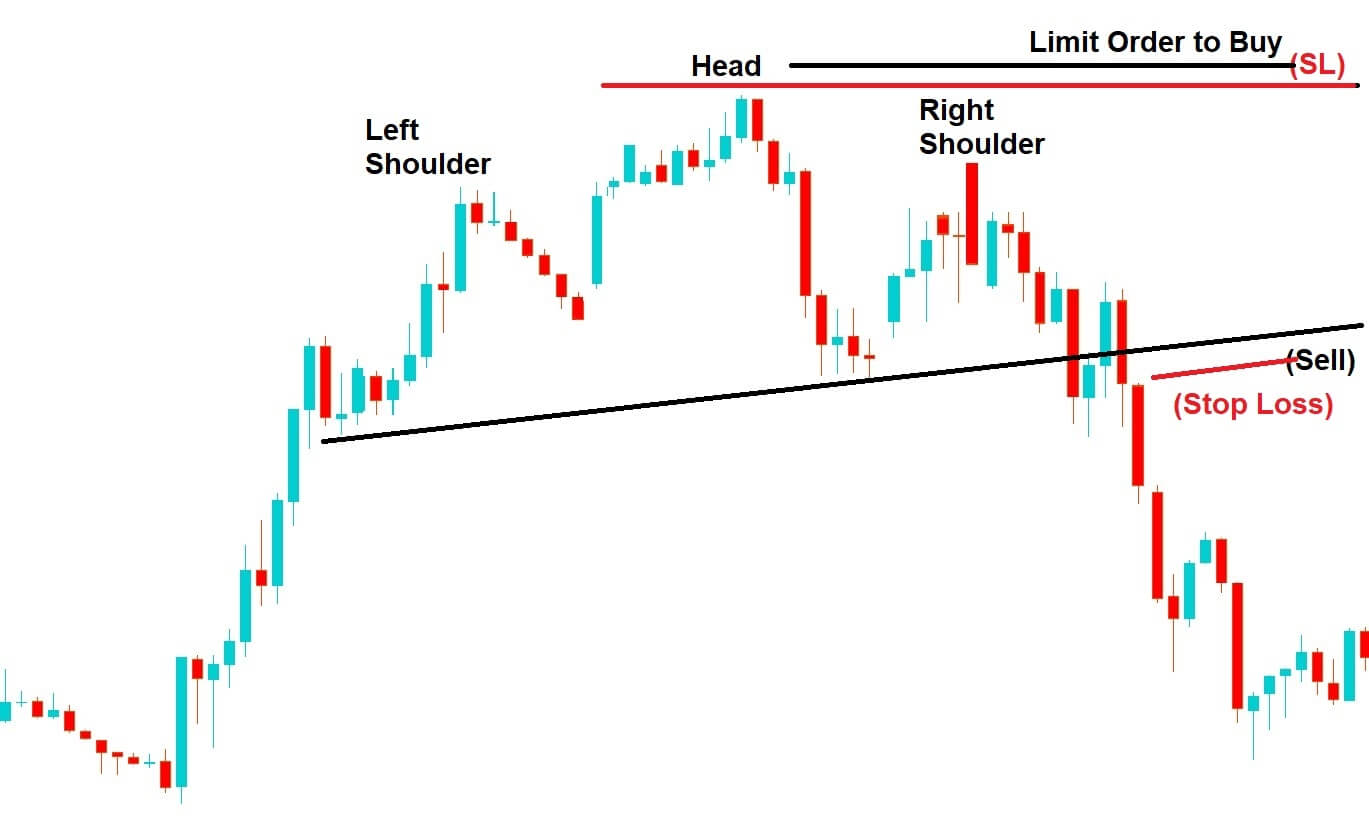

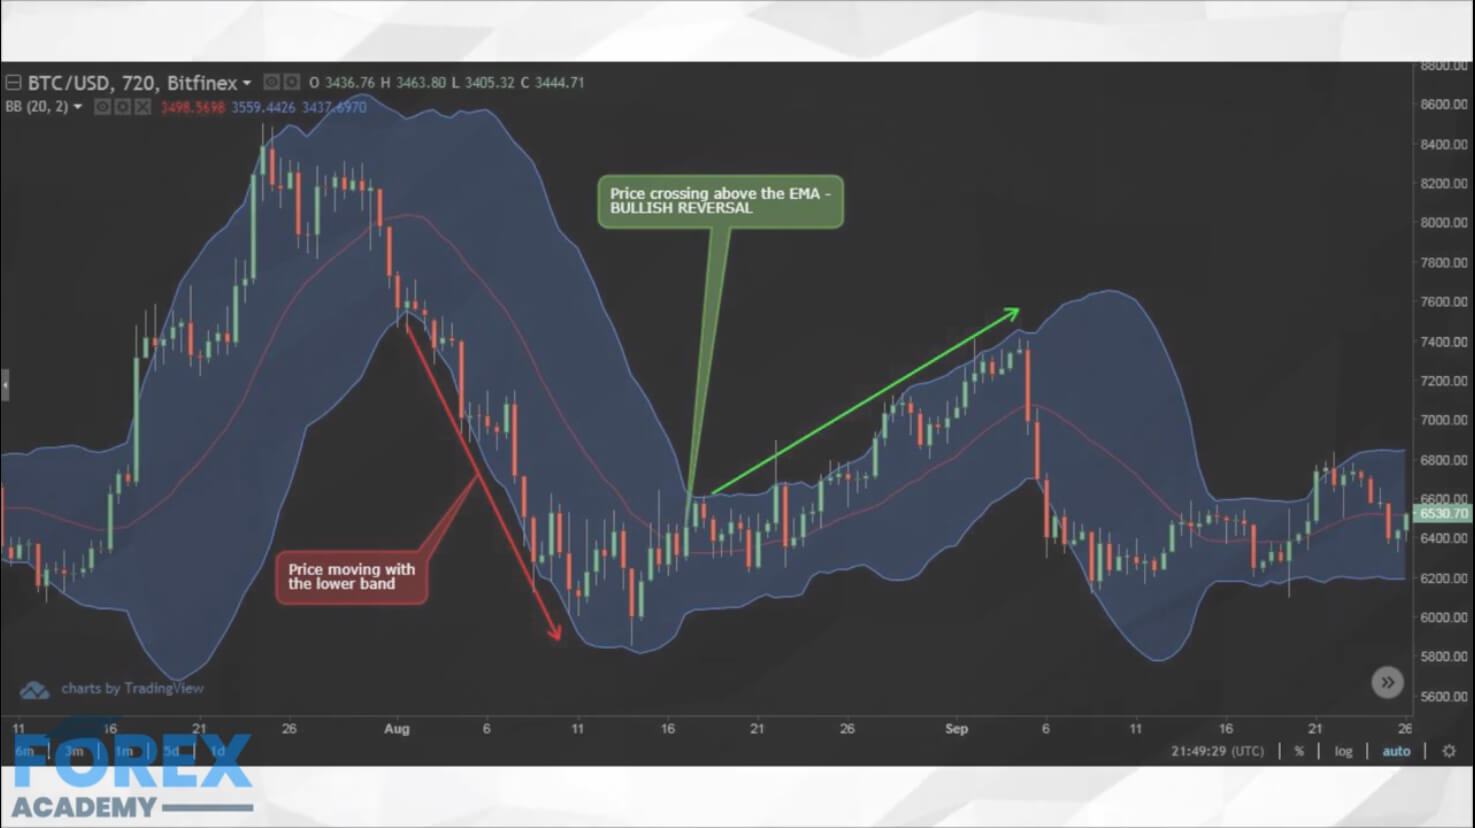

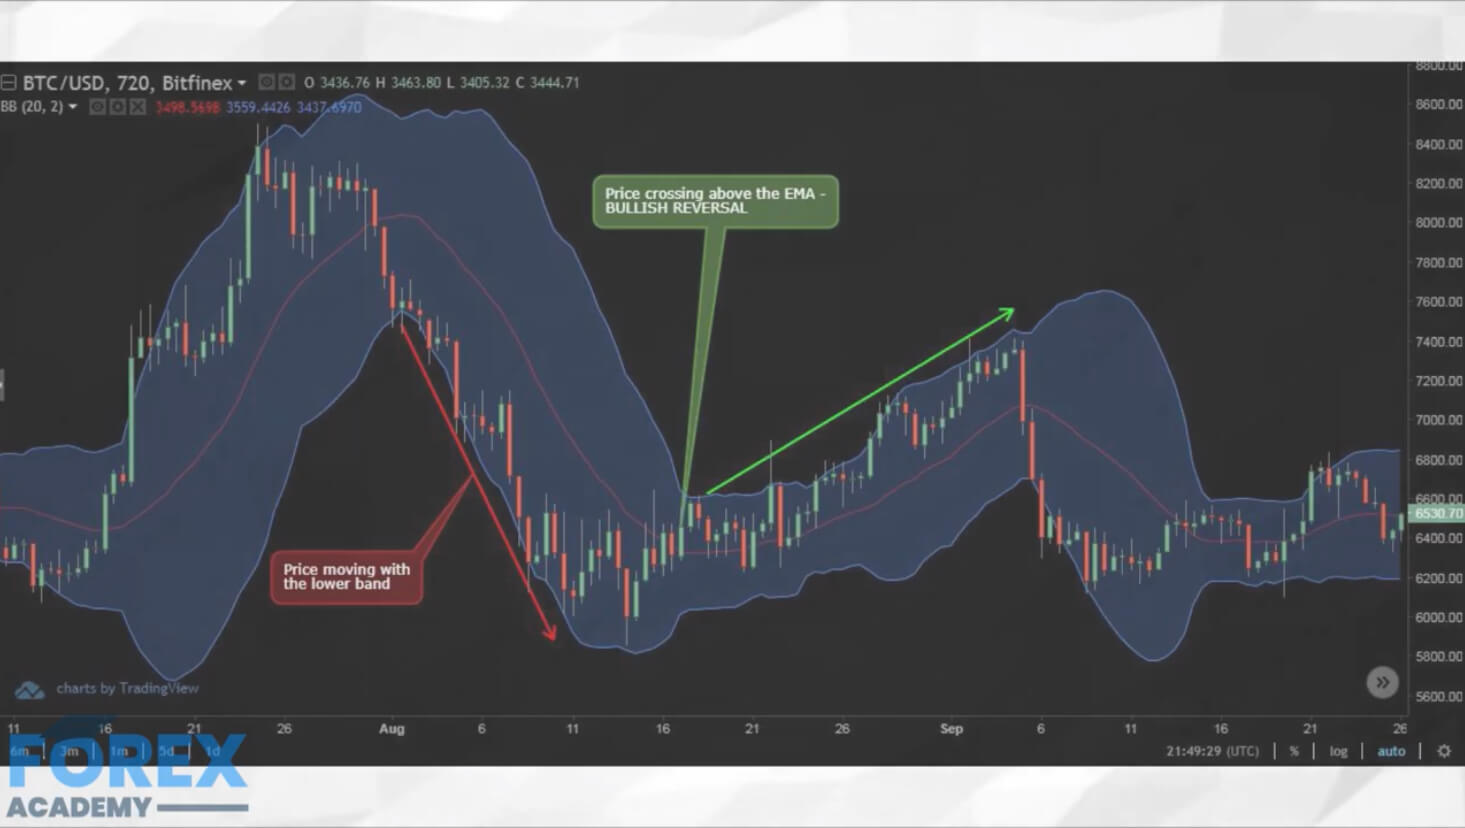

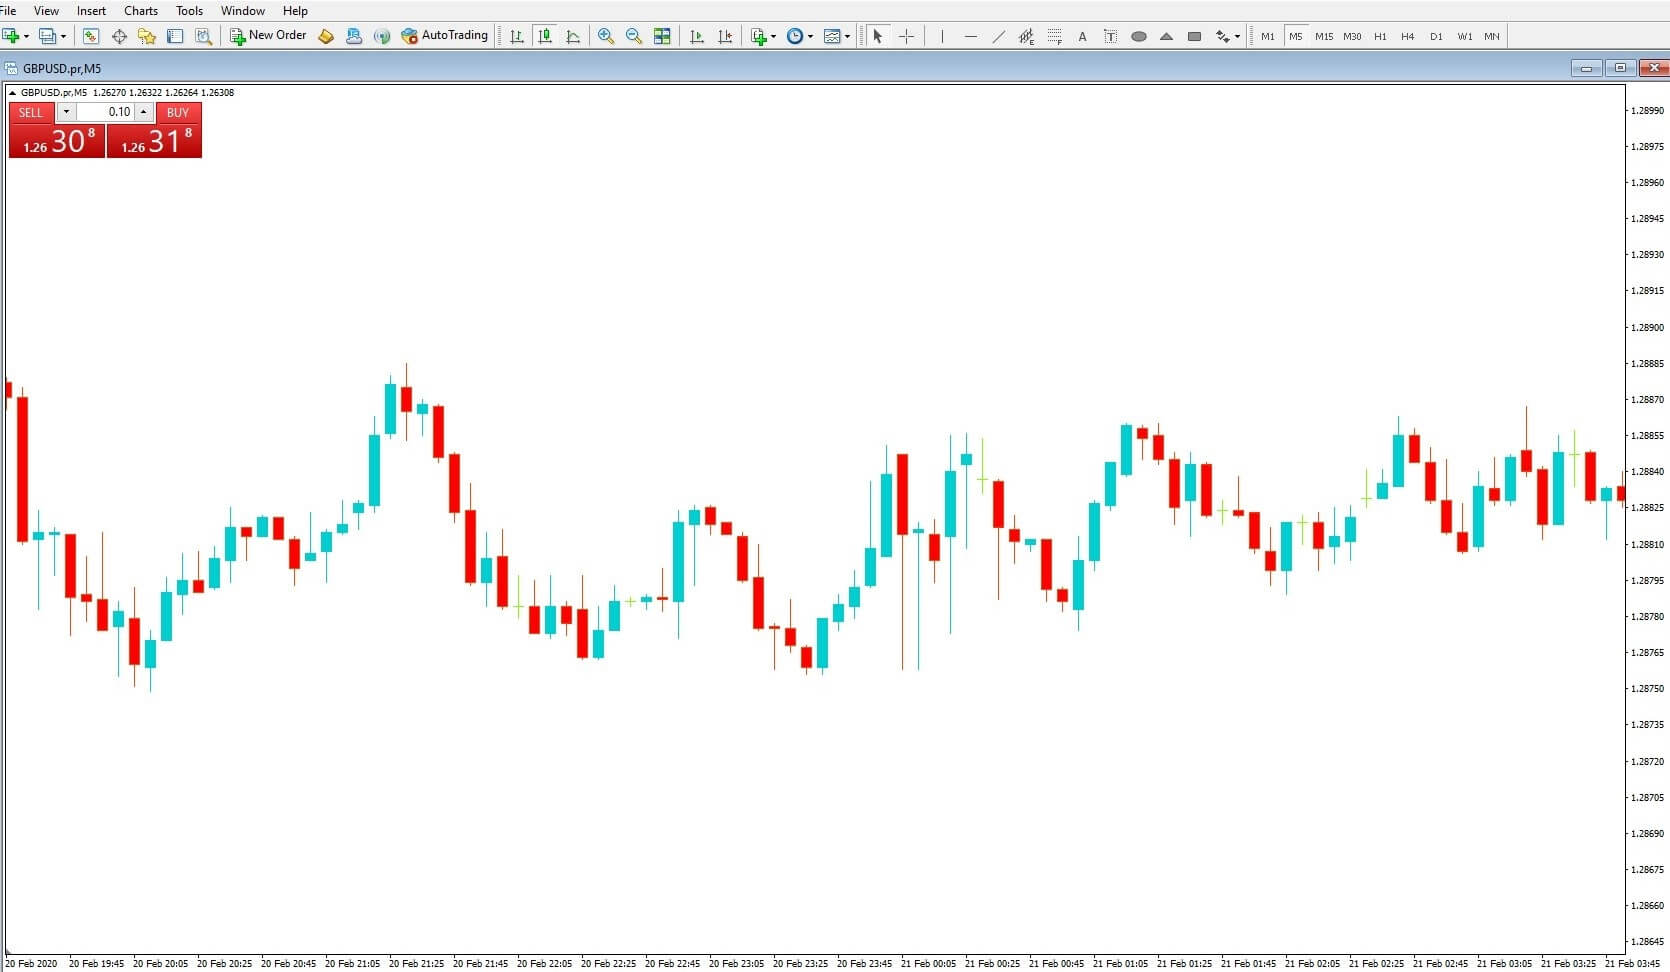
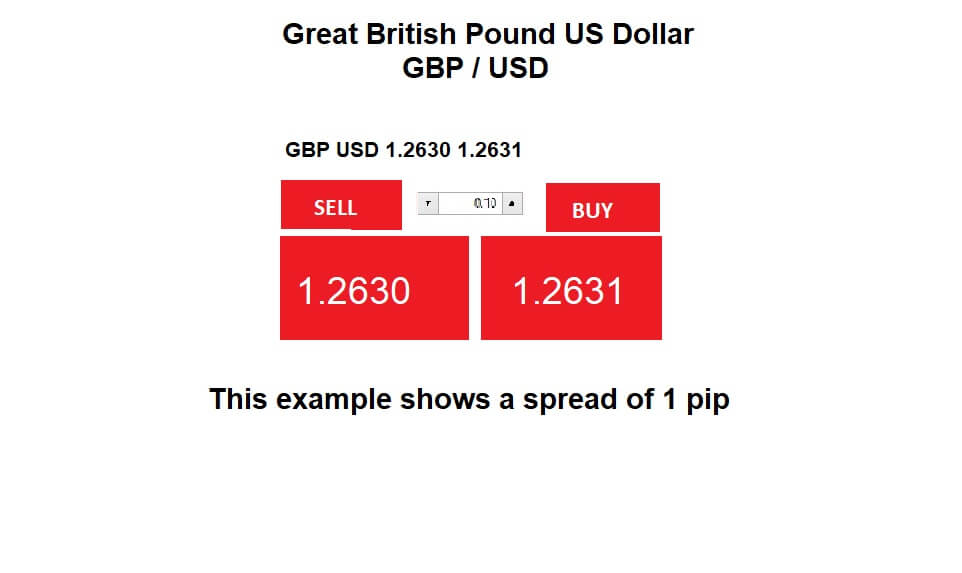
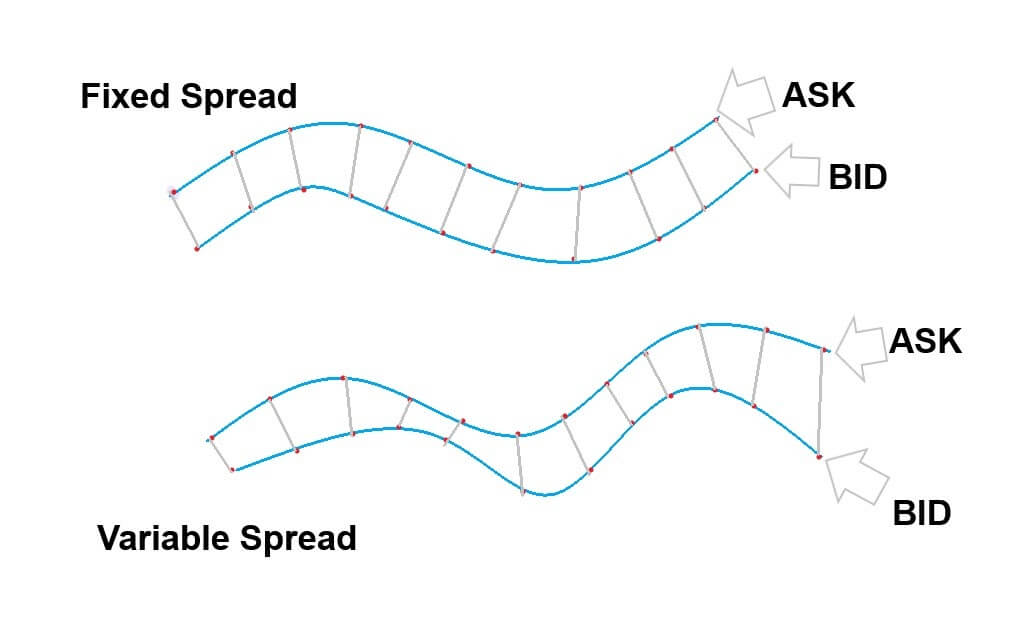


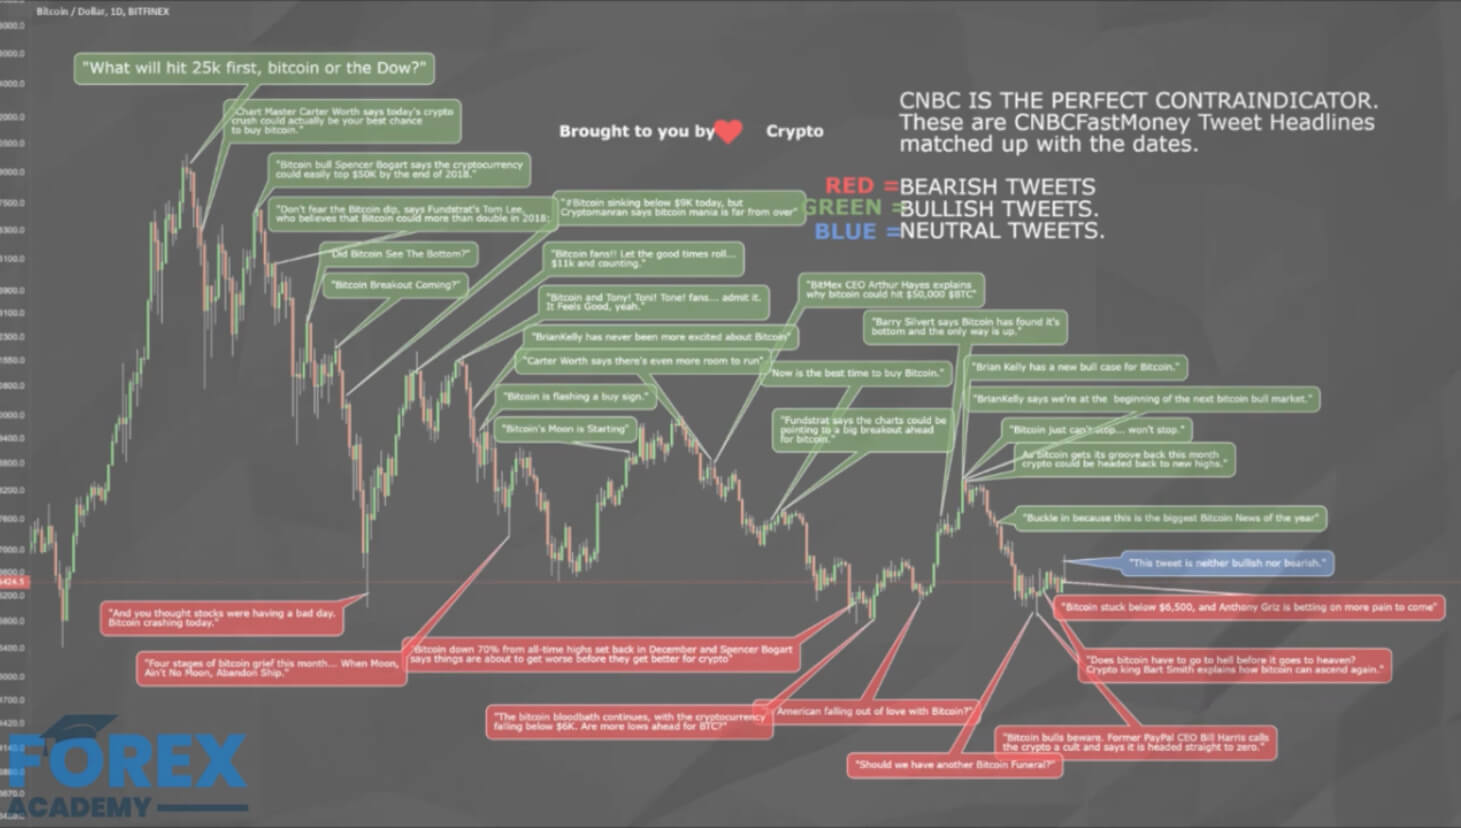

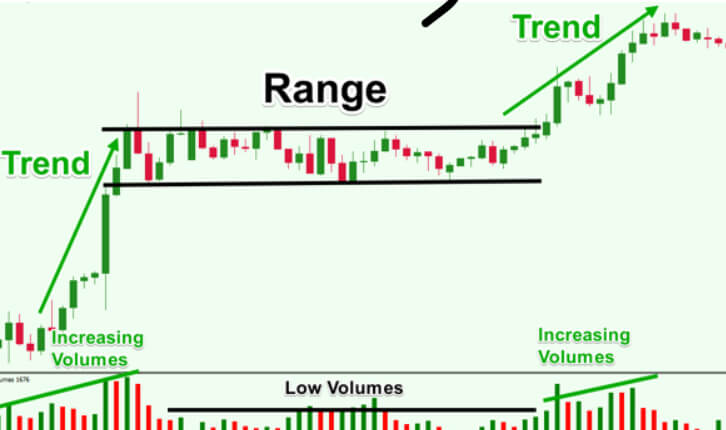
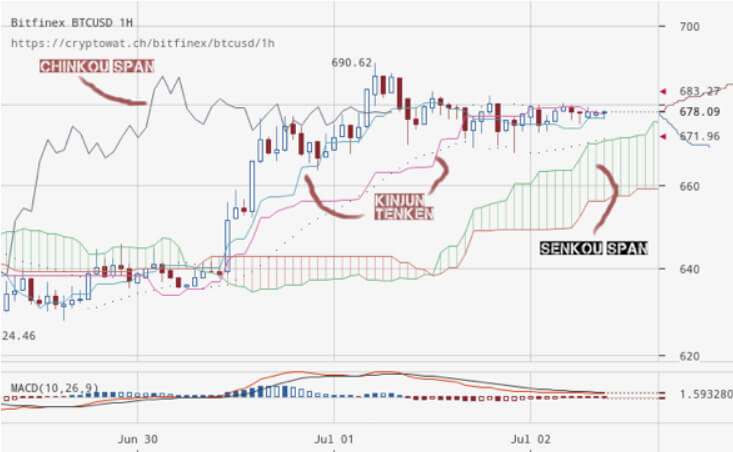
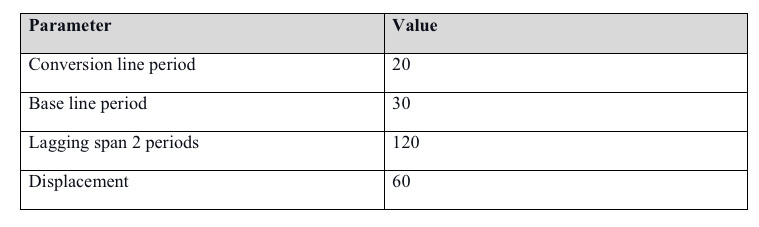

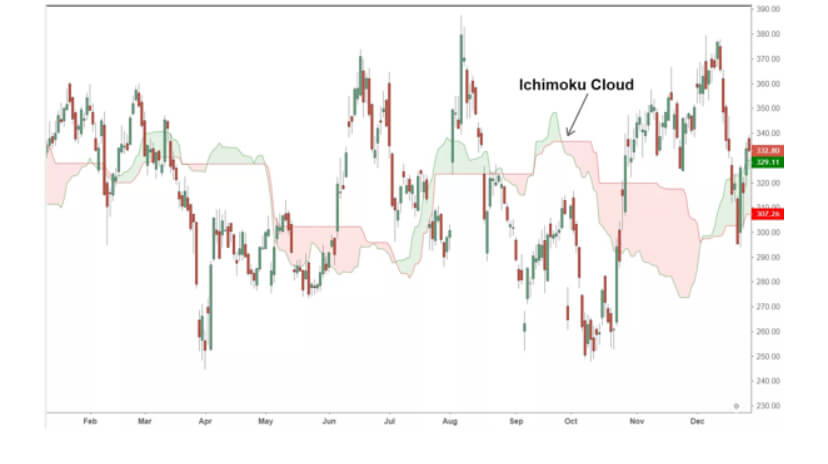
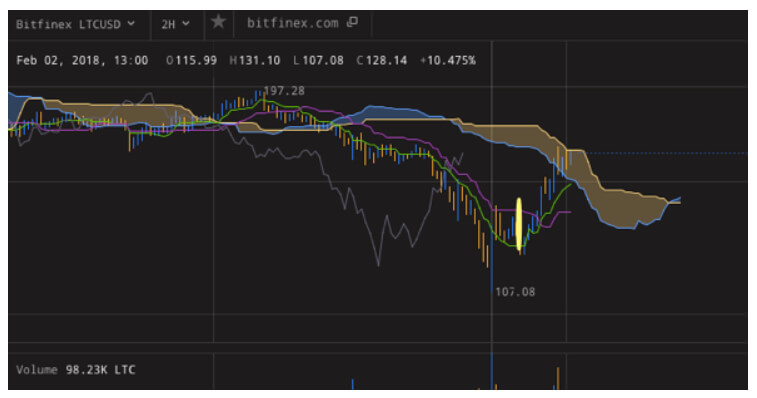
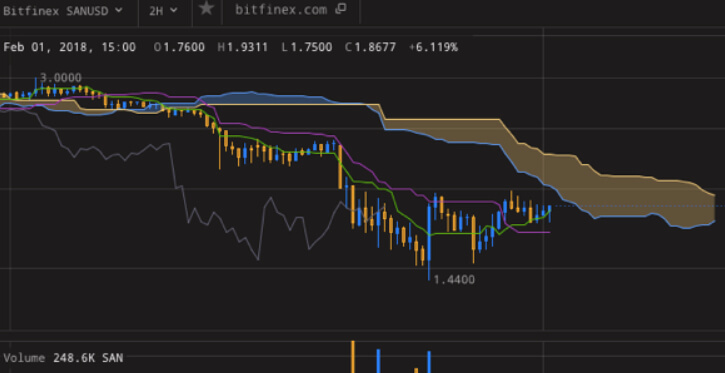

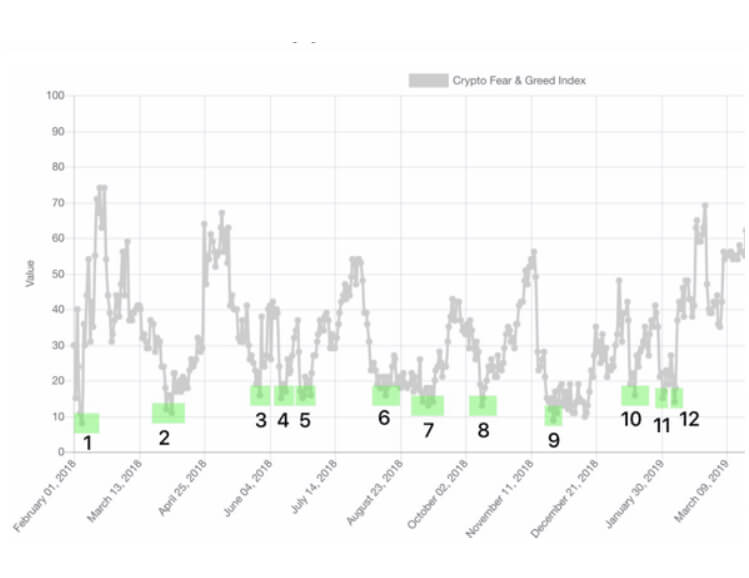
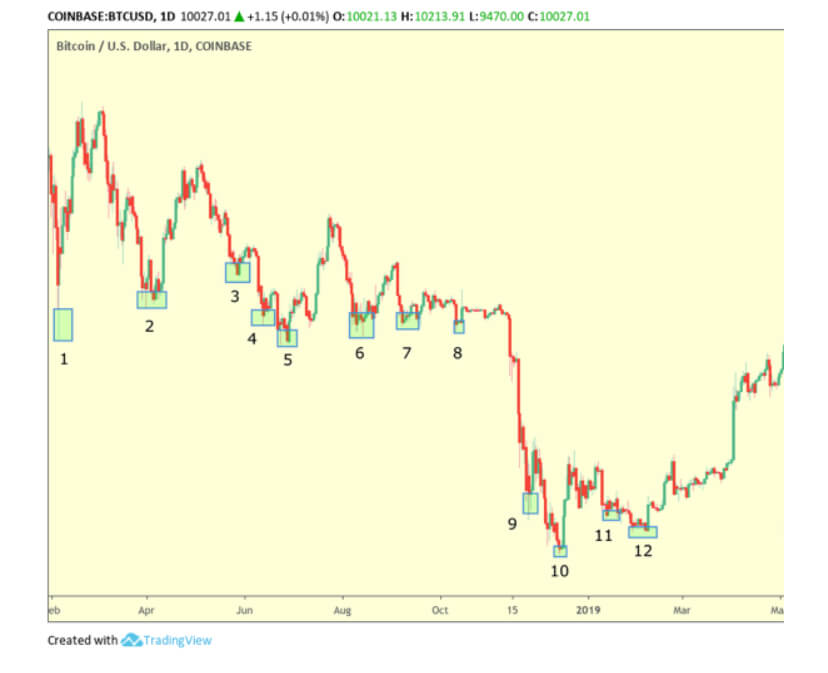
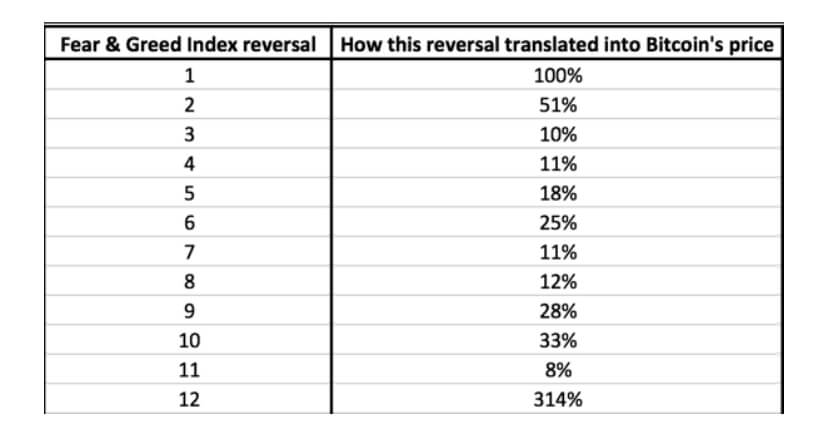

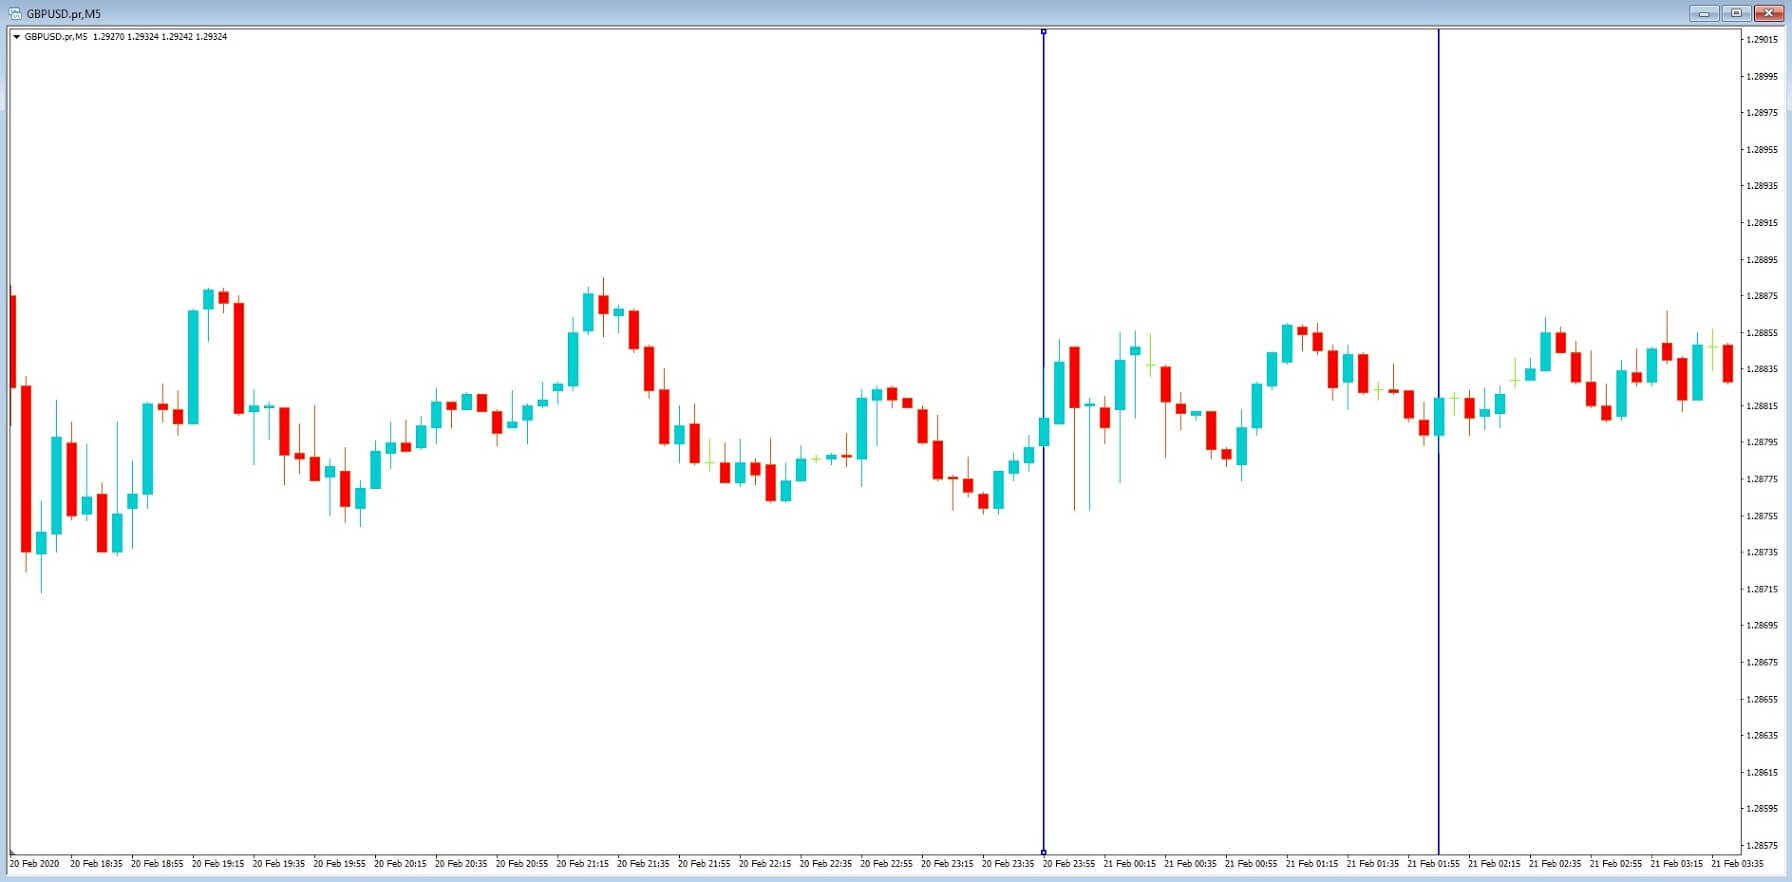
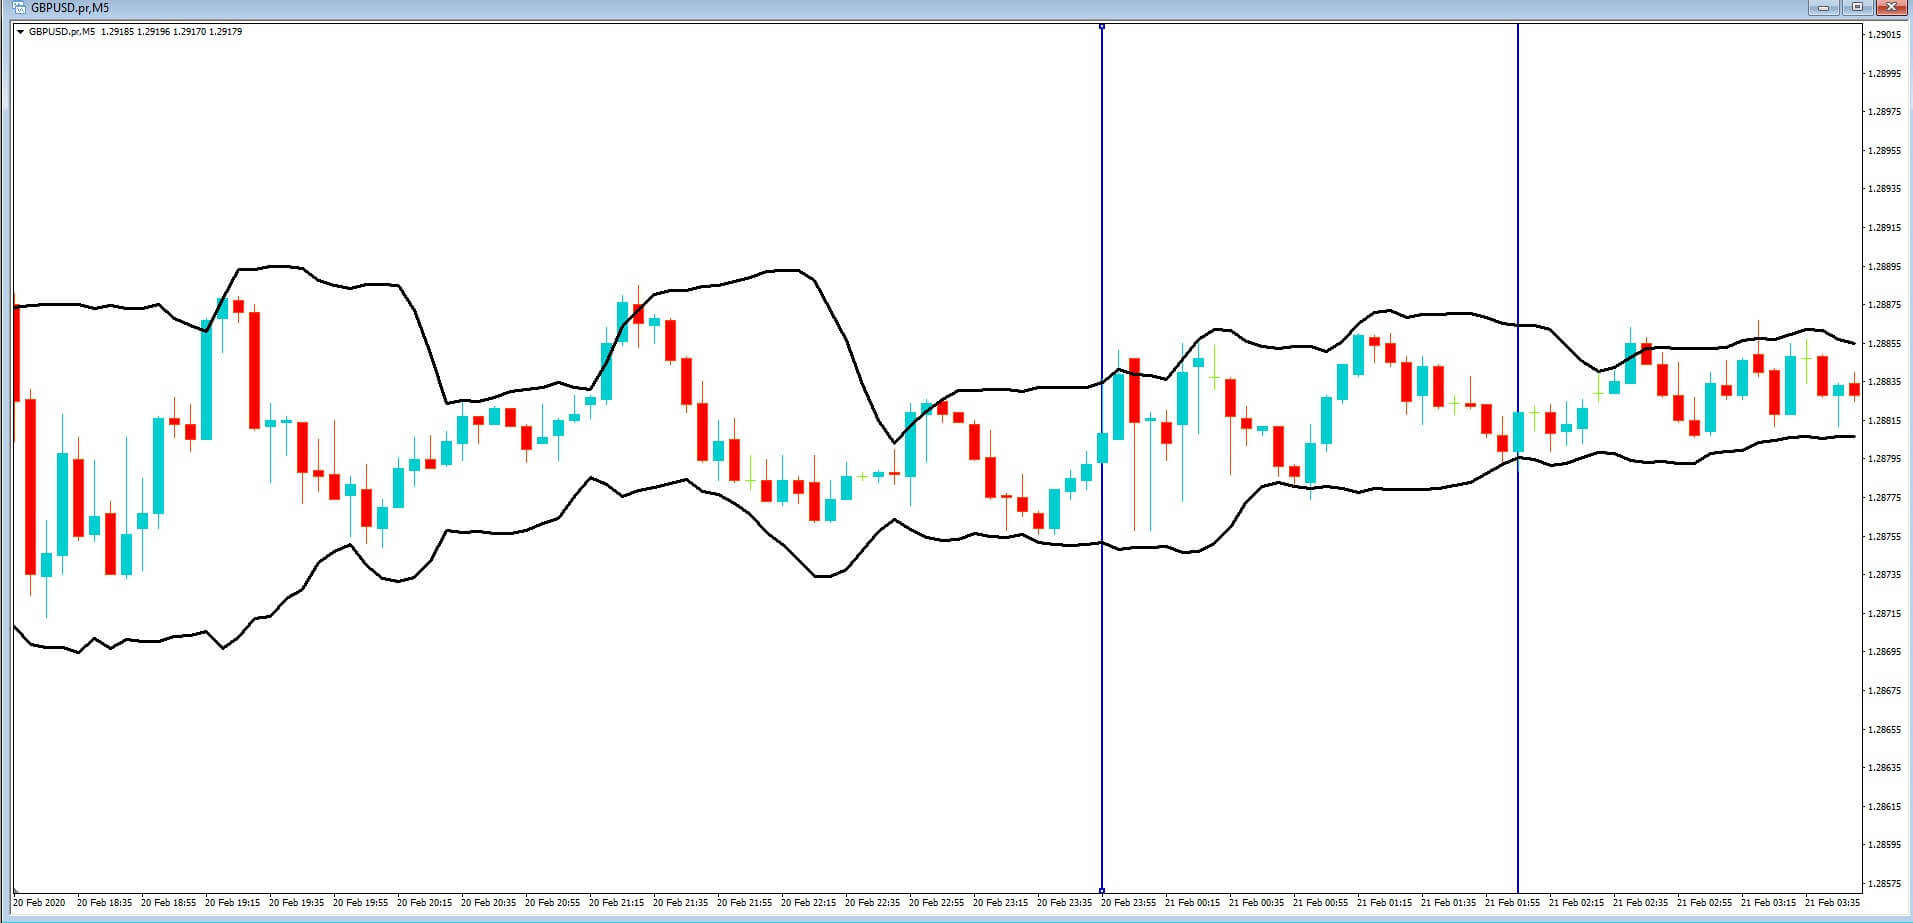
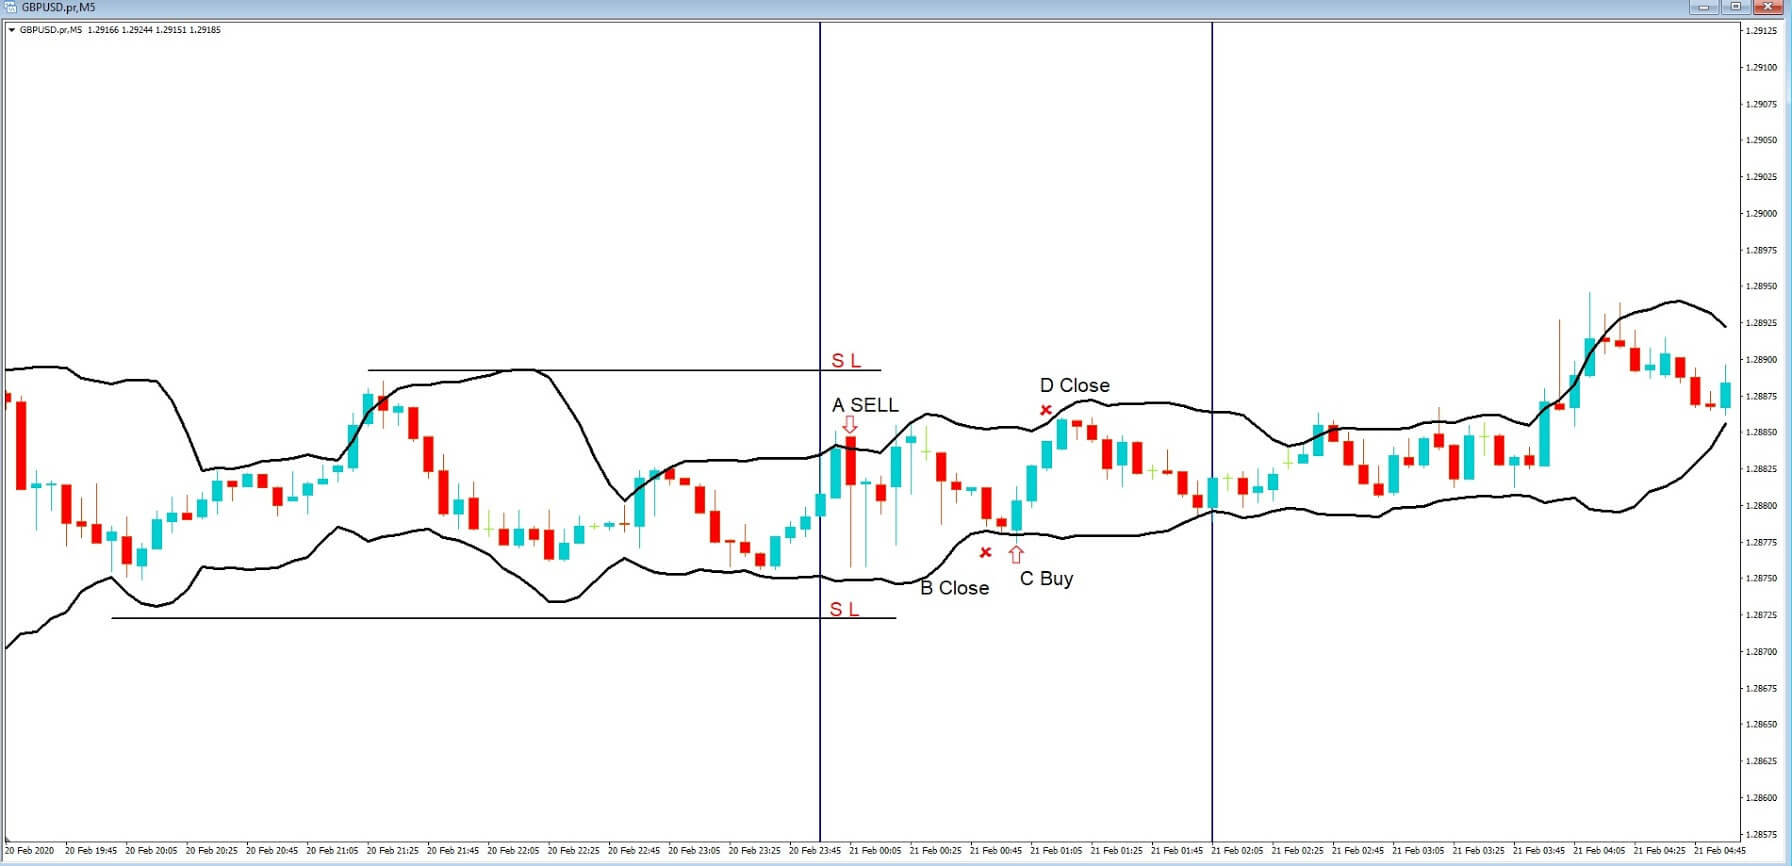
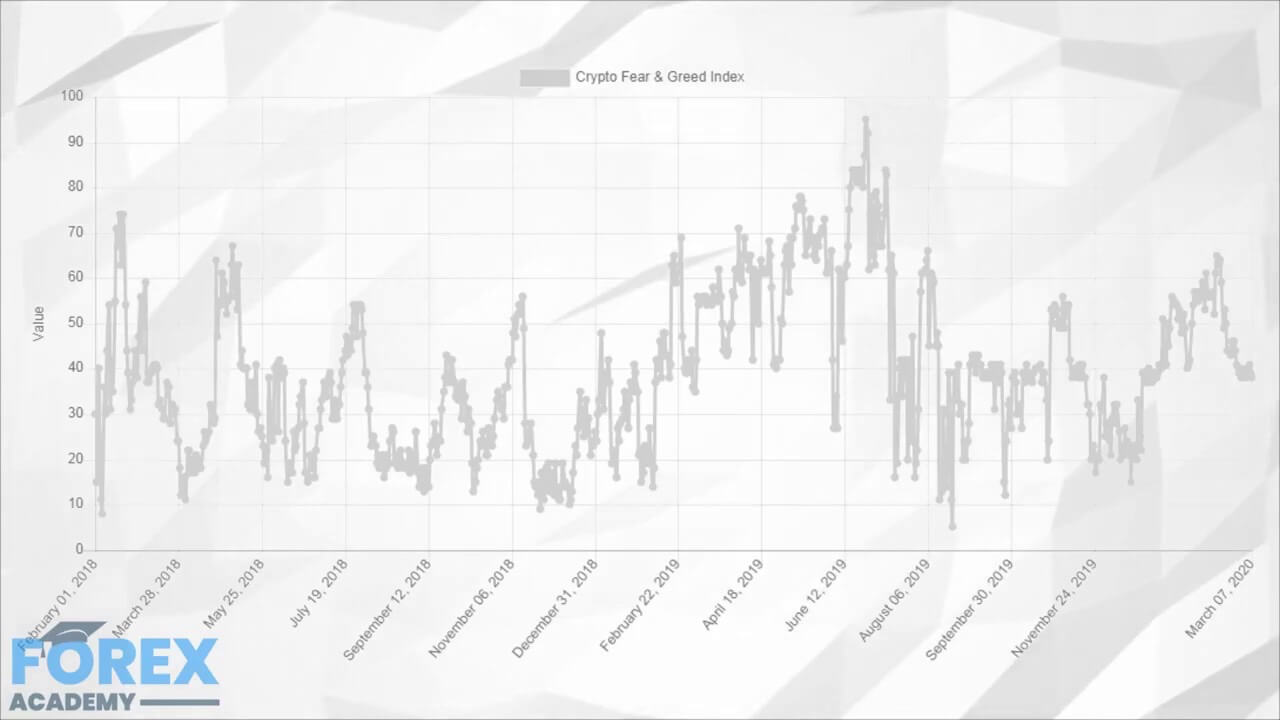
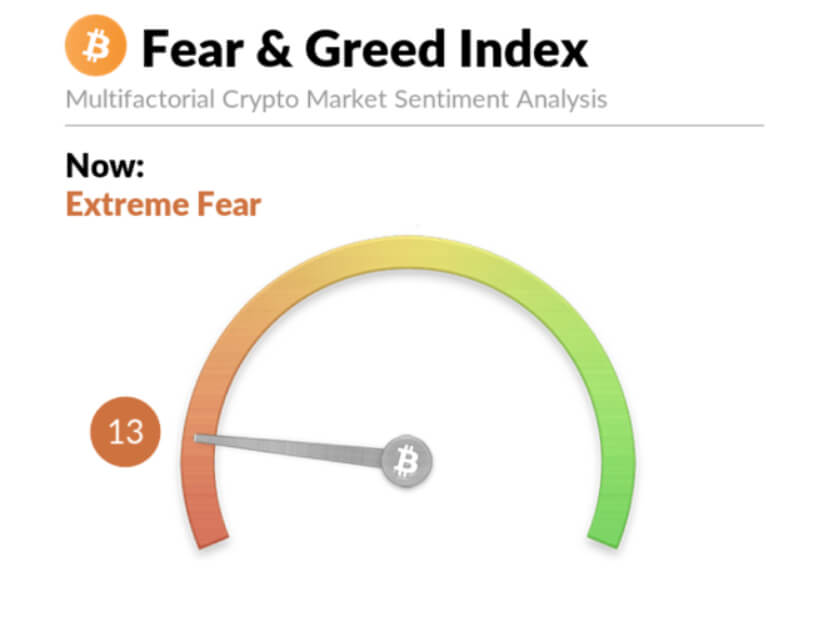
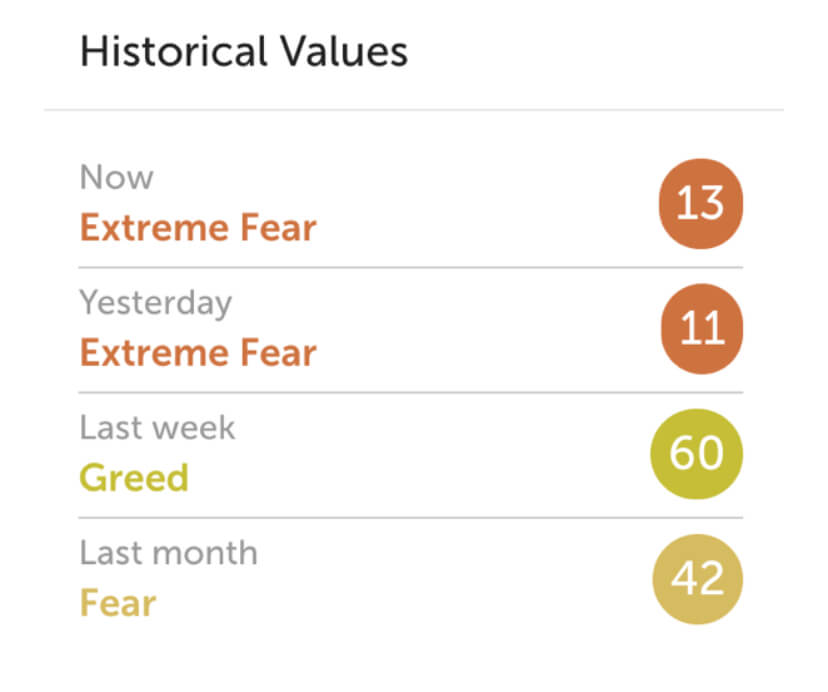


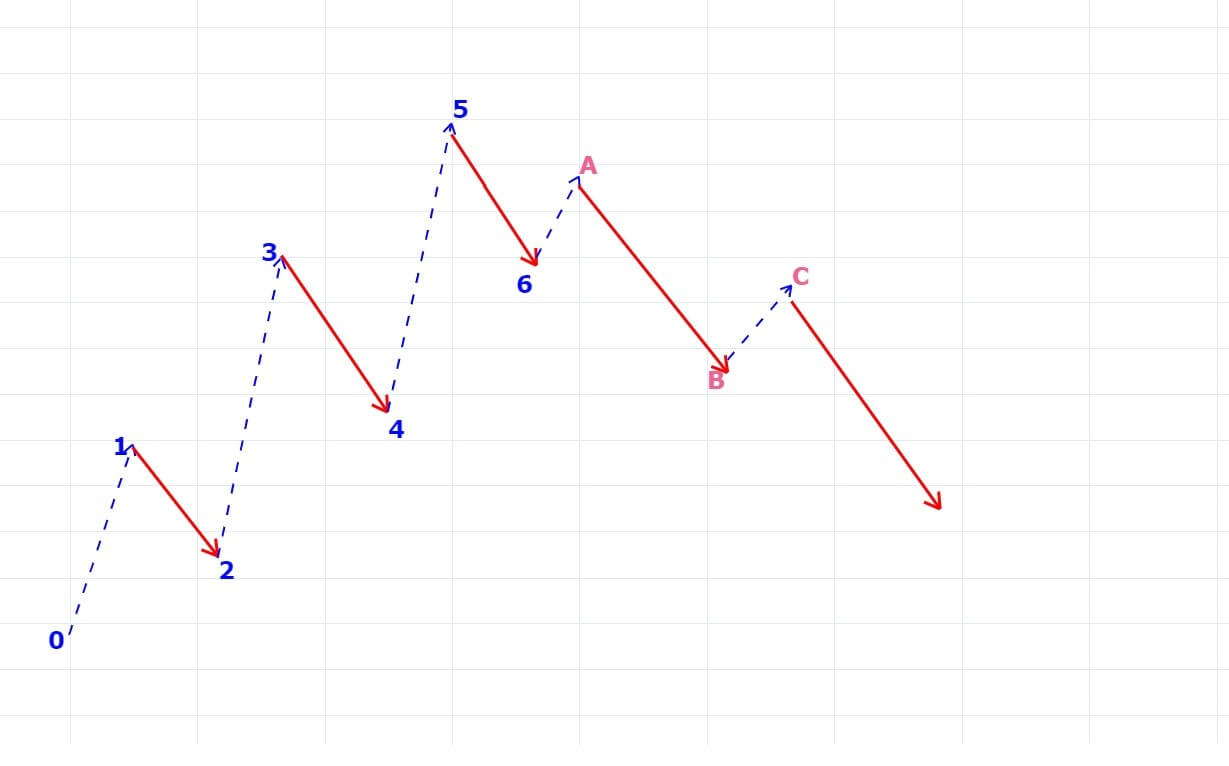
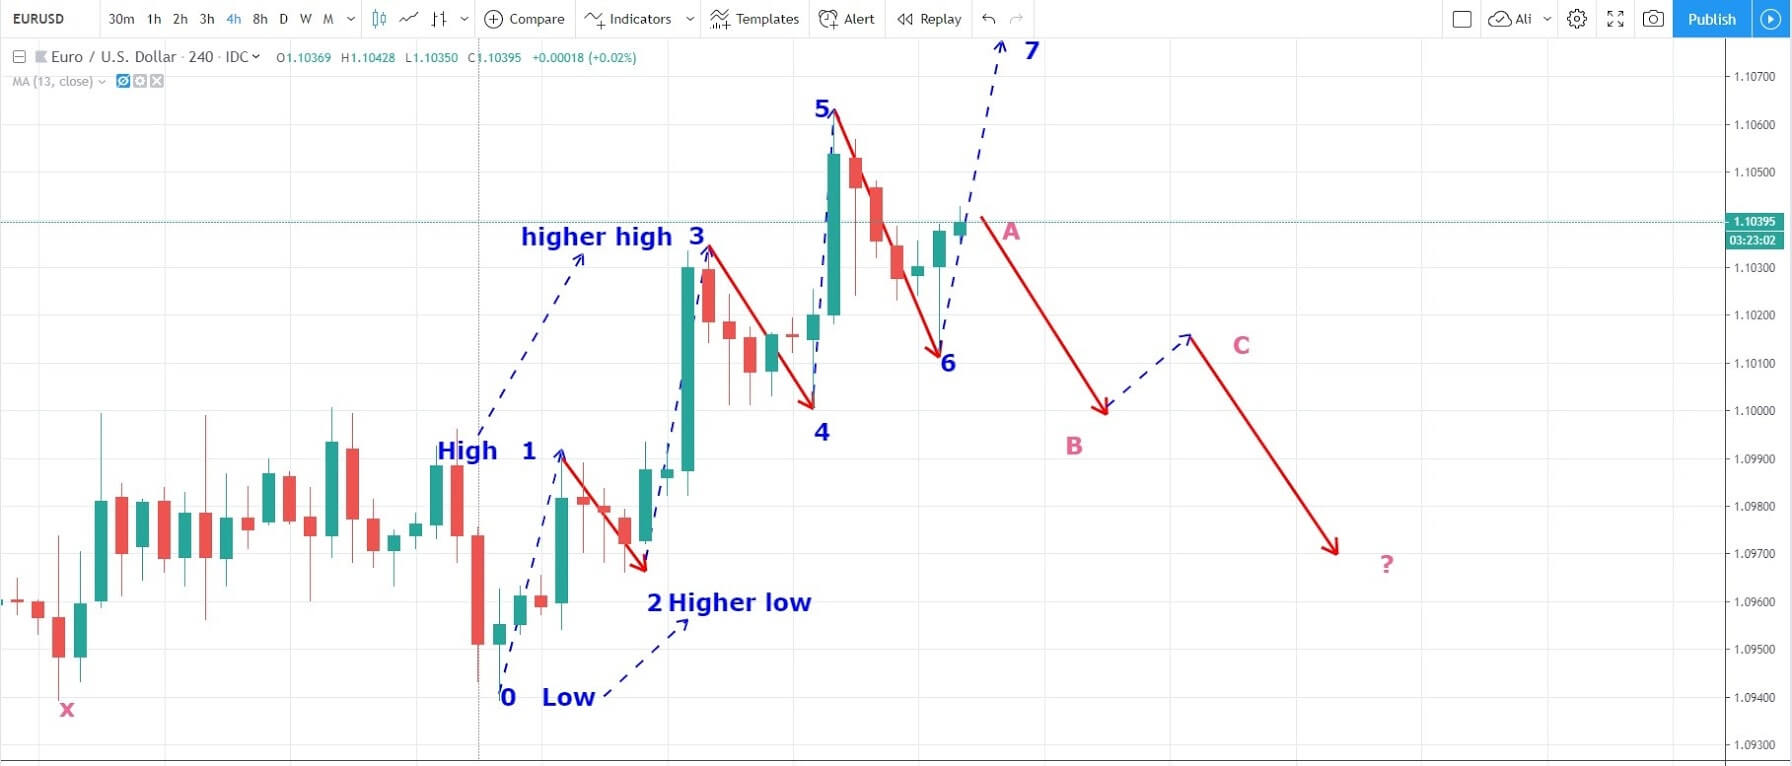
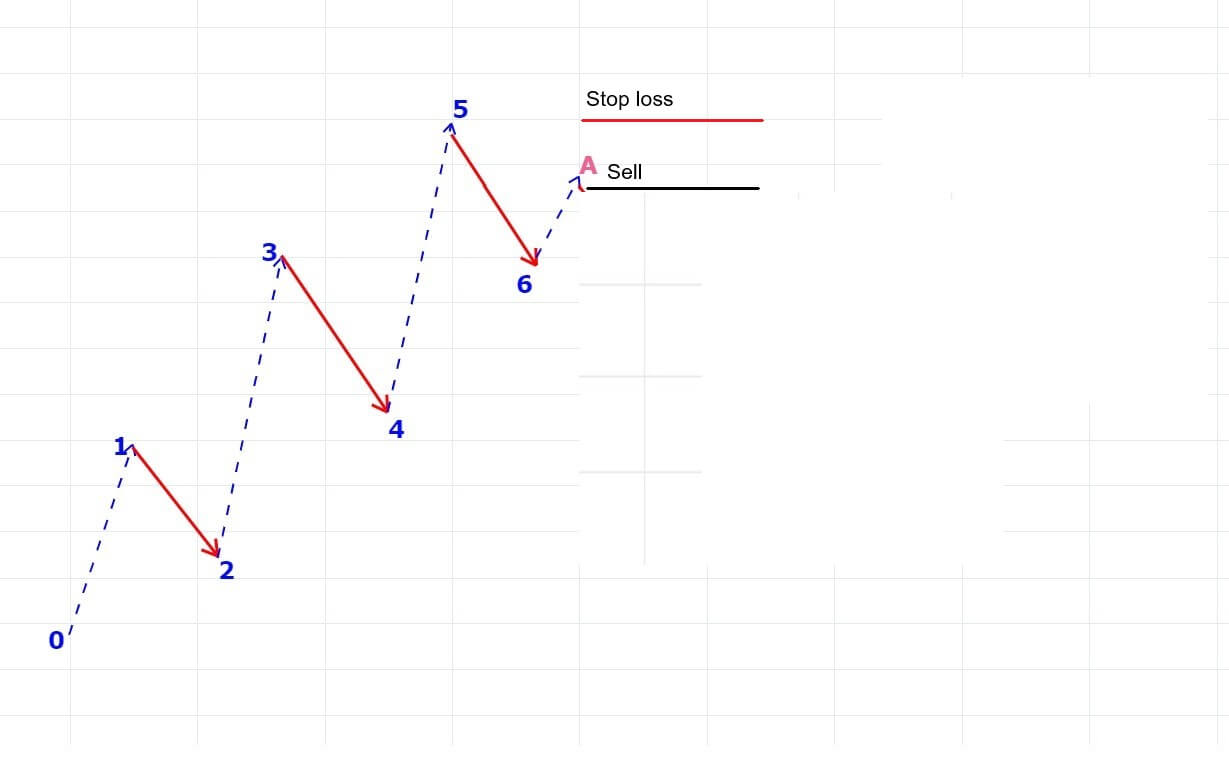
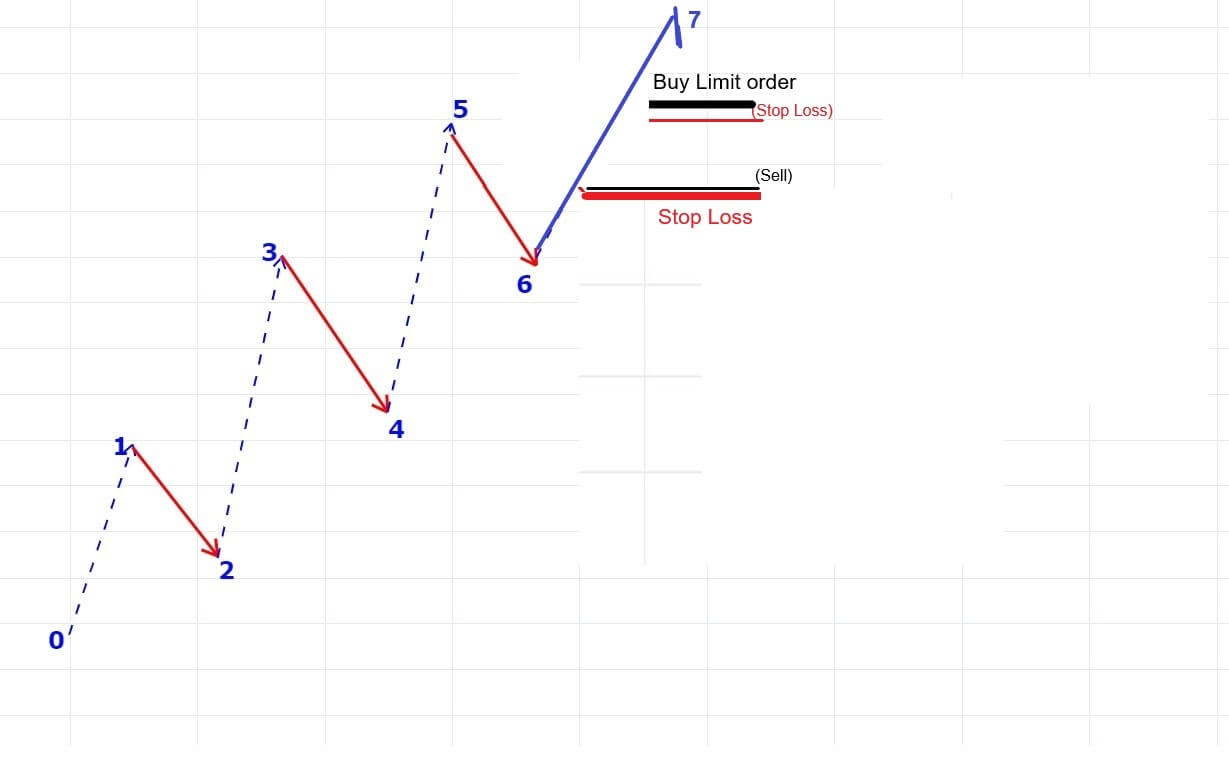


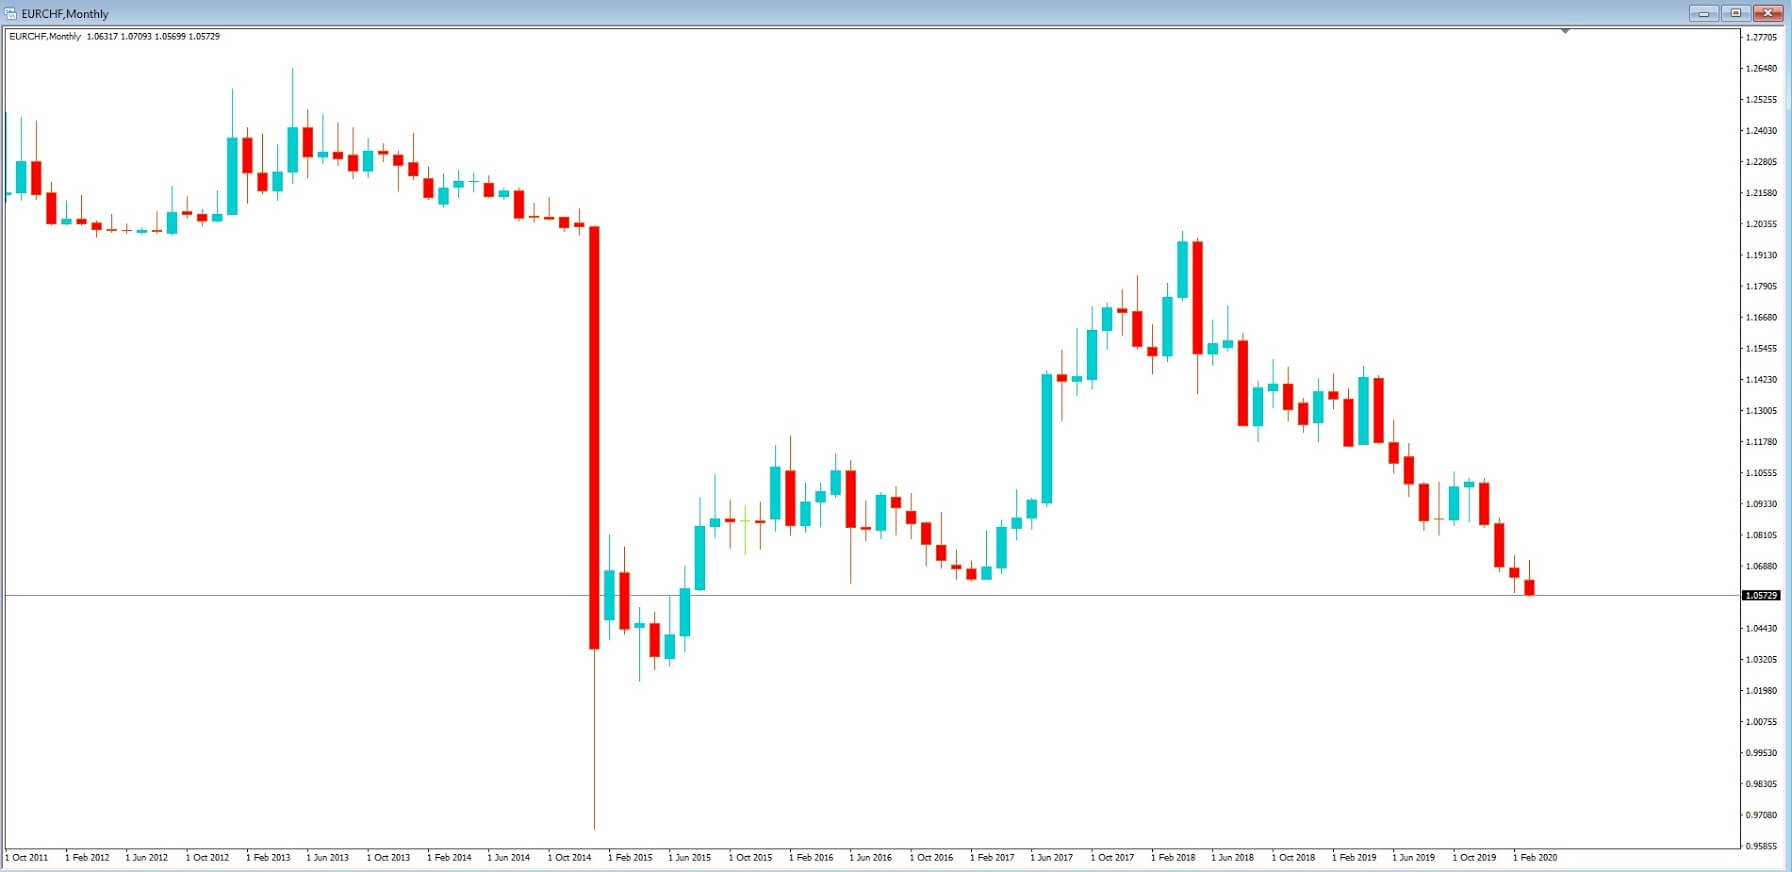
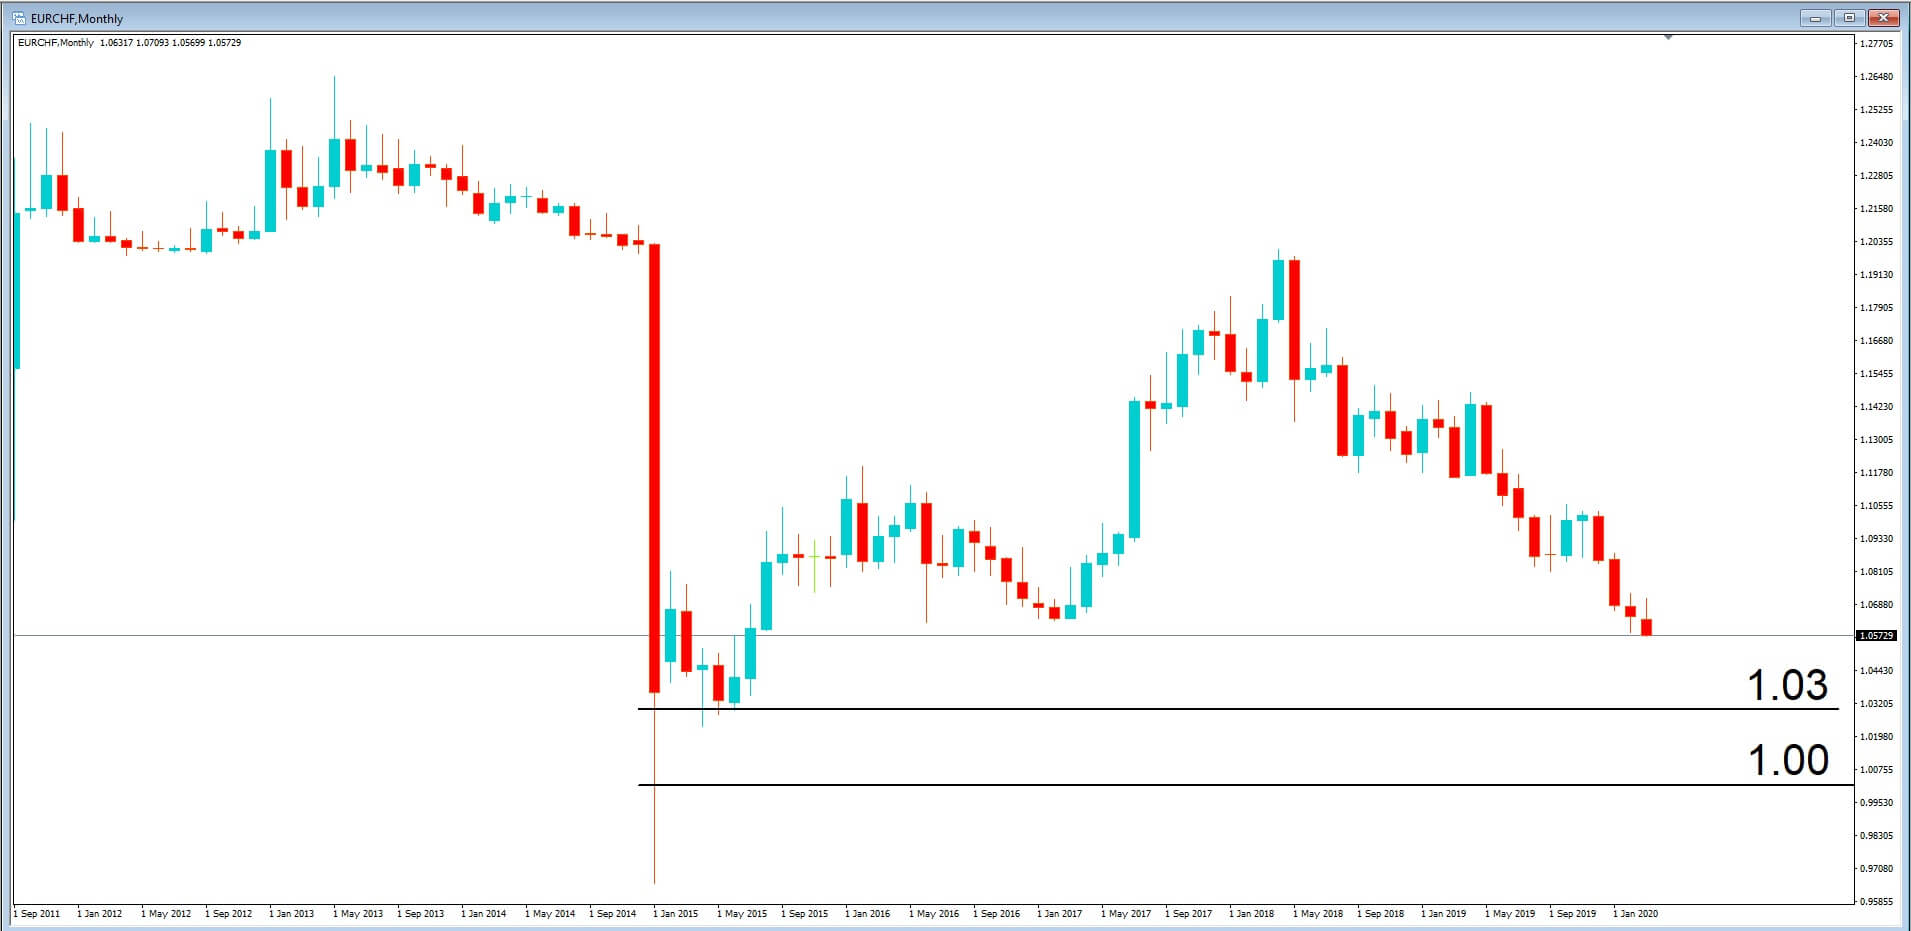
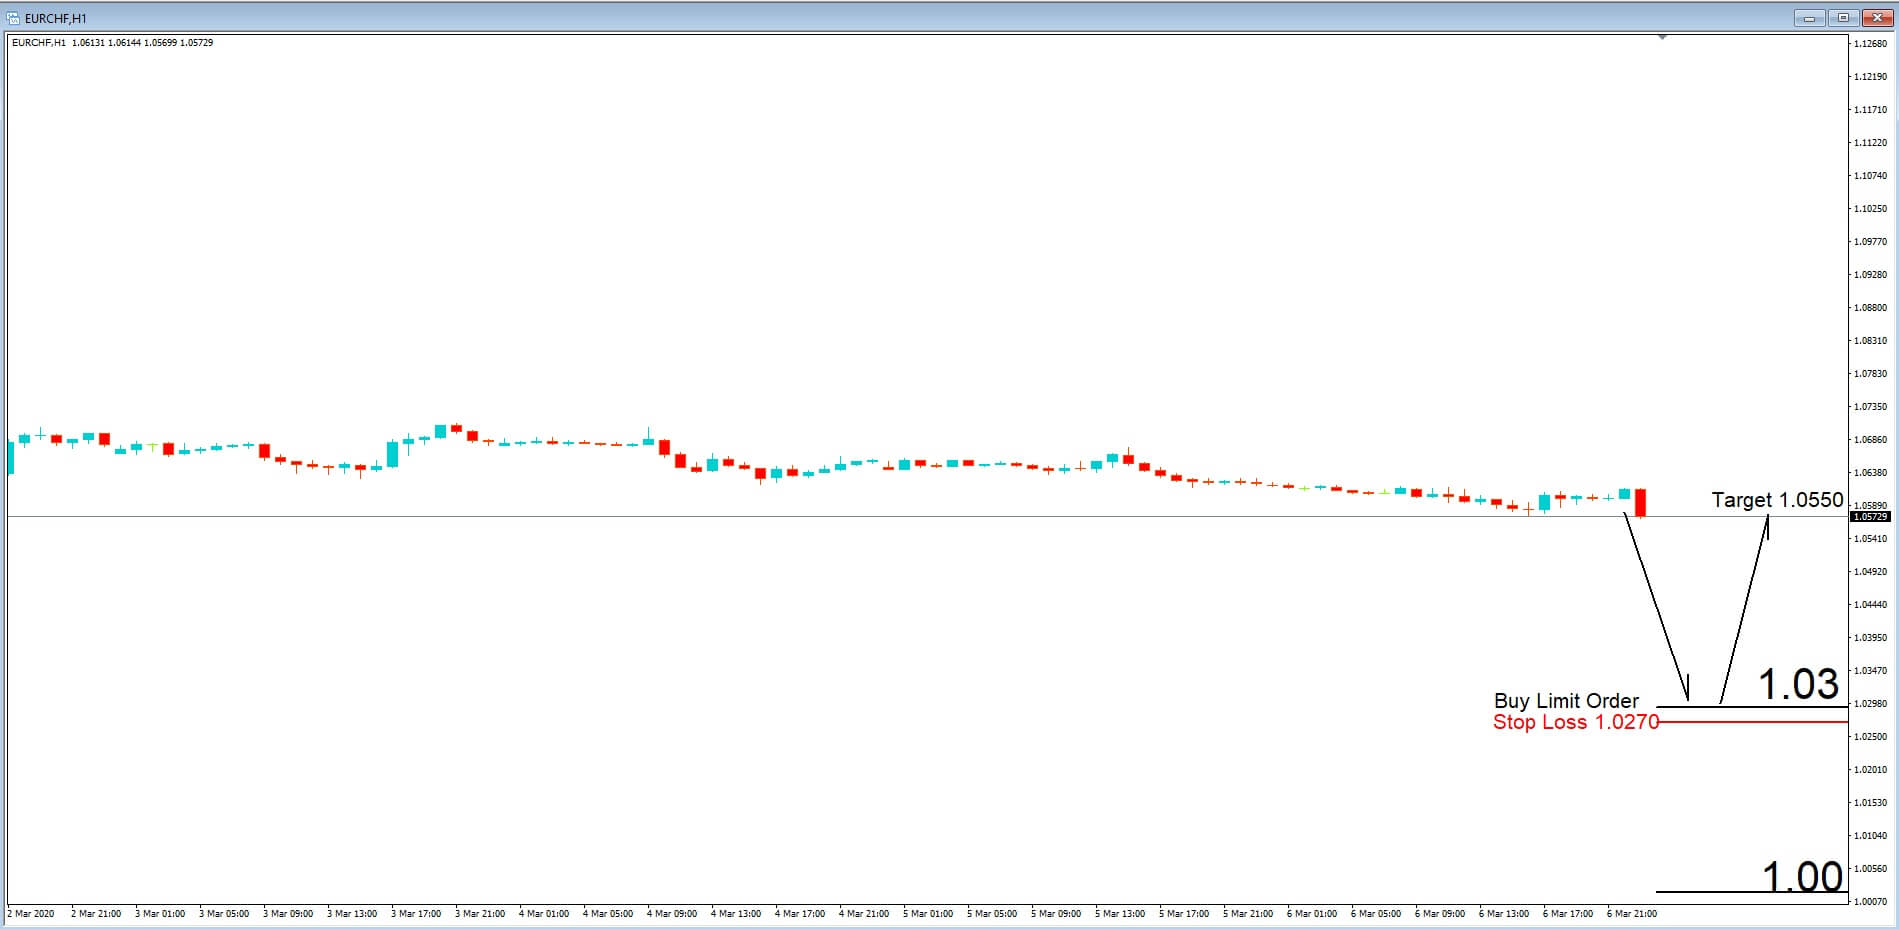
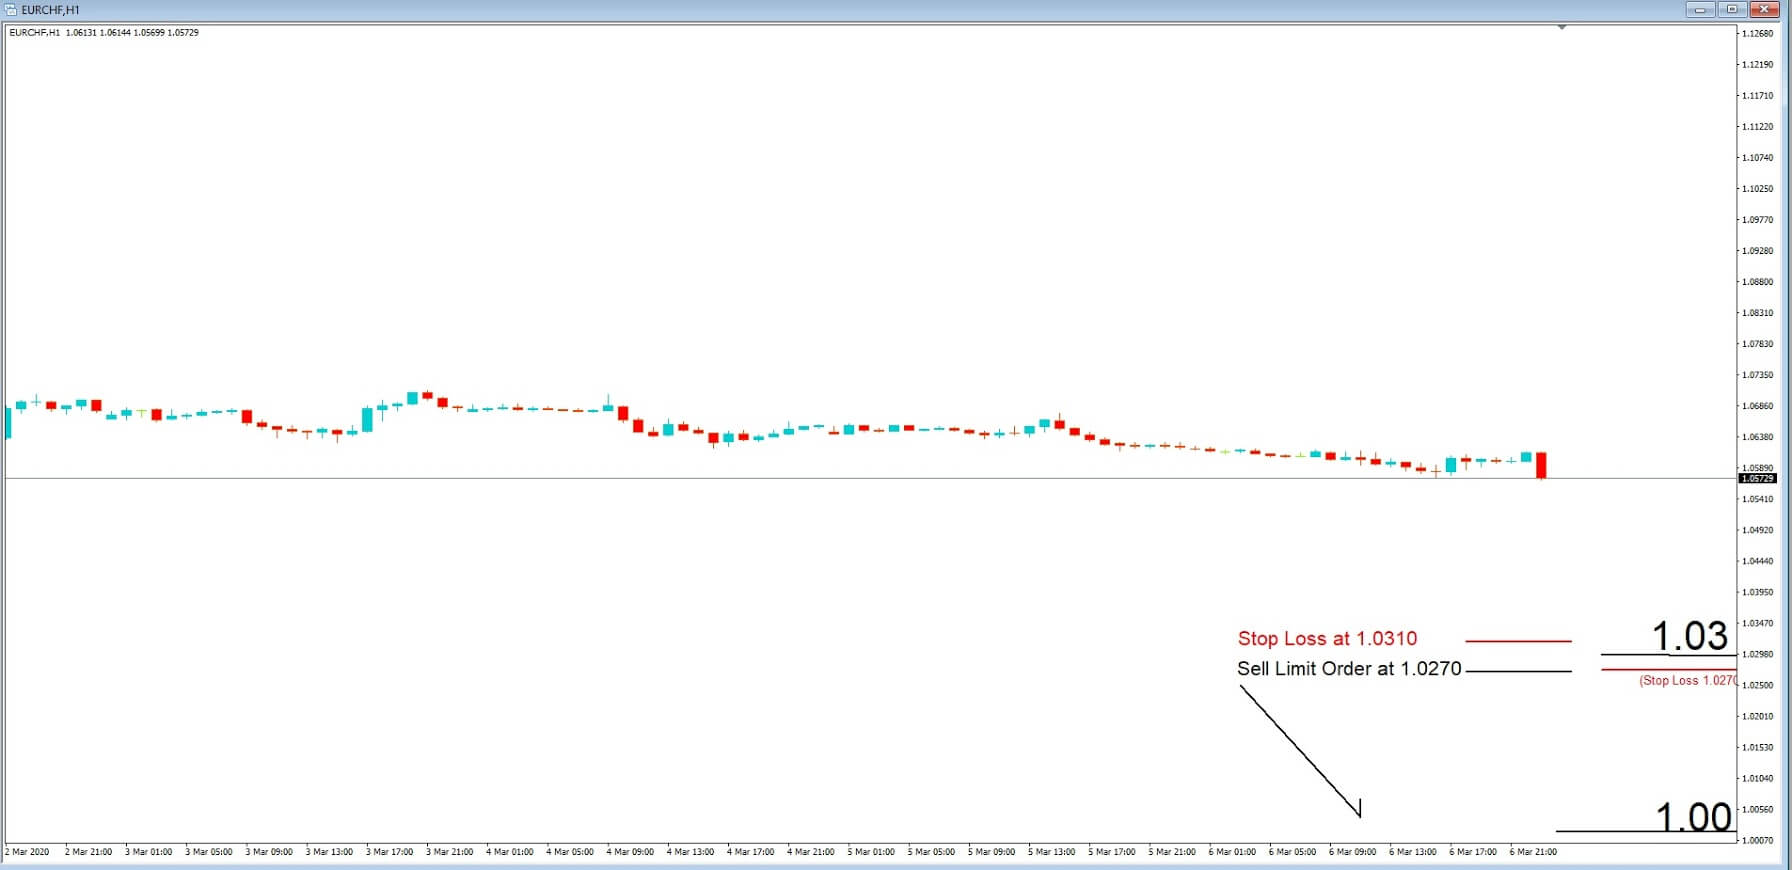


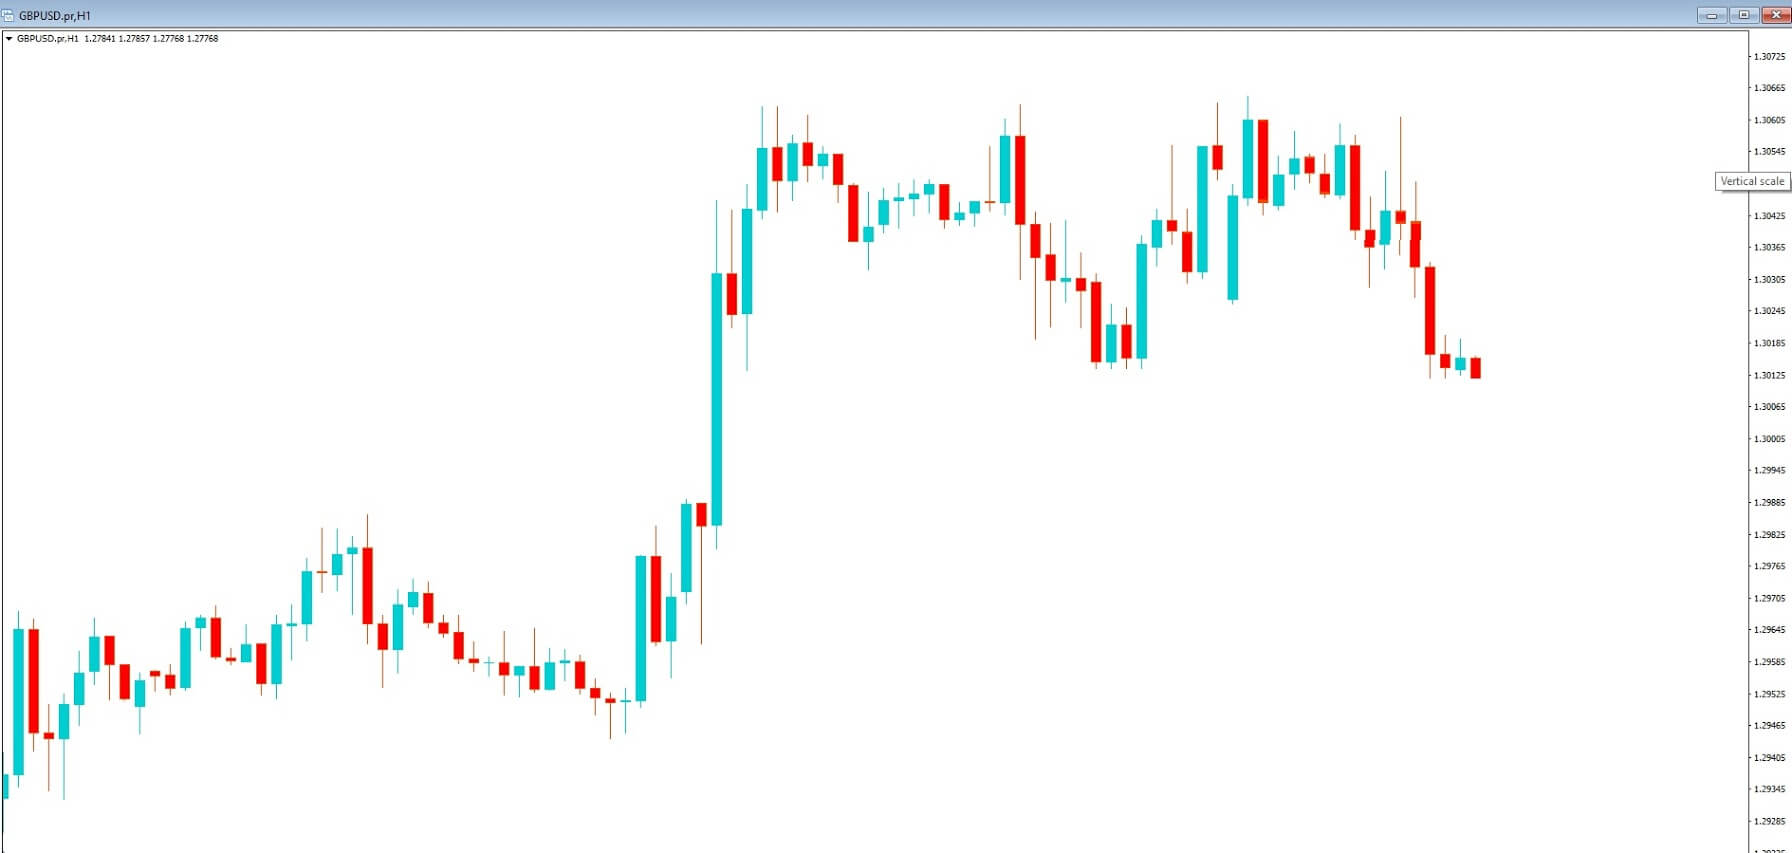
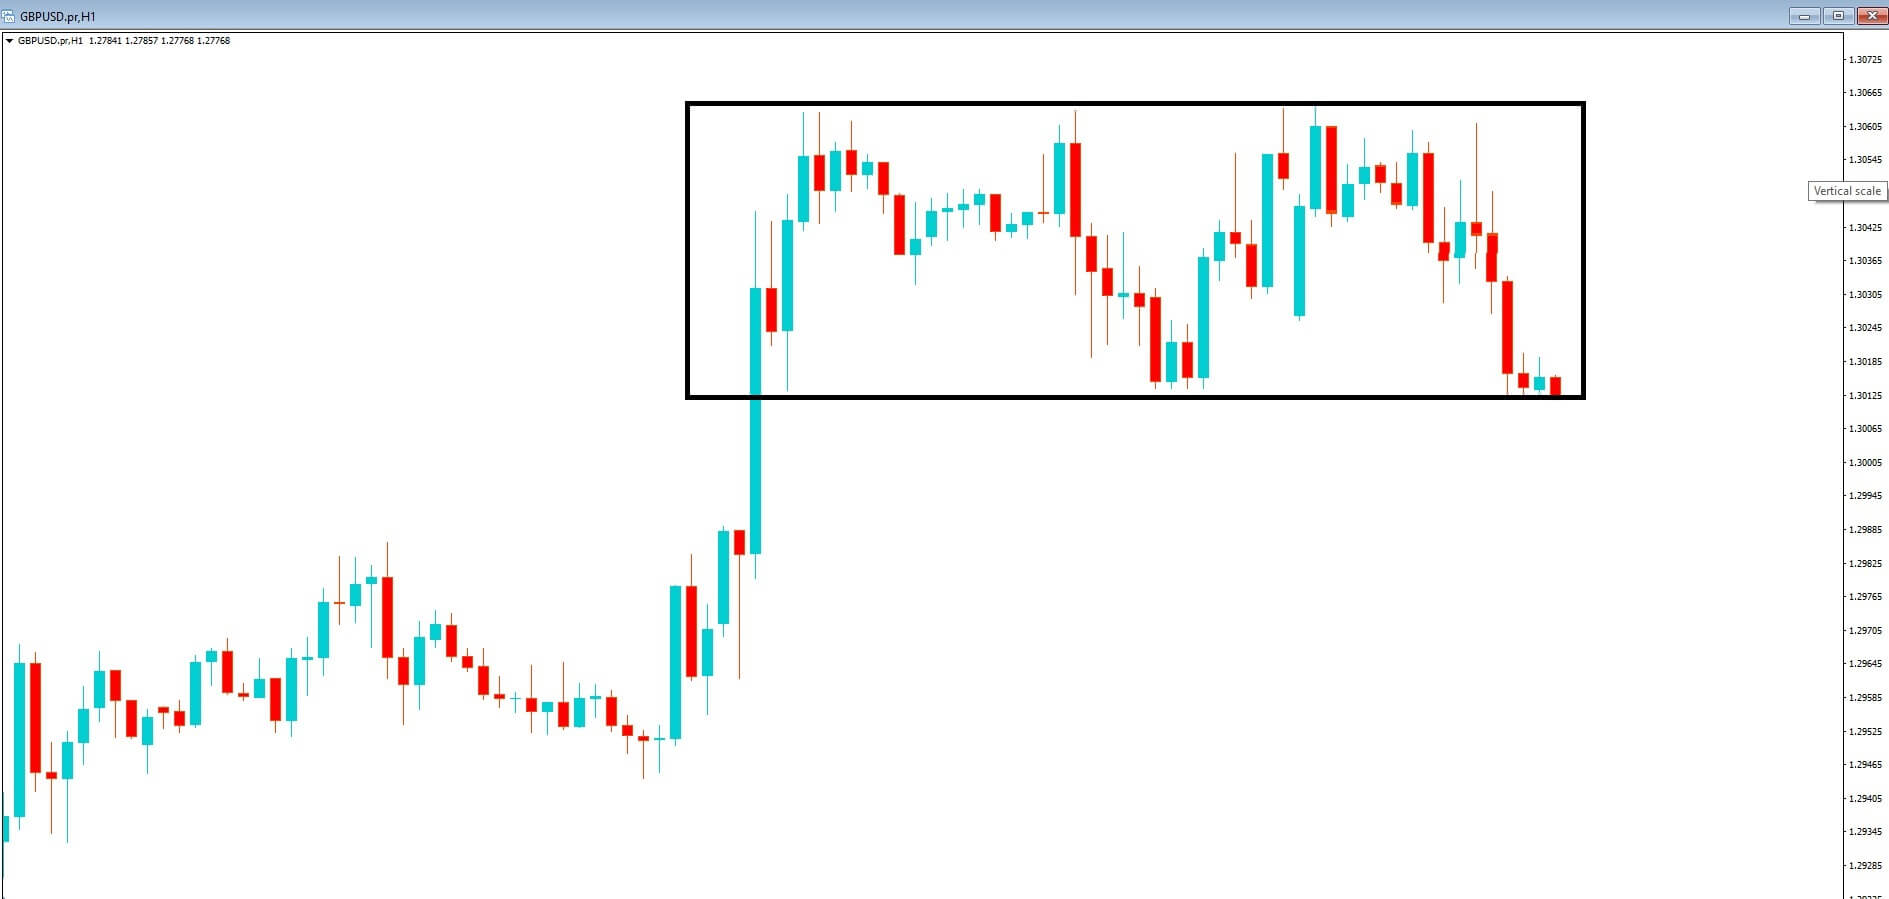
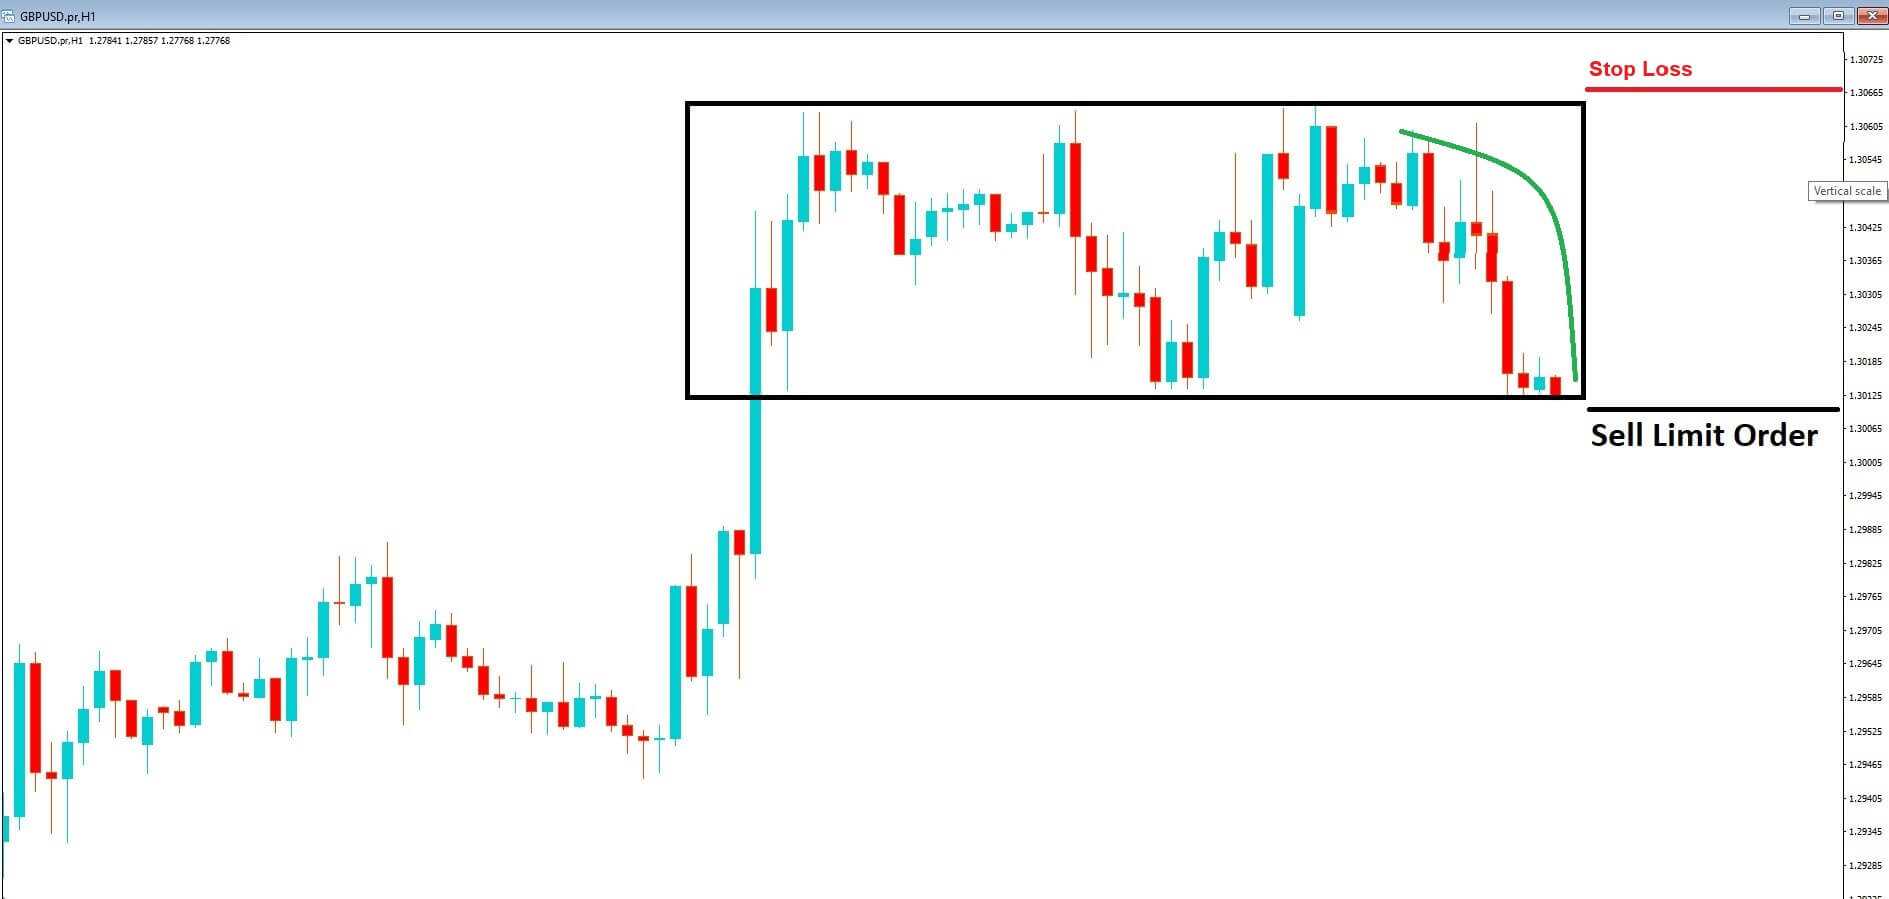
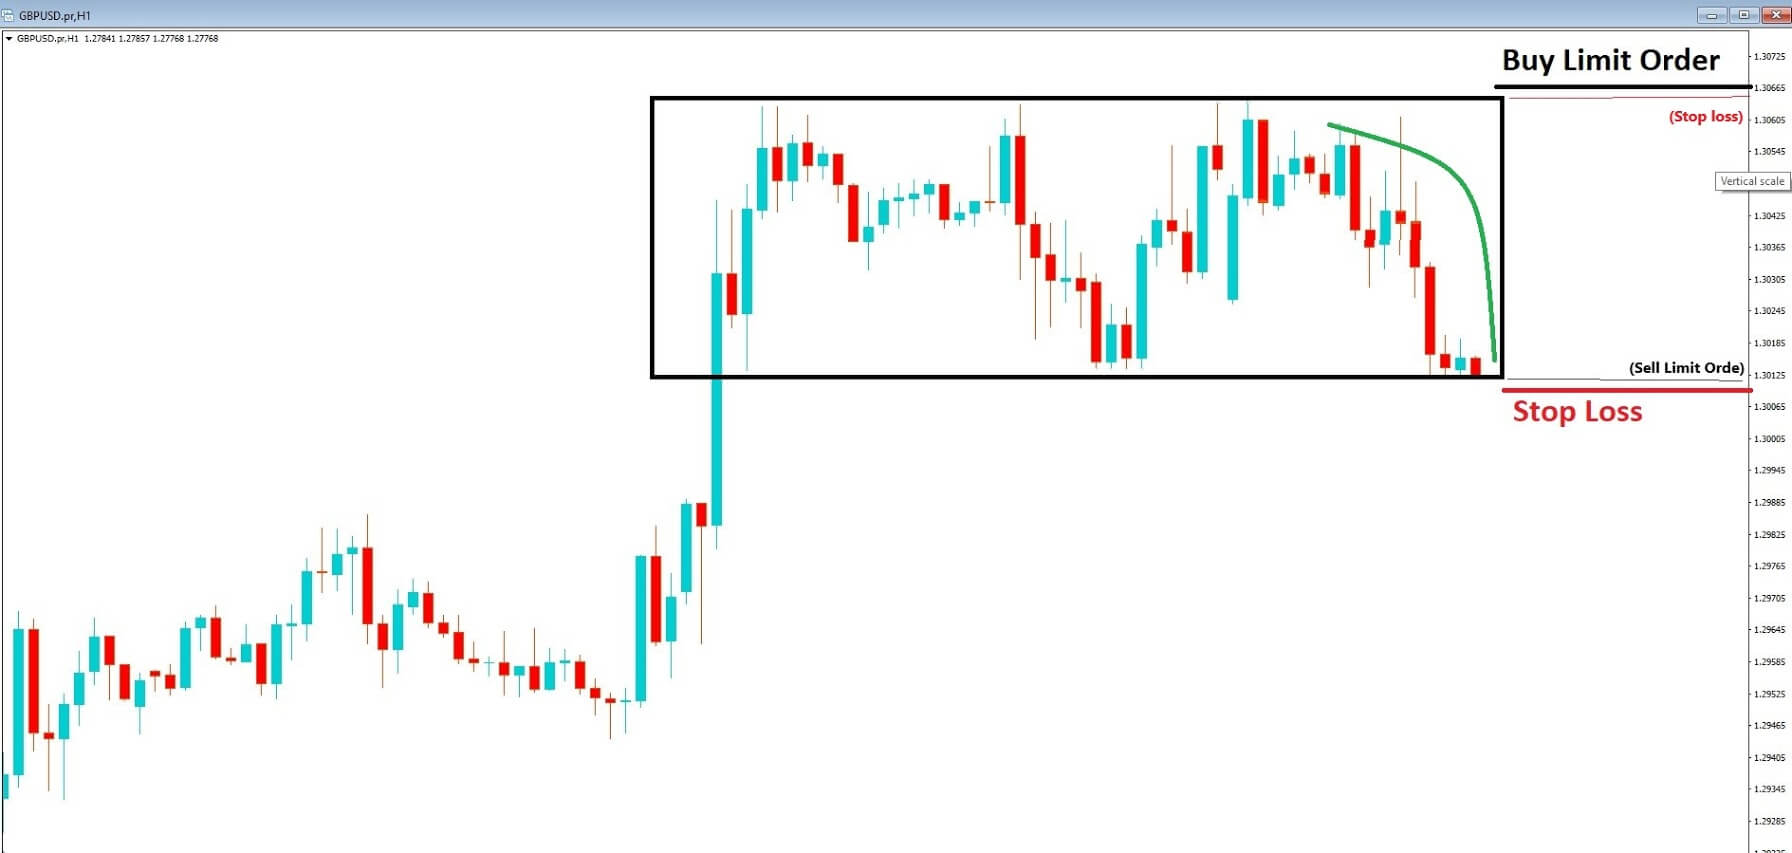


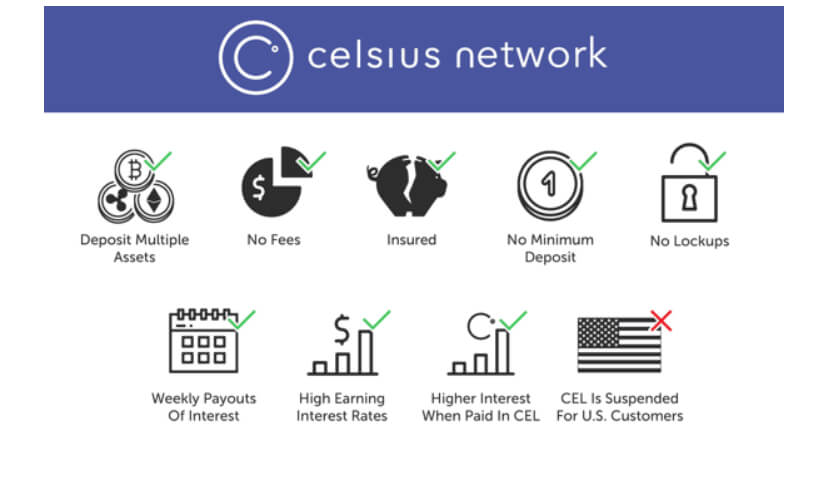
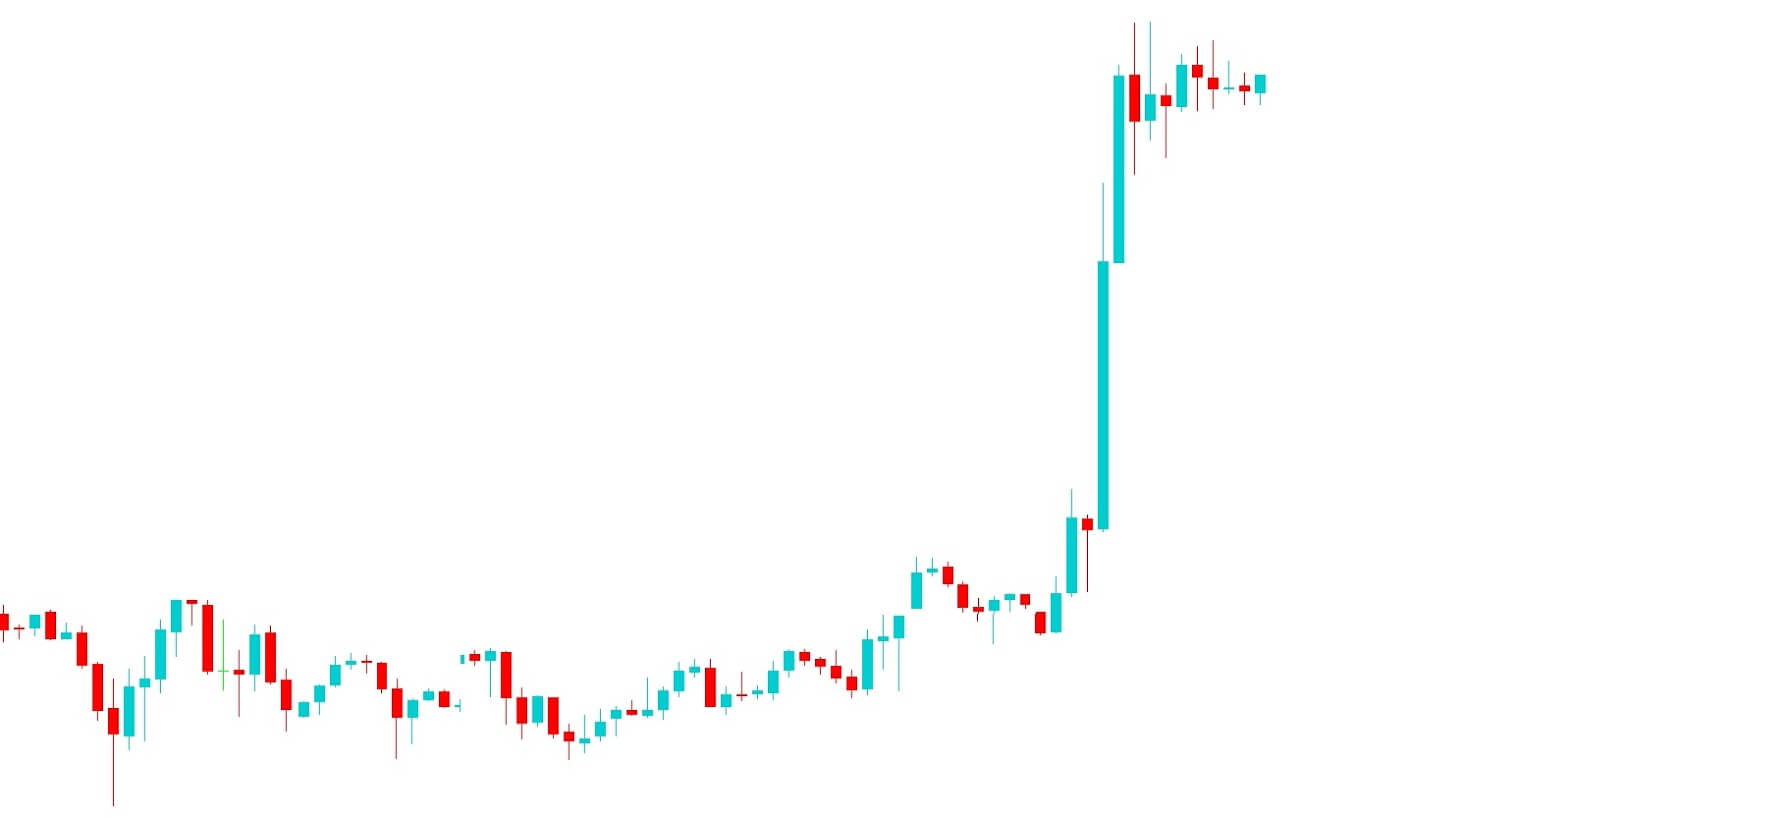
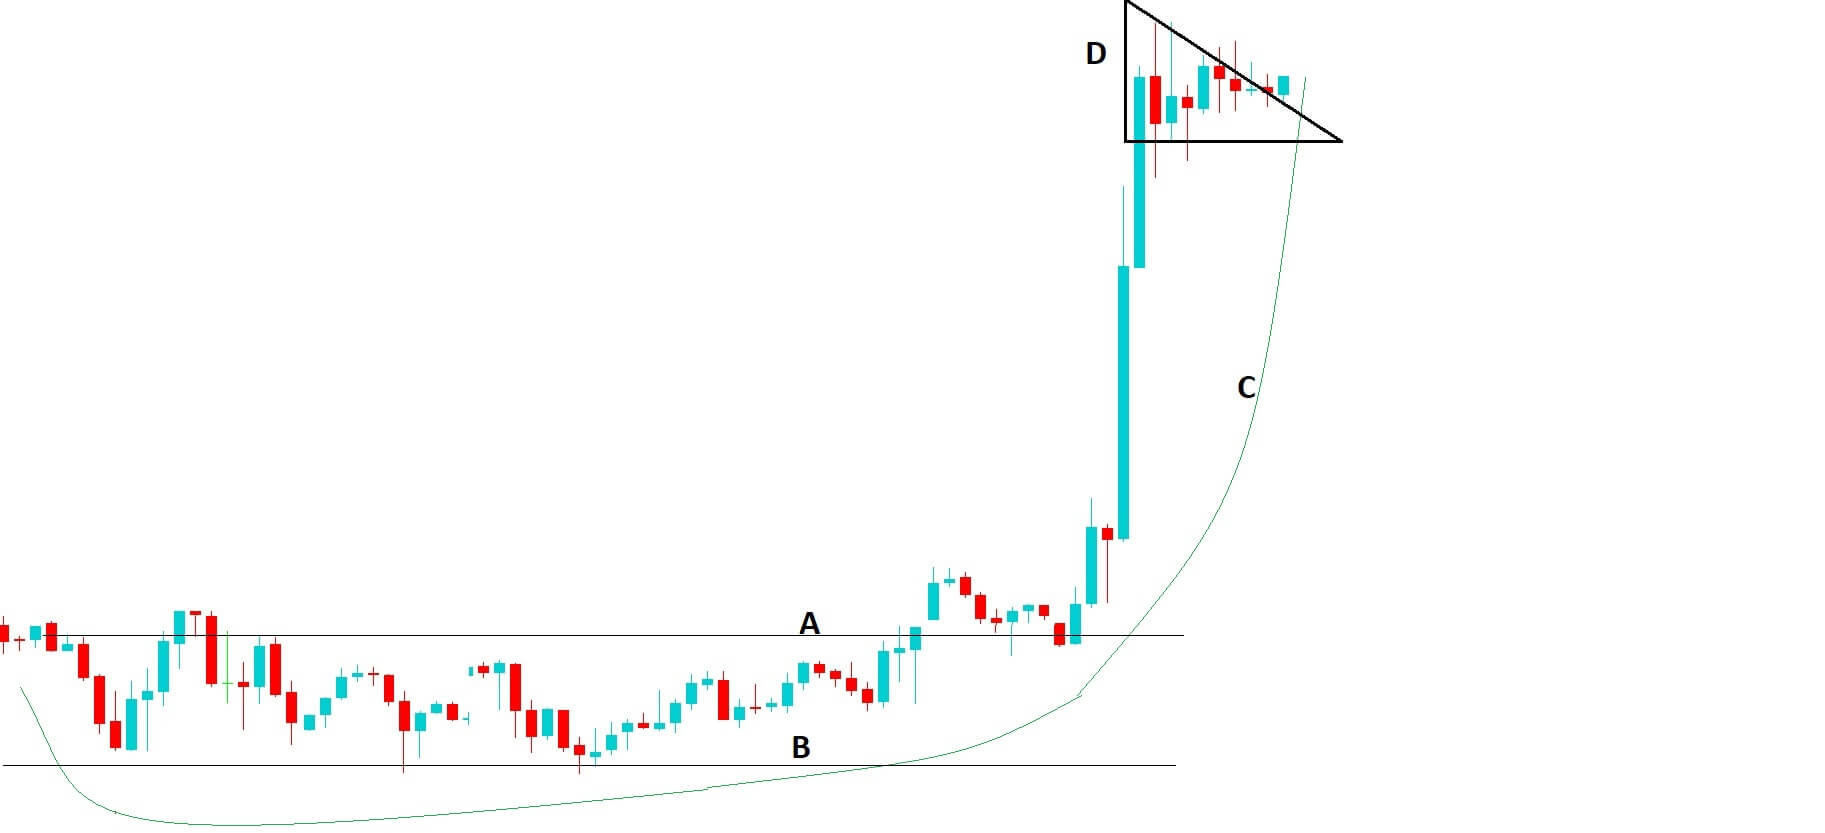
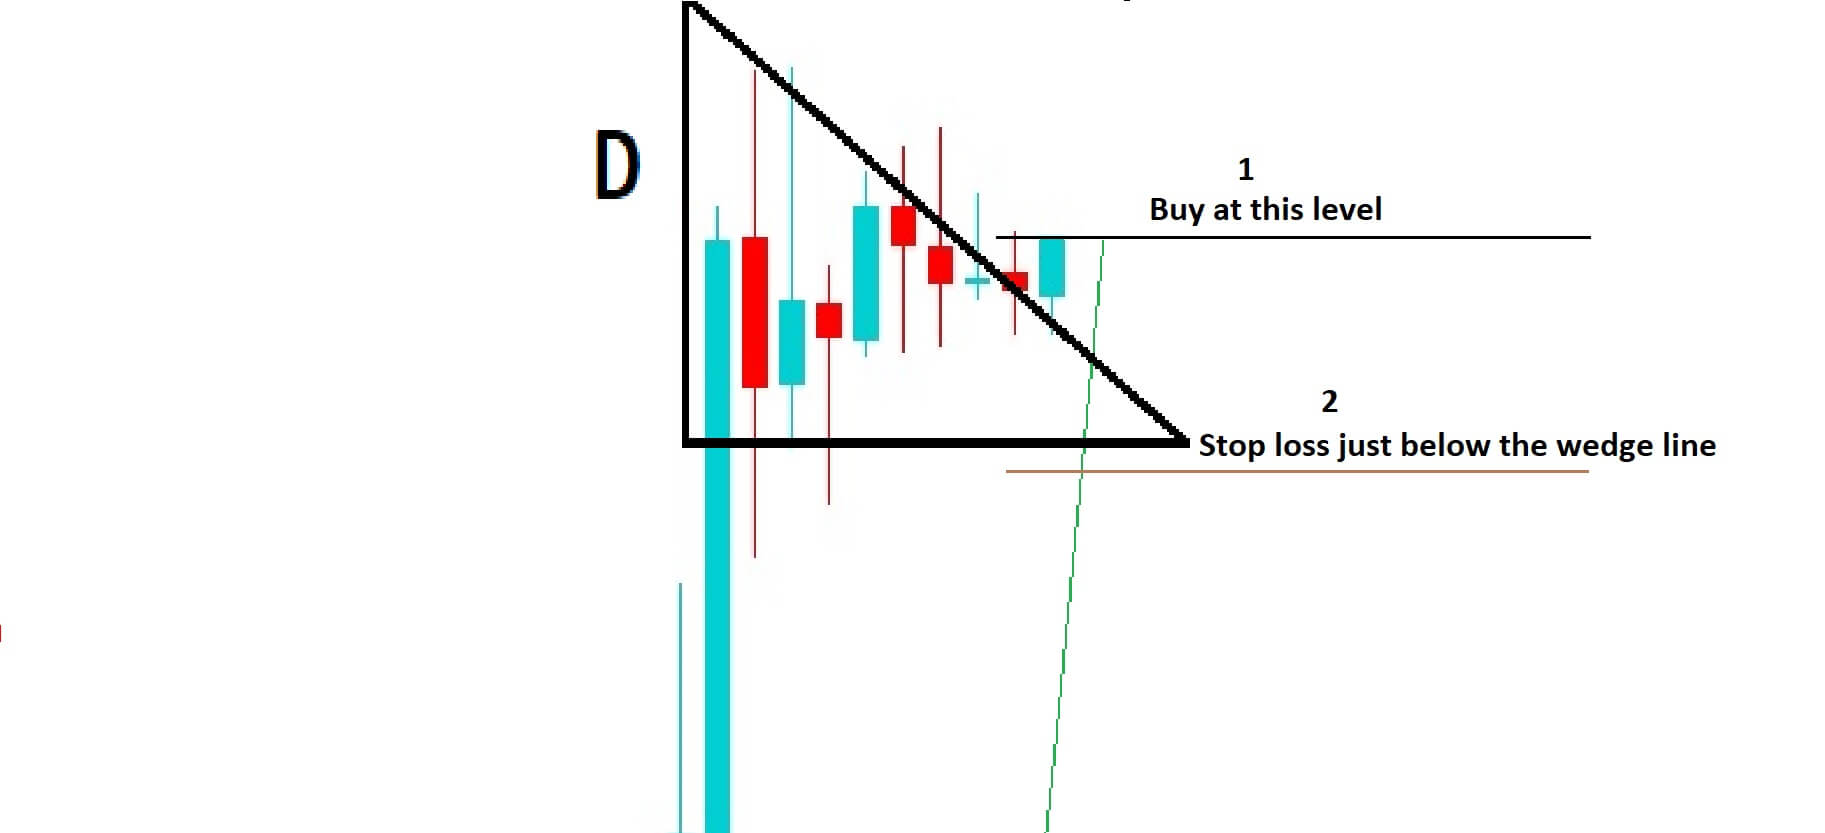
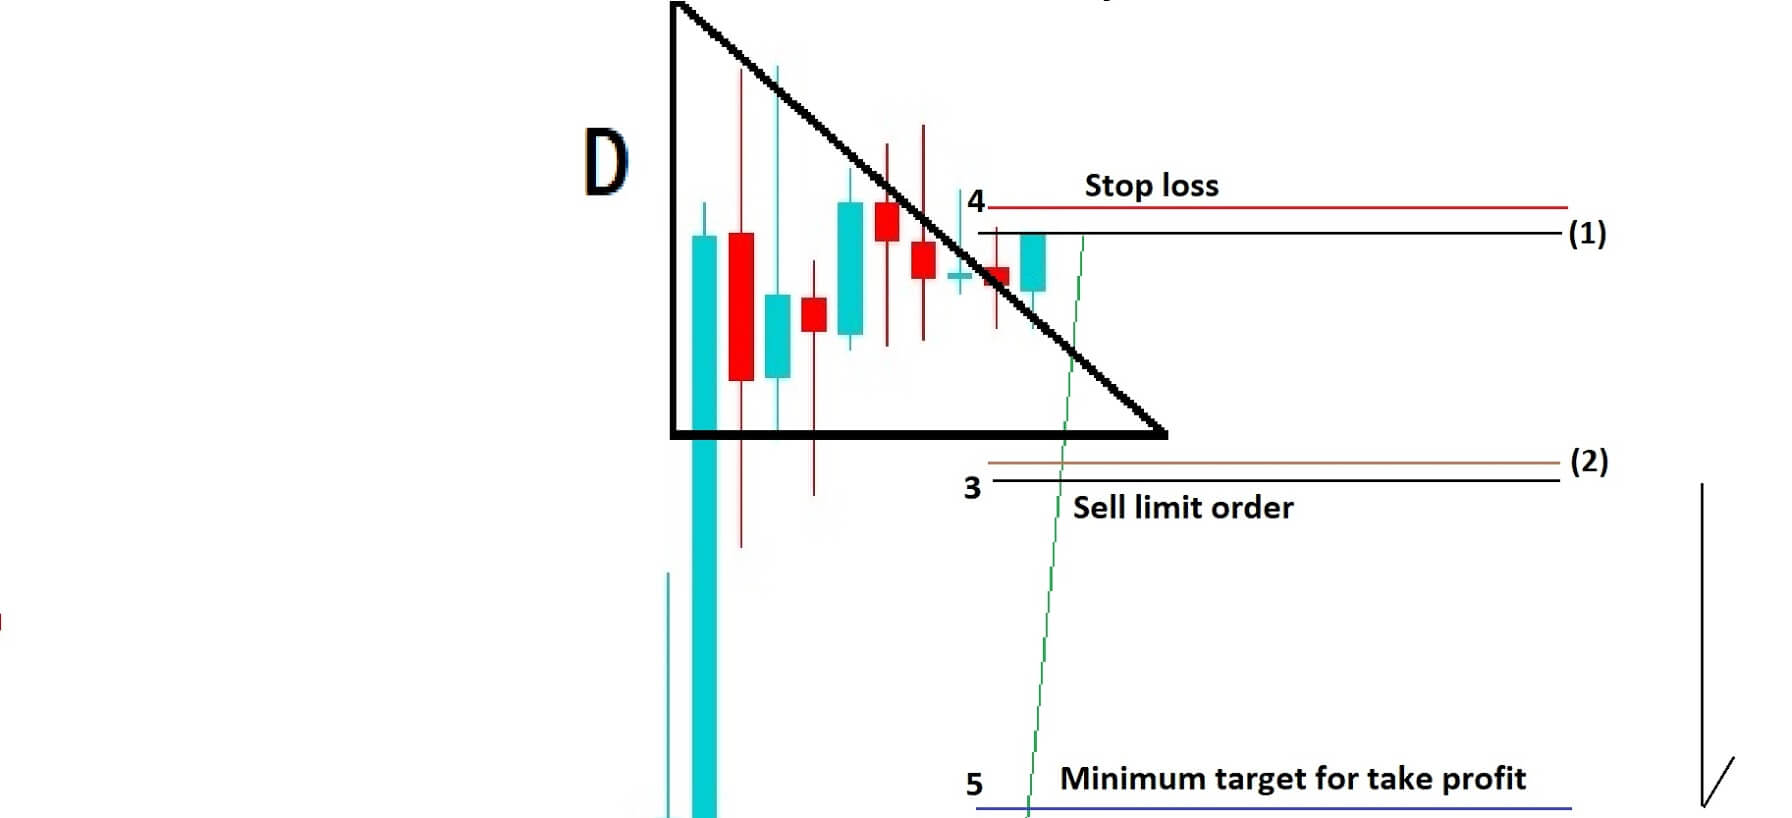


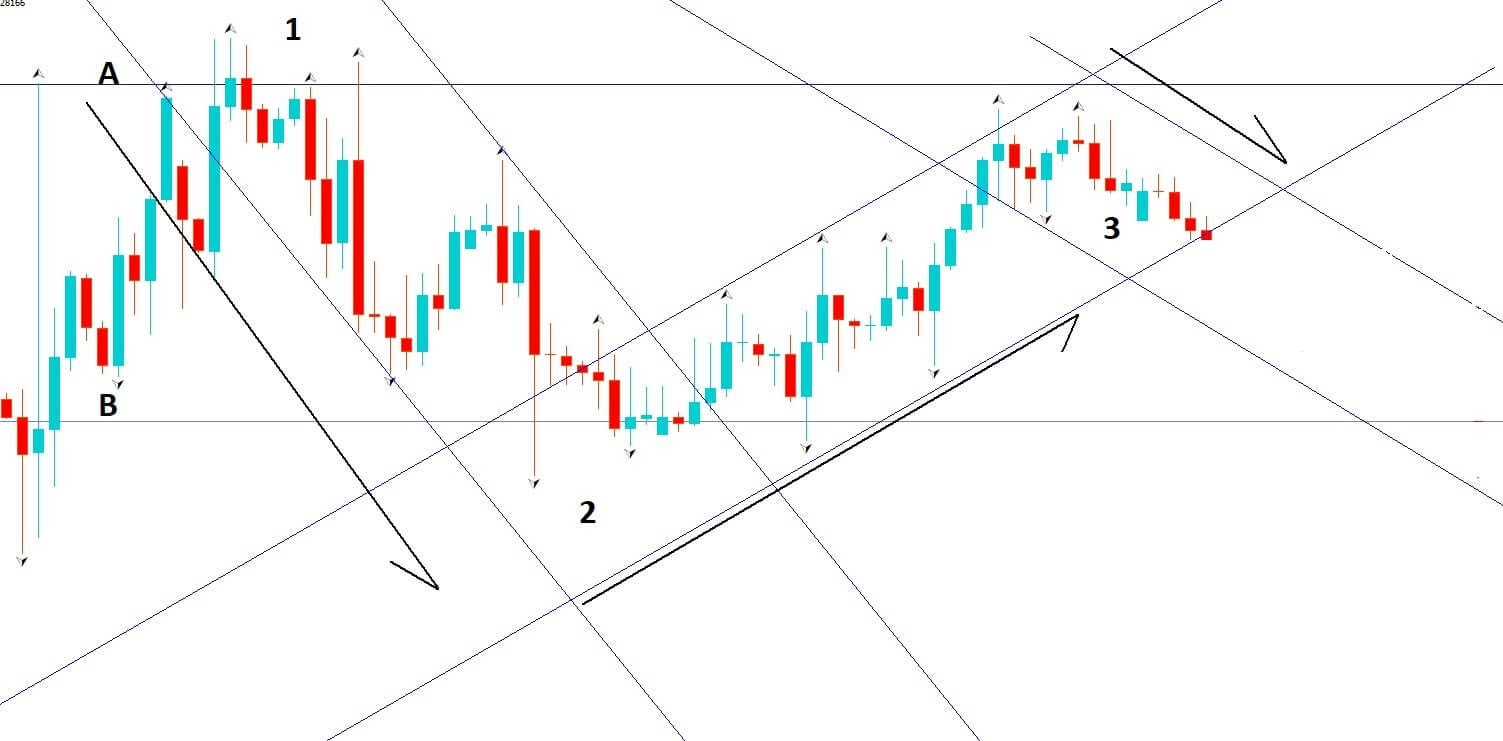
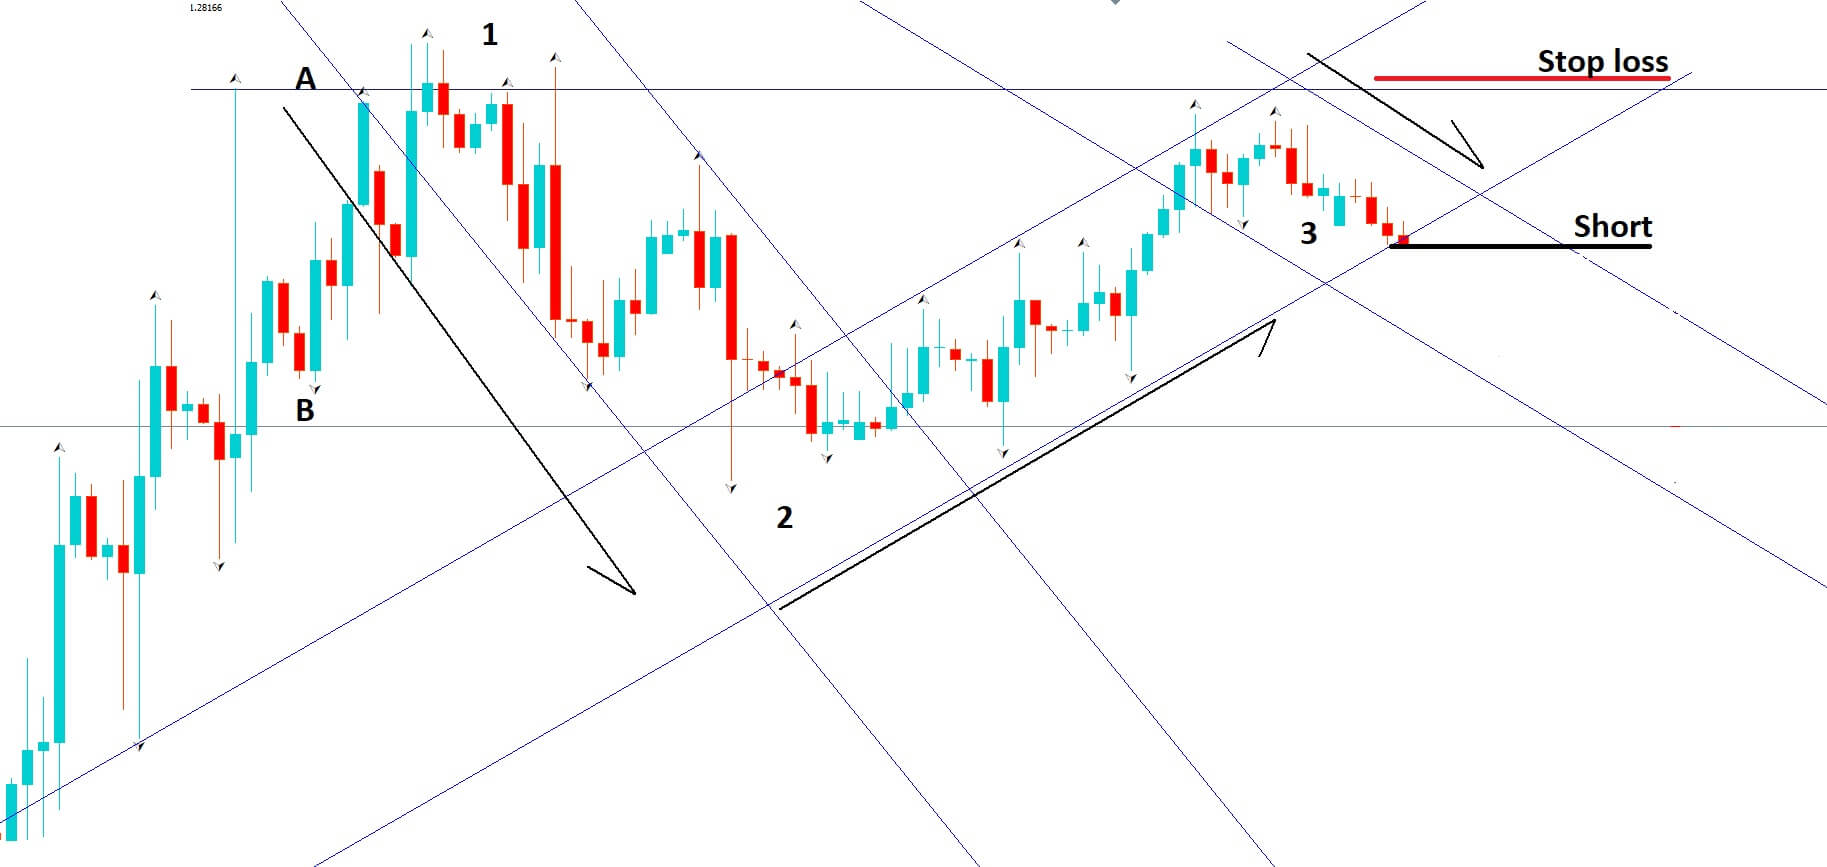
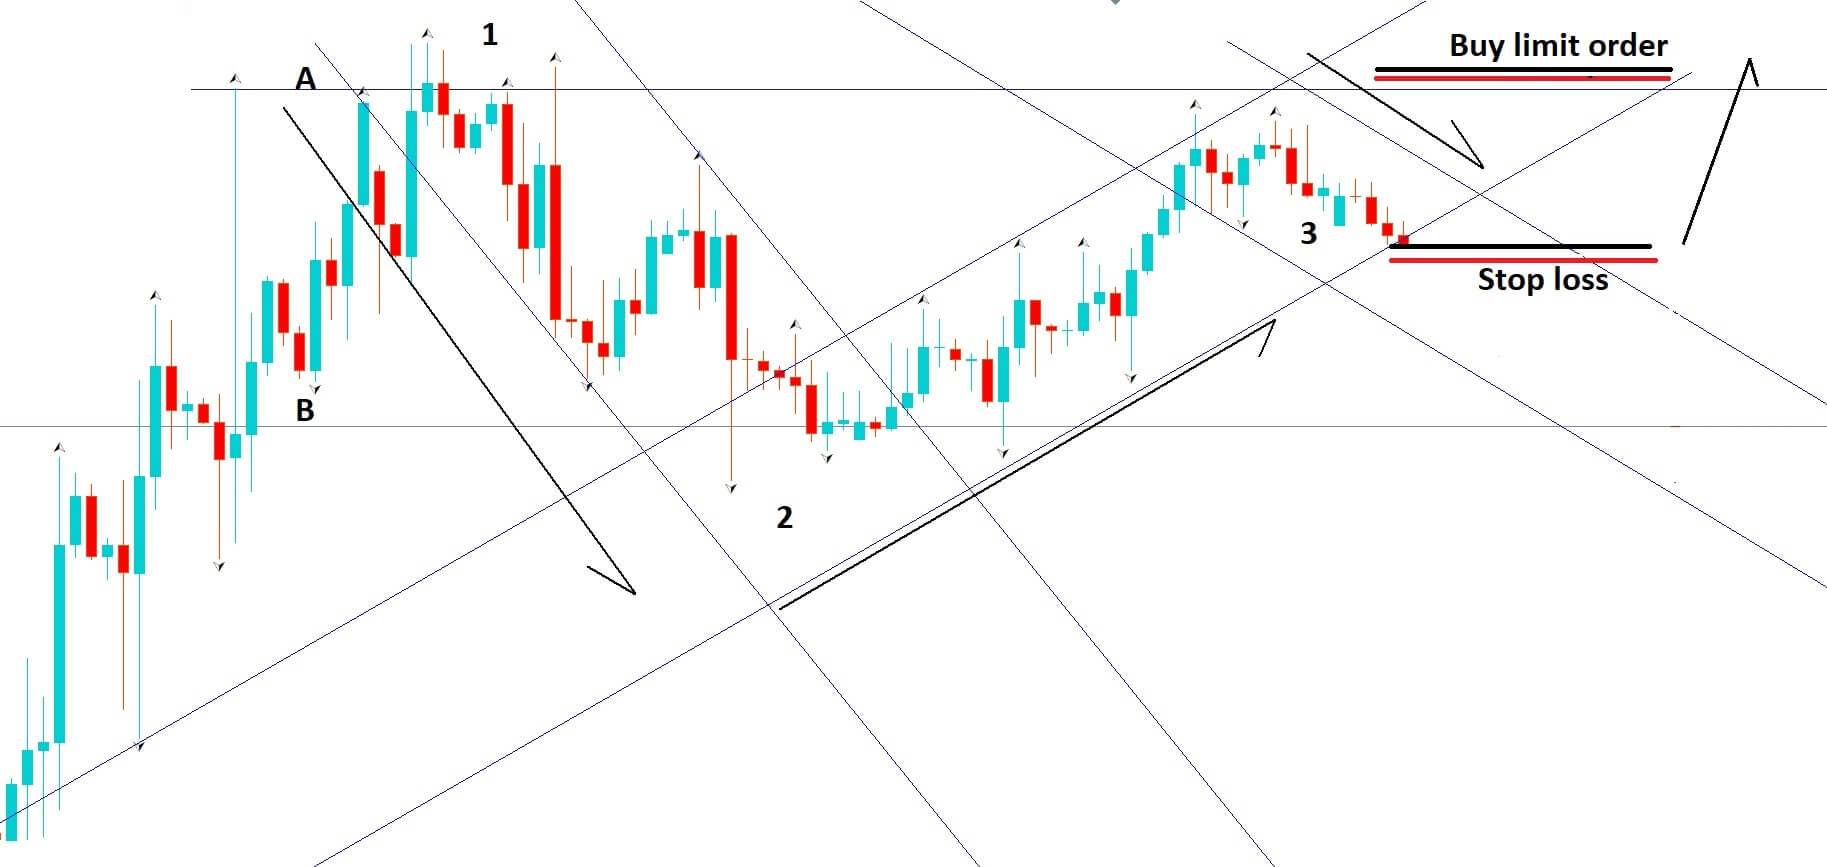


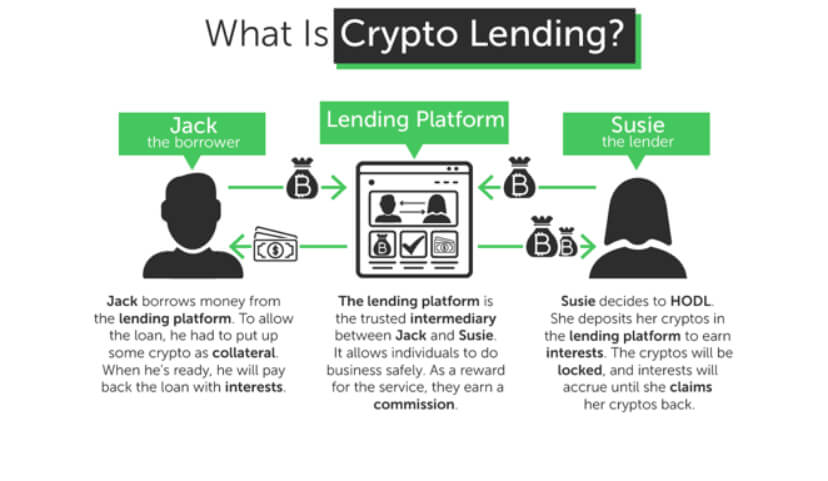
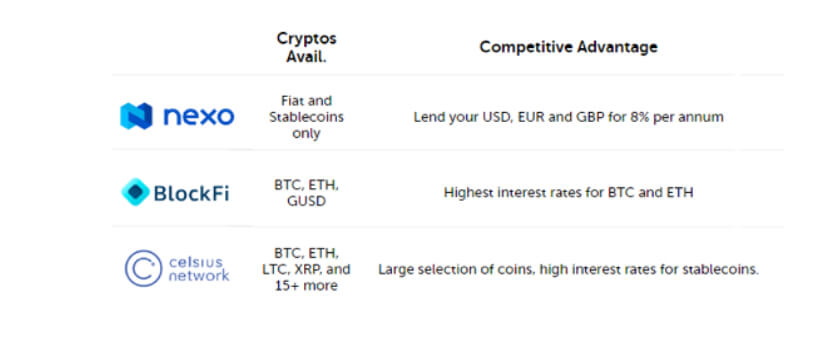

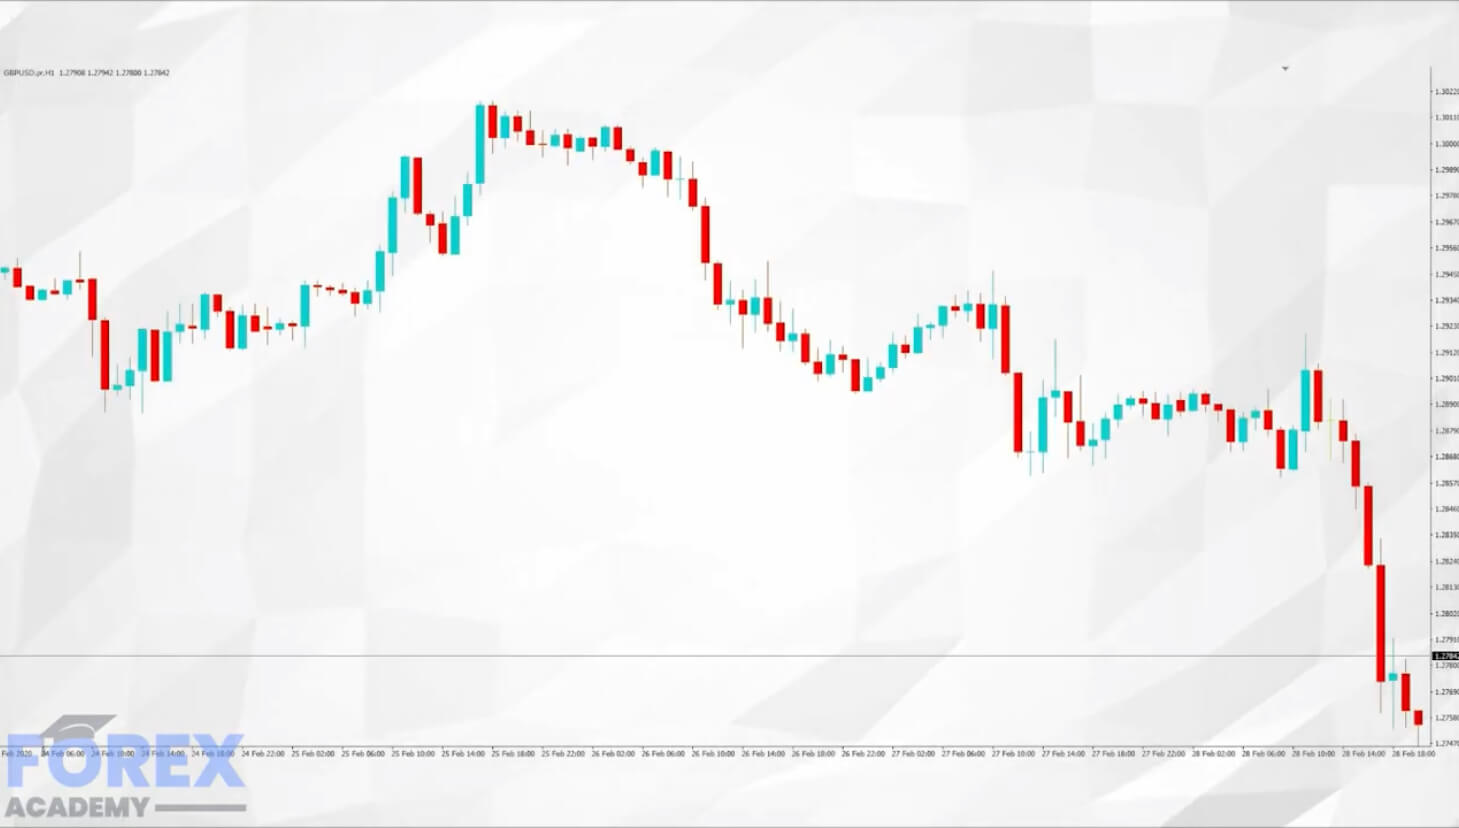
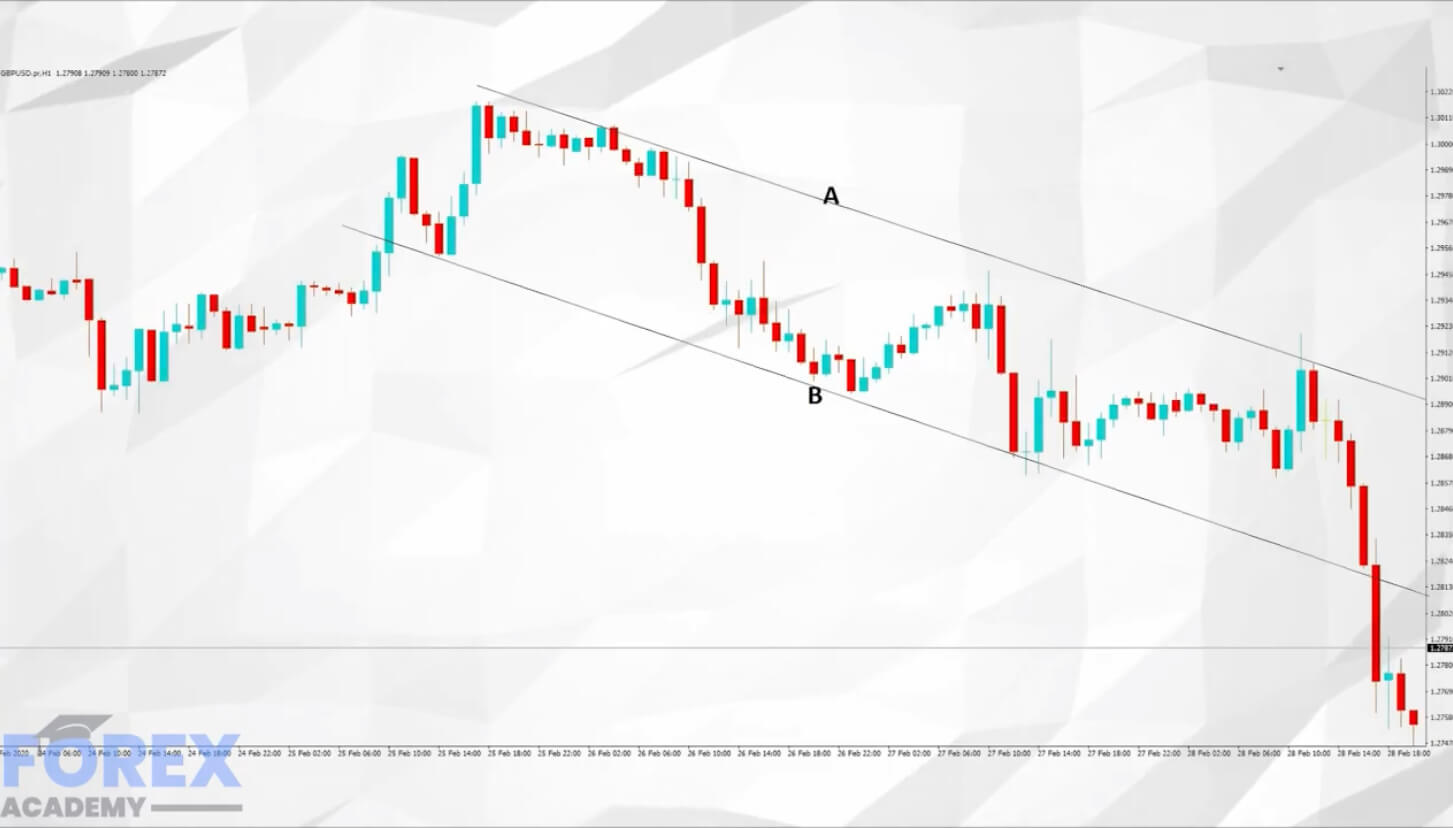
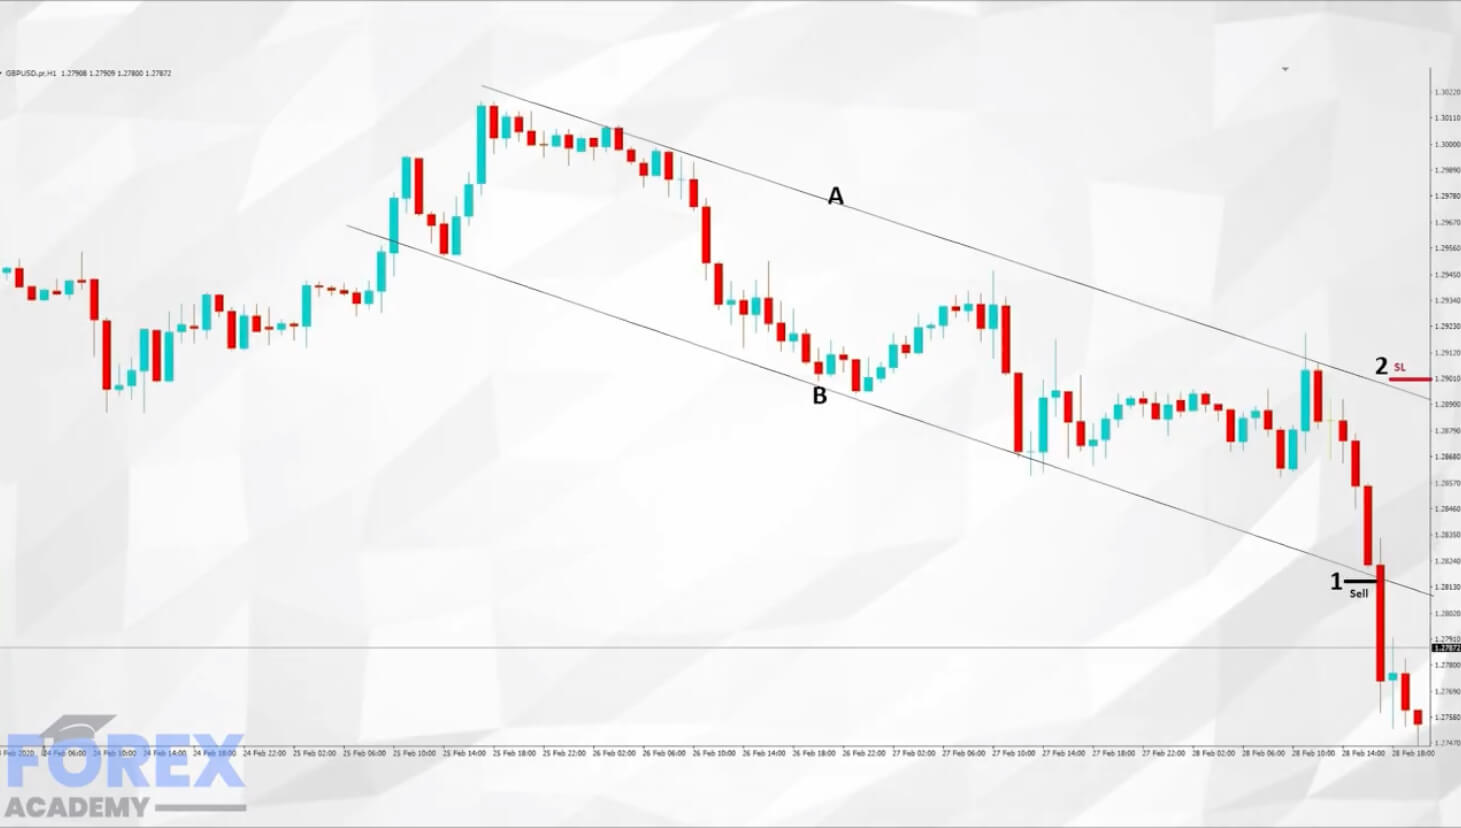
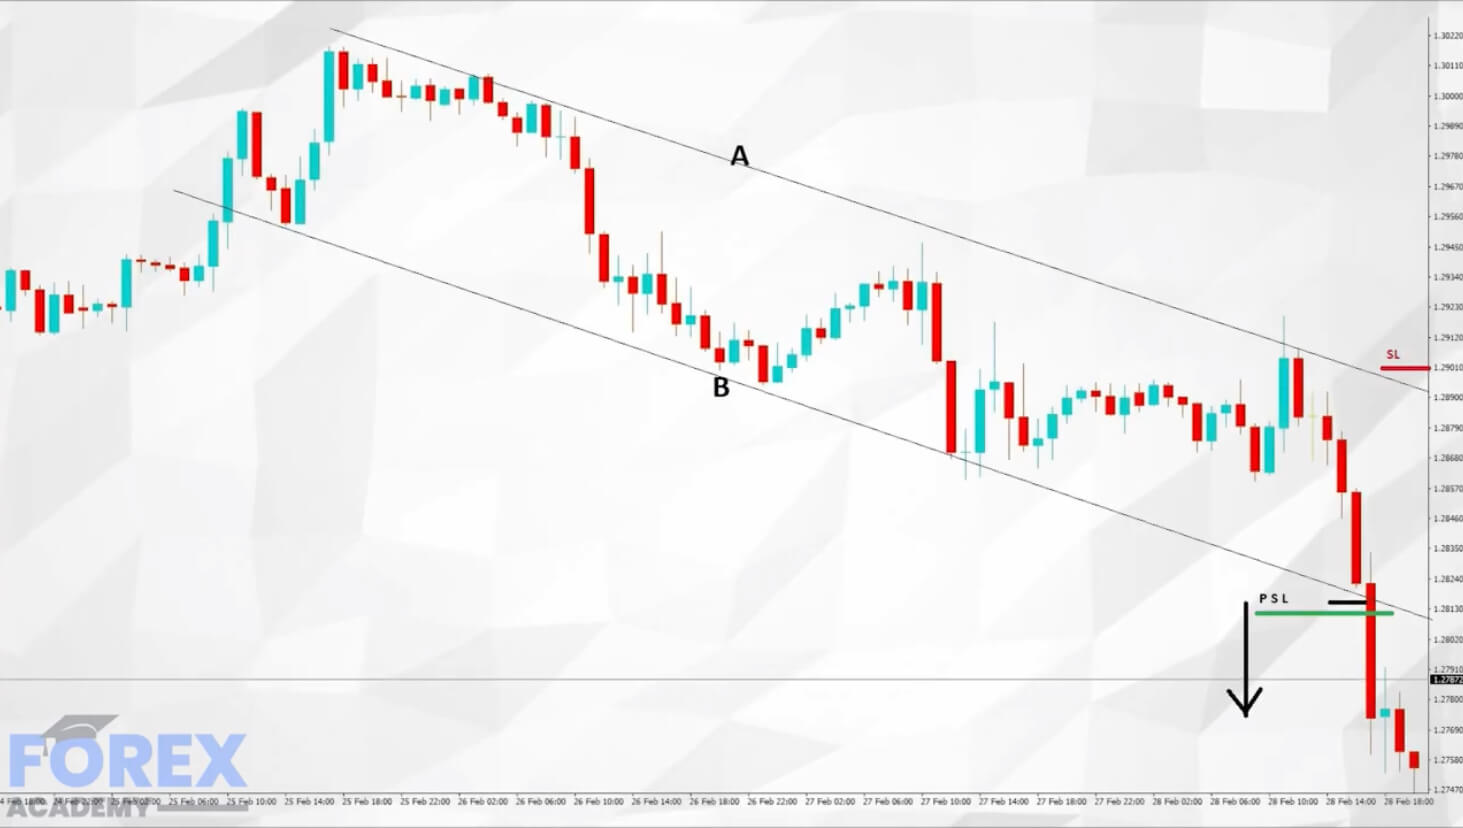
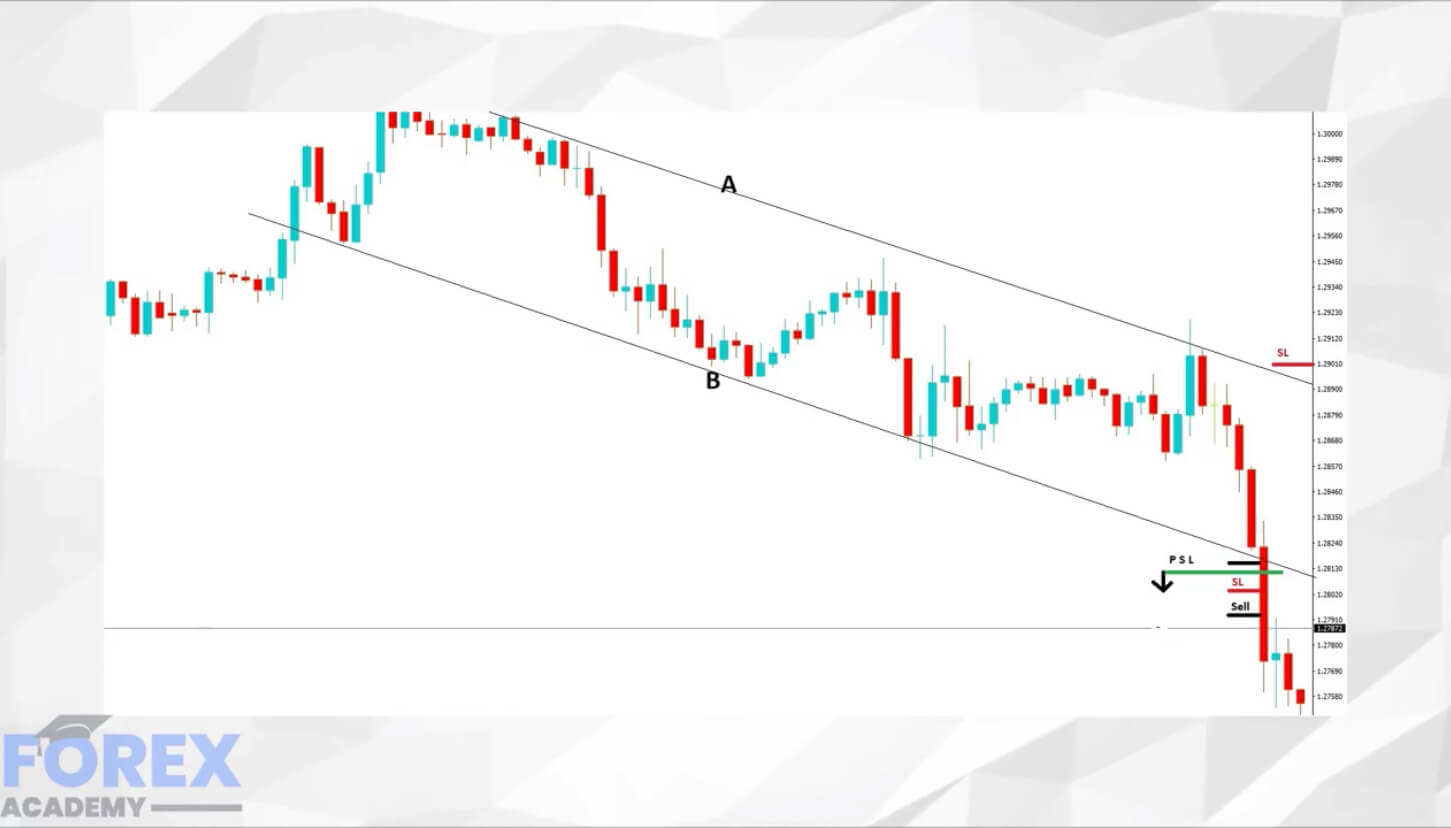

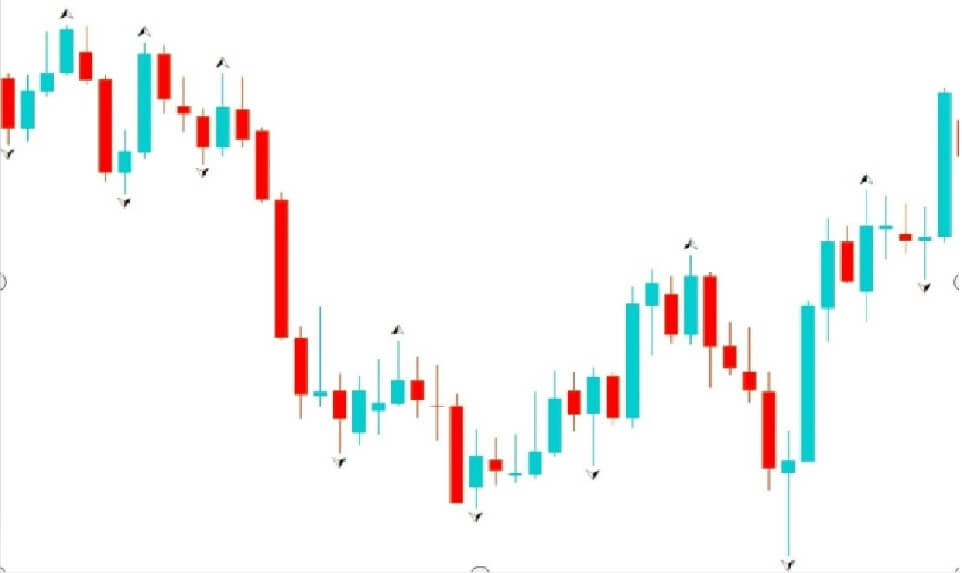
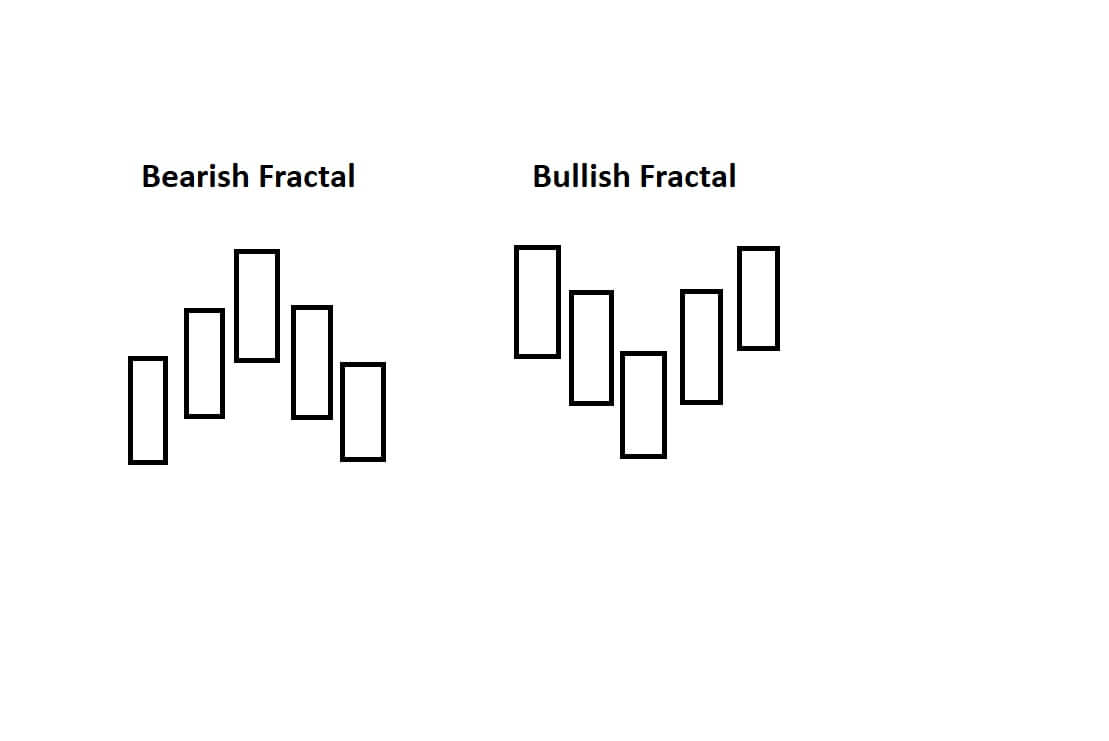
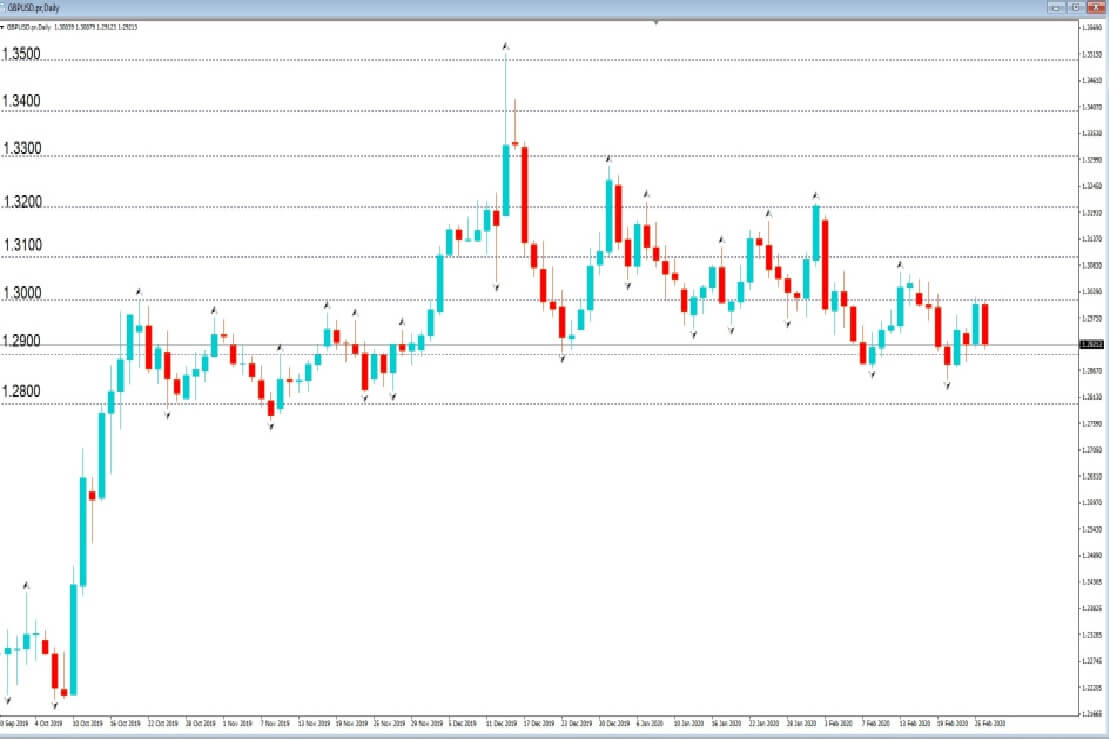
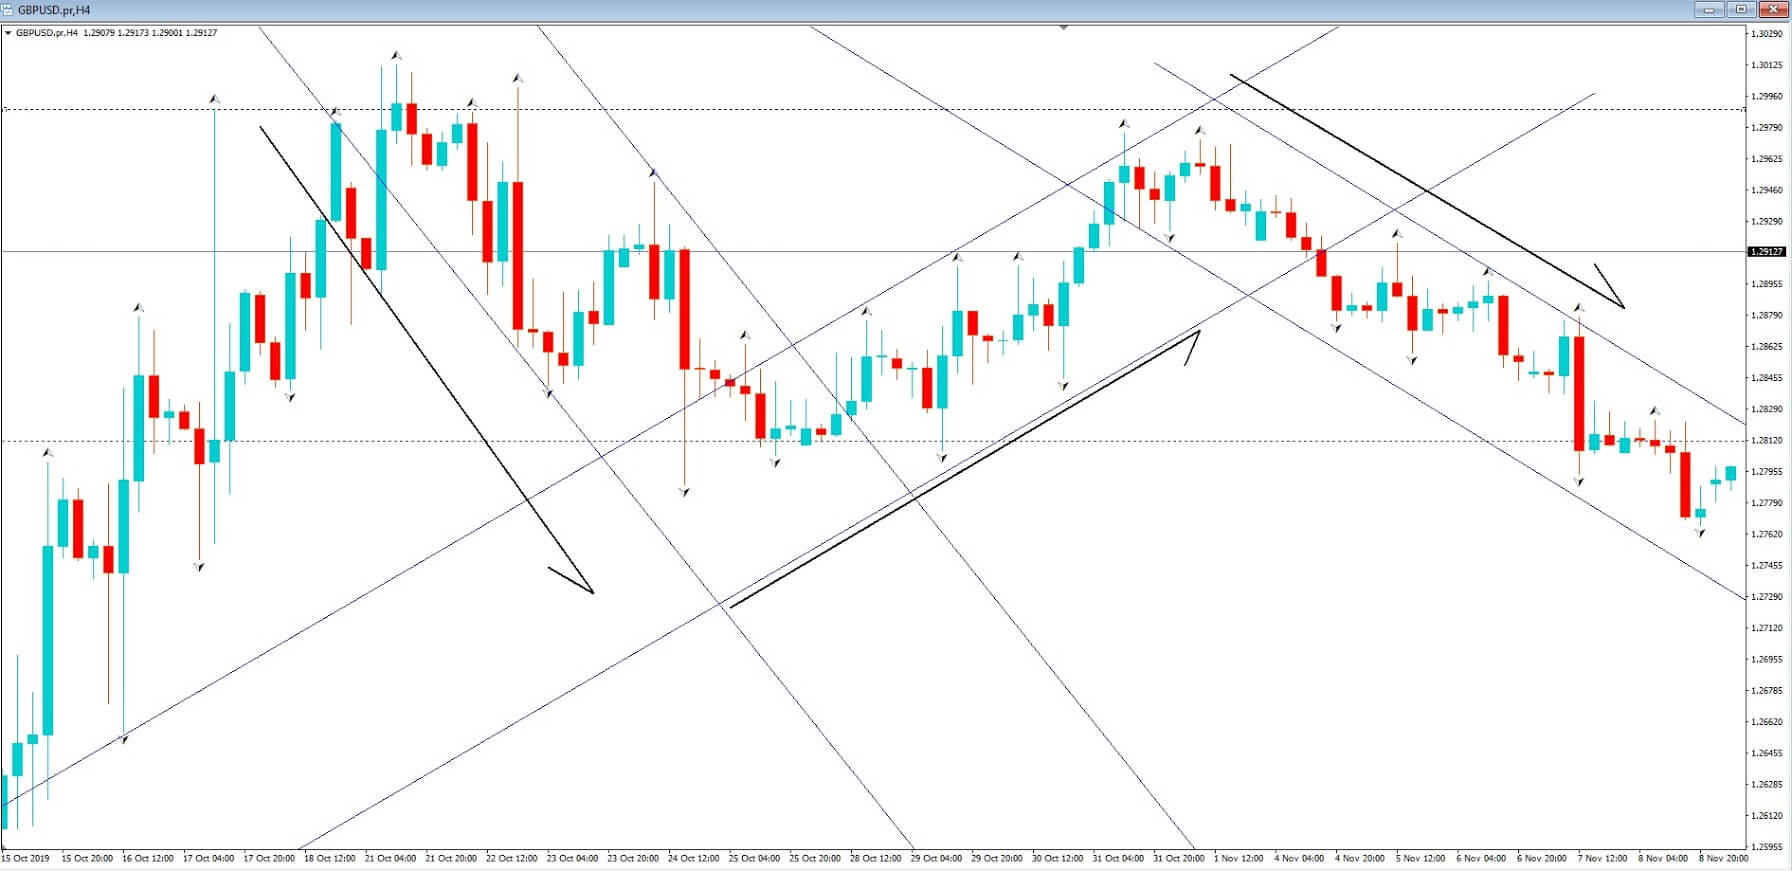
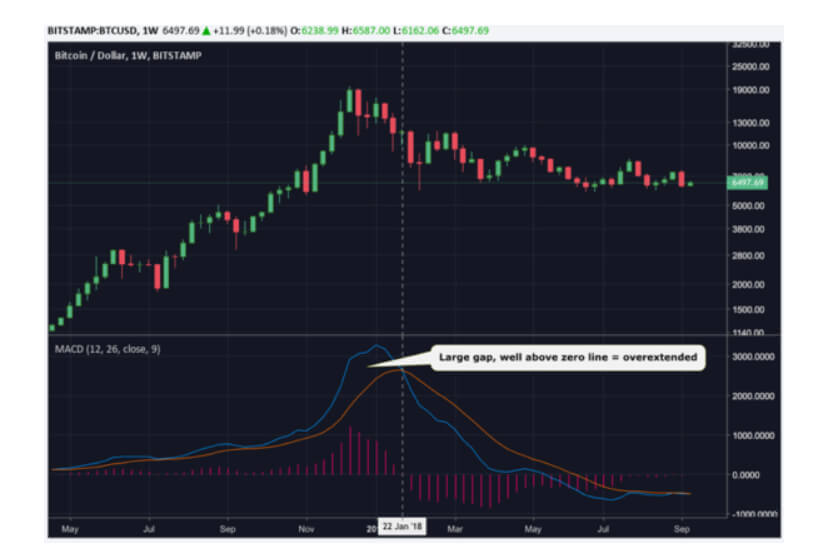


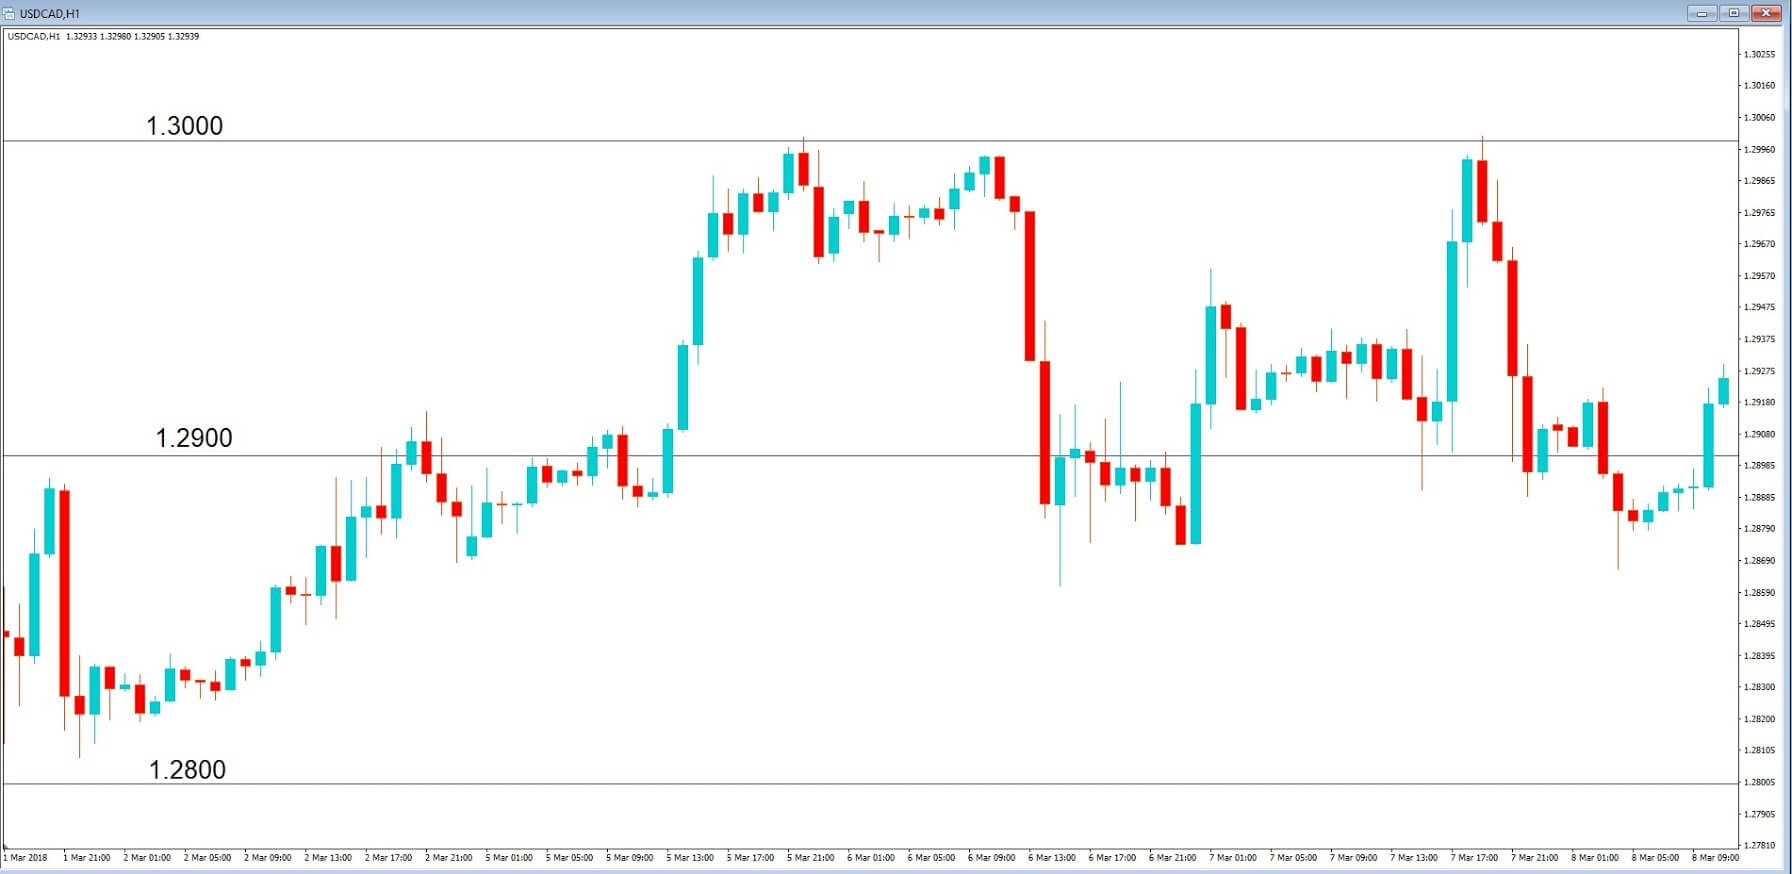
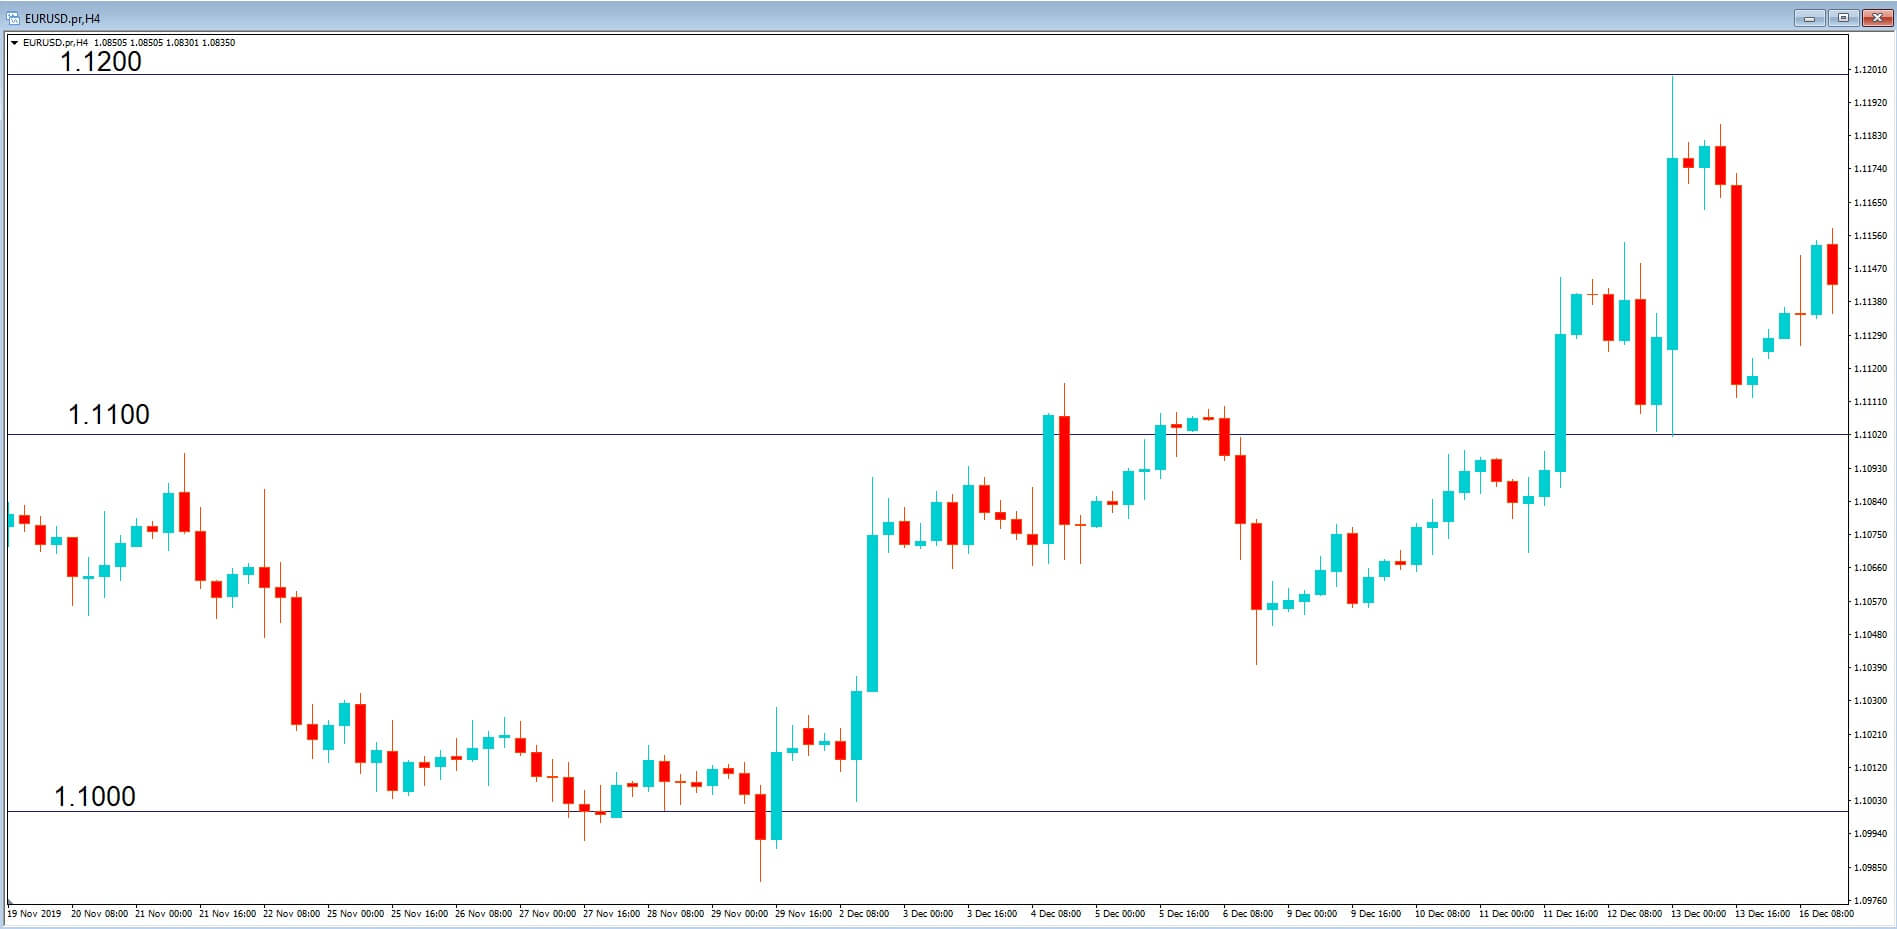
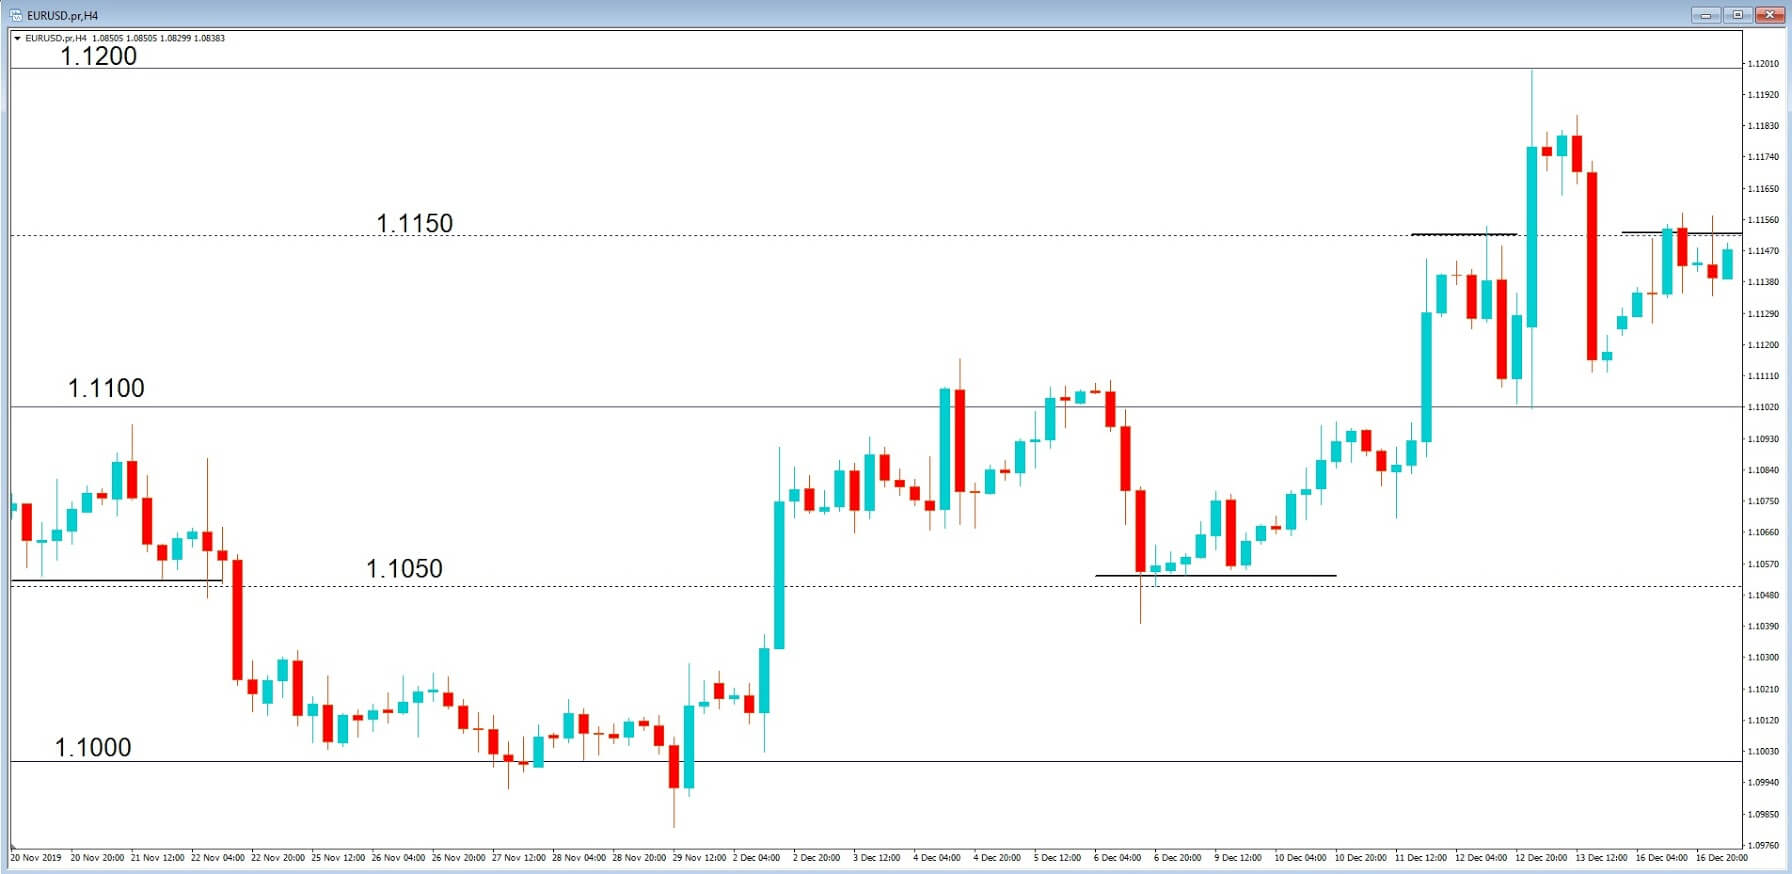
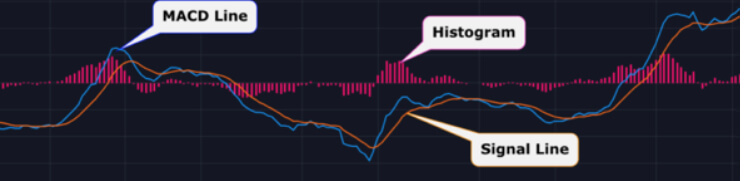
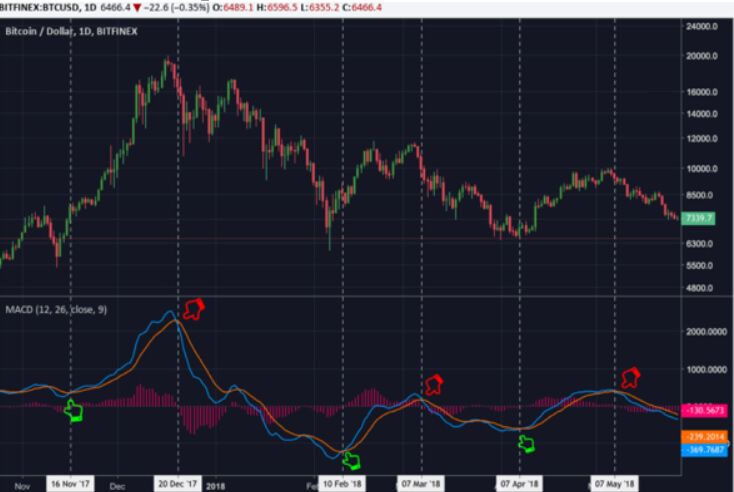

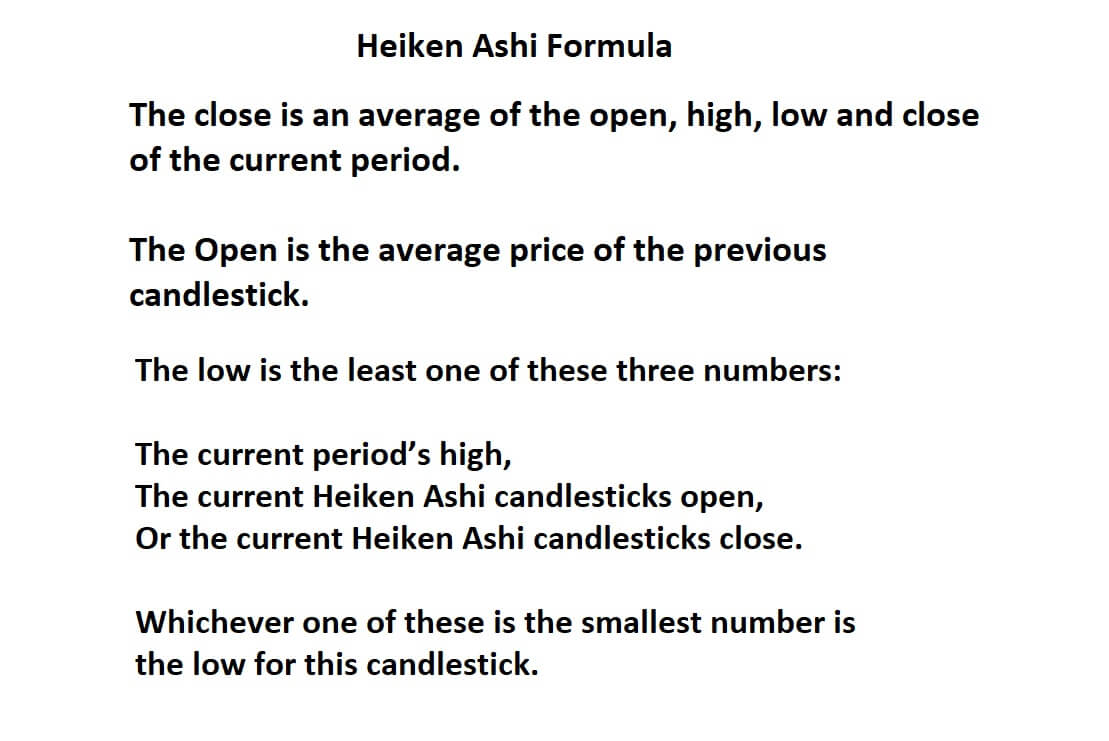 The close is an average of the open, high, low, and close of the current period. The Open is the average price of the previous candlestick.
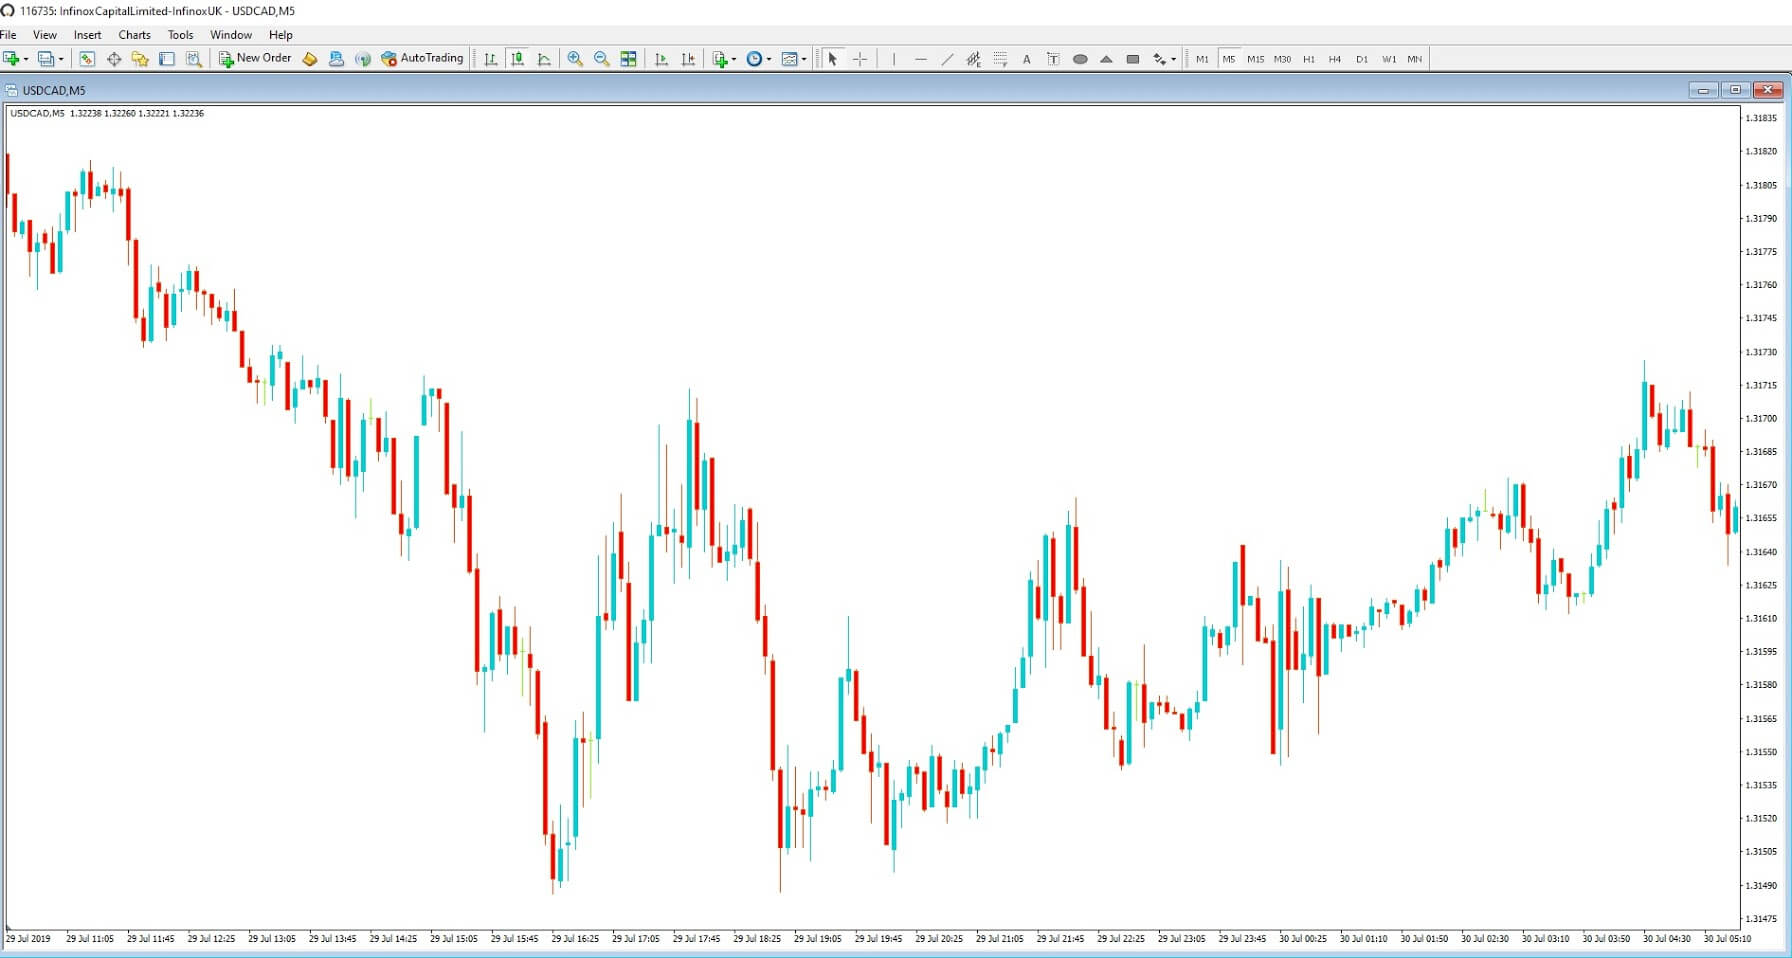
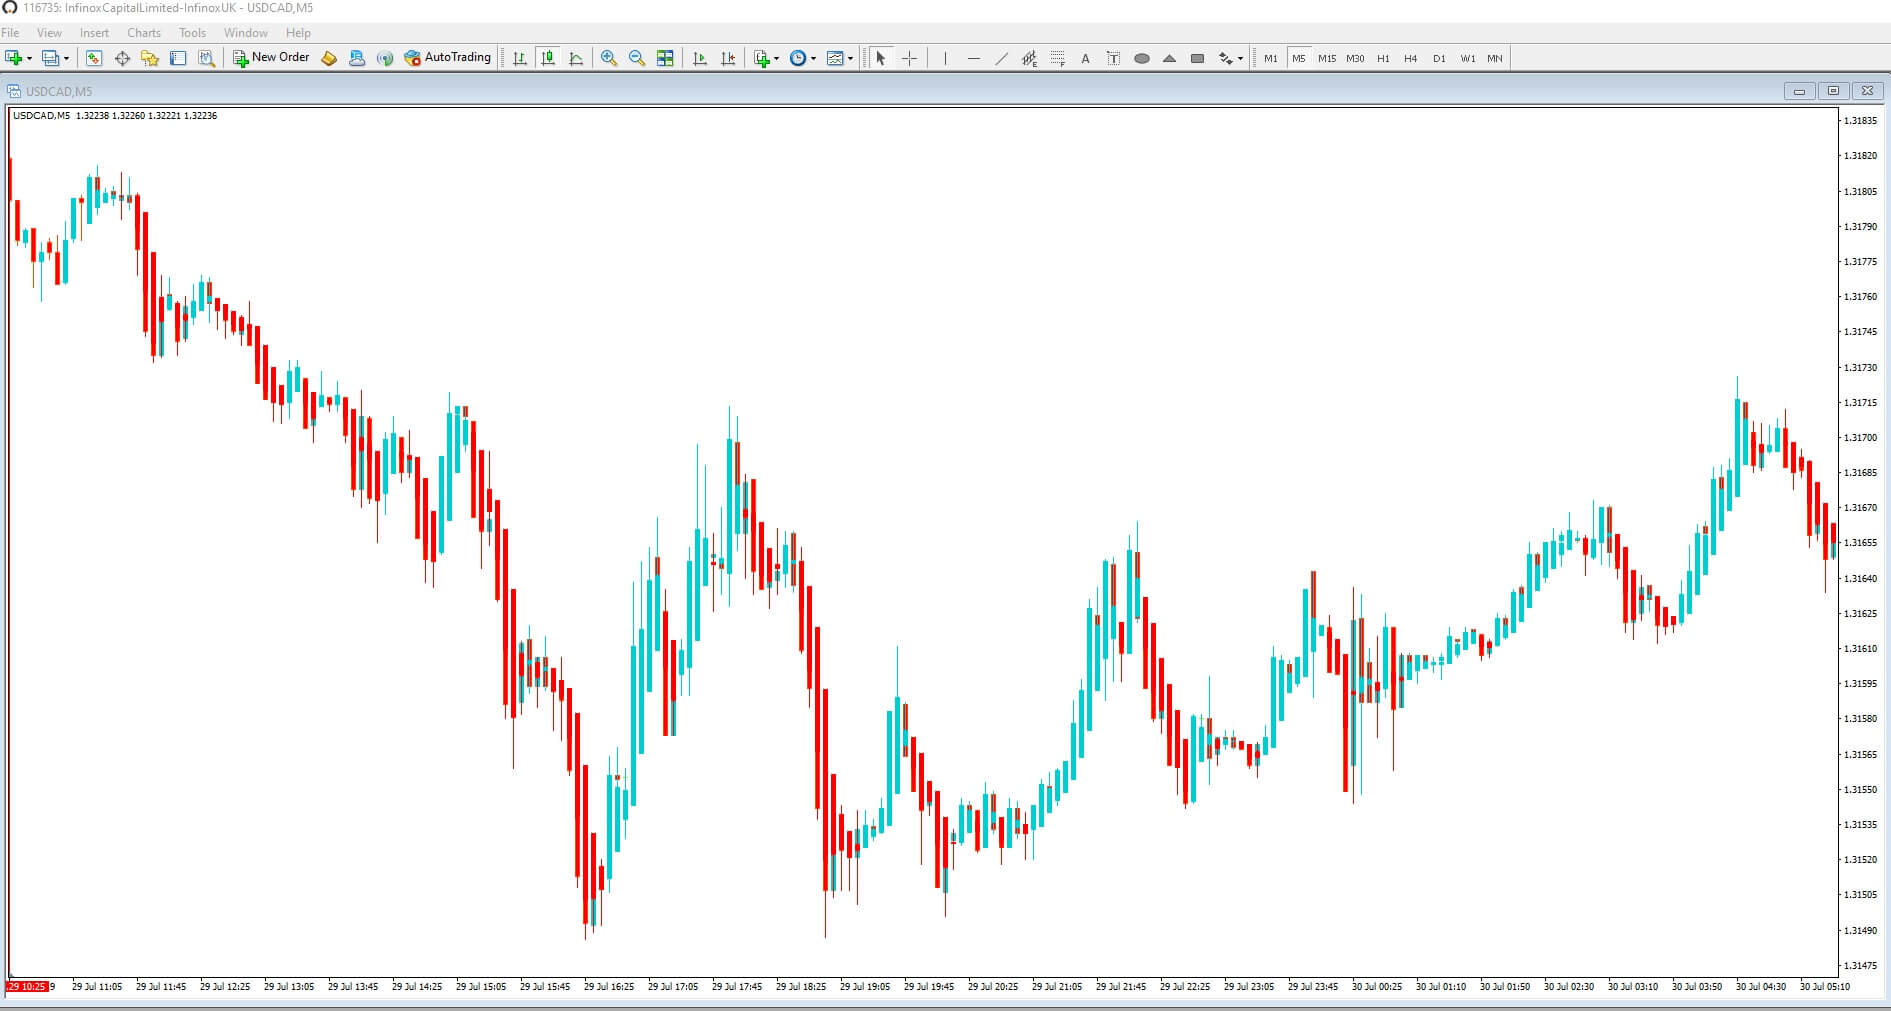
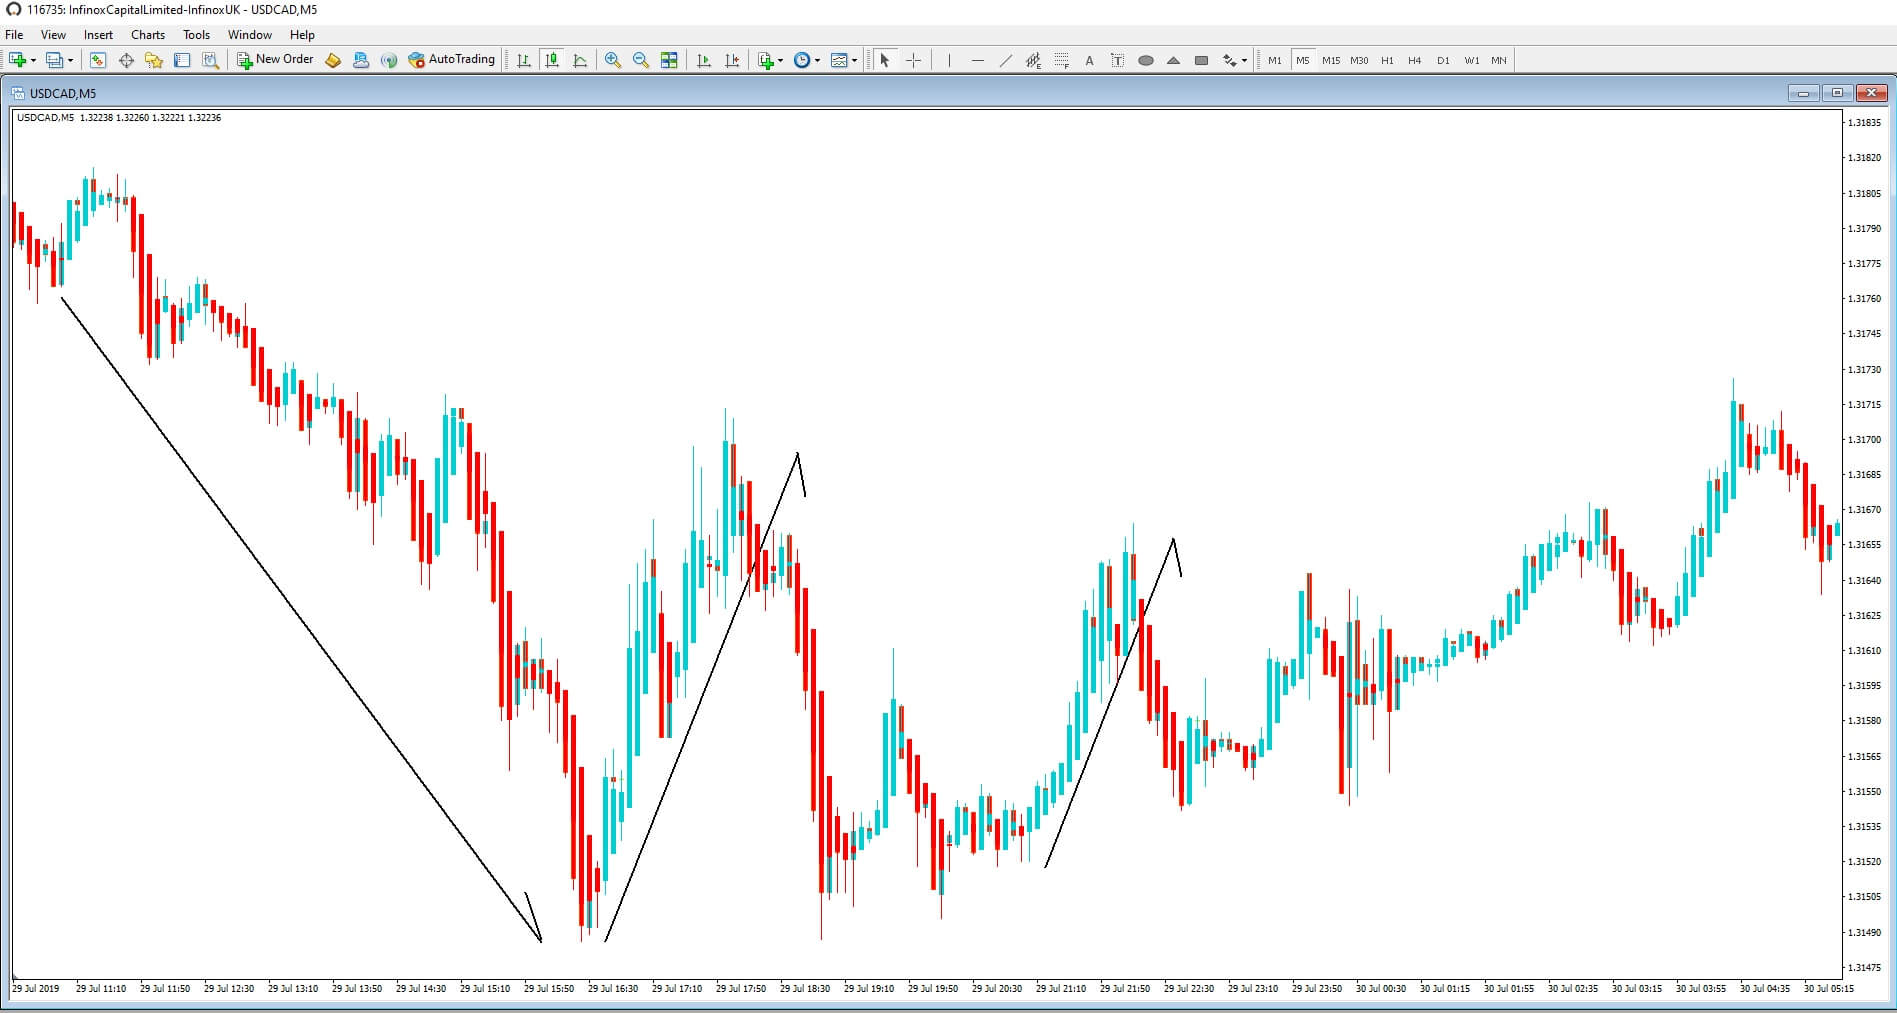
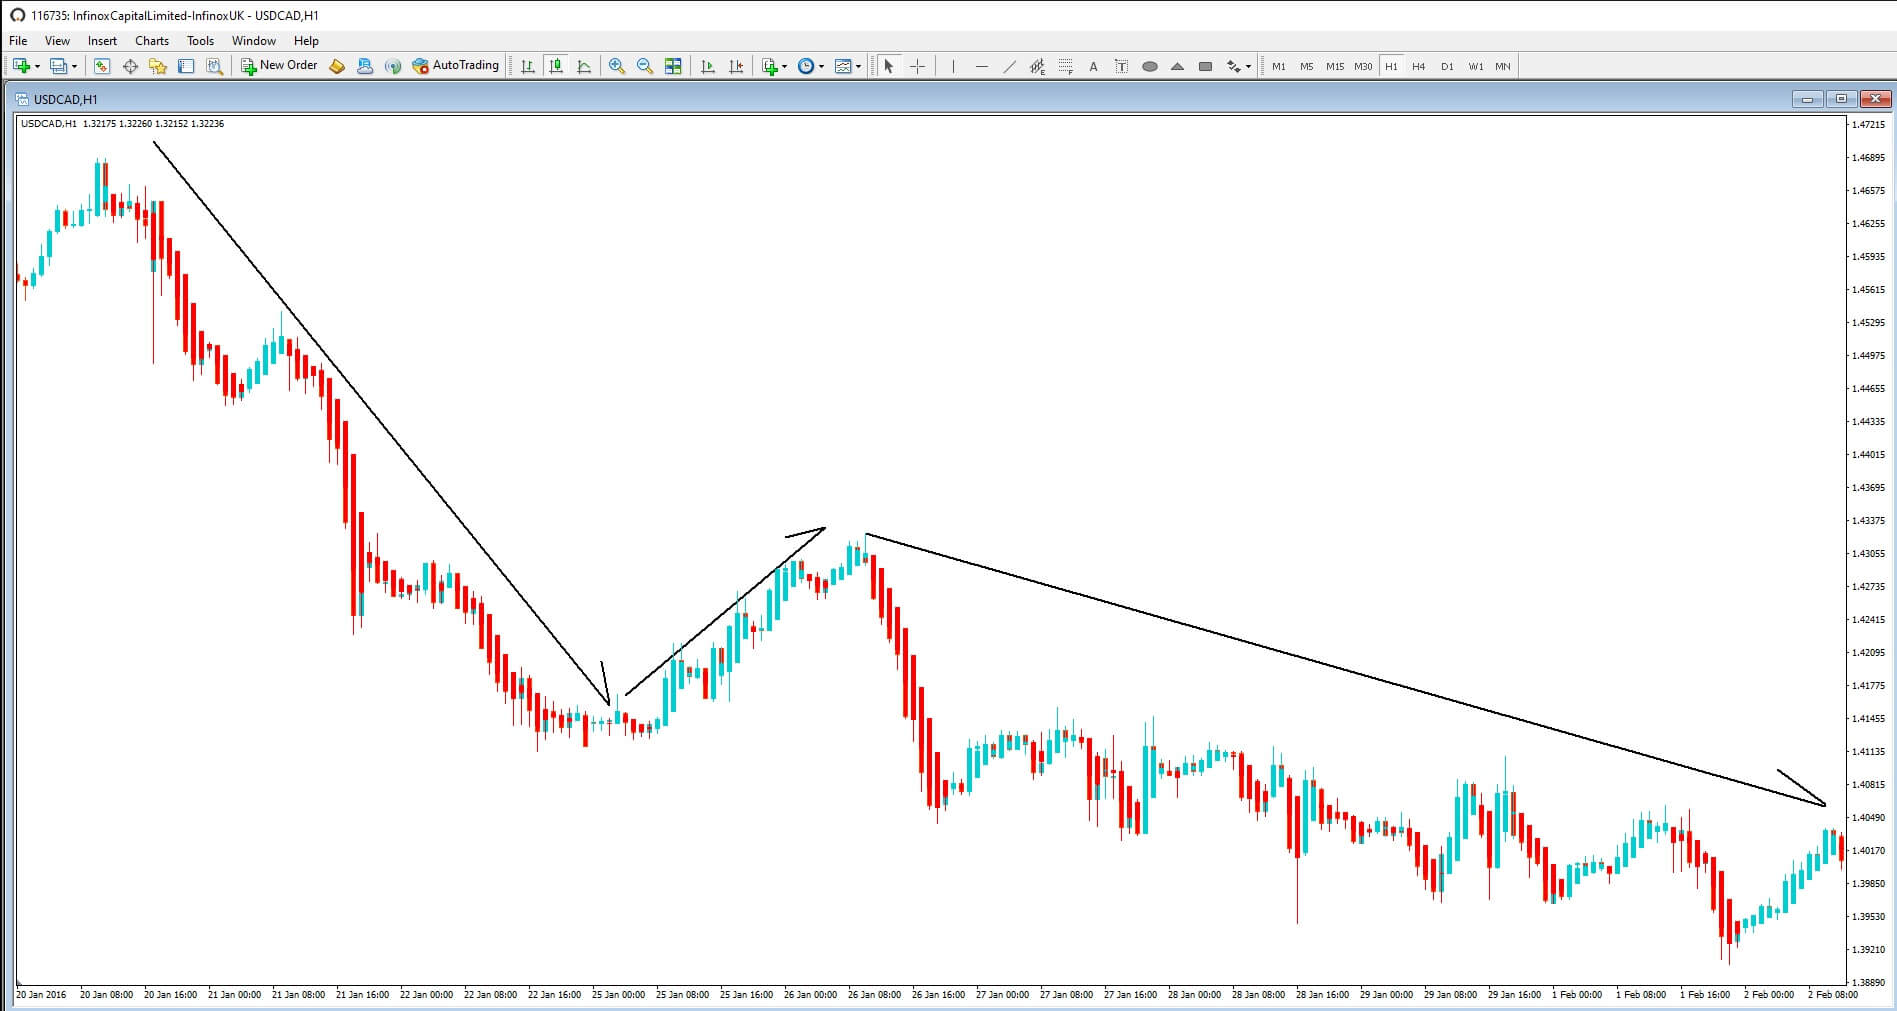
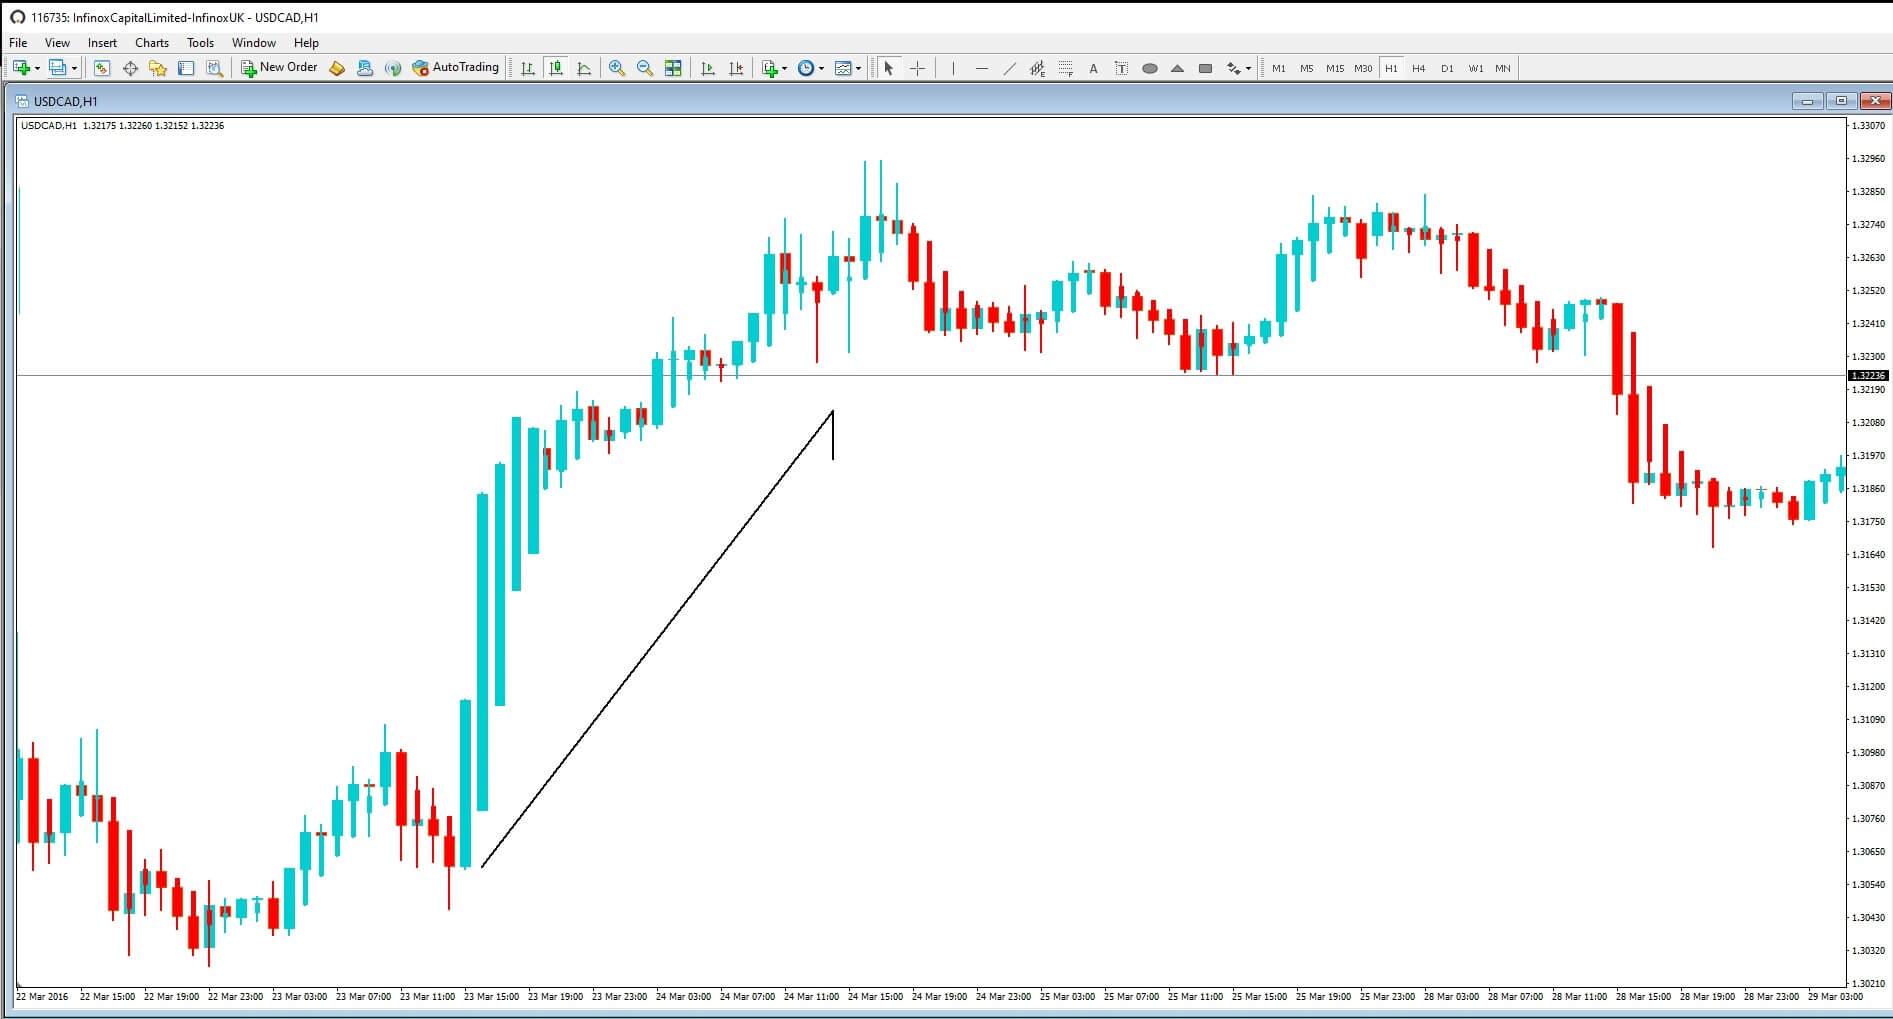
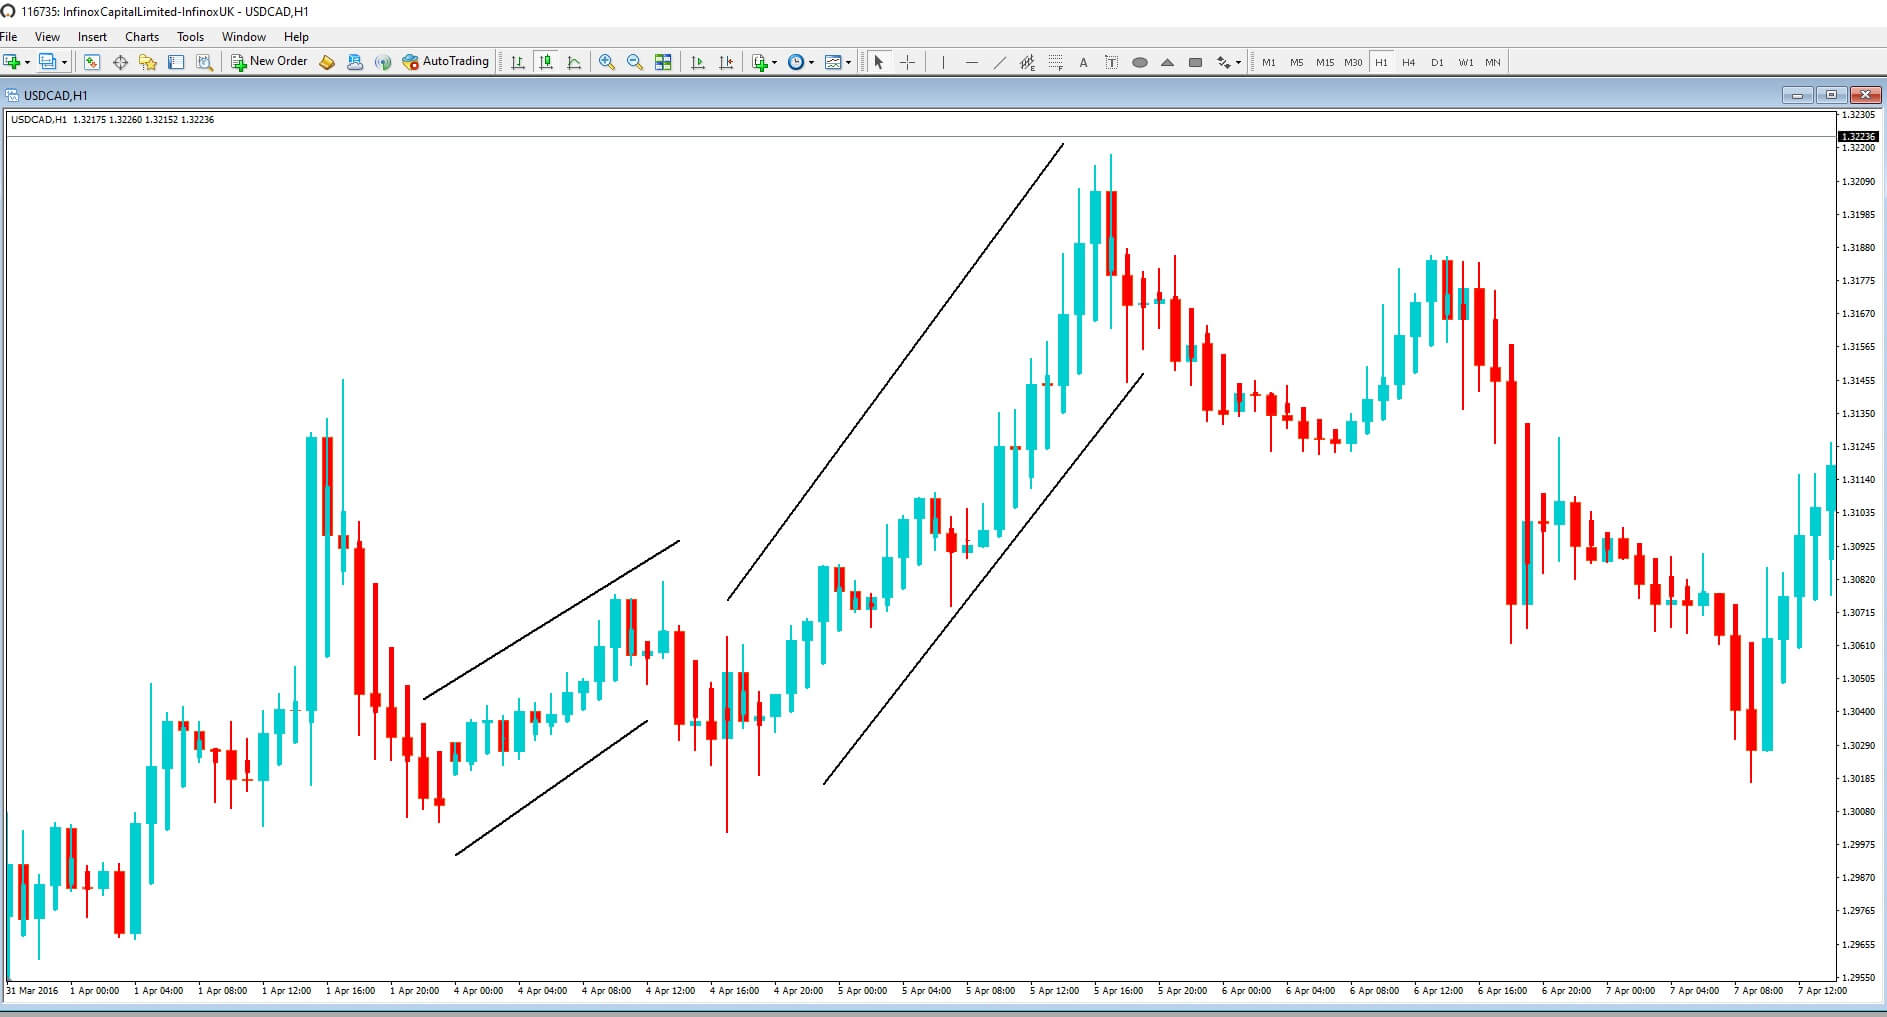
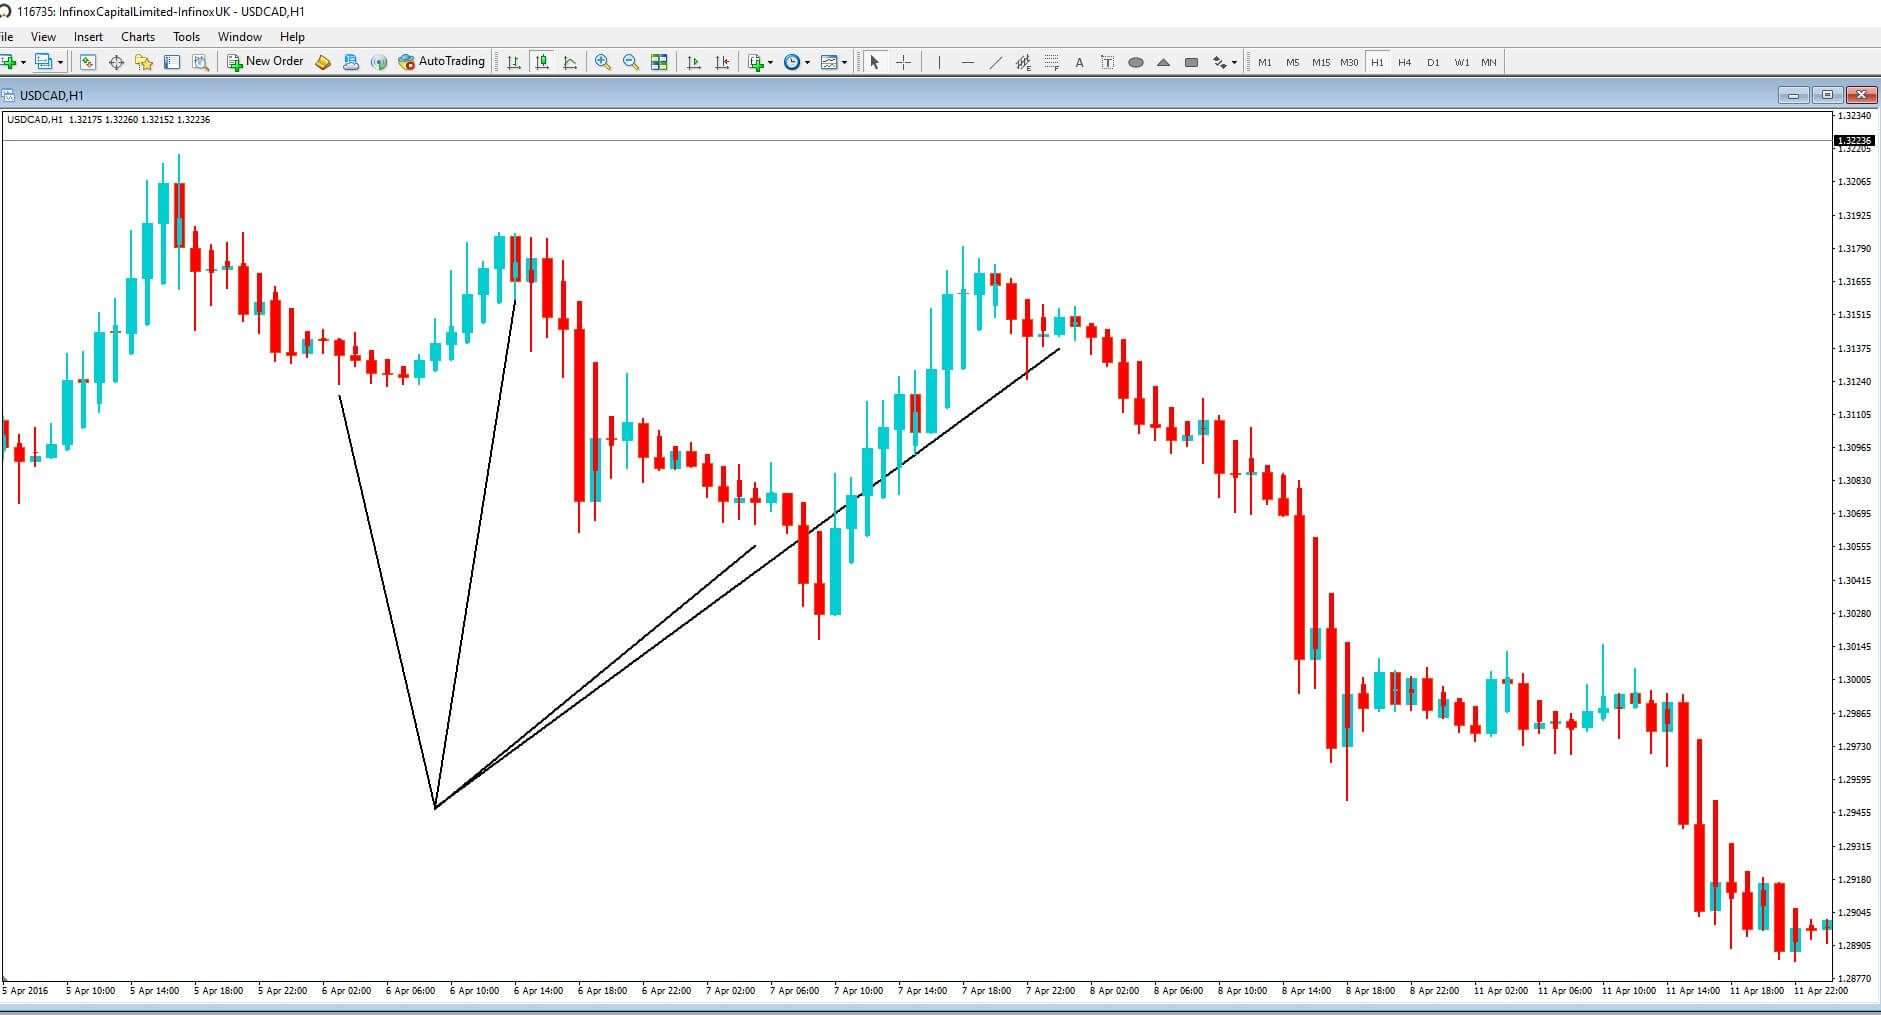
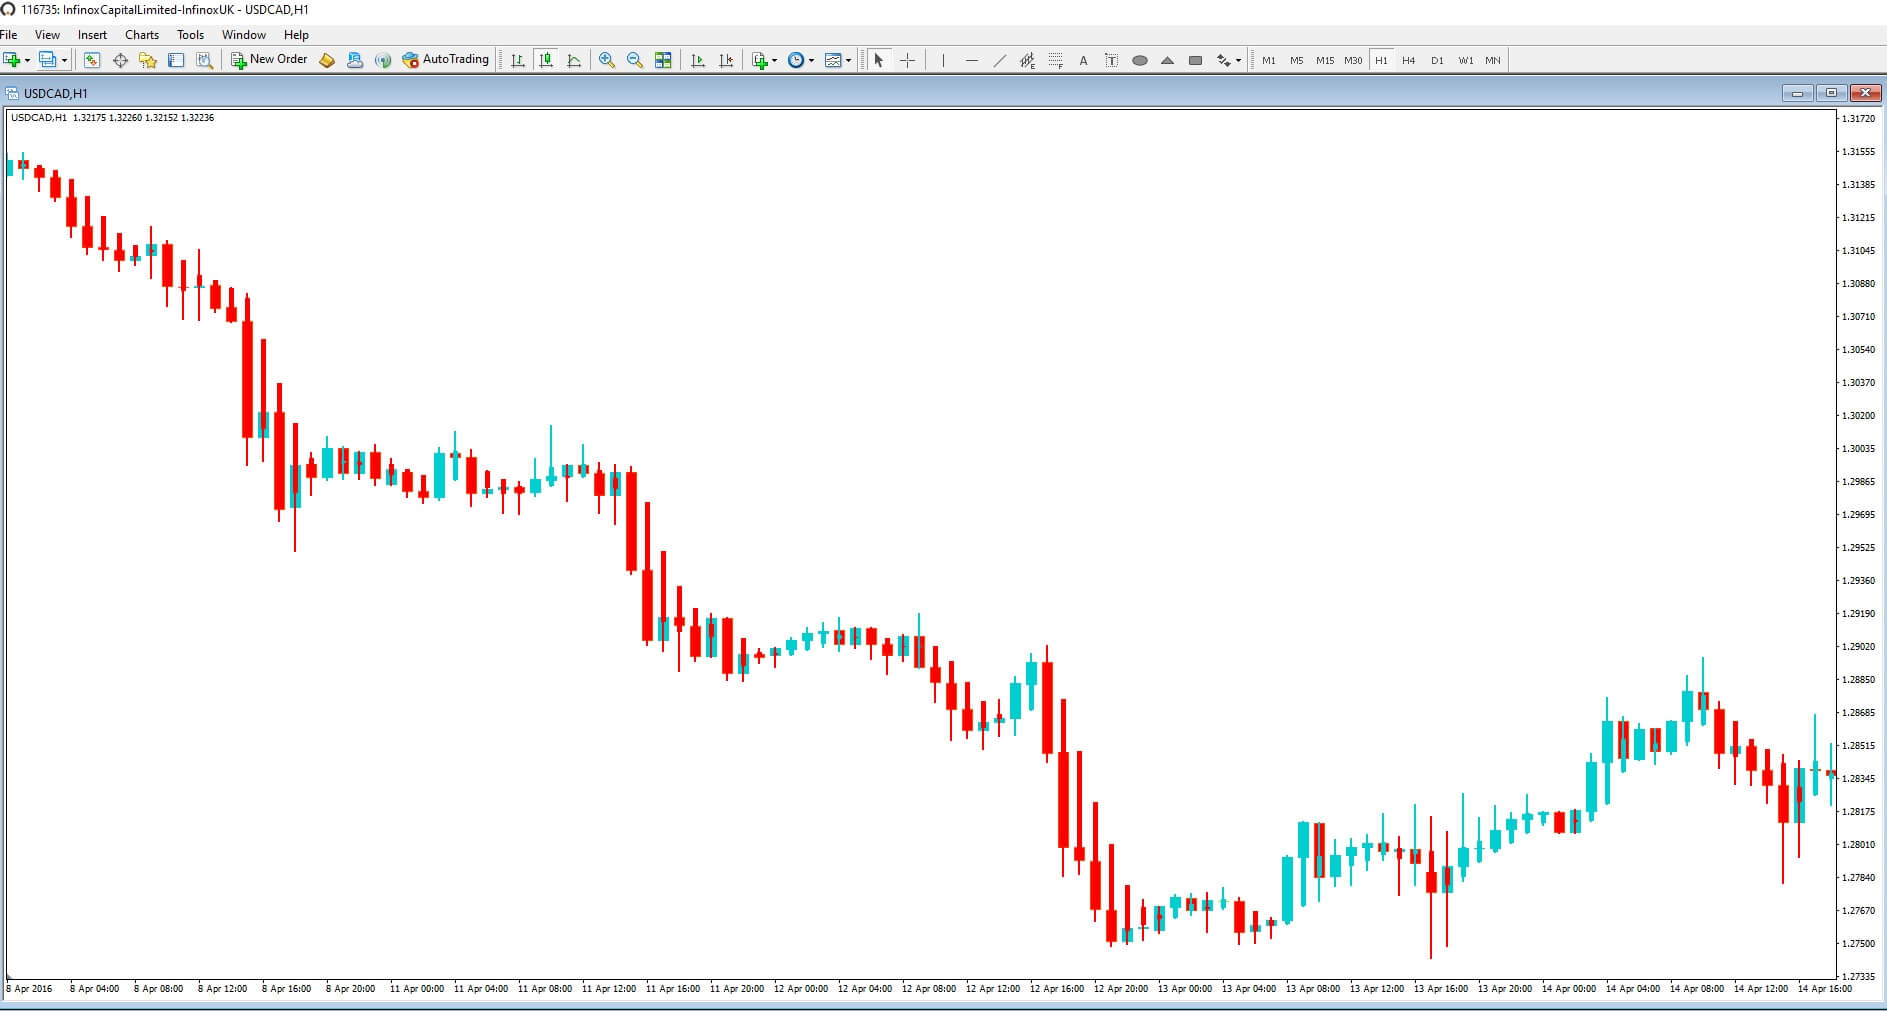
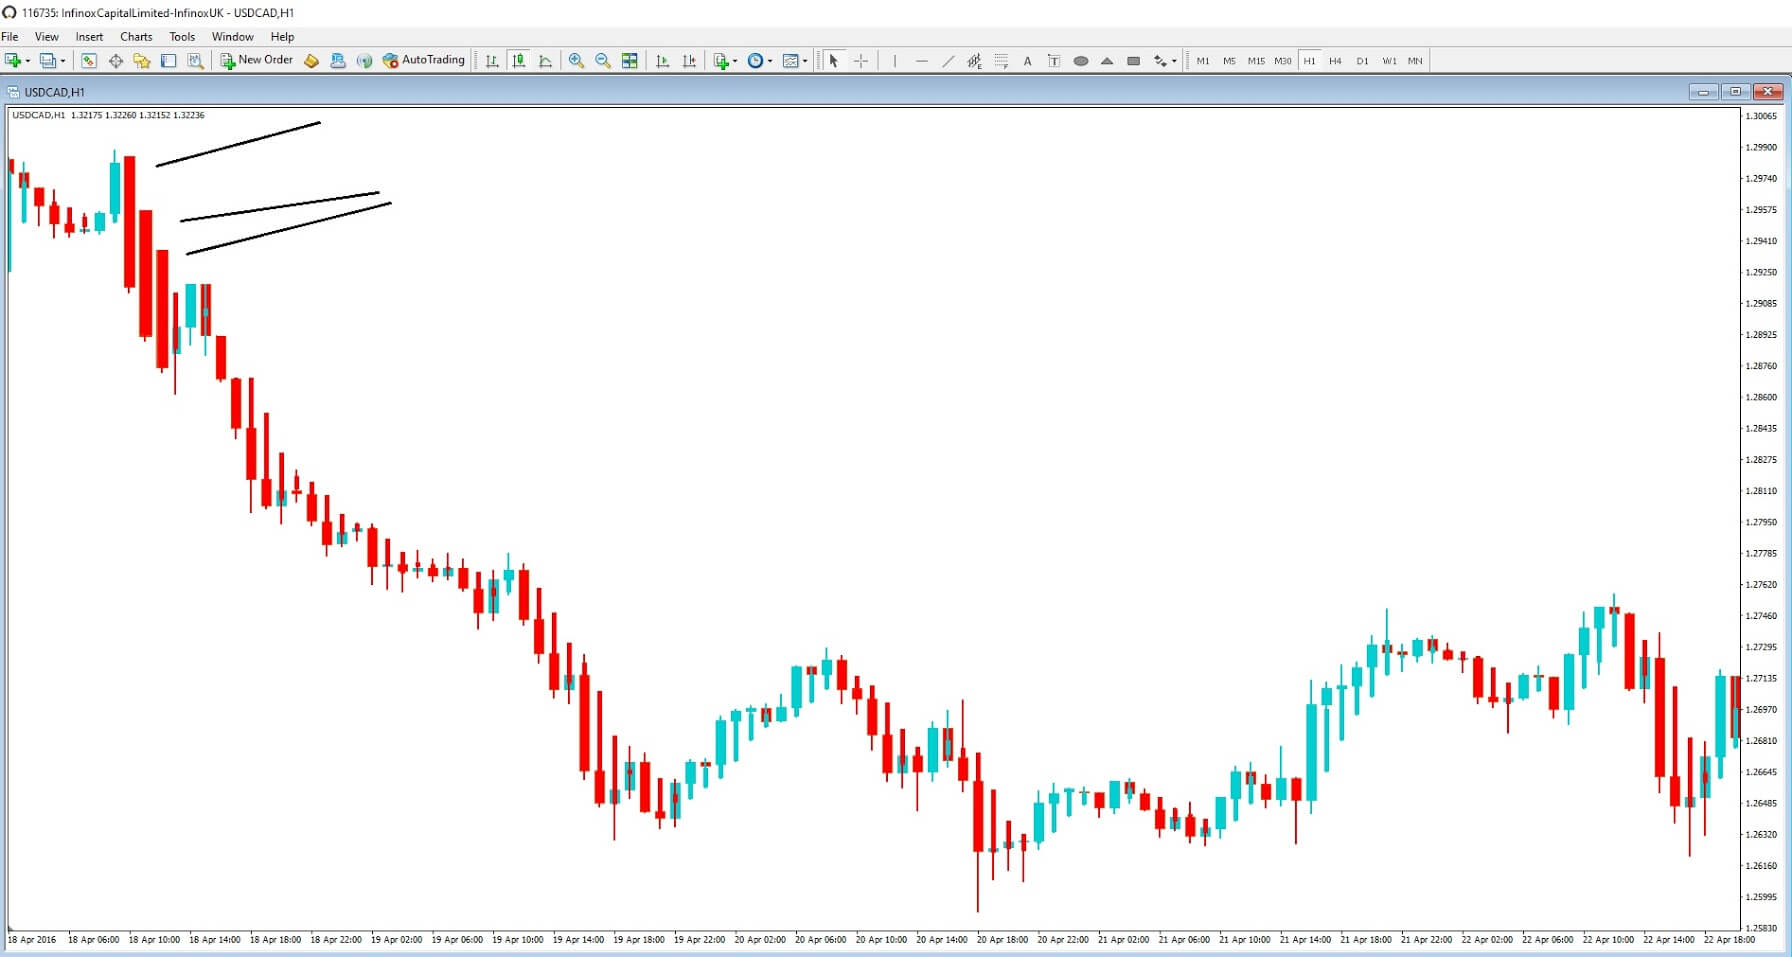

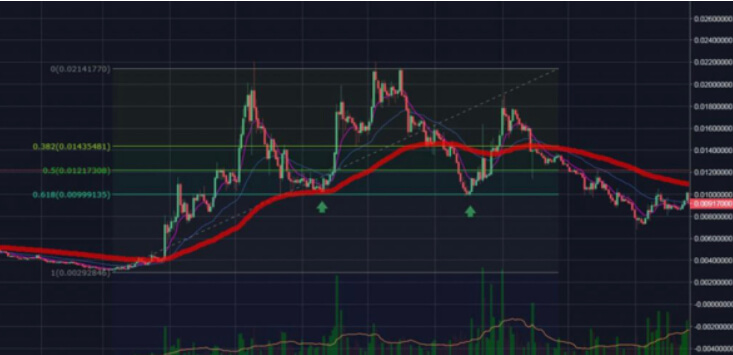
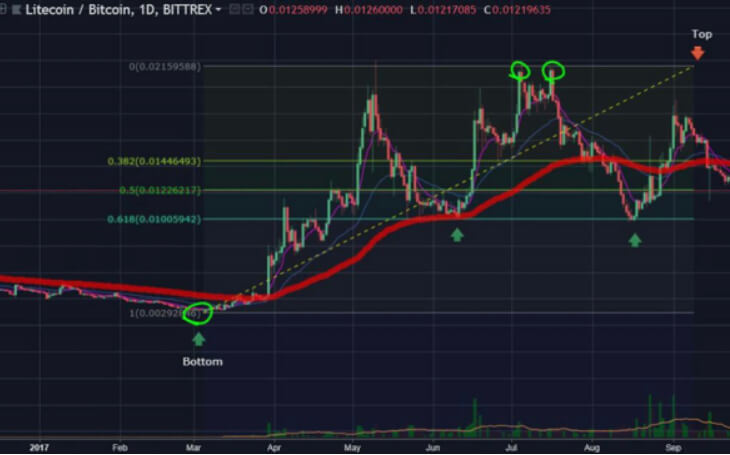
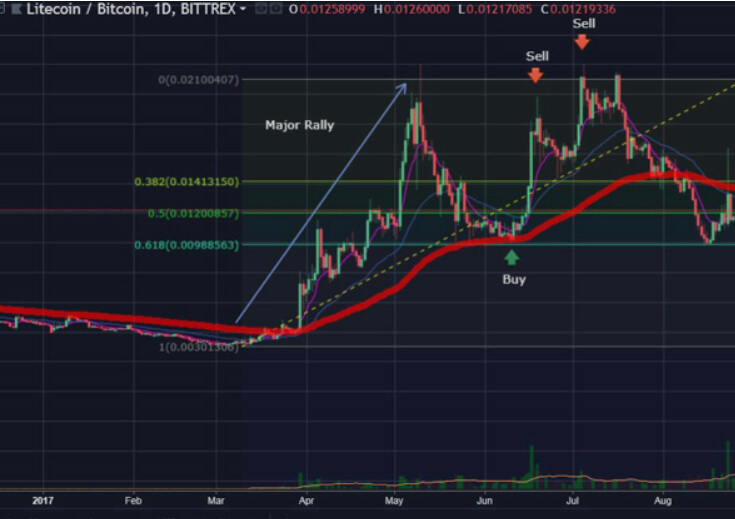


 An interesting proposal within Bonacci’s book was based on an observation of how the population of rabbits grew in ideal conditions. The solution to the rabbit problem was found within a mathematical sequence, which we now know as Fibonacci numbers.