
Pin Bar Candlestick Formations
Traders can potentially use price action alone to trade without the need to rely on other indicators. When doing this, they rely on Japanese candlestick patterns and formations, and one such pattern is the pin bar formation, which we will look at in great detail in this presentation. Traders try to identify reversal patterns, and pin bars are high on their list because they offer a high probability of success, and especially in volatile market conditions.
Example A
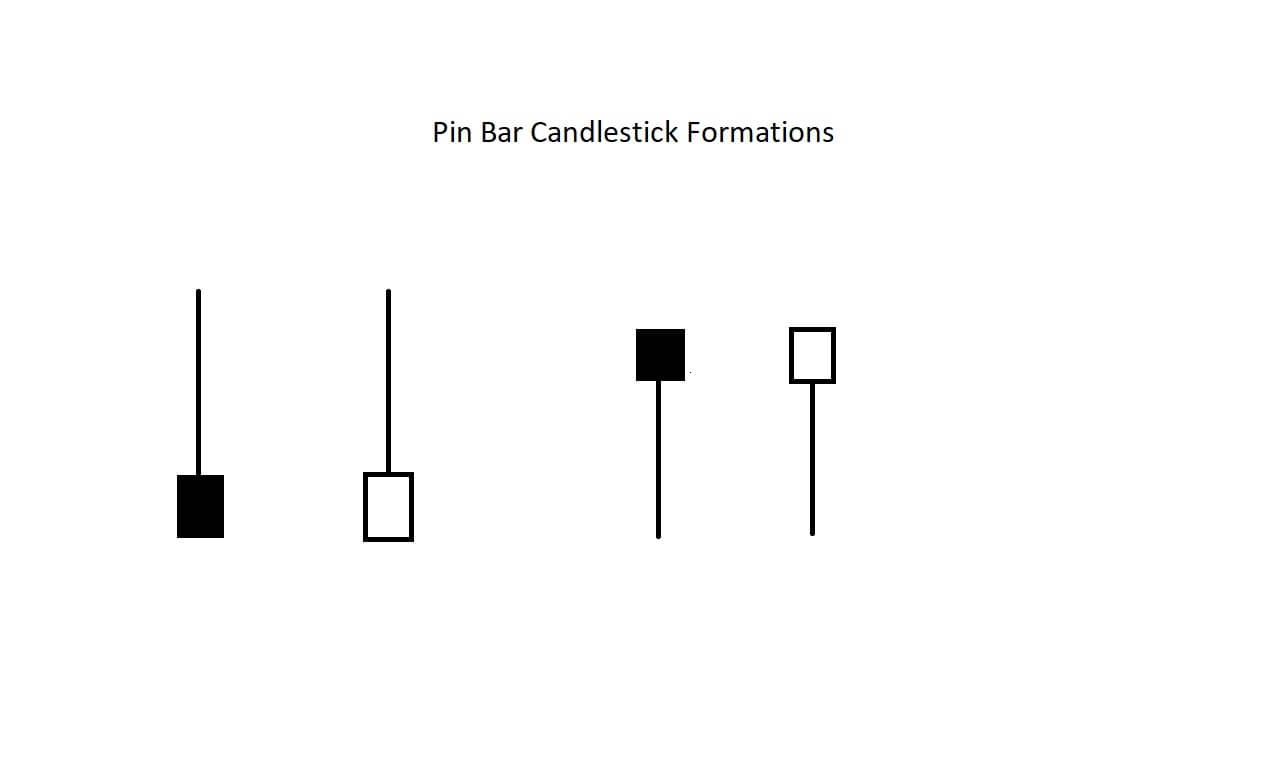
Example A is what you would expect to see when looking for bullish or bearish pin bar formations. The formation is dependent on one single candlestick, and will typically be larger than its immediate preceding candlesticks and represents a rejection of a move, followed by a sharp reversal. The pin bar reversal, as it is sometimes referred to, consists of a short body and a wick, or tail, which is at least three times the length of the body, thus making them easy to identify. The area of the pin bar’s wick defines the area of price action that was rejected. Traders would read the formation as identifying a reversal in price action and a continuation in the direction of the wick.
Example B
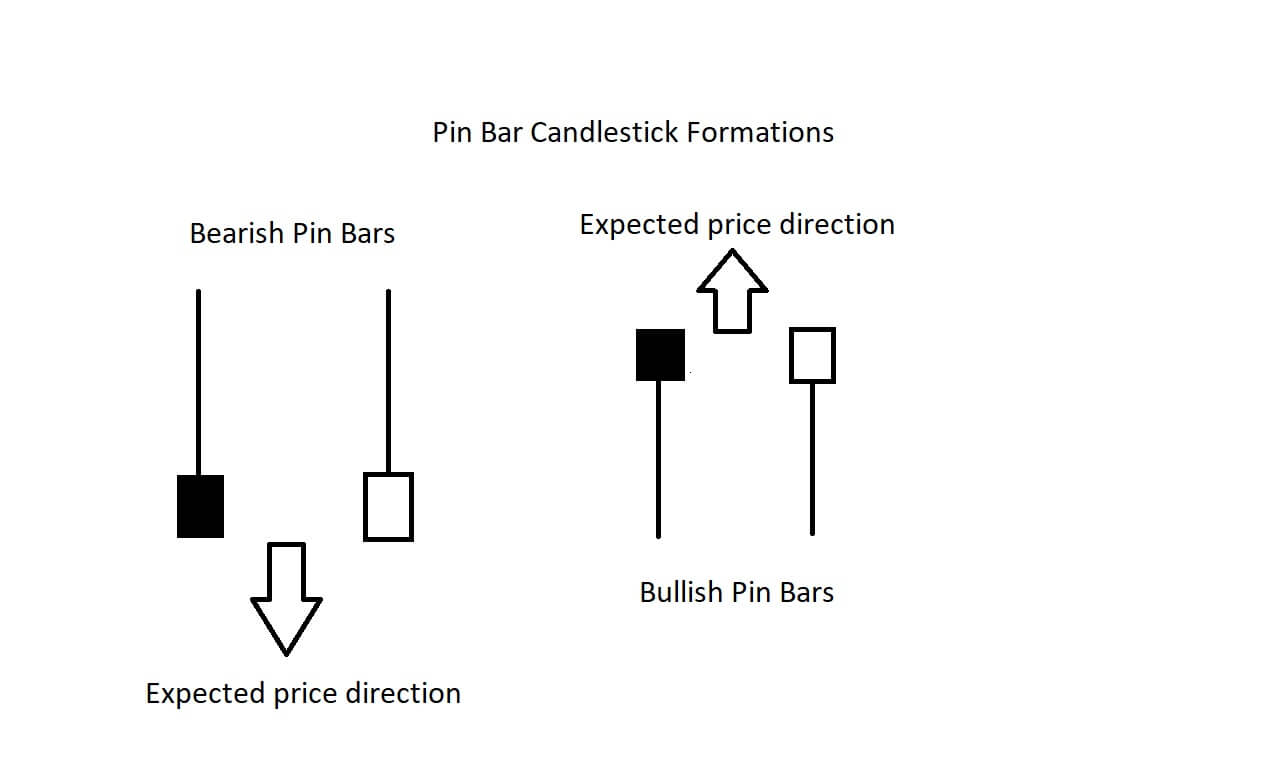
Example B looks at these shapes more closely and identifies the expected move of any subsequent price action.
Example C
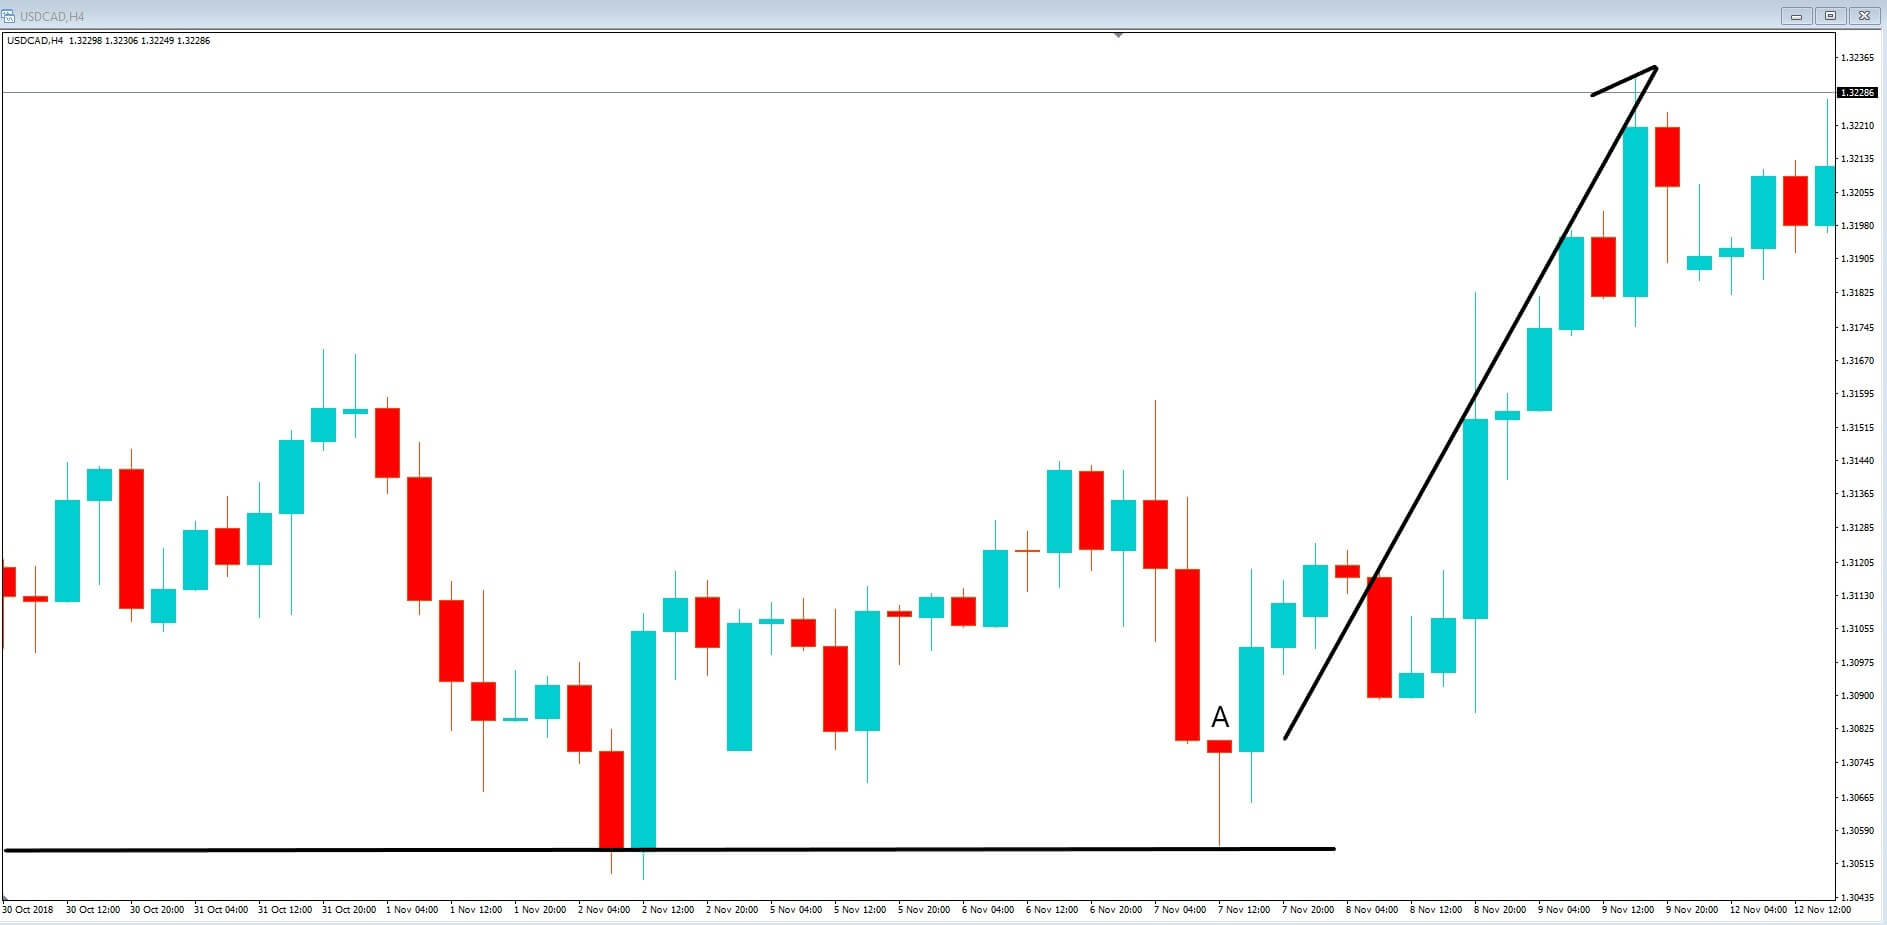
Example C shows a bullish pin bar trading strategy in action on a real chart of the USDCAD pair on a 4-hour chart. Here we can see a bullish reversal pin bar at position A. The reason that we can be fairly confident that this is a potential set up to move higher is because we can see that the previous candlesticks have found a support area as defined by our line and where candlestick A has gone down and touched that support area, only for the majority of the price action to be reversed. Had we decided to take this trade on, we would have placed a stop loss just below the support line, and we can see that on this occasion, we would have been nicely rewarded with a push higher in price action.
Example D
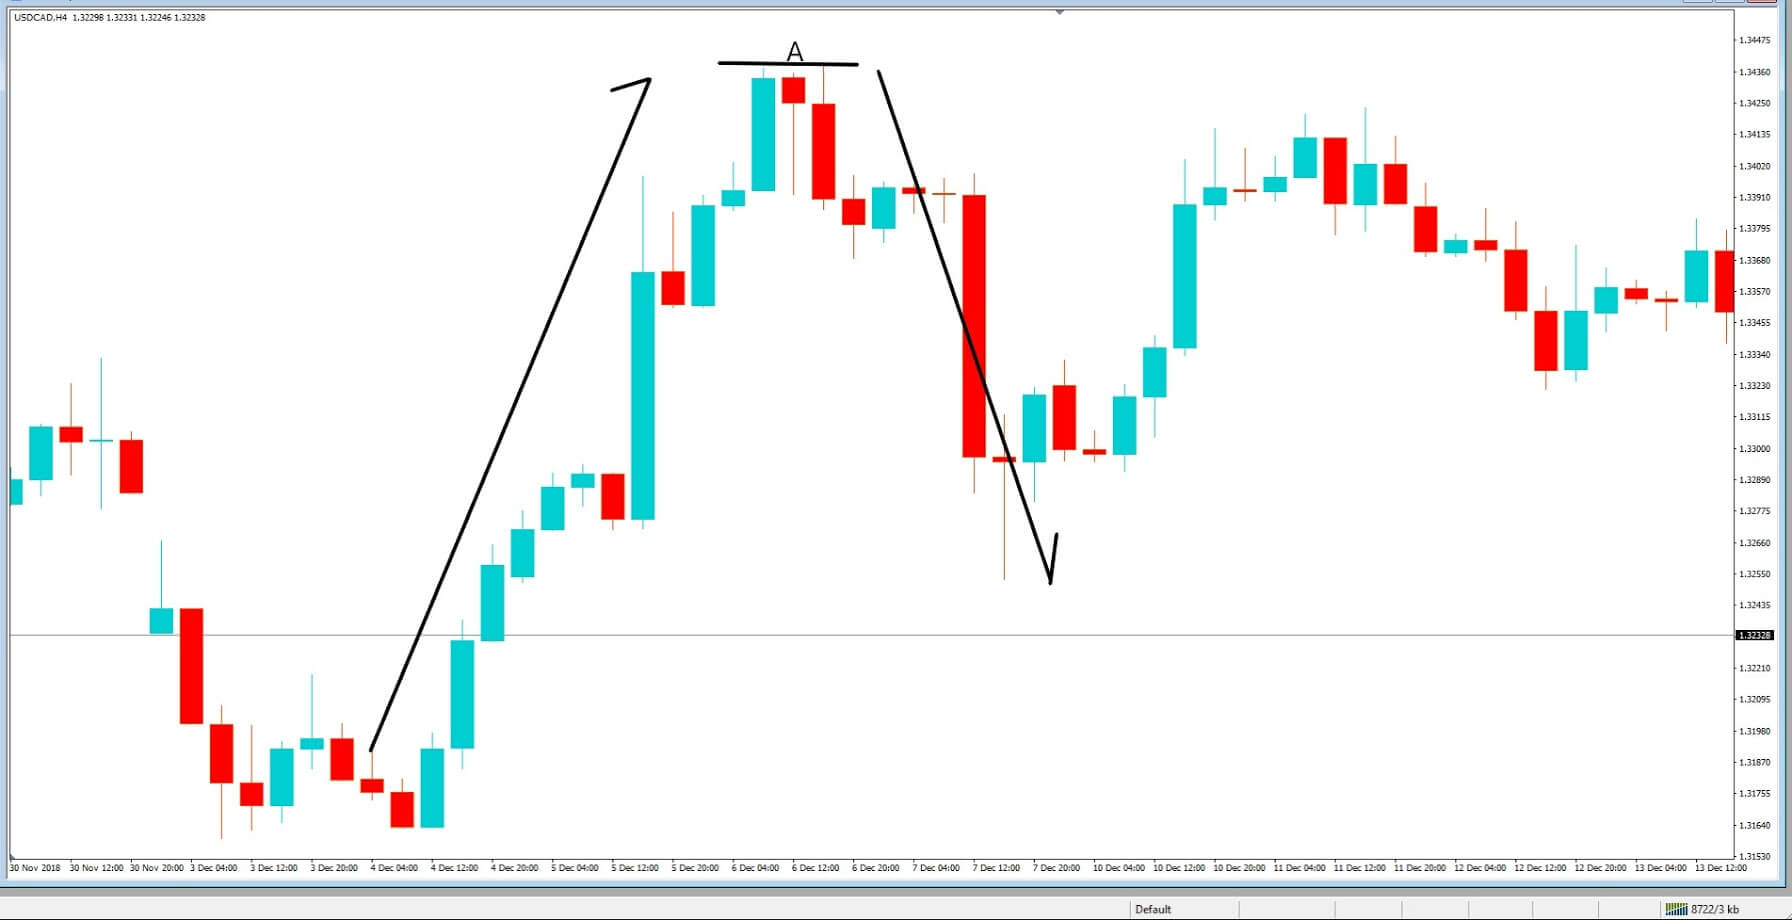
In example D, we can see a bearish pin bar set up on the same pair at a later date. The pair has witnessed a move higher and where at candlestick A we can easily identify a bearish pin bar setup. The subsequent candlestick moves lower, and this enforces our belief that we are going to get a reversal in price action and that indeed happens. Had we taken on this trade and placed a fairly tight stop loss, we would have been nicely rewarded again.
A word of caution, trading pin bars is essentially gambling that price action will reverse in the opposite direction of which might have been a trend, and which is therefore almost counterintuitive. Trading pin bars might be a result of many factors including economic data releases, price action hitting key levels of support and resistance, or simply running out of steam, newsflow, policymaker speeches, or other unexpected events, and therefore we do not recommend that new traders use these setups to trade unless they are experienced.
However, pin bars can also offer a warning of when to exit a trade, rather than necessarily looking at it as an opportunity to trade in the opposite direction.