Categories
Forex Market Analysis

Daily F.X. Analysis, January 9 – Top Trade Setups In Forex – Stronger Dollar In Play! 

The U.S. dollar rebounded for a second straight session on Wednesday, lifted by a stronger-than-expected ADP jobs report. The Dollar Index rose 0.3% on the day to 97.31.

Safe-haven assets and currencies lost bids as the U.S.-Iran tensions showed no signs of escalation. USD/JPY marked a day-low of 107.64 before bouncing back to close at 109.04, up 0.6%.

The euro slid 0.4% to $1.1113. Official data showed that German factory orders declined 1.3% on month in November (+0.2% expected). Later today, the eurozone’s jobless rate for November will be released (steady at 7.5% expected).

Economic Events to Watch Today


EUR/USD – Daily Analysis

The EUR/USD currency pair rose slightly and representing 0.10% gain, mainly due to the greenback weakness despite the upbeat U.S. macro news and de-escalated tensions between the United States and Iran. The EUR/USD is currently trading at 1.1117 and consolidates in the range between the 1.1103 – 1.1119.

Despite the recent gain in the EUR/USD, the pair remains prone to further bearish risks amid bearish technical set up. Notably, the market is still cautious that the currency pair could show less reaction on the Industrial Production data after the EUR currency ignored the unexpected declines in the German Factory order, which is released on Wednesday.

At the data front, the eurozone’s manufacturing powerhouse Germany is set to publish Industrial Production, Current Account and Trade Balance data for November at 07:00 GMT. 

The industrial data is anticipated to show the factory activity increased at a seasonally adjusted rate of 0.7% month-on-month in November, having dropped by 1.7% in the previous month. The annualized number is forecasted to print at -3.8% vs. September’s -5.3%. 

Whereas, Germany’s Current Account data for November is expected to arrive at EUR 16.9B vs. EUR 22.7B last. The Trade Balance figure is seen at EUR 20B as against EUR 20.6B booked in October. Imports are seen rising while Exports are expected to drop in the reported month.

On the other hand, the Industrial Production is hardly likely to see any positive surprise in November, as suggested by the lead indicators. 

The Industrial Production released by the Statistisches Bundesamt Deutschland measures outputs of the German factories and mines. Changes in industrial production are broadly understood as a significant sign of strength in the manufacturing sector. A high figure is considered as positive (or bullish) for the EUR, whereas a low number is considered as negative (or bearish).

Daily Support and Resistance

  • S3 1.1015
  • S2 1.1068
  • S1 1.1088
  • Pivot Point 1.1122
  • R1 1.1141
  • R2 1.1175
  • R3 1.1228

EUR/USD– Trading Tips

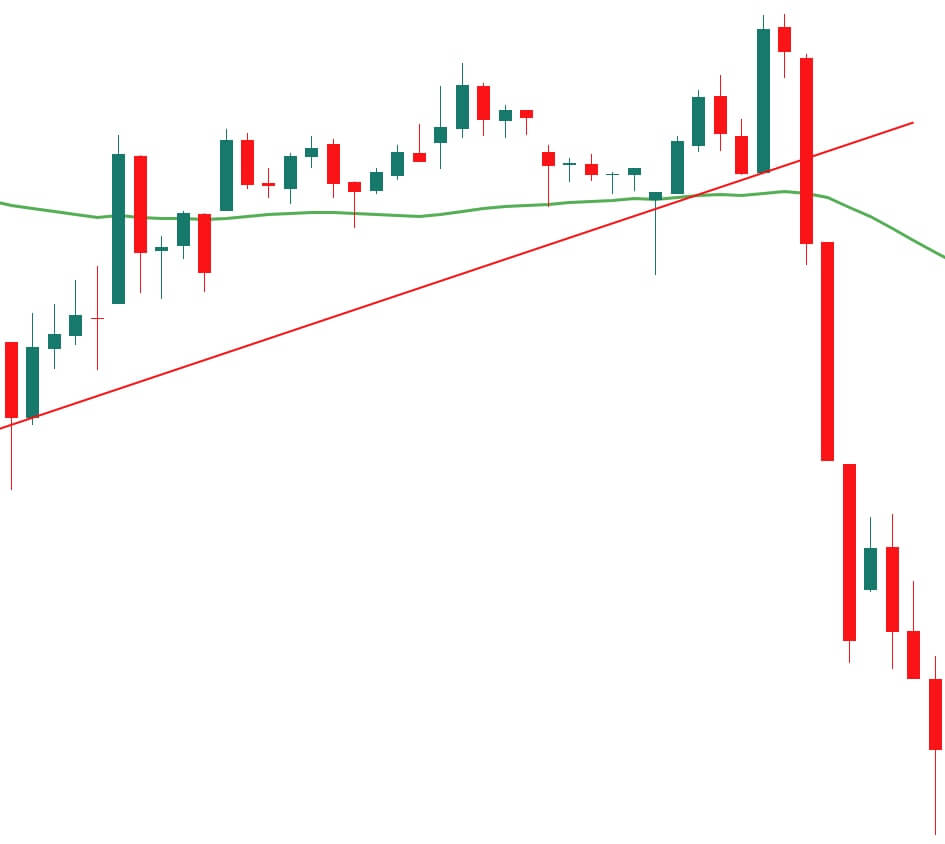
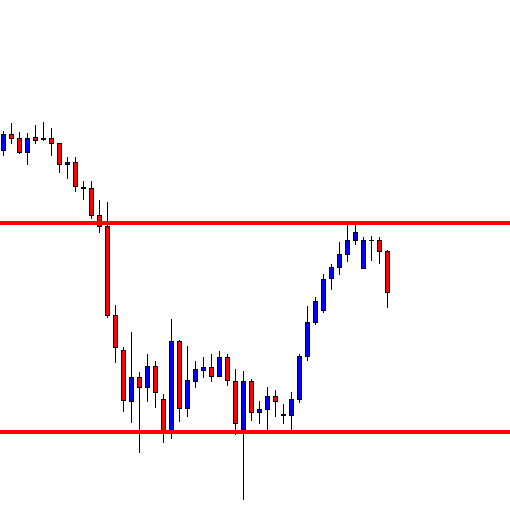
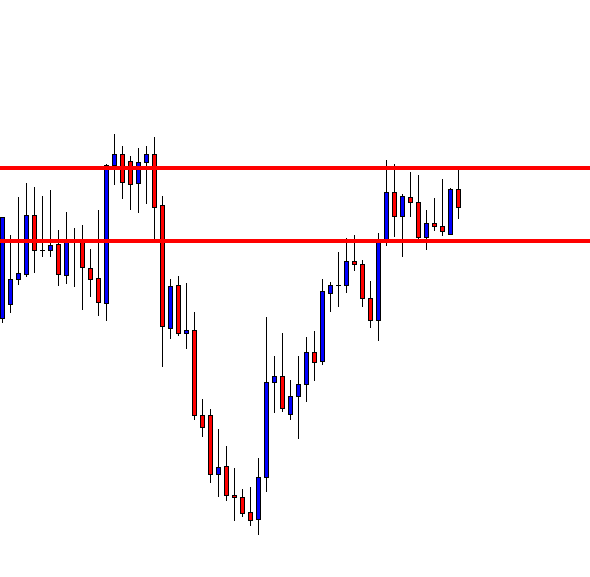
The EUR/USD is trading in a bearish mode below a crucial trading level of 1.1130, testing the support next level of 1.1100. This level worked as a support during the previous days, but this time it seems to get violated as the EUR/USD has formed a strong bearish candle. The MACD is trading below 0 levels, which is suggesting odds of the bearish trend continuation for the EUR/USD. 

On the 4 hour chart, the pair had formed a bullish channel which has now been violated at 1.1130 level, and now this can lead the EUR/USD prices towards 1.1077 level. 


GBP/USD– Daily Analysis

The GBP/USD currency pair is steady near the 200-weekly Moving Average with a slight bearish flow ahead of Brexit negotiations. The Cable is currently trading at 1.3108 and consolidates in the range between 1.3097 – 1.3115.

The GBP/USD currency pair has been confused due to the crossfire of risk-off and risk-on market sentiment after the missile attack and tensions in the Middle East. At this moment, the United States President Donald Trump de-escalated tension by not given any immediate reaction to an Iranian attack that help global trade deals to come back on the front.

Therefore, global trade deals are the key driver to watch. First of all, traders will keep their eyes on the United States and China phase-1 trade deal. As we know, both nations are ready to sign the agreement on January 15. The market focus will also be on the Brexit deal because the Europan Parliament also gives the green indicator, and the United Kingdom officially leaves the Europan Union on January 31 with a departure deal. After completing the departure deal, the United Kingdom will enter the transition period until December 31, 2020.

Looking forward, the global trade deal will be the key to watch, and traders will carefully follow any fresh news regarding the Brexit and Sino-US trade deal. The US-Iran fresh progress will be essential to watch. Apart from the headlines, the BOE Gov Carney will deliver the speech today. 

Daily Support and Resistance

  • R3: 1.3296
  • R2: 1.3206
  • R1: 1.3151
  • Pivot Point 1.3116
  • S1: 1.3061
  • S2: 1.3026
  • S3: 1.2936

GBP/USD– Trading Tip

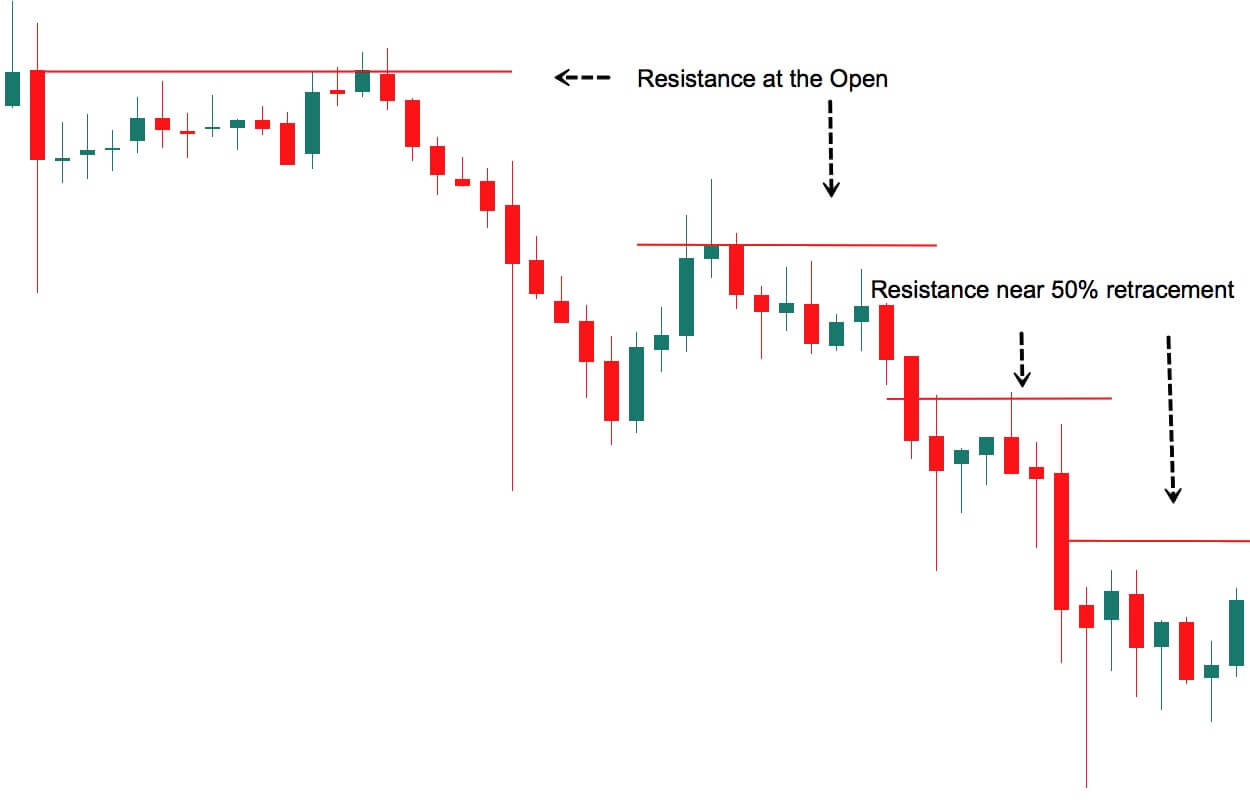
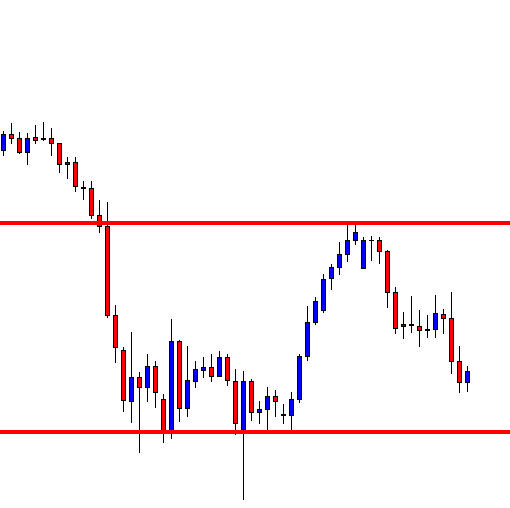
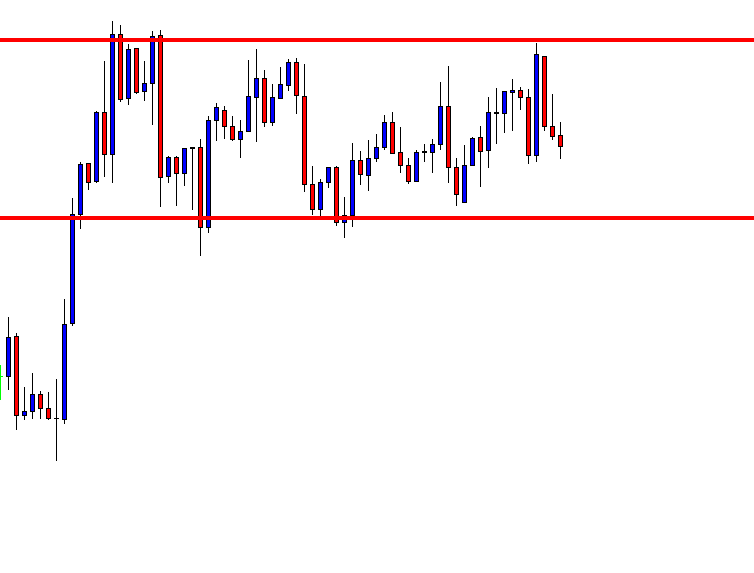
The GBP/USD continues to trade with bearish bias after violating the 1.3045 support level. On the 4 hour chart, the pair has closed a bearish engulfing candle under 1.3045 support level, which is a proof of bearish breakout. Below 1.3045, the GBP/USD has a potential to trade lower until 1.3000 level and even towards 1.2910 support zone. 

The leading indicators, such as RSI and MACD, are also supporting the bearish bias among traders. I will consider taking selling positions below 1.3058 to target 1.3000 today. 


USD/JPY – Daily Analysis

The USD/JPY currency pair flashing green and representing 0.15% gains in the Asian trading hours mainly due to the greenback recovery in the wake of de-escalated tensions between the United States and Iran war after the Trumps sluggish speech overnight. The USD/JPY is currently trading at 109.33 and consolidates in the range between the 109.02 – 109.33.

As for the previous sessions, the USD/JPY currency pair hit the bullish track from the low of 107.65, mainly due to Iran’s missile attack but later returned to 108.45 by the London morning, having hit the high of 109.20 during the U.S. session. Ahead of the U.S. President Donald Trump’s speech, there were already signs rising from Iran for a de-escalation. As of consequence, markets turned into risk-on sentiment and thought that the U.S. would not take any revenge.

No damage was found in the missile attacks from Iran. This is why, rather than taking any military action, Trump said that he was imposing more restrictions on Iran. As of result, the risk recovered and yields rallied, ass well as greenback got the support.

At the data front, the ten-year yields recovered from 1.70% to 1.87% (was 1.79% at the Sydney close). There was a small drop back in the Sydney morning though on headlines reporting rockets being fired at the U.S. “green zone” in Baghdad, While markets are pricing a near-zero chance of rate cut at the next Fed meeting on January 29 but a terminal rate of 1.25% (vs Fed’s mid-rate at 1.63% currently).

As for U.S. data, the US Dec ADP private payroll is beat estimates with a job gain of 202k (est. 160k), and Nov was revised higher to 124k (from 67k), bringing it closer to the official data.


Daily Support and Resistance

  • S3 106.93
  • S2 107.9
  • S1 108.49
  • Pivot Point 108.87
  • R1 109.46
  • R2 109.84
  • R3 110.81

USD/JPY – Trading Tips

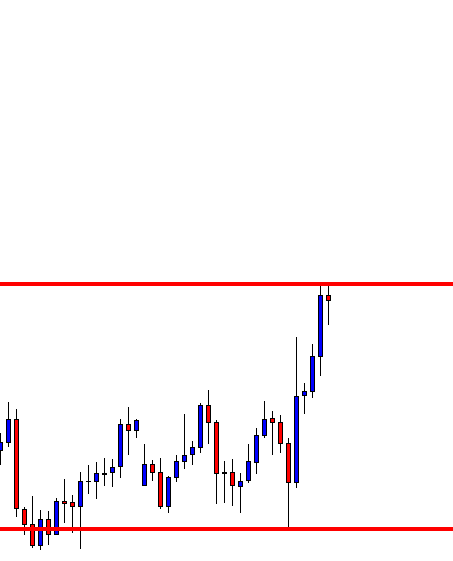
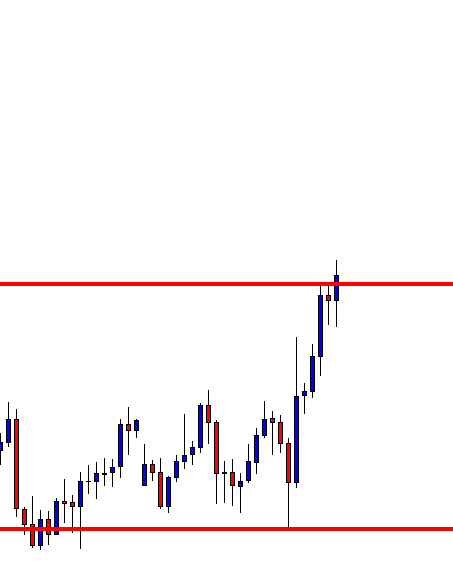
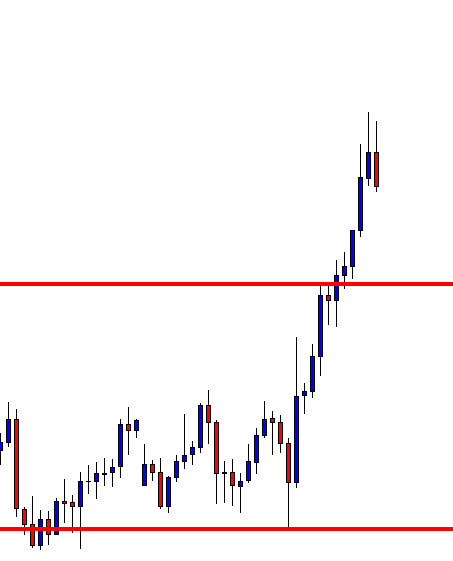
The USD/JPY pair is trading bullish around 109.420 after breaking above a resistance level of 108.950. The way USD/JPY is forming bullish candles shows a strong buying bias among investors. We may see USD/JPY targeting the triple top resistance level around 109.700. 

Leading indicators are massively overbought, and USD/JPY is looking for a reason to trigger bearish retracement. 109.750 can offer this reason today. Let’s keep an eye on this level to capture a sell positon below this today. All the best! 

Categories
Forex Market Analysis

WTI Crude Oil Prices Jumped On US-Iran War Sentiment! 

Earlier today, the WTI crude oil prices hit the bullish track and climbed to 1.3% to $63.53, mainly after Iran attacked two United States airbases in the wake of U.S. airstrike that killed the Iranian general last week, flashing worries regarding the escalating conflict between the United States and Iran.

The U.S. crude oil later fell from $63.53 to trade around $62 during the European session. Crude oil prices soared as much as 5% earlier in the day following the news, but gave up all of their increases following in the day as Iran’s foreign minister announced it had “settled proportionate steps in protection” and is not attempting war.

Supply worries extended due to an intensifying conflict between the United States and Iran after the U.S. airstrike killed general Qassem Soleimani last week. In total13 missies have been reported launched at the Ain Assad Air Base. White House answers they are aware of the attack, and U.S. President Trump has been briefed and is monitoring the situation.

It is worth to mention that the United States President Donal Trump will make a statement tonight. With this, the U.S. Defense Secretary Esper and U.S. Secretary of State Pompeo have arrived at the White House. On the other hand, Iran’s guards warn the U.S. any aggression against Tehran will get a worse response.

Meanwhile, the American Petroleum Institute reported that crude stockpiles dropped by 5.9 million barrels for the week ended Jan. 3, compared with a plunge of about 11.5 million barrels reported for the week before.

Whereas, the Energy Information Administration is expected to report a decline of around 3.6 million barrels when it publishes official figures tomorrow.

At the Sino-US front, the improvements on the Sino-U.S. trade front also remained as the focus. The two nations were reportedly going to sign a phase one trade deal on Jan. 15.

Daily Support and Resistance

S3 57.4

S2 60.7

S1 62.71

Pivot Point 64.01

R1 66.01

R2 67.31

R3 70.62

Looking at the 4-hour timeframe, the WTI prices are holding around 62 after violating the support level of 62.30. Crude oil is now facing support around 61.30, which is extended by an upward trendline. The WTI prices are likely bouncing off above this level to target 62.30.  

On the chart above, we can see the WTI seems to form a Doji candle, which is followed by a strong bearish bias. Typically such candles drive bullish trends in the market. I will consider taking buying positions above 61.20 to target 62.27. Above 62.30, the U.S. Oil can soar up to 63. Good luck! 

Categories
Forex Market Analysis

Daily F.X. Analysis, January 6 – Top Trade Setups In Forex – U.S. Iran Shakes The Market! 

On the forex front, the U.S. Dollar Index was little changed at 96.84 on Friday. Being regarded as a haven-asset, the Japanese yen strengthened against the greenback as geopolitical risks increased. USD/JPY dropped 0.5% to 108.09, the lowest level since mid-October.

The euro slipped 0.1% to $1.1160. Official data showed that German’s jobless rate was steady at 5.0% in December as expected, while CPI grew 1.5% on year (+1.4% expected). 

Besides, Iran vowed “severe revenge” on the U.S., while President Donald Trump threatened major retaliation on Iran if they do anything.

Economic Events to Watch Today


 EUR/USD – Daily Analysis

The EUR/USD currency pair hit the bullish track mainly due to U.S. Treasury yields, which dropped in the wake of risk-off sentiment. Besides, the greenback is also struggling to gain the ground. The EUR/USD pair is consolidating at 1.1164, consolidating in the range between the 1.1156 – 1.1172. 

The on-going tension between the United States and Iran further intensified during the weekend after Iran’s supreme leader Ayatollah Ali Khamenei’s statement that Iran would take revenge for the U.S. killing of Iranian general Soleimani. The country also announced that it would not follow any restrictions imposed by the 2015 nuclear deal.

On the other hand, the United States President Donald Trump also gave warning regarding retaliation if the Iran attacks on United States personnel or assets.

The yield on the United States ten-year Treasury note dropped to a one-month low of 1.757% in Asia and is currently seen at 1.777% – down ten basis points on the day.

At the data front, the German retail sale for November and final PMI indices for December are scheduled for release. However, these data will likely avoid in the wake of geopolitical development.


Daily Support and Resistance

  • S3 1.1082
  • S2 1.1133
  • S1 1.1153
  • Pivot Point 1.1183
  • R1 1.1203
  • R2 1.1234
  • R3 1.1284

EUR/USD– Trading Tips

On the 2 hour chart, the EUR/USD has tested the support level of 1.1130, which was being extended by the old triangle pattern. The U.S. Iran war sentiments are making EUR/USD weaker and are very likely to drive bullish bias until 1.1200 and 1.1245 level today. 

Speaking about the leading indicators, the RSI and MACD are holding in the buying zone, demonstrating the bullish trend in the EUR/USD pair today. Consider staying bullish until 1.1240 today.


GBP/USD– Daily Analysis

The GBP/USD currency pair shifted to bullish track from the two-day losing streak, mainly due to broad-based greenback weakness. As of writing, the GBP/USD is trading at 1.3160.

Just like the EUR/USD, the GBP/USD is also being influenced by the geopolitical tensions. On-going tension between the United States and Iran further intensified during the weekend after Iran’s supreme leader Ayatollah Ali Khamenei’s statement that Iran would take revenge for the U.S. killing of Iranian general Soleimani. The country also announced that it will not follow any restrictions imposed by the 2015 nuclear deal. As a result, the U.S. dollar is getting weaker.

At the Brexit front, the United Kingdoms’ opposition Labour Party will decide the schedule for the election to choose the next leader on Monday. Moreover, it seems like the contender Keir Starmer already accepted the Brexit while Jess Phillips says if Brexit fails, she will likely to rejoin the European Union.

The United Kingdom Prime Minister will meet the Ursula von der Leyen, European Commission President on Wednesday, and will likely discuss the Brexit process ahead. However, the daily mail hints that the senior Tory leaders are supporting Boris Johnson to kick off parallel post-Brexit trade talks with the U.S. to put pressure on the E.U. 


Daily Support and Resistance

  • S3 1.2932
  • S2 1.3047
  • S1 1.3094
  • Pivot Point 1.3163
  • R1 1.321
  • R2 1.3278
  • R3 1.3393

GBP/USD– Trading Tip

The GBP/USD is also trading bullish around 1.3185 due to weakness in the U.S. dollar. The recent bullish engulfing candle is suggesting odds of bullish trend continuation in the GBP/USD pair. 

On the higher side, the GBP/USD may find resistance near 1.3185 level today while the support still stays at 1.3060. A bullish breakout of 1.3185 level can extend the bullish trend until 1.3285. Let’s stay bullish above 1.3125 today. 

USD/JPY – Daily Analysis

The USD/JPY currency pair found on the bearish track due to the risk-off sentiment in the market and a greenback’s weakness. The USD/JPY pair is trading at 108.00 and consolidates in the range between the 107.77 – 108.12.

On the front of main headlines, the on-going tension between the United States and Iran further intensified during the weekend after Iran’s supreme leader Ayatollah Ali Khamenei’s statement that Iran would take revenge for the U.S. killing of Iranian general Soleimani. As a consequence, the markets have turned into risk-off sentiment, boosting demand for safe-haven assets like U.S. treasury, gold, and Japanese yen.

On the other hand, the United States President Donald Trump also gave warning regarding retaliation if Iran attacks the United States personnel or assets. Notably, we can expect further conflicting updates.

The United States’ two-year Treasury yields declined from 1.57% to 1.51%, the lowest since early Nov, ten-year yields from 1.88% to 1.79%. Markets are pricing a near-zero chance of rate cut at the next Fed meeting on January 29 but a terminal rate of 1.28%.

Daily Support and Resistance

  • S3 107.24
  • S2 107.9
  • S1 108.23
  • Pivot Point 108.55
  • R1 108.89
  • R2 109.2
  • R3 109.86

USD/JPY – Trading Tips

The USD/JPY is trading in a bearish channel, which is keeping it support near 107.750 for now. At the same time, the resistance is likely to be found around 108.250. The RSI and MACD are staying above 50 and 0, suggesting a bullish trend in the USD/JPY.

Technically the pair has the potential to drop further until 107.800 level, and violation of this could extend selling until 107.600. All the best!

Categories
Forex Market Analysis

Daily F.X. Analysis, January 3 – Top Trade Setups In Forex – FOMC Meeting Minutes Ahead! 

On the forex front, the U.S. Dollar Index rebounded from its six-month low, gaining 0.4% on the day to 96.80. The investor will focus on the Federal Reserve’s latest monetary policy meeting minutes due later in the day. In Asian trading hours, safe-haven demand surged as the U.S. Defense Department confirmed that the U.S. military, “at the direction of the president,” killed Iranian general Qassem Soleimani in an airstrike in Iraq.

Economic Events to Watch Today


EUR/USD – Daily Analysis

The Euro dropped 0.4% to $1.1171. Later today, German’s December jobless rate (steady at 5.0% expected) and CPI data (+1.4% on-year expected) will be reported. The contracted manufacturing PMI from Germany at the end of 2019 weighed on single currency Euro and dragged the pair EUR/USD below 1.120 on Thursday. 

On the other hand, the U.S. dollar rose today after a week on the release of U.S. initial jobless claims for December. The jobless claims for the previous week were in line with the expectations and supported the U.S. dollar.

The labor market of the United States showed signs of improvement, and American markets reacted positively to renewed hopes of growth in consumer spending. This could mean that the U.S. economy would grow with a moderate rate in 2020.

Meanwhile, the US-China trade deal developments had given some ease to the ongoing global economic slowdown when it was confirmed that the phase-one deal between the world’s two largest economies would be signed in mid –January. The strong U.S. dollar and weak Euro dragged the EUR/USD pair at the start of the New Year.


Daily Support and Resistance

  • R3: 1.1284
  • R2: 1.1234
  • R1: 1.1203
  • Pivot Point 1.1183
  • S1: 1.1153
  • S2: 1.1133
  • S3: 1.1082

EUR/USD– Trading Tips

Technically, the pair is trading at 1.1135, which is very closer to the bearish trendline support area of 1.1125. On the lower side, the EUR/USD is likely to find support around 1.1100 areas, which previously worked as a resistance for the EUR/USD. On the higher side, the EUR/USD may find resistance near 1.1150 and 1.1185 today.  

The RSI and MACD are holding in the bearish zone, suggesting chances of the bearish trend in the EUR/USD pair. Let’s stay bearish below 1.1180 and bullish above 1.1110 today. 


GBP/USD– Daily Analysis

The British pound sank 0.8% to $1.3147, halting a six-day rally. Research firm Markit will release U.K. Construction PMI for December (45.9 expected). However, Boris Johnson has pledged that U.K. would leave E.U. on January 31 and has announced to make his Brexit deal as a law in case no transaction was secured by the end of 2020 with E.U. in terms of trade.

PM Johnson insisted that 11 months period was enough to reach a trade deal with E.U., but critics have argued that the timetable was too tight and could lead to a no-deal Brexit. This has been weighing on British Pound, and hence, GBP/USD started to fell at the start of the New Year.

Meanwhile, the U.S. dollar gained traction in the market after the losses of 6 consecutive days on Thursday. 

The trader’s comeback after the holidays gave strength to the U.S. dollar when they re-entered in the market, and the volume of trades increased. Strong U.S. dollar added in the pressure of GBP/USD and caused the pair to lose its gains from the previous day.

Daily Support and Resistance

  • R3: 1.3393
  • R2: 1.3278
  • R1: 1.321
  • Pivot Point 1.3163
  • S1: 1.3094
  • S2: 1.3047
  • S3: 1.2932

GBP/USD– Trading Tip

Just like the EUR/USD, the GBP/USD pair has also completed a bearish retracement until 1.3045, which marks 61.8% Fibonacci Retracement area. Three black crows on the 2-hour chart are signifying bearish bias among traders. At the moment, the Cable is trading around 1.3050 level, and it may surge a bit above the 1.3045 area to target 1.3150 today. 


USD/JPY – Daily Analysis

The USD/JPY closed at 108.566 after placing a high of 108.864 and a low of 108.210. Overall the trend for USD/JPY remained bearish that day.

At 5:30 GMT, the Annual Challenger Job Cuts form the United States came in as-25.2% in comparison to the previous -16.0%. At 6:30 GMT, the Unemployment Claims for the last week from the United States came in line with the expected 222K. AT 7:45 GMT, the Final Manufacturing PMI for December forms the United States was dropped to 52.4 from the expectations of 52.5 and weighed on the U.S. dollar.

The decline in the Manufacturing activity in the United States at the end of 2019 gave pressure to the U.S. dollar and dragged USD/JPY for 4th consecutive day on Thursday to the level of 108.2.

The US-China trade deal optimism gave strength to the U.S. dollar when it failed to grow the economy of China. In response to what, on Wednesday, the Chinese Central Bank announced that it was diminishing the quantity of cash that all banks need to hold as reserves around $15B. This move from China’s Central Bank was taken to improve the economic condition of the country.

Daily Support and Resistance

  • R3: 109.86
  • R2: 109.2
  • R1: 108.89
  • Pivot Point 108.55
  • S1: 108.23
  • S2: 107.9
  • S3: 107.24

USD/JPY – Trading Tips

The USD/JPY was facing triple bottom support around108.400 level, which has now been violated after the USD/JPY completed 23.6% retracement at 108.700. The USD/JPY pair is trading in a bearish channel, which is likely to keep this pair bearish below 107.900. 

At the moment, the pair may find immediate support near 107.900, and violation of this could extend sell-off until 107.500. While resistance holds around 108.250 today, consider taking sell trades below 108.200 today.

All the best!

Categories
Forex Market Analysis

Gold Surge Amid Weaker Dollar – A Trade Plan on Thursday!  

Gold prices soared higher on Thursday, staying near to a three-month top as the precious metal gold profited from bent in the greenback. The dollar index, which gauges the worth of the US dollar against the basket of six major currencies, was down with 1.9% in the previous month, which was its lowest level since July. A weaker dollar means cheaper gold for investors and a rise in Yellow metal prices in financial markets.

Investors also stocked gold after the release of PMI from China, where factory activity came in line with the expectations and growth in production at a solid pace was seen. This increased the confidence of traders that global economic outlook has started to get better on the rising trade optimism after the announcement of the phase-one trade deal.

Another factor including in the upbeat movement of the yellow metal was the rising tensions between the US and the Middle East. When the US military carried out airstrikes in Iraq & Syria against Iran-backed Katib Hezbollah, the protestors rallied over the US embassy in Baghdad.

This increased the appeal for safe-haven assets like gold and continued to support gold prices at the starting trading day of New Year.
Investors will be eyeing on the release of Manufacturing PMI & Unemployment Claims data from the United States to further invest in gold.


Gold – XAU/USD – Daily Technical Levels


Support Resistance 

1524.5     1529.5

1522.59   1532.59

1517.59   1537.59

Pivot Point 1527.59

Gold may find next resistance around 1,533 levels as it’s a double top level, which may help sellers with a bearish opportunity. On the lower side, the support stays around 1,523. 

Gold’s RSI and MACD are holding above 0, suggesting odds of further buying in the gold. The inside up bar on the 120 minutes chart is also supporting the bullish bias. But sooner or later, the pair is going to enter an overbought zone, and we may need to look for a selling trade in it. Consider staying bullish above 1,523 and bearish below 1,533 today. Good luck! 

Categories
Forex Market Analysis

Daily F.X. Analysis, December 30 – Top Trade Setups In Forex – Market Expects Correction!

The U.S. dollar weakened against its major pairs on Friday, with the ICE Dollar Index sliding 0.6% on the day to 96.92. A Federal Reserve study pointed out that retaliatory tariffs issued in 2018 and 2019 have led to job losses and an increase in costs for the U.S. manufacturing industry.

Later today, economists expect wholesale inventories to rise by 0.2% on month in November. The Market News International Chicago PMI is expected to climb to 48 in December from 46.3 in November.

Economic Events to Watch Today

Let’s took at these fundamentals.


EUR/USD – Daily Analysis

The Euro jumped 0.7% to a two-week high of $1.1181, and the British pound advanced 0.6% to $1.3077. The Purchasing Manager’s Index (PMI) has pointed a moderate recovery in the growth of manufacturing production. On the other hand, the growth of services output was also somewhat modest.

According to the European Central Bank, the economic conditions have started to calm down even though the inflationary pressure remains generally muted. ECB said that inflation in Eurozone had stabilized as well though it has not softened in recent months but has shown signs of improvement slightly.

EUR/USD advanced to 10 days the highest level of 1.11882 and showed a sharp rise in its prices on Friday on the back of positive comments from ECB. The increase in prices of pair EUR/USD was also caused by the weakened U.S. Dollar that day.

The EUR/USD pair has sensitive nature towards the global growth rate, and with the emerging trade optimism around the globe from the world’s two largest economies, the trend of Euro started to follow the dynamics and moved in an upward direction on Friday.

Daily Support and Resistance

  • S3 1.0974
  • S2 1.1031
  • S1 1.1053

Pivot Point 1.1089

  • R1 1.1111
  • R2 1.1146
  • R3   1.1203

EUR/USD– Trading Tips

The EUR/USD is trading with the bullish sentiment, testing the resistance level of around 1.1215 on the 4-hour chart. The bearish breakout of this level can trigger further selling until 1.1175. Conversely, the bullish bias can lead the EUR/USD to 1.1125. Let’s wait for selling trade below 1.1215 today.  


GBP/USD– Daily Analysis

The British pound advanced 0.6% to $1.3077. There was no specific news related to Brexit, but GBP/USD pair before year-end raised its bars in the financial market on the back of the weakened U.S. dollar. Sterling increased 0.9% to $1.3117 on Friday, giving a bullish trend to the pair for 3rd consecutive day.

On the other hand, the New European Commission president, Ursula von der Leyen said in an interview on Friday that Brexit transition may not be possible by the end of next year.

This statement from the Europe side was not surprising at all. E.U. has remained doubtful that a proper trade deal can be made, but UK PM Boris Johnson has continuously insisted that the time period of 11 months was enough to get to the finish line. However, the future of the U.K. & E.U.’s relationship after Brexit has no clarity until M.P.s return to work after holidays. 

U.K. Prime Minister has a majority in U.K. Parliament now and has a smooth track for Britain’s exit from the European Union, but E.U. has argued that period for setting trade deal was not enough, and it has raised concerns in the eyes of traders.

Daily Support and Resistance

  • S3 1.2757
  • S2 1.2901
  • S1 1.2955

Pivot Point 1.3044

  • R1 1.3099
  • R2 1.3188
  • R3 1.3331

GBP/USD– Trading Tip

The GBP/USD has broken the support mark of 1.3060, and currently, this level is expected to serve as a resistance for the GBP/USD. On the downside, the GBP/USD can exhibit further selling until the next target level of 1.2940.

The RSI and MACD have now crossed over 50 and 0 zone, suggesting chances of a bearish reversal in the GBP/USD pair. Consider staying bullish above 1.2995 and bearish below 1.3100 today. 


USD/JPY – Daily Analysis

The USD/JPY lost 0.2% to 109.42. Adding in the downfall of USD/JPY that day was the weakened U.S. dollar. U.S. dollar index fell almost 0.6% to the level of 96.951 on Friday.

The increased risk factor caused the weakness of the U.S. dollar in the market after the positive sentiment around the globe related to US-China trade relations came in. The trade optimism gave investors concerns about the risk involved with it, and hence, the U.S. dollar loses its demand against other currencies before year-end.

Sine-US trade war has been weighing on the global economy for 18 months, and any positive trade news has massive effects on foreign exchange because of their direct link with international trade. 

Ahead of holidays, USD/JPY dropped amid thin volume trades in the market and less demand for the U.S. dollar.

Daily Support and Resistance

  • S3 108.56
  • S2 108.97
  • S1 109.17

Pivot Point 109.38

  • R1 109.58
  • R2 109.8
  • R3 110.21

USD/JPY – Trading Tips

The USD/JPY has already completed the 50% Fibonacci retracement around 109.050 level. Now, this level is supporting the safe-haven pair along with an immediate resistance around 109.450. The RSI and MACD are suggesting chances of further selling in the USD/JPY pair. The couple may trade bearish below 109.450 to target 108.800. 

All the best!

Categories
Forex Market Analysis

Daily F.X. Analysis, December 27 – Top Trade Setups In Forex – Weaker Dollar In-Play

On the forex front, the U.S. Dollar Index was little changed at 97.65 in thin holiday trading. The Euro edged up 0.1% to $1.1101, and the British pound gained 0.3% to $1.3001. The USD/JPY climbed 0.2% to 109.54.

The U.S. Labor Department reported that initial jobless claims fell to 222,000 in the week ended December 21 (220k expected) from 235,000 in the prior week. Today, the focus is going to be on the technical side of the market as the economic calendar remains muted. 

Economic Events to Watch Today

Let’s took at these fundamentals.


EUR/USD – Daily Analysis

The EUR/USD edged up 0.1% to $1.1101, and the British pound gained 0.3% to $1.3001. The U.S. President Donald Trump said on Tuesday that he and Chinese President Xi Jinping would have a ceremony to sign the phase-one of the trade deal reached earlier this month. 

Mr. Lowe also added that the E.U. was failing, so they rammed the Euro in. He said that Euro was destined to fail and would have collapsed by now if it was not for massive quantitative easing by ECB.

On the other hand, the macroeconomic calendar remained empty on Thursday except for the U.S. jobless claims for the previous week. The U.S. unemployment claims during last week were recorded as 222K, which came in line with the expectations. 

Daily Support and Resistance

  • S3 1.0974
  • S2 1.1031
  • S1 1.1053

Pivot Point 1.1089

  • R1 1.1111
  • R2 1.1146
  • R3   1.1203

EUR/USD– Trading Tips

The EUR/USD is trading with the slightly bearish sentiment, and it’s very likely to test the next support area around 1.1110 on the 4-hour chart. The bearish breakout of this level can trigger further selling until 1.1085. Conversely, the bullish bias can lead the EUR/USD to 1.1125 and 1.1160 resistance levels. Let’s wait for the buy trade above 1.1110 today.  


GBP/USD– Daily Analysis

The GBP/USD gained 0.3% to $1.3001. Boris Johnson has announced to make his Brexit deal as law, and in case of not reaching a trade deal with E.U. by the end of next year, then U.K. will leave E.U. without any agreement. However, it was highly unlikely because PM Johnson now holds the majority of the U.K. Parliament. 

The Parliament has already approved his deal for leaving E.U., and there are fewer chances that E.U. & U.K. will not reach a trade deal. Furthermore, PM Johnson has also said that he would make sure the departure of the U.K. from the European Union on January 31.

The British economy has been showing weaknesses for some time, and it is possible that Bank of England would start easing its monetary policy soon, which will drag the GBP/USD pair back from 1.30 level.

In the U.K., the British Banker’s Association will report November finance loans for housing (41.2 billion pounds expected).

Daily Support and Resistance

  • S3 1.2757
  • S2 1.2901
  • S1 1.2955

Pivot Point 1.3044

  • R1 1.3099
  • R2 1.3188
  • R3 1.3331

GBP/USD– Trading Tip

The GBP/USD has broken the support mark of 1.3060, and currently, this level is expected to serve as a resistance for the GBP/USD. On the downside, the GBP/USD can exhibit further selling until the next target level of 1.2940.

The RSI and MACD have now crossed over 50 and 0 zone, suggesting odds of a bullish reversal in the GBP/USD pair. Consider staying bullish above 1.2995 and bearish below 1.3100 today. 


USD/JPY – Daily Analysis

The USD/JPY fell to 109.48. This morning, official data showed that Japan’s jobless rate dropped to 2.2% in November (2.4% expected and in October), while industrial production slid 0.9% on the month (-1.0% expected). Also, retail sales grew 4.5% (+5.0% expected).

The Bank of Japan Governor Haruhiko Kuroda said on Thursday that the central bank would ease its monetary policy further without hesitation if the momentum toward its 2% inflation goal came under threat.

He also offered a brighter view of the global economic outlook and said that the Bank of Japan would not rush to change its current policy for now. After a week after Central bank kept its short term rates target at -0.1% and long-term at 0%, Kuroda said that the trend of Japan’s economy was at moderate growth.

However, the easing of global trade tensions has reduced the chances that the central bank would ease its monetary policy further. Reduction in uncertainties over the US-China trade war has played an essential role in facilitating global economic conditions.

Daily Support and Resistance

  • S3 108.56
  • S2 108.97
  • S1 109.17

Pivot Point 109.38

  • R1 109.58
  • R2 109.8
  • R3 110.21

USD/JPY – Trading Tips

The USD/JPY has already completed the 38.2% Fibonacci retracement around 109.200 level. Now, this level is supporting the safe-haven pair along with an immediate resistance around 109.350. 

The RSI and MACD are suggesting chances of further selling in the USD/JPY pair. The pair may trade bearish below 109.50 to target 109.200 and even below to 108.950 today. 

All the best!

Categories
Candlestick patterns Forex Daily Topic

Candlestick Trading Patterns V – The Long Black-bodied Candlestick

In the previous article, We talked about candles with long and white bodies and discovered how such a candle could provide us with very useful information about the hidden properties of the market situation and the psychology of its participants.

Actually, a black body in a currency pair is equivalent to a white body in the reciprocal pair. That is, the black body of the EUR/USD is the white body of the USD/EUR. In any case, in Forex, we can also operate with commodities, energy, or stock CFDs, therefore in this article, we will develop the properties and informative potential offered by the long-black candle bodies.

As we said in the article on long-white candles, the market can be described by two types of movement: impulsive movement and corrective movement. Large black-bodied candles (like the long-white candles) belong to the impulsive movement category, and as such, are indicators of a trend, in this case, a bearish one.

A black body in a topping area

As in the case of the white candle, a long black candle in a topping zone is a clear warning of the trend halt. For the warning to be stronger, the black candle must clearly be longer than the candles that preceded it. A black candle of this kind indicates that the bears have taken control.

Image 1 – The long black-bodied candle appearing after an uptrend.

In the previous image, we can see that the black body erased the gains acquired by the preceding five candlesticks showing a rush of close orders. Then, after the initial selloff, a short recovery but buyers were not able to move the price to new highs.

A long Black-bodied candle confirms resistance

If a top consolidation area appears, and, then, a black body shows up, it is an extra confirmation that the resistance area will hold, and the trend is reversing.

Image 2 – The long black-bodied candle appearing at a resistance level

On the picture above, the price topped and retraced, followed by a recovery touching but not exceeding the previous top close. Then the engulfing black body started up at the same level, but it created an exceedingly large body surpassing the previous retracement low and closing near it. That was the confirmation for bears to push the market down.

The Long Black-bodied candle breaks a support

The break of a support level by a long black candlestick is terrible news for bulls. This situation should be considered more bearish than other less evident breakouts.

Image 3 – The long black-bodied candle breaking support trendline and SMA 50-SMA

In the case of the preceding image, which corresponds to a 2H Euro Stoxx 50 chart, the large-bodied candle not only broke the ascending trend line but, also, the 50-Period SMA. This confirmation is what bears needed to move down the price.

Long Black-bodied Candle as Resistance

The top and open of a long black-bodied candle will act as resistance levels. That situation happens when the price retraces the complete impulse. According to Mr. Nison, it is more typical the retracement to stop near 50% of the candle’s body. In consequence, a typical strategy following the trend is to place a sell-short position at that level with a stop-loss level over the top of the candle.


Image 4 – The top of a black-bodied candle as a resistance

Conclusions

A large black body is a clear indication of a bear trend, especially if it appears at previous tops or resistance areas. We should always pay attention to a black body and analyze the implications of it in terms of market sentiment, and also its meaning as a new resistance area. Finally, from the point of view of a price-action trader, large black bodies are an opportunity to open a position with the trend, after waiting for a pullback. Not always the pullback will happen, but when it does, it is a low-risk place to create a short entry.


Categories
Forex Market Analysis

Dramatic Dip in Crude Oil – Bullish Channel Breakout 

During the European session, the WTI crude oil prices were unchanged near the 3-months highs due to optimism surrounding the United States and China trade deal that has left an impact on the oil demand as well as the global economic growth outlook.

The WTI crude oil has dropped dramatically from 61.01 to 60.35 level upon the bearish breakout of the bullish channel and bearish fundamentals. 

It should be noted that the improvement in an 18-months trade war between the United States and China, the world’s two biggest oil consumers, had raised expectations for higher energy demand next year.

China on Thursday declared a list of import tariff exemptions for six oil and chemical products from the United States, days after the world’s two largest economies announced an incomplete trade deal. 

As a result, U.S. Oil is facing intense bearish pressure. What’s next? The technical side of the market is likely to extend support around 60.30, and below this, the black crack can drop until 59.65 support zone. 


Daily Support and Resistance

  • S3 59.65
  • S2 60.35
  • S1 60.71

Pivot Point 61.04

  • R1 61.4
  • R2 61.74
  • R3 62.44

The RSI and MACD have entered the selling zone, and demonstrate strong bearish bias among traders. As we can also see, the upward channel which supported the oil around 61 has already been violated, and now 61 is likely to work as resistance for crude oil. Consider trading bearish below 60.74 today and buying above 59.65. All the best!

Categories
Forex Market Analysis

Daily F.X. Analysis, December 20 – Top Trade Setups In Forex – GDP Figures in Highlights! 

On the forex front, the British pound slid 0.5% to a two-week low of $1.3017, posting a three-day decline. Official data showed that U.K. retail sales dropped 0.6% on month in November (+0.2% estimated), falling for a fourth straight month–the worst run since 1996. On the other hand, the Bank of England held its benchmark rate at 0.75% unchanged as expected.

The European Commission will release the eurozone’s December Consumer Confidence Index (-7.0 expected). In Germany, the GfK Consumer Confidence Index for January will be published (9.8 expected).

Economic Events to Watch Today

Let’s took at these fundamentals.


EUR/USD – Daily Analysis

The EUR/USD pair exhibit bearish bias to hit the low level of 1.1117 from the Tuesday high of 1.1175 ahead of United States data release. At the moment, the EUR/USD pair is currently trading at 1.1116 and consolidates in the range between the 1.1114 – 1.1126. The pair has dropped but still staying inside the one-week-old symmetrical triangle.

The EUR/USD currency pair’s weekly candle now has a long upper shadow, which is a significant clue of bulls losing steam above the resistance of the trendline dropping from September 2018 and June 2019 highs.

The currency pairs trendline resistance is currently seen at 1.1148. The pair had increased to a high of 1.1175 previously but dropped again below 1.1148 on the next day. As a result, the consecutive failure of buyers to beat the convincing break above the trendlines has supported the negative risks, which may increase if the United States data ignore past expectations. The data is scheduled to release today.

If the personal spending and Core PCE release unexpectedly come out better, they will validate the Federal Reserve’s recent decision to pause the rate cuts and push the greenback higher.

On the other hand, a big miss may fuel the greenback sell-off. Looking forward, the EUR/USD currency pair will turn bullish mainly if the pair beats the weekly close above the trendline hurdle at 1.1148.


Daily Support and Resistance

  • S3 1.1108
  • S2 1.1112
  • S1 1.1114

Pivot Point 1.1116

  • R1 1.1118
  • R2 1.112
  • R3 1.1124

EUR/USD– Trading Tips

On Friday, the EUR/USD continues to trade mostly sideways, while investors await the U.S. GDP figures. The EUR/USD is trading with slightly bearish sentiment, and it’s very likely to test the next support area around 1.1110 on the 4-hour chart

The bearish breakout of this level can trigger further selling until 1.1085. Conversely, the bullish bias can lead the EUR/USD to 1.1125 and 1.1160 resistance levels. Let’s wait for the sell trade below 1.1110 today. 


GBP/USD– Daily Analysis

The GBP/USD currency pair hit the bullish track and recovered to 1.3020, mainly due to optimism surrounding the Brexit due to the voting on the United Kingdom Prime Minister Boris Johnson’s WAB. As of writing, the GBP/USD currency pair is currently trading at 1.3022. The GBP/USD traders seem confident ahead of the House of Commons voting on the UK PM’s Brexit bill.

The European Union Withdrawal Agreement Bill (WAB) will allow the United Kingdom to leave the European Union on January 31 while it’s also arranging the stage for no transition period beyond December 2020. The bill will also allow more British judges to leave from the previous rulings of the European Union’s top court.

The U.K. Office for National Statistics will release final readings of third-quarter GDP (+1.0% on-year expected), current account (15.5 billion pounds deficit expected), and November public sector net borrowing excluding banking groups (6.1 billion pounds expected).

The voting result will be released at 15:00 GMT on Friday. Traders will likely watch the final figures of the United Kingdoms’ 3rd-quarter Gross Domestic Product (GDP) for new directions. According to the forecast, there will no change in the GDP figures on QoQ and YoY basis that are 0.3% and 1.0%, respectively.

Daily Support and Resistance


  • S3 1.2757
  • S2 1.29
  • S1 1.2955

Pivot Point 1.3044

  • R1 1.3098
  • R2 1.3188
  • R3 1.3331

GBP/USD– Trading Tip

The GBP/USD has broken the support mark of 1.3060, and currently, this level is expected to serve as a resistance for the GBP/USD. On the downside, the GBP/USD can exhibit further selling until the next target level of 1.2940.

The RSI and MACD have now crossed over 50 and 0 zone, suggesting odds of a bullish reversal in the GBP/USD pair. Consider staying bullish above 1.2995 and bearish below 1.3100 today. 


USD/JPY – Daily Analysis

The USD/JPY closed at 109.366 after placing a high of 109.685 and a low of 109.180. Overall the trend for USD/JPY on Thursday remained bearish after the Bank of Japan kept its rates unchanged on Thursday at minus -0.1% the pair USD/JPY dipped in the financial market. 

The BOJ voted 7 to 2 to keep its short-term interest rates at -0.1% and the long-term rates at 0%. According to the Central Bank of Japan, the economy was likely to continue on a moderate expanding trend. The impact of the global economic slowdown on domestic demand was expected to be limited in the future. Although the fears of global economic slowdown still prevail in the market.

Recently, the government of Japan implemented a $122B fiscal stimulus package to aid economic growth. Japanese debt levels highly criticized this idea, but it was a wise decision as the government implemented a consumer tax hike after that.

The global economic outlook was raised after the phase-one deal between the U.S. & China and the victory of Johnson in Britain elections. Bank of Japan revised its GDP forecast for next year to 1.4% from the previous prediction of 1.2%.

The positive gestures and statements in Bank of Japan’s monetary policy statement on Thursday weighed on USD/JPY prices.

Adding in the downward trend of pair USD/JPY was the U.S. economic data that day. At 18:30 GMT, the Current Account Balance for the 3rd Quarter of the U.S. declined to -124B from -122B expectations. The Unemployment claims from last week surged to 234K from expected 225K. The C.B. Leading Index also fell to 0.0%, and the Existing Home Sales dropped to 5.35M from 5.44M of expectations.

On the other hand, the U.S. House of Representatives voted in favor of passing the impeachment of Donald Trump and made him third U.S. president to be impeached. However, the U.S. Senate of Republicans is still to vote on this, and it is expected that they will not vote against Trump.

Daily Support and Resistance    

  • S3 108.56
  • S2 108.97
  • S1 109.17

Pivot Point 109.38

  • R1 109.58
  • R2 109.79
  • R3 110.21

USD/JPY – Trading Tips

The USD/JPY has already completed the 38.2% Fibonacci retracement around 109.200 level. Now, this level is supporting the safe-haven pair along with an immediate resistance around 109.350. 

The RSI and MACD are suggesting chances of further selling in the USD/JPY pair. The pair may trade bearish below 109.50 to target 109.200 and even below to 108.950 today. 

All the best!

Categories
Forex Market Analysis

Gold’s Ascending Triangle Intact – Investor Awaits Fundamentals! 

On Thursday, the precious metal gold prices inched up to trade around 1,476 after the U.S. House of Representatives chose to challenge President Donald Trump on articles of misuse of authority and obstruction of Congress.    

Impeachment is a two-way process where the removal of a sitting president is decided. In the first stage, the majority of the Democrats will be needed to support the move. If that passes, then a trial would be held in U.S. Senate, which will be dominated by Republicans. 

For that, 2-3rd would have to vote in favor, which is highly unlikely to happen. But if it did happen, Donald Trump would be forced from the White House.

The U.S. Dollar Index advanced to a fresh weekly high near 97.50, which also helped gold prices to gain a slightly bullish trend. Lack of any macroeconomic data left the movement of pair XAU/USD dependant on the technical changes and political news. 

On Friday, the Bureau of Economic Analysis will publish the Q3 Gross Domestic Product (GDP) along with the Personal Consumer Expenditures (PCE) Price Index. 

Gold – XAU/USD – Daily Technical Levels

Support   Resistance 

1,460.28   1,483.1

1,450.74   1,496.37

1,427.92   1,519.18

Pivot Point 1,473.55

Technically, the yellow metal gold has extended an ascending triangle pattern, which is holding the XAU/USD sustained above 1,470 level. A bearish violation of this level of 1,470 can drive additional selling until 1,462. However, no vital drift isn’t anticipated until the release of UoM Consumer Sentiment on Friday. On the upper side, 1,480 is likely to be the resistance for gold. Good luck! 

Categories
Forex Market Analysis

Daily F.X. Analysis, December 19 – Top Trade Setups In Forex – Brace for BOE Interest Rate

The U.S. Dollar Index was up for a second day, rising 0.2% to 97.40. The British pound lost 0.3% to $1.3085. Official data showed that U.K. core CPI grew 1.7% on year in November (as expected). On the other hand, the Bank of England is expected to keep its benchmark rate at 0.75% unchanged later today. Also, November retail sales will be reported (+0.2% on month estimated).

The euro dropped 0.3% to $1.1115. The German Ifo Business Climate Index climbed to 96.3 in December (95.5 expected) from 95.1 in November.

Later today, the U.S. Labor Department will report initial jobless claims for the week ending December 14 (225,000 expected, 252,000 in the prior week). Existing home sales are expected to slightly decrease to an annualized rate of 5.44 million units in November (5.46 million units in October).

Economic Events to Watch Today

Let’s took at these fundamentals.


EUR/USD – Daily Analysis

The EUR/USD currency pair flashing green and hit the bullish track from the average support and picked up some buying mainly due to greenback weakness. Although, the currency pair did not beat the 200-day Moving Average so far. As of writing, the EUR/USD currency pair is currently trading at 1.1126 and representing 0.14% gains. By the way, the pair is now consolidating in the range between the 1.1113 – 1.1133.

President Donald Trump was accused by the U.S. House of Representatives on Wednesday night for the abuse of power. The House also approved a 2nd-charge that Trump obstructed a Congress investigation. The greenback came under pressure after the impeachment news hit the wires. 

It should be noted that the declines in the greenback were modest and will likely be reversed during Europe as the Senate, which is controlled by Trump’s Republican Party, possibly absolve to him of all charges. Moreover, the chances of Donald Trump vacating office are low. Looking forward, the Senate trial will likely start in January. 

With the German economy showing indications of bottoming out and heading into New Year with more confidence, there seem fewer chances that EUR traders will pick up the selling trend.

From a technical perspective, the currency pair is currently trading in no man’s land. A close above the 200-day average at 1.1151 is needed to revive the short-term bullish setup. On the flip side, a break below Wednesday’s low of 1.1115 would imply a short-term bearish reversal. 


Daily Support and Resistance

  • S3 1.1117
  • S2 1.1121
  • S1 1.1124

Pivot Point 1.1126

  • R1 1.1128
  • R2 1.113
  • R3 1.1134

EUR/USD– Trading Tips

Technically, the EUR/USD traded mostly sideways ahead of CPI, and German Business Climate figures. The EUR/USD is trading with a slightly bearish bias, and it’s very likely to test the bullish trendline on the 4-hour chart. The bullish trendline is expected to support the EUR/USD above 1.1125. Continuation of a bullish bias over 1.1125 can hold EUR/USD bullish unto 1.1160 and 1.1185. The EUR/USD’s next support lingers around 1.1095 today,


GBP/USD– Daily Analysis

The GBP/USD currency pair still found under pressure and hit the weekly lows despite the greenback weakness and waiting for fresh clues from the United Kingdom data/events which are scheduled to be released. As of writing, the GBP/USD currency pair is currently trading at 1.3081 and consolidates in the range between 1.3072 – 1.3091.

At the USD front, the greenback showed a broad-based weakness mainly due to the House Representatives, which voted to impeach President Trump. The House also approved a 2nd-charge that Trump obstructed a Congress investigation. Moreover, the ball will meet the Senate someday during early January for the opposition Democrats to make Donald Trump as the 3rd in the history to get impeached.

The GBP currency traders will keep their eyes on the November month Retail Sales ahead of the monetary policy meeting of the Bank of England and the British Queens speech setting out the Conservative government’s agenda for the coming year. The trader will also carefully observe the U.S. Philadelphia Fed Manufacturing Survey, Existing Home Sales, and Weekly Jobless Claims.

For now, BOE is likely to keep the rate unchanged at 0.75%. However, the markets are pricing a 65% probability of a rate cut by May 2020. 

Daily Support and Resistance

  • S3 1.295
  • S2 1.3019
  • S1 1.3049

Pivot Point 1.3089

  • R1 1.3118
  • R2 1.3159
  • R3 1.3229

GBP/USD– Trading Tip

The GBP/USD is trading with a slightly bullish bias now above 1.3178 as the pair has violated the 61.8% Fibonacci retracement level of 1.3240. Below the same mark, the 50 periods EMA is likely to provide resistance to the GBP/USD. 

The RSI and MACD are holding in the oversold zone, suggesting odds of a bullish reversal upon completion above the double bottom support level of 1.3095. Today, consider taking buying trades above 1.3100 and bearish trades below 1.3178. 


USD/JPY – Daily Analysis

The USD/JPY currency pair dropped from the weekly high after the United States House of Representatives voted to impeach President Donald Trump. As of writing, the USD/JPY currency pair s currently trading at 109.60 even after the status quo BOJ and remains stuck in the same range between the 109.56 – 109.59.

The Bank of Japan (BOJ) maintained the short-term interest rate at -0.1 and kept the 10-year yield target unchanged around 0%, as expected. The risk-off sentiment is expected to remain ahead. The United States’ ten-year treasury yields fell to 1.90%, whereas the S&P 500 Futures also decreases.

Looking forward, traders will keep their eyes on the monetary policy decision by the Bank of Japan (BOJ). Ahead of the releases, analysts at T.D. Securities said, “The Bank Of Japan will continue its last meeting of the year. This should move with little fanfare because the BOJ has made the necessary changes in October.


Daily Support and Resistance

  • S3 109.07
  • S2 109.3
  • S1 109.43

Pivot Point 109.53

  • R1 109.66
  • R2 109.76
  • R3 109.99

USD/JPY – Trading Tips

From the technical perspective, a breakout, if confirmed, would imply a resumption of the rally from the December low of 108.46 and may yield a rally to 110.00. On the flip side, range breakdown will likely allow a re-test of support at 109.20-109.00. 

On the technical side, the USD/JPY consolidates below 109.700 resistance level.

The 38.2% Fibonacci retracement level is supporting the USD/JPY pair around 109.200 level. While the RSI and MACD are suggesting chances of further selling in the USD/JPY pair. The pair may trade bearish below 109.53 to target 109.200 today. 

All the best!

Categories
Forex Market Analysis

WTI Crude Oil Slipped Amid Rising Crude Inventories – Quick Trade Plan! 

The WTI crude oil prices are flashing red and traded lower after the American Petroleum Institute reported a large build of weekly crude inventories. The WTI crude oil inventories increased by 4.7 million barrels in its snapshot of stockpiles for the week ended December 13, the API said.

The U.S. government data is anticipated to point a drop of 1.3 million barrels while the Energy Information Administration(EIA) publishes its weekly figures.

In the previous week, the EIA announced the advance of a crude stock of 822K barrels versus a market forecast for a dip of 2.76 million barrels.

The WTI crude oil prices got some benefit earlier in the day after data showed U.S. November manufacturing output and housing figures both outperformed expectations.

It should be noted that the declines in crude oil prices have been limited due to Sino-US trade optimism. A phase-one trade deal was agreed between the United States and China last week, decreasing some fears over the economic impact of a continued dispute between the two biggest crude oil importers. 

Technically, the WTI is trading in a bullish channel, which is supporting it around 60.20, while the same bullish channel is likely to resistance around 62.22. 

On the way to upside, the WTI crude oil may find a horizontal resistance level around 61 while the RSI and MACD are suggesting bearish bias. Lately, the crude oil has formed a series of neutral candles which exhibits indecision among traders.

Daily Support and Resistance

  • S3 58.49
  • S2 59.48
  • S1 59.97

Pivot Point 60.47

  • R1 60.96
  • R2 61.46
  • R3 62.45

Consider taking buying trade above 60.20 to target 60.50, and above this, the WTI may soar to test 61.10. Good luck! 

Categories
Forex Market Analysis

Daily F.X. Analysis, December 18 – Top Trade Setups In Forex – Eyes On UK CPI!

On the forex front, the British pound plunged 1.6% to $1.3122, wiping out its gains since the election day last Thursday. Media reported that U.K. Prime Minister Boris Johnson might amend the withdrawal agreement bill to block any further extension of Brexit. Hence the prospect of a no-deal Brexit is still on the table.

Also, the U.K.’s official data showed that the jobless rate for the three months to October was steady at 3.8% (3.9% expected). Later today, investors will focus on U.K. consumer inflation data for November (CPI +1.4% on year expected).

Economic Events to Watch Today

Let’s took at these fundamentals.


EUR/USD – Daily Analysis

The EUR/USD currency pair remains in the red territory and hits the strong bearish track after got repeated rejection to cross the 200-day Moving Average resistance. As of writing, the currency pair is currently trading at 1.1133, representing a 0.14% declines on the day and consolidates in the range between 1.1131 – 1.1155.

The EUR/USD pair hit the high level of 1.1155 but failed to beat the 200-day Moving Average resistance. Looking forward, the currency pair will likely pick up further selling trend if the German data disappoints expectations, whereas if the German data beats expectations figures, the currency pair can beat the 200-day Moving average.

It should also be noted that the buyers failed to secure a daily close above the long-term average for the 4th-straight day on Tuesday because the range between the United States and German ten-year bond yields increased nearly 5-basis points to 218 basis points.

Looking ahead, the German IFO survey, scheduled to release at 09:00 GMT, is expected to show the expectations index increased to 93.0 in December from 92.1, according to the latest survey of analysts. 

As we recently mentioned that an above-forecast figure is needed to confirm last week’s ZEW survey, which showed the German economy has bottomed out and draws bids for the EUR currency. Moreover, an upbeat on expectations will likely yield a move above the 200-day MA at 1.1151.

The European Central Bank’s President, Lagarde, is scheduled to speak at 08:30 GMT. Lagarde is unlikely to sound dovish and will likely repeat the need for fiscal stimulus. 

Daily Support and Resistance

  • S3 1.1062
  • S2 1.1107
  • S1 1.113

Pivot Point 1.1153

  • R1 1.1176
  • R2 1.1198
  • R3 1.1243

EUR/USD– Trading Tips

Technically, the EUR/USD traded mostly sideways ahead of CPI, and German Business Climate figures. The EUR/USD is trading with a slightly bearish bias, and it’s very likely to test the bullish trendline on the 4-hour chart. The bullish trendline is likely to support the EUR/USD above 1.1125. Continuation of a bullish bias over 1.1125 can hold EUR/USD bullish unto 1.1160 and 1.1185. The EUR/USD’s next support lingers around 1.1095 today,


GBP/USD– Daily Analysis

The GBP/USD currency pair flashing red and hit the four-day lows of 1.309 down -0.30% on the day. The currency pair continues its bearish streak and still under pressure. That is mainly due to hard Brexit fears intensified after UK PM Johnson’s confirmed to the parliament that his office planned to ensure by law that the U.K.’s post-Brexit departure period will end in Dec 2020. 

As of writing, the GBP/USD currency pair is currently trading 1.3102 and consolidates in the range between the 1.3072 – 1.3135.

It should be noted that the departure uncertainty regarding Brexit was always considered as the risk faced by the GBP currency, but it was priced in sooner than anticipated. As a result, the soft Brexit premium is currently being priced out of GBP, and buyers have been sent back from the buying track.

At the greenback front, the U.S. Dollar (USD) benefited from the upbeat industrial production and housing market numbers along with the welcome comments from the Federal Reserve (Fed) officials. The greenback also got the support of trade-related positive statements from the Treasury Secretary Steve Mnuchin and Trade Representative Robert Lighthizer.

Looking forward, the GBP buyers will closely observe the November month inflation data, whereas the Fed speak will likely offer additional hints. In this regard, T.D. Securities said, “We look for CPI to edge a touch lower to 1.4% y/y in November (market 1.5%). Underlying this, we expect core CPI to hold unchanged at 1.7% y/y (market 1.6%) for the 3rd-month in a row. 


Daily Support and Resistance 

  • S3 1.2774
  • S2 1.2976
  • S1 1.3054

Pivot Point 1.3178

  • R1 1.3256
  • R2 1.338
  • R3 1.3581

GBP/USD– Trading Tip

The GBP/USD is trading bearish below 1.3178 as the pair has violated the 61.8% Fibonacci retracement level of 1.3240. Below the same mark, the 50 periods EMA is likely to provide resistance to the GBP/USD. 

The RSI and MACD are holding in the oversold zone, suggesting odds of a bullish reversal upon completion above the double bottom support level of 1.3095. Today, consider taking buying trades above 1.3100 and bearish trades below 1.3178. 


USD/JPY – Daily Analysis

The USD/JPY closed at 109.472 after placing a high of 109.632 and a low of 109.441. Overall the trend for USD/JPY pair remained bearish that day.

On the data side, at 2:00 GMT, the U.S. Department of the Treasury published the TIC Long-Term Purchases for October, and it showed a decline to 32.5B from expected 52.2B and weighed on U.S. dollar.

The Building Permits from the United States showed growth in November when released at 18:30 GMT. In the previous month, it was expected that 1.41M building permits would be issued. Still, according to the reports, the number of actual building permits in November exceeded the expectations and came in as 1.48M to support the U.S. dollar.

The number of U.S. residential buildings that began construction during November also exceeded the expectations and supported the U.S. dollar on Tuesday. It was expected that 1.34M house buildings would start its construction, but in actual 1.37M, housing starts.

At 19:15 GMT, the Capacity Utilization Rate from Federal Reserve was published, which showed that 77.3% of available resources were being utilized during November. The expected figure was almost the same 77.4% and did not affect the U.S. dollar. However, Industrial Production from the United States for November also increased to 1.1% from expected 0.8% and supported the U.S. dollar.

At 20:00 GMT, the JOLTS Job Openings for October showed growth to 7.27M from the expected 7.01M and supported the U.S. dollar. And at 20:01 GMT, the IBD/TIPP Economic Optimism for the month of December was surged to 57.0 from forecasted 54.2 and supported U.S. dollar on Tuesday.

Daily Support and Resistance

  • S3 109.14
  • S2 109.34
  • S1 109.42

Pivot Point 109.53

  • R1 109.62
  • R2 109.72
  • R3 109.92

USD/JPY – Trading Tips

On the technical side, the USD/JPY consolidates below 109.700 resistance level. The same level marks a triple top pattern has the USD/JPY faced a hard time violating it back on Dec 1, 13, and 16. 

The 38.2% Fibonacci retracement level is supporting the USD/JPY pair around 109.200 level. While the RSI and MACD are suggesting chances of further selling in the USD/JPY pair. The pair may trade bearish below 109.53 to target 109.200 today. 

All the best!

Categories
Forex Market Analysis

Daily FX. Analysis, December 17 – Top Trade Setups In Forex – Eyes on UK Labor Market Figures! 

On Tuesday, the market trades with a risk-off sentiment as investors are still waiting for clarity about Brexit and Trade deal between the U.S. and China. The U.S. dollar was steady against other major currencies, with the ICE Dollar Index closing flat on the day at 97.15.

China’s official data showed that industrial production rose 6.2% on year in November (+5.0% expected), and retail sales grew 8.0% (+7.6% expected).

Economic Events to Watch Today

Let’s took at these fundamentals.


EUR/USD – Daily Analysis

Today in the early Asian session, the EUR/USD currency pair flashing green and trading on the bullish track but failed to cross the 200-day moving average despite the fresh trade truce between the United States and China. The EUR/USD is presently trading at 1.1147, having faced rejection at the 200-day Moving Average at 1.1152. 

However, the EUR currency has repeatedly failed to close above the 200-day MA. For example, the Euro currency picked up a strong buying on Friday and climbed to a high of 1.12 only to end the day with moderate losses at 1.1118. 

Regarding U.S. economic data, the Empire Manufacturing Index posted 3.5 for December (below the 4.0 expected, up from 2.9 in November). The Markit U.S. Manufacturing Purchasing Managers Index (preliminary reading) declined slightly to 52.5 in December (below 52.6 expected) from 52.6 in November.

The monthly United States Housing Starts and Building Permits are scheduled for release at 13:30 GMT on Tuesday. The Eurozone Trade Balance (Oct), scheduled for release at 10:00 GMT, is unlikely to move markets. 

Daily Support and Resistance

  • S3 1.1079
  • S2 1.1111
  • S1 1.1127

Pivot Point 1.1143

  • R1 1.1159
  • R2 1.1175
  • R3 1.1207

EUR/USD– Trading Tips

Just like the rest of the forex pairs, the EUR/USD hasn’t made much progress on Monday despite a mixture of PMI data. The EUR/USD is trading with a slightly bullish above the bullish trendline, which is supporting the EUR/USD above 1.1125. Extension of a bullish bias above 1.1125 can keep EUR/USD optimistic until 1.1160 and 1.1185. The EUR/USD’s next support prevails around 1.1095 today,


GBP/USD– Daily Analysis

The GBP/USD currency pair flashing red and representing more than 60 pips decline to 1.3265, having hit the low of 1.3236 during the Asian trading hours. The bearish bias came mainly due to hard Brexit fears. As of writing, the GBP/USD currency pair is currently trading at 1.3295 and consolidates in the range between the 1.3236 – 1.3339. Looking ahead, the GBP/USD pair could come under pressure due to fresh Brexit concerns.

It should be noted that the victory of conservatives will help the United Kingdom Prime Minister Boris Johnson to pass the Bill to rule out European Union transition beyond 2020. The Departure Agreement Bill (WAB) is widely expected to be put for a 2nd reading in the House of Commons on this Friday.

Whereas, the Conservatives leader Boris Jonhson will not hesitate to repeat his promise regarding leave the region with deal or without a deal before 2020 ends. Despite that, the United Kingdom Prime Minster has repeatedly promoted the idea of the Canda-style free trade agreement, and UK PM will likely push for the same after the Bill gets the Parliaments’ approval.

Comments came from Robert Peterson that the PM Boris Johnson is committed to passing the Tory manifesto commitment to end the transition in just over a year from now. 

Looking forward, investors will seek more hints of the recent declines in the GBP from the political headlines. However, the traders will keep their eyes on the releases of the UK employment figures. A busy week of the UK calendar is worth watching ahead of the Bank of England policy meeting on Thursday. The consensus is for the unemployment rate to tick up to 3.9%, whereas wages growth eases a little to 3.4% YoY,” says Westpac ahead of the data release.

Daily Support and Resistance 

  • R3: 1.3722
  • R2: 1.3548
  • R1: 1.3441

Pivot Point 1.3374

  • S1: 1.3267
  • S2: 1.32
  • S3: 1.3025

GBP/USD– Trading Tip

The GBP/USD is trading bearish below 1.3362 as the pair seems to go for a retracement until 1.3240, which marks a 61.8% Fibonacci level. At the same mark, the 50 periods EMA is likely to support the GBP/USD. 

The RSI and MACD are holding in the buying zone, suggesting odds of a bullish reversal upon completion of 61.8% Fibonacci retracement. Today, consider taking buying trades above 1.3190 and bearish trades below 1.3274. 


USD/JPY – Daily Analysis

The USD/JPY currency pair is struggling to extend its recovery rally because the markets want more clarity about the fresh optimism surrounding the phase-one trade deal and Brexit concerns. As of writing, the USD/JPY currency pair is currently trading at 109.56 and consolidates in the range between 109.50 – 109.63. 

Even after the fresh trade truce of the Sino-US Phase-one deal, the United States and China trade relationships are still being termed as noisy ceasefire by the South China morning post.

On the other hand, ITV’s Robert Peterson thinks the risk of hard Brexit because the United Kingdom’s (UK) Prime Minister (PM) will soon forward the Bill that supports no transition delay beyond 2020.

Moreover, the risk tone gets heavier because the United States’ ten-year treasury yields decline to 1.87%, whereas the S&P 500 Futures losses 0.14% to 3,193 by the press time.

Apart from the trade/Brexit headlines, monetary policy meetings by the Bank of Japan (BOJ) and headline inflation will also entertain momentum traders during this week. Whereas the BOJ is not expected to change the current monetary policy, appreciation of the latest fiscal measures will likely support the Japanese yen (JPY) to strengthen further on Thursday. Moreover, Friday’s inflation data will probably keep exerting downside pressure on the Japanese currency.

The currency pair ignored the sluggish activity data from the United States during the Monday as risk-on sentiment increased due to optimism surrounding the United States and China trade deal. Looking forward, today’s United States Industrial Production, Fed speak, and housing market data can offer immediate direction to the pair movement.

Daily Support and Resistance

  • S3 108.91
  • S2 109.22
  • S1 109.39

Pivot Point 109.53

  • R1 109.7
  • R2 109.84
  • R3 110.15

USD/JPY – Trading Tips

On the technical side, the buyers await a clear break of the monthly high surrounding 109.75 to target 110.00 and May month high near 110.70. Meanwhile, 21-day Exponential Moving Average (EMA) near 109.00 holds the key to fresh declines towards the 108.45/40 support area.

The pair is heading towards the double top resistance level of around 109.700. Below this, the USD/JPY is likely to show a bearish correction of up to 38.2% level, which stays at 109.200. On the higher side, the bullish breakout of USD/JPY can lead the Japanese pair towards 110.300. The MACD and RSI are in support of the bullish trend. 

All the best!

Categories
Forex Price-Action Strategies

It’s Not Only the Levels, but It’s also about Zones

We keep talking about support, resistance, and their levels. Sometimes we forget that it is not only about the levels. A lot depends on their zones. No doubt, in the end, we are to calculate their levels at the time of taking an entry. However, we are to keep an eye at the zones where the price may create a new trend. In this article, we are going to demonstrate an example of that.

This is a daily chart. The chart shows that the price upon finding very strong support heads towards the upside. It may have found its resistance as well, which pushes the price towards the downside. Take note that the level of support is extremely strong, which creates a secure buying zone.

The price tried to find its support at the last swing high. However, it breaches the level and comes further down. It produces an Inside Bar. It looks good for the sellers so far. Let us proceed to the next chart to find out what the price does.

The price consolidates with several candles. Look at the last candle. This is an engulfing candle which states that buyers on the minor time frames are confident enough to push the price towards the North. The resistance is far enough. Thus the daily-H4 chart traders are to flip over to the H4 chart to find out a long opportunity.

This is the H4 chart. The chart produces a Spinning Top. A bullish reversal candle, along with a breakout at the resistance, will be the signal to go long. Let us find out from the next chart whether it consolidates more or produces the bullish reversal candle.

It produces an H4 bullish engulfing candle as the reversal candle. It has an upper wick, but the body looks good enough to attract the buyers. A long entry may be triggered right here. Let us find out how the price heads with the bull. Do not forget it may go another way around, as well.

It goes towards the buyers’ desired direction. The buying pressure has been good as well. However, the last candle comes out as a bearish engulfing candle. It may be time for the buyers to close their entry.

The Bottom Line

We have demonstrated an example that the price creates a new trend, not right from the last level of support. It instead creates it from a support zone. Traders are to keep an eye on the price action around the support/resistance zone to be able to find out more entries.

Categories
Forex Price-Action Strategies

Risk-Reward and Its Impact on the Price Behavior

Risk-reward is an essential factor in price action trading. When the price makes a breakout and produces a signal, the first thing traders are to calculate is risk-reward. It does not matter how the price heads towards a direction, significant higher high and lower low are to be calculated. These are what determine risk-reward. In today’s lesson, we are going to demonstrate an example of how risk-reward may have an impact on the market.

The above chart is a daily chart, in which the price action produces a Double Top along with an Inside Bar, and its neckline is not too far. The sellers are to wait for a breakout at the neckline and go short on the pair. Let us flip over to the H4 chart.

The H4 chart produces an Inside Bar as well as the reversal candle. However, the price heads towards the neckline with good bearish momentum. If the price makes an H4 breakout, the sellers may go short up to the last swing low on the H4 chart. The daily support, however, lies a bit further down.

The price is right at the neckline level. It is at a critical level since the last candle closes right at the neckline level. It could go either way from here. Let us see which way it heads.

A massive breakout takes place here. However, look at the last swing low. The price is adjacent to it. This means risk-reward is not lucrative at all. Traders must not sell from here on this chart.

It makes a breakout, which is fantastic. However, the black marked level is daily support. The sellers may take a short entry from here, but that is on the H4-H1 chart combination.

As expected, the price heads towards the daily support, and it produces a bullish reversal candle. It made such a strong bearish move, but the daily-H4 chart combination traders have not found any entry because of the risk-reward issue. If the daily-H4 combination chart traders found an entry, the bearish move would have been more consistent. Let us find out what happened next.

The price heads towards the level sellers were waiting for the price to make a breakout at first. This one is another inconsistent move on this chart. That means an inconsistent move may bring another inconsistent one. To sum up, we could conclude by saying that the risk-reward factor may make the price inconsistent to some extent.

Categories
Forex Market Analysis

Daily F.X. Analysis, December 13 – Top Trade Setups In Forex – Borish Johnson’s Takes a Lead! 

Welcome to the last trading day of a week. The British Pound surged 2.1% to a six-month high of $1.3474. U.K. exit polls predicted that Prime Minister Boris Johnson’s Conservative party would win a majority in the House of Commons.

The euro advanced 0.5% to $1.1184. While the European Central Bank kept its monetary policy unchanged as expected, President Christine Lagarde said there are some indications of stabilization in the slowdown in the Eurozone’s growth and downside risks are less pronounced.

Economic Events to Watch Today

Let’s took at these fundamentals.


AUD/USD – Daily Analysis

The AUD/USD currency pair flashing green and hit the fresh one-month highs closer to the 0.690 levels. The AUD/USD currency pair is trading at 0.6909 and consolidates n the range between 0.6867 – 0.6910. The AUD/USD did not take any effect from the greenback strength and had continued its bullish rally.

The buying tone surrounding the China-proxy Aussie seemed rather unaffected by persistent risk regarding a phase one trade deal ahead of the December 15 deadline for the new U.S. tariffs on around $156 billion worth of Chinese imports.

At the Sino-US front, the U.S. President Donald Trump is yet to decide on the December 15 tariffs, though optimism continues on the back of news that negotiators were laying the groundwork for a preliminary deal to end the trade war.

Looking forward, Thursday’s U.S. economic docket, featuring the release of the Producer Price Index (PPI), will likely influence the USD price dynamics and produce some short-term trading opportunities during the early North-American session.

Daily Support and Resistance 

  • R3 0.7038
  • R2 0.6977
  • R1 0.6953

Pivot Point 0.6915

  • S1 0.6891
  • S2 0.6854
  • S3 0.6793

AUD/USD– Trading Tips

The AUD/USD pair is hanging around 0.6900, trading mostly bullish despite staying in the overbought zone. The traded higher further above the 0.6865 mark, the 61.8% Fibo retracement level of its November slide. In the 4-hour chart, the 20 SMA has hastened north over the bigger ones, all of them under the current mark. In contrast, the technical indicators lead to the north in overbought territory, without indications of bullish exhaustion. The rally is set to remain on a break over 0.6930, the next resistance.


GBP/USD– Daily Analysis

The British Pound surged 2.1% to a six-month high of $1.3474. U.K. exit polls predicted that Prime Minister Boris Johnson’s Conservative party would win a majority in the House of Commons.

The British Pound advanced piercingly overnight following the Conservative Party of Boris Johnson, who won a substantial majority in the General Election, and while the GBP has found a temporary resistance. Fundamentally, I do see the potential for further gains after sterling completes the bearish retracement. 

Besides this, the focus is on trade wars whereby an official announcement is expected to come from U.S. President Donald Trump. Bloomberg reported in recent trade that Trump would meet with his trade advisers at 19:30 GMT. U.S. Trade Representative Robert Lighthizer, White House economic adviser Kudlow and Treasury Secretary Mnuchin are expected to attend the meeting.

The latest reports are that the United States has considered offering a 50% reduction on $360 billion worth of Chinese imports, which raised market spirits, fulling higher benchmarks and gave an increase in U.S. Treasury bond yields. 

Daily Support and Resistance

  • S3 1.2969
  • S2 1.3071
  • S1 1.3133

Pivot Point 1.3173

  • R1 1.3235
  • R2 1.3276
  • R3 1.3378

GBP/USD– Trading Tip

The GBP/USD is presently consolidating around at1.3457, placing around 19-month high to 1.3515 during the U.S. session yesterday. The U.K. election exit polls foretelling a big win for the incumbent Prime Minister Boris Johnson. 

The GBP/USD pair’s 14-day relative strength index (RSI) is now floating around 80.47. I must say it’s the highest mark since January 2018. An above 70-reading shows overbought situations. Consider capturing retracement below 


USD/JPY – Daily Analysis

The USD/JPY currency pair was flashing green and climber from 108.60 to 109.30, hit the highest level for one-week mainly due to the latest trade headlines in which U.S. President Trump suggests an imminent deal with China. As of writing, the USD/JPY currency pair is currently trading at 109.36 and consolidates in the range between 108.45 – 109.44.

Fresh expectations regarding a deal between the United States and China on tariffs before the December 15 deadline supported equity markets. The Dow Jones reached new record highs and now is up 0.35%, off highs as the optimism eased. 

The United States bonds fell, pushing the yen lower across the board. The United States’ ten-year yield raised by more than 5% as it soared to 1.90% from 1.80% just in a few minutes. Other save haven assets like gold, also dropped significantly. 

More headlines related to trade may continue to flow, giving an impact on market sentiment. The rally of the USD/JPY was also supported by technical factors. The pair climbed above the 109.00 area, breaking a 7-day trading range. It also rose back above the 20-day moving average that stands at 108.80, level that could be seen now as the immediate support. The next support is the lower limit of the mentioned range around 108.40.

Daily Support and Resistance

  • S3 107.94
  • S2 108.28
  • S1 108.42

Pivot Point 108.61

  • R1 108.75
  • R2 108.94
  • R3 109.27

USD/JPY – Trading Tips

The USD/JPY rose 0.8% to 109.40 as investors’ risk appetite grew. The pair is heading towards the double top resistance level of around 109.700. Below this, the USD/JPY is likely to show a bearish correction of up to 38.2% level, which stays at 109.200. 

On the higher side, the bullish breakout of USD/JPY can lead the Japanese pair towards 110.300. The MACD and RSI are in support of the bullish trend. 

All the best!

Categories
Forex Market Analysis

Gold’s Bullish Bias Continues – Dovish FOMC and U.S. Shino In Play! 

Gold continues to trade bullish around 1,478 as we enter in the U.S. session. Most of the buying came after the dovish reports from the FOMC, as investors’ focus shifts to the trade war.

The Federal Reserve announced that it would proceed to watch the data to see if global developments and the muted inflationary pressure affect the U.S. economy. The fed statement of December meeting had no comments like it had in October’s meeting statement in which it was mentioned that uncertainties about outlook remained.

The latest signals from the Fed in its summary of economic projections gave the sense that the Federal Reserve may not run at all in 2020. When asked whether a hike in interest rates would Fbe seen next year, Chairman Jerome Powell answered that a persistent increase in inflation would be required to withdraw the stimulus Fed added this year. And that was a fairly high bar which he does not think will be met in 2020.

Speaking about the U.S. China trade talks, the director of White House National Economic Council Larry Kudlow said the media that “the reality is those tariffs are still on table, the December 15 tariffs, and the President has intimated if the little strokes that are still prevailing in trade talks do not get sorted out as per Trump’s wish, those tariffs could go back into place”.

XAU/USD – Daily Technical Levels 


Support Resistance 

1465.37 1481.64

1455.92 1488.48

1439.64 1504.76

Pivot Point 1472.2

The technical side of the market remained bullish as the precious metal trades above the strong support level of 1,471. On the higher side, gold is likely to find resistance around 1,483. 

Speaking about the leading indicators, the RSI and MACD are suggesting buying trends. So, we should look for bullish trades today. We will prefer staying bullish over 1,474 levels to target 1,482 today. Good luck! 

Categories
Forex Market Analysis

Daily F.X. Analysis, December 12 – Top Trade Setups In Forex – U.K. Voting and ECB in Play! 

The U.S. dollar declined versus other major currencies as the Fed signaled that interest rates could be stable at current levels through 2020. The ICE U.S. Dollar Index sank to 97.08, the lowest level since August.

The euro rose 0.4% to $1.1133. The European Central Bank is expected to keep its monetary policy unchanged later today.

As expected, the Federal Reserve maintained the rates after cutting them at three earlier meetings. Fed Chairman Jerome Powell stated that monetary policy is well-positioned for the expanding economy, where the jobs market is expected to remain strong and inflation moderate.

Economic Events to Watch Today

Let’s took at these fundamentals.


EUR/USD – Daily Analysis

The EUR/USD currency pair slightly recovered in the last hour in the wake of inflation data released from the United States, which made the EUR/USD pair weaker. As of writing, the EUR/USD currency pair is currently trading 1.1094 but virtually unchanged daily near the 1.1090 handles. 

The data published by the United States (U.S.) Bureau of Labor Statistics (BLS) on Wednesday showed that the core Consumer Price Index (CPI) in the United States stayed unchanged at 2.3% every year during November. Although these figures came in line with the market expectation, the initial reaction caused the U.S. Dollar Index to drop to a fresh session low below the 97.50 marks.

Despite this, the EUR/USD currency pair may not pick up bid further in the coming hours because traders are unlikely to take large bets before the Federal Reserve Open Market Committee monetary policy announcements. However, investors don’t see the Federal Reserve cutting rate again; the updated economic projections will provide fresh hints regarding the rating outlook in 2020. 

After the FOMC event, investors’ eyes will shift to the European Central Bank’s (ECB) meeting and President Lagarde’s first press conference on Thursday.

According to the ECB event, we will not see the steady bullish progress in the EUR currency because policy continuity should be the main takeaway. Lagarde’s style and sound is a wild card. Preventing an early misstep there, the slight declines we see to growth may be offset upgrades to next year’s inflation forecast.

At the Fed front, the Federal Reserve is expected to keep the Fed Funds rate stable at the 1.50 – 1.75% range. After cutting interest rates 3-times in a series, for now, market participants see no change today and also at the January meeting. Most members of the Federal Open Market Committee (FOMC) mentioned they think the current stance of policy appropriate. 

Looking forward, the Federal Reserve will announce its decision regarding monetary policy today at 19:00 GMT. Chairman Jerome Powell will read a statement and will hold a press conference at 19:30 GMT. 

Daily Support and Resistance

  • S3 1.102
  • S2 1.1043
  • S1 1.1054

Pivot Point 1.1066

  • R1 1.1076
  • R2 1.1089
  • R3 1.1111

EUR/USD– Trading Tips

The EUR/USD has crossed over its 5-month downtrend at 1.1113. The EUR/USD is trending higher but has not gained any support until now. The EUR/USD has next support near 61.8% Fibonacci support level of 1.1105.  

While the resistance stays around 1.1190, and the 1.1225 horizontal resistance mark strictly follows it. Considering the recent crossover on MACD, the pair may trade bearish below the 1.1100 level today. 


GBP/USD– Daily Analysis

The GBP/USD currency pair dropped but recovered a significant part of its early declines to weekly lows manly in the reaction to the latest election polls results. As of now, the GBP/USD currency pair is currently trading near the 1.3179 and consolidates in the narrow range between 1.3108 – 1.3188 after the Fed holding rates steady yet signaling that there will not be a change in rates in 2020, something quite to the contrary of Fed watchers.

The pair continued the previous session’s late pullback from over eight-month highs and saw some follow-through long-unwinding trade on Wednesday in the wake of the latest U.K. election poll, which tilted towards a hung parliament.

A closely watched YouGov’s poll based on the MRP model showed a narrowing lead for Prime Minister Boris Johnson’s Conservative Party, now expected to win a majority of 28 seats in the parliament, falling sharply from 68 last month.

The slight pick up in the greenback demand, despite the uncertainty of President Trump regarding the phase-one trade deal between the United States and China, further collaborated to the pair’s intraday slide to the 1.3100 neighborhood.

No:1 Key takeaways from FOMC statement and projections

No:2 The market has priced in virtually no chance of rate move through February.

No:3 IOER 1.55% vs 1.55% prior.

No:4 Fed drops language about ‘uncertainties about this outlook remain.’

No:5 The vote was unanimous.

No:6 The Committee will continue to monitor the implications of incoming information for the economic outlook, including global developments and muted inflation pressures, as it assesses the appropriate path of the target range for the federal funds rate.”

No:7 No changes in the economic outlook paragraph*

No:8 Says, “the current stance of monetary policy is appropriate.”

No:9 Leaves forecasts for GDP and inflation unchanged lowers 

unemployment.

No:10 The median forecast is for one rate hike in 2021 and one in 2022.

Looking forward, we are now counting down to the U.K. election vote for Thursday, where results are expected to come in from around 0200 GMT onwards. Pound Sterling has been improving because of yesterday’s YouGov outcome that proved the Conservative’s lead was narrowing. 


Daily Support and Resistance

  • S3 1.3056
  • S2 1.3104
  • S1 1.3124

Pivot Point 1.3153

  • R1 1.3173
  • R2 1.3202
  • R3 1.325

GBP/USD– Trading Tip

The GBPUSD is displaying a solid bullish bias as traders seem confident about the victory of the Conservative party and assume Boris Johanson to win the election. The GBP/USD may persist massively volatile today, and a day after, as the election result will start reaching out by tomorrow morning. On the higher side, the GBP/USD is expected to find resistance around 1.3265 and 1.3336. While the support can be seen near 1.3185 and 1.3110.

The RSI and MACD are in the bullish zone, signaling chances of a bearish correction, but then the Sterling will be found to do more upward movement. 


USD/JPY – Daily Analysis

The USD/JPY currency pair initially hit the bullish track and rose to 108.76 and the reversed falling to 108.57, the new daily bearish level after the decision of the Federal Reserve to keep the rate unchanged. As of writing, the USD/JPY currency pair is currently trading at 108.60, slightly lower as compared to previous before the statement.

The greenback dropped across the bard and hit the fresh bearish levels. The U.S. Dollar Index dropped under 97.30, the lowest level since November 4. The United States’ yields moved to the downside, and equity prices in Wall Street rose but remain under the highs. 

At the Sino-US front, the clock is ticking because we close in on the deadline on the so-called ‘phase- one’ deal and/or tariff delay by December 15. We are awaiting an announcement from U.S. President Donald Trump to come before the weekend’s deadline. Moreover, the news yesterday that tariffs would be delayed caused a short period of risk-on in the markets. Still, the news was unconfirmed, and Trump’s closest advisers tell the decision is finally depend on the president.

Daily Support and Resistance    

  • S3 108.06
  • S2 108.31
  • S1 108.43

Pivot Point 108.56

  • R1 108.68
  • R2 108.8
  • R3 109.05

USD/JPY – Trading Tips

On Thursday, the dovish FOMC and weaker U.S. dollar have driven sharp selling in the USD/JPY currency pair this week. For now, the pair is trading above 108.550, which is working as a double bottom support level.

A bearish breakout of this level can trigger selling until 108.250. The USD/JPY has already completed 81% retracement on three hourly charts, and this level can give some support to USD/JPY. Above this, the pair may find resistance around 108.900. Let’s wait for NFP to determine the further trend of USD/JPY. 

All the best!

Categories
Forex Market Analysis

Daily F.X. Analysis, December 11 – Top Trade Setups In Forex – Brace for FOMC & Fed Rate!

The forex market extends trading sessions mostly with the mixed sentiments as the trader’s eye remains on the Fed Policy decision and CPI rate today. The FOMC will publish its policy statement, and Chairman Powell will be giving his comments on the policy standpoint. Ahead of this event, the U.S. Dollar Index is down 0.22% at 97.45 on Tuesday, supporting the pair stay relaxed above the 0.6800 handles. 

Today, the trader’s focus will stay on the U.S. Monetary Policy and CPI rate from the U.S. Let’s brace for it. 

Economic Events to Watch Today

Let’s took at these fundamentals. 


AUD/USD – Daily Analysis

The AUD/UD currency pair flashing green and rose to 0.6835, mainly due to the upbeat data from Australia and unexpectedly higher inflation figures from China. As of writing, the AUD/USD pair is currently trading at 0.6814 and consolidates in the range between the 0.6800 – 0.6837.

The currency pair struggled to maintain its recovery rally due to a lack of progress surrounding the United States and China trade war and fell to a fresh weekly low of 0.6800 before recovering modesty.

The National Australia Bank’s Business Conditions Index remained unchanged at 4 in November, but it beat the expectations of 2. On the other, the annual House Price Index for the third quarter came in at -3.7%, after a second quarter’s figure of -7.4%, which supported the Australian Dollar.

In the second half of the day, the Wall Street Journal (WSJ) reported that the U.S. and China’s trade negotiators are working toward delaying the December 15 tariff hike. That gave a boost to the market sentiment and trade-sensitive AUD.

During the Asian session on Wednesday, Westpac Consumer Confidence Index from Australia, which is expected to drop to -0.7% in December from 4.5% in November, will be keeping under the eyes. 

Following in the day, the FOMC will release its policy statement, and Chairman Powell will be delivering his remarks on the policy outlook. Ahead of this event, the U.S. Dollar Index is down 0.22% at 97.45 on Tuesday, supporting the pair stay relaxed above the 0.6800 handles.

While reviewing Wednesday’s FOMC meeting, “after three cuts in a series, we expect the Fed to remain on hold (target range 1.50-1.75%) when it meets next week,” said Danske Bank analysts. “FOMC members have made it clear that they think the ‘current stance of monetary policy is appropriate’ and that they now want to wait some time and see how everything plays out before acting again.”


Daily Support and Resistance

  • S3 0.6795
  • S2 0.6811
  • S1 0.6817

Pivot Point 0.6826

  • R1 0.6833
  • R2 0.6842
  • R3 0.6858

AUD/USD– Trading Tips

On Wednesday, the AUD/USD is consolidating mostly bearish after falling below 38.2% Fibonacci retracement at 0.6820. It has also completed 50% Fibonacci retracement at 0.6795. The AUD/USD pair is now trading around 0.6808, in between the upper limit of 0.6820 and a lower limit of 0.6795. 

 A bearish breakout of 0.6795 level can extend selling until 0.6775. The MACD is holding below 0, suggesting the chances of a bearish trend continuation in Aussie. Let’s look for buying above 0.6775 and selling below 0.6820level. 


GBP/USD– Daily Analysis

The GBP/USD currency pair flashing green and hit the seven-months high from the bearish level of 1.3132 to 1.3189 while heading toward the United Kingdom elections on Thursday, and the result of elections will be released early Friday morning. As of writing, the currency is currently trading at 1.3188 and consolidates in the range between the 1..3132 to 1.3197.

According to the current situation, the Tories are ready to win the U.K. election, which may put the Brexit deal to bed. Today, the United Kingdom’s economic data don’t take a front seat due to the election hype, despite flat figures for Gross Domestic Produce for October. 

The GDP figures have followed 2-consecutive monthly contractions, which means we have now seen 3-consecutive months of negative/zero m/m growth for the 1st-time since 2009.

It should be noted that after this week’s snap December election, the next difficulty for the United Kingdom markets is next week’s Bank of England decision. However, the United Kingdom data continues to fall at a moderate rate since the last BoE meeting, which drives the dovish sentiment regarding the next rate decision. 

Looking forward, the markets will keep their focus on the Federal Open Market Committee and the Federal Reserve after the interest rate decision. Rates are expected to remain stable at 1.50-1.75%, while patience rhetoric will follow previous Federal Reserve speeches and statements furnished with preconditions before rate cut again in the future. 


Daily Support and Resistance

  • S3 1.3056
  • S2 1.3104
  • S1 1.3124

Pivot Point 1.3153

  • R1 1.3173
  • R2 1.3202
  • R3 1.325

GBP/USD– Trading Tip

The cable pair holds a bullish tone, but it is showing some short-term bearish signals after being unable to stay on top of 1.3160. Nevertheless, the trend in the pair points clearly to the upside, and consolidation of the GBP/USD above 1.3180 would expose the pair towards 1.3200. The prices need to cross May month high near 1.3180 to target 1.3200 and 1.3270 figures to the north, declining to do so highlights Wednesday’s top surrounding 1.3120 as immediate support. 

USD/JPY – Daily Analysis

The USD/JPY currency pair hit the bullish track and reached 108.75, mainly due to the Wall Street Journal reported that the United States and China trade talks are working toward delaying the tariff hike. After fastening to a fresh daily bullish of 108.75, the pair USD/JPY currency pair reversed slightly and was last seen trading at 108.62, where it was up 0.05% on a daily chart.

The U.S. and Chinese trade negotiators are planning for a delay of a fresh round of tariffs set to impose on December 15, according to officials on both sides. The market reaction to this headline also provided the ten-year United States Treasury bond yield to cancel its daily losses and helped the S&P 500 futures to move into the positive territory, pointing out to a positive shift in the market sentiment.

Meanwhile, the U.S. Dollar Index remains to move sideways a little above the 97.50 marks to allow the risk perception to continue to drive the pair’s action.

At the starting of today, the NFIB Business Optimism Index in the U.S. increased to 104.7 during November from 102.4, but the Unit Labor Costs rose 2.5% in the 3rd-quarter to drop short of the market expectation for an increase of 3.3%. But, these readings were largely ignored by the market members ahead of the FOMC’s monetary policy announcements on Wednesday. 

Daily Support and Resistance

  • S3 108.06
  • S2 108.31
  • S1 108.43

Pivot Point 108.56

  • R1 108.68
  • R2 108.8
  • R3 109.05

USD/JPY – Trading Tips

On Wednesday, the USD/JPY is likely to trade sideways until the release of FOMC and U.S. inflation rates. The pair is trading above 108.550, which is working as a double bottom support level. A bearish breakout of this level can trigger selling until 108.250. The USD/JPY has already completed 81% retracement on three hourly charts, and this level can give some support to USD/JPY. Above this, the pair may find resistance around 108.900. Let’s wait for FOMC to determine the further trend of USD/JPY. 

All the best!

Categories
Forex Market Analysis

Daily F.X. Analysis, December 10 – Top Trade Setups In Forex – Eyes on British GDP Figures! 

The market continues to trade mixed risk sentiment due to diminishing expectations of no interest rate cuts by the Fed and delay in the trade deal. The top White House Economic Adviser, Larry Kudlow, confirmed on Friday that the December 15 deadline to impose new tariffs on around $156 billion worth Chinese products remains in place.  

At the same time, he also said that the U.S. President Donald Trump is satisfied with the recent progress in trade discussions. Yet he is not looking to go with the current phase one trade deal. 

Today, the trader’s focus will stay on the British GDP and further events from the Eurozone. Let’s brace for it. 

Economic Events to Watch Today

Let’s took at these fundamentals.


EUR/USD – Daily Analysis

The EUR/USD currency pair continues its bullish moves mainly due to the greenback’s bearish reversal across the board and weaker United States Treasury yields. As of writing, the EUR/USD pair is trading near the 1.1064 and consolidates in the narrow range between the 1.1053 – 1.1078.

Besides, the currency pair picked up the fresh buying during the last hour, in the wake of the revived trade war between the United States and China. The dismal of China trade data also depressed the market mood.

The lowered demand for higher-yielding assets such as the Treasury yields pushed the U.S. dollar broadly lower. The USD index corrects Friday’s positive U.S. payrolls led upsurge to 97.84, now trading at session lows of 97.63, -0.15% on the day.

Even after the recent bullish moves, the currency pair still in the red zone because the greenback may remain supported by the stronger United States employment data that diminished the 2020 rate cut expectations by the Federal Reserve.

At the ECB front, the European Central Bank (ECB) President Largerde will deliver her first speech as a president regarding monetary policy during this Thursday. She will likely provide a hint about the ECB’s commitment to the recent stimulus package that included a rate cut and the restarting of the quantitative rate cut(Q.E.) program.

Meanwhile, the markets now await the Eurozone Sentix Investor Sentiment data, which is de during the European session today. Better-than-expected German Trade and Current Account data also collaborate with the positive tone around the shared currency.

Furthermore, the investor’s confidence in the Eurozone increased sharply in December, despite rising US-China trade tensions and the German slowdown, the latest data published by the Sentix research group showed on Monday.

The quote climbed to +0.7 in December from -4.5 in November and against a figure of -4.9 expected. The investors’ confidence hit the highest since March 2018.


Daily Support and Resistance

  • S3 1.093
  • S2 1.1
  • S1 1.1031

Pivot Point 1.107

  • R1 1.1101
  • R2 1.1141
  • R3 1.1211

EUR/USD– Trading Tips

The EUR/USD has disappointed in its first test of the 5-month downtrend at 1.1113. The EUR/USD is trending lower but has not gained any support until now. The EUR/USD has next support near 61.8% Fibonacci support level of 1.1040.  

While the resistance stays around 1.1070, and the 1.1075 horizontal resistance mark strictly follows it. Considering the recent crossover on MACD, the pair may trade bearish below the 1.1070 level today. 


GBP/USD– Daily Analysis

The GBP/USD currency pair flashing red and representing declines to 1.3135 from the highest level since early April of 1.3180 after the release of a new poll ahead of the snap December elections in the United Kingdom. The Cable experienced a slight bearish reversal on Monday and mostly traded at 1.3155/60, up 20 pips for the day. 

The GBP/USD currency pair was seen on the bullish track on Monday, but it remains under 1.3200. The GBP continues to be supported by the polls showing a top position of the Conservatives Party. Just minutes ago, the fresh opinion poll by ICM revealed that the United Kingdom Prime Minister Boris Johson’s Conservative Party remain unchanged at 42%. In contrast, support for the party rose by 1 point to 36%. The Tory slightly pushed lower the GBP in advance.

The reversal in the GBP/USD currency pair was limited as the volatility remain low, and the U.S. dollar continued to show slight bearish bias. 

Looking forward, the critical event in the U.S. will be the FOMC meeting on Wednesday. Analysts and traders are also focusing on trade progress as the December 15 deadline for hiking tariffs on Chinese goods remains in highlights. 


Daily Support and Resistance

  • S3 1.3004
  • S2 1.3069
  • S1 1.3103

Pivot Point 1.3134

  • R1 1.3168
  • R2 1.32
  • R3 1.3265

GBP/USD– Trading Tip

On the technical side, the cable pair holds a bullish tone, but it is showing some short-term bearish signals after being unable to stay on top of 1.3160. Nevertheless, the trend in the pair points clearly to the upside, and consolidation of the GBP/USD above 1.3180 would expose the pair towards 1.3200. 

The prices need to cross May month high near 1.3180 to target 1.3200 and 1.3270 figures to the north, declining to do so highlights Wednesday’s top surrounding 1.3120 as immediate support.

In the daily timeframe, the GBP/USD has an upward crossover on MACD. Lastly, the three white candles on the daily timeframe are suggesting bullish bias among traders. 


USD/JPY – Daily Analysis

The USD/JPY currency pair hit the five-days low below the 108.50 ahead of important macroeconomic events. The pair struggle to stage a recovery on Monday and was last seen trading at 108.49, a few pips above the 5-day low that it set at 108.43 in the last hour.

The economic figures showed that the business sentiment grew slightly during November with the Eco Watchers Survey’s Outlook and the Current indexes both coming out better than their October figures.

Looking forward, the trader will keep their eyes on the fresh progress surrounding the United States and China trade talks. If both sides could make a deal and sign the phase-one of the trade deal ahead of the United States tariff hike on Chinese imports on December 15, a relief rally will likely cause the Japanese Yen to lose interest as a safe-haven and support the pair gain bullish moves.

The U.S. Federal Open Market Committee (FOMC) will be publishing its monetary policy decisions on Wednesday. In contrast, the FOMC is not expected to make any changes to its policy rate. It will be interesting to see how the Fed estimates the positive Gross Domestic Product (GDP) and Nonfarm Payrolls (NFP) data. 

Last week on Friday, the U.S. Bureau of Labor Statistics reported that Nonfarm Payrolls increased by 266,000 during November to cross the market expectation of 180,000 and provided a boost to the U.S. Dollar Index. Consequently, the USD/JPY pair got bullish support. Meanwhile, the S&P 500 futures are virtually unchanged on the day, hinting that Wall Street is likely to open flat to reiterate the neutral market sentiment.


Daily Support and Resistance   

  • S3 107.85
  • S2 108.26
  • S1 108.44

Pivot Point 108.68

  • R1 108.85
  • R2 109.1
  • R3 109.51

USD/JPY – Trading Tips

On Tuesday, the demand for haven assets and weaker U.S. dollar has driven sharp selling in the USD/JPY currency pair this week. For now, the pair is trading above 108.550, which is working as a double bottom support level.

A bearish breakout of this level can trigger selling until 108.250. The USD/JPY has already completed 81% retracement on three hourly charts, and this level can give some support to USD/JPY. Above this, the pair may find resistance around 108.900. Let’s wait for NFP to determine the further trend of USD/JPY. 

All the best!

Categories
Forex Market Analysis

Gold Bounces Off Amid Safe Haven Appeal – What’s Next?

During the Asian and European sessions, the precious metal gold surged as traders hedged against a possible intensification in the U.S.-China trade conflict before a Dec. 15 deadline for fresh U.S. tariffs.

Overall, the precious metal remains under pressure in the wake of a stronger U.S. dollar. The Average Hourly Earnings from the United States Bureau of Labour Statistics was published, which showed a decline in November to 0.2% from the expectations of 0.3% and weighed on the U.S. dollar.

The Non-Farm Employment Change for November showed growth to 266K from expected 181K and supported the U.S. dollar. The Unemployment Rate of the United States also declined in November to 3.5% from previous & expected 3.6% and added in support of the U.S. dollar.

Besides, the Preliminary Consumer Sentiment from the University of Michigan also came in favor of the U.S. dollar as 99.2 against the expectations of 97.0. The Final Wholesale Inventories for October were also in favor of the U.S. dollar when released as 0.1% against the expectation of 0.2%. The Preliminary Inflation Expectations from the University of Michigan showed a drop this month to 2.4% from the previous 2.5%.


Gold – XAU/USD – Daily Technical Levels

Support      Resistance 

1,452.48      1,474.11

1,444.81      1,488.08

1,423.18      1,509.71

Pivot Point 1,466.44

Gold is likely to trade bullish above 1,459, which is working as a horizontal support level. The closing of Doji and Inside up bar patterns are suggesting chances of a bullish reversal in gold. 

It looks like gold is trying to capture a bullish retracement, and it has completed 23.6% Fibo corrections at 1,464. This level is now extending substantial resistance to gold. 

The bearish breakout of 1,459 can lead to gold prices towards 1,450. While bullish trend continuation can lead to gold prices to 1,471, I will be staying bearish below 1,466 today. Good luck! 

Categories
Forex Market Analysis

Daily F.X. Analysis, December 09 – Top Trade Setups In Forex – Mixed Risk Sentiment In Play!

The U.S. dollar rebounded against other major currencies, as the ICE U.S. Dollar Index rose 0.3% to 97.68, halting a six-session losing streak. EUR/USD lost 0.4% to close at 1.1060. Germany’s industrial production declined 1.7% on month in October (+0.1% expected).

The U.S. Labor Department reported that the economy added 266,000 nonfarm payrolls in November (+180,000 expected, +156,000 in October). The jobless rate dropped to 3.5% from 3.6%, the lowest level since 1969. Meanwhile, the University of Michigan Sentiment Index (preliminary reading) rose to 99.2 in December (97.0 expected) from 96.8 in November.

Let’s took at these fundamentals.

Economic Events to Watch Today


EUR/USD – Daily Analysis

The EUR/USD currency pair is flashing red and representing marginal declines on the day, mainly due to the tension of the intensified trade war between the United States and China. As of writing, the currency pair is currently trading at 1.1055 and consolidates in the narrow range between 1.1053 – 1.1061.

As we know, the pair had closed above 1.1097 during the Thursday, canceling the lower highs setup on the daily chart and confirming the bullish reversal. The breakout was short-lived because the currency pair fell from 1.1110 to 1.1040 during the U.S. trading session in the wake of the Nonfarm Payrolls figure.

At the fed front, the traders priced out chances of 25-basis-points rate cut by the Federal Reserve rate cut in 2020 after the release of the upbeat United States employment report. While on the U.S. dollar front, the greenback may remain in buying mainly due to upbeat payrolls data and trade tensions.

The data released during the weekend showed China’s exports to the U.S. dropped by 23% in November, the most significant monthly decline since February. 

The depressing figures may convince the United States President Donald Trump that his trade war is creating desired results, and he will likely move forward with a tariff spike on $160 billion of Chinese goods.

At the Sino-US front, the tensions regarding the United States and China intensified trade war will likely keep the shared currency under pressure. Ultimately, the trade fears have pushed Germany, the Eurozone’s largest economy.

Daily Support and Resistance

  • S3 1.093
  • S2 1.1
  • S1 1.1031

Pivot Point 1.107

  • R1 1.1101
  • R2 1.1141
  • R3 1.1211

EUR/USD– Trading Tips

The EUR/USD has disappointed in its first test of the 5-month downtrend at 1.1113. The EUR/USD is trending lower but has not gained any support until now. The EUR/USD has next support near 61.8% Fibonacci support level of 1.1040.  

While the resistance stays around 1.1070, and it’s strictly followed by the 1.1075 horizontal resistance mark. Considering the recent crossover on MACD, the pair may trade bearish below the 1.1070 level today. 


GBP/USD– Daily Analysis

 The GBP/USD currency pair is flashing green and representing 0.10% gains on the day in the wake of weekend polls. As of writing, the GBP/USD currency pair is currently trading at 1.3146 and consolidates in the range of 1.3133 – 1.3151. 

The market traders seem very careful to continue the recent bullish streak beyond the 7-month high ahead of the snap December election in the United Kingdom.

Moreover, the weekend survey indicates that the ruling Conservative Party continues to maintain top position across all major surveys. However, the opposition Labour Party seems to cut the lead as far as data from ComRes and Deltapoll are concerned. 

The fresh news from the U.K. politics shows that the Prime Minister (PM) Boris Johnson agrees that there will be insignificant checks between the U.K. and Northern Ireland. The United Kingdom Prime Minister Boris Johson has been criticized many times for not coming in the General debates. Still, the recent one on Channel 4 looks to be suitable for the Tories. 

At the Sino-US front, the United States (U.S.) did not reduce the scope of fresh tariffs on Chinese goods that are up for December 15. The same thing keeps market players under pressure because phase-one talks are yet to provide any strong development.

The traders will keep their eyes on Thursday’s election, as well as monthly figures of Manufacturing Production, Industrial Production, and Gross Domestic Product will likely offer fresh direction to the cable pair.

Daily Support and Resistance

  • S3 1.3004
  • S2 1.3069
  • S1 1.3103

Pivot Point 1.3134

  • R1 1.3168
  • R2 1.32
  • R3 1.3265

GBP/USD– Trading Tip

On the technical side, the prices need to cross May month high near 1.3180 to target 1.3200 and 1.3270 figures to the north, declining to do so highlights Wednesday’s top surrounding 1.3120 as immediate support.

In the daily timeframe, the GBP/USD has an upward crossover on MACD. Lastly, the three white candles on the daily timeframe are suggesting bullish bias among traders. 


USD/JPY – Daily Analysis

The USD/JPY currency pair flashing red and found near the 108.58, in short, the pair stays moderately changed to Friday range despite the upbeat growth data from Japan. As of writing, the USD/JPY Currency Pair currently trading at 108.58 and consolidates in the narrow range between the 108.55 – 108.67.

The final figures of Japan’s 3rd-quarter (Q3) Gross Domestic Product (GDP) increased past-0.2% forecast and 0.1% preliminary expectations to +0.4% on QoQ basis. Though the annually figures matched no change expectations of 0.6%. Moreover, Japan’s Trade Balance on Balance of Payment (BOP) Basis for October crossed ¥1.1 B before a whooping ¥254 B.

Markets risk sentiment didn’t succeed in extending the previous gains because the traders look careful ahead of the critical week that includes the crucial central bank meeting and the general election in the United Kingdom. Moreover, recent polls of the British December snap election seem to keep the ruling Conservative Party at the top and decrease fears of the united kingdom political trauma.

At the Sino-US front, the United States tariffs of China are ready to happen on December 15, and the Trump administration wants a phase-one to turn the tariff’s switch off. However, China seems not in a mood to respect the U.S. and trade deal, even after supporting agricultural demand. Looking forward, traders may look for trade/political headlines for fresh impulse.

Daily Support and Resistance

  • S3 107.85
  • S2 108.26
  • S1 108.44

Pivot Point 108.68

  • R1 108.85
  • R2 109.1
  • R3 109.51

USD/JPY – Trading Tips

The boosted demand for haven assets and weaker U.S. dollar has driven sharp selling in the USD/JPY currency pair this week. For now, the pair is trading above 108.550, which is working as a double bottom support level.

A bearish breakout of this level can trigger selling until 108.250. The USD/JPY has already completed 81% retracement on three hourly charts, and this level can give some support to USD/JPY. Above this, the pair may find resistance around 108.900. Let’s wait for NFP to determine the further trend of USD/JPY. 

All the best!

Categories
Forex Market Analysis

Daily F.X. Analysis, December 06 – Top Trade Setups In Forex – Brace for Nonfarm Payroll! 

The British pound extended its gains on expectations that Brexit uncertainty could be cleared when the ruling Conservative Party wins a majority in the December 12 general election. GBP/USD charged 0.4% higher to 1.3157, a fresh 7-month high. EUR/GBP declined 0.2% to 0.8438, which was last seen in May 2017.

The U.K. Society of Motor Manufacturers and Traders reported that new car registrations declined 1.3% on year in Nov. (-6.7% in Oct.).

The euro rose 0.2% to $1.1104. The eurozone’s third-quarter GDP growth (final reading) posted at 0.2% on quarter (as expected) and 1.2% on year (as expected). Also, the eurozone’s retail sales declined 0.6% on month in Oct. (-0.5% expected) but rose 1.4% on year (+2.2% expected).

Economic Events to Watch Today

Let’s took at these fundamentals.


EUR/USD – Daily Analysis

The EUR/USD currency pair flashing green and found above the November 21 high of 1.1107 despite the depressed German Factory Orders data. As of writing, the currency pair consolidates in the range of 1.1102 – 1.1110. The 14-day relative strength index is also representing bullish sentiment with an above-50 print.

The EUR/USD currency pair will be unlikely to take the significant declines even if the industrial production figures release below expectations. On the other hand, the positive data from the United States (NFP) may stop supporting the bullish technical setup. Changes in industrial production are widely followed as a primary indicator of strength in the manufacturing industry.

Looking forward, the Eurozone’s manufacturing hub Germany release Industrial Production figures for October at 07:00 GMT. The data was expected to show the factory activity increased at a seasonally adjusted rate of 0.1% month-on-month in October, but the actual data fell to -1.7%. Evidently, the EUR/USD is trading under pressure since it’s release. 


Daily Support and Resistance

  • S3 1.104
  • S2 1.1068
  • S1 1.1086

Pivot Point 1.1097

  • R1 1.1115
  • R2 1.1126
  • R3 1.1155

EUR/USD– Trading Tips

On Friday, the traders are waiting for the U.S. Non-farm Payroll and Employment change figures to drive the next movement in the market. 

The EUR/USD has next support is near mid-1.1050 and is strictly followed by the 1.1075 horizontal support mark. Considering the recent crossover on MACD, the pair may trade bullish above the 1.1070 level today. On the upper side, resistance stays around 1.1140 and 1.1170. 


GBP/USD– Daily Analysis

The GBP/USD currency pair hit the seven-month high and found near the 1.3160 ahead of the United States nonfarm payroll. As of writing, the currency pair consolidates in the range of 1.3153-1.3163. 

The recent polls of the United Kingdom December election maintain the ruling Conservative Party on the top place, Prime Minister Boris Johson seems to be stuck recently as the Tory leaders again reject to take part in ITV and BBC debates.

On the other hand, optimism surrounding the trade deal by the UK Chancellor Sajid Javid and ex-Brexit Party members’ who seem to push to vote Tories seem to play their roles. Moreover, the pairs’ bullish sentiment could also be attributed to the greenback weakness. 

Markets seem inactive and cautious because all eyes stay on the Novembers’ employment data from the United States. As a result, the United States’ ten-year treasury yields, and most of the Asian stocks stay modestly changed. 

Ahead of the U.S. jobs report, U.K. Halifax House Prices will likely entertain the traders. Notably, we expect payrolls to increase by a solid 200k in November, which is higher than the previous month’s 128k release. If this happens, the GBP/USD may face headwind to target the next resistance level of 

Daily Support and Resistance

  • S3 1.3021
  • S2 1.3082
  • S1 1.312

Pivot Point 1.3143

  • R1 1.3181
  • R2 1.3204
  • R3 1.3265

GBP/USD– Trading Tip

On the technical side, the prices need to cross May month high near 1.3180 to target 1.3200 and 1.3270 figures to the north, declining to do so highlights Wednesday’s top surrounding 1.3120 as immediate support.

In the daily timeframe, the GBP/USD has an upward crossover on MACD. Lastly, the three white candles on the daily timeframe are suggesting bullish bias among traders. 

USD/JPY – Daily Analysis

The USD/JPY currency pair flashing red and dropped from the 108.97 to 108.66 overnight, mainly due to the positive headlines which came from the United States and China trade. This helped the United States stocks to survive further gains. 

As of writing, the currency pair is trading near the 108.70 and consolidates in the range of 108.66-108.78. Recently the risk appetite was healthy, and investors were trading based upon the set of positive news during this week from the United States. Although, without any positive response from China, markets were afraid to take any action ahead.

Before the headlines, there were upbeat tones from the United States President Donald Trump, who said that the United States is having meetings and trade talks with China. Something may happen regarding the December 15 tariff, but we are not discussing currently.

As for U.S. yields, the two-year Treasury yields increased slightly from 1.56% to 1.60%, ten-year yields rose from 1.76 to 1.82%. “Markets are pricing a near to zero chance of rate cut at the Fed’s December 11 meeting but a terminal rate of 1.25%.

Looking forward, the trader will keep their eyes on the coming Nonfarm Payrolls. Nov Nonfarm Payrolls are expected to rise 185k and report that the unemployment rate is likely to stay at 3.6%. Average hourly earnings are expected to hold at 3.0%, still down from the 3.2% beforehand.


Daily Support and Resistance

  • S3 108.12
  • S2 108.46
  • S1 108.61

Pivot Point 108.81

  • R1 108.95
  • R2 109.15
  • R3 109.49

USD/JPY – Trading Tips

The boosted demand for haven assets and weaker U.S. dollar has driven sharp selling in the USD/JPY currency pair this week. For now, the pair is trading above 108.550, which is working as a double bottom support level.

A bearish breakout of this level can trigger selling until 108.250. The USD/JPY has already completed 81% retracement on three hourly charts, and this level can give some support to USD/JPY. Above this, the pair may find resistance around 108.900. Let’s wait for NFP to determine the further trend of USD/JPY. 

All the best!

Categories
Forex Market Analysis

Gold’s Sideway Range Remains Intact – What’s Next to Expect? 

Gold prices mostly traded in sideways trading range of 1,483 – 1,475 due to lack of market moving fundamentals. Recently, the statement by Trump having no-deadline for the US-China agreement drove US Treasury yields lower and helped in tightening the spread between US Govt. Bond yields & Japanese Govt. Bond Yields. This made gold more attractive that day and hence XAU/USD pair suffered.

A report from Bloomberg turned the table by saying that US & China were moving closer to a trade deal. According to the report, the US & China were under talks to agree on the amount of tariffs that would be rolled back in Phase-one trade deal despite the raised tensions over Hong Kong issue.

China has been continuously demanding the roll back of US tariffs as part of phase-one trade deal which Trump has denied earlier. Yesterday, reports came in favor of trade-deal raised the hopes for phase-one deal completion by mid-December. This happened despite the increased tensions between US & China after the US legislation to punish Chinese officials over human rights issues in Hong Kong. 

Gold – XAU/USD – Trade Plan

Technically, the precious metal gold is stuck in a narrow trading range of 1,483 – 1,467. On the 4 hour timeframe, gold is forming neutral candles above 1,472 mark which is extending an immediate support to gold today. Bearish breakout of this level can extend sell-off until 1,467 level.


Support Resistance 

1469.34 1481.99

1464.07 1489.37

1451.42 1502.02

Pivot Point 1476.72

The RSI and MACD are holding around 50 and 0 respectively, suggesting neutral sentiment of traders. Looks like, traders are going to keep trading choppy session until the NFP is released tomorrow. 

Consider staying bearish 1,480 and bullish above 1,472 today. Good luck! 

Categories
Forex Market Analysis

Daily F.X. Analysis, December 05 – Top Trade Setups In Forex – Get Ready for European GDP! 

On the forex front, the British pound bounced 0.9% to $1.3103, the highest close since May. Polls suggested a majority-win by Prime Minister Boris Johnson’s Conservative Party in the general election to be held next week, which could clear political uncertainty over Brexit. Meanwhile, the Markit UK Services PMI for November (final reading) was released at 49.3 (48.6 expected).

The euro closed a few pips lower at $1.1077. The Markit Eurozone Services PMI for November (final reading) posted 51.9 (51.5 expected).

Economic Events to Watch Today

Let’s took at these fundamentals.


EUR/USD – Daily Analysis

The EUR/USD currency pair hit the multi-week highs just above the 1.1100 level, mainly due to the poor ADP data result. As of writing, the currency pair currently trading near the 1.1090 and consolidates in the range between 1.1067 – 1.1115.

The ADP showed the US US private sector added ‘just’ 67K jobs during last month, coming in well below estimates whereas the November’s print was also changed a tad lower to 121K (from 125K).

Looking forward, all eyes will be on I.S.M. Manufacturing for November, which is due to come out later in the NA session.

Eventually, the pair has stuck above the critical barrier at 1.1100 due to the continuous weak sentiment in the greenback and the intensified Sino-US trade war. 

IHS Markit reported that today’s data signals 0.1% GDP growth in the last quarter of the year, with manufacturing creating a notable resistance. While today’s figures steadied a bit from the previous reading, the numbers are at the lower end of what’s been reported over the last five years.

On the technical side, the EUR/USD pair is increasing 0.19% at 1.1102 and faces the next hurdle at 1.1161 (200-day SMA), followed by 1.1179 (monthly high Oct.21) and finally 1.1186 (61.8% Fibo of the 2017-2018 rally). On the other hand, a breakdown of 1.1040 (55-day SMA) would target 1.0989 (low monthly Nov.14) en route to 1.0925 (low Sep.3).

Daily Support and Resistance    

  • S3 1.0883
  • S2 1.097
  • S1 1.1025

Pivot Point 1.1057

  • R1 1.1112
  • R2 1.1145
  • R3 1.1232

EUR/USD– Trading Tips

The European traders are waiting for the GDP and Retail Sales data, which is due in a couple of hours. With an improved level of uncertainty, the greenback is getting weaker, which is why the EUR/USD is trading steadily in a narrow range

The EUR/USD has immediate support is near mid-1.1050 and is closely followed by the 1.1075 horizontal support mark. Considering the recent crossover on MACD, the pau may trade bullish above the 1.1070 level today. 

.


GBP/USD– Daily Analysis

The GBP/USD currency pair remains to flash green and hit the seven-months highs near the 1.3100 in the last trading hour. That happens after the incoming polls have hit a majority for the United Kingdom Prime Minister Boris Johnsons ruling Conservatives Party at the upcoming snap election, which is listed to occur on December 12.

It should be noted that the bullish sentiment in the pair did not take any effect by the weakness in the greenback, supported by a sharp intraday upward movement in the US Treasury bond yields and some positive trade-related headlines. Moreover, the report came that the United States and China are moving closer to a deal before the December 15 tariff due data.

The GBP/USD currency pair will likely be trying to improve the 1.3100 round-figure marks, although slightly overbought sentiments on intraday charts warrant some attention before initiating any new bullish positions. Market traders now look forward to the US economic docket, highlighting the release of ADP report and ISM Non-Manufacturing PMI, for some short-term impetus.

Daily Support and Resistance    

  • S3 1.2823
  • S2 1.2876
  • S1 1.2908

Pivot Point 1.2929

  • R1 1.2961
  • R2 1.2982
  • R3 1.3035

GBP/USD– Trading Tip

The GBP/USD’s bullish trend continues to dominate the market, and the pair is consistently heading north to test the initial resistance level of 1.3195. A bullish breakout of this mark can drive buying until 1.3335, the double top resistance level. 

In the daily timeframe, the GBP/USD has an upward crossover on MACD. Lastly, the three white candles on the daily timeframe are suggesting bullish bias among traders. 


AUD/USD– Daily Analysis

The AUD/USD pair flashing red and currently trading near the bearish range of 0.6853, mainly due to the intensified trade tension between the United States and China.

As of writing, the currency pair failed to continue its recent bullish streak and unfortunately came under pressure, as we know the pair registering 2-consecutive days of bullish streak in the wake of softer Austrian macro data.

Apart from this, Australia’s GDP growth slowed to 0.4% during the 3-months to September as compared to the previous quarter’s upwardly revised figures of 0.6% and worse than 0.5% expected.

At the Sino-US front, the overall sentiment on the AUD/USD currency pair affected mainly by the United States and China trade deal uncertainty. It should be recalled that the United States President Donald Trump said that the trade deal with China would likely not happen in 2020. As well as, the US US Congress on Tuesday overwhelmingly approved a bill condemning China’s mass detention of ethnic Muslims and called for sanctions against some officials responsible.

The AUD/USD currency pair left its recent bullish moves, and bearish sentiment remained strong so far, despite the weak greenback. Because investors continue to digest the latest trade developments, the greenback buyers remained on the defensive track, avoid a modest uptick in the US US Treasury bond yields.

Daily Support and Resistance    

  • S3 0.6699
  • S2 0.6752
  • S1 0.6785

Pivot Point 0.6806

  • R1 0.6839
  • R2 0.6859
  • R3 0.6913

AUD/USD– Trading Tips

The AUD/USD is trading slightly bearish to achieve 38.2% Fibonacci retracement at 0.6820. Over this, the Aussie has produced a series of bearish candles that are suggesting chances of a sell-off in Aussie. 

The AUD/USD may trade with a bullish bias above 0.6820 to aim 0.6850 and 0.6868 while the next support prevails around 0.6800. 

All the best!

Categories
Forex Market Analysis

Gold Sideways Trend Continued – ADP Fails to Drive Price Action! 

These back to backfires from Trump administration are affecting the credibility of the United States. Trump, on Monday, said that giving U.S. legislation to Hong Kong protestors was not making trade negotiations easy with China. However, he believed that Beijing still wanted a deal with the U.S. Trump added that China was having by far the worst year that hey had in 57 years and was still paying for the trade war. He said that in contrast, the U.S. was doing very well, and it can even do better with a flick of a pen.

In October, China has reported its slowest growth in the economy in 27 years when trade tensions with the U.S. hit its manufacturing sector. 

On the other hand, the Wards Total Vehicle Sales from the United States on Tuesday was published and showed growth to 17.1M from expected 16.8M and supported the U.S. Dollar.

Gold continues to gain bullish momentum as the U.S. private employers scored fewer jobs in six months in November, falling below economists forecast. The U.S. companies’ payrolls grew by 67K last month as per the ADP National Employment Report. 


XAU/USD – Daily Technical Levels

Support Resistance 

1,464.34   1,486.32

1,451.14   1,495.1

1,429.16   1,517

Pivot Point 1,473.12

For the U.S. session, gold is likely to trade in a narrow range of 1,474 – 1,483. The chances of a bearish break below 1,474 remain high. Thus, the second bearish target for gold is likely to be 1,467 today. Good luck! 


Categories
Forex Market Analysis

Dramatic Buying In Gold – Trump Inflict Sudden Tariff In Brazil, and Argentina!

On Tuesday, gold prices were trading in a tight area of 1,462 – 1,452 as traders were mostly staying out of the market during the Asian and European sessions. All of a sudden, we noticed a dramatic buying trend in gold, which lead its prices towards 1,472 and even higher. Most of the buying came in response to U.S. President Donald Trump’s action of slapping tariffs on Brazil and Argentina.

Besides this, Construction spending from the United States also dropped to -0.8% from the expectations of 0.3% and weighed on the U.S. dollar. The ISM Manufacturing prices showed a minor drop of 46.7 from expected 47.0.

On the trade deal front, the U.S. dollar remained under pressure after the demand of tariffs removal as a part of the phase-one deal by the Chinese government. Trump, in response, told Commerce Secretary Wilbur Ross, who reported the media that Trump would not back off from tariff hike on December 15 if China would not sign the phase-one deal by then.

Taking a look at the technical side of gold, the metal is trading around 1,474 area with an immediate resistance around 1,476. The precious metal has violated the descending triangle pattern, which is now supporting gold around 1,466 area.


Support Resistance
1,455.8    1,467.31
1,449.15 1,472.18
1,437.64 1,483.69
Pivot Point 1,460.66

On the 240 minutes chart, gold may form three white soldiers pattern, which typically represents chances of a bullish bias among traders. Likewise, the leading indicators, such as RSI and MACD, are also suggesting the odds of a bullish trend in gold. Consider staying bullish above 1,466 and bearish below 1,476/77 today. Good luck!

Categories
Forex Market Analysis

Daily F.X. Analysis, December 04 – Top Trade Setups In Forex – Eyes on US ADP Report! 

The market trades risk-off sentiment as the U.S. China trade war continues to play. The U.S. House of Representatives passed the Uighur Act, a bill to condemn the Chinese government for its mass internment of Uighur Muslims in Xinjiang. China has denounced the U.S. movement and has warned to take revenge.

It should be noted that the intensified political tensions will likely complicate the trade deal matters. As a consequence, the shared currency will likely struggle to pick up secure buying.

Economic Events to Watch Today

Let’s took at these fundamentals.


EUR/USD – Daily Analysis

The EUR/USD currency pair flashing red and representing marginal declines, mainly due to renewed trade tension between the United States and China. As of writing, the currency pair currently trading at 1.1079, having hit a high level of 1.1094 in the overnight trading hours. For now, the breakout may remain elusive if the key U.S. data releases ignore expectations by a big range, which is scheduled to release on the day.

The EUR/USD currency pair surged 0.58% on Monday, confirming its most significant single-day rise since September 17. The sharp rise neutralized the immediate bearish setup but failed to draw stronger buying pressure, leaving the pair below the November 21 high of 1.1097. A close higher is needed to confirm a bullish breakout.

However, that seems complicated due to fading optimism regarding the trade deal between the United States and China. President Donald Trump said that he would likely delay a trade deal with China until after the 2020 presidential election.

The U.S. House of Representatives passed the Uighur Act, a bill to condemn the Chinese government for its mass internment of Uighur Muslims in Xinjiang. China has denounced the U.S. movement and has warned to take revenge.

It should be noted that the intensified political tensions will likely complicate the trade deal matters. As a consequence, the shared currency will likely struggle to pick up strong buying.

Daily Support and Resistance

  • S3 1.0883
  • S2 1.097
  • S1 1.1025

Pivot Point 1.1057

  • R1 1.1112
  • R2 1.1145
  • R3 1.1232

EUR/USD– Trading Tips

With an increased level of uncertainty, the dollar is getting weaker, which is why the EUR/USD is on hold despite entering the overbought zone. At the moment, the pair is holding right below a strong triple top resistance level of 1.1090, having formed a series of bullish and bearish candles. 

Below this level, we can expect a slight retracement in the EUR/USD until 1.1060 and 1.1038. Conversely, the bullish breakout can lead EUR/USD prices towards 1.1120.


GBP/USD– Daily Analysis

The GBP/USD currency pair hit the 6-week high and taking rounds to 1.3000 on the day, mainly due to recent polls raid chances of the ruling Conservatives Partys victory in December snap election. As of writing, the cable currency pair is currently trading at 1.2994 and consolidates in the range of 1.2992-1.3004 ahead of key data.

However, the recent polls that showed the reducing lead of the Tories against the opposition Labour Party, the recent survey from the YouGov and Kantar signal increased the popularity of the Converaitce Party. 

At the Sino-US front, the chances of the United States and China phase-one trade deal getting reduce day by day. The United States President recently warned the deal might happen till late-2020 while the U.S. House announced sanctions on the senior Chinese diplomats.

Additionally, the Independent’s news that Hundreds of protesters march to Buckingham Palace over the U.S. President Trump NHS fears might have exerted additional pressure on the trading sentiment. As a result, stocks in Asia and S&P 500 Futures keep in the red zone.

Today, the traders are preparing for the key U.K. Services Purchasing Managers’ Index (PMI), anticipated to continue unchanged at 48.6, as well as the U.S. Markit Services PMI and ISM Non-Manufacturing PMI. Whereas the U.S. Markit data could reprint 51.6 figure, it’s ISM counterpart might decline to 54.5 from 54.7. Moreover, the US ADP Employment Change, forecast 140K against 125K prior, will likely offer additional pressure on market watchers.

Daily Support and Resistance

  • S3 1.2823
  • S2 1.2876
  • S1 1.2908

Pivot Point 1.2929

  • R1 1.2961
  • R2 1.2982
  • R3 1.3035

GBP/USD– Trading Tip

The GBP/USD is trading outside of the normal trading range, which was extending resistance around 1.2956. Now the same level is likely to work as a support. Traders may look for bearish retracement below 1.3000 psychological trading levels, but later, buying can be seen above 1.2965.


USD/JPY – Daily Analysis

The USD/JPY currency pair came under pressure and hit the multi-day low of 108.65, mainly due to fading optimism of the United States and China trade deal, as in result kept the JPY strong in the wake of risk-off sentiment. As of writing, the USD/JPY currency pair consolidates in the range between the 108.48 – 108.67.

Looking forward, Japan’s Jibun Bank Services Purchasing Managers’ Index (PMI) for November, expected 50.4 against 49.7, is likely to offer fresh direction to the pair during initial Tokyo open. However, the trader’s eyes will be on this week’s U.S. employment data and trade war headlines for fresh impulse.

Because of the lack of major catalysts from Japan, Friday’s key monthly jobs report from the U.S. is now getting more attention. As a consequence, today’s ADP Employment Change for November, forecast 140K against 125K earlier, will be closely observed for fresh direction. 

Concerning Friday’s employment numbers, the headlines Nonfarm Payrolls (NFP) is expected to increase from 128K to 180K, whereas Unemployment Rate and Average Hour Earnings (YoY) will likely remain unchanged at 3.6% and 3.0% respectively.


Daily Support and Resistance

  • S3 107.65
  • S2 108.42
  • S1 108.7

Pivot Point 109.2

  • R1 109.48
  • R2 109.98
  • R3 110.76

USD/JPY – Trading Tips

The USD/JPY currency pair flashing green and hit the bullish level of 109.19 from the 5-day low despite the broad risk-off sentiment. As of writing, the pair is consolidating in the range between the 108.95 – 109.20.

At the moment, the USD/JPY is trading with a strong bearish bias, and we may see a bullish reversal in USD/JPY somewhere around 108.800 level today. Below this, the pair can go after 108.500 level.

On the technical side, the USD/JPY has shown a dramatic dip until 108.950, the 50% Fibonacci retracement level. The pair has violated the bullish channel, which was supporting the safe-haven pair around 109.350. 

All the best!

Categories
Forex Market Analysis

Daily F.X. Analysis, December 03 – Top Trade Setups In Forex – Dollar Weakens Over ISM Manufacturing PMI 

The global financial markets are trading the weaker dollar sentiment in the wake of worse than expected ISM manufacturing PMI data. On the news, the Euro gained 0.5% to $1.1079, the largest percentage gain since September 17. The Markit Eurozone Manufacturing PMI (final reading) for November was released at 46.9 (46.6 expected). Similar PMIs for Germany and France were posted at 44.1 (43.8 expected) and at 51.7 (51.6 expected), respectively. While the Markit U.S. 

The Manufacturing Purchasing Managers’ Index (PMI) posted a final reading of 52.6 (52.2 expected and in preliminary reading), the Institute for Supply Management’s (ISM) Manufacturing PMI declined to 48.1 (49.2 expected) from 48.3 in October. Construction spending declined 0.8% on month in October (+0.4% expected, -0.3% in September).

Economic Events to Watch Today

Let’s took at these fundamentals.


 EUR/USD – Daily Analysis

The EUR/USD currency pair climbed 0.58% very sharply during the Monday, representing its most significant single-day upward movement since September 17. As of now, the currency pair is currently trading near the 1.1076. Notably, the outlook will likely shift to the bullish track if the currency pair crosses the November 21 figures high of 1.1097. That would confirm a double bottom breakout on the daily chart and create an opportunity for 1.12.

The breakout could be possible if we look at the dismal of the United States data, which was released on Monday. The Institute for Supply Management said its manufacturing index dropped to 48.1% in November from October’s 48.3%, confirming the 4th-straight month of contraction.

At the greenback front, as we know that the U.S. Dollar already shows losses in the wake of the weak data, and the focus will likely shift to the on-going trade tensions; in that case, the breakout will likely remain elusive.

The United States President Donald Trump administration said late Monday it is planning to impose tariffs up to 100% on around $2.4 billion of French goods in return to take revenge on France’s decision to impose a tax on digital services.

Looking forward, the Eurozone producer price index is scheduled to release at 10:00 GMT, and the US ISM-NY Business Conditions Index (Nov) will hit the wires at 14:45 GMT. These data sets rarely have a big impact on the currency markets. Although, the EUR may take hints from a speech by European Central Bank’s (ECB) member Benoir Coeure scheduled at 17:30 GMT.

On the bearish side, the November 29 low of 1.0981 is the level to beat for sellers. At press time, the pair is trading at 1.1075, representing little change on the day.

Daily Support and Resistance

S3 1.0883

S2 1.097

S1 1.1025

Pivot Point 1.1057

R1 1.1112

R2 1.1145

R3 1.1232

EUR/USD– Trading Tips

The EUR/USD pair concluded the day over 1.1065, the 38.2% retracement level on 4-hour chart. Weaker ISM manufacturing data from the U.S. economy is driving bearish bias for the EUR/USD pair ahead of NFP data, which is due on Friday. 

The EUR/USD has reached the triple top resistance area of 1.1085, which is keeping the Euro on hold below this area. Although the closing of candles below this level is suggesting chances of a bearish bias, the RSI and MACD value is still in the bullish zone. These may drive more buying in the EUR/USD currency pair. In the case of a bullish breakout of 1.1085, the EUR/USD may lead towards a 1.1120 trading level. 


GBP/USD– Daily Analysis

The GBP/USD currency pair flashing red and shifted from the recovery track to bearish track mainly due to greenback recovery. As of writing, the GBP/USD currency pair is currently trading at 1.2940. Moreover. The reason behind the cable pairs pullback could also the recent changes in the United Kingdom politics and careful trading ahead of the United States President Trumps London visit for the North Atlantic Treaty Organization summit.

Tory leader has recently been fired by the opposition or the media, which in turn might have reduced the scope of the Conservatives holding the British rule after the December election.

At the greenback front, the U.S. Dollar was found on the strong bearish track on Monday because the United States President Donald Trump announced a measure that shows the world’s largest economy’s preference for trade protection. Apart from this, the United States and China trade war regarding Hong Kong also leaving pressure on the greenback. Freshly, China announced sanctions over the US Non-Government Organization (NGO).

Looking forward, the United States President Donald Trump will visit London tomorrow for the NATV summit. By the way, traders are not expecting something from this meeting, but the United Kingdoms opposition parties will keep their eyes on the meeting between the United States and United Kingdom leaders to increase their earlier claims that the United Kingdom Prime Minister has plans to sell National Healthcare System to the United States.

On the economic calendar, the final figures of November month U.K. Construction Purchasing Managers’ Index (PMI) will be watched for fresh directions.

Daily Support and Resistance


S3 1.2823

S2 1.2876

S1 1.2908

Pivot Point 1.2929

R1 1.2961

R2 1.2982

R3 1.3035

GBP/USD– Trading Tip

The British pound was up for a second session as it edged up 0.1% to $1.2939. The Markit U.K. Manufacturing PMI (final reading) for November came in at 48.9 (48.3 expected). On Tuesday, the GBP/USD is trading with a strong bullish trend as it already has violated the symmetric triangle pattern at $1.2935. 

The symmetric triangle pattern typically breakout on either direction, but the weaker dollar causes a bullish trend in the GBP/USD. For now, the GBP/USD pair may find next resistance around 1.3015 along with immediate support around 1.2970 and 1.2930.  

On the 4-hour timeframe, the RSI and MACD are holding are still signaling bullish bias. Thus, let’s consider taking buying trades above 1.2950 to target 1.3010 today. 


USD/JPY – Daily Analysis

The currency figures marked the highest losses on Monday, mainly due to headlines from the United States flashed challenges to the global trade system. As well as, another reason behind the pairs bearish trend was downbeat data from the United States.

The United States and China phase-1 deal or steel tariff on South American economies, not to forget possible trade negative measures against the European Union, the United States ran the trade show during the Monday.

Moreover, the US ISM manufacturing numbers stayed in the contraction region for the 4th-consecutive month and increased uncertainties on the strength of the world’s largest economy.

At the data front, the market’s risk aversion hit Wall Street on the 1st-trading day of the month while the United States’ ten-year Treasury yields increased by 4-basis points to 1.82%. However, the latest figures seem to change with the S&P 500 Futures be quietly on the positive side with the U.S. government bonds on the waiting mood for fresh directions.

The United States President Donal Trump continues his hate factor for the Federal Reserve monetary policy, as Trump said that the Federal Reserve should lower rate and loosen, making us competitive with other countries, and manufacturing will SOAR. The greenback is very strong as compared to others. Whereas the Federal Reserve policymakers are on the blackout session, negative data from the United States keep decreasing the chances of any monetary policy stabilization due to conflicting comments from the United States President Donald Trump.

Additionally, a repeat of the November news that the Japan government is considering 25 Trillion Japanese yen (JPY) economic stimulus package, as per the NHK, recently crossed the wires while supporting the pair.

Daily Support and Resistance


S3 107.65

S2 108.42

S1 108.7

Pivot Point 109.2

R1 109.48

R2 109.98

R3 110.76

USD/JPY – Trading Tips

The USD/JPY currency pair flashing green and hit the bullish level of 109.19 from the 5-day low despite the broad risk-off sentiment. As of writing, the pair is consolidating in the range between the 108.95 – 109.20.

On the technical front, the USD/JPY has shown a dramatic dip until 108.950, the 50% Fibonacci retracement level. As we can see in the chart above, the pair has violated the bullish channel, which was supporting the safe-haven pair around 109.350. 

At the moment, the USD/JPY is trading with a strong bearish bias, and we may see a bullish reversal in USD/JPY somewhere around 108.800 level today. Below this, the pair can go after 108.500 level.

All the best!

Categories
Forex Market Analysis

Gold’s Descending Triangle Pattern – U.S. 0 China Trade Talk In Action! 

On Monday, gold prices fell after better-than-expected manufacturing figures from China soothed concerns of a slowdown in global growth while deficit-ridden auto catalyst metal rose to an all-time high.

Trump’s approval to pass the Hong Kong Human Rights & Democracy Act as a law could hurt trade relations because the Chinese Government has warned firm countermeasures against such action by the U.S. 

Ongoing trade talks between both economies were going positively, and the phase-one deal was expected to be signed before December 15. 

If the deal is not approved by then, the fresh tariff from the U.S. on Chinese goods would be imposed, and it would hurt the U.S. economy more than the previous tariff hike. Trump would like to avoid such a decision when he is so eager to get China to buy U.S. soybeans, pork, and other farm products, which is a part of the Phase-one deal.


Gold – XAU/USD – Daily Technical Levels

Support      Resistance 

1,455.89      1,469.43

1,447.72      1,474.8

1,434.18      1,488.34

Pivot Point 1,461.26

Speaking of the technical aspects, gold is stuck in a descending triangle pattern, which is keeping it supported around 1,450. Although gold has closed three black crows on the 4-hour chart, which typically signals a bearish trend, the investors are still looking for a reason to enter the market. The ISM manufacturing PMI may work as a catalyst to drive price action

On the lower side, a bearish breakout of 1,452 can fell to 1,442 while on the upper side, gold may find resistance around 1,464 today. Let’s look for sell trades below 1,462 today. Good luck! 

Categories
Forex Market Analysis

Daily F.X. Analysis, December 02 – Top Trade Setups In Forex – ISM Manufacturing PMI In Focus! 

The U.S. Dollar Index rose edged down to 98.27 from 98.33 during the previous week. The euro edged up 0.1% to $1.1015. Official data showed that November consumer prices in the eurozone increased 1.0% on year in November (+0.9% expected), and October jobless rate was at 7.5% (as expected, 7.6% in September). 

The U.S. stocks closed lower while ending November with the most significant monthly gain since June. The Dow Jones Industrial Average fell 112 points (-0.4%) to 28051, the S&P 500 lost 12 points (-0.4%) to 3140, and the Nasdaq Composite was down 39 points (-0.5%) to 8665.

Economic Events to Watch Today

Let’s took at these fundamentals.


EUR/USD – Daily Analysis

The EUR/USD currency pair hit the bearish track and continue to flashing red despite the positive China manufacturing data. As of writing, the EUR/USD currency pair currently trading near the 1.1018, representing slight declines on the day and consolidates in the range of 1.1015-1.1028.

The Caixin PMI, which surveys the small and medium-sized export-oriented units, increased to 51.8 in November from October’s 51.7 to record the fastest expansion in 3-3-years. While the official PMI released on Saturday also printed well above 50 to mark the first expansion in 13 months.

As in result, the risky assets getting bids due to data. For example, Japan’s Nikkei surged by1% in Asia, and the NZD/USD pair rose to a one-month high. Even so, the EUR currency is struggling.

Looking ahead, the EUR/USD currency pair may take bids if the European Central Bank (ECB) President Christine Lagarde’s pushes European leaders to boost spending, indirectly hinting low chances of more monetary stimulus in the foreseeable future. Notably, the Lagarde’s testimony is scheduled to happen at 14:00 GMT.

The market’s focus will shift to the U.S. data on the North American session. The US ISM Manufacturing PMI (Nov), due at 15:00 GMT, is forecasted to print at 49.4 against 48.3 in October. An above-50 print may put pressure on EUR/USD.

The final German and Eurozone PMI numbers scheduled to release in Europe may not have a big impact, unless they carry a significant upward or downward revisions to the preliminary figures released on November 22.


Daily Support and Resistance

  • S3 1.0915
  • S2 1.0962
  • S1 1.099

Pivot Point 1.1009

  • R1 1.1037
  • R2 1.1056
  • R3 1.1103

EUR/USD– Trading Tips

Traders are strengthening the downside bias amid positive NFP forecast, which is due to release later this week. The EUR/USD disrupted the tight trading range of 1.1016 – 1.0992 to trade near the 1.1020 trading level. 

At the moment, the EUR/USD’s now consolidating in a narrow trading range of 1.1030 – 1.1015. A bullish breakout of 1.1030 can lead the EUR/USD prices towards 1.1055, and on the lower side, 1.0985 endures the final support.


GBP/USD– Daily Analysis

The GBP/USD currency pair flashing red and representing 0.10% losses. As of writing, the cable pair is currently trading at 1.2915 and consolidates in the narrow range between 1.29107 and 1.2918 at the start of the week, mainly due to series of United Kingdom election polls which doing limited to affect a leading Tory sentiment.

The GBP currency was seen stronger in the recent times in the wake of Brexit Party promising not to stand against the Tories in voters where there is a sitting Tory MP, underpinning the probability of a Tory majority after the quick threat of no-deal Brexit.

The investors are now keeping their eyes on the election outcomes. Still, the market will likely hold the risks of talks between the United Kingdom and the European Union, which may cover any quick bullish move in the GBP on a Tory victory.

At the Sino-US front, doubts over the phase-one deal between the United States (U.S.) and China are weighing on the greenback, whereas recently, actual activity data from China adds strength to the risk sentiment.

Looking forward, the market will keep their eyes on the U.S. main event in the U.S. nonfarm payroll jobs report. We expect employees to increase by 200k in November, after the above-consensus 128k October print.

All traders will keep their eyes on the trade and political headlines November month Purchasing Managers’ Index (PMI) data from the U.S., and the U.K. will likely offer intermediate moves. Including, U.K. Manufacturing PMI, anticipated 48.3, will be the first to observe ahead of the U.S. Markit and ISM activity indices. 

Estimates suggest the Markit PMI remain unchanged at 52.2, but ISM Manufacturing PMI may rise to 49.9 from 45.5.

Daily Support and Resistance

  • S3 1.2784
  • S2 1.285
  • S1 1.2889

Pivot Point 1.2917

  • R1 1.2955
  • R2 1.2984
  • R3 1.3051

GBP/USD– Trading Tips

The cable pair is currently trading at 1.2915 and consolidates in the narrow range between 1.29107 and 1.2918 at the origin of the week, mainly due to series of United Kingdom election polls which doing limited to affect a leading Tory sentiment.

On Friday, the GBP/USD continues to above the suggested support level of 1.2880. The pair has formed neutral candles above this level as traders are waiting for a fundamental reason to get in the market. 

On the 2-hour timeframe, the RSI and MACD are holding near 50 and 0, suggesting neutral bias among investors. Therefore, we may see a slightly bearish trend in the GBP/USD below 1.29400 area until a 38.2% Fibonacci retracement level of 1.2900. Consider staying bullish above 1.2900 today to target 1.2945/65. 


USD/JPY – Daily Analysis

The USD/JPY currency pair hit the 6-months high 109.70; this is the highest level since May 30, by the way, the safe-haven currency Japanese Yen came under pressure after the upbeat China manufacturing data and uptick in the United States equity index futures.

As of writing, the USD/JPY currency pair is currently trading at 109.70, the highest level since May 30, and the S&P 500 futures are reporting a 0.30% rise.

As we all well aware that President Donald Trump signed the Hong Kong Democracy Bill. China criticized the move because interference into its internal matters regarding Hong Kong, China warned to take revenge.

However, China did not take any revenge so far, and that may support the risk assets. Moreover, the data released over the weekend showed China’s manufacturing sector unexpectedly increased in November. The purchasing managers’ index (PMI) for China’s manufacturing sector inched up to 50.2 in November from 49.3 in October. A reading above 50 indicates expansion.

At the greenback front, the U.S. dollar stayed little changed on Monday in Asia after the release of reliable economic data in the U.S. the previous week. The U.S. Dollar Index traded marginally higher early in the day, up 0.03% to 98.20 by 8:41 PM ET (01:40 GMT).

Looking forward, the initial indications of a turnaround in the world’s 2nd-largest economy support further upside in the risk assets and the USD/JPY pair. The Caixin China manufacturing PMI, which focuses on the small and medium-sized export-oriented units, printed above the estimate of 51.5 soon before press time.

Meanwhile, the bullish movement will likely weaken if the focus shifts to the negative news regarding the United States and China trade talks because the report came earlier today that the optimism between the United States and China decreased about the phase-one deal.


Daily Support and Resistance

  • S3 108.98
  • S2 109.25
  • S1 109.38

Pivot Point 109.53

  • R1 109.65
  • R2 109.8
  • R3 110.07

USD/JPY – Trading Tips

The USD/JPY is consolidating at 109.425, and it has just begun to trade in the overbought zone as the RSI and MACD are stuck in the overbought territory. On the 4 hour graph, the USD/JPY has created a Doji and Spinning top, which typically implies chances neutral bias in the USD/JPY. On the downside, the USD/JPY may drop towards 38.2% Fibonacci retracement until 109.150. Besides Fibonacci, the bullish channel is also supporting the USD/JPY at the same level. So look for taking a sell trade below 109.700 today to target 109.200 and buying above 109.300 to target 109.700. 

All the best!

Categories
Forex Market Analysis

Gold Choppy Trend Continues – What Next to Expect?

On Friday, the precious metal gold trade sideways in the wake of mixed fundamentals. Despite this, gold is still on track to post its most vital monthly drop in 3 years, as traders solicited evidence on the U.S.-China trade progress after the United States withdrew anti-government protesters in Hong Kong.

Earlier, the U.S. Section of Hong Kong law got criticized by China and Hong Kong as well. But we noticed only a limited reaction due to the thanksgiving day holiday in the United States. 

Furthermore, the criticism from the China State Council that Beijing will adequately resolve the trade disputes, and they will step up punishment for intellectual property infringement, seems to have played their role, keeping the safe-haven demand diminished.  

XAU/USD – Daily Technical Levels

Support Resistance 

1454.29    1459.19

1451.77    1461.58

1446.86    1466.48

Pivot Point 1456.67

Gold continues to trade within a narrow trading range of 1,463 – 1,451 as investors await for a fundamental reason to determine further trends in the market. In the meantime, the XAU/USD is likely to continue trading in the same trading range. 

On the downside, gold is presumed to find support at 1,452 area, and the violation of this could initiate further selling unto 1,442. The MACD is still holding in the buying zone, but the latest histograms are smaller than the previous one, signaling chances of a further bearish trend. 

Good luck! 

Categories
Forex Market Analysis

Daily F.X. Analysis, November 29 – Top Trade Setups In Forex – Brace for European Inflation Report! 

The U.S. dollar steadied against most major currencies on Thanksgiving day, with the ICE Dollar Index closing relatively unchanged on the day at 98.32. The euro edged up 0.1% to $1.1012. Official data showed that the eurozone’s Economic Confidence Index rose to 101.3 in November (101.0 expected) from 100.8 in October. Later today, November CPI (+0.9% on-year expected) and October jobless rate (steady at 7.5% expected) will be reported.

The German Federal Statistical Office will release November jobless rate (steady at 5.0% expected) and October retail sales (+0.2% on month expected).

Economic Events to Watch Today

Let’s took at these fundamentals.


EUR/USD – Daily Analysis

The EUR/USD currency pair found on the bearish track and representing 1.27 decline on the monthly opening rate of 1.1151. As of writing, the currency pair is trading near 1.10.

The EUR/USD currency pair is moving bearish at the end of November, having surged 2.33% during October. So, that was the most significant monthly increase since January 2018. However, the currency pair has come under pressure, pouring cold water over the optimism generated by October’s 2.3% gain.

On the other hand, Consumer spending, as represented by retail sales, is anticipated to have increased at an annualized rate of 1.1% in October, having increased by 3.4% in the previous month. The retail sales data is scheduled to release at 07:00 GMT.

Meanwhile, the data due at 08:55 GMT is expected to show the economy added 5,000 jobs in November, and the unemployment rate continued steady at 5%. The Post-German data, the focus would shift to the Eurozone consumer price index and the jobless rate, scheduled for release at 10:00 GMT. 

The EUR currency may come under the selling pressure and hit the bearish track if the German jobs data disappoint expectation. As we know, Germany is already facing bearish pressure from the external sector. If the labor market cools sharply, the consumers will likely shift on the purse saving mood, leading to a deeper economic recession.

On the other side, the EUR/USD currency pair will likely find love if the key data crosses the forecast figures. Notably, the gains could be short-lived due to the United States and China trade tensions. As we all well aware that President Donald Trump signed the Hong Kong Democracy Bill earlier this week, irritating China. That could hurt the trade matters.

Daily Support and Resistance


  • S3 1.0958
  • S2 1.098
  • S1 1.099

Pivot Point 1.1002

  • R1 1.1012
  • R2 1.1024
  • R3 1.1046

EUR/USD– Trading Tips

The EUR currency outlined a sideways trading pattern, which is signifying neutral bias among traders, and that’s mostly due to the limited volatility ahead of the weekend. However, traders are strengthening the downside bias put forward by the lower high at 1.1097 established on November 21.  

The 14-day relative strength index is proposing bullish bias, but it’s directing lower now as it’s valued may cross below 50. Let’s look for bearish trades below 1.1020 level today to target 1.1099 and 1.0960.


GBP/USD– Daily Analysis

The GBP/USD currency pair is consolidating in the narrow range of 1.2910-1.2917. The pair got support from the polls showing continued fame of the ruling Conservative Party. Moreover, probably the reason behind the lack of more strength is the stepping back of the United Kingdom Prime Minister Boris Johnsons from certain debates.

After the YouGov’s poll of a clear lead of the ruling Tory Party over the opposition Labour Party, accusations on the United Kingdom Prime Minster raised as he stepped back from the debate on channel4 and is yet to confirm an interview with BBC’s Andrew Neil, as per the Independent. Whereas the opposition leaders have started using rude words and media support the reaction, probably due to this, they will lose their fame ere the December snap election.

The Conservative’s boss was recently criticized by the opposition Labour Party leader Jeremy Corbyn regarding selling the National Healthcare Systems (NHS) to the United States, citing leaked government papers. The decreasing chances of another strong poll supporting the Troy leadership and the greenback recovery are the major catalyst to drive trading volume in the GBP/USD pair.

So far, the market risk sentiment is still directionless, with the United States’ ten-year Treasury yields taking rounds to 1.77% with Asian equities flashing mixed signals.

Looking ahead, the half-day trading session in the U.S. and shortage of data and events will likely keep the market unactive. However, political and trade headlines will entertain the traders.


Daily Support and Resistance

  • S3 1.2698
  • S2 1.2794
  • S1 1.2857

Pivot Point 1.2891

  • R1 1.2954
  • R2 1.2987
  • R3 1.3083

GBP/USD– Trading Tips

On Friday, the GBP/USD continues to above the suggested support level of 1.2880. The pair has formed neutral candles above this level as traders are waiting for a fundamental reason to get in the market. 

On the 2-hour timeframe, the RSI and MACD are holding near 50 and 0, suggesting neutral bias among investors. Therefore, we may see a slightly bearish trend in the GBP/USD below 1.29400 area until a 38.2% Fibonacci retracement level of 1.2900. Consider staying bullish above 1.2900 today to target 1.2945/65. 


USD/JPY – Daily Analysis

 The USD/JPY currency pair is flashing red and hit the session low near the 109.46, having hit the high of 109.60 three hours ago. As of writing, the currency pair is consolidating in the day’s range of 109.47-109.59.

The USD/JPY currency pair is stepping back, possibly following the slow descent of the S&P 50 futures. The index futures were down 0.10% in early Asia and are currently reporting a 0.26 decline. Bank of Japan’s (BOJ) Governor Kuroda was out on the wires a few minutes before press time asking for structural changes. Kuroda told Parliament that structural reforms must accompany fiscal and monetary stimulus measures to heighten the economy’s long-term growth potential and added that the central bank’s ultra-loose policy is aimed at boosting inflation to 2% and not monetize debt. 

Governor Kuroda’s comments are not surprising because the central bank has little capacity to stimulate, having run an expansionary monetary policy for more than 6-years. 

Looking forward, the Japanese Yen will likely continue to gain ground, because equities may trade risk-averse in the wake of the decision by President Trump to sign the Hong Kong Democracy Bill. 


Daily Support and Resistance

  • S3 108.42
  • S2 108.92
  • S1 109.24

Pivot Point 109.42

  • R1 109.74
  • R2 109.93
  • R3 110.43

USD/JPY – Trading Tips

The USD/JPY is consolidating at 109.425, and it has just begun to trade in the overbought zone as the RSI and MACD are stuck in the overbought territory. On the 4 hour graph, the USD/JPY has created a Doji and Spinning top, which typically implies chances neutral bias in the USD/JPY.  

On the downside, the USD/JPY may drop towards 38.2% Fibonacci retracement until 109.150. Besides Fibonacci, the bullish channel is also supporting the USD/JPY at the same level. So look for taking a sell trade below 109.700 today to target 109.200 and buying above 109.300 to target 109.700. 

All the best!

Categories
Forex Market Analysis

Gold Trade Sideways – Volatility Lacks Amid Thanksgiving!

On Thursday, the precious metal gold traded in a tight $5 range trading range as investors assessed the impact of U.S. support of Hong Kong rebels on its trade agreements with China.

Demand for safe-haven assets like gold, silver, and Japanese yen increased as the U.S. President Trump signed the Hong Kong Human Rights and Democracy Act in early Asia, reaffirming support for Hong Kong’s pro-democracy protests after the majority of the City’s districts turned in favor of pro-democracy candidates with record voter turnout this week.

While China has frequently warned the U.S. administration not to interference in their personal affairs, therefore, President Trump’s move will likely hurt the relationship with China at a time when both sides are trying to reach a “phase one” trade deal.

On the positive side, the United States and China trade deal nearness and the optimism surrounding the United Kingdom December election result supported the market’s riskier assets and moved the greenback.

Besides, the greenback strength was robust U.S. data that decreased market speculations that the excellent time for the world’s largest economy will soon be over.

The traders will have a few data to watch due to the United States holiday regarding thanksgiving data; it means that the trade and political headlines will keep the market active.


Daily Support and Resistance

  • S3 0.6746
  • S2 0.6762
  • S1 0.6769

Pivot Point 0.6779

  • R1 0.6786
  • R2 0.6796
  • R3 0.6813

Choppy dealing in gold remains as the yellow metal still maintains the full range of 1,464 – 1,452. Due to thanksgiving holiday today, we may not see much moves in the market. We can try to cap above 1,452 as below this gold can find next support nearby 1,447. The overall trend is likely to be mixed today.

Categories
Forex Market Analysis

Daily F.X. Analysis, November 28 – Top Trade Setups In Forex – Happy Thanksgiving! 

The U.S. dollar kept trading within a tight range on Wednesday, amid thin trading before the Thanksgiving holiday. The ICE Dollar Index closed broadly flat on the day at 98.31.

The British pound rose 0.5% to $1.2930. A U.K. election poll showed that the Conservative would retain a majority of seats in the parliament. The euro fell 0.1% to $1.1005, while USD/JPY gained 0.3% to 109.38. 

The Federal Reserve released the Beige Book, which stated that economic activity expanded modestly, the outlook remains positive, and growth is expected to continue into next year. Besides, theU.S. economic data, third-quarter GDP growth was revised to 2.1% (1.9% expected and previously estimated), and durable goods orders increased 0.6% on month in October (-0.9% estimated).

Economic Events to Watch Today

Let’s took at these fundamentals.


EUR/USD – Daily Analysis

The EUR/USD currency pair consolidates on the uncertain track and may face a hard time defending crucial support until the German inflation data blows past predictions, weakening dovish ECB expectations. Today, the German inflation data is scheduled to release at 13:00 GMT.

As of writing, the EUR/USD currency pair seems set for a possible break below 1.0994, which is the 61.8% Fibonacci retracement of the rally from 1.0879 to 1.1179.

At the USD front, the greenback got the support mainly due to the 3rd-quarter gross domestic product was updated higher to 2.1% from 1.9%, in the wake of positive consumer spending data. The Fed’s preferred measure of inflation, which strips out volatile food and energy prices, soared higher to 2.1% from 1.9% in the 2nd-quarter. The inflation gauge exceeded an expectation of 1.7%.

It must be noted that the upbeat data of the U.S. may push the greenback further high on the day. Traders will be likely to sell dollars over increases uncertainty as President Trump’s decision to sign the Hong Kong Democratic Bill has irritated the Dragon Nation, and fears have increased regarding side effects on the trade deal. This is evident from the 0.25% drop in the S&P 500 futures seen at press time.

Looking forward, the breakdown will likely remain elusive manly if the preliminary German consumer price index for November crosses expectations by a considerable range, creating the opportunity for the European Central Bank head Christine Lagarde to maintain her neutral-to-hawkish stance for some time.

On the flip side, the CPI is anticipated to drop 0.6% month-on-month in November, having increased by 0.1% in October. The EUR/USD currency pair may plan a notable bounce from $1.10 if the inflation figure crosses estimates by a significant margin.


Daily Support and Resistance

  • S3 1.0958
  • S2 1.098
  • S1 1.099

Pivot Point 1.1002

  • R1 1.1012
  • R2 1.1024
  • R3 1.1046

EUR/USD– Trading Tips

On the technical side, the EUR currency charted a bearish engulfing candle yesterday, strengthening the downside bias put forward by the lower high at 1.1097 established on November 21. On the technical side, indicating the route of least resistance is to the bearish. The 14-day relative strength index is suggesting selling conditions with as the RSI value holds below 50, and the daily MACD histogram is again printing deeper bars below the zero line, a sign of strengthening bearish momentum. Let’s look for staying bullish above or bearish below 1.1000 level today to target 1.1055 on the upper side and 1.0985 on the lower side. 

GBP/USD– Daily Analysis

The GBP/USD currency pair flashing green and hit the 4-day high to 1.2920, mainly due to the ruling Tory party, which will keep the helm of the United Kingdom with a vast majority. The YouGov Poll on the MRP model is highly appreciated for its forecasts regarding the United Kingdom’s result since they forecasted a suspended parliament in 2017. 

The poll suggests Conservatives gain 359 seats against the opposition Labour Party’s 211 seat estimate. Apart from this, It also shows that 43% of vote share will be allocated to the ruling Tories against Jeremy Corbyn-led Labour Party’s 32% expected share, which in turn indicates an 11-point lead of the Prime Minister (PM) Boris Johnson led Conservatives over the Labour Party.

On the other hand, the GBP/USD currency pair is found under pressure during the Asian session today. The GBP currency has initially fallen mainly due to expectations that the Tory announcement might leave a negative impact on the ruling party popularity ahead of the December Snap election. But now the GBP/USD is likely to find enough support below at the 1.2900 regions to bounce yet again. 

A report came from the Guardian’s journalist Owen Jones that the British Prime Minister Boris Johnson’s Conservatives have a significant majority over the Labour Party in the YouGov’s MRP poll.

Looking forward, the traders will just have limited data to trade as the United States enjoys thanksgiving holiday. Therefore, trade and political headlines will keep the market active.


Daily Support and Resistance


  • S3 1.2698
  • S2 1.2794
  • S1 1.2857

Pivot Point 1.2891

  • R1 1.2954
  • R2 1.2987
  • R3 1.3083

GBP/USD– Trading Tips

On Thursday, the GBP/USD has hit our previously suggested target level of 1.2880; in fact, it soared further to trade around 1.2940 level. Currently, the pair has entered the overbought zone, as we can see on the 2-hour timeframe, the RSI and MACD are holding near 70 suggesting chances of a bearish correction.

Therefore, we may see a slightly bearish trend in the GBP/USD below 1.29400 area until a 38.2% Fibonacci retracement level of 1.2900. Consider staying bullish above 1.2900 today to target 1.2945/65. 

 USD/JPY – Daily Analysis

The USD/JPY currency pair flashing red and dropped by 0.13% to 109.38, mainly due to fears regarding United States President Donald Trump’s decision to sign the Hong Kong bill. It may irritate China and could drop a negative impact on the trade talks. 

As a result, the safe-haven currency Japanese Yen has picked up buying. The USD/JPY pair is currently trading at 109.38, representing a 0.13% drop on the day. The pair has dropped more than 20 pips in the last 90 minutes or so. 

The U.S. President Trump signed the Hong Kong Human Rights and Democracy Act in early Asia, reaffirming support for Hong Kong’s pro-democracy protests after the majority of the City’s districts turned in favor of pro-democracy candidates with record voter turnout this week.

It must be noted that China has repeatedly warned the U.S. administration not to interfere in their internal affairs. Therefore, President Trump’s move will likely hurt the relationship with China at a time when both sides are trying to reach a “phase one” trade deal.

Looking forward, deeper declines could be in the offing if the Asian and European equities turn risk-averse concerning the latest political developments. 

At the USD front, the greenback found on the buying track during the United States trading hours on Wednesday, mainly due to official data, which showed the U.S. gross domestic product (GDP) increased 2.1% in the 3rd-quarter, driven by strong consumer spending. Notably, the pair hit a 6-month high of 109.61 before dropping on Trump’s decision to sign Hong Kong Democracy bill. 

Daily Support and Resistance


  • S3 108.42
  • S2 108.92
  • S1 109.24

Pivot Point 109.42

  • R1 109.74
  • R2 109.93
  • R3 110.43

USD/JPY – Trading Tips

The USD/JPY is trading at 109.425, and it has just entered the overbought zone as the RSI and MACD are stuck in the overbought territory. On the 4 hour chart, the USD/JPY has formed a tweezers top, which typically suggests chances of a bearish bias trend in the USD/JPY. 

On the downside, the USD/JPY may drop towards 38.2% Fibonacci retracement until 109.150. Besides Fibonacci, the bullish channel is also supporting the USD/JPY at the same level. So consider taking a sell trade below 109.500 today to target 109.200. 

All the best!

Categories
Forex Market Analysis

Daily FX Brief, November 26 – Major Trade Setups – Stronger Dollar Rules the Market

The U.S. Dollar Index rose 0.3% on the day to 98.27, lifted by stronger-than-expected U.S. economic data. The euro slid 0.3% to $1.1024. The Markit eurozone Manufacturing PMI posted 46.6 in November (46.4 expected, 45.9 in October), while Services PMI declined to 51.5 (52.4 expected) from 52.2.

The sentiment was lifted after Chinese President Xi Jinping called for Beijing and Washington to strengthen communications.

Regarding U.S. economic data, the Markit U.S. Manufacturing Purchasing Managers’ Index (preliminary reading) posted 52.2 in November (51.4 expected, 51.3 in October). The University of Michigan Consumer Sentiment Index (final reading) came in at 96.8 (95.7 expected).

Economic Events to Watch Today

Let’s took at these fundamentals.


EUR/USD – Daily Analysis

The EUR/USD currency pair looking flat and consolidates in the narrow range of 1.1012 / 1.1016. Looking forward, this pair will likely hit the 4-day winning rally mainly due to the hints came regarding a rate cut from the Federal Reserve President Jerome Powell on Monday that interest rates are unlikely to increase anytime soon.

Notably, Powell’s comments indicate the Federal Reserve is likely to hold rates steady for some time until the inflation spikes well above 2 percent.

Therefore, the markets will likely offer the greenback and supporting the EUR/USD currency pairs to hit the bullish level for the first time after November 19. As we know, the currency pair found oo the bearish track yesterday to confirm the 4th-consecutive daily decline.

While Powell’s comments may weigh over the U.S. dollar, the upside in the common currency looks limited, courtesy of weaker Eurozone and German PMIs released last Friday.

Whereas on the other hand, the Federal Reserve President Jerome Powell’s comments could leave the pressure on the greenback, the bullish move in the EUR currency looks limited in the wake of weaker Eurozone and the German PMIs released last Friday.

At the Sino-US front, the report came that the United States and China have reached on the solving trade deal and reduced the risk appetite sentiment in the market. That is visible from the flat action in the Chinese Yuan and the Australian dollar currency. Whereas, the futures on the S&P 500 are also trading in a sideways manner. 


Daily Support and Resistance

S3 1.1036

S2 1.1056

S1 1.1067

Pivot Point 1.1076

R1 1.1087

R2 1.1095

R3 1.1115

EUR/USD– Trading Tips

The EUR/USD traded as we forecast to drop to 1.1010 level after forming a bearish hammer candle during the previous week. For the moment, the EUR/USD is trading at 1.1020 level and has developed a bullish engulfing pattern on the 2-hour chart. It’s suggesting strong chances of a bullish reversal until 1.1040 and 1.1060 the 38.2% and 61.8% Fibonacci resistance areas. Let’s consider staying bullish above 1.1015 level today to target 1.1060. 


GBP/USD– Daily Analysis

The GBP/USD currency pair sidelined and consolidates in the narrow range near the 1.2900 mainly due to traders takes clues from the trade news and Federal Reserve Chairman Jerome Powell diverting markets attention off from the United Kingdoms matters.

At the Sino-US front, the report came that the official from the United States and China discussed the multiple ways to resolve the trade deal matter over the phone call raised the chances of the phase-1 deal between the world’s biggest nations. Traders are ignoring the rising uncertainty regarding the 2nd-phase deal.

Moreover, the United States Federal Reserve Chairman Jerome Powell crossed wires while delivering the speech at the Providence Chamber of Commerce Annual Meeting in Rhode Island. The Fed avoided giving any fresh hints regarding future monetary policy. By the way, his positive preference for household spending ruled out the negative comments regarding global trade and jobs increase.

As well as, the greenback increases its recent rally, whereas the risk sentiment stays almost positive due to the United States’ 10-year treasury yields and major stock indices.

In the United Kingdom (U.K.), the ruling Conservatives and the opposition parties are at each other after the Tory leader, Boris Johnson, released the party’s announcement during the weekend. Whereas the Labour Party is struggling to detect mistakes in the Tory promises, ordering from National Healthcare System (NHS) to Defence, the Liberal Democrats (LibDems) doubts the Prime Minister (PM) Boris Johnson led to party’s ability to offer smooth Brexit before the Christmas.

There is no significant data and event for decorating the economic calendar, so the traders will keep their eyes on the U.S. catalysts to plan near-term trading bias. Moreover, the 2nd-tier housing and manufacturing data will join Consumer Confidence and speech from the Fed Governor Lael Brainard.

Daily Support and Resistance

S3 1.2651

S2 1.2756

S1 1.2794

Pivot Point 1.2862

R1 1.29

R2 1.2967

R3 1.3073

GBP/USD– Trading Tips

On Tuesday, the GBP/USD has opened higher to 1.2865 following a massive fall to 1.2822 on Friday, which would yield consolidation ahead of another bearish wave from 1.2985 extends to 1.2775. Lets us reckon Nov’s low of 1.2769 as it supports the GBP/USD around the same level if 1.2825 level gets violated. Consider staying bearish below 1.2875 level today to target 1.2825 


USD/JPY – Daily Analysis

The USD/JPY closed at 108.917 after placing a high of 108.975 and a low of 108.596. Overall the movement for USD/JPY remained Bullish that day.

China said on Sunday that it would seek to improve protections for intellectual property rights, including raising the upper limits for compensation for rights violations. 

China rolled out plans to strengthen its rules on copyrights, patents, and trademarks. This subject has been one core sticking point in more than a year of trade negotiations with the United States.

It was reported that by 2022, China would be making progress in issues that have affected intellectual property rights enforcement, such as low compensation, high costs, and the difficulty of proof. And that a better system of protection should be placed by 2025.

The rules around Intellectual property rights have been a major complaint against China and have been boosting the dispute between the most significant economies from the year. It was reported by US International trade Administration in 2018 that the estimated Intellectual Property theft has cost American businesses up to $600 billion a year.

The unauthorized access to a wide range of commercially valuable business information, technical data, trade secrets, and proprietary internal communications by the Chinese Government has been a burden on US commerce. In response to this, the need to address intellectual property rules came out against China by Trump administration, which led to increased tariffs on thousands of products and cast uncertainty on business activity across the globe.


Daily Support and Resistance

R3: 109.38

R2: 109

R1: 108.77

Pivot Point 108.61

S1: 108.39

S2: 108.23

S3: 107.84

USD/JPY – Trading Tips

The USD/JPY is trading at 108.700, and it has just violated the triple top resistance area of 108.600. The closings of bullish candles above 108.600 level are extending support to the safe-haven currency USD/JPY. With this, the market opens further room for buying until 109.090 for the USD/JPY pair. Besides, the MACD and RSI are still holding in the bullish zone. Consider taking buying trades over 108.650 to target 109 today. 

All the best!

Categories
Forex Market Analysis

USD/CAD Completes 50% Retracement – Investor’s Eye Triple Top! 

The USD/CAD closed at 1.32993 after placing a high of 1.33014 and a low of 1.32542. Overall the movement of pair remained Bullish that day.

At 18:30 GMT, the Core Retail Sales from Canada came in favor of Canadian Dollar as 0.2% against the expectations of -0.1%, and the Retail Sales also supported the Loonie when came in as -0.1% against the expectations of -0.3%.

The Stronger than expected Retail Sales & Core Retail Sales data from Canada gave the impression of a robust Canadian economy in this time of global slowdown. The stronger Canadian Dollar pushed USD/CAD prices to the low of 1.32524 on Friday.

However, the pair USD/CAD got support from Strong US Dollar on Friday after the release of PMI from the United States. At 19:45 GMT, the Flash Manufacturing PMI of the United States showed an increase to 52.2 from the expectations of 51.5 for November. The Flash Services PMI was also increased to 51.6 for November from October’s 50.6. 

Stronger than expected PMI was very beneficial in raising the dropped USD/CAD on Friday. However, the upward trend for the pair continued and was further supported when the Consumer confidence from the University of Michigan was seen as favoring the USD. At 20:00 GMT, the Revised UoM Consumer Confidence Sentiment also raised to 96.8 from the expectations of 95.8.

The Crude Oil prices on Friday also dropped due to increased selling pressure by profit-taking activities of the traders who bought Crude Oil after the news of OPEC cut extension on Thursday. The fall in crude oil prices pressed the Commodity-linked Loonie, and hence, USD/CAD was further raised to place a high of 1.33014 at the ending day of the week.


USD/CAD – Daily Technical Levels

Support Resistance 

1.3269     1.3318

1.3237     1.3335

1.3187     1.3385

Pivot Point 1.3286

The commodity currency USD/CAD has completed 50% Fibonacci retracement at 1.3258. On the 2 hour graph, the pair has closed bullish engulfing candle, which is signaling bullish bias among traders. 

For the moment, the USD/CAD is facing strong support at 1.3290, along with a resistance at 1.3325. At the same time, the pair is also trading in a bullish channel, which is keeping the USD/CAD trading sentiment bullish.  

Consider staying bullish above 1.3286 with a stop loss below 1.3250 and take profit around 1.3325. All the best! </span

Categories
Forex Market Analysis

USD/CAD Completes 38.2% Fibo Retracement – Retail Sales Surpries!

The USD/CAD closed at 1.32846 after placing a high of 1.33249 and a low of 1.32694. Overall the trend for USD/CAD remained Bearish that day. Last month, the Central Bank of Canada held its Interest rates at 1.75% as expected and left the door open to a potential cut in later months. The Bank of Canada has not changed its monetary policy since October 2018, even its counterpart Banks, including the Federal Reserve of United States, has lowered its interest rates.

On Thursday, Stephen Poloz, the Governor of Central Bank of Canada, said that Canada’s monetary conditions were about right in the current economic situation, which has been challenged throughout by global trade tensions. He added that the central bank of Canada was watching whether the trade uncertainties affect the confidence of the economy in order to decide its future plans. In his views, the monetary conditions were about right in given situations.

He also compared the Canadian economic state with American and said that Federal Reserve cut its rates three times and was now down to where the Canadian rates were. He further added that Bank of Canada was concerned that the Canadian economy relies heavily on exports, and the global trade disputes, including the US-China trade war, were affecting it.

Stephen Poloz also mentioned about the new models that Bank of Canada was built on understanding the significant consequences climate change could impose on financial stability. The positive comments about the Canadian economy from Poloz gave strength to the Canadian Dollar and weighed on USD/CAD prices on Thursday.
On Data front, the ADP Non-Farm Employment change from Canada came in as -22.6K against the previous 25.7K.

Furthermore, the Crude Oil WTI prices rose on Thursday amid the hopes of OPEC cut extension and supported the rising Commodity Linked Currency – Loonie, which added in the Bearish trend of USD/CAD.

The downward trend of USD/CAD was also supported by the weak macroeconomic data from the American side on Thursday. At 18:30 GMT, the US Unemployment Claims for this week exceeded the expectations of 215K and came in as 227K and gave pressure to US dollars. At 20:00 GMT, the CB Leading Index came in as -0.1%, which was as expected. The Existing Home Sales also gave pressure to US Dollars when it came in as 5.46M against the expectations of 5.49M.

Besides, the Canadian retail sales data has just come out, and it may drive sell-off in the USD/CAD pair in the wake of optimistic data. Retail sales surged by 0.2% vs. a drop of 0.1% during the previous month.


USD/CAD- Daily Technical Levels
Support Resistance
1.326 1.3315
1.3237 1.3348
1.3182 1.3403
Pivot Point 1.3293

Technically, the USD/CAD has a complete 38.2% retracement at 1.3274, but the MACD histogram is holding below 0 levels suggesting further selling bias. The bearish breakout pattern can trigger a sell-off until 50% and 61.8% Fibo level of 1.3260 and 1.3240 level. Let’s consider staying bearish under .13293 level today. All the best!

Categories
Forex Market Analysis

Daily FX Brief, November 22 – Major Trade Setups – Who’s Up for ECB and PMI Data?

The U.S. Dollar Index edged up 0.1% on the day to 97.96, as investors remained prudent over the prospects of a U.S.-China trade deal. The U.S. President Donald Trump mentioned that China is not stepping up in trade negotiations, while the Wall Street Journal reported that China’s chief trade negotiator Liu He had invited his U.S. counterparts for more talks.

The U.S. Labor Department reported that initial jobless claims amounted to 227,000 for the week ended November 16 (218,000 expected, 227,000 in the prior week). Existing home sales grew to an annualized rate of 5.46 million units in October (5.49 million units expected, 5.36 million units in September).

Economic Events to Watch Today

Let’s took at these fundamentals.


EUR/USD – Daily Analysis

The EUR/USD currency pair flashing green and will likely hit the bearish track if the new European Central Bank President Christine Lagarde sounds dovish in her first policy speech. So, let’s see what will happen.

As of writing, the EUR/USD currency pair currently trading near 1.1063, showing a 0.12% increase in the trading hours, by the way, the pair hit the high of 1.1097 yesterday. The new European Central Bank President Christine Lagarde will be giving her first big policy speech at a banking conference in Frankfurt. She avoided talking regarding the monetary policy during her last November 4 speech in Berlin.

It should be noted that the dovish comments may send the EUR/USD currency pair near the bearish level of 1.10. The EUR currency will likely cancel the next bearish move if the Lagarde sounds hawkish regarding the policy and calls for more effort on the fiscal front.

On the other hand, the recent report came that many board members held against the previous President Draghi’s decision to add further stimulus in September. So, Lagarde has limited opportunities to raise expectations for more stimulus. Moreover, Germany avoided recession in the 3rd-quarter.

According to the forecast, the chance of Lagarde sounding neutral-to-hawkish is high. However, the resulting increases in the EUR will likely to be canceled if the preliminary Eurozone and German PMI, scheduled for release after Lagarde’s speech, disappoint expectations. The final figures for Germany’s 3rd-quarter GDP, recorded at 07:00 GMT.

Daily Support and Resistance

S3 1.0981

S2 1.1026

S1 1.1044

Pivot Point 1.107

R1 1.1089

R2 1.1115

R3 1.116

EUR/USD– Trading Tips

The currency pair created a bearish hammer candle on Wednesday, indicating the bullish move from its recent lows below 1.10 has run out of steam and sign of an aggressive bearish move. However, a bearish reversal will be confirmed if the EUR/USD pair closes below the candle’s low of 1.1053 (a hammer) on Thursday. Also, a close above 1.1081 would negate the bearish hammer and signal a resumption of the recovery rally.


GBP/USD– Daily Analysis

The GBP/USD currency pair found on the bullish track the first time after the starting of the week due to a variation in the market trade sentiment. While the pair is currently taking bids to the 1.2920.

The recent recovery could partially be attributed to the silence before taking a decisive turn in the US-China trade tussle. As per the Reuters, the United States (U.S.) may delay December 15 tariff hikes while the CNBC’s news of China still having U.S. trade negotiators on their invitation list triggered risk recovery. Even so, the U.S. Navy’s claim of “Freedom of Navigation” in the South China Sea was harshly criticized by Beijing.

We may say that the recent recovery in the GBP/USD currency pair inspired by the silence before happening any positive activity in the United States and China trade deal. Moreover, the chances that the United States will likely delay the increased tariff on Chinese goods. In contrast, China invited the United States negotiators, recently trying to restore the sentiment of the market. 

However, uncertainties still surrounding the United States and China trade deal because China now awaits the United States President Donald Trumps to proceed with the Hong Kong bill after congress passed the much-criticized bill.

On the economic calendar, Markit is scheduled to release preliminary readings of the U.K.’s Manufacturing and Services Purchasing Manager Index (PMI) figures, whereas the US PMIs and Michigan Consumer Sentiment Index will also enhance the line.

On the other hand, the month brings the first flash PMIs for the U.K. For the manufacturing PMI, we look for a bit of a pullback to 49.3 (market: 48.8), as election uncertainty weighs on sentiment. Notably, the Chances for Sino-US trade deal and hard possibilities of hard Brexit should support the PMI above its lows from the summer.

Daily Support and Resistance

S3 1.277

S2 1.2847

S1 1.2878

Pivot Point 1.2924

R1 1.2955

R2 1.3001

R3 1.3078

GBP/USD– Trading Tips

On the technical side, bears look for a daily closing below 21-day Simple Moving Average (SMA) level of 1.2880 to try for monthly low surrounding 1.2770, until then 1.3000 and 1.3015 will stay on buyers’ radars. 

On a shorter timeframe, the GBP/USD is trading with a bullish bias at 1.2930. The bullish trend is mostly triggered due to the Three White Soldiers pattern, which is suggesting a strong buying trend in the GBP/USD pair. On the upper side, the immediate target is likely to be 1.2960. 


USD/JPY – Daily Analysis

The USD/JPY currency pair is sideways near the 108.60 and consolidates in the narrow range of 408.46 and 108.70 because markets want more transparency on the trade deal between the United States and China. 

At the Sino-US front, the chances that the United States will likely delay the increased tariff on the Chinese goods. In contrast, China invited to the United States negotiators, as delivered by the South orning Post and the Wall Street Journal, recently trying to retore the sentiment of the market. However, uncertainties still surrounding the United States and China trade deal because China now awaits the United States President Donald Trumps to proceed with the Hong Kong bill after congress passed the much-criticized bill.

Finally, the greenback drifted a little higher, whereas the United States’ two-year Treasury yields bounced off 1.55% to 1.60%. The ten-year yields rose from 1.71% to 1.78%. Markets are pricing a terminal funds rate of 1.20% (vs. 1.63% currently).

U.S. stocks closed modestly lower with the Dow Jones Industrial Average, DJIA, losing 54.8 points, or 0.2%, to 27,766.29 while the S&P 500 dropped back 4.92 points, or 0.2%, to 3,103.54. The Nasdaq Composite index fell 20.52 points, or 0.2%, to 8,506.21, having closed at its highest levels at the start of the week.

At the Japan front, the Japan October Consumer Price Index was expected to tick up fractionally, to 0.3% YoY overall, 0.6% YoY ex-fresh food & energy. 

Daily Support and Resistance

S3 108.11

S2 108.35

S1 108.48

Pivot Point 108.59

R1 108.72

R2 108.83

R3 109.07

USD/JPY – Trading Tips

The USD/JPY is trading at 108.500, just below the bearish trendline, which is extending resistance at 108.700 area. The closing od Doji candle below 108.700 level saying a lot about investors’ sentiment. On the other hand, the MACD and RSI are still holding in the bullish zone. 

Due to different sentiments, we should keep a close eye on 108.550 level today as the USD/JPY can trade bearish below and bullish above this level. On the lower side, the target remains 108.250, while 109 remains the bullish target. 

All the best!

Categories
Forex Market Analysis

Gold’s Bullish Channel In Test – Can We See a Breakout?

On Thursday, the gold prices y eased from the last session’s two-week high after a report that China has invited top U.S. negotiators for a new round of face-to-face talks, and is seeking to reach a primary trade treaty with the United States.

Safe-haven demand is also dominating the market as it was further disturbed after the U.S. Senate passed a bill against China and in favor of Hong Kong on Wednesday. Both the U.S. House and Senate signed the Bill via a veto-proof majority. 

According to the act, annual certification of Hong Kong’s autonomy would be required, and punishment will be imposed on Beijing against suppressing protestors. China demanded the United States to stop interfering in its internal affairs and said that it would retaliate.

Later, on Wednesday, FOMC October’s Meeting minutes were released and showed that there would not be any further rate cut this year. 

The holding of monetary policy and rate cuts by federal reserve was already expected, so it didn’t make much impact on the precious metal gold. 

Minutes revealed that most officials of Federal Reserve were against the 4th rate cut this year. Some officials supported rate cut but also said that it was a close call. 

Officials were concerned that some banks had decreased the capital buffers when they should be rising. Minutes also revealed that risks to the economic outlook remained tilted to the downside. Many officials said that rate cut was warranted due to global weaknesses and trade uncertainty.


XAU/USD – Technical Levels

Support    Resistance 

1,465.41    1,478.36

1,459.2      1,485.1

1,446.25    1,498.05

Key Trading Level: 1,472.15

On the technical side, gold prices are trading within a bullish channel, which is supporting the XAU/USD above 1,466 level. The MACD and RSI are holding below 0 and 50, respectively, suggesting changes of a bearish breakout. If this happens, gold prices may drop further until the 1,456 level. Therefore, consider taking sell positions below 1,465 level today. 
cript>

Categories
Forex Market Analysis

Gold Set to Test Pivot Point – Buyers Loom Around the Corner! 

On Wednesday, the precious metal gold prices soared to their peak levels in nearly two weeks as U.S. Senate activity on Hong Kong produced a likely obstacle to a trade deal between the United States and China, bending demand for riskier assets.

The Chinese news outlet Global Times reported that U.S. & China had a long way to go to end the trade dispute and to come to terms. 

CNBC reported on Monday that China would wait for the outcomes of 2020 U.S. Presidential elections before signing a trade deal. It was also said that China appeared to set on “wait till Trump out” rather than focusing on the Phase-one deal.

The phase one deal was highly skeptical from the beginning due to red lines of enforcement mechanism, Intellectual properties, and subsidies. Trump, on Tuesday, in response to the Chinese reluctance to sign the deal, gave threats to China that he would impose more duties on Chinese goods by 15 December if the phase-one deal was not signed by then.


Gold – XAU/USD – Technical Outlook

Gold extends to trade in a bullish trend at 1,474 levels in the wake of U.S. China trade risks. On the 4 hour graph, the yellow metal has violated the ascending triangle, which was extending hurdle to gold around 1,472 area. Now, this level is working as a support. 

Support    Resistance
1466.46    1476.85
1460.46    1481.25
1450.06    1491.64
Pivot Point 1470.85

Gold prices still hold over 50 EMA, which is expected to support it near 1,470 marks. The recent bearish trend in gold is likely to from three black crows pattern on gold, which may lead to gold prices below the 1,470 level and even towards 1,466. That’s where we can expect to take a buying trade today. Good luck! 

Categories
Forex Market Analysis

Daily FX Brief, November 20 – Major Trade Setups – Eyes on U.S. FOMC Meeting Minutes! 

The U.S. dollar was steady ahead of the release of the latest Federal Reserve monetary policy meeting due later today. The Dollar Index closed broadly flat at 97.82. While media reported that the U.S. and China are discussing the size of tariff rollbacks, President Donald Trump cautioned to force higher tariffs in case a deal is not reached.

Economic Events to Watch Today

Let’s took at these fundamentals.


EUR/USD – Daily Analysis

The EUR/USD is flashing red and will likely slip from its recovery rally, and today’s close will decide the next direction. As of writing, the currency pair fluctuating in the bearish range of 1.1084-1.1063 and representing declines on the day within yesterday’s bullish and bearish range of 1.1090 and 1.1048. 

On the technical side, the EUR/USD pair created an inside bar candlesticks pattern today. Moreover, a close above the inside bar’s high of 1.1084 is needed to improve the recovery rally from 1.0989. While a close below the inside bar’s low of 1.1063 would suggest a bearish reversal.

On the other hand, the United States ten-year yields hit the two-week low of 1.763% and have dropped almost 20-basis-points since the topping out at 1.972% on November 7. Apart from Yields, the United States and China trade concerns are sending the risk assets danger.

It should be noted that the market flow may stand in favor of sellers if the FOMC’s 29-30 October meeting sounds hawkish. The meeting is scheduled to happen at 29-30 October19:00 GMT.

However, the hawkish tone has to be strong because, as we know, the financial markets have confirmed that the rate cuts by the Federal Reserve will not deliver until June of 2020.

According to Germany’s influential BDI industry association’s Managing Director Joachim Lang, manufacturing production in Europe’s economic powerhouse is anticipated to decrease by 4% this year.

Daily Support and Resistance

S3 1.1036

S2 1.1056

S1 1.1067

Pivot Point 1.1076

R1 1.1087

R2 1.1095

R3 1.1115

EUR/USD– Trading Tips

The EUR/USD displayed bearish behavior after testing the resistance mark of 1.1090. Today, the EUR/USD pair has violated the upward channel, which supported the pair around 1.1080 level, and it’s now extending it towards 1.1050 level. Consider taking sell positions below 1.1075 today with the aim of 1.1040. 


GBP/USD– Daily Analysis

The GBP/USD pair hit the bearish track for the second consecutive day and representing 0.19% declines on the day, mainly due to uncertainties surrounding the Tory leader’s public favor after the ITV debate. By the way, the cable pair is currently trading at 1.2915.

At the broadside, the ITV debate, which happened between the Tory and the opposition Labor leaders, seemed peaceful as both parties showed a relaxed attitude during holding to part and of Brexit and 2nd referendum, respectively. At the end of the debate, the survey surprise the GBP/USD pairs traders because the United Kingdom Prime Minister Boris Johson got only 51% votes in his favor whereas, on the other hand, the opposition party leader Jeremy Corbyn got 49% votes. 

In addition to the recent polls of the ITV’s debate, the uncertainties over the UK PM’s refrain from publishing the news of Russian interference into the Brexit referendum and delaying the corporate tax forms also simulate challenges to the Tory administration.

At the greenback front, another reason behind the GBP/USD pairs weakness is that the U.S. Dollar extended its gains and offer more weakness to the GBP/USD pairs mainly due to the favorable housing market data from the United States. It also helped the US Dollar strength the United States Federal Reserve policymaker John C. Wiliams continued support for the current monetary policy also supported the U.D. buyers.

At the Sino-US front, the greenback extended its recovery streak on the day due to the risk-off arisen by the United States and China trade war regarding the Hong Kong bill. The risk-tone also weighs down amid on-going protests in Hong Kong and Israel. As a consequence, the U.S. 10-year treasury yields drop to 1.75%.

Looking forward, all the market’s eyes will be on the Feral Open Market Commmetiiees latest monetary policy meeting, which is scheduled to happen on 29-30 October, whereas the trade and political headlines will likely keep the trader entertaining.

Daily Support and Resistance

S3 1.2816

S2 1.2876

S1 1.2901

Pivot Point 1.2935

R1 1.296

R2 1.2995

R3 1.3055

GBP/USD– Trading Tips

The GBP/USD is consolidating in a sideways range of 1.2970 – 1.2890 as bearish bias dominates despite weakness in the U.S. dollar. The GBP/USD pair may face double top resistance at 1.2975 on the 4-hour chart. While support stays at 1.2890 level today. Below this, the GBP/USD may head towards 1.2855. 

The leading indicators such as a MACD and RSI, are holding in the selling zone, suggesting chances of more selling. Consider staying bearish below 1.2935 today. 


USD/JPY – Daily Analysis

The USD/JPY currency pair representing marginal declines and having hit the low of 108.36, the pair is currently trading at 108.50. As of writing, the pair is fluctuating in the range of 108.38/57, mainly due to weakness in the Treasury yields and lack of fresh impulse in the trade war and Brexit.

On the green side, the USD/JPY currency pair has recovered from session lows but remains on the defensive below 109.07 despite the weakness in the Treasury yields.

At the Sino-US front, the greenback extended its recovery streak on the day due to the risk-off arisen by the United States and China trade war regarding the Hong Kong bill, and Beijing warned the United States to do not interfere in this matter. The risk-tone also weighs down amid on-going protests in Hong Kong and Israel. As in consequence, the U.S. 10-year treasury yields drop to 1.75%.

At the Brexit front, the ITV debate, which is happened between the Tory and the opposition Labor leaders, seemed peaceful because both parties showed a relaxed attitude during holding to part and of Brexit and 2nd referendum, respectively. However, at the end of the debate, the United Kingdom Prime Minister Boris Johson got only 51% votes in his favor, whereas, on the other hand, the opposition party leader Jeremy Corbyn got 49% votes. 

Meanwhile, the Fedspeak came with New York Federal Reserve president Williams announced that the economy is in a “good place.” The U.S. 2-year Treasury yields roundtripped between 1.59% to 1.62%, while the 10-years initially rose from 1.80% to 1.83% but was then sent back to 1.78%. 

Daily Support and Resistance

S3 107.84

S2 108.23

S1 108.39

Pivot Point 108.61

R1 108.77

R2 109

R3 109.38

USD/JPY – Trading Tips

The USD/JPY is trading at 108.40, as the bearish engulfing candle on the 2-hour chart is suggesting a strong bearish bias for the pair. Closing of another bearish candle will confirm bearish setup and the safe-haven currency pair USD/JPY may drop towards 108.200 today.  

On the higher side, resistance stays at 108.600 level. 

All the best!

Categories
Forex Market Analysis

Gold’s Ascending Triangle Plays – Is It Good Time to Buy?

On Tuesday, gold slid erasing profits from 1,470 t0 1,464 level earlier in the session, as a temporary respite from Washington for China’s Huawei increased confidence for a trade agreement between the nations and increased risk sentiment.

The yellow-metal prices dropped during the last week mainly due to the Commerce Secretary Wilbur Ross and White Hosue’s economic adviser Larry Kudlow hinting that the United States and China were close to signing the deal. That sent the three major stocks indexes to record highs on Wall Street.

On the other hand, Donald Trump met with Federal Reserve Chairman Jerome Powell and Treasury Secretary Steven Mnuchin at the White House overnight to discuss the economy and the greenback weakness.

Powell’s remarks were consonant with his statements at his congressional hearings last week the Fed said in a statement released after the meeting. In contrast, the United States President Donald Trump said the meeting was “very good.”

Risk appetite was shaken due to the news that Trump and Fed Chairman Powell had met to discuss the tendency of the dollar. There were rumors of a CNBC report that Chinese officials were involved over prior comments concerning tariffs from Trump.


XAU/USD – Daily Technical Levels

Support Resistance 

1,460.54    1,478.16

1,449.67    1,484.91

1,432.05    1,502.53

Pivot Point 1,467.29

Gold is trading at 1,468 level, bouncing off above 1,464 support level. On the 4 hour timeframe, it has formed an ascending triangle pattern, which is extending its resistance around 1,474. While the bullish trendline is likely to support the pair around 1,464 level. 

The recent bullish closing above 1,464 level is suggesting the market to retrace back upward until 1,472 level. While on the flip side, a bearish breakout of 1,464 can lead gold prices towards 1,456.

All the best!

Categories
Forex Market Analysis

Crude Oil Bearish Retracement In Play – Brace for a Bullish Trade!

The WTI crude oil prices slightly dropped even after positive headlines regarding the United States and China trade news. Chinese state media Xinhua reported that Chinese Vice Premier Liu He discussed an incomplete deal with U.S. Treasury Secretary Steven Mnuchin and U.S. Trade Representative Robert Lighthizer in a phone call during the weekend.

Both sides had helpful discussions about “each other’s core concerns,” the article said. The USTR confirmed the call took place. Besides, the Asian stocks got the support due to the headlines, but unfortunate WTI crude oil prices were little impacted.

A monthly report from the International Energy Agency (IEA) was cited as a potential catalyst for selling today. The IEA estimated that non-OPEC supply growth would grow to 2.3 million barrels per day (BPD) next year compared with 1.8 million BPD in 2019.

Daily Support and Resistance

S3 54.44
S2 55.98
S1 56.99
Pivot Point 57.53
R1 58.54
R2 59.08
R3 60.63

The oil prices remained under pressure over the data that showed weekly U.S. crude stockpiles surge by 2.2 million barrels, crossing the forecast of a 1.649 million-barrel rise.

WTI Crude Oil – Trade Idea 

Consider taking buying positions above $57.20 with a take profit at $57.75 and stop loss of $56.90.

Categories
Forex Market Analysis

Daily FX Brief, November 18 – Major Trade Setups – Risk-on Sentiment In Play

On Monday, the market trades with a risk-on sentiment over the faded safe-haven appeal. Significant forex pairs indicated time on Monday as traders observed to whether Washington and Beijing can promptly approve an agreement to end a trade war that has been a drag on word’s economic growth.

  EUR/USD – Daily Analysis

The EUR/USD currency pair hit the bullish track and currently trading at 1.1061, As of writing, the pair consolidates between the range of 1.1048 – 1.1065 on the day and hit the weekly highs at 1.1065 mainly due to greenback weakness against the bucket of currencies. The buyers join the latest bullish trend, awaiting fresh trading clues and keep their eyes on ECB-speak.

On the EUR-side of the equation, the Eurozone October inflation came in as expected, up by 0.7% YoY and core CPI up by 1.1%, which supported the continuing bullish drive in the common currency.

Looking forward, the buyers target the 100-DMA now located at 1.1093 should the recovery momentum continue. On the other side, the 50-DMA at 1.1042 could defend the downside if the ECB speakers support dovish expectations. However, the United States and China’s trade progress will keep under the spotlight for getting the fresh impulse.


Daily Support and Resistance

S3 1.0957

S2 1.0999

S1 1.1026

Pivot Point 1.1042

R1 1.1069

R2 1.1084

R3 1.1126

EUR/USD– Trading Tips

The EUR/USD proceeds to trade higher, violating the resistance level of 1.1000, which now is working as a support. On the 4 hour timeframe, the EUR/USD has three white soldiers candlestick pattern, which is signaling chances of further buying in the EUR/USD. At the moment, the EUR/USD is holding at the resistance level of 1.1065 as above this; the pair can continue to soar until 1.1080. So consider staying bullish above 1.1065 and bearish below the same level today.

GBP/USD– Daily Analysis

The GBP/USD currency pair consolidates in the range of 12909 – 1.2933, representing 0.20% gains on the day. As of writing, the pair is currently trading at 1.2925 and faced a month old falling trend line resistance due to the increasing expectations of Tory leadership after the December elections. As well as the hardship for the United Kingdom Prime Minister Boris Johnson, limit the further pair’s upside.

The market’s trade sentiment still slows with the United States’ ten-year treasury yields taking rounds to 1.82%, whereas most Asian shares are flashing mixed signals.

Looking forward, traders will now keep their eyes on British prime minister Boris Johnson’s speech at Confederation of British Industry’s annual conference for getting a new direction to move ahead. At the economic calendar front, the US NAHB Housing Market Index figures for November, expected to remain at 71, will keep the thin line of statistics. However, trade and political headlines will keep under the spotlight.


Daily Support and Resistance

S3 1.2793

S2 1.2845

S1 1.2874

Pivot Point 1.2897

R1 1.2926

R2 1.2949

R3 1.3001

GBP/USD– Trading Tips

The GBP/USD continues to trend upward to test our previously suggested upper corner of a wide trading range of 1.2970 – 1.2780. 

The MACD and RSI are lingering in overbought territory as their values linger at 0 and 50, respectively. Besides this, the chances of bullish correction are becoming very strong. 

At the time, the GBP/USD trades at 1.2940 level, and it may find support immediate support around 1.2920. I will consider taking buying positions above 1.2920 and bearish positions if this level breaks on the lower side. 

USD/JPY – Daily Analysis

The USD/JPY currency pair consolidates in the narrow range between the 108.75 and 109.00, mainly due to intensifying tensions in Hong Kong and lack of trade war hopes.

So, the risk-off sentiment raises so far, with S&P 500 futures down -0.15%, Treasury yields falling almost 0.50%, whereas the Asian equity markets trade with moderate losses. The Japanese Yen currency still on the supported track and keeping a break above the 109 range.

If talking about the greenback, the U.S. Dollar still on the bearish track due to the losses in the Treasury yields. As in result, this situation sending lower the USD/JPY currency pair. Moreover, the investors are on the waiting mood and await some transparency regarding the United States and China trade deal and FOMC minutes for fresh trading direction, because the United States economic calendar seem light during this week.

As of writing, the U.S. Dollar Index traded 0.1% lower to 97.810. The Federal Reserve will announce the minutes of it’s October meeting on Wednesday, and several Federal Reserve policymakers are scheduled to speak before the upcoming Thanksgiving holiday.


Daily Support and Resistance

S3 107.96

S2 108.33

S1 108.55

Pivot Point 108.7

R1 108.93

R2 109.08

R3 109.45

USD/JPY – Trading Tips

The USD/JPY is trading at 108.90, crossing over 61.8% Fibonacci retracement level. This level also marks a double bottom resistance level, but that has now been violated and may keep the USD/JPY pair supported today.

The violation of the 108.90 level can extend buying until 109.200. The MACD and RSI are also supporting the bullish trend in the USD/JPY pair. 

All the best!

Categories
Forex Market Analysis

Gold’s Bullish Channel Supports – U.S. China Sentiments Remains Mixed!

On Friday, gold prices declined the demand for safe-haven assets fell remarks from White House economic adviser Larry Kudlow that the United States is pretty close to settling an interim trade agreement with China.

Fresh certainties regarding the United States and China trade deal returned after the goodwill gestures by the Dragon nation as China lifts the restrictions on the United States poultry imports. Additionally, the headlines of the restart trade talks later on the day also improve the risk-on market.

At the Kudlow front, the latest comments from the White House Economic Adviser Kudlow announce that we are very close to getting the trade deal with China, so in the consequences, the bounce-back came in the U.S. Treasury yields and S&P 500 futures.


XAU/USD – Daily Technical Levels
Support Resistance
1,465.42    1,476.06
1,459.45    1,480.73
1,448.81    1,491.37
Pivot Point 1,470.09

On the 2 hour chart, the yellow metal gold is trading in a bullish channel, which is supporting it around 1,461 level along with a resistance level of 1,473. The new 2-hour candle is bullish marabou, which signals the chances of a bullish trend in gold.

The leading indicators, such as MACD and RSI, are still trading below 0 and 50 level, supporting the bearish bias in gold. With that being said, gold prices may drop further until 1,452 level of it manages to give us closing below 1,460 level.

Likewise, the bullish breakout of 1,473 resistance opens further room for buying until 1,479.

Categories
Forex Market Analysis

Daily FX Brief, November 15 – Major Trade Setups – Core Retail Sales In Focus! 

The US greenback has stretched back a little versus the Japanese yen, as risk-off sentiment dominated the market. That being said, this market is highly sensitive to risk appetite, so with the multitude of problems that the global economy has right now/ Friday is a calm day ahead of the data aspect. There are no economic figures due from the United Kingdom to give the Sterling with direction.

Economic Events to Watch Today

Let’s took at these fundamentals.


EUR/USD – Daily Analysis

A day before, the EUR/USD currency pair traded on the bearish track as on the way a stable support level of 1.0990 was there to stop its movement. As we know, the German Q3 GDP showed the Eurozone’s largest member miss entering Techincal slowdown but overall look still darker. 

As of writing, the EUR/USD currency pair seen on the bearish track and losing almost 160 ticks during the last ten trading session. At the starting of the month, we observed the 200-day Moving Average as a robust range for the EUR/USD pair to hit, which it proved, and any support from the 50 and 20-day Moving Average proved short-lived.

As of now, the EUR/USD currency pair continues to move lower with the 1.1000. The EUR/USD currency pair on the overselling track, but this may well slow down and not change its direction. A double at the 1.0879, while these targets remain near and achievable. 

Daily Support and Resistance

S3 1.0936

S2 1.0974

S1 1.0998

Pivot Point 1.1013

R1 1.1037

R2 1.1052

R3 1.109

EUR/USD– Trading Tips

The EUR/USD continues to trade lower, maintaining a bearish bias after violating the support level of 1.1000. On the 4 hour timeframe, the EUR/USD has inside down candlestick pattern, which is signaling chances of further sell-off in the market. 

For the moment, the EUR/USD is holding above a crucial trading level of 1.0990 as below this; the pair can continue falling until 1.0960. So consider staying bearish below 1.0990 level today.


GBP/USD– Daily Analysis

The GBP/USD currency pair sideways and taking round to 12840 mainly due to optimism surrounding the United Kingdom political plays face the greenback strength ahead of the United Kingdom Retail Sales Data for October. 

Friday is a calm day ahead of the data aspect. There are no economic figures due from the United Kingdom to give the Sterling with direction. The shortage of fundamentals leaves the Pound firmly in support of UK politics and the general voting opinion polls. At the moment, the Pound was down by 0.02% to $1.2879.

The GBP/USD was range-bound since Monday, in what has been a dull week, but the Cable showed a dramatic surge to 1.2880 level. The pair is still finding support around 1.2870, and below this, the GBP/USD can drop until 1.2860 level. On the higher side, we see resistance at 1.2925, which is defending the symbolic level of 1.3000.

Daily Support and Resistance

S3 1.2767

S2 1.2806

S1 1.2829

Pivot Point 1.2845

R1 1.2868

R2 1.2884

R3 1.2923

GBP/USD– Trading Tips

The GBP/USD has come out of a broad trading range of 1.2970 – 1.2780 to trade at 1.2870 level. The MACD and RSI are holding in an overbought zone as their values stay at 0 and 50, respectively. With this, the odds of bearish correction are becoming very strong. 

At the time, the GBP/USD trades at 1.2880 level, and it may find support immediate support around 1.2870. I will consider taking buying positions above 1.2875 and bearish positions if this level breaks on the lower side. 


USD/JPY – Daily Analysis

The US greenback has dropped a bit versus the Japanese yen, tearing through the 200 day EMA but has a vital sum of support just below as well. I think we maintain the very slovenly trading, as markets have multiple concerns to trade with at the same time.

The US greenback has stretched back a little versus the Japanese yen, as risk-off sentiment dominated the market. That being said, this market is highly sensitive to risk appetite, so with the multitude of problems that the global economy has right now, it’s not difficult to imagine a situation where the Japanese yen remains to be a market that traders jump in and out of.

The latest update on the global macro figures is presenting a not so definite hint of the pernicious influence the protracted US-China trade war is becoming on the global economy.

Daily Support and Resistance

S3 107.87

S2 108.37

S1 108.57

Pivot Point 108.86

R1 109.06

R2 109.36

R3 109.85

USD/JPY – Trading Tips

The USD/JPY is trading at 108.50, right below the 38.2% Fibonacci retracement level. This level also marks double bottom support and may keep the USD/JPY pair supported today.

The violation of the 108.500 level can extend selling until 108.200. The MACD and RSI are also supporting the bearish trend in the USD/JPY pair. 

All the best!>

Categories
Forex Market Analysis

Gold’s Bearish Channel Breakout Drives Bulls – What’s Next?


On Thursday, the precious metal gold surged to trade around 1,468 level extending gains to a third session, as soft Chinese figures and risk about whether Beijing and Washington will strike a trade agreement anytime soon depressed demand for riskier assets.

China and the United States are enduring “in-depth” talks on a first-phase trade deal, and cutting tariffs is a crucial requirement for settling, the Chinese commerce ministry stated.

The report came from the Wall Street Journal that the United States and China hit a snag over farm purchases. Notably, President Trump recently said that China committed to buying up to $50 billion in U.S. soybeans, pork, and other agricultural products as part of a phase one trade agreement.

However, China is unwilling to quantify its farm purchases now, as in result, instantly activated a risk-off sentiment in the American markets that destroyed the Wall Street party.

XAU/USD – Daily Technical Levels

Support     Resistance
1,458.56      1,467.83
1,453.59      1,472.13
1,444.32      1,481.4
Pivot Point 1,462.86

Gold has crossed over a triple top resistance level of 1,466. CLosing of the bullish candle above this level is suggesting the bullish trend is still strong. While the MACD and RSI are also supporting the buying trend in gold.

At the moment, gold has immediate support around 1,466 and above this, gold has the potential to target 1,472 and 1,479. Let’s consider staying bullish above 1,466 today. All the best!