On Monday, gold prices fell after better-than-expected manufacturing figures from China soothed concerns of a slowdown in global growth while deficit-ridden auto catalyst metal rose to an all-time high.
Trump’s approval to pass the Hong Kong Human Rights & Democracy Act as a law could hurt trade relations because the Chinese Government has warned firm countermeasures against such action by the U.S.
Ongoing trade talks between both economies were going positively, and the phase-one deal was expected to be signed before December 15.
If the deal is not approved by then, the fresh tariff from the U.S. on Chinese goods would be imposed, and it would hurt the U.S. economy more than the previous tariff hike. Trump would like to avoid such a decision when he is so eager to get China to buy U.S. soybeans, pork, and other farm products, which is a part of the Phase-one deal.
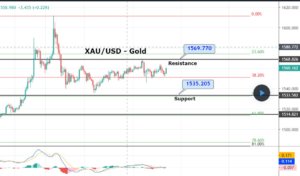
Gold – XAU/USD – Daily Technical Levels
Support Resistance
1,455.89 1,469.43
1,447.72 1,474.8
1,434.18 1,488.34
Pivot Point 1,461.26
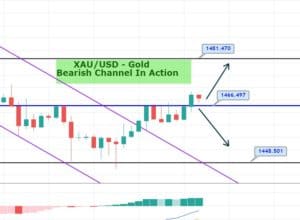
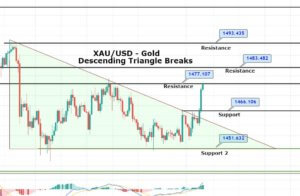
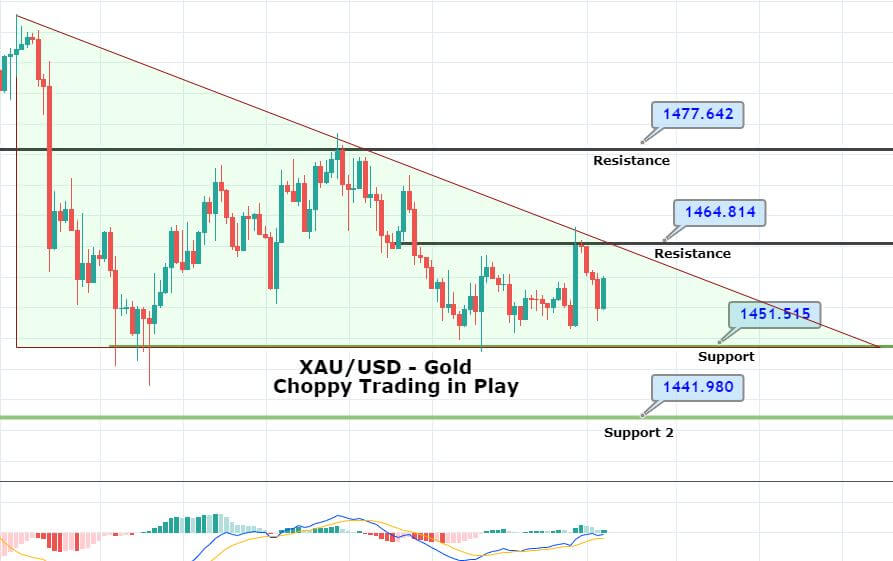
Speaking of the technical aspects, gold is stuck in a descending triangle pattern, which is keeping it supported around 1,450. Although gold has closed three black crows on the 4-hour chart, which typically signals a bearish trend, the investors are still looking for a reason to enter the market. The ISM manufacturing PMI may work as a catalyst to drive price action.
On the lower side, a bearish breakout of 1,452 can fell to 1,442 while on the upper side, gold may find resistance around 1,464 today. Let’s look for sell trades below 1,462 today. Good luck!