Categories
Forex Videos

Free Forex Course Part 2 of 3 – Into The Hardcore Of Technical Analysis

Into the Hardcore of Technical Analysis – Session two

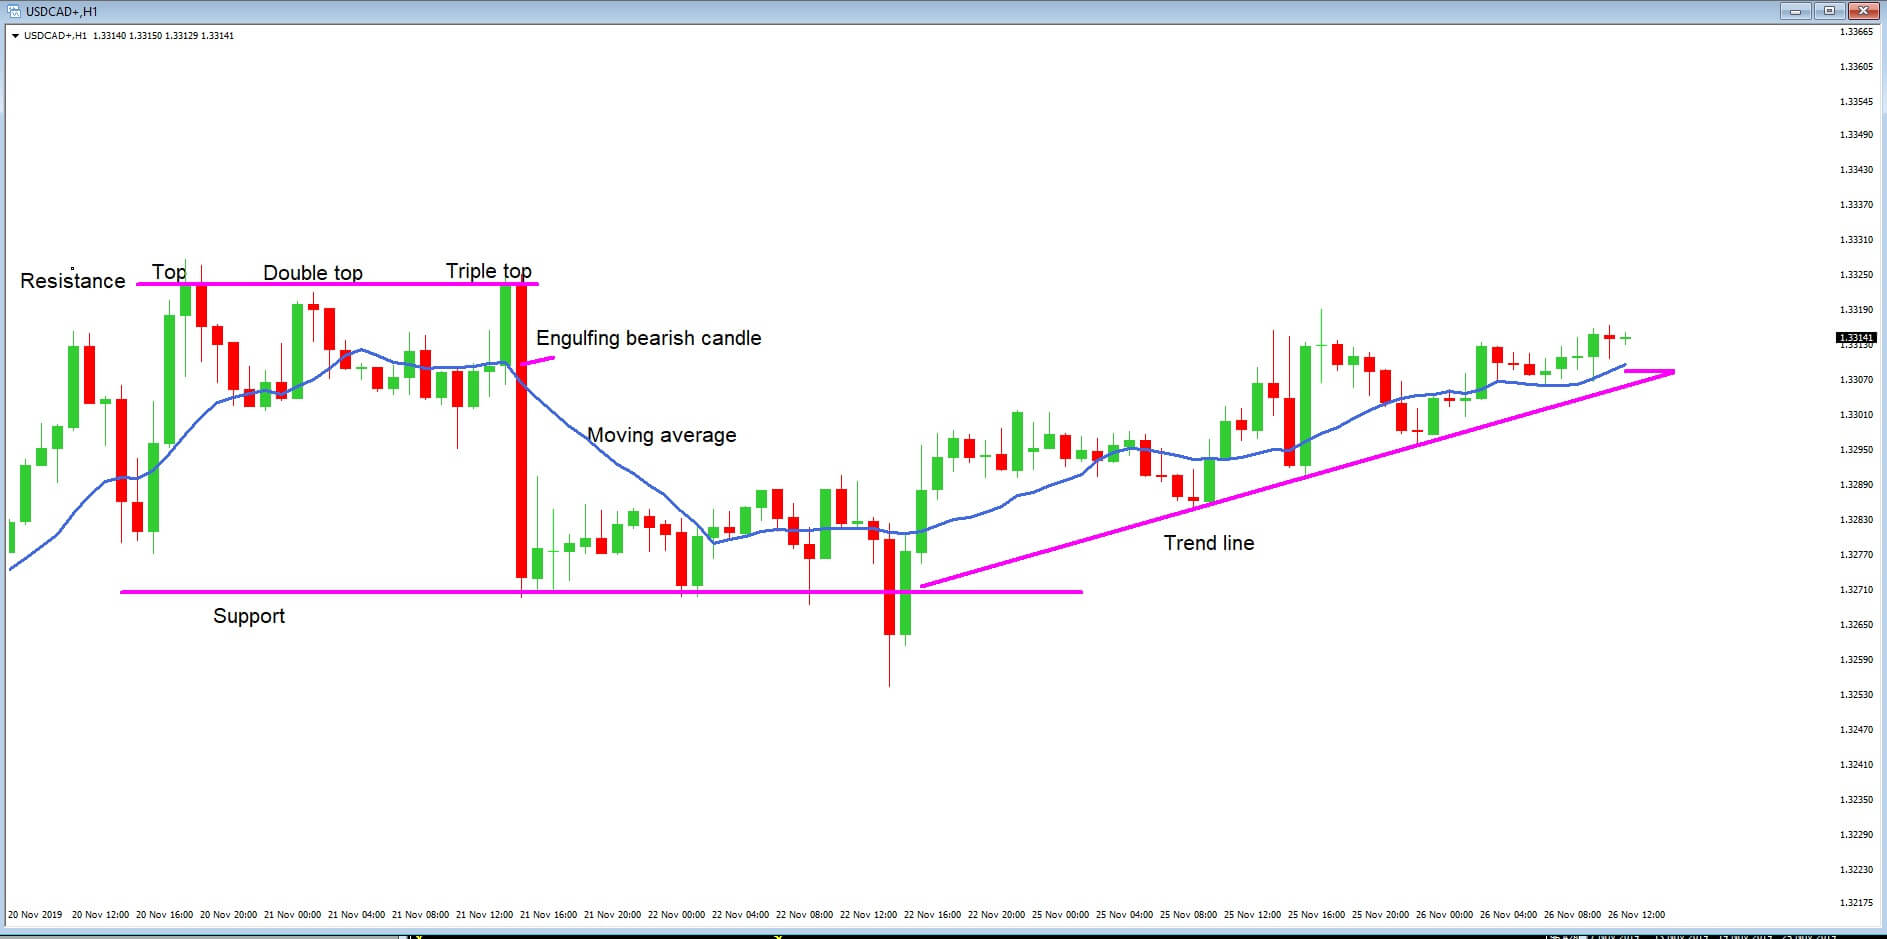
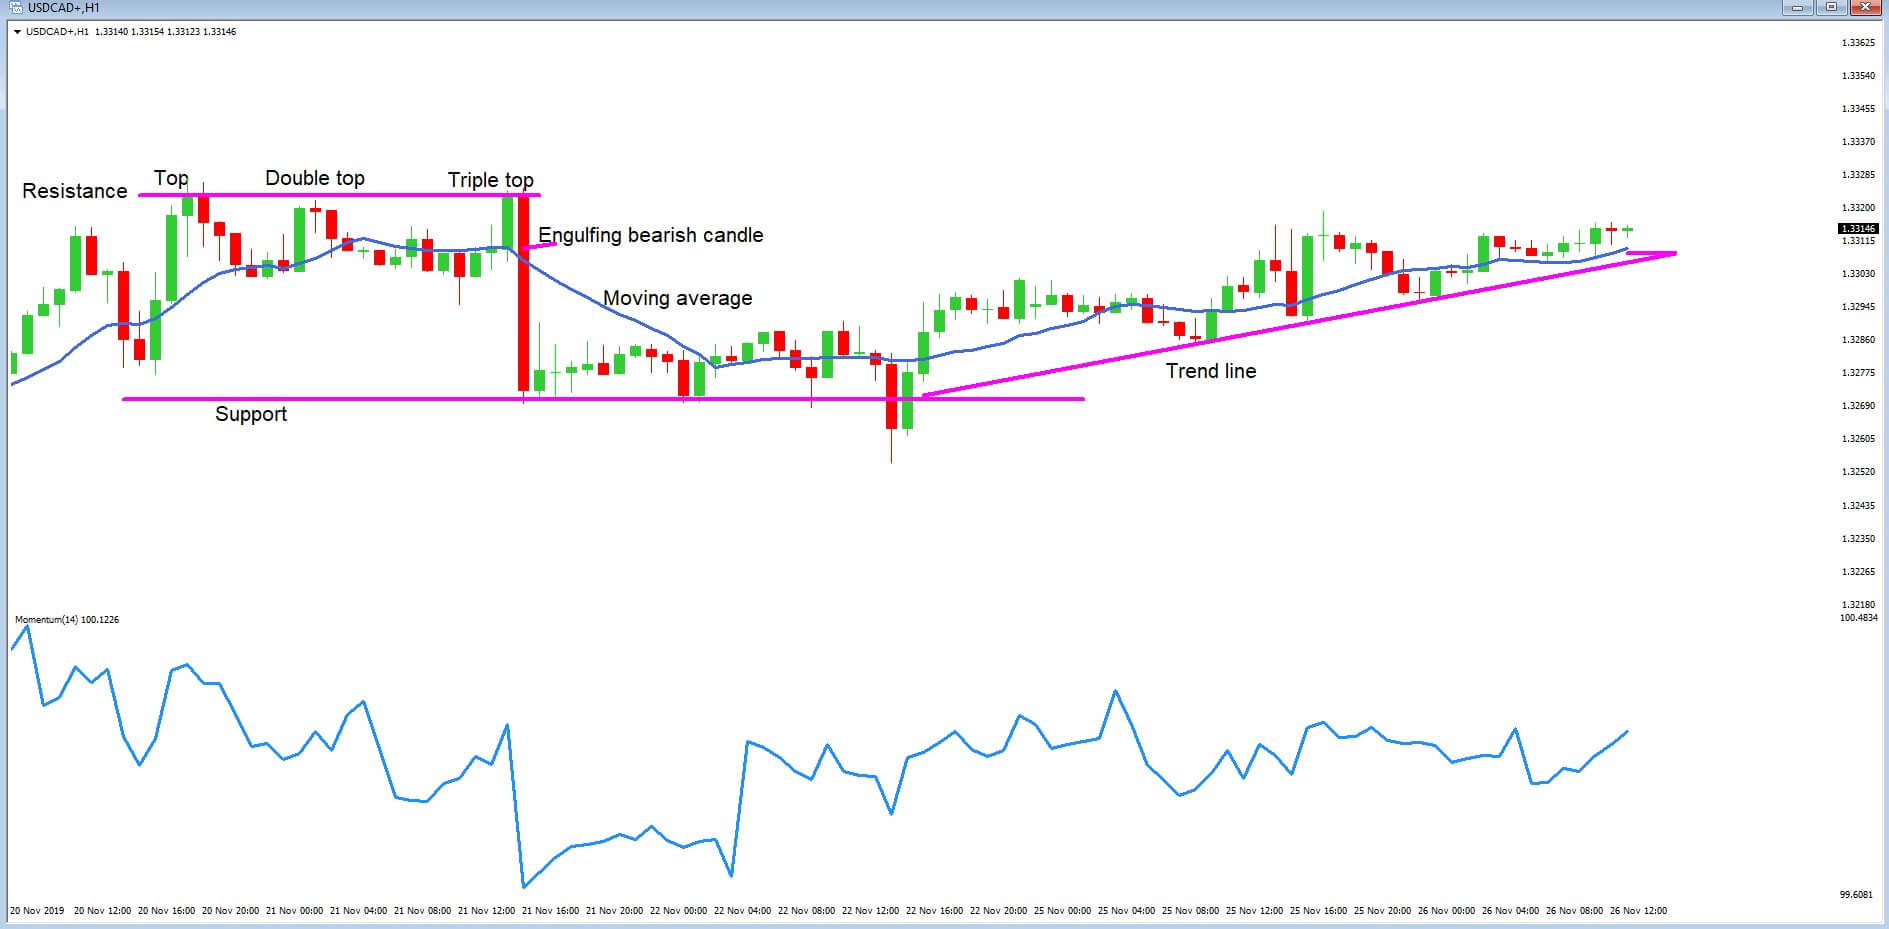
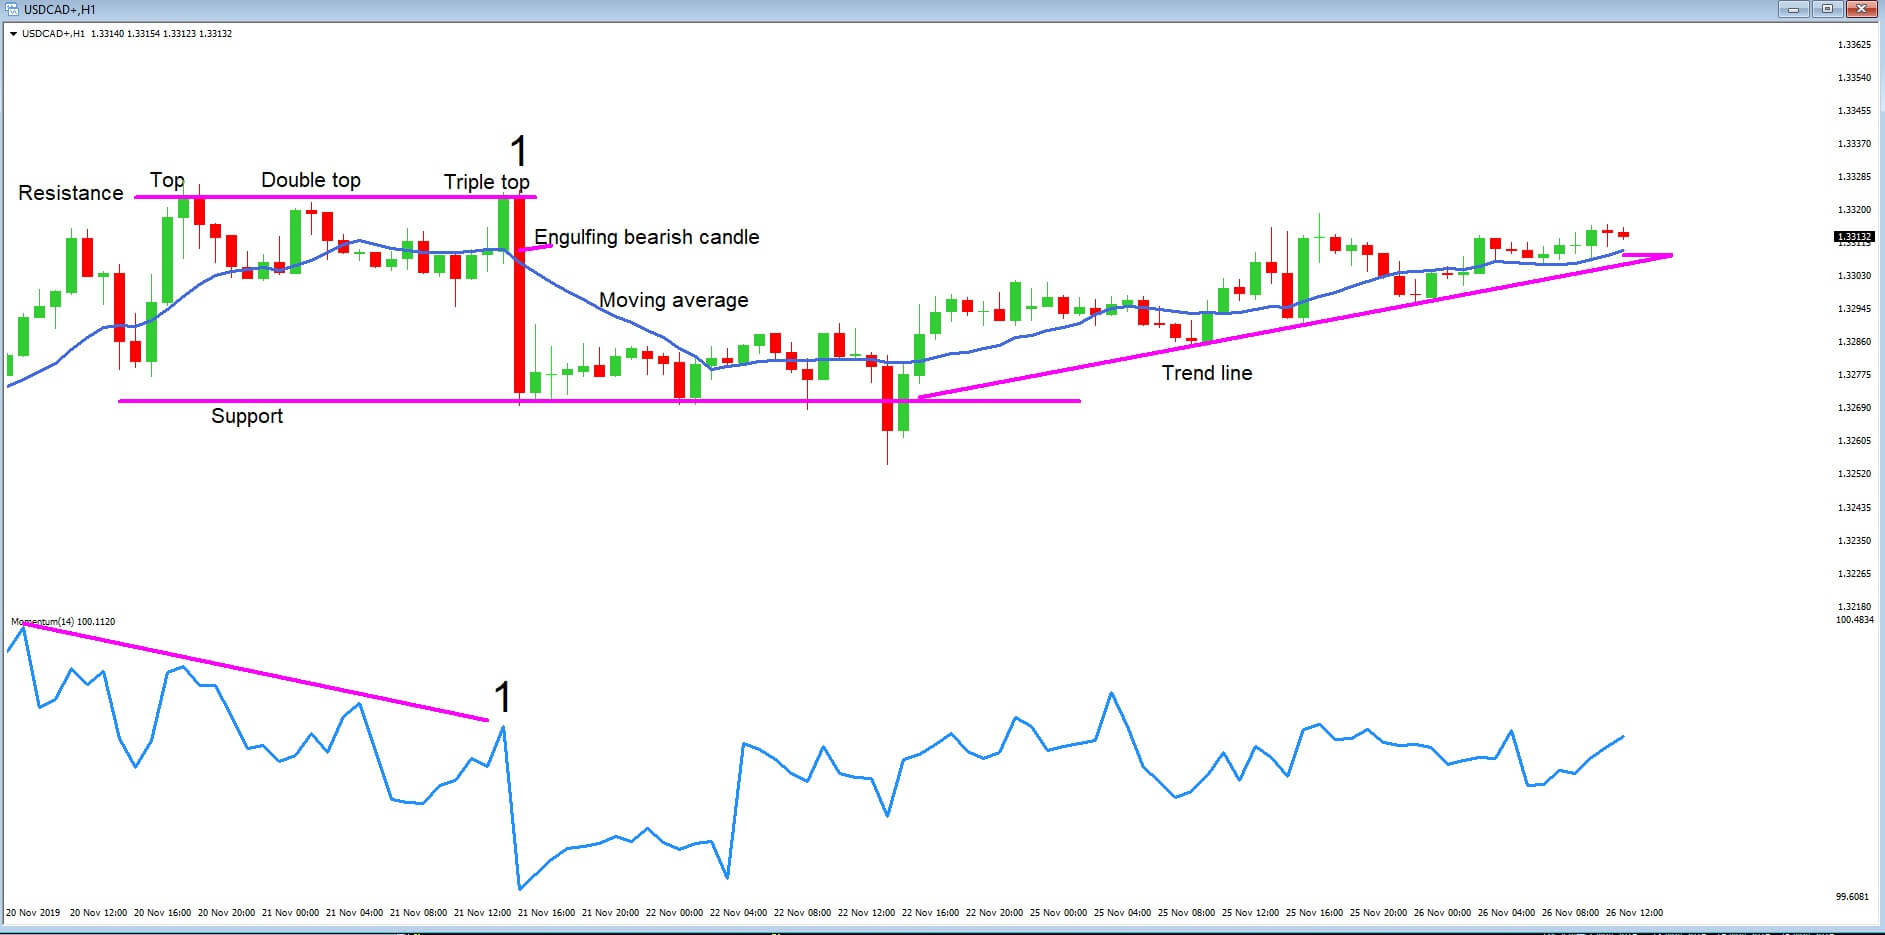
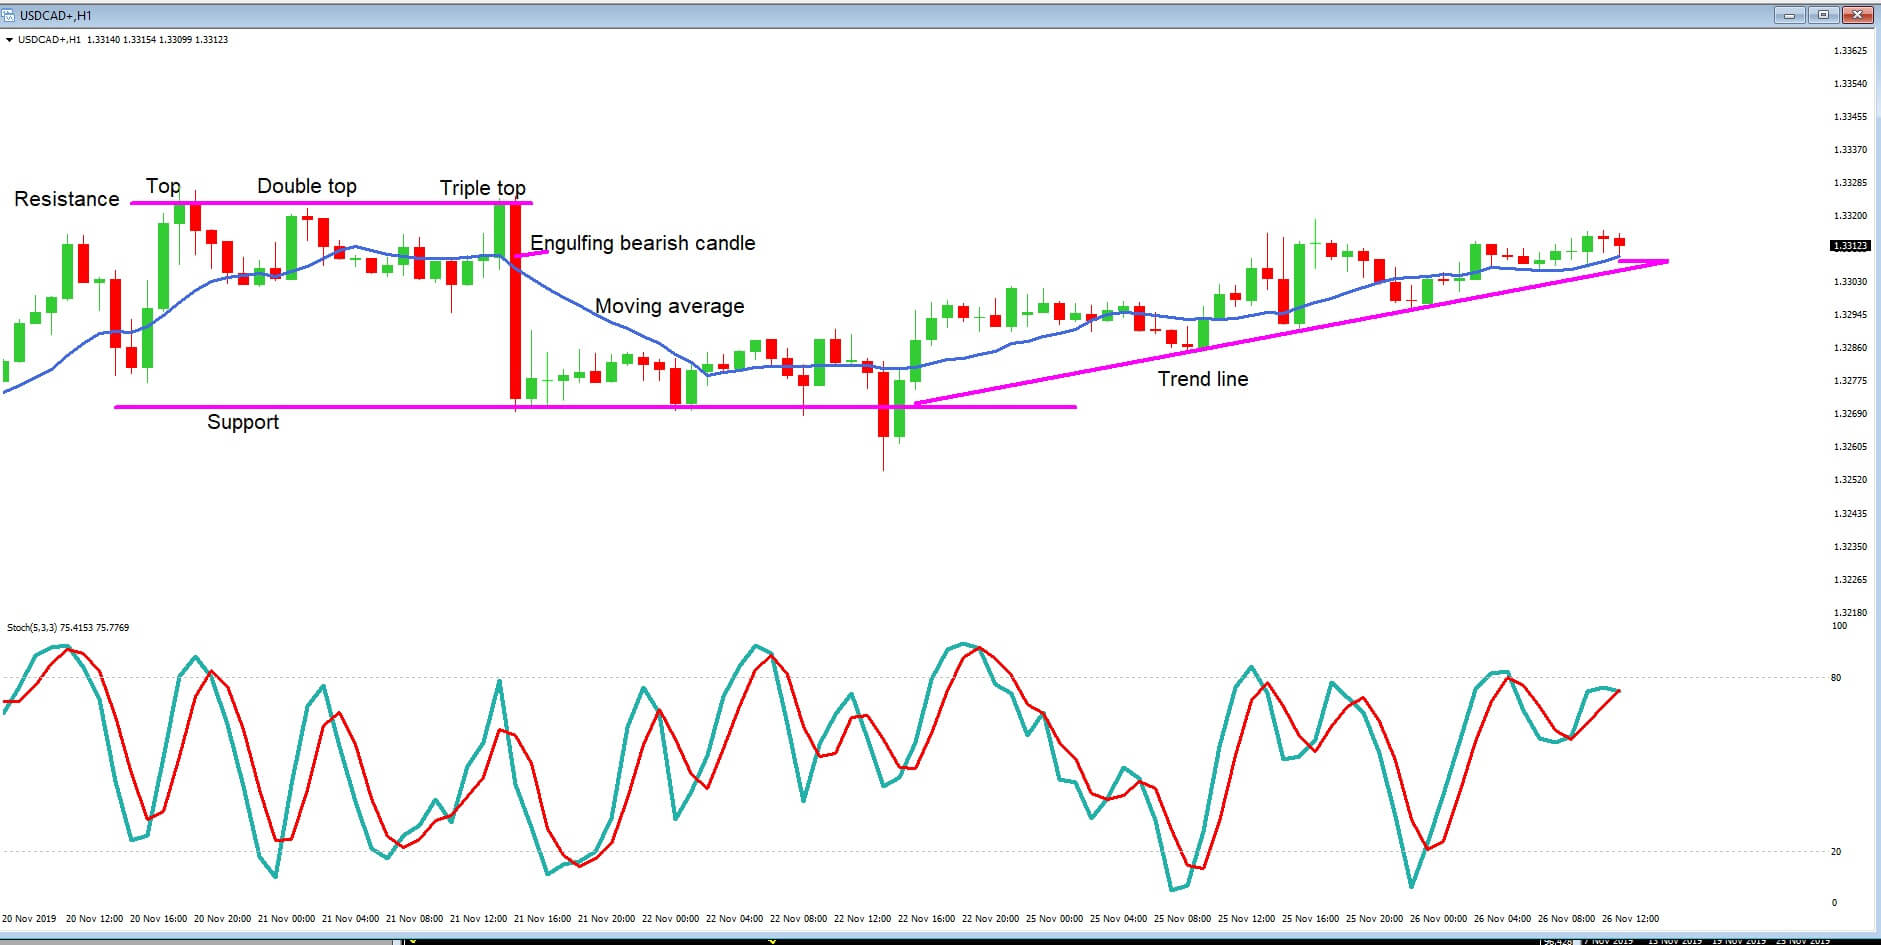
In session one, we spoke about one of the most common mistakes new traders make, which is to overload their screens with technical indicators. It is advisable that traders do not clog up the screens with indicators. In the last session, we also looked at the importance of price action as a leading indicator, moving averages, trendlines, the momentum oscillator, the stochastic oscillator, and the significance of divergence to help ascertain when a Forex pair might be running out of steam and looking to reverse a trend.
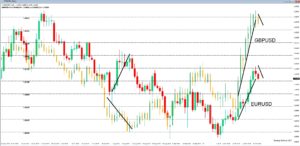
Example A


In this session, we will be looking at some more indicators that professional traders favor.
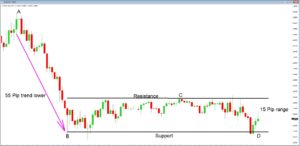
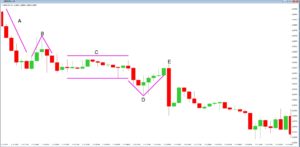
Example ‘A’ is a daily chart of the EURUSD pair with three sets of moving averages applied. The moving average is a lagging indicator, which means it plots a line on a chart based on the historical price action based over a set amount of time frames. In the charts, we are using a 200-period moving average, a 50 MA, and a 14 MA. These are fairly typically used by professional traders on a daily chart. Traders can choose a simple moving average, which plots a constant line of the average of the highs and lows or weighted and also exponential moving averages, which have slightly different computations in order to help smooth the average price indicator.
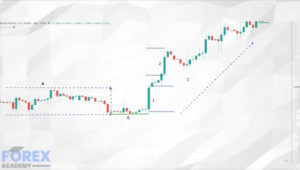
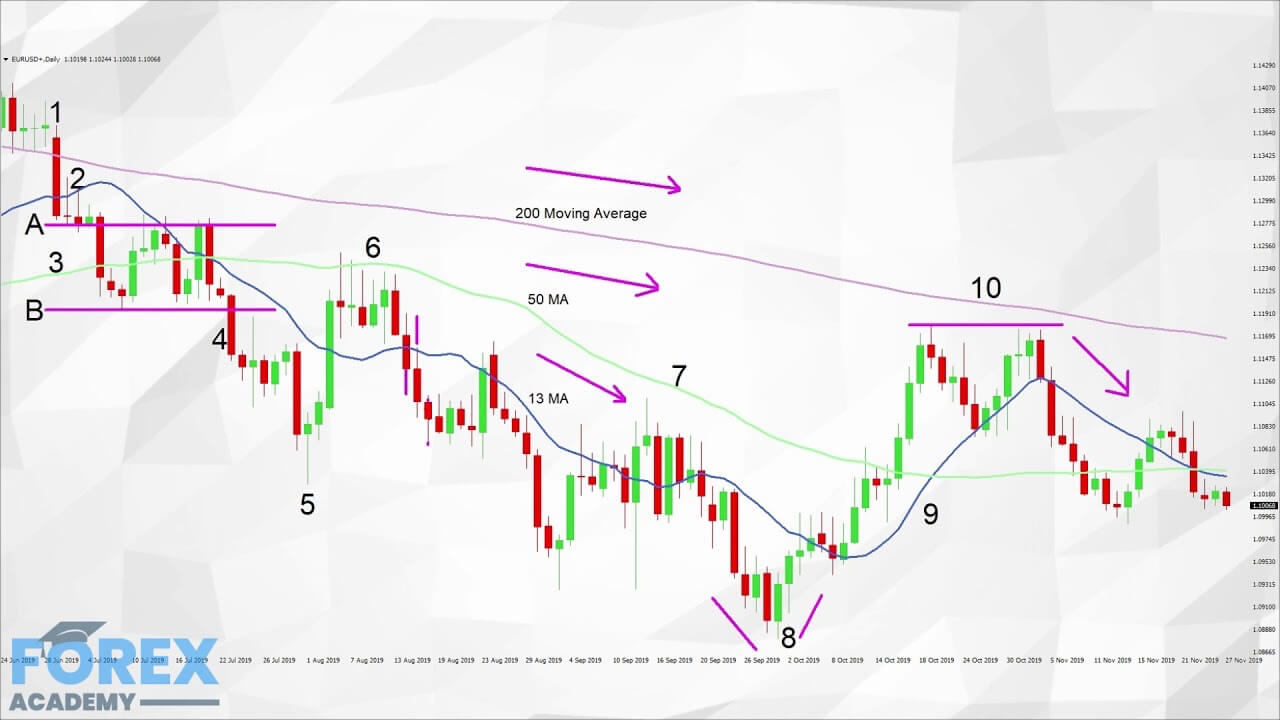
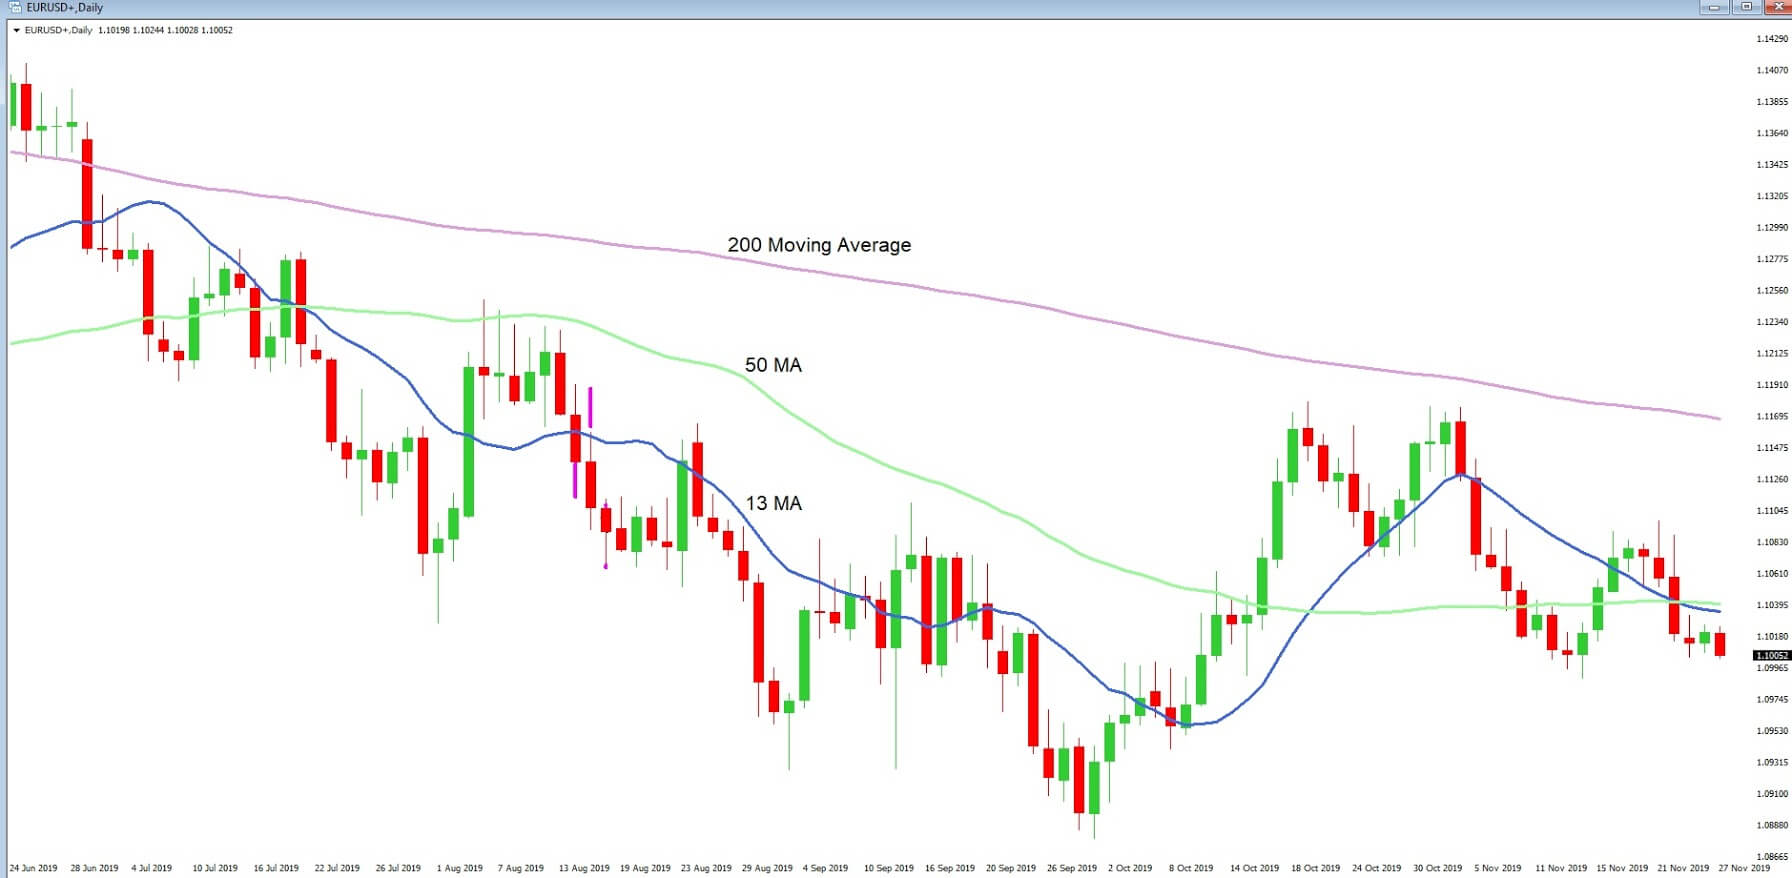
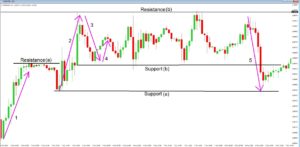
Example B

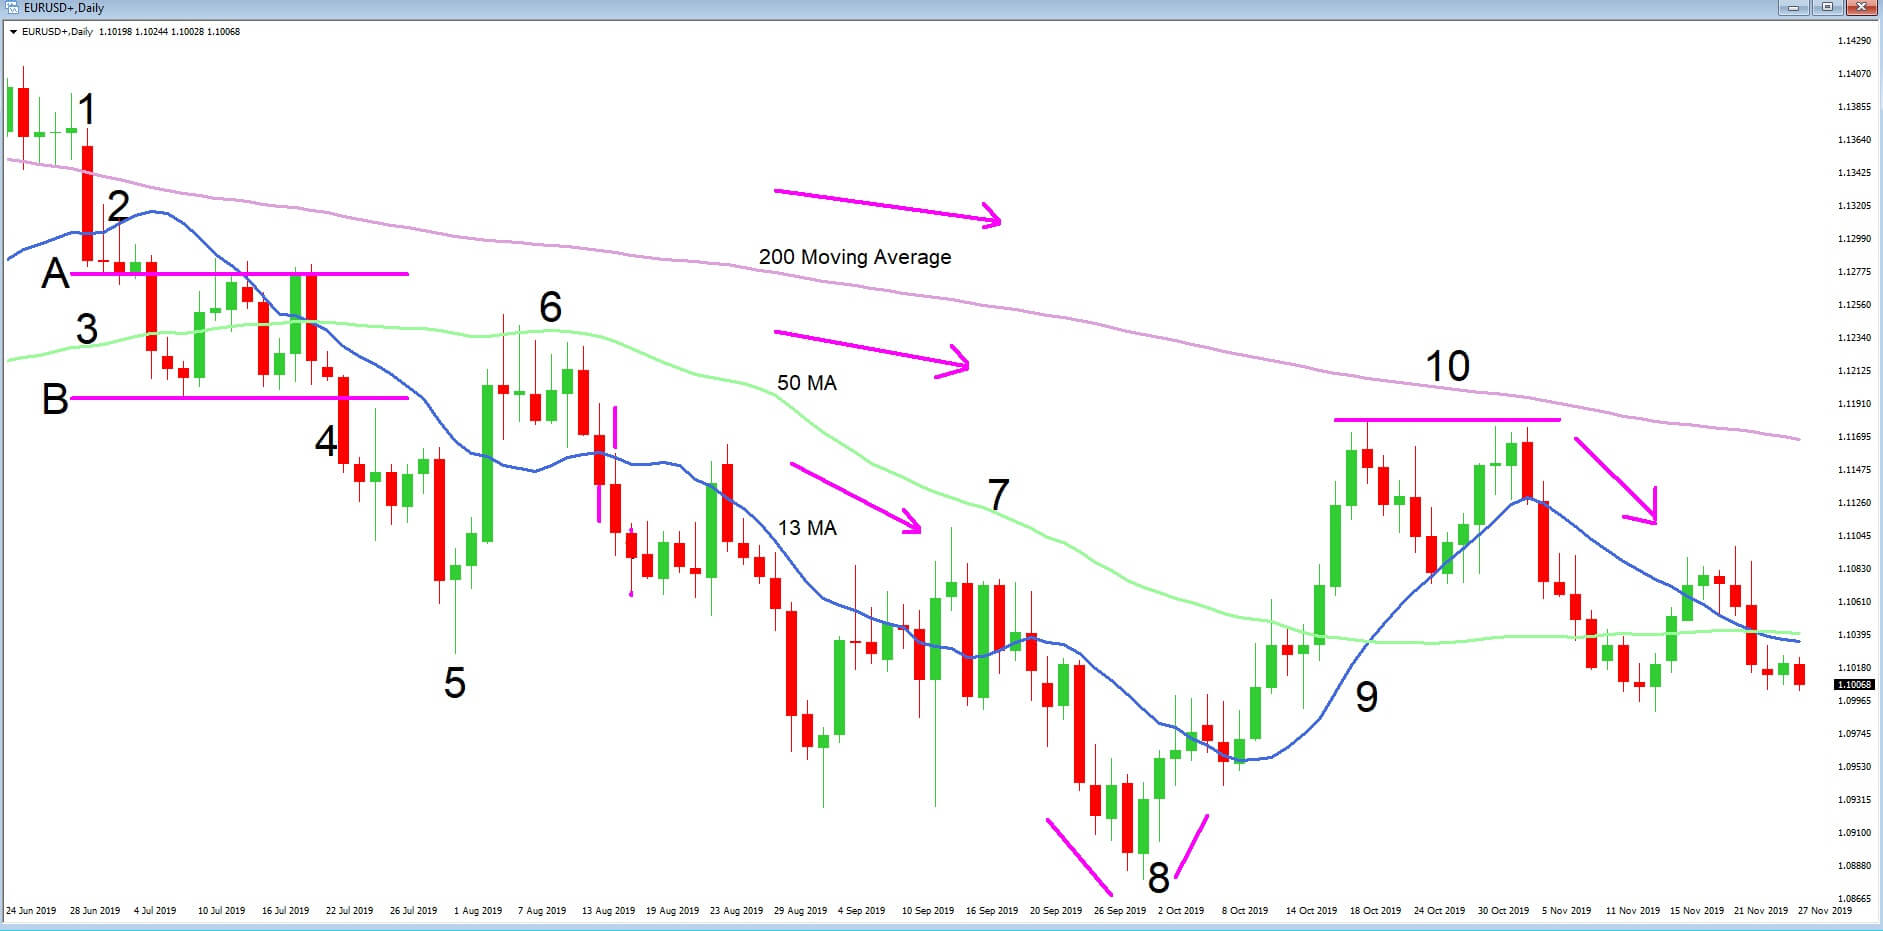
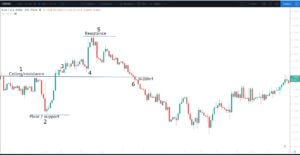
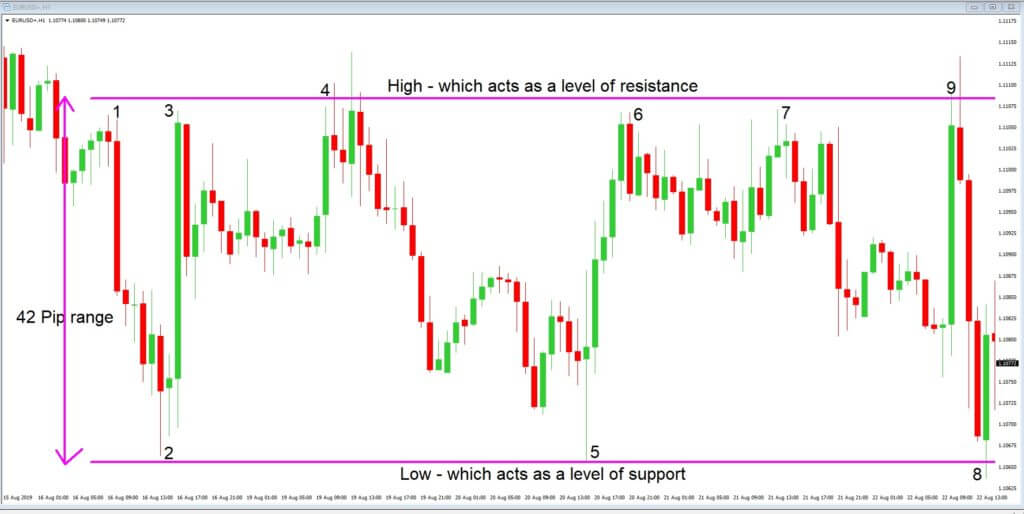
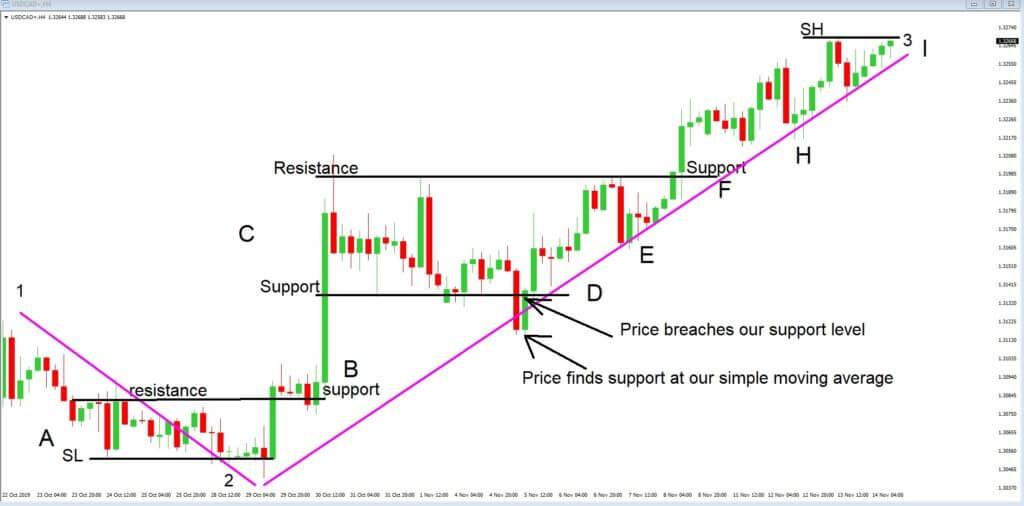
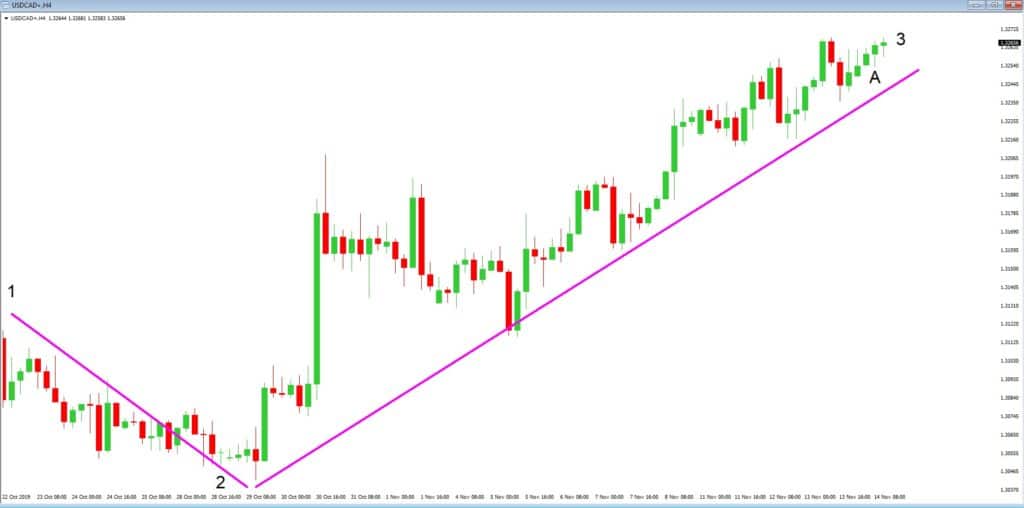
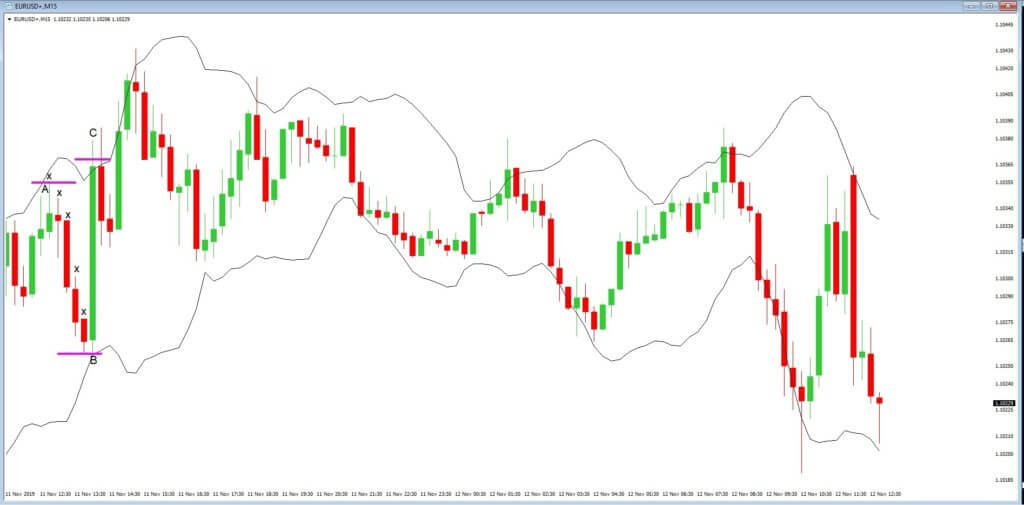
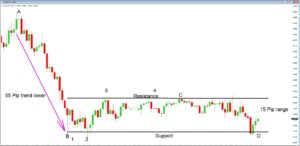
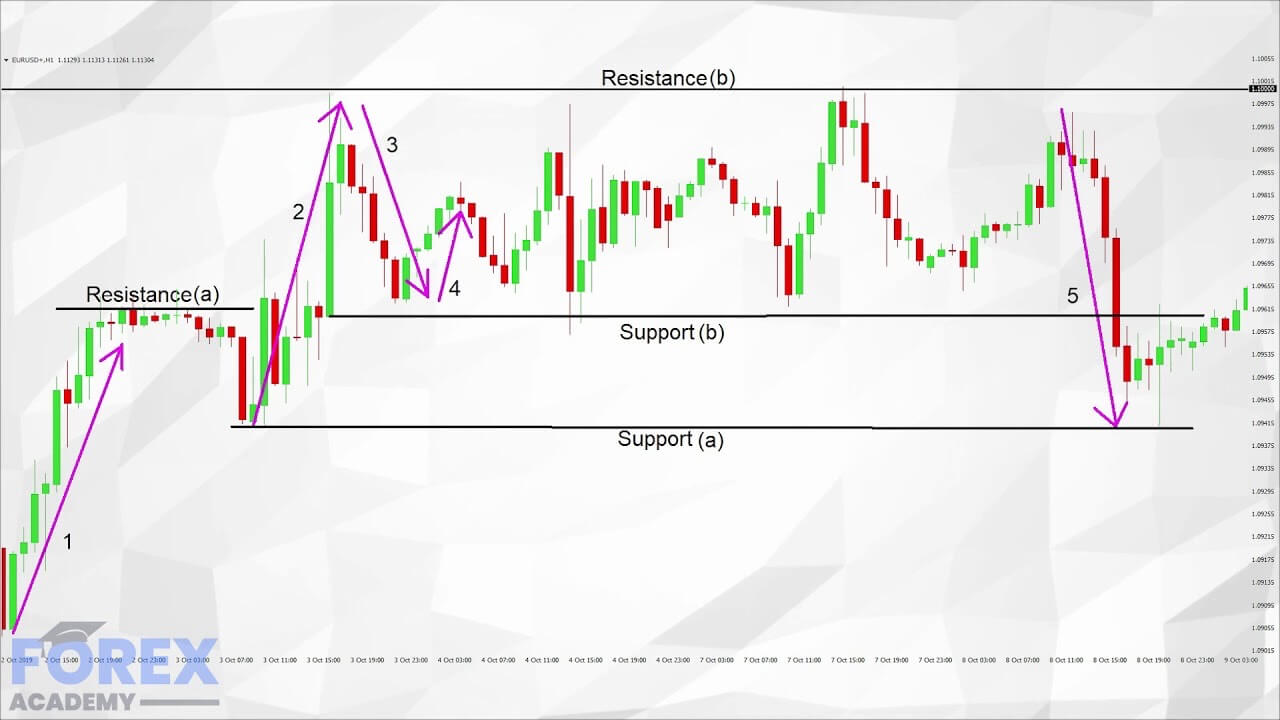
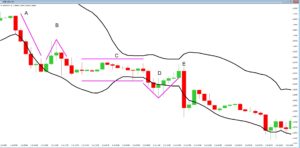
Let’s take a more in-depth look at our chart with example ‘B’ and with just the three moving averages added to it and try to establish the price action story. At position 1, price action moves below the 200 moving average, some traders see this as an important technical moving average, and indeed we see a large bearish candlestick which punches through the 200 MA, and where the total amount of pips in this single move was 92.
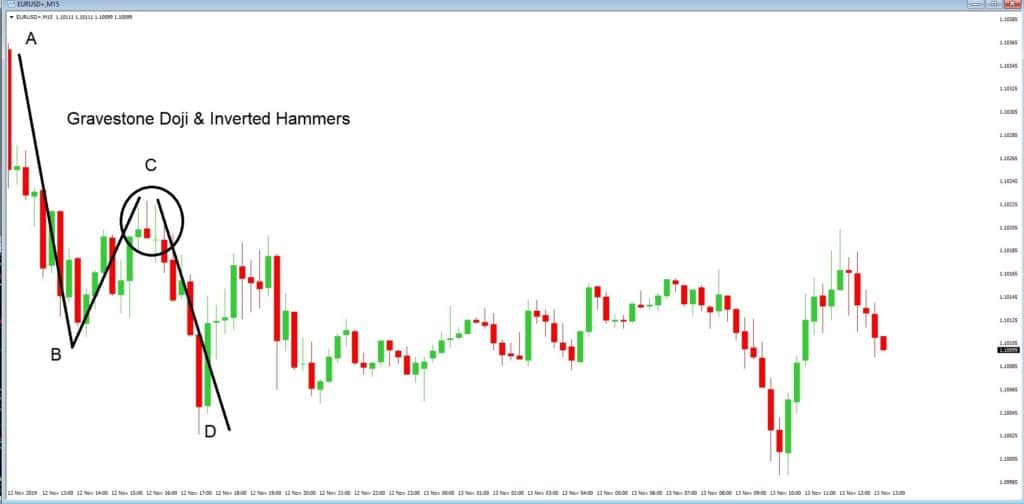
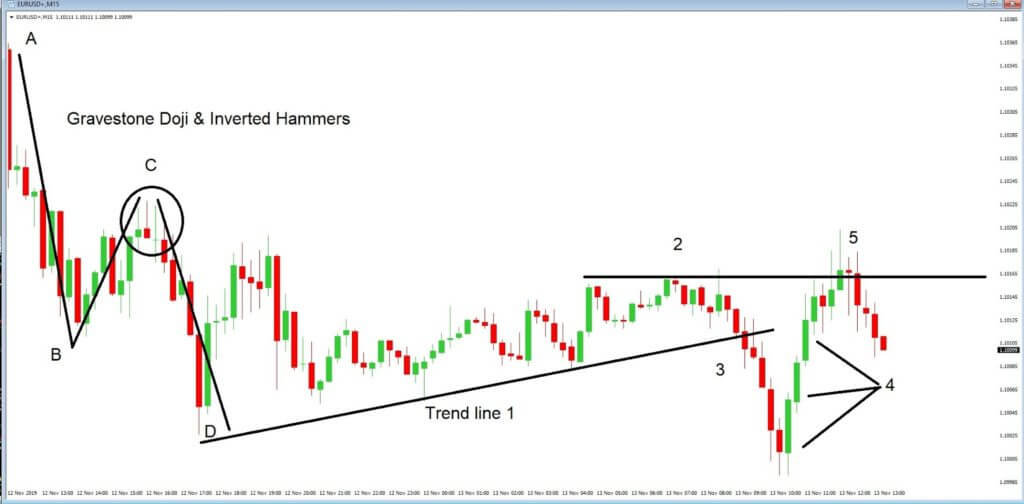
The shock of this move causes consolidation and uncertainty at position ‘2’, and where an area of support is formed, as defined by the line, we drew in at position ‘A.’
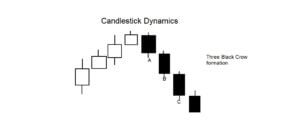
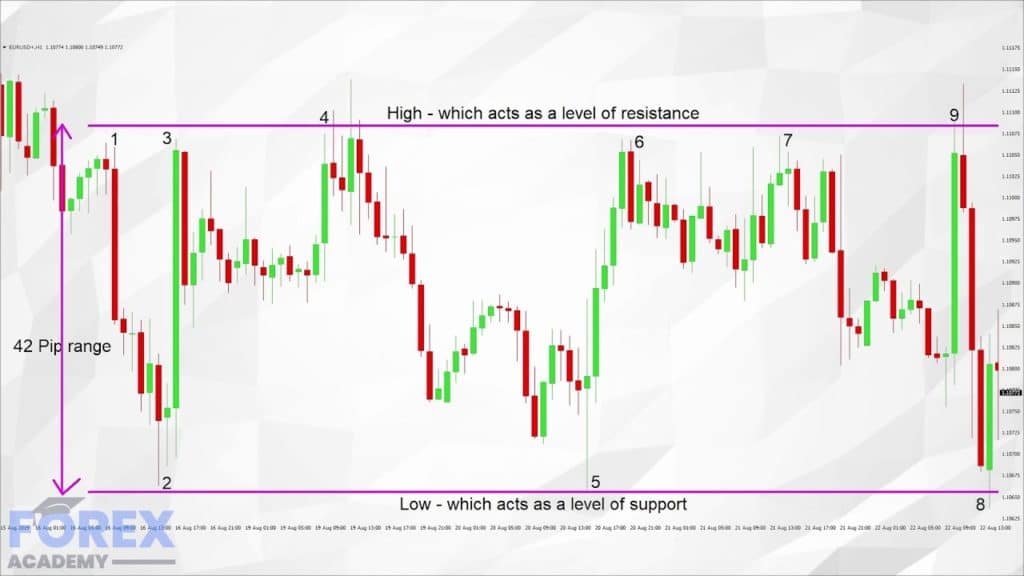
Traders then pick up the downward momentum and where position ‘A’ now forms an area of resistance and where line ‘B’ acts as an area of support. After a period of consolidation and sideways trading, the support line ‘B’ is breached at position ‘4’, and our trend continues lower to the candlestick at position ‘5’, which is a reverse hammer. This is where we see price reverse and continue up to the 50 period MA, which acts as an area of resistance at position ‘6’, and where price action subsequently continues to fall, and where the 13 period MA acts as an area of resistance. Although there is some indecision at point ‘7’, each of the three moving averages is moving lower on the chart, and traders continue to look for selling opportunities in order to push the pair lower.

At position ‘8’ we see a reversal candlestick formation and our trend begins to the upside where price action finds our 13 and 50 MA’s acting as an area of support and after two attempts to push the pair higher at position ‘10’ price action fails to breach the 200 moving average which then acts as an area of resistance, and we see further decline in price action.
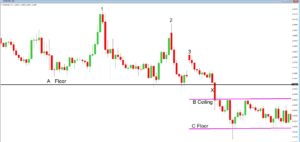
Example C

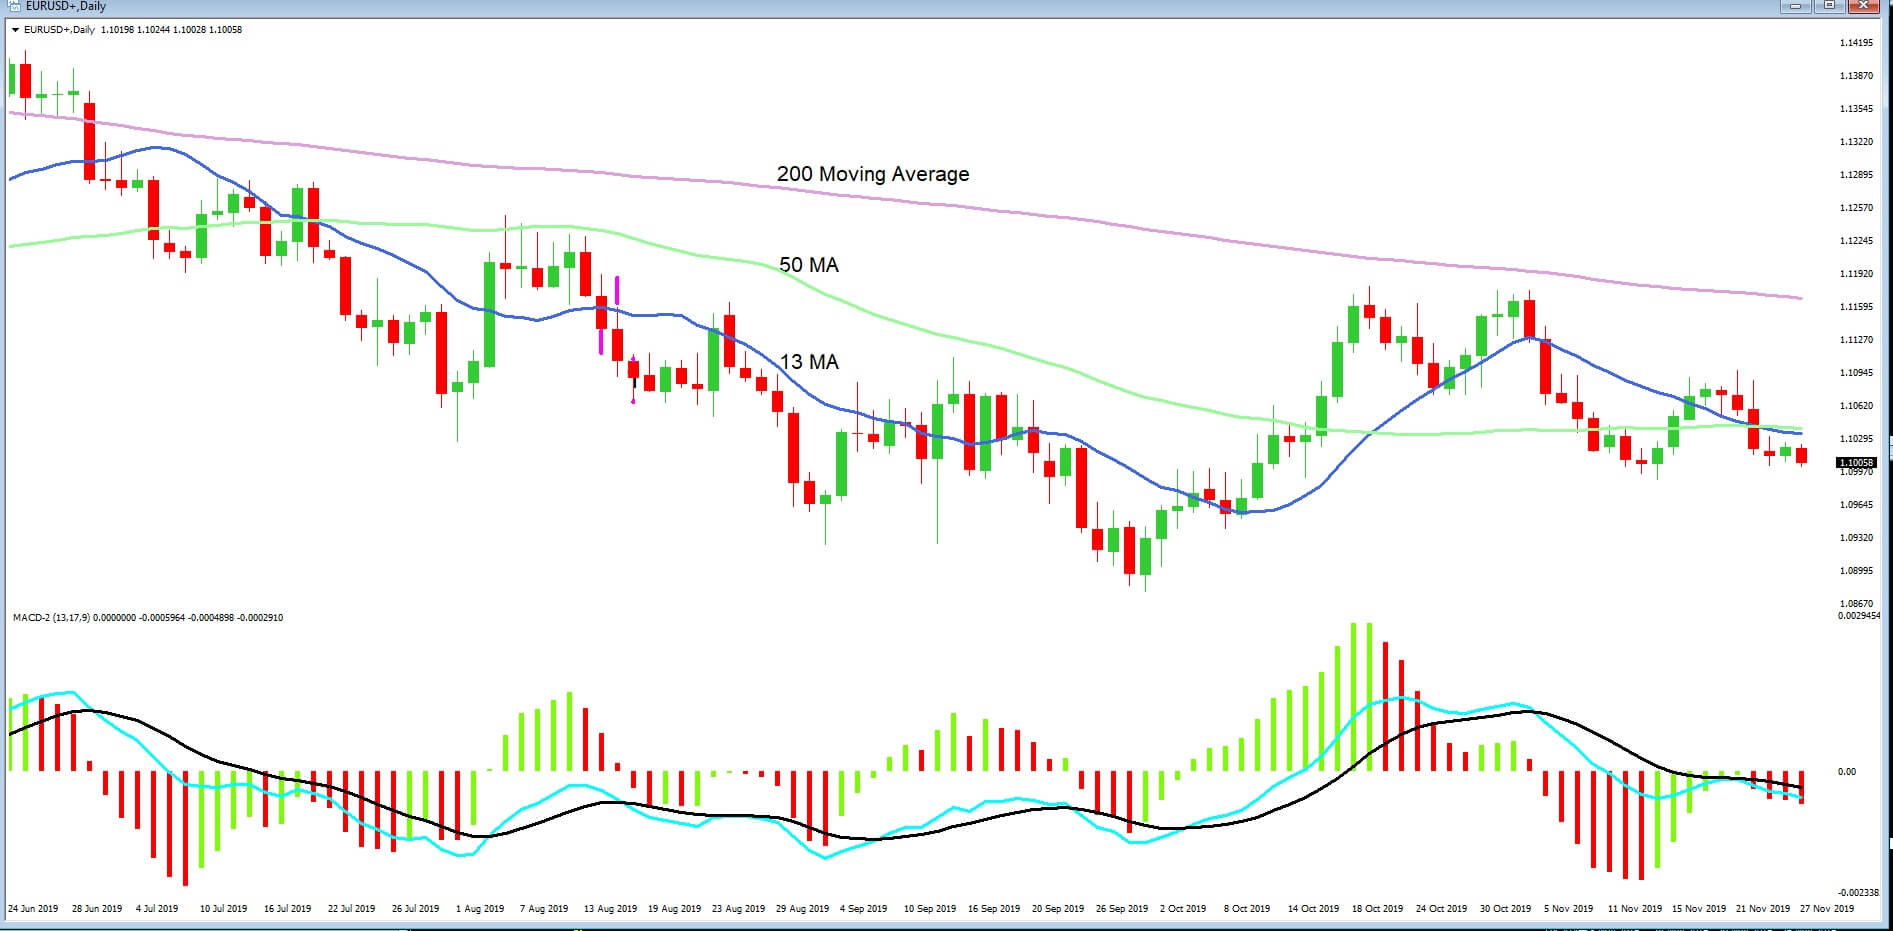
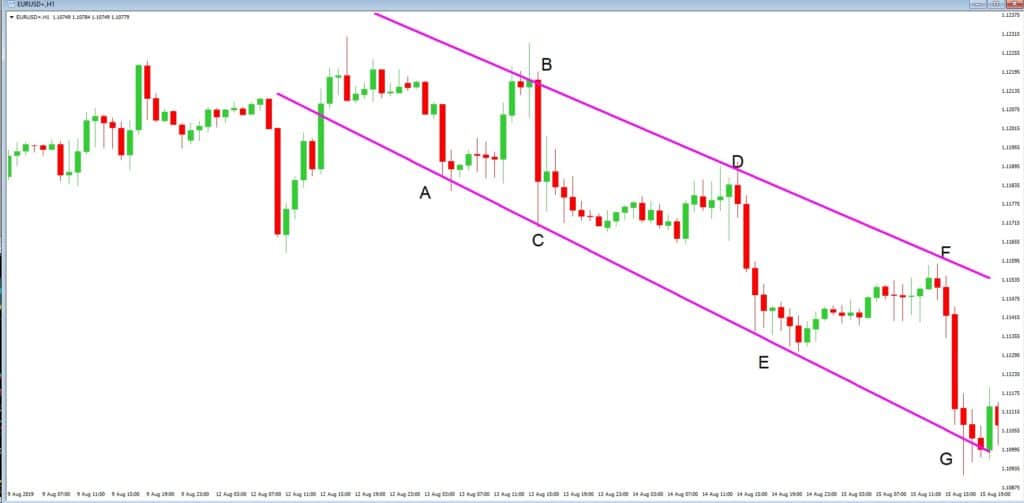
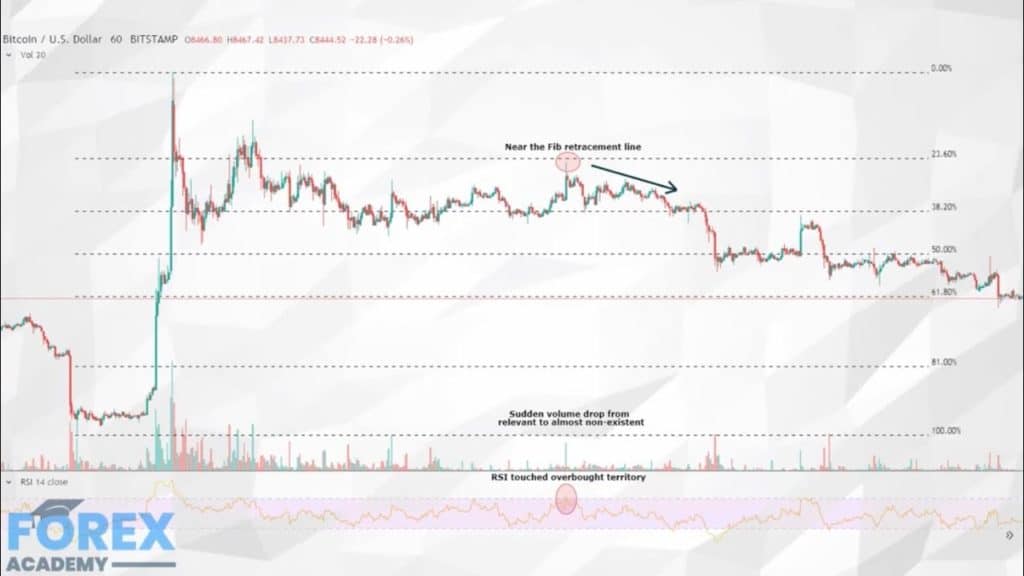
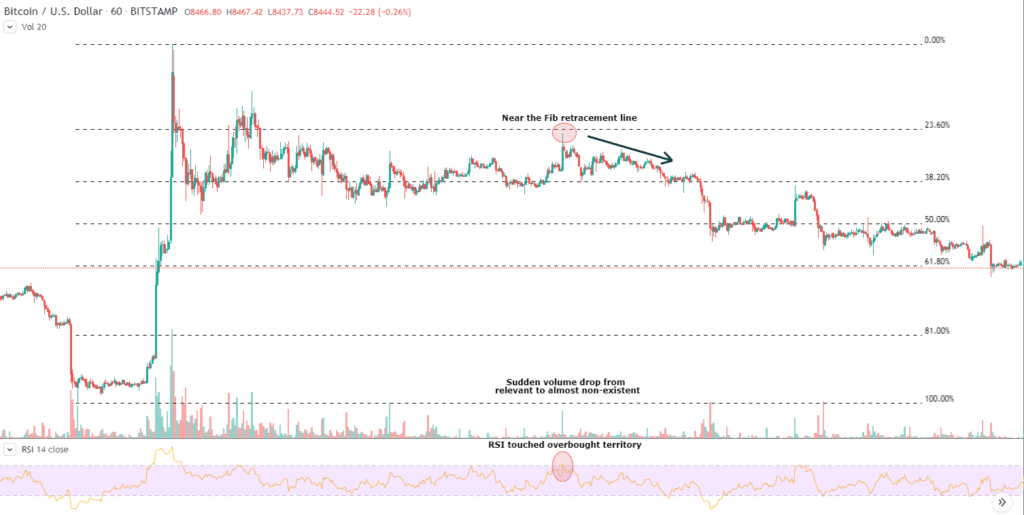
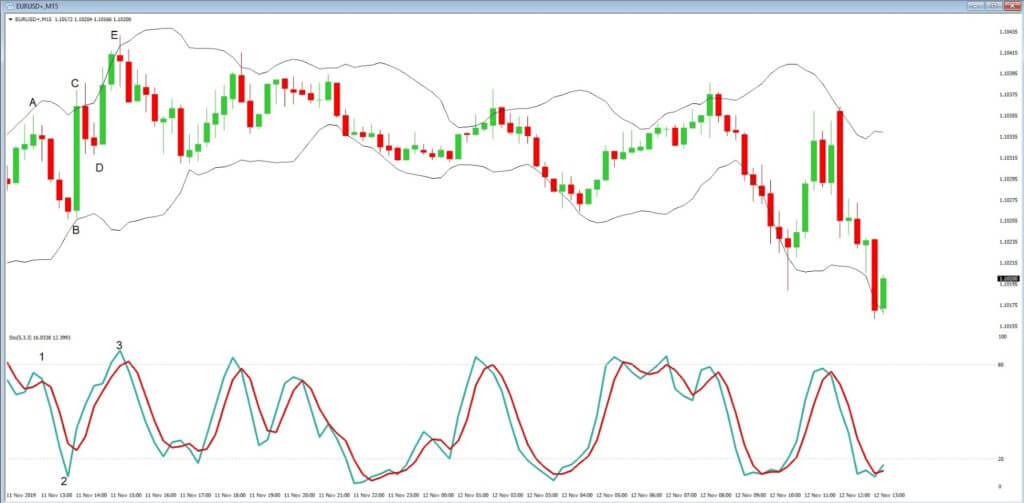
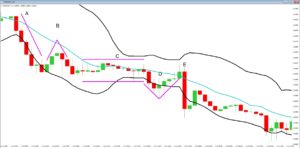
Another example of a commonly used indicator is the moving average convergence divergence or MACD, as seen in example ‘C.’ The indicator consists of a histogram, as denoted by the green and red stripes, which move above and below a 0-axis. And also two moving averages, which also move above and below the 0-axis. The basic idea is that when the histogram has formed a peak and then moves towards the 0-axis, followed by the two moving averages crossing over and also moving towards the 0-axis, this gives a trader an indication that a pair is about to reserve direction. Traders also use this to gauge divergence, which also helps them to establish if the market is running out of steam and about to reverse.
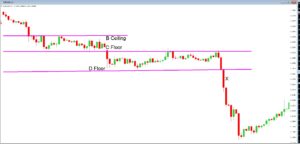
Example D


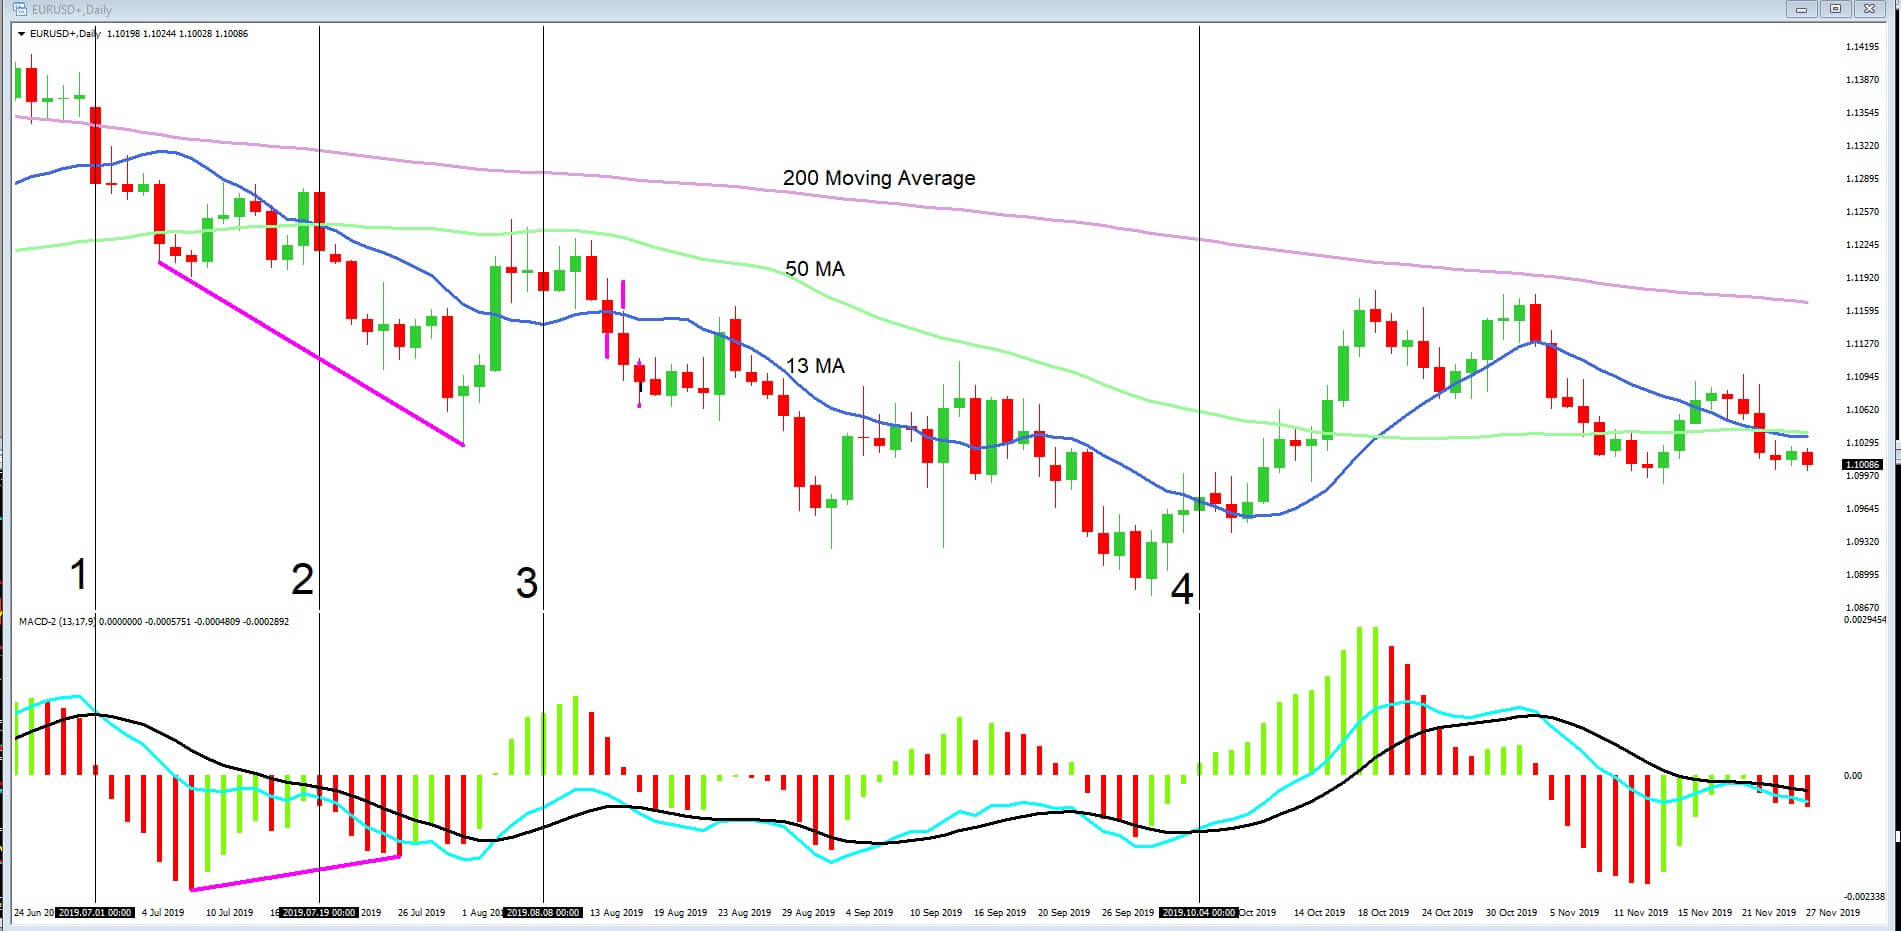
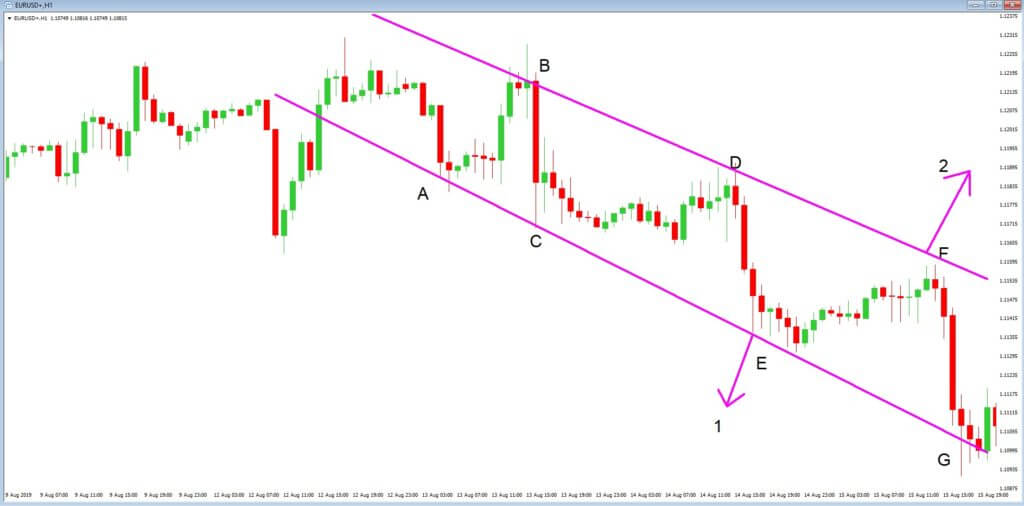
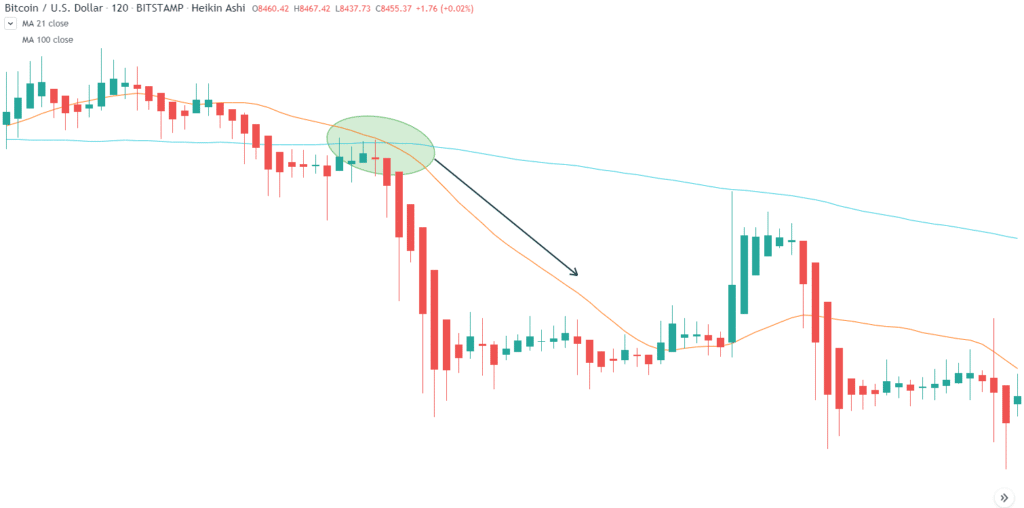
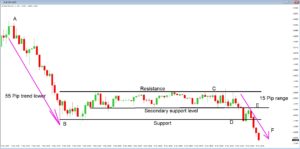
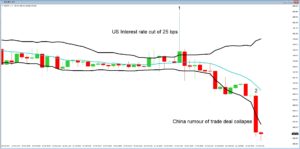
Let’s return to our chart and example ‘D,’ where we have added some vertical lines to help us ascertain where the MACD has been useful in identifying trade setups. Firstly, at position 1, our histogram has fallen away and moves towards the 0-axis, with the moving averages crossing over and also moving lower. This follows our bearish candlestick punching through the 200 MA. This is a clear signal to traders that a possible downtrend has formed and will continue.
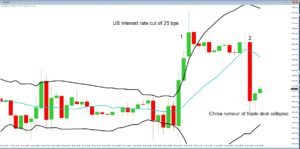
However, at position 2, our point of reference line cuts through the middle of two low points in the price action, but when we look at our histogram the two low peaks, the second low is not lower than the first respective to the downward move. The second peak is higher than the first. This is a divergence between the MACD and price action and warns traders that the market may be running out of steam. Indeed we see a pullback in the pair to the 50 MA. The 50 MA then acts as an area of resistance, with the peak of the histogram forming an arch and where the moving averages are below the 0-axis. This tells traders the price action is still bearish. At position ‘4’, the moving averages have crossed over and are moving higher, and the histogram is moving upwards too and above the 0-axis, and price action climbs above the 13 and 50 period moving averages.

Categories
Forex Videos

Free Forex Course Part 1 of 3 – Into The Hardcore Of Technical Analysis


Into the Hardcore of Technical Analysis

One of the most common mistakes new traders make is to overload their screens with technical indicators. And where they were looking for signals, they end up clogging up the screens with indicators. The problem with having too many is that they often send conflicting messages. This means that they cannot see the wood for the trees!.

There are literally dozens of technical indicators available to traders nowadays, including leading and lagging indicators. An example of a lagging indicator would be a moving average, and an example of a leading one would be price action itself. Some indicators tend to identify opportunities in range-bound markets; others identify opportunities in trending markets.

Leading indicators, including price action, work especially well during periods of sideways market movements.

In a sideways moving market, lagging indicators are almost useless because the market has no clear direction. They can often provide random indications. None of these indicators can make valid predictions about future market movements. Because some indicators are lagging – which is to say they show where the market’s historical price action – the higher the time frame, the more laggy the indicator.
When developing a successful trading strategy, it is wise to use a combination of price action and technical analysis. This is because technical analysis does outline some very good statistical observations in the market. As such, price action will often trade very uniquely around technical areas of interest and can reveal indications of future price movements.


Example A


In example A, which is a 1-hour time frame of the USDCAD pair, we have a host of information already on the chart as provided by price action in the form of our favored Japanese candlesticks, the blue moving average indicator, and some comments and lines we have drawn onto our chart.
We can see that on the left of the chart, that price action attempted to break above our area of resistance on three occasions. Where we see the ‘triple top’ failed attempt to break above the area of resistance, and where subsequently bulls threw the towel in, and bears gained the stronghold, as denoted by our engulfing bearish candle.
The moving average offered very little guidance during this period of sideways trading activity. However, when price action fails to break through and remain below the support level after a few occasions, price action then starts to trend upwards, and this is where the moving average becomes more useful.
In this chart alone, we have areas of support and resistance, increases in volume, and trend lines, which are all critical components of technical analysis.

Example B


In example B, we return to our chart; however, this time, we have added a momentum indicator which shows the location of the close relative to the high-low range over a set period of time. In this case, the last 14 candles which are displayed on the chart as an average line.

Example C


In example C, we can see that momentum was falling lower when price action hit our triple top area of resistance at position 1. Therefore, the momentum indicator was a red flag for buyers and an opportunity for sellers at this point. When an indicator fails to keep up with price action, such as in this setup, it is known as divergence.

Example D


Example D shows another very widely used indicator: the stochastic oscillator. The basic premise is that when the two moving averages move above the key 80 level, an asset is said to be overbought, and when they move below the key 20 level, an asset is said to be oversold.

Example E


We return to these charts, in example E, where we have cleared away some of the clutter. If we draw a line from position 1 to position 2, we can see that our stochastic has breached the 80-line, showing that price action is overbought, and we see a pullback in price action. At position 3, where our momentum indicator was running out of steam at this point, we also see our stochastic is overbought at position 4, and subsequently, we see price action retreat lower in the form of our engulfing candlestick.

Divergence is also commonly observed when using the stochastic oscillator. We can see that position A to position B is an area of being oversold, and while price action moves higher, it is followed by a sharp move lower at position C. But the overall movement of our stochastics at point D is higher than our low at point B, showing divergence between the indicator and price action and warning traders that bearish price action is running out of steam, and where the subsequent move is higher.
Not every trade is exactly the same, and therefore no matter how many times you use a successful setup, it will not produce winning trades 100% of the time.

Categories
Crypto Videos

Statistical Arbitrage In Cryptocurrencies – How To Profit!


Statistical Arbitrage in Cryptocurrencies

Statistical Arbitrage is a specific approach to trading many major quantitative hedge funds use at the moment. It was pioneered by Morgan Stanley, one of the biggest investment banks during the 1980s, and it is still improving. Statistical Arbitrage is a trading strategy approach that uses mean-reversion models. This trading strategy is almost exclusively used for short-term financial decisions and not for regular investing. Assets are being kept in this portfolio anywhere from a few seconds to a few days.
Statistical Arbitrage strategies are supported by many mathematical, computational, and trading platforms that help with their usage. These strategies are heavily quantitative by nature. They involve data mining, statistical methods, as well as the use of automated trading systems, better known as bots.


How Statistical Arbitrage came to be

The most basic form of Statistical Arbitrage is trading two assets, and it’s a type of strategy which exploits a relationship between the mispricing of the assets involved.
The Statistical Arbitrage model was first tested by pairing up two stocks in the same field. When one stock outperforms the other, the underperforming stock is bought while the outperforming stock is sold. This strategy tries to maximize profit potential while minimizing risk. The whole premise was that the underperforming stock would rise in value and catch up with the outperforming stock, therefore making a profit while doing so.
Statistical Arbitrage Requirements
For this model to work, the paired assets are required to have a high correlation, cointegration, or any other common factor characteristics. To find asset pairs that work together, people have used various statistical tools and methods.

Cointegration in Statistical Arbitrage

A popular way to mathematically model a mean-reverting relationship between two assets is to use cointegration. Michael Patrick Murray explained cointegration in a funny and relatable way in his paper, “A drunk and her dog.”
A drunk person walks out of a bar at 4 AM. His path would be quite random, or at least highly unpredictable. We could say the same about a path taken by a dog roaming around without a leash. However, let’s see what happens if the dunk person walks the dog around in the park. In this scenario, the randomness of their path does not change, but their cointegration does. The dog and the human will stay within a certain distance of each other, no matter how random their path is. The dog might wander off at some point, but will eventually return towards its owner once its name is called.
In this scenario, the path of the dog and the drunk person are clearly cointegrated.
Statistical Arbitrage in Cryptocurrencies
When taking cryptocurrencies into consideration, a few examples of how simple Statistical Arbitrage could be used in the cryptocurrency market come to mind:


Ethereum and Ethereum Classic – Ethereum Classic is a semi-recent fork of Ethereum, which by itself makes these two cryptocurrencies extremely correlated as they fight for the same market. Aside from recent Ethereum upgrades, Ethereum Classic is basically a version of Ethereum that forked off because the founding community did not agree on the decision to roll back the blockchain to refund the victims of the DAO hack.

Tron and EOS – Tron and EOS are direct competitors as well as for cryptocurrencies with a fairly large market capitalization, which means they might be correlated in some way. Both of these projects launched their main-nets around the same time as well as turned their tokens away from the ERC-20 standard so they could have a blockchain of their own.
Monero and Zcash – Monero and ZCash are currently the most popular privacy coins (excluding Dash, which is not fully a privacy coin as it has the option to bet completely transparent). Both of these cryptocurrencies target the same market (people interested in anonymous transactions), and both are considered to have top-of-the-chain privacy features. None of these two cryptocurrencies had an ICO, which is another thing that puts them into the same category.

Conclusion

Statistical arbitrage can certainly be another potentially profitable trading strategy when trading cryptocurrencies. People that like to look at things from a more fundamental perspective while still trading assets in the short-term would find this strategy quite useful.

Categories
Crypto Videos

How To Find Your Lost Cryptocurrencies – Recover Lost Or Stolen Crypto


How to Find your Lost Cryptocurrencies


The cryptocurrency industry has been a place where cases of theft and fraud, lost coins and lost private keys are a daily occurrence. A new breed of business is taking shape in the virtual cryptocurrency world because of these factors. Individuals, as well as companies, are trying to re-obtain such lost coins, private keys, and forgotten passwords.

Where do cryptocurrencies get lost?

Chainalysis, a blockchain analysis firm based in New York City, reports that around 20% of all Bitcoin is now missing. The most common issue that leads to lost crypto is the individuals losing access to their cryptocurrency wallets by merely forgetting the seed.
Since cryptocurrencies work in a decentralized ecosystem, there is no central authority that can re-issue the key to the original crypto owners. It is the sole responsibility of the individual to keep their private key safe and secure. Most individuals tend to forget or misplace this private key, rendering their wallets inaccessible.
There are, of course, other cases of lost cryptocurrencies that are attributed to scams, hacks, and thefts.

Who are the cryptocurrency hunters?

With so much Bitcoin being lost over the years, a new breed of digital entities and individuals, called crypto hunters, is emerging to help with recovering the lost and stolen wallet keys. These crypto hunters work with both cryptocurrency holders as well as the law enforcement agencies to search and rescue these assets.
Crypto hunters resort to anything and everything at their disposal to accomplish the task. That includes the use of modern supercomputers to attempt cracking private keys or even using mental practices such as hypnotherapy on the wallet holders to help them remember their lost cryptocurrency wallet private key.

Crypto hunters that offer their services online typically require only the basic details such as the last remembered private key as well as some basic private information. A few technology enthusiasts are even attempting to do the do-it-yourself (DIY) approach, making programs that test tens of millions of password combinations.
Crypto hunters also offer their services to track down the cryptocurrency thieves and scammers. They work with law agencies to identify where the stolen coins may have been transferred and to find out who did the transfers.

How much do crypto hunters charge?

The majority of such crypto hunting services charge their fees in cryptocurrencies. Prices vary greatly and depend on the success rate. Both computer-based recovery service providers and crypto-hypnotists charge an upfront fixed cost as well as a percentage of the recovered funds. This percentage usually varies from 5 to 10 percent.


Conclusion

While a lot of online services claim to offer help in recovering lost crypto funds for a fee, care should be taken to ensure that one deals with an authentic crypto hunter that is knowledgeable enough to perform the task. The process of re-obtaining the funds usually requires revealing a few key details to the service providers, which may cause misuse of the details. It is advisable to deal with only those crypto hunters that operate in the real-world with verified identity, rather than trusting the flashing ads in the online world full of scammers with no verified identity.

Categories
Forex Videos

Fundamental Analysis- The Full Sector Breakdown

Fundamental Analysis – Sector Breakdown

When trading currencies, which are always traded in pairs, you are effectively trading the economic worth of one country over another. And a country’s economic value is theoretically defined by its currency exchange rate. Although some currencies are also bought and sold based on supply and demand, and where certain currencies are also traded based on perceived market ‘risk-on’ and ‘risk-off’ events.
Therefore, in order to be an effective trader, you should have a good general knowledge and understanding of the economic situation pertaining to both countries within the pair you are trading.

Even though you might be planning to only trade currencies on a technical analysis basis, by having a good understanding of the economic state of both countries in the pair are you are trading, or thinking of trading, it will give you an overall edge if you are up to speed with the economic state of both of those countries. And this is why fundamental and technical analysis really do go hand in hand. Simply put, the more you know, and the more you understand, the more chance you will have of stacking the odds in your favor when it comes to pulling the trigger on your trades.

In order to gauge a country’s economy, we must first break it down into sectors.
The most important being gross domestic product or GDP, including factors that contribute to GDP, such as net trade exports, personal consumption, business investment, and government spending. In other words, it measures the total output of an economy.
Another sector would be the percentage of employment within the population, including cyclical and other fluctuations of unemployment and the relevant financial cost to the government thereof.


Another sector would be natural resources and technology, which lead to business creation and, more importantly, the exportation of these to other countries.
And other intellectual activities, including education and research, which all add value to a country’s economy in one form or another.
Cyclical sectors are also important components because they tend to have the effects of shrinking or expanding an economy during periods, and where one example might be the production of crops, where winter months plays a part in the reduction of harvests and associated production staff. Finance and credit fall into this sector too. Other areas include building materials, commodities exploration, and processing, banks and asset management, investment brokerage, insurance, property management, retailers, auto and auto parts, residential construction, restaurants, and entertainment.


The defensive sector reflects essential consumer needs such as healthcare, staple foods, which is virtually immune to economic developments. Telecoms would also fall into this bracket, especially as society becomes ever more reliant on the internet. Oil and gas producers, services and equipment, aerospace and defense firms, designers, and developers of computer operating systems and software firms fall into this area too.

Sensitive sectors fall between defensive and cyclical and are not immune or acutely affected by economic shifts. Here we would include real estate, Capital markets, the production of chemicals, and also commodities.
If GDP outlines the total output produced by an efficient economy, then the gross value added or GVA is the term used to highlight the performance of the individual sectors of an economy.
The breakdown of sectors is of particular interest to equity traders and especially fund managers who will often adjust their portfolios on a sector by sector basis. And while some Forex traders believe that the constant assessment of economic conditions within an economy will always be reflected in the current exchange rate of a particular currency pair, it is essential that traders analyze the contributions of the components of an economy – as best they can – in order to have at least an overview of how an economy is performing.
Here at Forex.Academy, we teach traders that you can never have too much knowledge when it comes to navigating the complex nature of the Forex market, and the significance and importance of recently released, and imminent economic data releases should never be underestimated.
It is also essential that traders have a reliable economic diary to hand and take note of key economic data releases because these are likely to be the times when volatility will increase.

Categories
Crypto Videos

High Frequency Trading in Cryptocurrencies – Can Normal Traders Utilise This Groundbreaking Strategy


High-Frequency Trading in Cryptocurrencies

High-frequency trading, also known as HFT, is a relatively new method of trading. It takes advantage of powerful computer programs that can transact a large number of orders in a time-span no human could succeed to do manually. The trading strategy is called high-frequency because the transactions are done in fractions of a second, and the sheer number of transactions can reach thousands per hour. High-frequency trading uses extremely complex proprietary algorithms to analyze various markets and determine which trades are worth taking and which are not.

One important thing that these systems strive to perfect is fast execution speeds. As these trades are performed at such high speeds, traders with the fastest execution speed will be significantly more profitable than ones that can’t execute their orders as fast.
The history of High-Frequency Trading
High-frequency trading is a fairly new trading strategy. In fact, several things needed to happen in order for it to even be considered as a trading strategy. The first one was, of course, the advancement of technology. The other was when exchanges started to offer incentives for companies to become liquidity providers.
The New York Stock Exchange’s group of liquidity providers is called Supplemental Liquidity Providers. This group was created after the collapse of Lehman Brothers in 2008 as a response to the investors showing major concern regarding liquidity. This group’s job is to create and add competition and liquidity for the existing quotes on the aforementioned exchange. The New York Stock Exchange, as an incentive to liquidity providers, pays a fee for providing liquidity. Even though the fee is extremely small (a fraction of a $ cent), high-frequency traders transact millions of times per day. As a result, the fees pile up and bring in large profits.

High-Frequency Trading in Cryptocurrencies

A handful of cryptocurrency exchanges are currently incentivizing high-frequency traders to use this trading strategy. Huobi, based in Singapore, and ErisX, based in Chicago, have separately started to offer colocation. Colocation enables a client’s server to be placed in the same facility or cloud as the exchange’s server. This would allow for execution speeds up to a hundred times faster than what was available before. This essentially gives these traders an edge over the rest of the market. Gemini was, however, the first big crypto company to offer colocation at a popular data center in the New York area. On top of that, it plans to expand its positions to a second site in Chicago.


These exchanges’ moves are a sign that high-frequency trading is something they are planning to approve as a viable trading strategy on their platform. They are doing this for a simple reason; cryptocurrency space has an enormous amount of exchanges, and crypto beginners usually choose to trade on an exchange with the highest liquidity. That’s why crypto exchanges are allowing and encouraging this controversial practice to slowly enter the crypto sphere. While “trading bots” have been present in crypto since the days of Mt. Gox, colocation takes algorithmic trading to a whole another level.
Pros and Cons of High-Frequency Trading
Pros of High-Frequency Trading
High-frequency trading provides two major benefits:

It improves market liquidity.
It removes bid-ask spreads.

By transacting millions of times throughout the day, high-frequency trading helps increase liquidity and remove bid-ask spreads that would otherwise be too small. This was even tested by adding fees on HFT, which resulted in bid-ask spreads increasing.
Another upside of high-frequency trading is that it removes the need for manual trading at big companies, therefore reducing labor and labor education costs dramatically. Once the algorithm is programmed, the operators only interfere with the system is when they notice an error.

Cons of High-Frequency Trading

High-frequency has also had some criticism on its back due to its downsides. What has been listed as a benefit can also be considered a downside in this case. High-frequency trading has almost completely replaced humans for mathematical models and algorithms to make decisions. Decisions of whether to buy or sell happen in milliseconds and due to the similarity of models between companies, the market swings upwards or downwards without any particular fundamental reason.
May 6, 2010, has shown us how the unexplained swings could shake the markets. The Dow Jones Industrial Average suffered its largest intraday point drop ever in just 10 minutes by declining 1,000 points. The price plummeted and rose back up again 20 minutes later. A government investigation found out that the reason for this crash was a massive order that triggered a sell-off.

Another downside to high-frequency trading is from the perspective of retail traders and companies that do not have the capital to position their servers near the trading mainframe. As a result, the big companies with well-developed high-frequency trading systems now profit at the expense of the “little guys.”
Another major concern about high-frequency trading is the type of liquidity it provides. The liquidity produced by this type of algorithmic trading is momentary and is also called “ghost liquidity.” This means that high-frequency trading provides liquidity that is available to the market for an extremely short amount of time. This way of providing liquidity, in most cases, prevents traders from actually using the liquidity provided.

Recommendations

Since High-Frequency Trading is a relatively new concept, information on it is quite scarce. On top of that, trading algorithms and models used by the large companies are kept a secret in order to remain as profitable as possible.
However, there are some quite interesting pieces on high-frequency trading worth reading. Anyone who is interested in reading about algorithms and high-frequency trading should take a look at:

Algorithmic and High-Frequency Trading (Álvaro Cartea, Sebastian Jaimungal, José Penalva) – This book first explains how market microstructure works. After that, it focuses on using various tools from stochastic analysis to solve problems such as optimal liquidation or optimal acquisition problems. The book also discusses some HFT strategies that can be used by anyone and everyone.

High-Frequency Trading: A Practical Guide to Algorithmic Strategies and Trading Systems (Irene Aldridge) – This book focuses on high-frequency trading strategies and models. It also shows proper and appropriate ways of backtesting these strategies and analyzing their performance over time. The book also sheds light on how high-frequency trading is used in a business scenario.

Categories
Forex Videos

Master Advanced Technical Analysis – Candlesticks part 2

Advanced Technical Analysis – Candlesticks part 2

This article is a continuation from part 1, where we learned that the Japanese candlestick is the most widely used technical tool used by traders across the globe. Japanese candlesticks were invented in the early 15th century by the Japanese government of the time. They were used to record price movements on Japan’s rice exchange. At this time, rice was not only the primary dietary staple, but it was also a unit of exchange. Candlesticks are used in trading most of the asset classes. However, they are a particular favorite in the Forex community.


Example A


Example A is the Morning Star set up. We can see that this is a reversal pattern formation of the Evening Star from part one. This three candlestick formation, as seen as A, B, and C, features a descending candlestick at position A, followed by a spinning top, B, which usually denotes a possible change in direction, followed by an ascending candlestick C, and where this is the beginning of the upward move in this example. Keep an eye out for these three candlestick formation setups in the form of the Morning and Evening Star, which usually means that a change in trend is imminent.

Example B


In Example B we have a downward trend which ends with a spinning top, and then a triple formation of the A, B, C, ascending candles which is known as three white soldiers and typically shows the end of a bearish trend, and confirmation that a strong uptrend is underway.

For the three white soldiers to be confirmed the first candlestick at position A, must be a reversal candlestick, and candlestick be the second candlestick should be bigger than candlestick A. Also, candlestick C should be at least the same size as B, with small or no shadows.

Example C


Example C, is a bearish reversal, and helps traders to define a downward trend. The A, B, C, formation is known as Three Black Crows. For this formation to be confirmed, the first candlestick at position A needs to be a reversal, and candlestick B must be larger than candlestick A, with small or no shadows. And where candlestick C, should be at least the same size or bigger than candlestick B, with small or no shadows.

Example D


Example D shows some examples of spinning tops. These candlesticks will typically have long legs and short bodies and tell traders that there is a lack of volume and liquidity in the market. These types of candlesticks can often be found when the market is consolidating, through a lack of direction, and where traders are waiting for a new time zone to open, or perhaps the release of economic data, and therefore, this type of candlestick should be treated with caution.
The second type of candlesticks we can see are known as Doji. These are considered by traders as neutral. They show very thin trading conditions, with a lack of volatility, and offer no clues as to future directional trends.

Example E


Example E, is the bullish White Marubozu. This will always have a large ascending body with no shadows. It tells traders that a large amount of liquidity has gone into the market during this particular time frame and that it was a strong move and was possibly caused by a breakout, or due to an economic or fundamental news release. This type of candlestick would usually be found during an upward trend and would suggest that the buyers have control and that, therefore, a continuation to the upside is very much on the cards. On the flip side, the bearish, Black Marubozu candlestick is directly opposite to its white counterpart and tells traders that the sellers are currently in control and that a continuation to the downside may follow.

Example F


Example F, is of a standard bullish line candlestick, which tells traders that buyers are mostly in control during this time frame. There is a little bit of pullback from the top and the bottom, as defined by the shadows, but overall a good amount of liquidity has gone into the market during this time frame, and this is therefore considered to be a strong move to the upside. The standard, bearish line, just below, is a strong bearish candle and tells traders that a reasonable amount of liquidity is going into the market during this time frame and that the sellers are mostly in control. The standard bullish and bearish candlesticks are favored by traders because they confirm liquidity is present, and they typify a continuation in trend.

Example G


In example G, we can see umbrella shapes, the first of which is a hanging man, because it is formed at the top of a trend, and is the same shape as a hammer. The second shape is a hammer, but which is defined by it appearing at the bottom of a trend. These shapes often depict a change in direction
While candlestick shapes and formations give traders and wealth of information and are extremely useful in predicting trends, periods of consolidation, and showing the possible end of a trend, they are, at the end of the day, just technical indicators and are not 100% reliable. Therefore they should be used with caution and in conjunction with other technical tools in order to increase the odds in a trader’s favor. Always remember the smaller the real body, the weaker the trend, and that this will typically reflect consolidation in the market, when uncertainty exists, and perhaps where traders are squaring positions or looking for a potential reversal or a correction. Lengthening shadows usually show the existence of weakness in a trend and also tell traders that a possible reversal in trend is on the horizon.

Categories
Crypto Videos

Will Cryptocurrency Replace Fiat? – Which Crypto Will Be Dominant?


Can any cryptocurrency replace fiat?

The cryptocurrency community tried to predict how digital currencies will someday take over the world and stand on the spot of fiat currencies. However, there are several problems that the industry has to tackle before becoming mainstream. Some economists view cryptocurrencies with quite a bit of disdain. Even though some traditional financial institutions pointed out the importance of the concept of blockchain technology and even announced working on developing or adopting something similar, only a few have made any suggestion that they will adopt cryptocurrencies at the expense of fiat money.


Even though cryptocurrencies have a long way to go before being considered mainstream, some obvious signs show various cryptocurrencies are making it in the traditional business space.
When talking about any cryptocurrency taking over fiat, we have to think about which one would be the best replacement for the traditional financial system.

Bitcoin

Bitcoin is the one cryptocurrency that remains most likely to become mainstream and get adopted by the world on a large scale. While there is no single authoritative list of companies that accept cryptocurrencies such as Bitcoin, Coin Telegraph suggests that over 54 major companies currently accept one or more cryptocurrencies. Out of the 54 companies, just two don’t accept Bitcoin.
Looking at this statistic, Bitcoin easily outpaces all other cryptocurrencies at the moment.


Altcoins

Altcoins are cryptocurrencies that are alternative to Bitcoin. They tend to see lower levels of acceptance among major companies, as fewer companies want to take such a risk. Coin Telegraph suggests that, when compared with the 52 major companies that accept Bitcoin at the moment, only 25 accept Litecoin, 13 accept Ethereum, 14 accept Bitcoin cash, 15 accept Dogecoin and 12 accept Monero.
However, these 52 companies reported by Coin Telegraph are not the only ones that accept cryptocurrencies. UseBitcoin is a directory that lists over 5,000 businesses and retailers, with nearly all of them accepting Bitcoin. On the other hand, the large majority of these companies don’t accept other cryptocurrencies.
More and more businesses are accepting cryptocurrencies other than Bitcoin or are even developing their own ones. Cryptocurrencies are witnessing wider acceptance as the years go by. Places that have accepted only Bitcoin in the past started accepting Litecoin, Ethereum, or some other cryptocurrency. On top of that, there are even ATMs that offer cryptocurrencies other than Bitcoin. That being said, Bitcoin is still dominant in the cryptocurrency space.
In the end, it’s difficult to guess if cryptocurrencies will get mainstream and if they will, which will able to break into it most decisively. Bitcoin has the advantage of the biggest name and largest market cap cryptocurrencies, as well as being the first one to break into the market. However, altcoins continue to grow in popularity against Bitcoin, even when we take into consideration the bear market.
At the moment, no cryptocurrency has effectively become mainstream and overtaken fiat in any aspect in any part of the world.

Conclusion

There is a possibility that cryptocurrencies may one day take over the role of money from fiat currencies. However, the obstacles they face at the moment, such as widespread adoption, regulation, and such, are extending the horizon enough for the analysts to be unable to predict the future outcome.
One thing is certain, and that is that cryptocurrencies are a groundbreaking technology.

Categories
Crypto Videos

Wall Street VS Cryptocurrencies – Battle Of The Titans


Wall Street VS. Cryptocurrencies


Cryptocurrency investors believed that institutional investors might be the key to Bitcoin’s next bull run for quite a long time. It was a well-known fact that people wished that Wall Street entered the markets as an eager investor, ready to pump money into the young and perspective market. However, that projection misses the mark in two ways:
Wall Street is already investing in the cryptocurrency market while the general public doesn’t know about it;
The last thing Wall Street wants is to “pump” the cryptocurrency market with its capital.
Institutional finance is deeply invested in the cryptocurrency market. However, the fact is also that Wall Street is slowly killing cryptocurrency with the way they do business.

Why is Wall Street killing cryptocurrencies?

Before explaining why Wall Street is killing crypto markets, we need to understand the meaning behind hypothecation. Hypothecation is when a firm that owns equity shares in a company signs those shares away to a lender as collateral.
These shares are not settled physically but rather written as certificates of ownership. This makes these certificates easier to pass along as an ‘IOU.’ This fact opens up a lot of space for speculation as well as manipulation of the crypto markets.


Why is the cryptocurrency market different?

Almost all of the major cryptocurrencies are traded on centralized exchanges, even though they claim to rely on a hard-coded Proof of Work or Proof of Stake consensus algorithms. If a Bitcoin can be rehypothecated many times as brokers and exchanges trade debt and collateral, no one knows who the real custodian of the coins is at the end of the day. In this case, multiple parties own the cryptocurrencies, and no one does. Either all of the parties involved have access to the private key, or no one does.
It’s unclear who owns the Bitcoin because the collateral chain is so long in the case of a hard fork or a broker going bankrupt. When it comes to cryptocurrencies and other ledger-based assets, this complex model of transient ownership simply doesn’t work.


Wall Street steps in

There was a time when Bitcoin was traded exclusively on fiat exchanges. This meant that users could only buy or sell it for fiat on these exchanges. There was no way to short-sell Bitcoin, and there was no option to trade Bitcoin futures or derivatives. All purchases were settled purely in Bitcoin, while that is not the case at the moment. Bitcoin’s limited supply and deflationary nature made it easy for people to calculate the supply and demand and form a market price based on that.
Wall Street’s introduction of Bitcoin futures to its own brokers and exchanges reduced its volatility as these contracts allowed investors to speculate on Bitcoin’s downside and upside. This move balanced the market and made it just as profitable to suppress Bitcoin just as it was to let Bitcoin rise in price. On top of that, the high-frequency trading bots started to trade on the crypto markets, which further reduces their volatility. Sophisticated bot programs like those employed by Wall Street can still be extremely profitable in low-volatility environments.

Why is Bitcoin ETF so beneficial?

The Futures Industry Association (FIA) is a powerful financial trade entity that has a significant influence on the global financial markets. People mostly think that the FIA is responsible for the consecutive delays and rejections of the many Bitcoin exchange-traded funds (ETFs) that have been proposed in the past couple of years.
A Bitcoin ETF would represent a success for the cryptocurrency investors for two main reasons:
ETFs are actually settled in an underlying asset, meaning that there would be less influence created by the cryptocurrency derivatives market;
This feature would create a more simple way of integrating cryptocurrency markets with traditional financial markets via brokers. Bitcoin would become more accessible to retail investors that don’t want to create their own wallets. That could build a bridge that will ensure mass adoption.
Bitcoin ETFs have been mostly flat-out denied, and this includes the ETF proposal from the famous Cameron Winklevoss and Tyler Winklevoss as well as many more.
The rejections and delays were mostly not described wall, which indicates that Wall Street may want the cryptocurrency market to die before it infiltrates the global consumer market. Even though there are multiple avenues for profit in crypto for Wall Street, the threat to the financial world order as we know it cannot be put aside. Wall Street seems to recognize this and want to stop it in its tracks or adapt the technology while keeping its place in the financial world.


Conclusion

Even though Cryptocurrencies are a promising new technology that ensures financial stability once it reaches mass adoption, it would represent the end of the financial world as we know it. Many financial institutions are cautious or defensive towards this market as they can’t predict the future well enough to see themselves in it. For this reason, Bitcoin and other cryptocurrencies face great resistance ahead.

Categories
Forex Videos

Master Advanced Technical Analysis – Candlesticks part 1


Candlesticks part 1

The Japanese candlestick is the most broadly used technical tool by traders across the globe. Japanese candlesticks were developed in the early 15th century by the Japanese government of the time. They were employed to register price changes in Japan’s rice exchange. At this time, rice was not only the main dietary staple but also a unit of exchange.
Candlesticks are used in trading most of the asset classes. However, they are a particular favorite in the Forex community.

Example A


In example ‘A’, we can see two candlesticks, they consist of 4 price inputs, open, low, high and close and which are defined by a real body which displays the open and close, and a lower shadow and an upper shadow which show the overall high and low of that particular timezone.
The left-hand candlestick, with the white body, denotes an ascending candlestick. The candlestick has opened, and at some point moved to the low, it has then moved higher, above the open value of the exchange rate and thus creating the solid body. The candlestick then moves to the high, before falling back to the close, and where it has left a shadow, or wick on the top.

The second candlestick is a descending one. It usually opens at the point where the previous candlestick closes. This time the real body is black. At some point, the candlestick has moved higher, before falling back below the opening value of the exchange rate, and thus now leaving a solid body, before eventually moving to the low point and subsequently moving higher to the close, and thereby leaving a lower shadow, or wick at the bottom. Candlesticks can be color coded to suit. But this is the basic of candlestick trading traders look for patterns when studying technical analysis, and these offer short-term signals that identify relationships between supply and demand. They also help traders to identify areas of support and resistance, which are also called floors and ceilings, and these are areas where price action tends to find it difficult to breakthrough.

Example B


Example ‘B’ shows two completely different candlesticks. Each of them provides a trader with information about activity within that particular time frame. The black candlestick on the left is a bullish candlestick, where the open and close are far away from each other and where the close is near the top of the overall movement during that time frame. This tells traders that this was a bullish move, where a considerable amount of liquidity has pushed the exchange rate higher and that the subsequent move may well continue to the upside.
The white candlestick on the right, however, shows a long shadow at the top and a long shadow at the bottom, with a small body and where the opening price is close to the closing price. This candlestick is known as a spinning top and tells traders that there is a lot of indecision during this time frame. Neither buyers nor sellers were particularly in control during this time frame. Therefore traders will be cautious because this candlestick also represents a consolidation of price action and where no real trend has been defined.

Generally speaking, in a bullish or upward trend, traders will see more black candlesticks than white. And in a bearish or downward trend, they would expect to see more white candlesticks than black. In a consolidating or sidewards moving trend, traders would expect to see an even amount of black and white candlesticks, which would be bouncing off of areas of support and resistance.

Example C


Example C, shows a bearish trend, and where the last candlestick, which is known as Takuri line set up and is very similar to the hammer, has pushed all the way down to a critical support area before buyers have come in and bought it all the way back to its closing level. Therefore it has left a long shadow, which is bigger than the body. Traders will see this as a potential trend reversal and take the necessary steps to close all or part of their bearish trend and wait to see what happens in the subsequent time frame.

Example D

In the example ‘D,’ we have a bullish trend, where are the three ascending candlesticks are fairly large in size with relatively small shadows, followed by a candlestick with a long shadow either side of a small body, and which is known as a spinning top.
Although the closing price is above the opening, and therefore an ascending candlestick, because the body is small, it tells traders that there is indecision at this point and that therefore, there could be a reversal in price action.
The next candlestick is a bearish candlestick, which confirms that the previous upward trend could be over, and this is followed by a bearish engulfing candlestick which gets its name because it involves at least the first two candlesticks in the upward trend. The A, B, C, positioning of a bullish candle, followed by a spinning top and then a bearish candle, is known as an Evening Star formation.

Categories
Forex Videos

Trading Volatility In Forex – How To Make Over 100 Pips In A Single Trade #Newstrader

Trading Volatility

The forex market will typically ebb and flow in line with technical analysis, especially during the times of economic releases, or in the run-up to potential market-moving commentary from governing policymakers.

Depending on the nature of economic data releases, which are usually tiered between, low, medium and high risk, and where the latter would include gross domestic product or GDP, interest rate decisions, and employment statistics, the market can often be subdued just before high-risk announcements, and then extremely volatile afterwards.

During periods of extreme volatility, currency pairs can often spike 50 to 100 pips in a matter of minutes. This will occur because big institutions pull their bids and offers, and large orders begin to fill the vacuum, and where many of the big players and retail traders will be stopped out of their trades. Markets need time to analyze data and trade accordingly. This can be problematic for retail traders who are not properly equipped with professional analysts to help filter out components of the news, which might push a pair in either direction or to decipher if the data is already in the price.
As prices blip and spreads tend to widen during high-risk announcements, it becomes extremely difficult to gauge entry and exit points. In fact, it is almost impossible for the human mind to be able to know how to make informed trading decisions while under so much pressure during times of extreme volatility.
So how do traders trade high volatility events?

Example A


Well, in example ‘A,’ which is a 1-hour chart of the USDCAD pair, and where we have been following the pair from its low of 1.3187 to a recent high of 1.3314. There is a high-risk event later today in the form of Bank of Canada data releases, including consumer price index – year on year – and which will typically involve a great deal of volatility in price action upon its release. We have determined that the pair is overbought, and gone short at 1.3309 and where the pair came into profit almost immediately. We have also protected the trade by bringing our closeout order in front of our entry price at 1.3306 and which essentially gives us a free trade. We cannot lose on this one.

We have set our take profit at 1.3209, which is close to the bottom of the previous low and which would give us a profit of over 100 pips should it be executed. However, in the run-up to the data release, we now have the flexibility of managing this position by bringing our protective close out lower as we get closer to the data event, in case the figure is below market expectations and the Canadian dollar loses ground with the pair moving higher.
If the numbers are strong, we are in a position to follow – what should be a strengthening of the Canadian dollar, and hence the pair is moving lower and then drag our protective close out lower and bag as many pips as we can.

Example B


Example B is a calendar event highlighting the data release which will occur subsequent to our trade set up. And or trade platform is the Metatrader MT4.

Another way traders will set up a trade is via the use of limit orders. These orders can be placed above or below the market price and where they will automatically buy or sell a pair at a predetermined level, close to, or after data release events. These can be a great way of gaining access to high-risk events but should always be used with carefully thought out stop losses. Some traders will even place limit orders to both buy and sell a pair after a high-risk event on the basis that at least one trade will be executed. Again, this is an extremely risky strategy as it is possible to have both trades executed consecutively, and both trades stopped out as the market whipsaws post the event.

Here at Forex.Academy we recommend next new traders study their economic calendar closely and do not trade a couple of hours before, or after, big data release events. Try to observe other regular times of extra volatility, such as the opening of new time zones and during times of thin volume such as public holidays.

Categories
Crypto Videos

Bitcoin The Biggest Enemy Of Cryptocurrency Success

For the cryptocurrency skeptics

Ever since its inception over a decade ago, Bitcoin and the cryptocurrency market, in general, had quite a big group of skeptics declaring the market dead or directed towards obsolescence. Ten years later, Bitcoin is worth four figures, while the crypto sector as a whole is stabilizing and maturing.
However, cryptocurrencies still can’t seem to break into the mainstream and start getting used as they were intended. Very few merchants accept cryptocurrency payments, and even those that do immediately exchange their holdings to fiat currencies.

Argument against cryptocurrencies

There are currently several thousand cryptocurrencies on the market. This can be considered a sign of the success of the market as a whole. However, these numbers can be deceptive. According to a CNBC report, over 800 cryptocurrencies are essentially dead and worth less than a single penny. When we take those out, the vast majority are not relevant or popular. Not to mention reports of various scams and fraud that happened and are still happening in the ICO market.
Other cryptocurrencies aside, the chief troublemaker in the industry is, according to skeptics, none other than Bitcoin itself. After reaching stratospheric heights of $20,000 in December 2017, Bitcoin price started falling in January, which started a lengthy bear market. On top of that, the value of crypto transactions fell by nearly 75% during the second quarter of 2018 when compared to the first quarter.
This lack of acceptance, both in the investment and retail arena, can partially be attributed to the US SEC’s denial of over a dozen ETF filings. On top of it, the regulators are trying to protect their respective fiat currencies, which brings Bitcoin and the crypto market to another obstacle – regulation.


Argument for cryptocurrencies

While it is true that Bitcoin prices crashed in early 2018, the market seems to be maturing, and the volatility, which was one of the main problems, is gradually fading. While this is bad news for speculators, it is excellent news for both institutional and retail investors, as well as for people who want to use cryptocurrencies as a payment method.
Cryptocurrencies and blockchain technology, in general, are starting to receive more and more attention for their utility rather than price movements. While merchants still remain wary of cryptocurrencies, banks and other corporations already started employing them.
While many are advocating the idea that Bitcoin and the crypto market are mainstream, the sector is determined to prove them wrong. While cryptocurrencies may still not be a standard payment method, the technology, as well as the idea behind cryptocurrencies, is quickly becoming extremely popular in different sectors and industries. As companies continue to fix their problems by introducing their infrastructure to a new frictionless solution to old problems with blockchain, cryptocurrency will strive.


The Bottom Line

Even though the market is divided on whether the cryptocurrency market is going to fail or not, the market has continued to plug along and thrive. Although prices have fluctuated wildly, the sector is maturing and stabilizing.
As more companies discover uses for cryptocurrency and blockchain, and more users accept them as a way to simplify their lives, they will remain at a top spot when it comes to technological improvements. On top of that, at one point, if the concept gets fully adopted, we can expect cryptocurrencies to integrate itself in all ways of life. Coins and tokens may come and go as most projects are not resilient enough to survive the harsh market conditions. Still, the idea and the concept behind cryptocurrencies will undoubtedly thrive and get more respect as time passes.

Categories
Crypto Videos

How To Manage Your Cryptocurrency Assets – The Best Sources Available


Cryptocurrency asset management potential

As the internet became more and more popular, it started revolutionizing not only communication but online investing as well. By using the internet, many people could break down the informational and execution barriers that they were facing before. This brought an overwhelming amount of trading applications to the market. This gave an opportunity for a wider range of investors the ability to participate in financial markets with greater execution speed and reduced fees.


Cryptocurrency asset management

New milestones have been met as the UK-based robo-advisor, and online wealth manager Nutmeg surpassed GBP 1 billion in funds under management. On the other hand, such centralized execution and advice are used less in cryptocurrency trading. Cryptocurrency asset management tools are entering the market intending to assist retail investors that want to explore the market. Companies that create such tools have a clear incentive, which is to operate in a perspective market that started to stabilize.

Simplified cryptocurrency management

The process of purchasing cryptocurrencies is still harder than buying regular tradable equities, even in this day. As cryptocurrencies keep attracting new users, the need for straightforward tools designed to manage crypto portfolios is increasing.

Traditionally, new traders must first find a wallet that accepts the cryptocurrencies they wish to trade, and then find a way to buy that cryptocurrency. This is usually done via exchanges that require completing a multifaceted and lengthy verification process. Any form of diversification can mean using more than one wallet or exchange. While it is doable, this process is quite complex and presents a big barrier to entry for many new market participants.


As a result, companies are introducing a tool that was previously only used in traditional asset management, which will help people manage their cryptocurrency portfolios more easily. Instead of having to manage multiple accounts and wallets, cryptocurrency asset management platforms are there to help their users consolidate their diversified portfolios.
This concept is still rather new as most traders still manage their investments through their wallets. However, several platforms have established themselves on the market as asset management tools worth using.
Picking the right asset management tool
Even though the cryptocurrency market has an enormous number of exchanges active, the combination of cryptocurrencies they offer is not a comprehensive list. This poses a challenge for new investors, as exchanges are not compatible with all wallets, which can lead to certain complications when trying to manage a diverse array of assets.

Cryptocurrency asset management platforms

Seek to simplify the process without resorting to a third party to handle users’ investment. Some platform’s tools help its users manage multiple portfolios concurrently. On top of that, they allow for automatic syncing, so users’ trades and purchases will always be updated centrally.
Others provide more traditional asset management tools, such as allowing users to create their asset groups as well as combinations according to their liking and risk-aversion.


Centralization

One important thing to note is the centralized nature of these platforms. Most cryptocurrency asset management platforms are completely centralized, which means that the simplicity and ease of access is just one side of the coin.
Most of these platforms do not offer private keys to the “wallets” to their users, meaning that the funds are not under complete control of the users.

Simplicity is the key to success

Ultimately, the cryptocurrency market will only succeed if the barrier to enter the market is small or non-existent. Cryptocurrency asset management tools offer traders a simple and easy way to enter the market as well as manage their investments.

Categories
Forex Videos

How To Trade Ranging Markets – Maximise Your Forex Profits


Trading Ranging Markets

A range-bound market is one in which price action bounces between a specific high and a specific low on a technical chart. The high acts as a major resistance level and which is defined by at least two attempts to breach a certain exchange rate, and where this has failed and then price action goes on to fail during subsequent attempts.

The opposite applies to a specific low, which acts as a level of support, and whereby at least two attempts have been made to breach this level and where both attempts have failed, and where subsequent attempts have also failed. Price action then continues to range between such highs and lows.

Example A


Example A is a 1-hour chart of the EURUSD pair between 16th to the 22 August 2019 and where price action, as denoted by our red and green candlesticks, bounces between the two levels of support and resistance.

Example B

In example B, we have added eight positions of interest to traders and where price action came very close to our support and resistance levels on five occasions and where the levels were temporarily breached on three occasions at positions 4, 8, and 9, only to be reversed shortly after.

The price action range is approximately 42 pips from the high to the low. The consecutive amount of pips that could have been gained by selling and buying between the high and low equals 245 pips. This is a considerable amount.
This is a classic example of a range-bound – or sideways trading – market during this 6-day trading period. Traders are always looking to reduce risks from their trade setups, and therefore it makes sense to try and establish range-bound markets, because these offer an extra layer of security due to the support and resistance lines which, when established, act as an extra visual layer of comfort.

These levels of support and resistance usually occur after a large price action move and where the price is effectively consolidating because traders have no real ideas as to the future direction of the exchange rate of a particular currency pair. This can also happen between periods of economic data releases, or, while traders wait for events such as interest rate decisions, or forward guidance on monetary policy to be announced by the respective governments.
Another thing to consider is that the Forex market never trades in a linear fashion, that is to say, that it does not move in straight lines. Market performance usually coincides with current daily news events and where this causes volatility and change in price action, which leads to short price action shocks. And where these moves typically spend a lot of time retracing, and this is usually due to traders considering price action to be overbought or oversold within the various timeframes.
Markets do not necessarily range in a horizontal fashion; they can also range in upwards or downwards trends as well.

Example C

Example C is a one hour time frame of the EURUSD pair, and after a difficult to decipher price action movement to the left of the image, at position A and B we have the beginnings of a downward range, or trend, that would have offered up to 200 pips to traders who spotted the opportunity.

Example D

In example D, a range-bound price action is confirmed, and levels of support and resistance are identified at position A, B, C, and D, and therefore should price action continues below the support line at position 1 – where we might have bought the pair, or higher than our resistance line at position 2, where we might have gone short, we would then have confirmation that the trend had finished. However, because we have placed our trend lines on the chart, we can place tight stop losses a few pips above or below our lines in order to reduce risk.
And so, if you are looking to trade range bound markets, make sure that your time frame has established at least two attempts of support and resistance and then pick your moment carefully to buy from support levels and sell from areas of resistance.

Always be mindful that range-bound price action does not go on forever, traders will be sitting on the sidelines waiting for the price to breach support and resistance areas and where extra volatility can creep into the market while traders trade away from them.

Categories
Forex Videos

Forex Trading Psychology – The Key To Success Or Failure


Trading psychology

You’ve probably heard of the old adage: if you don’t like the heat, stay out of the kitchen. Well, Forex trading is a regular burning cauldron of fire and is certainly not for the faint-hearted.

One of the key areas that new Traders fail to take into consideration when starting out on the forex trading journey is the art of controlling their emotions. To be a successful Trader, you need to have a clear head at all times. You need to be making informed decisions, that are based on the economic market fundamentals and your technical charts, and not making rash decisions, such as trading to make up losses on previous trades, or trying to trade while your mind is otherwise engaged in other activities or trading on a whim. Ideally, traders need to be working in a quiet environment, without being impacted by external forces, such as family members, friends, TV, loud music, or other such distractions. All of these will affect your concentration and cause stress.


Trading is going to take all of your concentration because a lack of it will no doubt leave you making incorrect trading decisions, and, therefore, you will be losing more trades than you win. New forex Traders typically fund their accounts and begin trading without learning about how the forex market works. They will often have a minimum of education in this area and will often not fully understand about margin requirements, leverage, the implementation of stop losses, and, therefore, the inheritance risk that is associated with trading the financial markets. This lack of knowledge will greatly affect stress levels and whereby the overall psychology factors of trading are not taken into account.


The biggest area that is going to affect your state of mind when trading is the fear of loss. Taking losses on the chin is a prerequisite of trading psychology. Let the losers go, do not be influenced by losses when deciding on your next trade, and do not double up in order to chase losses. Just accept losing trades as a part of trading. You are not going to win every single trade, no matter how good you are. And one of the best tools that you will have in your armory in order to beat fear, is to use a stop loss on every trade. And the other important factors are to keep leverage at a reasonable level, and reduce losing trades to a small percentage of the account equity, so that should you have a few consecutive losing trades, you will still have available funds to allow you to keep trading. Most professional traders limit losing trades to 2 to 5 percent of their account balance. All of this is the only way you will know where your downside risk is, and implementing these tools will help to reduce the stress of trading.

Professional traders look for a minimum of a 2 to 1 win-to-loss ratio percentage on a deal by deal basis. That is to say, you should expect to lose, let’s say $100, with an expectation of winning $300. And with more wins than losses. And this should be at the back of a trader’s mind at all times. Trading is not a race. It’s a marathon. And it is most certainly not a get rich scheme.

And so when you think about it, psychology, or your state of mind, and particularly when trading, if controlled, will become an invaluable asset. Trading Forex is therefore not just about understanding how this market works, it’s not only taking into consideration the fundamentals when choosing to trade a particular currency pair, and it doesn’t matter how well your technical indicators are set up, if you do not have the right mindset, you are set up to fail.

Another way to help with the psychology of trading is education. Here at Forex.Academy, we supply all the education you will require in order to help you with your Forex trading journey. Therefore, soak up as much education as you can and learn what the market drivers are. Study your charts and identify why your losers happened. This will help you with your subsequent trading activity. And, if you are a novice, make sure you only trade on a demo account. Because, if you can’t be successful there, you will not be successful with a real money account.

Categories
Crypto Videos

Tether & Its Controversies – Is Your Money At Risk?


Tether and its controversies

Before talking about how does Tether work, we have to know what it is.
Tether is a blockchain-based stable cryptocurrency backed in fiat currency. Tether is backed by the US Dollar, which is all held in a designated bank account. Tether tokens are traded under the USDT ticker symbol.

Tether was first launched under a different name. It was called RealCoin when it first came out in July 2014. However, it was quickly renamed to Tether in November by Tether Ltd. Tether Ltd. is the company that maintains the reserve amounts of fiat currency. Tether started trading in February 2015.


In-depth explanation

Tether is the leader of the new type of cryptocurrencies called stablecoins. Stablecoins are created to keep cryptocurrency valuations stable, as most cryptocurrencies fluctuate too much in price to be considered viable currencies. Low volatility would allow stablecoins to be used as a medium of exchange rather than as a medium of speculative investments.
There are many forms of stablecoins, and Tether specifically belongs to fiat-backed stablecoins. As previously said, the US Dollar backs each Tether token in circulation. Tether was created to build the bridge between fiat currencies and cryptocurrencies. It is supposed to offer stability, transparency, and minimal transaction charges to its users. Tether is pegged against the US Dollar and maintains a 1-1 ratio in terms of value and price. However, there is no guarantee whatsoever provided by Tether Ltd. that users can exchange their Tether tokens for US dollars.

According to CryptoCompare data cited by The Wall Street Journal, somewhere around 80% of all Bitcoin trading is currently done in Tether. If this is true, Tether would be considered a major source of liquidity for Bitcoin as well as the cryptocurrency market in general.


Controversies on Tether

Tether was known for its controversies throughout its history. It allegedly got hacked for $31 million worth of Tether tokens, which made the company fork the coin to create a rollback. This event happened in November 2017.

This is not the end of controversies with Tether. Another controversy happened as the audit that was created to ensure that the fiat reserve is maintained never took place. Instead, Tether announced it was parting ways with the firm that was supposed to audit them. Right after that happened, Tether was issued a subpoena by financial regulators. This event happened in January 2018.


In April 2019, New York Attorney General Letitia James accused the parent company of Tether Ltd. as well as the operator of cryptocurrency exchange Bitfinex of hiding tremendous losses from its investors. Allegedly, Tether hid a loss of $850 million from its investors.

Tether has always been a center of attention when it comes to controversies. Many people are still insecure about whether it is backed by fiat currency or not. As there is no real evidence of whether the fiat funds exist, no one can say for sure. However, Tether remained a stable cryptocurrency for quite some time. So far, it has been a safe haven for traders and investors that want to move their funds away from volatile cryptocurrencies when the bear market approaches, without actually exchanging the cryptocurrencies for fiat. This way, they are avoiding various exchange and transaction fees.

Tether token is transacted on many popular cryptocurrency exchanges such as Binanace, BitFinex, and Kraken.

Categories
Forex Videos

Types Of Forex Markets Part 1 – Mastering Your Understanding

Types of Markets Part 1

The foreign exchange market has a daily turnover of over $5 trillion, and which has the largest amount of market participants than any other asset class. The forex market has seen continual growth over the years. But it started evolving into what we have now after the advent of the Bretton Woods system, which was a monetary policy where countries agreed to peg their currencies to the US dollar, and where the United States agreed to redeem all dollars for gold. This system collapsed in 1971, which led to the free-floating of currencies on the free market that we see today.


Forex trading platforms began to emerge in the 1990s. However, it wasn’t until the development of the internet, trading software, and the emergence of forex brokers who offered trading on margin, which started the growth of retail trading in the Forex arena.

Foreign or international currency exchange rates display how much one unit of a currency can be exchanged for another currency. Typically, exchange rates float up or down and where the value of one currency against another is traded based on a multitude of factors, including the strength or weakness of an economy, interest rates, gross domestic product, and political factors, including war. Currencies can also be fixed to another, in which case they still float. However, they move in tandem with the currency to which they are pegged.

All currencies are traded in pairs, and where traders simply look for the strength of one currency against the weakness of another in order to make profitable trades. While this is not the easiest thing to achieve in such a volatile market as foreign exchange, software trading platforms that offer great technical analysis tools, where the study of recurring chart patterns on screens, has completely changed the dynamics of trading within this asset class. And so, technical analysis trading has driven the exponential growth of the Forex market.
The types of people who trade the forex market are hedge funds, asset managers, central banks, sovereign wealth funds, financial institutions including currency speculators, and retail traders who all try to make potential profits from currency fluctuations relating to the global economy.

Example A


In the example ‘A,’ we can see how the Euro is quoted first against the USD because one Euro has a greater value than one US dollar, in which case it is quoted as the base currency against the quote currency. The same applies for all currencies.

Although it is common sense to believe that, for example, a country such as the United States, with all its wealth and power, has a much greater financial foothold over countries such as New Zealand, or Australia and Japan, there is almost an unquantifiable amount of economic variables that formulate the value of one currency against another. And this is why you’ll find one of the idiosyncrasies in the Forex marketplace, where holders of United States dollars might quickly sell those in order to buy the Yen, Australian and New Zealand dollars, simply based on rumors, speculation, and chart patterns. It is because of this that the forex is the most volatile of all asset classes with constant price movement.

Example B


Example ‘B’ is a market watch price board showing many currency pairs and where the fluctuating exchange rates are expressed as bid and ask. If a trailer believes a particular pair is going to go, they will

accept the bid price and execute that rate on their trading terminal, and if they think that the value of the exchange rate is going to go down, or depreciate, they will accept the price as quoted on the ask section of their trading platform

Example C


Example ‘C’ is a screen chart of the USDCAD pair on a four-hour time frame. Traders look for patterns on their screens, such as swing highs and swing lows, in order to try and gauge the strength of one currency against another. And therefore in this chart, we can see that after a swing low the US dollar began strengthening against the Canadian dollar, all the way up to the swing high, where it met some resistance, and then the Canadian dollar began to strengthen against the US dollar as price retreated away from the swing high.

When trading in the currency markets, traders buy one currency and sell the other. In our example, traders began buying the US dollar and selling the Canadian dollar when price moved up and away from the swing low and where this continued all the way up to the swing high.

Traders choose the forex market because there is so much activity. There are many currency pairs, and because the market is often extremely volatile, it presents many trading opportunities. And because of the continual change in the economic circumstances of countries, and the continual newsflow pertaining to economic data, this market has become the most liquid of all asset classes. And because of tight spreads and cheap execution relating to trading within the forex market and the small outlays in capital, which is needed to fund a trading account, it makes absolute sense to consider Forex trading as a great business opportunity.

Categories
Crypto Videos

What Happens After An ICO? – Get Rich Quick Or Scam


What happens after an ICO

Initial coin offerings became an extremely popular subject as people saw the crowdfunding and profit-making potential is brought to the market. Companies create an ICO where they sell their tokens in exchange for funds. On the other hand, investors give their funds to the ICO project as they believe that it will solve a certain problem or simply bring a profit. The creation of ICOs meant that companies could finance a project based on just the idea.

ICO stages

ICOs usually have more than one stage. The first one is private and inaccessible to the public in most cases. It is available only to the big investors and companies that are willing to support the project. They get special deals as well as bonuses depending on the support they are willing to provide, and the amount of money they are willing to invest.

The Pre-ICO stage is next in line. In this stage, early investors get a chance to acquire the biggest bonuses available to the public. After that, the regular ICO can be divided into a few stages, with each one giving different bonuses, depending on the time of investing (the earlier, the bigger the bonus), and/or based on the amount invested (which is rarely the case).


ICO caps

Most ICOs have soft and hard caps to measure the funds required for their projects. The soft cap is the minimum amount of investment required to be acquired to even start the project. If the ICO doesn’t manage to get enough starting capital, they shut down the project and return the money to the investors.
Hard cap, on the other hand, is the polar opposite of the soft cap and represents the maximum amount of money an ICO needs. If reached before the offering is finished, the ICO stops as all the required funds are acquired, and no more funds are needed. The best project ideas tend to sell all of their available tokens in a matter of minutes.

ICO aftermath

After a project finishes crowdfunding through an ICO, the second stage of a project starts. The acquired funds are used to pay for project development or improvement (if the project had any form of a product before the ICO), marketing, and branding the idea that the ICO was based on in the first place.
The first move is, in most cases, to list the token on as many exchanges. By doing this, projects quickly enable profit-making from their tokens as the invested funds grow in market value, turning profits for the investors and making them happy, as well as making a profit to the project managers and developers, so they can have more funds to work with.
Buying into an ICO is much like investing in a company through a stock market. The main distinction is that a company that is listed on a stock market is most likely well-developed already, while an ICO represents an investment into an idea.
That idea is described in a whitepaper. When time is added to the equation, we get a roadmap for the project. The roadmap includes the project’s schedule of improvements, public and official launching of the product, and major exchange listings of their coin or token. If the project wants to be successful, they have to keep up with their timeline, or the investors will not be satisfied, therefor reducing the market price of the coin or token they bought.


ICO regulation

Many countries have decided to take a look at ICOs, how they operate, and how they should be regulated after the 2017 ICO craze. Many of the ICOs were just money grabs or scams while others were decent projects with good visions, but unable to deliver on their vision properly.
Even though the whole idea of cryptocurrency is based on decentralization, regulation can be a good thing, especially in the ICO sphere. Some countries, like China and the USA, have made strict regulatory actions towards ICO. However, both of these countries are now easing up on regulation and trying to come up with a solution on how to utilize ICOs.

KYC – know your customer

KYC laws were introduced in 2001 in the USA as part of the Patriot Act, which was passed after 9/11 to provide a variety of means to deter terrorist behavior. The section of the Act that pertained specifically to financial transactions added requirements and enforcement policies to the Bank Secrecy Act of 1970 that had thus far regulated banks and other institutions.
There are many fully legal reasons to invest in an ICO, ranging from belief in the utility of a new piece of cryptocurrency infrastructure to speculation on a coin’s rising value. Outside of these legal motivations, there are also illegal practices such as laundering fiat currency through ICO projects. Unfortunately, the ongoing lack of regulatory clarity and regulation means that people who wish to invest in a project for its intrinsic utility to disrupt established industries for the better feel they risk being treated as money launderers.
This is why the KYC system is what all of the ICO investors usually have to go through to be able to invest in an ICO. KYC is completed by submitting your information (name, address, country of origin) and then providing one or more documents to prove the information provided.

Final word

Investing in ICOs can be highly lucrative, but only if the investment is well thought out, and the project is successful. Much time has to pass until an ICO proves its worth, so investors need to have a lot of patience. The roadmap is the holy grail of investors and should be considered as such by the developers, too, for the sheer positive thinking in the times of waiting for the project to come to life.

Categories
Forex Videos

Analysing Price Cycle & Market Structure

Price Cycle – Market structure

In this section, we will be looking at technical market structures. Professional traders are continually looking out for technical market structures that occur when a currency pair has achieved a swing high – or structural high – followed by a swing low – or structural low – and vice versa. Traders gain great inside in the relationship between these highs and lows.
These swing highs and swing lows can be found on any time frame, including the 1 minute, the 5-minute, 15-minute, 1-hour, even the 1-month time frame. And herein lies one of the most problematic aspects of trading the forex market: because a swing high might occur on one timeframe, while actually forming the basis of a swing low on a different time frame!

Example A


Let’s take a look at example ‘A’, which is a 1-minute chart of the USDCAD pair, and where we can see price action, as denoted by our Japanese candlesticks, has formed a swing high at position ‘A’, followed by a swing low at position ‘B’, and then a swing high to position ‘C’. In total, this A, B, C, swing high, to swing low price and swing high price action move presented traders with an overall 20 pip trading opportunity. This is not an unsubstantial amount of pips!

Example B


Now let’s look at the example ‘B’; this is a 4-hour chart of the same USDCAD pair. In this example, we have used position ‘1’ to show a previous structural, or swing high, followed by position 2, which is a structural or swing low and then followed by a structural , or swing high, to position 3. This overall move presented traders with a 300 pip price action swing. A huge swing, and an extremely profitable one, if you got it right!. However, sat all on its own, in the top right-hand corner of the chart, as they noted by position ‘A,’ is the exact same position of our swing high, swing low, swing high on our 1-minute chart.

All of the timeframes present trading opportunities when it comes to identifying structural highs and structural lows. However, it is advised that traders are mindful as to what is going on in various other time frames on any given currency pair! But one thing is for sure, and self-evident from the two examples, that the larger the timeframe is, the more important significant the market structure becomes.
Technical traders will keenly observe price action at structural highs and structural lows, because they present trading opportunities, such as pullbacks and reversals, continuations in price action, or price consolidation and subsequent breakouts. They can use a number of tools, such as Fibonacci retracements, moving averages, stochastic oscillators, and Moving Average Convergence and Divergence or MACD, however, the best tool is price action itself, and the most common method to determine price action is via the use of Japanese candlesticks.
Traders don’t need to load their chats up with lots of technical indicators, because more often than not, all the information is already on the charts, and we can use a few lines that we draw onto the charts ourselves in order to show us where the structural highs and lows are.

Example C


So let’s look at example C, where we have added a few lines to the same 4-hour chart of the USDCAD pair. First of all, at position ‘A’ on the bottom left of the screen, we can see a structural low, or SH, where price action has failed to go any lower. Price action enters a consolidation, or sideways pattern, between this low, and the area of resistance just above it.
Price, as it will always do, eventually brakes out of this range at position ‘B,’ where we find that our previous area of resistance has become an area of support. The major structural low has failed, and price action moves to the upside as denoted by the very large bullish candlestick, which tells traders that a large amount of liquidity or volume has entered this pair and moved it up to position ‘C.’ Again we see some consolidation of price action, but where are an initial pullback below the support level at position ‘D’ is curtailed when price action bounces off our ascending magenta simple moving average, and where we can see price action hugging this line all the way up to position ‘I.’ Because position ‘I’ is the highest point in this range it is considered to be a structural high or SL on our chart.. Traders will now be looking to establish if price action moves underneath the simple moving average, or if it will continue above the structural high. And if this becomes a support level, buyers may take advantage of an upward trend continuation.
Here at Forex.Academy, we emphasize to new traders, to be patient, understand their technical analysis, and that an awful lot of information is already on the chart. It does not need to be overloaded with too many technical analysis tools. And that to be a successful
trader, one needs to be patient. What is more, that a multi time-frame approach should be observed to help maximize win to loss ratios.

Categories
Crypto Videos

Cryptocurrency Trading Strategies – How To Make Money Using A Small Starting Balance

Viable cryptocurrency trading strategies
 

“How can traders potentially profit from the cryptocurrency markets without risking too much money, and what are the profitable strategies for the current market?”

Whether the market is moving up or down, there is an opportunity for profit! Cryptocurrencies have been the most volatile tradable asset class in decades, which makes them the most sought after place for traders, as it offers the most opportunity. However, trading brings its risks along with the opportunities. So how can we overcome these risks and make sure the odds are in our favor when trading, even in the bear market we are in currently?

Strategy #1 Heikin Ashi and MA crossover


With the cryptocurrency market mostly being in a downtrend since 2017, we have to take a look at some good strategies for trending markets (whichever way they go). This strategy includes Heikin Ashi as well as slow and fast-moving average crossovers to create an entry point, a profit target as well as a stop-loss. It is suitable for automation as well as beginner traders, as it’s quite easy to pick up.
Heikin Ashi is a version of a chart similar to a candlestick chart. The main difference is that the Heikin Ashi “candles” are averaged out. When used along with moving average crossovers, it can be quite effective in catching upwards and downwards moving trends.

Setup

Heikin Ashi chart 13-21 Simple moving average (fast)

100 Simple moving average (slow)

This strategy marks an entry when the fast SMA crosses the slow SMA, and 2-3 Heikin Ashi candles in a row are in green. For short-selling, the entry should be when the slow SMA crosses the fast SMA, and 2-3 most recent Heikin Ashi candles are red.
The profit target is when (in case of a long position) a few HA candles in a row are red. In the case of a short position, the profit target is when a few HA candles in a row are green.
Stop-loss is a great prevention tool when it comes to preserving capital. When using this strategy, the stop loss should be the latest swing low for a long trade and the latest swing high for a short trade.
Caution: This strategy works extremely well in trending markets, but does poorly in ranging swings.

Strategy #2


Fib retracements, volume, and oscillators
The second strategy is quite the opposite of our first one: it works great in ranging markets, and poorly in uptrends/downtrends.
Using Fibonacci retracements, we can establish potential previous move reversal points. Combining the previous support and resistance levels makes it easy to predict support and resistance points that the price will react to. This is where volume and oscillators come into play. Oscillators such as RSI or Stochastic can tell us when to expect a reversal and are mostly used as confirmation indicators.
The entry points in this strategy should be breakouts to the upside or downside from the resistance/support levels followed by a spike in volume as well as a confirmation from the indicators. Stop-loss should be placed just on the other side of the support/resistance level that was used as an entry point.
Leveraging your position can be an amazing addition to this strategy, and is even considered necessary, as ranging moves are usually not big. This means that the movements are more predictable, and when supplemented with a medium to high leverage, can be an amazing profit-making strategy.

Utilizing leverage trading

Using leverage as a tool to increase the potential profits has been used by both institutions as well as retail traders for decades. It is a great tool to enhance potentially profitable trades. Many traders are arguing that it’s a fast way to lose all your money. However, if used properly, each of the trades taken will have a bigger upside than the downside. If that’s taken into consideration, leverage is an amazing way to increase profits, and start trading with as little money as possible!
If the market makes a 1% move, you will get only 1% profit without leverage. However, with the leverage of up to 1:100 that trading platforms are currently offering, that 1% move can turn into a 100% gain.
With that being said, people should be careful when using leverage as cryptocurrency markets are extremely volatile and unpredictable. The amount of leverage used should correspond to the level of risk a trader is willing to take.

Categories
Crypto Videos

Cryptocurrency Day Trading Vs Swing Trading – Which is best for you?

Cryptocurrency Day trading vs. Swing trading

Cryptocurrency trading is becoming more and more popular as new people enter the markets. Depending on how risk-averse they are, traders are more prone to day trade or swing trade. First off, we need to know the difference between the two.
Day trading is trading where the long or short position is done within one day. Day traders usually stick to this rule relentlessly, regardless of the outcome of the trade. On the other hand, swing trading is and tries to take into account market swings and lasts longer than day trading. The positions can last several days, weeks, or even months. Anything more than a few months, and the trade can be considered an investment.
Many people are struggling to choose between day trading and swing trading and can’t decide which one is better for them. This article will try to explain the differences between the two.


Day trading

Being a day trader is not for everyone, as it brings a lot of risks with its profit potential. Day traders enter short trades with a high win/loss ratio and hope for the trade to be profitable within the trading day. In the case of cryptocurrencies, day traders are people that hold their positions up to 24 hours, as the markets never stop. These traders often utilize leverage to make their profit potential even higher.
Day trading, more than any other form of trading, requires extreme accuracy and quick decision-making when it comes to sizing as well as the timing of the entry, exits, and stop-losses. This form of trading relies much more on the technical overview of the cryptocurrency as opposed to longer time-frame trading, which has a much more fundamental approach. For this trading strategy to work properly, the trades need to be extremely precise and calculated. Day trading can be superior to swing trading in terms of profit, but only if the trader is analytical and can handle stress well.


Day trading also requires constant analysis and knowledge of the markets and their correlations. Cryptocurrency markets are never asleep, so the amount of information a day trader has to process is huge. Day trading is a lot more demanding in terms of time spent on strategizing when compared to swing trading. However, it can be a fulfilling full-time job.
Day trading cryptocurrency markets can be extremely lucrative because of the constant fluctuations of the market. On top of that, there are no set times when a trader must operate, so anyone can trade at any time.

Swing trading

Unlike day traders, swing traders hold their positions for longer than a day. They are usually more patient and fundamentally driven. They require less time to trade, but more time to analyze the markets. These trades have a bigger profit potential due to the duration of the trade, but there are fewer trading opportunities as opposed to day trading.
Swing trading requires less technical analysis skills, but it is more demanding in terms of fundamental research and knowledge of macroeconomics. The entry points are not intended to be micro-managed and don’t have to be as precise. On top of that, the timing is not as crucial as with day trading since the moves swing traders are aiming to catch are larger. The important thing with swing trading is to determine the trend and trade with it.
As swing trading doesn’t take as much time as day trading, it can be a fun and profitable part-time job. However, traders need to understand the importance of stop-losses as the cryptocurrency market does not sleep while they do. If stop-losses are not utilized properly, one might lose most of the trading portfolio while they sleep. This vulnerability has to be countered with a strategy that involves various defensive measures.

Conclusion

Depending on the trader’s personality, ability to tolerate stress, people pick day trading or swing trading. Highly analytical people that have time to do the research and don’t like holding their positions would be a perfect fit for day traders.
On the other hand, people who like trading based mostly on fundamentals and think that chart analysis is pointless, boring, or not as important as fundamental analysis, are a good fit for swing traders.
Either way, both trading strategies can be profitable as long as the traders utilize all of the tools that can minimize their risk and increase their profit potential.

Categories
Forex Videos

Technical indicators Vs Price Action – Which Is Best For High Probability Forex Trades


Technical indicators V. Price Action


The foundation of price action trading is based on the discipline of making all trading decisions based on chart analysis only. A chart, relating to a specific period of time, or time frame, reflects the beliefs of traders in the form of ‘price action.’
Technical traders believe that economic data and other global news events are the catalysts for price action movement. Technical trading assumes that we don’t need to fundamentally assess such data in order to trade the forex market successfully. The reason for this is because all economic data and related world news that causes price movement are ultimately reflected in the price seen on a chart.

Example A


In example ‘A’, the candlestick formation shows an elevated price action at the beginning of the charts on the left-hand side, and then falls lower and traders believe that the market news is ‘in the price’ and therefore they are safe to trade the charts on the basis that their technical indicators are telling them that the price action is overbought, or oversold, and that therefore their chart indicators have a greater probability of offering winning trade set-ups until the next release of economic including such things as unemployment, CPI and inflation, gross domestic product or GDP, interest rate changes and political events and conflicts.


Example B


How do we analyze the price action? Let’s look at the example ‘B.’ This is a 15-minute time frame chart of the EURUSD pair. Each of the Japanese candlesticks presents 15 minutes of price action. Traders always read their charts from left to right, and in the case of Japanese candlesticks trading, they try to decipher the meaning of each candlestick, either individually or as part of a trend.


Example C

In the example ‘C,’ we have highlighted some Gravestone Doji’s and Inverted Hammers, which traders look out for because they tend to occur at times of price action slowing just before a reversal.


Example D

In example ‘D’ this is made much clearer by the use of some technical lines to identify an A, B, C, D, price action, and where at position C, technical traders would be looking for a push lower to the ‘D’ position, purely based on the gravestone and inverted hammer candlestick formations.


Example E


Now let’s look at example E, we have now added a trend line at position 1, and we can see a clear trend which is moving to the upside, and where price action bounces off our trendline as it gradually pulls back from the lows of the previous A, B, C, D, price swing. However, price action begins to flatten out at position 2, and when the price breaks through our trend line at position 3, our bear traders will no doubt be wondering if there is going to be a continual push lower to add to the overall trend of this chart. But the push lower is short-lived, and price reverses during position 4, and where these three candlestick formation is known as three Bullish soldiers and typically denotes a strong bullish trend. Price action falters at position 5, and this becomes an area of resistance, or a ceiling because technical traders will have drawn a trendline, such as ours, and noted that price failed to go above this level on three previous occasions at position 2. Indeed price action begins to fall lower from position 5.

So, in these examples, we can see just how important price action alone, in the form of Japanese candlesticks, and a few lines drawn onto our charts can be so effective in analyzing the ‘clean’ price of an exchange rate. There is an abundance of information when we drill down and look for it. But this can only be truly established by learning about how Japanese candlesticks can define price movements, the stalling, and reversal of price movement, and the indisputable evidence they provide of support and resistance on the basis that these candlestick shapes and formations simply repeat themselves time after time. Price action is a leading indicator, whereas technical indicators, which are overlaid onto chats and follow a statistical measurement of price, are lagging indicators. While technical indicators are an extremely effective tool in technical analysis, they often throw up false signals, or simply leg behind price action so far as to be unreliable when used on their own and without factoring in price action.

Here at Forex.Academy we recommend that new traders learn about the significance of Japanese candlesticks, and study their charts, and read them from left to right, because they tell a story of where price action has been, and where it is likely to move to in the future, based on the fact that all the relevant fundamental data is already encapsulated in the exchange rate of a particular price action.

Categories
Crypto Videos

Trading Stocks & Forex vs Trading Cryptocurrencies – what Is Best For The Every Day Trader


Trading stocks and FOREX vs. trading cryptocurrencies

Many people are wondering if trading cryptocurrencies can match trading stocks or FOREX in terms of profit potential. Many factors affect traders’ choice on which market to trade. Whether it is the liquidity of the market, volatility, or simply the ease of access to the profit-making trade, everything, and anything can influence that decision. We can certainly point out a few factors that differentiate stocks or FOREX to cryptocurrency trading.

Ease of access

When it comes to trading, the ability to start the process fast and without any issues should be a priority. When it comes to stocks and FOREX trading, trading software is expensive and requires a lot of paperwork and time. It is also demanding in terms of computer performance. On the other hand, cryptocurrency exchanges and trading platforms offer a quick and painless registration process as well as the ability to trade from any device in most cases.


Stockbrokers also have a day-trading rule, which requires accounts to have more than $25,000 balance in order to day trade. This rule is called “pattern day trading rule” and is created by FINRA (Financial industry regulatory authority) to stop people from day trading stocks with no intention of supporting the companies or investing into their stocks for the longer term. This makes the barrier to enter the “playing field” when it comes to trading stocks much higher.

Volatility

Volatility is the single most important indicator when deciding whether something is tradable or not. It signifies the price oscillation of the tradable asset. The more volatile the asset is, the more profit potential it has. It is safe to say that cryptocurrencies are far more volatile than stocks or FOREX, and still have enough volume for traders to avoid any form of slippage. Markets like FOREX or the big stock indexes are safer, but also much slower.
We can compare the NYSE FANG+ index, which consists of the biggest tech companies: Facebook, Amazon, Netflix, Google, Alibaba, Baidu, Nvidia, Tesla, and Twitter. This stock index has returned a total of 21.65% annualized total return, starting from September 19, 2014, until October 31, 2019. It has outperformed the NASDAQ-100 index and S&P500 index by a large margin. Still, when compared to the return Bitcoin has made from September of 2014, it is not even close.


Market liquidity and market depth

Bitcoin and the cryptocurrency market have a decent market size, but not close to anything like FOREX. FOREX is by far the biggest tradable market in the world. It trades 5.3 trillion dollars each day. However, even though the cryptocurrency market is a lot smaller, it has no liquidity issues. Both markets are liquid, and the market depth is good enough, so the traders do not have to worry about their orders not being filled, or any form of slippage. As far as liquidity goes, any market liquidity that does not allow for slippage and sudden non-fluid jumps in price are good enough for trading.

Institutional involvement

Institutions are trading every form of asset and commodity they can earn money on. However, the cryptocurrency market is still young and fairly free of institutional manipulation. There is no denying that institutions manipulate the order books and use the latest software and the best technology to create a trading “edge.” This makes trading traditional assets extremely hard. FOREX is especially filled with algorithmic robot-trading and market manipulation (to a degree), which destroys all profit potential traders should have. According to data gathered by Morton Glantz and Robert Kissell, the percentage of algorithmic trading in FOREX is ranging from 85% to 90%. On the other hand, algorithmic trading in cryptocurrencies is minuscule compared to the numbers FOREX shows. Competing with machines that are analyzing as well as entering/exiting positions faster than any human can be extremely hard.


Regulation

When compared to FOREX and stock trading, cryptocurrency markets are less regulated. This gives many platforms a chance to rise and try to offer the best options for the traders, as it is much easier to create a cryptocurrency trading platform than a FOREX brokerage firm. However, quantity does not mean quality. Only a few exchanges are offering innovative and good options to their customers. Most trading platforms offer crypto traders 100x leverage on their traders, among other options, making it much easier to start with less money and profit more from small movements in price.

Uptime

Quite simply, cryptocurrency trading is available every minute, hour, and every day. There is no downtime, not even for holidays. FOREX markets, on the other hand, are not tradable on weekends, while stock markets have trading hours each day. Why should a trader lose two trading days a week in case of FOREX, or even more when it comes to stocks? Most retail traders are trading only part-time, and this gives them the option to be more involved in trading, as the markets are available and tradable at all times.

Conclusion

Every trader needs to decide how much risk he or she can handle. Trading cryptocurrencies is a bit riskier but brings massive profit potential. On the other hand, investing in stock indexes or FOREX can bring constant minute profits over a longer period.

Categories
Forex Videos

Technical Analysis Defined – Using Past Price & Technical Tools To Predict The Future

Technical Analysis Defined

Technical analysis is the study of historical exchange rate price action, which forex traders study in order to predict future price movement. Traders can look at historical price movements on charts with various time frames in order to determine the current trading conditions, including volume and liquidity and possible price movement. Technical analysts use screen charts because they are the easiest way to visualize historical data!

Example A


In the example ‘A,’ we can see a very basic screen 15-minute time frame chart of the EURUSD pair where the elapsed time is shown on the X-axis along the bottom and where the change in exchange rate price fluctuations is shown on the vertical Y-axis to the right of the chart.
Many professional technical traders are of the opinion that the fundamental reasons that might affect a currency exchange rate, such as the latest economic data releases, including interest rates, will all be encapsulated within the current exchange rate, as seen on the chart. But of course, everybody’s opinion differs and when you Factor in market sentiments and expectations from future events, plus institutions creating extra markets liquidity by ducking in and out of various currency pairs. This is just one of the reasons why exchange rates seldom stay static.
But, essentially, traders use past chart data in order to try and determine future exchange rate direction.

Example B

Let’s look at an example ‘B.’ This is the same 15-minutes charts of the EURUSD pair, and the only tool we have on the screen is Japanese candlesticks. Some Traders only have candlesticks on the charts because they are often the best indicator of all when it comes to historical price movement. In our example, we can see that to the left of the screen at position A there was a self in the pair to position B, and then a complete reversal to position C, where one single bullish candlestick engulfed the price activity of the previous elven time frames. Therefore, due to the size of this candlestick, it would have been considered to be a strong indication that the market was going to continue to move higher.

Example C


In example ‘C’, we are sticking with the initial A, B, C move, to try and identify what traders might have been looking for during the move from position B to position C. As such we have added some X’s, which mark areas, usually a couple of pips above entry points where the short-selling traders in our example may well have placed their stop losses, during periods mini stop losses are taken out, it can increase volatility, And so Traders will be aware where of where the stop losses lay.

Example D


In example ‘D’, we have added Bollinger bands to our chart. This is another tool favored by technical analysts. Something clearly interesting can now be seen at point ‘A,’ which is at the top of the bands, and often features as a selling opportunity to traders. And at position ‘B,’ we can see price action bounce off the bottom of the bands and move up to position C. Again, price action had reached the top of the bands again before pulling back slightly, but not to the bottom of the bands this time. And this was most likely due to the fact that the move from b to c was seen as a bullish move and where several stop losses were taken out along the way.

Generally speaking, over 90% of price action will remain within the Bollinger bands.
In example ‘B’ we have added another favourite tool that technical Traders use the stochastic oscillator, which is a momentum indicator and tells traders when a pair might be overbought, for example when the two lines moved above the 80 axis line, and when the pair were likely oversold, which would be when the two lines crossed underneath the 20 axis line.


Here we can see that at position ‘A,’ the stochastic was close to the 80 axis line, and therefore overbought. We subsequently see at position B, that our stochastic had gone below the 20 axis line and the market then moved higher to position C. We think we know why there was only a short pullback from position C to position however D, and then position E coincides with our stochastic being overbought at position 3. From here, we then see a fall back in price action.

One of the most common mistakes that new traders make is to load up their screens with many and various technical tools. In the case of technical analysis, we find that less is more when it comes to using technical trading tools.
This is a short example of the power of technical analysis. However, there is a caveat, which is that indicators are just that, indicators! They are not a guarantee of future price action and must be used with caution. The best indicator is price action itself, and even this is not a guarantee that price action will not stop dead in its tracks and completely reverse without warning.

Categories
Forex Videos

Who Is Trading Forex – Know Your Enemy!

Forex, so who’s trading?

The Forex market has a daily turnover of around US$5.3 trillion! That’s around £4 trillion. This market has been growing exponentially. However, growth has pulled back slightly since 2013.
So who is taking advantage of this incredibly liquid market, the biggest traded business on the planet? Large companies and institutions, including banks, HNW individuals, fund managers, firms that have overseas business activities and need to hedge their currency exposure, sovereign wealth funds, and governments’ central banks, importers and exporters, and everyday people in their bedrooms are now trading Forex; thanks to the proliferation of the internet!


But here is something that new retail traders do not appreciate, nor fully understand: Every single time that a new retail trader pulls the trigger on a trade, where he or she might be trading a pound, or a dollar per pip movement, or perhaps they have already done that, been lucky, and then leveraged their next couple of trades up to 5 or $10 per pip, they are trading against institutional traders who have at their disposal billions of dollars in their trading accounts. And when these guys pull the trigger on a trade, there are a host of professional traders on the opposite side of the fence trading against them! And with much deeper pockets. It is not unusual for an institution to hit a Forex exchange rate with over $500 million in one single ticket; it happens all the time. This kind of size can move the and exchange rate by 25 to 50 pips in the blink of an eye. So new traders be warned; this is what you are up against!
Also, many of these institutional traders will have been to university and studied economics, and cut their teeth trading on smaller accounts at their institutions, until such time as they have honed their skills and then been let loose on multi-billion dollar accounts. And now traders are up against adaptive algorithms which are now regularly used in the Forex market for auto trading purposes. These clever algorithms actually learn how to improve their trading, and they are getting better all the time!

However, it is well known that over 70% of new Forex traders will lose all their deposited money within six months. And this led – according to Reuters – to the China Banking Regulatory Commission banning banks from offering retail Forex on margin to their clients back in 2008. The writing was on the wall for retail FX traders in the west!


In 2014, the French regulator conducted a survey which concluded that the average % of losing clients was 89%, with clients who squandered €11K on average between 2009 and 2012. Over that four year period, 13,224 clients lost €175M. The estimated number of losing retail traders across Europe during this period was 1 million.

In 2015 the US National Futures Association announced a reduction on limits that US brokers could offer their retail clients to a maximum of 50:1 in 10 listed major foreign currencies and 20:1 on some others. Similarly, in 2018, The European Securities and Markets Authority (ESMA) confirmed stricter changes to the way brokers are able to offer retail Forex clients leveraged trading. We expect we shall see a lot more of this type of intervention in years to come.


Yet none of this really addresses the real issue, which is why people lose money trading Forex? It simply comes down to education. I wouldn’t strip a car engine down without first going to mechanic classes, or operate on a human without going to medical school, or fly a plane without lessons. And yet thousands of individuals think they can open a Forex trading account and consistently make money. Sure, they might get lucky initially and think they are on a roll, before over-leveraging themselves and wiping out their accounts. In our opinion, here at Forex.Academy, if governments want to intervene, they need to address education. Sure, reducing leverage and insisting on a larger margin requirement will slow down the rot. But

it won’t stop it, whereas insisting that traders are qualified – even to some basic degree of education level – would have a much better positive impact. Just like any profession, people need to be fully educated, and a basic level of education should be the first thing undertaken before newbies are let loose ‘trading,’ a term we use loosely! Under the circumstances, they are gamblers, and we all know what happens to most gamblers!

So to all you people who are thinking about becoming a currency trader, invest in a professionally put together education course and at least give yourself a chance in this volatile arena, which is fraught with danger and will think nothing of absorbing your hard-earned cash into its coffers!

Here at Forex.Academy, we recognize this issue and feel passionate about it. What’s more, we offer all the educational tools you will need to trade effectively, and the only investment you need to outlay is your time because our entire and comprehensive educational library is free!

Categories
Crypto Videos

How To Get Your Token Listed On An Exchange? – Can You Make Money From Doing So?

How to get your token listed on an exchange and when?

Tokens that are easily available to the public become more attractive to buyers. On top of that, many exchanges require projects to have a value-adding product to be listed. Therefore, the token listing brings external confirmation of a value-adding product as well as a product that is easily tradable.

This brings us to the conclusion that the success of an ICO project often lies in getting listed on an exchange. Some people even invest in ICOs simply to “flip” them if they know that the token is being listed on an exchange in a reasonable time frame.


Choosing an exchange

As history shows us, listing a token on an exchange can, on average, increase its value by 15% – 20%. However, infrastructure providers of crypto listings are also aware of this fact. That’s why listing an ICO on a known crypto exchange can cost up to $3million. To cover these astronomical fees, startups are spending money raised through an ICO instead of using the funds for developing their product. But what are these companies getting out of the process and how they pick the right exchange? With more than 500 exchanges to choose from today, it is not an easy decision.

Factors to consider when choosing the right exchange:

  • Safety
  • Exchange fee
  • Liquidity
  • Exchange customer support
  • Different payment options
  • Is the exchange beginner friendly?
  • Does it accept fiat currency?
  • Centralization

1. Safety factor

Choosing a safe exchange is clearly a “must do.” With all the security breaches that happened to various cryptocurrency exchanges over time, one must be very careful when picking the right one. Choosing a decentralized exchange will certainly be much safer than choosing a centralized one. However, that might bring other problems. With that said, everything needs to be balanced out, but safety is certainly one of the biggest factors when choosing the right exchange.

2. Exchange fees

Various exchanges have various fees. Depending on how many people support the project, how desired it is, and how “revolutionizing” the exchange thinks the project is, different cryptocurrency projects will get different offers. Most exchanges currently do not have a fixed listing price, but rather set their price based on various conditions. Choosing an exchange that fits the budget is certainly a goal, but not at the expense of safety and integrity.

3. Liquidity

Liquidity and volume measure how big an exchange actually is. The more liquid the exchange is, the more volume listed coins have on average. With the correlation between liquidity of the exchange and token liquidity being clear, we can safely assume that exchanges with more liquidity will be better for the token. However, they usually have bigger listing fees or higher standards in terms of coin development.

4. Exchange customer support

Exchanges are often rated by their users (both token projects and traders). Based on the reviews, both good and bad, a project should decide on whether the exchange is suitable for them or not. Getting honest and detailed reviews can be hard, but it is doable. Companies should not be afraid to approach already listed token projects to seek advice when it comes to a particular exchange.

5. Different payment options

Most exchanges have the same payment options but should be checked just in case. Centralized exchanges, on average, have a wider variety of payment options.
Even though all of the payment options should be considered, they should not be an important factor when choosing the right exchange.

6. User-friendliness of the exchange

Depending on the project’s target audience, this factor might be more or less important. However, having a user-friendly exchange for your token is always a good thing!

7. Fiat currency trading pairs

If a token gets listed on an exchange which also supports trading fiat currencies, it might rise in price much more. Those exchanges are usually more regulated, but also more reputable.
The fact that a particular exchange supports fiat currency trading should not be important to the project from any technical side, but it does bring additional integrity and a positive reputation.

8. Exchange centralization

Choosing a centralized or decentralized exchange can be a big thing. They both carry a lot of positives and negatives.
Overall, decentralized exchanges are safer, but are currently lacking in every other department. Even though they are the future, it might be better to (at least for now) stick with centralized exchanges due to higher liquidity and user-friendliness.


Listing timing

Lastly, we need to mention token listing timing. Many people tried to debate whether it matters when the token is listed or not. However, there is no debate that whenever cryptocurrencies are in a bearish market/trend, smaller altcoins perform worse on average. This is because of mass fear and people exiting their positions to save themselves from the potential downswings. Therefore, timing plays a big role when it comes to token listing.
There are no formulas or clear guidelines when it comes to proper timing, but the general rule is that the more bullish market looks, the better chance a token has to succeed as soon as it gets listed.

Conclusion

Choosing the right exchange for the project is by no means an easy task. However, each project has an enormous choice of exchanges, which will ultimately allow them to pick the most suitable exchange for their needs.

Categories
Crypto Videos

The Complete Guide To Binance DEX – Crypto Master


Binance DEX guide

Binance has released a decentralized exchange in addition to its traditional one. The Binance DEX is now running on the testnet. Binance wanted to tackle the problems of the conventional exchange model. Having a decentralized exchange puts back full custody in customers’ hands as well as goes along with the principle that cryptocurrency decentralization.

Binance DEX is a decentralized order-matching engine that does not have any influence, power, or custody over its users. Binance DEX should be seen as an extension of the traditional Binance exchange, especially now that Binance DEX is only in testnet. As Binance DEX required a blockchain to be built on, Binance Coin (BNB) will transform from an ERC-20 token to a cryptocurrency with its blockchain called Binance Chain.


Binance DEX guide

Binance DEX currently allows people to create a wallet and start exchanging their tokens on it.

How to Start Creating a Wallet

Click the “Create Wallet” icon that appears on the official website. After creating a wallet, pick one of the three options to how you want to access your wallet:
Keystore File + Password;
Mnemonic Phrase;
Private Key.

Binance DEX requires all users to use the Keystore file + password, while the choice between Mnemonic Phrase and Private Key is left to the users. The chosen method will act as a secondary way of accessing the account wallet.
Creating a Keystore file requires users to enter a password that is at least eight characters in length. The password must include an upper case letter, a symbol, and a number for it to be accepted. After the password is created, the mnemonic phrase will be shown.


Unlocking
the wallet

Before placing any trades, users are required to unlock their wallets. That can be done by clicking on any of the relevant tabs which will lead you to the password window. Once you choose one of the three aforementioned methods of wallet accessing and input it, you are ready to go.
Adding funds to the Testnet account
Adding funds to Binance DEX will give users free 200 BNB funds. All testnet users are required to have at least 1 BNB token on their traditional Binance account so they can receive the 200 BNB testnet funds. This requirement is not a limitation, but rather a security measure against spam.


Binance DEX trading interface

Binance DEX user interface (UI) is created to be easy to use and intuitive, as that was one of the biggest downsides to other DEXs.
TradingView chart is the center of Binance’s user interface. This chart is connected to TradingView, which means that all indicators, strategies as well as the ability to draw on the chart are available on Binance DEX.

The bottom left-hand side of the UI is where users can track their Open Orders, Order History, Trade History, and Balances.

Binance DEX currently supports only Limit orders, but other types of orders will be available. Limit orders can be located at the lower right-hand corner of the interface.

The order book can be found in the right-hand side middle part of the interface. By utilizing the order book, users can see a list of open orders on the exchange for both asks and bids.

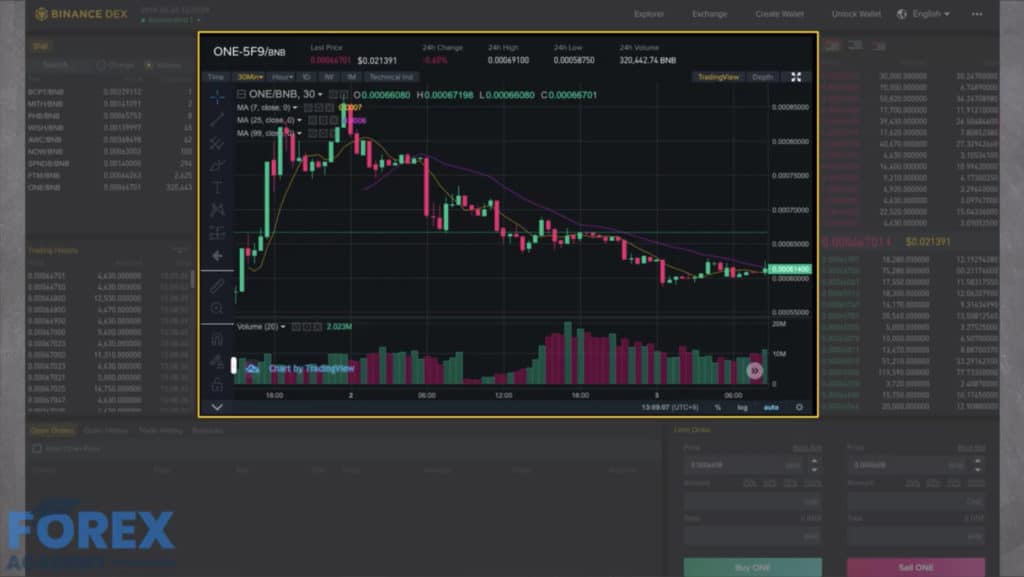
The Left-hand side middle part of the UI is reserved for the trading history panel. This part of the UI shows users all trades that occurred on the selected trading pair and in a certain period.

Available trading pairs can be located at the upper left-hand side of the UI. Additionally, this part of the UI also shows the current price of the asset, 24-hour percentage price change, and the 24-hour volume.

Users can sign out by clicking the “Sign Out” icon at the top right of the user interface when they are finished with trading.

Categories
Forex Videos

Assessing Forex Price Consolidation Like A Pro

Price Consolidation


In any market, but specifically, the Forex market, when we talk about price consolidation, we are referring to the price action, or the up and down movements, of exchange rates of a particular currency pair that occurs between defined levels of support and resistance.
These areas of consolidation are typically seen after, or during trend cycles, either to the upside or downside or during time zone crossovers. At these times, price action will usually become slightly muted and whereby volume in terms of liquidity dries up.

Some people refer to these areas of price consolidation as the markets taking a breather, or times of indecision. At these times, traders will look at what has been happening on a currency pair after a defined trend in either direction, due to technical or fundamental analysis. At which point traders will be wondering if the trend will continue or if there will be a reversal. And therefore, liquidity is taken out of the market until such time as traders pile into the next move.
Therefore, price consolidation can only be identified via technical analysis.

Example A


And so let’s look at the example ‘A,’ which is a fairly typical example of what you can expect in the Forex market on an all too regular basis. This is a 15-minute time frame of the EURUSD pair. We are using Japanese candlesticks and some trend lines which we have drawn it onto our chats.
We always read our chats left to right, because they tell a story of where the pair has been moving too and from. We can see that from position ‘A’ there was a bearish trend which is clearly defined by our red candlesticks. Traders pushed the pair lower by 55 pips during this move, before price action pulled back slightly due to indecision by traders.

Position ‘B’ then becomes an area of support, and price action consolidates between this support level and a clearly defined area of resistance, where price action fails to go any higher than position ‘C.’ We then have a period of sideways movement or price consolidation, and where the overall movements between these two lines is restricted to a very small 15 pip range. In the middle of this section we can see that some of the candlesticks are very small, and during some of those 15-minute time frames, price action moves no more than a couple of pips. This is a clear sign that price action is in a consolidation mode, and where traders will be looking for the next breakout from this narrow range.


Example B

Let’s go back to that chart as per example ‘B,’ which is a few time frames later than the previous. Here we have added a secondary support level. This level was not breached during the midsection of this consolidation period. However, as price action begins to fade to the downside of the consolidation period and breaches the secondary support level and also breaches the original support level briefly before moving up to the secondary support level, which then becomes an area of resistance at position ‘E.’ Price action then falls back to our original support level. We can see that the size of the candlesticks has become larger, and during this later stage where the sellers’ candlesticks engulf those of the final two bullish candlesticks in the series. This indicates to traders that buyers are starting to stay on the sidelines and where sellers believe that they will see a continuation of the trend lower and which originally started at position ‘A.’ Therefore, the activity around positions ‘D’ and ‘E’ become selling opportunities and where a secondary trends lower has been established from this period of consolidation. The longer the period of consolidation, the more likely the market will react with an explosive breakout. Remember, at some stage, the market simply must move on.

Example C

So how do we know if support and resistance is applicable to our chart? Have a look at the example ‘C.’


The best way to determine if support and resistance is happening is to establish at least two positions on our chats where the market fails to go lower, and this will be the support or floor, and two positions on our chats where price fails to go higher, and this an area of resistance, or a ceiling. As we can see in our diagram, price action fails at position B’s bearish trend, and we have now called this position 1, Traders try to push the pair lower again and failed at position 2. The move action pushes higher to position 3. A subsequent move fails to go higher at position 4. Therefore this could be considered to be acceptable areas of support and resistance.
We can now use these levels of support and resistance in our risk management strategy, should we wish to take on a trade in either direction with this pair. If we believe the market is likely to break out to the downside eventually, then we should place our stop loss a couple of pips above the highest candlestick formation adjacent to our resistance line.

On the flip side, if we believe the market will reverse the original trend lower, and move to the upside, we would simply need to place our stop loss a couple of pips under the lowest candlestick adjacent to our support line. This is typically how professional traders place this stop losses when trading out from areas of consolidation.

Categories
Crypto Videos

What You Don’t Know About Decentralised Exchanges In Under Four Minutes

Decentralized exchanges explained

Bitcoin was designed to be a peer-to-peer system that allows its users to transfer funds or information without central authority or third party getting involved. By using Bitcoin, users fix the problems of censorship, fraud, and many others. On top of that, the automated issuance mechanism of Bitcoin through mining removes the control that central and private banks had.
The primary goal of Bitcoin’s creation was to return the control of money to its owners. However, these same fund owners entrust their funds to third-party services on a daily basis. The most popular service providers in this industry are cryptocurrency exchanges. These centralized exchanges are easy to use and access. On top of that, they are a great option when it comes to using advanced trading features such as margin trading.
However, these exchanges represent a security risk for the users’ funds. Not only that, but they go against everything that Bitcoin and cryptocurrencies in general stand for. While some exchanges have better security features than others, security breaches are not rare in this industry. Exchanges got hacked, and people lost their crypto holdings in a matter of seconds.

So what’s the alternative?

With all that being said, users still need to exchange their funds somewhere. Bitcoin is not yet an accepted payment method in most places, and people need places where they can sell it for fiat currency. Also, obtaining some altcoins can only be done in exchanges where people can exchange major cryptocurrencies for smaller ones. So how can people not compromise their security while still being able to exchange cryptocurrency? The answer lies with decentralized exchanges (better known as DEXs).

Decentralized exchanges

Decentralized exchanges are exchange markets that don’t require a third-party service to hold the customer’s funds. The exchange trades occur directly between users through an automated process, which greatly increases the decentralization aspect of DEXs. The decentralized exchange system opposes the centralized model in which users deposit their funds while the exchange issues them an ‘IOU’ that can is then traded on the platform. These funds are converted back into the cryptocurrency once a withdrawal is asked for.

Pros and cons of DEXs

Decentralized exchanges are a safer option to traditional centralized exchanges as they do not own their users’ keys. On top of that, users are not required to trust the security of the exchange as their funds are held in their wallet rather than the third party.
Decentralized exchanges also value the privacy they provide. Users are not disclosing their details to anyone on the network, which keeps them safe from any type of government intervention.
On the other hand, there are always downsides when it comes to decentralized exchanges. Most DEXs have very complicated user interfaces, which are challenging even to seasoned traders. On top of that, most decentralized exchanges have far lower liquidity than their centralized counterparts. On top of that, margin trading, lending, and stop-loss are currently unavailable on many DEXs.

Summary

Decentralized exchanges provide a unique way of transacting cryptocurrencies. However, there are still many obstacles to tackle before DEXs become what they are intended to be. With low liquidity and non-user-friendly interfaces, DEXs are just another tool for people that want to exchange their crypto assets safely. However, to mass adoption, DEXs have a long way to go.

Categories
Forex Videos

Why You Will Never Be A Successful Forex Trader – Understanding Forex Position Sizing

Position Sizing

Position sizing is the technical size of a trade, or the monetary risk, that a trader is going to take in any given trade. Investors use position sizing to help determine how many units of a particular currency they can purchase, or sell, which helps to control risk and help maximize returns.
Let’s face it, some people might be prepared to go into a casino and put all of their available funds on black, or red, or odds or evens, or a select a number on the roulette wheel, or snake eyes on a throw of the dice, and then hope for the best! A few lucky punters might win occasionally. However, the house always wins in the end!

In Forex trading, we are unlike a casino, insofar as we use fundamental and technical analysis skills in order to try and stack the odds in our favor. We then utilize position sizing in order to maximize our winning potential and also to help to mitigate against the risk of losing trades. In other words, if we do suffer a few losses, we live to fight another day, unlike gamblers who put all their money on one roll of the dice.
Therefore, traders must put up an appropriate amount per trade, given their level of experience, the level of volatility in the market, and proportional to their account balance size. This is where most inexperienced traders go wrong; they simply use too much of their capital per trade, and as a result, when they have a couple of losing trades, they blow their accounts. Statistically speaking, over 70% of new retail forex traders will blow their accounts within the first six months. This, coupled with a lack of understanding of how the forex market works and a lack of understanding regarding leverage and margin requirements, is the account killer for new traders.

In order to be a successful Forex trader, they must learn how to apply the correct use of capital exposure per trade or position sizing. The three most important issues are 1: how much capital they wish to assign to each trade, 2: what is the trade risk associated with each trade, and 3: are they calculating position size accurately.
All of these issues come under effective risk management and are just as important as any other area in Forex trading, such as technical and fundamental analysis. If traders do not understand this, then everything else they know about the market is a waste of time! In Forex trading, every aspect must work together in unison, in order for a trader to consistently win trades. When it comes to trading, capital preservation is paramount to survival.

Example A


Let’s look at example A: Determining capital risk per trade This is typically a percentage of an account balance
The average percentage per trade risk for retail traders is 2%
Example: 2% risk of a $2,000 account balance is $40
Calculation: $2000 x 0.02 or 2% = monetary trade size risk
In this example, a trader could experience ten back-to-back losing trades or $40 and still have
80% of the capital intact.

It is extremely advisable that new traders adopt this very important position sizing risk strategy, in order to achieve longevity in their trading careers, especially in the early stages. Once a trader has a consistent winning methodology in place percentage risk per trade can be gradually increased above 2%. Traders are also advised to try and achieve a minimum of 2 to 1 win to loss ratio. This would mean that a trader should be looking to make a minimum of $80 per trade win while risking a $40 loss.

Example B

Let’s look at example B: Determining trade risk per trade
Is there an accurate assessment of the probability of a positive outcome?
Are there enough reasons in place to enter this trade?
Decisions must be made to determine precisely where to place a stop loss
Does the chart confirm a realistic possibility of your trade hitting a minimum profit based on the 2 to 1 win to loss ratio?
One area where new traders fall down is their failure to understand that when they trade in the Forex market, they trade on a per pip basis within exchange rate fluctuations. That is to say, that traders’ winnings and losses are calculated on the movements of pips. In Forex, trading pips are calculated from four places to the right of the decimal point.

Example C

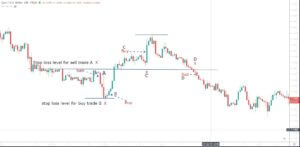
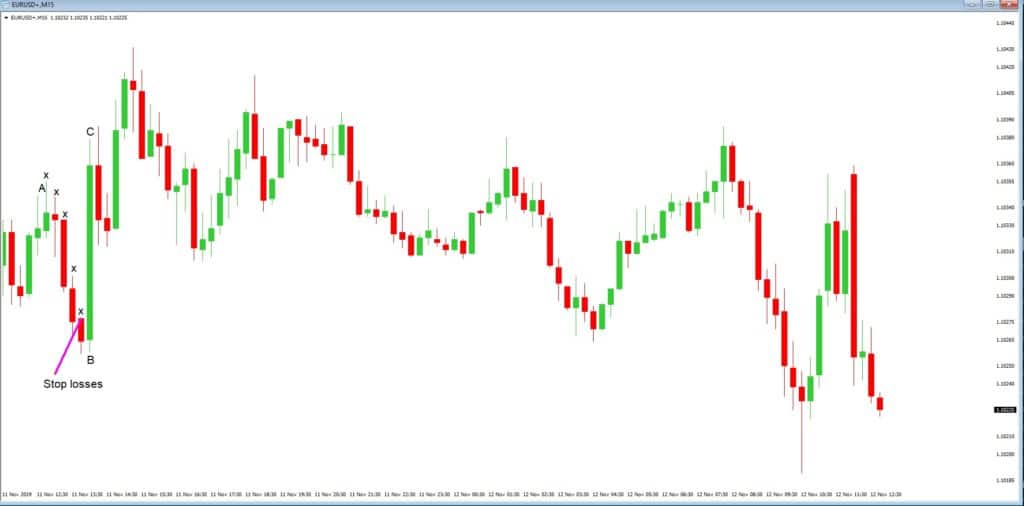
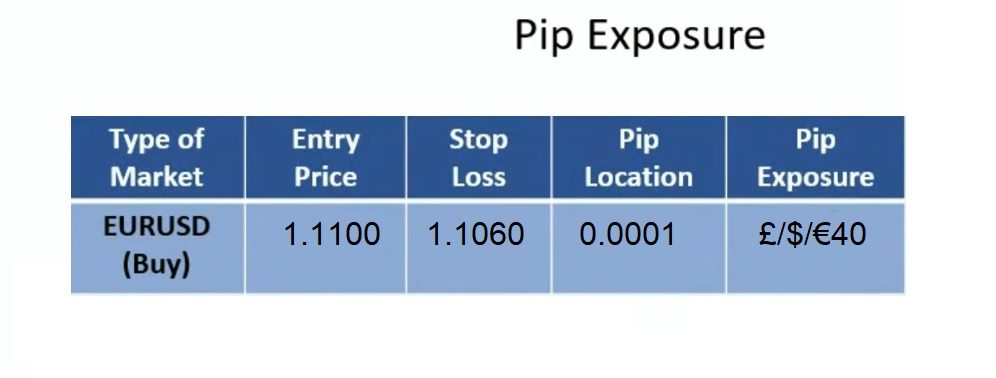
Therefore in example C, if we bought 1 mini lot of the EURUSD pair at 1:1100, we would need to place our stop loss at 1.1060, which would give us an exposure of $40.
In keeping with our 2 to 1 win-loss ratio, we would put our take profit at 1.1180.

Example D

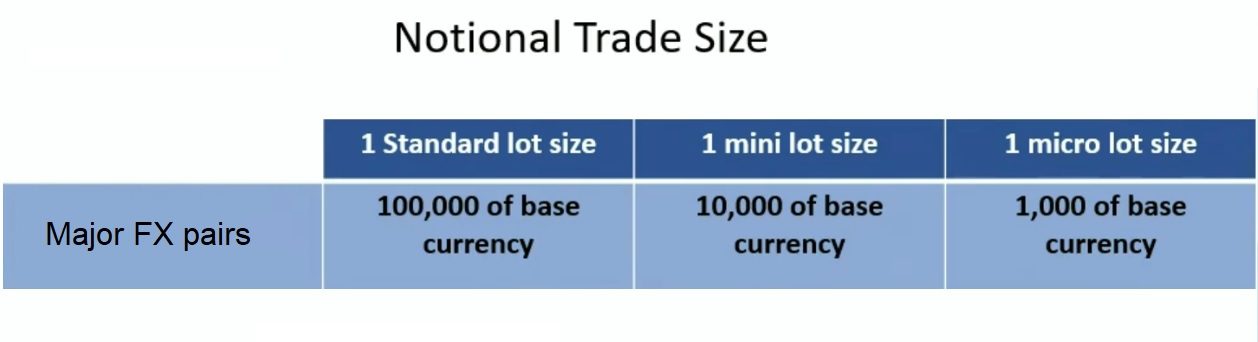
Let’s look at example D: Notional trade size.
In order to understand position sizing, traders also need to understand the notional size of a trade. In keeping with our earlier EURUSD trade example, when setting our trade size on our platform, we need to understand about lot sizes. Therefore when trading currencies, because we are trading on leverage, essentially when we trade one mini lot, we are effectively trading 10,000 units of the base currency of the particular pair.
And so in our example, we would be buying 10,000 units of Euros, as the base currency is always quoted first, and the counter currency is always quoted second.

Categories
Forex Videos

The Complete Guide To Forex Order Types


Order Types

The pre-internet era for the institutional foreign exchange currency market was fairly limited by today’s standards for institutions who wanted to buy and sell currencies. Back then, the market was known as the Spot Forex market. This is because most trades were done on the spot. A bank would call a broking house, or another institution directly and ask for an exchange rate on a currency pair in a given amount. If the price was right, the trader would hit the bid or the offer by saying, Mine, or Yours. The trade was done instantly, or on the spot. A fairly average trade size would be $1 – $10 million per ticket, a sizable amount.

So banks in the institutional Forex market would typically use money broking firms who would supply them with various exchange rates pertaining to the currency pairs the bank was interested in trading. This is where the bulk of the liquidity was, because it was quicker for a trader at a bank to call a broker, who in turn would be simultaneously taking orders from over 100 other banks in the major trading hubs, such as the city of London, for example.
Banks would have direct lines to the brokers and often had squawk boxes on both sides for quick contact. It was much less time consuming for a bank to speak to one or two brokers than it was to call around all of the other banks one by one.
However, in the late 1980s, banks decided to try and do away with broking firms due to the high amounts of commissions the brokers were charging, and with the advent of increasing technology, the first screen-based ordering FX systems hit the market.
Now, rather than the bank calling brokers, or other banks directly, they would simply place their orders onto a computer-based trading platform, where a growing number of other institutions would also place their bids and offers until trades were executed automatically by the trading platform which price matched the orders.
This was the advent of pending orders in the Forex trading arena. Thanks to this evolutionary period, retail forex traders are now able to enjoy various types of trading orders for their convenience, including the provision of capital protection orders, known as a stop loss, and orders to enter the market at a future exchange rate, which might be above or below the current one.

And so traders can use a market execution order, which is the same as the on the spot order, or right now, where a trade is executed instantly by accepting the bid or offer on a current exchange rate, as seen on a trading terminal. In this example, traders accept the best available price at the time of execution. Obviously, for this type of order, the trader needs to have instant access to his or her trading platform terminal, which is not always convenient in a 24 hour a day, five days per week market.

Traders are also able to place a stop-loss order on their trades, which will guarantee that should the exchange rate move against them to a chosen level of acceptable loss, then the trade will

automatically be stopped at the chosen exchange rate. This might be slightly greater due to price action slippage in volatile market conditions.
Traders are also able to take profit orders: this is known as a pending order and is placed onto the trading terminal and is designed to automatically close out the trade and thus bank the profit from winning trades, and this must also be set at a pre-determined exchange rate. This is extremely useful for traders who may not have the ability to be sat at their trading terminal, perhaps due to other commitments, or during overnight trading sessions. This facility can be used to close out the entire trade, or in increments. Pending orders are extremely convenient and allow traders to enter a trade, either long or short, at a future exchange rate, which would be above or below the current available exchange rate.


Example A


In the example ‘A,’ we can see the Metatrader MT4 platform, terminal. This is the EURUS pair.
On this market-leading platform, a trader will enter the volume or size of the trade. In this example we are trading with 0.10 size, which is one-tenth of a standard lot, or approximately €1 per pip in this example. We have also chosen market execution, which means that should we hit the red, sell box, or the blue, buy box, we are choosing the exchange rate, which is highlighted just above the box. So, we would be selling 1.10808 or buying 1.100811.
This example is set up as an instant sell, where the stop-loss has been set at 1.1150 and with a take profit target set at 1.0850 to the downside.

Example B


Let’s now look at the example ‘B.’ This is the same EURUSD pair. Here we have decided to use a pending order. And the order we have chosen is a buy limit order. The current exchange rate is 1.10898, as seen on the Y-axis to the right of the chart. And we have decided to place an order to buy this pair, should the exchange rate move up to 1.1100. We have also placed a stop loss at 1.1000 and a take profit at 1.1300. This trade is also good until manually canceled, or as per the expiry date which has been set at the 8th of November 2019, and at 12:21 in the afternoon.
In this example, we have increased the volume or size of the trade to 1 standard lot, which is the equivalent of €10 per pip. This would give us a profit of 200 pips, or around €2000 Euros, or approximately there or thereabouts of your designated account currency. Should the trade lose, we would be automatically stopped out at 1.100 with a potential loss of €1,000. Although the beauty of the MT4 platform is that traders can manually change their orders once executed by dragging trade order lines which appear on the screen once a trade order has been placed.
This trade represents a win-to-loss ratio of 2 to 1, which is fairly standard within the trading community.

To reverse this trade order to a sell limit, we simply highlight the buy limit box and change it to sell limit and adjust our stop loss and take profit accordingly, on the basis that we would then be expecting this pair to move lower.

Categories
Crypto Videos

How To Trade Crypto With A Small Balance – Cryptocurrency Margin Trading

What is cryptocurrency margin trading?

Margin trading is a way of trading assets where traders use funds provided by a third party. Margin accounts allow traders to trade with much bigger capital, which can, in turn, bring bigger profit. Margin trading allows its users to leverage their positions. Users get to borrow a certain multiple of their original assets, which essentially amplifies their trading results. Amplifying trading results makes margin trading interesting in low-volatility markets such as Forex markets. However, they have their place in cryptocurrency trading as well.


In traditional markets, the additional funds are provided by an investment broker, while cryptocurrency markets work by traders offering the funds. In return for their investment, they earn interest. Some cryptocurrency exchanges also provide margin funds by themselves to their users, but that is far less common.

How does margin trading work?

The first thing that has to happen in a margin trade is that the trader commits a percentage of the total order value. These funds are better known as the margin. Margin trading accounts are used to exploit the feature that is leveraged trading. Leverage is the ratio of borrowed funds compared to the margin. As an example, a $1,000 trade with 100:1 leverage requires a margin of $10.

Different trading platforms offer bigger or smaller leverage, based on their capabilities as well as the asset class they are trading. Stock markets usually trade with a 2:1 ratio, while Forex trading can have leveraged trading of up to 200:1. Cryptocurrency trading platforms offer trading of up to 100:1.
Margin trading offers its users the feature to open both long and short positions. A long position is a bet that the asset’s price will go up, while a short position is a bet that the asset’s price will fall. Trader’s assets act as collateral for the borrowed funds for the duration of the position. If the market moves against the position, brokers have the option to liquidate the position. Margin trading is riskier than regular trading due to the leverage it offers. Margin trading cryptocurrencies brings the risk even higher due to their inherent volatility.


Pros and cons of margin trading

If we talk about advantages, the most obvious one is the profit-making potential. Leveraged positions can quickly result in larger profits as a bigger relative value is traded in the position. Margin trading is also useful when diversifying, as traders have the option to open many positions with relatively insignificant capital. The last advantage is simply the ease of use. Margin traders don’t have to shift large amounts of funds to the margin account.
If we talk about the advantages, we have to talk about the disadvantages of margin trading. Leveraged positions can, if not properly managed, bankrupt an account in a matter of seconds. Overleveraged trading that goes against the position will quickly lead to the liquidation of the funds. It’s extremely important to exercise caution while trading with leverage. Any form of stop-loss is also advised.

Margin funding

Trading is a task that requires a lot of research, knowledge, and intuition. Many people do not have the skillset or the risk tolerance to engage in margin trading. However, they still want to make a profit off of the whole margin trading idea. The way for them to profit from leverage trading is margin funding. Some trading platforms and cryptocurrency exchanges offer an option for users to invest their money to fund the margin trades of other users. This process has a set interest rate, which is quite low. However, so is the risk associated with the investment.


Conclusion

Margin trading is a useful tool for risk-averse traders that want to amplify their profit-making potential. If used properly, this method of trading can have an amazing effect on the profit size. On top of that, users interested in diversifying should also look into margin trading.
However, this method of trading amplifies potential losses as well. The risk it inherently brings is not for everyone.

Categories
Forex Videos

Mastering Price Action Part 2 – Becoming A Full Time Forex Trader


Mastering Price Action

Price action is the fluctuation in currency exchange rates, which are constantly moving up or down, relative to the exchange rate, and where these movements form trends, which are typically called ‘bullish,’ where price action moves in an upwards direction, or bearish when price action moves in a downward direction.
However, currency exchange rates do not move in a straight continuous line. Therefore, Traders use technical analysis tools in order to decipher the direction of price action on their charts.
By carefully selecting technical analysis tools Traders are able to drill down further into the fluctuations of exchange rates and where it becomes much easier to identify when a particular price action move is about to stall and reverse direction.

Example A

Let’s look at the example ‘A.’ This is a 1-hour chart of the EURUSD pair. Always read your charts from left to right, because they tell a story of where price action has been, and where it is likely to go in the future. In the chart, we are using Japanese candlesticks, and where are the green candlesticks denote bullish price action, and where red candlesticks show a bearish price action.

Example B

Now let’s look at the example ‘B,’ which is the same 1-hour chart of the EURUSD pair. And like other professional technical analysis traders, we have added a few lines which highlight some interesting areas on the chart, and which would have led to several trading opportunities.
First of all, we note a strong bullish move at position 1, where we see predominantly bullish candlesticks. However, this price action trend to the upside fades, and where we have drawn in a ceiling, or level of resistance marked ‘A.’ The bulls have essentially thrown in the towel. Some traders would be taking a profit at this stage, and price action begins to fall lower. This is a period of consolidation. But it is not long until the bulls regain control again, and an overall trend forms to the upside, as per the arrow at position 2, until price reaches our resistance line marked ‘B.’ Importantly, this line is the 1.10 exchange rate, a key level.

Incidentally, note that our resistance A-line causes some confusion for traders until price action reaches the key 1.10 exchange rate. While some see the resistance continuing to hold, it eventually becomes the beginning of support line ‘B.’
The overall move from the beginning of position 1 to the top of position 2, which is our key 1.10 exchange rate, is around 100 pips, a fairly substantial move. Again, bull traders will be looking to cash in and take a profit at this level while assuming that there will be limit orders in place here to go short at this level and therefore drive the price action lower. And that is exactly what happens as per arrow number 3, where sellers take a hold, and price action moves lower to our secondary support level marked support ‘B.’
Price action then begins to fluctuate between our support level B, and our resistance level ‘B.’ During this phase, technical Traders will be wondering if price action can breach the key

resistance level at 1:10, and where that might become an area of support at which point bulls would be expected to come in and drive the market to the next level of resistance.
After three consecutive attempts to breach the key 1.10 resistance level, bull traders at position 5 fail to reach the 1.10 level and they begin to fear that price will again be rejected at the 110 level, and price action pulls back to support level B, which is then breached, until price action finally finds support at level ‘A’.

During the time frame of this chart, from the 2nd to the 9th of October, 2019, we are presented with clear buying and selling opportunities with the EURUSD pair, simply by the use of Japanese candlesticks and a few trend lines that we have added to our chart to identify support and resistance levels. We can see sideways price action where traders are uncertain if there will be a complete reversal in the upward trend, and there are clear lines of interest, such as the 1.10 exchange rate.

And so, support lines become lines of resistance, and these fluctuate throughout the day depending on the level of liquidity and also market sentiment and other factors based on fundamentals of the relevant currencies within the pair.

Simply by understanding that these lines exist and where traders are driving the market too, and fears of where reversals lurk will give you a better understanding of mastering price action.

Categories
Crypto Videos

Everything You Need To Know About Cryptocurrency Exchanges


What are cryptocurrency exchanges?

Cryptocurrency exchanges are online platforms where users can exchange one cryptocurrency for another. The exchange rates are based on the market value of the given assets at that moment in time. Most cryptocurrency exchanges allow for crypto-to-crypto exchange, while some even allow trading fiat for cryptocurrency and the other way around. An important thing to notice is that cryptocurrency exchanges are not cryptocurrency wallets or wallet brokerages. Cryptocurrency wallets and wallet brokerages allow their users to buy and sell a small range of popular cryptocurrencies.


Types of cryptocurrency exchanges

There are four main types of cryptocurrency exchanges:

  • Traditional cryptocurrency exchanges
  • Cryptocurrency brokers
  • Direct trading platforms
  • Cryptocurrency funds

Traditional Cryptocurrency Exchanges 

Traditional cryptocurrency exchanges are all exchanges that act like the traditional stock exchanges. Users can buy and sell their assets based on supply and demand, which creates market prices. The exchange acts as a middleman in the process and charges trading fees for transacting. While most of these exchanges only exchange cryptocurrency, some allow users to trade fiat currencies for cryptocurrencies.

These exchanges can be centralized and decentralized. Centralized exchanges are run by third parties and hold their user’s keys. They act as support and problem solvers. Decentralized Exchanges (DEXs) operate by trading that is based on smart contracts. There are no centralized third parties, and the wallet keys remain in the hands of its users. While decentralized exchanges sound like a better option, they are often slow and do not support fiat trading.


Cryptocurrency Brokers

Cryptocurrency brokers are website-based exchanges that allow its users to buy and sell cryptocurrencies at a price set by the broker rather than the market. This price usually has a premium on the market price. The exchange is between the buyer or seller and the broker acting as the other party. Coinbase and Shapeshift are good examples of cryptocurrency brokers. For the slightly higher price, brokers offer ease of use and convenience in general.


Direct Trading Platforms 

Direct trading platforms offer peer-to-peer trading between buyers and sellers, and they don’t use a fixed market price. They let sellers dictate their exchange rate while buyers find sellers they like and perform an over-the-counter exchange. Many decentralized exchanges work this way, but most of them still fall under the traditional exchange category. LocalBitcoin.com is a great example of a centralized peer-to-peer exchange that allows fiat-to-crypto exchange.

Cryptocurrency Funds 

Cryptocurrency funds are professionally managed cryptocurrency asset pools. These funds allow users to buy and hold cryptocurrency via their services. GBTC is a prime example of cryptocurrency funds. Cryptocurrency funds let its users invest in cryptocurrency without ever having to purchase or store it by themselves. On the other hand, the bought cryptocurrencies are only there as an investment and cannot be used.

Conclusion

There are many forms of cryptocurrency exchanges, but they all try to achieve the same goal: customer satisfaction. While some focus on the ease of use, others focus on the options that they provide. Crypto-trading beginners will most likely want to use traditional exchanges or brokers.

Categories
Crypto Videos

What Is Proof Of Stake & Will It Make Ethereum Better Than Bitcoin


What is proof of stake, and how does it work?

The proof of stake system is a consensus protocol that came as a response to the shortcomings of proof of work. It is attracting a lot of attention as of late, with Ethereum switching its consensus protocol from proof of work to proof of stake. Proof of stake is nothing more than an alternative way to verify transactions on a blockchain.

How does it all work?

Proof of work and proof of stake works very differently, even though they are trying to do the same thing. The proof of work system has its users validate transactions and create new blocks by solving a “puzzle,” which requires some computational power. On the other hand, a proof of stake consensus algorithm requires the user to show ownership of their funds to validate transactions.


When it comes to proof of stake system, the creator of a new block is picked in a pseudo-random way. The block creator has more chance depending on the size of their “stake.” In the proof of stake system, blocks considered forged or minted rather than mined. Nodes who validate transactions and create new blocks with this system are not miners, but rather forgers.
To validate transactions and create blocks, a forger must stake their funds. Their holdings are being held in an escrow account, which acts as collateral for any potential fraud attempts. If a forger tries to validate a fraudulent transaction, they lose both their staked holdings and their rights to participate in the process. This way, the proof of stake protocol incentivizes forgers to validate only non-fraudulent transactions.
An important thing to note is that most proof of stake projects already created and distributed their digital currency units already. When this is the case, the forgers receive transaction fees instead of new cryptocurrency as rewards. This is considered true only if the cryptocurrency cannot inflate itself by minting more and more coins.

Block selection methods

Proof of stake consensus algorithm needs a way to select future forgers. There are two main ways to do so:

Selecting a user randomly
Selecting a user based on their coin age.

Selecting a forger only by the size of their account balance would go against the whole premise of cryptocurrencies, and is a bad idea. That way, people with more funds would get richer, while the ones with fewer funds on their account would be hindered and have less control over block creation. To counter this problem, these two methods have come up as the most popular and reasonable.


Randomized block selection

The randomized block selection method is just what it sounds. The method seeks a user that offers the lowest hash value regarding the size of its stake. As all stake sizes are public, each node can predict (with high probability) whether they will be selected to forge the next block.

Coin age-based selection

This system is a bit different than the randomized block selection one. It selects the next forger based on the ‘coin age’ of the node’s stake. Coin age is a multiplier of the number of days the funds have been staked and the number of coins that are being staked. Coins must be staked for 30 days before they can compete for block creation. Users with larger stakes have an advantage, but so do users who have staked for a longer time. Once a user forges a block, their coin age is reset to zero. After a node forges a block, they must wait at least 30 days before creating another block. This mechanism promotes decentralized forging while maintaining a power balance between large stake forgers and lower stake forgers.
Advantages of proof of stake
Proof of stake is a much more environmentally friendly and efficient consensus algorithm than the proof of work method. The electricity and hardware costs are much lower due to how the method is made.

Unlike proof of work system where a 51% attack is performed by obtaining the majority of hash rate, proof of stake attackers would be required to obtain 51% of the cryptocurrency to perform the attack. Even though performing a 51% attack is possible, forgers with the majority of funds would not risk their money to perform such an attack. If the cryptocurrency price drops due to the attack, their holding value would also drop.

Conclusion

Proof of stake is a consensus algorithm that is created as an answer to the disadvantages of proof of work. It offers a unique way of validating transactions and creating blocks, and it is gaining popularity. With that being said, the Proof of Stake algorithm is not better than Proof of Work on all fronts, and each project should consider both methods before picking the one they like.

Categories
Forex Videos

The Most Powerful Forex Technique – Trading Breakouts

Trading Breakouts


In the area of financial trading and in particular within the Forex market, the movement of a currency pair, or price action, does one of three things: it moves up, it moves down, or it moves sideways. Within these types of moves, especially when the price action is moving up and down, we will find trends forming. We also find pullbacks, or price reversals, continuations, slowdowns in volatility, and pauses and hesitations, which are also known as periods of consolidation. Typically at these times you might see very small movements, where price moves sideways in a narrow range. In other words, currency exchange rates in the Forex market do not travel in a continuous straight line. And this is what makes trading so difficult to predict.
Each time you pull the trigger and execute a trade, and especially as a retail trader, you are up against institutional traders, including sovereign wealth funds, hedge funds, governments and their central banks and high net worth individuals, all of whom might well have a different price move expectation than yourself and be trading in the opposite direction, i.e, against you!

This is why it is so important to learn the peculiarities, twists, and turns, the dynamics and unpredictability of the Forex market. And the best way to do this is to study your charts and to study the markets and to practice on a demo account. In other words, learn the ropes, find the best time of day to trade that suits your trading style and methodology, try to determine when the aforementioned big guns are all likely to be singing from the same hymn sheet, in other words when the majority are trading in the same direction.

One of the most popular and rewarding styles of trading the Forex market is identifying breakouts. This type of trading relates to technical analysis only. That Is not to say that we can take our eyes off of the fundamentals, because these events can be triggered by economic data releases. However, after periods of consolidation, where price action becomes narrow and congested, and show a lack of direction, traders look for potential breakouts to test new levels, and these events regularly occur purely on technical analysis, alone.
Because breakouts are so popular, price action can be extremely volatile at these times. It’s almost as if everybody pounces to trade at the same time and either buys or sells a particular currency pair because their charts tell them so. This tends to cause strong moves, as price breaks out of bottlenecks and where quite often those entities who are trading counter to the breakout may be stopped out of their trades. This is often because breakouts regularly happen at, or close to, round numbers. At these levels, traders tend to place their stop losses or limit orders to buy or sell. This can often result in a spoof breakout, where price action breaks out of a period of consolidation only to reverse quickly and start a trend in the opposite direction. And therefore, some breakouts can be short-lived, and which are also known as false breakouts.

Example A

Let’s turn our attention to example ‘A.’ This is a 1-hour chart of the EURUSD pair. Always read your charts from left to right, because it tells you a story of where price action has been, and where it is possibly going to go in the future.


In this example, we can see that we have drawn a horizontal line at position ‘A.’ This has become an area of support; it is effectively a floor. Although we have a high, as marked at the position marked 1, and where price action moves back to our floor, the second move higher at position 2 becomes a lower high than at position 1. This tells us that the market is running out of momentum to the upside, and where indeed price action returns to the floor after this push higher falters. And then, price action forms a new lower high at position 3. This now tells us that bull traders have effectively thrown the towel in, and then, when price again returns to the floor, we see a breakout, as marked by the X, which punches through the floor, or support level. Therefore, this would have been the breakout candlestick that traders were looking for In order to go short on this pair.

Price action continues to move to the downside. However, we now see a new floor at position C, and a new ceiling at position B. And where price action consolidates in a sideways trading fashion.
In the example ‘B,’ we have moved the charts along to the next session. Price action continued to trend sideways between the ceiling marked ‘B’ and the floor marked ‘C’ until it becomes a second breakout occurs and where price action punches through to a new floor marked ‘D’ and where the previous floor, ‘C’ has now become a ceiling.

Again, price action returns to a consolidation or sideways momentum, until, eventually, at candlestick marked X – a series of strong bearish candlesticks form another breakout to the downside. Had we entered a short trade at the first breakout to the downside in example A, we could have realised a profit of over 180 pips.
An important lesson to learn from this section is that breakouts often occur when price action punches through floors and ceilings, and which are also known as levels of support, being the floor, and resistance being the ceiling.
So keep an eye out for possible breakouts and especially at key technical levels when support and resistance levels begin to fail. They will be far stronger in momentum after extended periods of consolidation.

Categories
Forex Videos

Trading Price Momentum – Becoming A Forex Trader

Trading Price Momentum

One of the biggest keys to understanding how trading in the forex market works is to know how momentum affects price action. Traders need to gauge the market extremely carefully as price action can turn in direction, in a split second, based on a momentum occurrence, such as an economic data release, market rumours, and economic news commentary. It is essential that traders have contingency plans in place in the event of huge momentum moves. This could be by implementing stop losses, limit orders, hedging strategies, but importantly, being aware of market conditions and potential events that might cause huge liquidity and momentum shifts in price action.

Causes of trading price momentum are such things as government elections, war, OPEC meetings, and announcements pertaining to oil prices, commodity forecasts, government policy, currency devaluations, exchange rate pricing, debt defaults, market collapse, the US Federal Reserve, political referendums and economic data releases. During these events we will usually find a great deal of speculation due to market sentiment, risk-on and risk-off events, institutional investments including position-taking, and stop-loss activity.

The big players cause the big moves because of their size and liquidity, and they typically include hedge funds, sovereign wealth funds, governments, and their central banks. When these guys come to the market, it is not unusual for them to trade in sizes of over 100,000 US dollars per pip in the Forex market. This type of size causes market makers – that’s those who provide the bids and offers – to very quickly adjust their liquidity support in the market, which further adds to the momentum.

Example A


Let’s take a look at the example ‘A,’ this is a 1-hour chart of the USDJPY pair covering the last couple of days. At position 1, we note a huge spike higher in the pair with the 1-hour candlestick breaching the Bollinger bands, whilst spiking through an area of resistance caused by the sideways trading of this pair, and which reaches across, to the left of our chart. Even though the Federal Reserve cut their short-term interest rate by 25 basis points – the third cut this year – which caused this market reaction.
One might have thought that the US dollar would have lost ground against the Japanese Yen because of a lowering in interest rates, which, of course, is less than appealing to investors holding dollars. However, traders took into account that the subsequent forward guidance speech given by Federal Reserve Chairman, Powell, gave no indication that further interest rate cuts were imminent this year. Also, Federal Reserve governors voted 8 to 2 in favour of the cut. This shows that there is some conflict within the Federal Reserve regarding monetary policy.
Indeed the next hourly candlestick shows a pullback in this pair, thus negating the 30 or so pip move to the upside. This spike would have caused many institutions to suffer from a stop loss as price action moved above the key 109.00 level, while traders tried to decipher the implications of the rate cut, and what messages could be gained from Fed Powell’s speech.

Now let’s turn our attention to position 2, we can see a strong bearish candlestick just below position 2, which was a result of a news release stating that a Chinese official reported that the long-awaited part 1 of the Chinese & US trade agreement might not be signed next month as per market expectations. The Chinese official also stated that there was a risk that the deal may collapse due to what they said was a divisive attitude to the agreement by President Donald Trump.

These are just two examples of how price momentum can cause huge amounts of volume and volatility, and whereby in a relatively short time frame, we can see swings in the price action of over 100 pips in this example.

Example B


Let’s look at example B. This is a one-hour chart of the US DOW Jones 30. In position 1, we can see a surge in the price action to the upside after the announcement of the 25 basis points rate cut. This is important because US companies can borrow money more cheaply with lower interest rates. We subsequently see a slight pullback of price action inside the Bollinger bands and a consolidation to position 2. The bearish candlestick at this point takes out most of the previous day’s bull trend as soon as the rumour from the Chinese official that the US-China trade deal could collapse. The upshot of these two events was a 400 point swing in price action!
Here at Forex.Academy, we always advise traders to be aware of potential momentum moves in price action. This can only be achieved by having a good overall market awareness, and learning the art of expecting the unexpected, and by having contingency plans in place in the event of such events.

Categories
Crypto Videos

Will The Next Bitcoin Halving Send The Price Into Space? #Moon

https://youtu.be/obpfVVZY02M

What is Bitcoin halving?

Before explaining Bitcoin halving, we need to know how Bitcoin mining works. Each time a block is verified by submitting a correct answer to the equation, new Bitcoins come as a reward. Satoshi Nakamoto set up two major rules for the proof of work protocol:

Bitcoin’s maximum supply is finite. It is limited to 21 million and cannot be changed.

The number of Bitcoins generated per block and distributed as a mining reward halves (decreases by 50%) every 210,000 blocks.


How long until Bitcoin rewards halve?

As one block is found every 10 minutes on average, 210,000 blocks would be found in approximately four years. The mining reward for solving the block puzzle will halve by 50% every four years. Bitcoin’s first mined block rewarded the miner 50 Bitcoin. Two halvings after, and we are in the present, where each block grants 12.5 Bitcoin. Next, halving will reduce that amount to 6.25 Bitcoin and so forth until there are no more Bitcoin to be mined. When there are no more Bitcoin to be mined, miners will be compensated through mining fees.

Why is halving created?

The explanation of the creation of halving events lies in the law of supply and demand. If coins are mined too fast, the supply will rise too fast, and there will be a lot more Bitcoin in circulation. This will, in turn, devalue the currency.
Vitalik Buterin, the lead developer of the Ethereum project, explained the need for halving to occur is to keep inflation under control. Additionally, he explained that “One of the major faults of traditional fiat currencies controlled by central banks is that the banks can print as much of the currency as they want, and if they print too much, the laws of supply and demand ensure that the value of the currency starts dropping quickly.”


When Will the Next Halving Occur?

As previously mentioned, each block takes 10 minutes to generate on average. Taking that into consideration, we can estimate the next block halving event to occur somewhere around June 2020. Many websites track block generation and estimate when the reward halving will happen exactly. They even have countdowns that let people know the date and time of the estimation.
One important thing to mention is that some people noticed that each block takes only 9 minutes and 20 seconds on average to generate, instead of the presumed 10.

How Will the Bitcoin Halving Affect Bitcoin’s Price?

As block halving essentially reduces the further supply of Bitcoin, many people will ask whether the price will be affected by this event. Sadly (or fortunately), no one knows. The 2016’s halving event had no major effects on the price at that time. A week after the event, Bitcoin went from $650 to $675.
However, even if there are no apparent signs of price change, economic principles of supply and demand still work. Either the price will increase after the halving, or the current price already includes the speculation of what’s about to happen.

Conclusion

Bitcoin is a scarce asset by design. The specific rules, such as a limited supply of 21 million Bitcoin as well as an inflation reduction “tool,” which is the halving event, make sure that Bitcoin becomes even more valuable over time. The Bitcoin halving event should not be considered as a date at which the price of Bitcoin skyrockets, but rather a tool which keeps inflation in check. This is one of the main attributes of Bitcoin and one that separates it from fiat currencies, which are inflationary by nature.

Categories
Crypto Videos

What Is Proof Of Work? – Cryptocurrency Mining


What is proof of work cryptocurrency mining?

Cryptocurrency mining is a process that is used to verify cryptocurrency transactions and add them to the blockchain ledger. Cryptocurrency mining has been a topic of discussion ever since Bitcoin started getting popular. On top of that, the mining itself has grown exponentially in the past couple of years.

This article will try to explain how proof of work mining works as well as its pros and cons. Proof of work mining in-depth. Proof-of-Work (PoW) is the original consensus algorithm in a blockchain network and is the consensus algorithm that Bitcoin uses. Proof of work is used to confirm transactions as well as create new blocks to the blockchain. By using PoW, miners compete against each other to complete transactions on the network, and the first miner to complete it gets the block reward.

The main working principle of Proof of Work is a complicated algorithm that requires a lot of computation power to use. Transactions get bundled in blocks that require verification. The verification process is nothing but miners competing to solve a mathematical puzzle before the rest of the world. Whoever solves the puzzle first, gets rewarded. The answer to the PoW puzzle is called hash.

The more the network is growing, the harder it is to solve a puzzle first and submit the hash to the consensus algorithm. The algorithms need more and more hash power to solve as speed is a major factor in mining. This becomes a problem because harder mathematical equations are good to prevent DoS attacks and spam but also slow down the puzzle-solving itself, therefore slowing down the network.

This problem is solved by adjustable mining difficulty. How complex a puzzle solely depends on the number of users, current mining power, as well as the network load. In Bitcoin, network difficulty is adjusted every two weeks.
Where is proof of work mining used?
Proof of work is used in a lot of cryptocurrencies, with the most famous one being Bitcoin. Bitcoin was the project that laid the foundation for this type of consensus.
Besides Bitcoin, another large project with PoW is Ethereum. Given that almost three-quarters of all cryptocurrency projects are tokens made on the Ethereum platform, it’s safe to say that the majority of cryptocurrencies use the PoW consensus model.

Why use a Proof of Work consensus algorithm?

The main benefits of the proof of work consensus algorithm are:

The anti-DoS attacks defense
Low impact of stake on mining possibilities.
Anti-DoS attacks defense – PoW imposes some limits on performing certain actions in the network. These actions require a lot of computational power as well as time. This brings the costs of the attack too high, which renders attacks of this kind useless.

Mining possibilities – The PoW algorithm does not care about how much money a wallet has to mine. All that matters is the amount of computational power and how fast a node can solve the puzzle. This prevents whales from being in charge of making decisions in the name of the network just because they hold a lot of funds.

Proof of work disadvantages

The Proof of work consensus algorithm also has several disadvantages. The main disadvantages are:
Huge expenditures
“Uselessness” of computations
51 percent attack.
Huge expenditures – Mining currently requires highly specialized computer hardware to achieve the effectiveness of solving complicated equations. This specialized mining hardware consumes large amounts of power to run, and people are starting to question if the power spent is justified.
“Uselessness” of computations – Besides using a lot of power (mostly electricity), miners also use quite a bit of computational power that could maybe be used elsewhere. Even though this computational power guarantees network security, it cannot be applied anywhere else.
51 percent attack – Small proof of work algorithms are extremely vulnerable to this kind of attack, while Bitcoin may be large enough to be immune to it. 51 percent attack, also called a majority attack, is when a user or a group of users control the majority of mining power, which gives them the power to control most network events. These attacks are considered obsolete as they are easily spotted by the public, and the new blockchains created in the process are rejected.

Mining pools

As it has been previously mentioned, the block reward is given to the miner who solves the mathematical equation first. However, the chances of finding a solution to this problem as a single miner are now slim to none. This is why miners are joining their computational power in hopes of solving the puzzle as a unit and sharing the reward fairly. This is how mining pools are created. These pools are, as the word implies, pooling of resources by miners to split the reward equally among everyone in the pool according to the amount of work they contributed.

Categories
Forex Videos

Trade Like A Forex Beast – Chart Patterns & Bollinger Bands

Chart Patterns

Chart patterns, or technical analysis, is how traders determine possible future price action direction by incorporating ‘technical’ tools onto their PC screens. The resulting patterns they see on their screens, including the current exchange rate of a Forex pair, while factoring in volume, time of day, recent and future economic data releases via fundamental analysis, provide an effective way of gauging future price action direction.

Forex trading only took off in the retail sector in the early 2000s. Before that, and largely thanks to the advent of the internet, technical trading was almost unheard of in the institutional Forex market. Today, retail Forex traders take for granted the myriad of available technical trading platforms such as the; Metatrader MT4 platform, Trade Station, Currenex, Ctrader, etc. These incredible platforms, which are mostly free to retail Traders, would have been an institutional traders dream come true in the 1970s, 80s, and 90s. Back then, traders, technical analysis depended on plotting exchange rates into a notebook or on a spreadsheet. However, time and technology have moved on, and the internet has allowed liquidity to increase exponentially year on year. People can now make a reliable living by trading in favor of recurring patterns that they see on their computer screens. It is quite amazing that many economies around the world are often affected, both negatively and positively, by exchange rate fluctuations because of patterns on traders’ screens which tell them to buy or sell.

Example A

In the example ‘A,’ we can see a 1-hour chart of the GBPUSD pair. In the chart, we are only using Japanese candlesticks. We advise that you always read a chart from left to right because it tells a story. Traders typically draw their own trendlines, and that’s what we have done here. In this diagram at section ‘A,’ we can see that there has been a bearish trend. This was followed at section B’ buy a pull-back or consolidation and then continuation to the downside. This produced an upside-down V formation, which traders look for when considering a possible continuation in the downward trend. However, price stalls in section ‘C,’ which is littered with small candlesticks. Price action then slips into a sidewards momentum. These smaller candlesticks, some of which open and close at the same exchange rate, tells traders that there is a lack of liquidity in the market during this phase. Section ‘D’ is a continuation to the downside, and where price action has gone through the support line, we drew in at section ‘C.’ The continuation is short-lived, and we had a bullish pullback, again with the v-shape formation clearly evident. However, the bearish engulfing candlestick marked ‘E’ takes out all of the candlesticks in Section ‘D’ telling traders that a large amount of liquidity has gone through at this point and that the sellers are in command. Subsequently, we see price action continue to fall.

Example B


In example ‘B’ we have added Bollinger bands to our chart. Bollinger bands were developed by John Bollinger, whose book on the subject, “Bollinger on Bollinger Bands” (2001), was transcribed into over 11 languages and is widely used in the trading community. Bollinger bands plot deviations from the exchange rate onto a chart that materialize as two lines, one either side of the and outside of price action. The theory is that over 90% of price action will remain within the bands. Therefore, traders look for certain aspects to occur during the formation of the bands to help them with their trading decisions.
During the sell-off at section ‘A’ we can see that the bands are widening while moving in a downward direction. However, as volatility gains, price moves outside of the bands. But we can see that price action moves back inside the Bollinger bands to begin the V formation at section B. During the consolidation period at section ‘C,’ we can see that the bands move together to form a narrow tunnel. Typically traders will expect larger liquidity entering the market during times of bands expansion from a narrow contraction, and during the bottom of section ‘D,’ we see an increase in liquidity which pushes through the Bollinger bands, only for the bulls to buy the pair back inside. Subsequently, we see that the bearish engulfing candlestick marked ‘E’ pushes through the Bollinger bands to the downside, before buyers bring the pair back inside again. Price action then continues to the downside, while staying inside the Bollinger bands, until the bottom right-hand side of our screenshot, where we can see some tails piercing through the Bollinger bands, only for price action to pull the candlesticks back inside.

In diagram ‘D,’ we have added another favorite tool as used by technical traders: a moving average. The blue line is a 14 period, simple, moving average. It calculates the highest point and the lowest point of each of the previous 14 candlesticks and plots the average measurements on the screen in the form of a line. In our example we can see that once price action falls below our moving average at section ‘A’, it begins to form an invisible area of resistance, where price action moves up to it on a number of occasions at sections ‘B’, ‘C’, ‘D’ and ‘E’ before price action continues to the downside. Trainers typically use several moving averages on their screens in order to determine price direction, consolidation, continuation, and price reversal areas.

There are hundreds of technical analysis tools available to Forex traders. However, the more you have on your screen is not necessarily more of an advantage! In fact, too many analysis tools may hamper your trading by clouding your judgment. The best technical tool will always be the price action itself, which is a leading indicator. So, here at Forex.Academy, we recommend that you do not overload your screens with technical analysis tools. Keep things as simple as possible when deciding which technical tools to implement in your trading style and methodology.


Categories
Crypto Videos

What Is A STO & How Is It Different From An ICO?


What is an STO?

STO is an acronym that stands for security token offering. Crowdfunding in cryptocurrencies started with ICOs, while STOs came as a necessity. Similar to an ICO, an investor exchanges their funds and gets a token in return. However, there are differences between ICOs and STOs. Unlike an ICO, a security token represents an investment contract in an underlying investment asset, such as stocks, bonds, funds, real estate investment trusts (REIT), or even other cryptocurrencies.

Any financial instrument that bears some type of monetary value is considered a security. This means that, simply put, securities are investment products that are backed by real-world assets. A security token, therefore, represents the ownership information of the aforementioned investment product, rather than having inherent value by itself. Investing in traditional assets can now be improved by recording the investments on the blockchain rather than being written on a document.
As many people try to describe ICOs and STOs by comparing them to the IPOs, we will do the same. STOs are a hybrid between ICOs and the more traditional IPOs because of their overlap with both methods of investment fundraising.

STO vs. ICO

These two offerings are quite the same, but the token characteristics are different. STOs are asset-backed and are required to comply with regulatory governance. Most ICOs, on the other hand, have their tokens declared as a utility token. Tokens utility gives users access to the native platform or their decentralized applications. The purpose of the coin, therefore, is its utility and not its investment properties.
Due to not having to comply with any regulation whatsoever, the barrier to entry for companies to launch an ICO is much lower. Launching an STO can be quite a difficult task, as the intention is to offer an investment contract under securities law. Therefore, the platforms launching the STO have to have their project comply with the regulators from day one.

STO vs. IPO

STOs and IPOs have quite a similar process (once again), but STOs issue tokens on a blockchain while IPOs issue share certificates on traditional markets. Although both IPOs and STOs are regulated offerings, IPOs happen only when private companies that want to go public. Through the IPO process, they raise funds by issuing their company shares to accredited investors.

When it comes to STOs, tokens that represent a share of an underlying asset are issued on the blockchain to accredited investors. These assets can very well be shares of a company, but they can also be any other form of asset, such as a share in the ownership of a property, fine art, investment funds, etc.

STOs are also more cost-effective than IPOs, as they do not have to deal with brokerages and investment banker fees. IPOs, however, have to. STOs would still need to pay lawyers and advisors, but they wouldn’t have to pay people for access to the market. The administration that happens after the STOs fund-raising finishes is also more cost-effective than those of an IPO.

STO regulation

As with ICOs, STO regulation very much depends on individual jurisdictions. The United States Securities and Exchange Commission (SEC) is surely the biggest and most vocal regulator on the issue of how a security token is defined. They are also one of the key factors in deciding whether or not certain tokens are utility or security tokens.

ICOs will be considered a security if they fall under the definition of an investment contract, the SEC stated. This definition comes from the Howey test, which states that:

“An investment contract is (1) an investment of money (2) in a common enterprise (3) with a reasonable expectation of profits (4) to be derived from the entrepreneurial or managerial efforts of others.”

Tokens that pass this test by qualifying for all of the attributes are security tokens. If they fail the test, they are utility tokens.

The world’s outlook on STOs

The world has not agreed on its stance on STOs yet. Many countries have even banned STOs, while other countries are not yet clear on how to regulate STOs.
As an example, Thailand’s Securities and Exchange Commission concluded that Thai-related STOs launched in an international market break the law. However, in an article by the Bangkok Post, deputy secretary of the Thai SEC indicated that the commission has not yet decided how (and if) to regulate STOs.

Conclusion

Tokenization of securities is certainly a step forward in terms of technological progress. However, the road will not be a smooth one. Countries will have to decide on how to regulate STOs for them to reach their maximum potential.

Categories
Forex Videos

Predicting The Future Of The Forex Market With These Candlestick Formations

Candlestick formations – The display of price information

There are many different ways that a trader can have access to the price of an asset. In the Forex market, the most common ways that traders monitor the movements of exchange rates are by using line graphs, bar charts, Renko charts, tick or ticker tape charts. And one of the most popular ways of deciphering price movements is the Japanese candlestick.

Let’s look at some examples of exchange rate price action via three commonly used technical analysis tools.

Example ‘A’ is a basic line graph of the daily time frame of the GBPUSD pair, as denoted in the top left-hand corner of our chart. Time frames are shown here too. At the bottom of the chart along a horizontal axis, we can see time and the date, and the exchange rate of this pair is shown in the vertical axis on the right-hand side of the chart.

The line graph converts the price action of a currency pair onto a continuous line on a chart. As you would expect, the line goes up and down and sideways. However, just by looking at the line graph alone, it would appear to be almost impossible to try and ascertain future movements by this tool.

Example ‘B’ is the same daily time frame of the GBPUSD pair, but this time we are looking at a bar chart. Each bar opens at the beginning of the given timeframe, and in this case, opens and closes every 24 hours. Each bar consists of three lines: A vertical line to the left of the horizontal line, which denotes the opening of the bar; the vertical line which tells the trader the up-and-down movement of price action during this time frame; and another horizontal line to the right of the vertical which tells the trader where price action finished.

Let’s now turn our attention to example ‘C’: The Japanese candlestick. Each candlestick opens and closes along a vertical line. Again, this is the daily time frame of the GBPUSD pair. The candlestick offers a much greater visual representation of the exchange rate and therefore presents many opportunities to a trader with regard to potential future trends. The Japanese candlestick is the most widely used technical tool used by traders across the globe.

Japanese candlesticks were invented in the early 15th century by the Japanese government of the time. They were used to record price movements on Japan’s rice exchange. At this time, rice was not only the primary dietary staple, but it was also a unit of exchange.

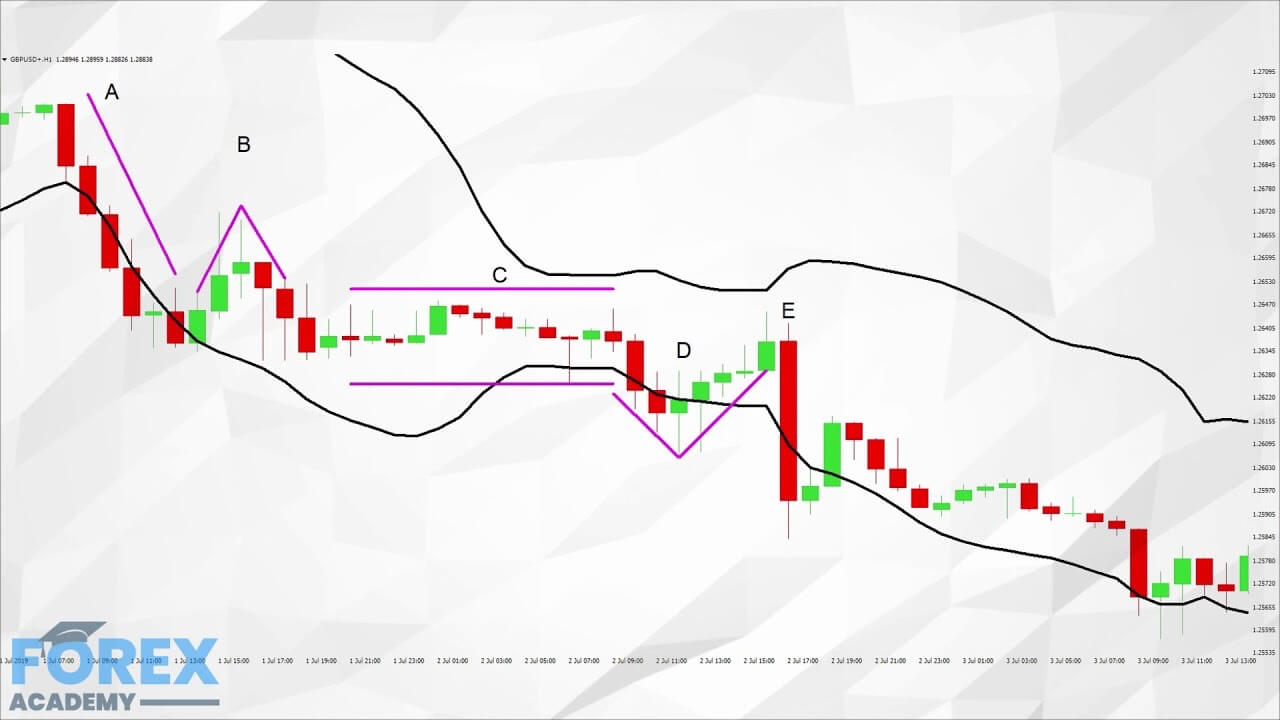
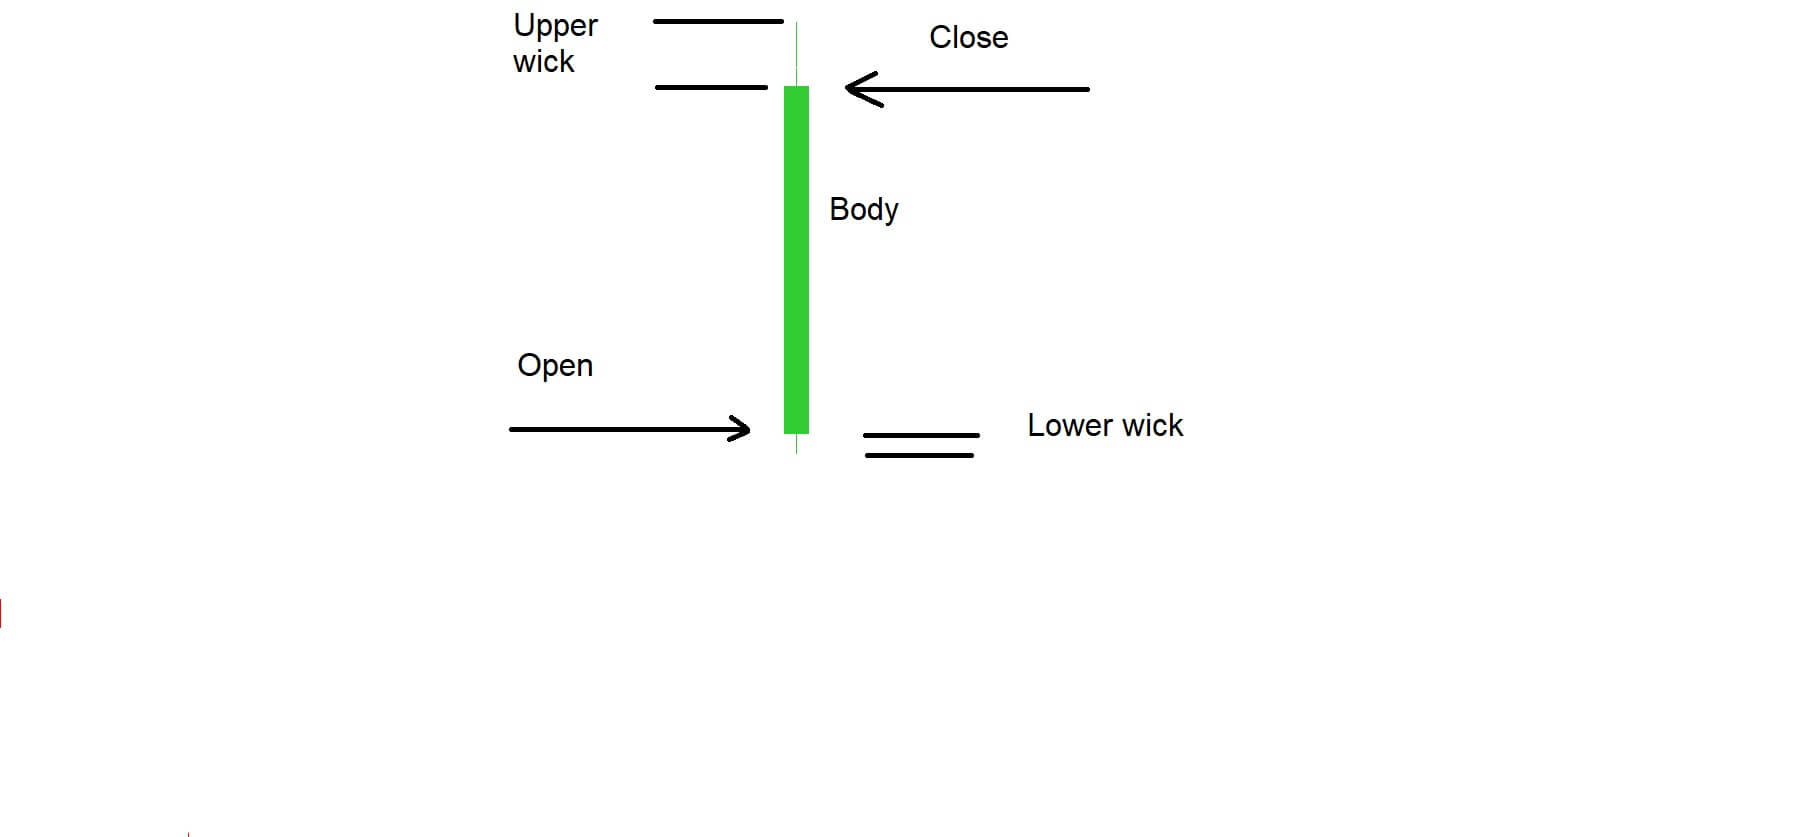
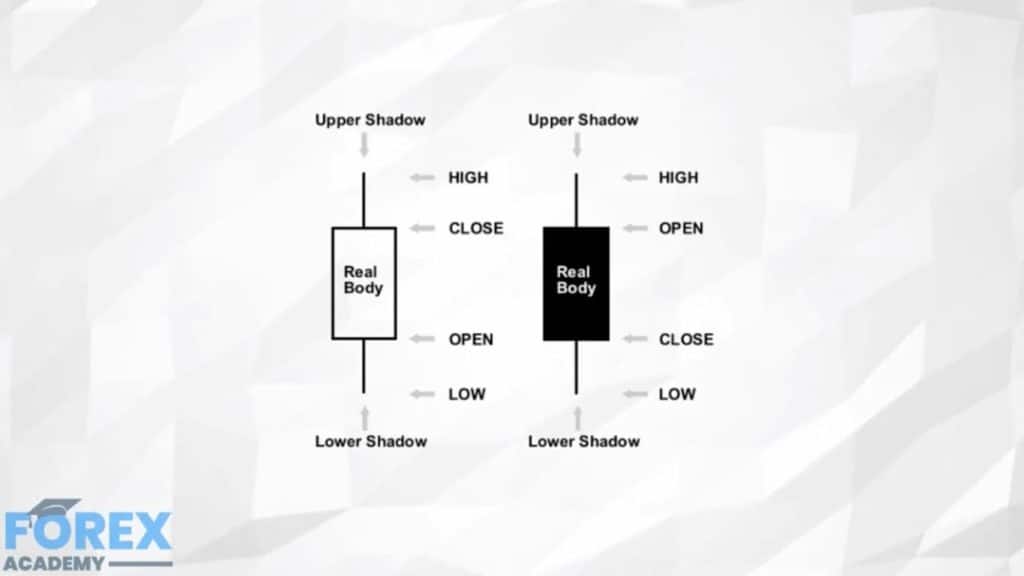
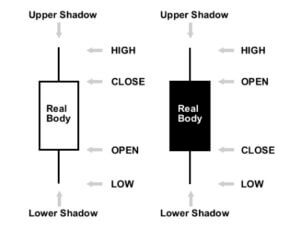
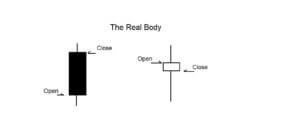
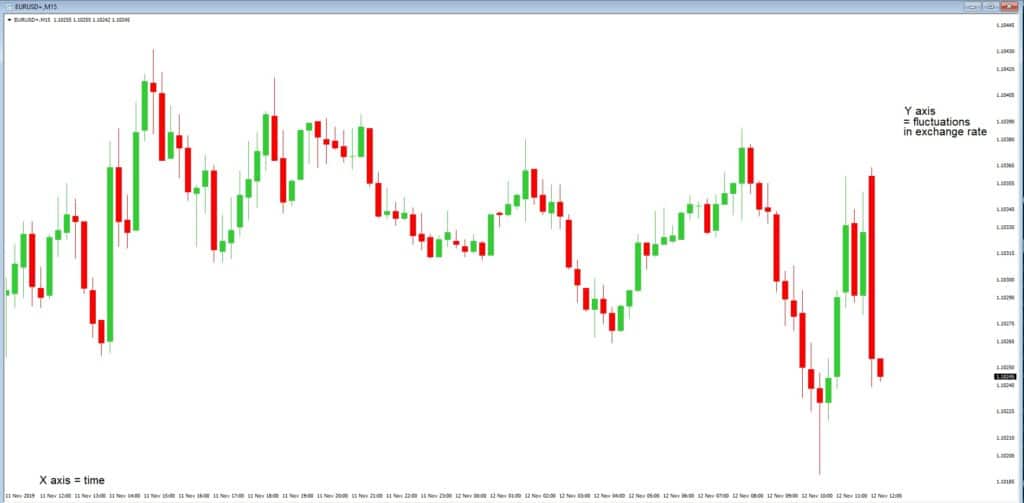
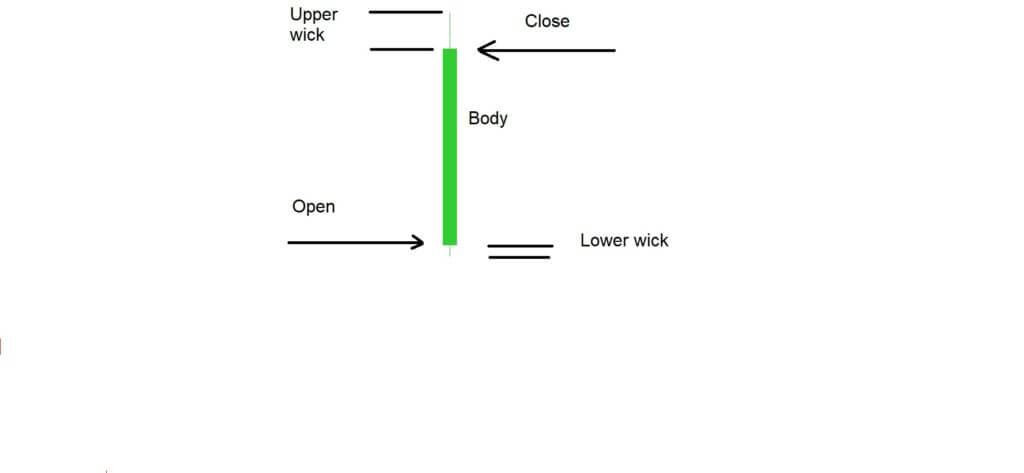
Example ‘D’ is a typical candlestick shape that traders see regularly on their charts. We have marked the points where the candlestick opened and closed. If the candlestick closes above the exchange rate at the point of which it opened, it is considered to be a bullish candlestick. If it closes below the exchange rate at the point of opening, it is considered to be bearish. Candlesticks can also open and close at the same exchange rate.

However, in this example of a bullish candlestick, we can see a wick at the top of the candlestick and also one at the bottom. Therefore, a trader can determine that after opening, price action initially falls before reversing and rising to the top of the time frame, before falling again back to the close. In this case, we have two wicks, one at the top and one at the bottom. A trader can tell the total exchange rate covered by the candlestick by measuring between the low and the high points and also see pullbacks and reversals. The same principle applies to a bearish candlestick where price action is measured over the whole length of the candlestick, but where traders easily identify the opening and closing of price action for each time frame.

Each candlestick will have a different sized body and wicks dependent on the amount of volume going through at any given time. The basic principle is that the longer the body and the shorter the wicks, the stronger the volume. Traders are able to read the many different types of candlesticks, which are all given names, in order to depict the strength of a trend and volume in the market at any given time, and these will help them to predict trend formations, reversals, and consolidation of the exchange rate of any particular pair.

Diagram ‘E’ provides us with a snap-shot of a 1-hour chart of the GBPUSD pair, where candlesticks are used to show price action. In section ‘A’ of the diagram, we can see that the price action is fairly flat and trading in a sideways motion. However, candlestick number 1 pushes below the trend line and forms the basis of a downward move. The candlestick is also bigger than those preceding it, and the wick at the bottom is small, denoting strong volume to the downside.

After a period of uncertainty, price action becomes stronger to the downside, as denoted by the large candlesticks numbered 2 and 3. Price action continues the downward trend, however buyers push up price action at number 4, which is called a reversal hammer, and where indeed price action reverses to section ‘B.’ We now have a series of smaller candlesticks which denotes a thinning in volume, and where we can see some candlesticks open and close at the same exchange rate, telling traders that neither the buyers or sellers are in control at this particular moment in time.

Candlestick number 5 tries to push the trend to the downside, but reverses and forms a reversal hammer shape, and where we subsequently see price action move to the upside as per candlestick number 6 and 7. But we then see a trend reversal in candlestick number 8, which becomes an engulfing candlestick because it is larger than both 6 and 7. The strength of this candlestick denotes a potential increase in price action to the downside by taking out the previous two candlesticks, and we see further movement to the downside before price rises again. Incidentally, we have another price reversal hammer in section A where we have placed an X.

Here at Forex.Academy, we strongly recommend that you learn as many candlestick formations as possible because they are very commonly used within the trading community, and therefore this will give you an edge in your trading.

Categories
Crypto Videos

What is an ICO – How To Know If It’s Worth An Investment


What is an ICO?

An Initial Coin Offering (ICO) is a crowdfunding method where idea creators issue a cryptocurrency and offer it to the general public in return for the project funding. ICOs are mostly used in underfunded projects. Investors usually have the option to pick Bitcoin or Ethereum as a payment method. However, in some cases, fiat currency is also accepted.
People invest in Initial Coin Offerings when they believe in the project and what it could do for the world. On top of that, successful projects would have the demand for their token increased, causing the price to increase. In other words, investors are hoping to get a good return on investment (ROI) as early supporters of that particular cryptocurrency project. Most ICOs offer their tokens at a discounted price to the early investors.

ICOs are compared to IPOs (Initial Public Offerings) on a regular basis. However, this comparison is quite deceptive and untrue. IPOs happen when established businesses go public and sell partial ownership shares in their company to raise additional funds. On the other hand, ICOs are mainly used as a fundraising mechanism for projects that have an idea but no funding or development (or they are at early development stages). Additionally, buying tokens during an ICO does not grant ownership of the company.

How does an ICO work?

ICO tokens are created on a cryptocurrency platform (in most cases, the Ethereum platform), and they have to follow the platform’s guidelines. In Ethereum’s case, following the ERC-20 token standard is obligatory. Along with Ethereum, other platforms support the creation and issuance of digital tokens, such as Stellar, NEM, NEO, Waves…

Taking the ERC-20 tokens as an example, a company will use the Ethereum’s smart-contract feature to create and issue its digital token. The token will have to fully comply with the ERC-20 protocol, which defines a set of rules for it.
The ICO starts once the tokens are created. The founders now need to convince the general public to invest in their project by participating in the ICO. The technical characteristics of the token, as well as the company’s goal, are described in a whitepaper, which is completely public and free for anyone to read.

Why do ICOs exist?

An ICO can be a very effective method of crowdfunding to reach a certain development goal. Startups can now have a project idea and no funds to start with, but an ICO will (if the project is good enough) help raise sufficient funds for the project to start. This gives a chance for good ideas to thrive even without enough capital, just by making it public and letting people choose whether to support it or not.
While new companies and startups represent the majority of ICOs, this does not have to be the case every time. Many large companies are just realizing how interesting the ICO market is. The public is also slowly beginning to understand the power of decentralization offered by cryptocurrencies. For these reasons, big companies are now doing their own ICOs to launch new projects on a blockchain-based system. They do it to decentralize their business as well as raise capital. This particular practice is better known as a “reverse ICO.”

ICO regulation

The growing number of ICOs (especially during the ICO boom of 2017) attracted the attention of regulators all over the world. They are trying to see how to classify ICOs and which regulations they should impose. If we are talking about the US, the SEC (US Securities and Exchange Commission), as well as CFTC (Commodity Futures Trading Commission), are trying to conclude how to approach the regulatory framework for ICOs and cryptocurrencies.
ICO sector regulation is still in the early stages, and most countries are uncertain on how to approach the subject. That’s the reason that there is no uniformity across countries. Some people argue that more regulation will bring legitimacy to the industry and make it even better, while others say that regulation goes again everything that cryptocurrencies are and that ICOs should be unregulated.
Some jurisdictions have declared all ICOs illegal, while other issued warnings to all potential investors to perform their due diligence before investing.

Conclusion

After the ICO boom of 2017, the number of ICOs has drastically reduced. However, the ICO industry is not a dying one. ICOs will continue to be a new and great way of funding new projects with great problem-solving ideas.

Categories
Forex Videos

Buying Rumour & Selling Fact – The Trump Card – Is Donald Trump Manipulating The Forex Market?

Buying Rumour & Selling Fact – Forex Fundamental Secrets

When it comes to trading the markets, there are three main tools that traders use to in order to try and gauge direction within the financial markets: fundamental and technical analysis, and trading based on sentiment. Within the scope of fundamental analysis lies a critical area based on market rumors, which are rife in all the various sectors that make up the financial markets.

Buy the rumor, sell the fact is something you may have heard of, but in any case, rumors tend to abound in all of the financial markets and these often present opportunities to buy and sell or hold assets. The saying, buy the rumor and selling news first entered the financial markets when traders picked up on chatter or news reports in the equity market that a company was doing better than expected and that this would be reflected during the earnings announcement season. This could lead to a better share price for the company and also better dividends. And therefore, this would lead traders to believe that the stock was undervalued and result in speculative buying of the stock, hence pushing up its share price. Speculative buying also results when rumors are going around that a company was about to merge or be taken over.
Another area in the equities market that is affected by rumors or hearsay is mergers and acquisitions. Sometimes CEO’s of companies will not make this type of information readily available to the marketplace during the negotiation stage, However, a secret meeting between the two heads of firm’s could be exposed by the media, and whereby investors speculate that a merger or takeover is imminent and this could cause a flurry of buying or selling of stocks in the two companies. But this could also cause selling in other companies – in the same sector – which might suffer because of a perceived diminished market share, in the event of such a merger or takeover.

On the flip side, rumors might surface that the company is not performing well, and this might lead to a sell-off. Therefore our adage of buy the rumor sell the fact can also mean the opposite, depending on the magnitude of the rumor, and especially if it subsequently turns out to be false, and which can cause extreme market volatility.
Buy the rumor and sell the fact works differently in the Forex space because obviously, we do not have mergers or acquisitions. However, analysts will speculate that governments are intending on raising or lowering interest rates. Traders might then take the analysts’ comments on board and start trading a particular currency pair in favor of the analysts’ report, which is just another way of saying rumor.

In recent years and especially with the advent of Twitter, the Forex market has become much more susceptible to buy the rumor sell the fact. This is partly due to the fact that news reporters are often well placed with governments’ lawmakers to obtain unofficial – as yet unreleased – information that could affect the economy of a particular country, and thus the value of its exchange rate.

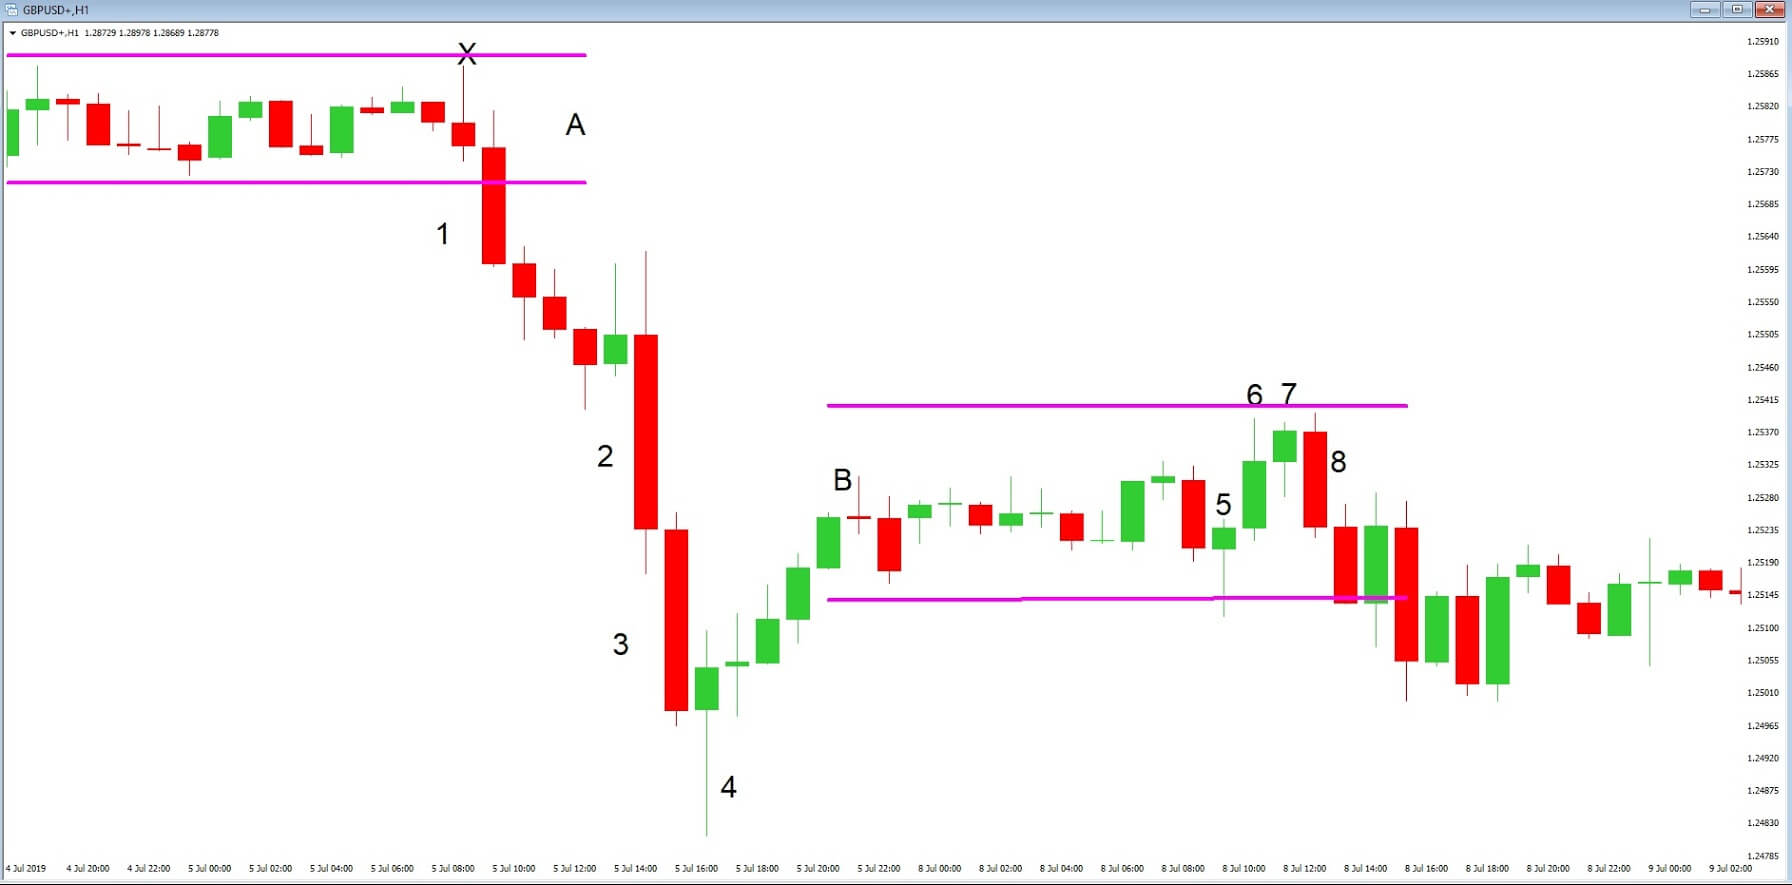
Another area that has had a dramatic effect within the Forex market is the style of the presidency pertaining to the United States of America. President Donald Trump has his own unique style of governing. He regularly tweets on such things as his preference for low-interest rates in the United States. This type of comment often flies in the face of the Federal Reserve, and it is not uncommon for him to tweet on factors pertaining to the economy, such as imminent economic data releases, even occasionally tweeting in a somewhat biased manner about highly sensitive and anticipated non-farm employment results, which are of course subject to an embargo.
One of the biggest problems that retail traders face, within the Forest market, is that price action, while driven by rumor, is reliant on market perception of the reality of the anticipated news release. At this point, the markets might think that the current exchange rate warrants such levels, or perhaps that there has been an overall exaggeration at which point a sharp reversal in price action might occur. Another danger is that traders who have ignored price action based on rumor, then enter the market expecting a continuation in trend, only to be thwarted by a reversal due to traders who got in during the early stages of the rumor then deciding to take their profits and causing a potential reversal or consolidation.

As well as rumors in the financial markets, another all too common a feature nowadays is fake news. It is not unheard of for fake Twitter accounts to be opened purporting to relevant players, such as respected analysts and reporters, and whereby fake news is released into the market which can greatly affect price action having been inadvertently being picked up in good faith by major news channels and filtering its way into to the market. While this type of fake news is generally quickly shot down in flames, that is not to say that it has not already caused extreme volatility in the process.
That is why here at Forex.Academy, we recommend that traders be mindful of rumor and speculation in the Forex market and trade with the necessary caution at such times. Always be prepared and expect the unexpected!

Categories
Crypto Videos

Utility VS Security Tokens – Avoiding Facebook Scams

Utility vs. security tokens

Anyone that’s new to cryptocurrencies must have been confused by the terminology at one point or another. Terms like “cryptocurrency,” “tokens,” “securities,” “utility tokens,” etc. must get extremely overwhelming in the beginning.
This guide will try to explain and simplify terms like “utility token” and “security token” in order for people to better understand them.

What are Tokens?

Tokens are considered a representation of an asset or utility that resides on top of another blockchain. They can represent basically any asset that is fungible and tradable. Tokens do not have their own blockchains, but they rather use a platform’s blockchain. Utility tokens and tokenized securities concepts that are funding underfunded projects with good ideas all around the world.

A token is not limited to one particular goal as it can fulfill many roles in its native ecosystem. A token represents a security or utility that an entity has. These securities and utilities are usually offered to their investors in exchange for funds during a public sale called ICO – initial coin offering (in the case of utility tokens) or STO – Security Token Offerings (in the case of security tokens).

The Howey Test

Before we talk more about utility and security tokens, we have to know how they are divided into these categories.
In order for a financial instrument (in this case, a token) to be regarded as security and fall under SEC’s purview, the instrument must satisfy these four criteria:

It must be a money investment
profits are to be expected
In a unique enterprise
With the profit to be generated by a third party.
All these three elements must be met for a token to be classified as a security. Otherwise, the token is a utility.
The Howey Test and securities, in general, have become a source of intense debate in the crypto-community. The criteria of the Howey Test can be interpreted quite differently from one person to another. This brought additional instability to the ICO markets, which resulted in a lot of money being pulled out of the market itself.

Utility Tokens

Most ICOs are considered an investment opportunity, which means that most tokens usually can be considered as securities. However, if the token doesn’t qualify according to the Howey test, then it is classified as a utility token. These tokens aim to provide users with a product or service.
Their value is derived by the utility they provide and (of course) supply and demand. As there is a maximum number of coins, and no minting is allowed in most cases, the value of the tokens may go up as the demand rises.

How Utility Tokens Work

Utility tokens can offer a wide variety of things, with the most important features being:
Giving holders a right to use the network;
Giving holders a right to take advantage of the network by voting.
Utility tokens the most popular form of tokens out there, mainly because of the 2017’s ICO boom. Companies raised millions of dollars in funding by offering utility tokens. However, many of these crowdfunding campaigns were just there to part people from their money. Once the cryptocurrency market started entering the bear market, the ICO market settled down a bit.
The most clear example of a utility token is the ERC-20 Ethereum standard. Most tokens were made on the Ethereum platform.
Examples of utility tokens:
Filecoin
Siacoin
Civic
Security Tokens

Any crypto-token that passes the Howey Test can be considered a security token. These tokens derive their value from an external, tradable asset. As these tokens are deemed as securities, they are subject to federal regulations.
A token is considered a security when there is an expectation of profit from the effort of others. If the crowdfunding doesn’t follow certain regulations, it could be subject to penalties. However, if all the regulations are met, then these tokens have the potential to have some amazing use-cases.

At its core, a security token is an investment contract. It represents legal ownership of a physical or digital asset such as real estate, ETFs, or any other asset. This ownership has to be verified within the blockchain in order to be valid. After the ownership is verified, security token holders can:
Trade their tokens for other assets
Use them as collateral for a loan
Store and hold them in different wallets

What Regulations Are Security Tokens Subjected to?

Security Tokens are subject to federal security regulations, which means that they have to be compliant from the first day itself. This means that security tokens need to follow certain regulations within the USA. These regulations are:
Regulation D
Regulation A+
Regulation S
Regulation D
Examples of security tokens are:
Sia Funds (Sia has two tokens – Sia coin which is a utility token and Sia Funds which is a security token)
Bcap (Blockchain Capital)
Science Blockchain…

Conclusion

Both utility and security tokens have a role to play in the token infrastructure. They offer and represent different things, which means that they are not direct competition with one another.
As time passes, regulators will clarify and classify tokens better, which will make the token market a much safer and straightforward market.

Categories
Forex Videos

Buying & Selling The Forex Market – Your Path To Financial Freedom


Buying & Selling The Forex Market – The Path To Financial Freedom

There is an old adage in the financial markets: buy at the bottom and sell at the top.
This might be better applied to the second-hand car or housing markets than the financial markets. In truth, it is meaningless in the Forex market, but it has strong connotations.

Within the Forex market, a currency pair, in theory, has no top and no bottom! Rather one currency can be valued against another currency as having an intrinsic value that fluctuates either below, above, or at parity with the counter currency within the pair being traded.

Therefore within the Forex market, we have a multitude of various levels that can be broken down into floors and ceilings, which are also known as areas of support and resistance. And so as traders, we look to buy and sell currency pairs from areas of support up to areas of resistance, or to sell them from areas of resistance to areas of support. We then look for continuations or signs that we should exit our trades.

Source:  Our own YouYube presentation here.

The absolute best way to ascertain where these areas of floors and ceilings are is by way of technical analysis. Traders then use trend lines and other technical tools on their charts in order to highlight where the price action of a pair will bottom or top out and reverse. Of course, traders would love to execute a trade and have it roll on in their favor for a couple of hundred pips every trade. In reality, it hardly ever happens like this. Even the most reliable technical analysis, set-ups will not work 100-percent of the time. What really matters most is that a trader’s methodology or style means that they consistently win more trades than they lose and that each winning trade is greater than each losing trade. And therefore, traders must incorporate tight stop losses while utilizing their tried and tested trading criteria.

Now let’s break down a buy trade to its bare bones. But before we do so, let’s just go back to our adage for one moment: buy at the top and sell at the bottom. As traders in the Forex market, we have to establish where the multitude of tops and bottoms are in order to give us an advantage in our trading. When you break trading down into its base elements, traders simply like to push an asset as far as it will go. In other words, in Forex, they buy a currency pair until it runs out of steam and stalls at a ceiling, and then after a period of consolidation, they will either continue buying it, or they will reverse the process and start selling it far as they can.

Example A

Let’s turn our attention to example ‘A.’ This is a 4-hour chart of the EURUSD pair. Always read a chart from left to right because it tells a story. Here we can see that price action was unable to go rise above the ceiling or resistance level at position 1. Traders then pushed the pair down by selling it to the area of support at position 2. Price action then goes up to the previous ceiling, and this time punches through at position 3. Price action moves a little bit higher before falling back at position 4 and where our previous ceiling has now become an area of support. Traders now start buying the pair all the way up to another area of resistance labeled 5. When they could not push it any higher price action moves down to the previous area of support at position 6 and this time punches through. We then find a continuation trend to the downside.

Example B

Let’s take a look at the example ‘B,’ which is the same as our previous chart of the EURUSD pair, but where we have Incorporated some potential buy and sell levels. Again, using our levels of support and resistance, we are looking for opportunities when the market pulls away from these levels. At position ‘A,’ we find that the market is moving below the area of resistance, which presents a selling opportunity and where a stop loss marked ‘X’ is placed just a few pips above the resistance line.
When price stalls to the downside, we are presented with a buying opportunity at position ‘B,’ and where our stop loss should be placed a few pips underneath the lowest candlestick at the support area.

At position ‘C’ price action fails back to the support area, we get a second buy opportunity as marked by the arrow and where traders would typically place a stop loss just under the previous resistance level and which has now become a support level. Now it could be that traders are still long having bought the pair at position ‘B.’ But later in the chart, when buyers lose momentum we see price action fall below the support line we have a sell opportunity at position ‘D’ and where our stop loss should be placed a few pips above this level of resistance.
So when it comes to buying and selling a currency pair, we look for defined areas of support and resistance and, more importantly, areas where traders push through these levels, which is typically when we might see a continuation in price action in either direction.

Categories
Forex Videos

Using Volume As A Form Of Technical Support – Forex Tips & Tricks

Using Volume As A Form Of Technical Support – Forex Tips & tricks

One of the problems for retail Forex traders is that there is no tool currently available that tells them how much volume – in terms of currency amount – floating around in the market at any given time. The Forex market is not like the stock market, where we can see amounts of stocks and shares being bought and sold. Although some brokers will tell you what percentage of the traders are either long or short on a currency pair, it doesn’t give you the whole of market volume. And because there are so many market makers and so many brokers out there, it is impossible to determine the amount of volume – in terms of currency – in the market at any given time.

Therefore traders have to use their technical analysis to establish when volume is high and low in the market. One of the best ways to establish volume is to look at the size of Japanese candlesticks. For example, the longer the candlestick – and especially those which have very short wicks at either end – usually means a large volume of currencies are being simultaneously bought and sold, pertaining to the particular pair a trader is focused on.
Logically, the times when traders are more likely to see large volumes going through in a pair is likely to be around the times of economic data releases, in particular, those relating to GDP, interest rate decisions, employment, imports and exports, and manufacturing.

We might expect to see smaller candlesticks and, therefore, smaller amounts of volume in a pair in areas of price congestion, price consolidation, and also quiet times in the market, such as time zone overspills.

Let’s look at the example ‘A’

This is a 4-hour chart of the GBPUSD pair, also known as Cable. We have split the price action in this period into three sections marked, ‘A,’ ‘B’ and ‘C.’ In area ‘A,’ price action has gravitated to the bottom, which is a key level of support at the 1.22 exchange rate. This is technically a period of consolidation and sideways trading because no trend has been allowed to develop to the upside or downside. Let’s now turn our attention to the area ‘B,’ where the candlesticks are very small and where price action is merely fluctuating around the 1.22 to level. The candlesticks are very small, and this can only mean one thing: that volume is thin in this area. Now let’s take a look at area ‘C.’ We have marked the first candlestick as number 1 and where price action has accelerated away from the 1.22 level to just above the 1.24 level; again, this is a key level. We also note that there are small wicks at either end of the candlestick. This candlestick has also taken out or engulfed the preceding candlesticks in areas A and B. This is a strong move to the upside, and was a lot of volume has gone through during this 4 hour our time frame. Candlestick number 2 is also a large candlestick, although it does have a small wick at the top denoting a decrease in volume towards the end of that period. The strong push higher with candlestick 1 and 2 confirms large volume, which kicked off what turned out to be the beginning of a trend higher in this pair.
Traders need to be mindful of potential areas of support and resistance while factoring in economic data releases, which could subsequently reverse or cause a continuation of a trend in price action.

Useful tools to be able to gauge support and resistance during technical analysis are; Fibonacci retracement, stochastic overbought and oversold, and being mindful of possible Elliott waves forming.
One key area to focus on in order to fully understand volume in the markets is an understanding of the psyche of institutional traders.

Let’s imagine that an institutional trader comes to his or her desk at 7 AM in the morning, bright and breezy, and looking for the earliest opportunity to make money for their investment firm.
Now, this guy or girl may be on a salary of over €/£/$100.000, for example, and also gets a big fat annual bonus cheque. This puts them lots of pressure to make money.
Therefore at the beginning of each session, whether it be the USA, Asia, Europe, or the United Kingdom sessions, you will find that volatility usually picks then. Therefore Forex Traders, we need to be mindful that volatility equals volume, and the greater the volume, the greater the risk of larger swings in price action.


Categories
Crypto Videos

Cryptocurrency – Coin Vs Token – Which Is Better?

Cryptocurrency Coin vs. Token

Before we jump into the comparison, let’s start with understanding the definition of cryptocurrencies. Cryptocurrencies are digital currencies that are secured with encryption. This encryption is created by using cryptography, which is simply the use of encryption techniques to secure and verify the transfer of transactions.
Bitcoin is considered the first decentralized cryptocurrency. It is powered by blockchain, a public ledger that records and validates all transactions that happen on it. Even though Bitcoin was not the first cryptocurrency, its creation is extremely important as it is the first distributed and decentralized one. The creation of Bitcoin managed to start a whole market of other cryptocurrencies (coins and tokens) that are regarded as cryptocurrencies even though most of them do not fall under the definition of a “currency,” but rather try to solve a different problem in society.

Cryptocurrency Categorisation

As previously mentioned, the term cryptocurrency is not completely accurate for most cryptocurrencies. In order for a cryptocurrency to be considered a currency, it technically needs to represent a unit of account, a store of value, and a medium of exchange.
These currency characteristics are inherent within Bitcoin, and since the whole cryptocurrency industry started with Bitcoin’s creation, the rest of the cryptocurrencies began being called currencies. In order to better understand the nature of cryptocurrencies, there are a couple of categorizations. We will talk about the most common one today. Cryptocurrencies can be separated into:
Coins (Altcoins), Tokens.

Coins


Alternative cryptocurrency can also be called altcoins or simply “coins.” Altcoin simply refers to coins that are not Bitcoin. Most altcoins came to life as a fork of Bitcoin, built using Bitcoin’s original protocol with a couple of changes to its underlying codes. These changes are, even though seemingly small, what actually sets these new coins apart from Bitcoin, as they offer a different set of features to it.
A concept of modifying open source codes to create new coins is called hard forks, while a change to a code that does not create a new cryptocurrency is called a soft fork. A few examples of altcoins that came from Bitcoin’s code are Namecoin, Litecoin, Dogecoin, Bitcoin Cash, Bitcoin Private, Auroracoin…
However, not all altcoins came from Bitcoin’s code. There are altcoins that have created their own Blockchain as well as a protocol that supports their native currency.

These coins include Ethereum, Ripple, Bitshares, NEO, Waves. What sets altcoins apart is that they each possess their own independent blockchain. This blockchain is where all transactions of their native currency occur.

Tokens

Tokens are considered a representation of an asset or utility that resides on top of another blockchain. Tokens do not have their own blockchains as altcoins do. They can represent basically any asset that is fungible and tradable. This could range anywhere from commodities to loyalty points.

Creating a token is a much easier task than creating a coin. This is simply because the code from a particular protocol does not have to be modified in order to create a token. Platforms such as Ethereum or Waves offer certain guidelines which, if followed, allow anyone to create a token. Creating tokens is made possible through the use of smart contracts. Smart-contracts are programmable computer codes that are self-executing as long as the terms are met. They don’t need any third-parties to operate.
As tokens built on the same blockchain have the same template, they share many characteristics. This provides a standard interface for interoperability between tokens, which allows people to store different types of tokens on a single wallet. A great example is the ERC-20 standard on the Ethereum blockchain, which has been used to create over a thousand tokens. Most (if not all) of these tokens can be stored on ERC-20 wallets.

Tokens are mostly created and distributed through an Initial Coin Offering (ICO). An ICO is simply a way of crowdfunding where developers fund their projects through the release of a new token or a promise of a token. The ICO market has been filled with successful as well as very unsuccessful projects. There were also a lot of scams on the market as people were buying anything and everything during the time of the cryptocurrency price boom of late 2017. Nowadays, the ICO market has died down compared to 2017 but is still active. However, people are a lot more cautious when it comes to where they invest their money.

Final Thoughts

The main difference between coins and tokens is in their structure, where coins are separate currencies with a separate blockchain, while tokens are cryptocurrencies that operate on top of an already-made blockchain.
When it comes to the number of coins and the number of tokens, the majority of cryptocurrencies in existence are tokens as they are simply easier to create.

Categories
Forex Videos

Why do we need private cryptocurrencies? – Who Is Collecting Your Financial Data?

Why do we need private cryptocurrencies?

One of the most essential features, as well as one of the main reasons that cryptocurrencies were invented, are the anonymity and privacy features. The fact is that most people do not care enough about privacy and anonymity as they believe that these features only important to fraudsters and criminals. However, ordinary people do need privacy to protect their everyday life.


The past decade has brought us various cryptocurrencies that try to fix specific problems in society. Privacy coins became increasingly popular because they provided privacy features that other cryptocurrencies only could not.

What are privacy coins?

Privacy coins are cryptocurrencies that encrypt its transaction by using a technology called “zero-knowledge verifications” or similar private technology. When a blockchain has privacy, its users can transact on it with complete anonymity as well as keep their wallet balances completely private.

Some of the most popular privacy coins include:
Monero
Zcash
DASH
PIVX
Verge
Particl
Bitcoin Private…

Let’s touch upon some important things about privacy itself as well as privacy coins (both good and bad).

Privacy matters

Keeping user’s information private lessens the risk of monitoring, surveillance, or even manipulation coming from governments or any other authority. The more is known about a user, the easier the person becomes to monitor and control. Living in this day and age leaves us exposed to various data mining technology as well as another form of information collector technology that can be used and abused.

Privacy is the only thing standing between people and external control, personal attacks, companies, and other individuals. When it gets ignored and marginalized, it allows third parties to collect your data. Every web search on a search engine or social media post acts as an information carrier which can be accumulated over time to make a detailed digital profile.
It’s about the freedom of thinking and expression
Every human being should be guaranteed freedom of thought and expressing themselves. This freedom is a necessity, but it has lately been entirely blurred by censorship and third-party control. Privacy gives people enough protection for them to feel free and be themselves.
It’s personal – Financial Safety and Reputation
Neglecting your financial privacy can attract various forms of fraud, theft, and danger. The same thing applies to cryptocurrencies as well, as most of them are only pseudonymous but are also quite transparent. The wallets whose private keys leaked have been hacked, damaged, or infected with malware.


The list of exchanges that have been hacked is ever-growing, as they are the easiest to break into. All of the funds are stored on a few addresses as centralized exchanges keep their customers’ keys to themselves. Privacy coins are here to help manage risk when it comes to any attempt of fraud or theft.

If we move away from finance, we can also include reputation as a significant factor that requires privacy. Every person on this planet has things they wouldn’t want the public to know or see. Some personal information is just not meant for being on display. Privacy features help people stay anonymous and safe from any information theft, which could result in reputation damage.

Privacy is even more than personal

Talking about privacy is often associated with only the privacy of an individual. However, that should not be the case. Privacy is only real when it’s applied to the whole system of network users as well as exchanges. One user’s carelessness about security could potentially leak information that extends further than most people imagine. That’s why secure systems, rather than secure individuals, should be a priority.
Privacy coin disadvantages
Privacy coins bring a solution to all the problems mentioned above. However, they also bring some drawbacks to the table along with the advantages that they offer.
Various governments, as well as external authorities, are frightened that privacy coins offer the perfect mechanism for concealing criminal operations. Offering the option for untraceable money and information transfers can be a threat to security. Robert Novy, Deputy Assistant Director of the Secret Service’s office of investigations, announced that privacy coins are “one of the greatest emerging threats to U.S. national security.” On top of that, Japan (which is usually quite open to cryptocurrencies) has put a blanket ban on any cryptocurrency exchange, which allows its users the obfuscation of its transactions.
The evidence suggests that financial regulators are undoubtedly anxious and afraid of how introducing full privacy could affect their control over the system. They are slowly but steadily crafting policies that will shape the future of using privacy coins.

Categories
Forex Videos

Understanding Which Pairs Effect Each Other – Forex Hacks

Correlated Market’s – Understanding Which Pairs Affect Each Other

When we talk about correlation in the financial markets, we are looking for assets across all the financial classes, such as stocks, Forex, bonds futures, commodities precious metals and oil, etc., which trade positively or negatively against each other, either for brief or sustained periods. And so in Forex trading, we seek other currency pairs or other assets from these classes to assist us in our trading decision making, especially when we know that we can rely on correlation due to historical reliance.

As an example, in the stock market, we often find that if a major bank announcers a large loss due to underperformance you might find that there is a knock-on effect in the banking sector, causing bank stocks to fall due to the fact that the market perceives a correlated risk in this sector. This was particularly true in the 2008 market crash. Stock market traders might consider trying to counter this by buying stocks in utilities companies and firms that manufacture consumer staples, which are usually seen as more safe haven stock. In this example, traders look for positive correlation by buying utilities and consumer staples producers, and negative correlation in selling banking stocks in order to balance their portfolios.

There are many ways to measure correlation, and the larger the financial institution, the more complex measurements are used to define values in correlation, such as; Correlation Brownian motions, The Binomial correlation coefficient, Copula correlations, and others.
The basic measurement is called a Correlation Coefficient and is calculated within a range between -1 and +1. A perfect positive correlation has a correlation coefficient of +1, where currency pairs will move in the same direction 100% of the time. A perfect negative correlation is measured at -1 and means that the two currency pairs will move in the opposite direction 100% of the time. And if the correlation is 0, the two currency pairs are said to have no correlation and will act independently of each other.

We often find positive correlation within the precious metals sector, where silver will move either up or down in line with gold. An example of a negative correlation would be between gold and the US dollar. If we think about this logically, gold is valued in US dollars, and therefore for if the price of gold is rising, it stands to reason that the value of the dollar must be falling in value. Therefore some Traders will buy gold when the value of the dollar is falling and vice versa. See example ‘A.’

When looking for correlation on equities we find a positive correlation between the Dow Jones, the NASDAQ 100 and the S&P 500, and this is because these indices are priced in dollars and when the US economy is strong we would expect that these three indices are correlated positively to the upside, and vice versa when their economy is weak. Also, if the US has a strong economy and, therefore, we experience positive correlation between the indices, then we might expect this positive correlation to spill over into global equities. Again the opposite would

apply in a US downturn.
Another area we would expect to see positive correlation would be the bond market and especially when it comes to US and German 10 year treasury bonds, which typically move in sync with each other. Another positive correlation is seen in the oil markets where US, Canadian, and European oil stocks are heavily correlated, being supply-driven, and where the price is affected by the global economy outlook.

Great, so we know that correlation exists in the market and that traders use correlation to adjust their portfolios, but how can it help us in the retail Forex market? First and foremost, the fact that we know it exists already helps us because now we can use it as a tool or leading indicator in order to support our trading view of a particular currency, for example, USDCAD. This pair is heavily influenced by the fluctuations in the oil market. We can see this in action, in the example, ‘B.’

Here we have overlaid the USDCAD pair with US oil on a daily chart. The magenta trend line helps to define areas where USDCAD and especially when the price of oil is moving higher from the 10th to the 12th of June 2019, and the opposite is true between the 18th September to the 4th October 2019.
This is because a major contributor of the Canadian economy GDP is their production and subsequent sale of oil into the global oil market. Therefore when we find the price of oil tumbling, we might see the value of the Canadian dollar to fall in relation to the US dollar due to a negative correlation.

Also during the last few days, we have seen a rapid appreciation of the British pound to US dollar and whereby this rally was followed by the Euro against the US dollar which acted as positive correlation between the two pairs, and which largely came about because of positive sentiments regarding the eurozone and United Kingdom withdrawal agreement. See example ‘C.’

Where we see negative around the beginning of August 2019 and positive correlation during mid-October 2019. Correlation can be seen in the most unexpected places, such as, for example, ‘D,’ between the CHFJPY and EURUSD pairs, so it’s worth looking out for examples by studying your charts regularly.


The thing to bear in mind when it comes to correlation in the financial markets is that the markets have an ebb and flow to them, and things are constantly changing, and therefore correlation between assets should be seen as a fair-weather friend who comes and goes when they feel like it.